final technical report satellite sar remote … · national oceanic and atmospheric administration...
TRANSCRIPT

Final Technical Report
SATELLITE SAR REMOTE SENSING OF THE GREAT LAKES ICE COVER
Assigned Project No. 56
TO
NATIONAL OCEANIC AND ATMOSPHERIC ADMINISTRATION
NOAA Code E/SP
4700 Silver Hill Road
Stop 9909
Washington, D.C. 20233-9909
S. V. Nghiemt, G. A. Leshkevich+, and R. Kwokt
t Jet Propulsion Laboratory
California Institute of Technology
Pasadena, California 91101
+Great Lakes Environmental Research Laboratory
National Oceanic and Atmospheric Administration
Ann Arbor, Michigan 48105
August 1998

I. OBJECTIVES
II. PROGRESS
Table of Contents
A. Algorithm Development
B. Field Experiments . . .
C. Shipborne Radar Data Processing
D. Radar Signatures of Great Lakes Ice
E. Ice Mapping with RADARSAT SAR Data
F. Ice Mapping with ERS SAR Data
III. APPLICATIONS
A. Publications
B. Meetings ..
IV. PROJECT SUMMARY
A. Milestones
B. Budget ..
C. Period of Performance
V. PROJECT OUTLOOK
A. Outlook ...
B. Collaboration
C. Projected Resources
REFERENCES ...
LIST OF FIGURES
1
2
2
3
5
7
8
9
11
11
13
15
15
15
16
16
16
19
20
20
22

Satellite SAR Remote Sensing of the Great Lakes Ice Cover
S. V. Nghiemt, G. A. Leshkevicht, and R. Kwokt
t Jet Propulsion Laboratory, MS 300-235
California Institute of Technology
4800 Oak Grove Drive
Pasadena, California 91109
Tel: 818-354-2982, Fax: 818-393-3077
E-mail: [email protected]
ron @rgps 1.jpl.nasa.gov
I. OBJECTIVE
+ +NOAA/Great Lakes
Environmental Research Laboratory
2205 Commonwealth Boulevard
Ann Arbor, Michigan 48105
Tel: 313-741-2265, Fax: 313-741-2055
E-mail: [email protected]
The main objective of this project is to map the Great Lakes ice cover using radar
data acquired by satellite Synthetic Aperture Radar (SAR) data such as RADARSAT
or ERS SAR. ERS is a European satellite and RADARSAT is a Canadian satellite on
sun-synchronous near-polar orbits. ERS carries a SAR with the vertical polarization and
RADARSAT has a SAR with the horizontal polarization. Both SARs operate at C-band
frequency, which image ice cover on the Great Lakes during winter seasons. ERS SAR
Precision Image (PRI) data over the Great Lakes were received at the Gatineau station and
processed by the German Processing and Archiving Facility (D-PAF). RADARSAT data
were acquired in ScanSAR Wide A (SWA) mode and were also received at the Gatineau
station. In the SWA mode, the data calibration is more involved because several antenna
beams are mosaiced together to form an image covering an area of 500 km by 500 km on
the ground.
1

II. PROGRESS
A. Algorithm Development
We have developed the first algorithm for lake ice mapping using RADARSAT pre
release scenes of the ice cover in the 1996 winter. The SAR images were displayed and
analyzed on a Unix computer. We used field photographs along with ice charts and field
notes to interpret and analyze ice types and patterns seen in the SAR images. The pre
release scenes received from the Gatineau readout station had the scalloping or banding
effects due to uncalibrated effects of antenna patterns of the different beams. This is
evident in both the ScanSAR Wide and ScanSAR Narrow images in Figures 1 and 2,
respectively.
Although training sets were taken and processed within an image band, they could not
be used to classify the entire scene because results of the classification outside the band in
which the training set was taken could be subject to error. At the present time, ScanSAR
images have not been calibrated to fully eliminate the scalloping effects. Currently, data
over taiga forest are being ordered by the Alsaka SAR Facility (ASF) for RADARSAT
SWA calibration; however, ASF plan for SWA calibration processing is delayed to 1999.
Once the SWA calibration processor is completed, SWA data acquired over the Great
Lakes can be calibrated to remove the banding effects.
To test the ice mapping algorithm, a supervised level slicing classification [Lillesand
and Kiefer, 1979] was used based on a comparison of brightness or digital values in the
SAR scene representing known ice types as identified on the ground [Leshkevich et al, 1994,
1995]. With field observations and ancillary data, two ice types (snow ice and new ice)
and open water were identified in the computer displayed SAR image and a representative
training set, consisting of a range of digital values, for each type was extracted. A color
was assigned to each type (range of values). Then, the color assigned to each range was
applied to the entired scene producing a color-coded classified image. This method requires
a manual selection of training areas and it is applicable to an uncalibrated SAR image.
2

However, as explained above, the classification is only valid for the image band in which the
training set was taken. Ice mapping results using uncalibrated RADARSAT SAR image
will be shown in section II.E. For calibrated ERS SAR image, the ice classification and
mapping based on calibrated backscatter values in the SAR scene are done automatically
using a backscatter signature library for different ice types and the results will be presented
in section II.F. Radar signatures of ice are obtained from field experiments described in
the next section.
B. Field Experiments
To continue the development and validation of the algorithm for remote sensing of
Great Lakes ice using satellite SAR data, we conducted two experiments during the 1997
winter season across the Straits of Mackinac and Lake Superior. The experimental cam
paign was coordinated into two expeditions on two different United States Coast Guard
(USCG) Ice Breaker vessels, the Biscayne Bay in February and the Mackinaw (an Arctic
class ice breaker) in March. The particular objective of these experiments are to measure
radar backscatter signatures of various ice types and open water together with ground
truth data to establish a backscatter library that can be used to translate SAR data into
ice maps. Such a comprehensive radar data set does not exist in the open literature and
these experiments provide the first radar signature data set for Great Lake ice remote
sensing.
In these experiments, the Jet Propulsion Laboratory (JPL) polarimetric scatterometer
was mounted on board the Biscayne Bay and the Mackinaw to measure the backscatter.
The JPL scatterometer [Nghiem, 1993, Nghiem et al., 1997] is an accurate radar capable
of detecting a small pin in the far field. The operating fi:equency is in C band, which is
the same frequency band of many remote sensing satellite SARs including RADARSAT
SAR. Furthermore, the JPL scatterometer has the full polarization capability including
both magnitude and phase measurements. Thus, the results are applicable not only to
RADARSAT SAR with the horizontal polarization, but also with ERS SAR with the
vertical polarization and the future ENVISAT SAR with multiple polarizations.

The JPL radar system was delivered at the National Oceanic and Atmospheric Ad
ministration (NOAA) Great Lakes Environmental Research Laboratory (GLERL) in early
February 1997. Pre-experiment system tests and calibrations were carried out at GLERL.
Then, the system was transported to the ship dock and integrated on the Biscayne Bay
(2/97) and the Mackinaw (3/97). Further system tests and calibrations were performed
on board the ship after the system integrations. On the Biscayne Bay, the JPL radar was
mounted on the left side of the ship and the radar was controlled from the engineering
control room inside the ship. A video camera was mounted on the frame of the antenna
pointed in the same direction as the antenna look direction so that the ice could be ob
served from inside the control room on a TV monitor. The video images were recorded on
8 mm tapes and VHS VCR tapes at the same time. On the Mackinaw the radar system
was also mounted on the ship left side and the radar control system was in a small room
close to the radar. Figure 3 shows the radar system setup on the Mackinaw.
A Global Positioning System (GPS) receiver GARMIN GPS II unit was used to record
the locations along the ship routes when the scatterometer data were taken. The GPS data
were received by the unit and downloaded to the computer that controlled the radar. The
data were plotted out on a map of the Great Lakes to show the locations of the ice types
where radar data were obtained. The computer internal clock was synchronized with the
GPS time and both radar data and GPS data were time tagged so that they can be
correlated. An anemometer was used near the radar to measure in-situ wind. The ship
instruments also provided location, wind data, and temperature data. Figure 4 presents
the GPS data map on Lake Superior along the Mackinaw ship track.
During the experiments, accurate calibration measurements were conducted to cali
brate the scatterometer data. A trihedral corner reflector of known radar cross section
was used for this purpose. The corner reflector was aligned with the radar pointing direc
tion with a laser pointer. Real time radar signals were displayed on a microwave network
analyzer to check the alignment by detecting the maximum radar returns. Furthermore,
another calibration target, a metallic sphere, was used to obtain additional data to validate
the radar calibration. During the experiment on board the Biscayne Bay, the calibration
4

measurements were taken while the ship docked near De Tour Village in Michigan. The
calibration targets were setup on the ground and the radar was on the ship. Background
measurements were used in the coherent subtraction method to remove the background
noise. In the Mackinaw experiment, the calibration targets were setup on an open area at
the back of the ship and microwave absorbers were used to avoid unwanted signals from
reflections and multipath effects.
Ice truth data for different ice types were obtained. Ice thickness and snow thickness
data were taken. Photographs showing the layering structure of snow ice and lake ice
with different amount of air inclusions were taken. The photograph in Figure 5 shows an
example of the ice layering structure. Wind speed and temperature were recorded. We
also took a number of snow thickness mea.5urements over an area at a location during the
Biscayne Bay experiment to determine the range of snow thickness distribution. A number
of photographs were taken to estimate the surface roughness condition and snow coverage.
For each set of radar measurements of an ice type, photographs were taken both in the
near range coincident to the area of the radar footprint and in the far range for an overall
picture of the ice type.
The total duration of this year field campaign Wa.5 about one month (2 weeks in 2/97
and 2 weeks in 3/97). The participants from .JPL were S. V. Nghiem and R. Kwok and from
NOAA/GLERL was G. A. Leshkevich. The US Coast Guard involved in this campaign
were the USCG Mackinaw ice breaker, the USCG Biscayne Bay ice breaker, the USCG
Traverse City Air Station, and the USCG Portage Ground Station in Michigan. The
Houghton Memorial Airport provided an ideal location for the radar reflector setup and
the machinery to prepare the reflector site. As described above, the Great Lakes winter
experiments involved with all components including lake, ground, and space levels.
C. Shipborne Radar Data Processing
From the winter 1997 experiments, we obtained close to 2000 radar data files for
various ice types for application to RADARSAT Great Lakes ice mapping. The data were
5

acquired with the JPL C-band scatterometer on board the USCG Mackinaw and the USCG
Biscayne Bay Ice Breaker Vessels as described above. For each ice type, we obtained radar
data from 0° to 60° incidence angles. For each incidence angles, the measurements covered
several different samples in azimuth directions scanned over the targeted area. For each
antenna look direction, data were coherently averaged by 20 times over 401 samples in the
frequency domain with 1 GHz bandwidth. The data included both magnitudes and phases
of the scattering matrix for all combinations in the linear polarization basis.
We have applied the polarimetric scatterometer data processor, which was modified for
the particular data acquisition configuration and data format for the lake ice experiments.
The shipborne radar data set are calibrated both polarimetrically and radiometrically
to obtain polarimetric backscattering coefficients and polarimetric covariance matrices to
construct a library of backscatter signatures with multipolarizations and multi-incidence
angles for the various ice types. Also, the software for antenna pattern deconvolution is
modified to account for the antemm pattern effects at different incidence angles.
The fully polarimetric radar processor was completed using the system configurations
and parameters for these experiments to calibrate the experimental data set to deter
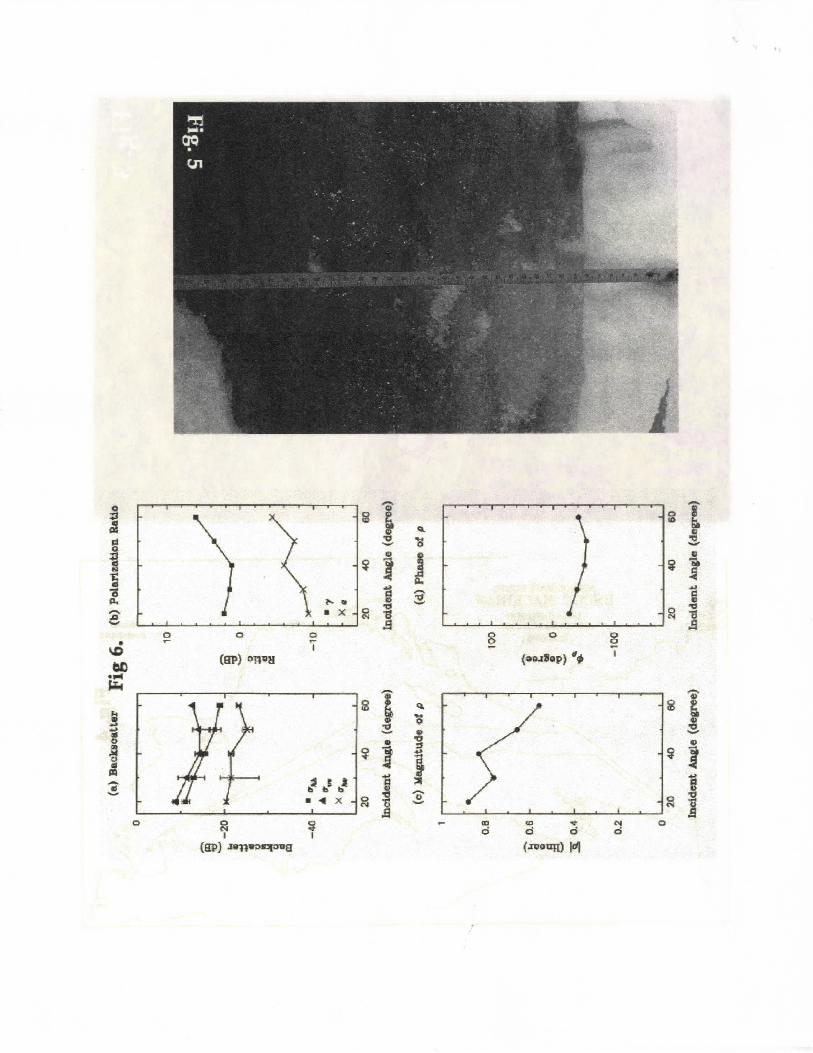
mine polarimetric covariance matrices for the various ice types. A covariance matrix in
cludes radar backscattering coefficient 6 H H for horizontal polarization, copolarization ratio
"( = 6vv I CTHH where 6vv is the vertical backscatter, crosspolarization ratio e = crHv I CTHH
where crHv is the crosspolarized backscatter, and polarimetric coefficient p (both magni
tude and phase) between the horizontal and vertical radar returns.
The unique feature of these backscatter data sets is that the measurements cover a
large range of incidence angles (0°-60°) with all polarizations in conjunction with ice truth
measurements and surface observations. The utility of these shipborne backscatter data
is particularly important to current satellite SAR data such as ERS with incidence angles
from 19° to 26° for vertical polarization, and RADARSAT SWA data with incidence angles
from 20° to 49° for horizontal polarization. Furthermore, the multipolarization results in
the data sets from these experiments will be applicable to future C-band satellite SARs
6

such as ENVISAT and RADARSAT -2 regardless of their polarizations. An important
implication from the multiple polarization radar results shown above will be discussed
later for the project outlook.
D. Radar Signatures of Great Lakes Ice
We present backscatter signatures of various ice types in the Great Lakes and their use
for ice mapping with satellite SAR data. For the typical ice type consisting of a snow layer
on white ice over lake ice, 1 is smaller than 1. Backscatter 6HH is larger than 6vv by 2
to 3 dB (3 dB = 200% larger) over the range of incidence angles from 30 to 60° incidence
angles. An important implication of this result is that the typical ice type over the Great
Lakes can be identified/mapped with the dual polarization radar data (ENVISAT SAR)
because the radar signature of open water has an opposite behavior ( 1 > 1) regardless of
wind speeds.
Deformed ice in a rubble field consists of ice plates that were pushed together by winds
and waves, broken in to ice slabs of various sizes, and rafted or piled up. This ice type
represents areas in the Great Lakes that are most difficult to ice breaking operations and
most hazardous to commercial ship. The radar signature results show that this ice type
has very strong backscatter (even brighter than typical backscatter from cities or tropical
forests with large trees).
What is interesting and important from the measured signature of the rubble ice type
is that the backscatter remains very strong ( -5 to -3 dB) for both HH and VV polarizations
over the range of incidence angles (20 to 50°) of all present and future spaceborne SARs
(ERS-1, ERS-2, RADARSAT, ENVISAT, and RADARSAT-II). This result indicates that
this important ice type can be identified from SAR data regardless of polarization and
incidence angles. Furthermore, the backscatter is much higher that the typical backscatter
equivalence noise floor of satellite SAR.
Backscatter signature results of thin black ice with bare surface or thin snow cover
show that this ice type is observable at small incidence angles (less than 40°) for VV
7

polarization (ERS SARs) due to the low radar backscatter and the noise-floor limitation
of space borne SARs. For HH polarization such as RADARSAT SAR, observable incidence
angle is around 20°. Thus, the thin black ice type is likely to be confused with calm
open water. However, in terms of USCG ice breaking operations, open water or thin ice
does not make much difference. We also obtained polarimetric backscatter signature of
pancake ice, thick white ice, and other ice types under different snow cover and surface
roughness conditions. This comprehensive radar backscatter signature data set is valuable
to interpret SAR data for ice mapping over the Great Lakes.
Figures 6-8 show polarimetric backscatter data measured by the JPL C-band ship borne
scatterometer during the 1997 field experiments. Figure 6 is for rough consolidated ice floes,
7 for brash ice or rubble ice field, and 8 for patchy snow cover on snow ice covered black
ice [Ice Glossary, 1971]. These 3 ice types are often encountered in the Great Lakes. These
backscatter results will be used as a backscatter signature library to map the Great Lakes
ice cover with satellite SAR data. Results of ice mapping from calibrated ERS data will
be shown later.
E. Ice Mapping with RADARSAT SAR Data
Since RADARSAT SWA data are not calibrated, we use visual observations of ice types
from field experiments and determine their locations in the concurrent satellite image. The
field observed areas are used as references (training sets) to classify ice types. This approach
requires a supervised selection of training data sets from the SAR imagery. This method
is applicable only to the scene acquired concurrently with the field observations within a
given band of the SAR image.
A SAR image taken on 16 March 1996 over western Lake Superior is presented in
Figure 2. The approximate routes of the United States Coast Guard Cutter (USCGC)
Mackinaw and the USCGC Neah Bay, a smaller ice breaker that accompanied the USCGC
Mackinaw from Sault St. Marie, Michigan to Duluth, Minnesota, are plotted on the
image. In the later part of the afternoon, when the Mackinaw entered the area of the
8

image, temperatures averaged about 2°C and winds were out of the northeast at about
7.2 mfs. Field observations from the ship were used in the ice mapping.
Training sets for two ice types and open water were applied to the scene. The ice map
in Figure 9 illustrates the results of the supervised level slicing classification. The training
set for open water was picked in the middle band and color-coded blue. The training set
for new lake ice color-coded green and snow ice coded red were taken from the right band.
Another training set for open water was also selected from the left band and color-coded
yellow as the training set for open water from the middle band did not classify the open
water in the left band. This is probably largely due to the radiometric differences among
the bands as the areas are relatively close to each other thus likely influenced by the same
wind pattern.
The analysis indicates that open water and different ice types in the ice cover can be
identified, classified, and mapped in RADARSAT SAR imagery. In addition, wind has
a strong influence on the backscatter from open water as observed in other RADARSAT
images taken over the Great Lakes. However, uncalibrated data cannot be used to ad
dress the temporal variations and classification from scene to scene at different times and
geolocations throughout the winter. In this view, calibrated SAR data are necessary.
F. Ice Mapping with ERS SAR Data
With calibrated SAR image, the backscatter signature library can be utilized for auto
matic ice mapping. ERS-2 SAR imagery was obtained and used for this study. A scene of
the central portion of Lake Superior collected on 22 March 1997 (Figure 10) was calibrated
and linear O'o values converted to dB according to the simplified equation for the derivation
of O'o in Precision Image (PRI) products [ Laur et al., 1997). A large part of the lower right
portion of the image covers land in the Keweenaw peninsula. Certain assumptions on the
local incidence angle were made:
• A fiat terrain is considered , i.e. there is no slope. The incidence angle depends only
on the earth ellipsoid and varies from about 19.5° at near range to about 26.5° at far
9

range {23° was used).
• Any change in incidence angle across a distributed target is neglected, i.e. a distributed
target corresponds to one average value of the incidence angle.
Measured backscatter values (converted to dB) for 3 representative ice types presented
in section II.D and also calm water backscatter were used as a limited backscatter library
to classify and map the ice cover from the ERS imagery. The measured backscatter values
for these different ice types and open water were applied to the 8 x 8 pixel averaged digital
ERS-2 SAR image. The averaging not only reduced the speckle but resulted in an image
similar in resolution to RADARSAT ScanSAR Wide images. The overall uncertainty is
about ± 1 dB due to the averaging and the incidence angle effect.
Figure 11 shows the color-coded result of the classification. Most of the ice cover
m the scene was classified as rough consolidated ice floes (yellow) or brash ice (red).
Areas classified as patchy snow cover on snow ice covered black ice (green) are scattered
throughout the ice cover, but no calm open water was classified in the scene. This sample
was measured on 23 March when we were out of the area covered by this scene. Black
and gray represent unclassified a areas. The land area (Keweenaw Peninsula which can be
masked out) was classified largely as brash ice (red) owing to similar backscatter intensity
from the forested area. Although our route across Lake Superior appears to have passed
through the northwest portion of the scene, the classification appears to be valid based on
the ice types we encountered.
Another ERS scene (Figure 12) north of the above ERS scene is studied. The new
scene contains Isle Royale (the large elongated feature in the image). The ice classification
and mapping result is shown in Figure 13 using the same backscatter library of the 3 ice
types. Further validation needs to be done on these scenes, once geo-referenced. However,
this study demonstrates the capability of classifying Great Lakes ice types in calibrated
satellite SAR imagery using backscatter values measured from different ice types as a
"backscatter signature library".
10

III. APPLICATIONS
Results accomplished from the research in this project have been presented at sev
eral workshop and conference meetings. We have written 18 publications including 10
conference abstracts/papers, 1 occasional series paper, 4 workshop papers, and 3 technical
reports. We have participated in 6 conferences and 4 workshops and organized and chaired
a special session on Remote Sensing of the Great Lakes. The publications and meetings
are listed in the following subsections in reverse chronological order.
A. Publications
[1] S. V. Nghiem, G. A. Leshkevich, and R. Kwok, "Shipborne Scatterometer Measure
ments of Great Lakes Ice," Remote Sensing for Marine and Coastal Environments, San
Diego, California, October 5-7, 1998.
[2] G. A. Leshkevich, S. V. Nghiem, and R. Kwok, "Great Lakes Ice Cover Classification
and Mapping Using Satellite Synthetic Aperture Radar (SAR) Data," Remote Sensing
for Marine and Coastal Environments, San Diego, California, October 5-7, 1998.
[3] H. Shen, S. V. Nghiem, G. A. Leshkevich, and M. Manore, "A Summary of Cur
rent Remote Sensing and Modeling Capabilities of the Great Lakes Ice Conditions,"
Occasional Paper Series, Great Lakes Research Consortium, 10 p., April 1998.
[4] S. V. Nghiem, G. A. Leshkevich, and R. Kwok, "C-Band Polarimetric Backscatter
Observations of Great Lakes Ice," International Geoscience and Remote Sensing Sym
posium, Seattle, Washington, July 6-10, 1998.
[5] G. A. Leshkevich, S. V. Nghiem, and R. Kwok, "Algorithm Development for Satel
lite Synthetic Aperture Radar (SAR) Classification and Mapping of Great Lakes Ice
Cover," International Geoscience and Remote Sensing Symposium, Seattle, Washing
ton, July 6-10, 1998.
[6] G. A. Leshkevich and S. V. Nghiem, "Analysis of Great Lakes Ice Cover Using RADAR-
11

SAT SAR Data,'' International Association for Great Lakes Research Conference,
Hamilton, Ontario, Canada, May 18-22, 1998.
[7] S. V. Nghiem, G. A. Leshkevich, and R. Kwok, "Satellite SAR Remote Sensing of
the Great Lakes Ice Cover," Semi-Annual Rep., Center for Space Microelectronics
Technology, Jet Propulsion Laboratory, California Institute of Technology, May, 1998.
[8] S. V. Nghiem, R. Kwok, and G. A. Leshkevich, "Satellite SAR Remote Sensing of
Great Lakes Ice Cover- Backscatter Signatures and Ice Motion," Remote Sensing and
Modeling Great Lakes Ice, Alexandria, Virginia, October 8-9, 1997.
[9] G. A. Leshkevich, S. V. Nghiem, and R. Kwok, "Satellite SAR Remote Sensing of Great
Lakes Ice Cover- Ice Classification," Remote Sensing and Modeling Great Lakes Ice,
Alexandria, Virginia, October 8-9, 1997.
[10] W. Y. Tseng, W. G. Pichel, A. K. Liu, P. Clemente-Colon, G. A. Leshkevich, S.
V. Nghiem, R. Kwok, and R. R. Stone, "Near Real-Time RADARSAT Data System
for NOAA CoastWatch Applications," International Geoscience and Remote Sensing
Symposium, Singapore, August 3-8, 1997.
[11] S. V. Nghiem, G. A. Leshkevich, and R. Kwok, "Satellite SAR Remote Sensing of the
Great Lakes Ice Cover," Annual Rep., Center for Space Microelectronics Technology,
Jet Propulsion Laboratory, California Institute of Technology, August, 1997.
[12] S. V. Nghiem and G. A. Leshkevich, "The Impact of Great Lakes Ice and the Lake
Ice Remote Sensing from Space," Progress In Electromagnetics Research Symposium,
Cambridge, Massachusetts, July 7-11, 1997.
[13] G. A. Leshkevich, S. V. Nghiem, and R. Kwok, "Algorithm Development for Satel
lite SAR Mapping of Great Lakes Ice Cover," Progress In Electromagnetics Research
Symposium, Cambridge, Massachusetts, July 7-11, 1997.
[14] G. A. Leshkevich, S. V. Nghiem, and R. Kwok, "Satellite SAR Remote Sensing of
12

Great Lakes Ice Cover Using RADARSAT Data," Workshop on Remote Sensing of
Planetary Ices: Earth and Other Solid Bodies, Flagstaff, Arizona, June 11-13, 1997.
[15] S. V. Nghiem, R. Kwok, and G. A. Leshkevich, "Satellite SAR Remote Sensing of
the Great Lakes Ice Cover," Semi-Annual Rep., Center for Space Microelectronics
Technology, Jet Propulsion Laboratory, California Institute of Technology, April, 1997.
[16] G. A. Leshkevich, S. V. Nghiem, and R. Kwok, "Satellite SAR Remote Sensing of Great
Lakes Ice Cover Using RADARSAT Data," Proceedings of the Fourth International
Confer·ence on Renwte Sensing for Marine and Coastal Environments, Vol. I, pp.
126-134, Orlando, Florida, March 17-19, 1997.
[17] G. A. Leshkevich, S. V. Nghiem, and R. Kwok, "Remote Sensing of Great Lakes
Ice Cover Using RADARSAT SAR Data," CGLAS/CILER Symposium, University of
Michigan, Ann Arbor, MI, February 4, 1997.
[18] G. A. Leshkevich, S. V. Nghiem, and R. Kwok, "Early Results on RADARSAT SAR
Applications to Great Lakes Ice," The Sixth Workshop of the Canadian Ice Working
Group, RADARSAT for Ice and Oceans, Ottawa, Canada, November 19-21, 1996.
B. Meetings
[1] Remote Sensing for Marine and Coastal Environments, San Diego, California, Octo
ber 5-7, 1998: We author and present two papers on Great Lakes experiments, SAR
algorithm development, and ice mapping results.
[2] International Geoscience and Remote Sensing Symposium, Seattle, Washington, July
6-10, 1998: We author and present two papers on polarimetric radar signatures of
various ice types in the Great Lakes and ice identification and classification using SAR
data.
[3] International Association for Great Lakes Research Conference, Hamilton, Ontario,
Canada, May 18-22, 1998: We present a paper on how to interpret satellite SAR data
13

for Great Lakes ice mapping.
[4] Remote Sensing and Modeling Great Lakes Ice, Alexandria, Virginia, October 8-9,
1997: Presented 2 papers on past, present, and future remote sensing of Great Lakes
ice. We initiated the potential use of interferometric SAR for three-dimensional map
ping of Great Lakes ice including both ice areal coverage and ice thickness. We de
scribed the plan to propose to NASA to support airborne interferometric/polarimetric
SAR flight (on NASA DC-8 aircraft) experiment over the Great Lakes in conjunction
with field experiment with ship and helicopter supported by US Coast Guard and/or
Canadian Coast Guard.
[5] International Geoscience and Remote Sensing Symposium, Singapore, August 3-8,
1997: Coauthored a paper on RADARSAT SAR Data Applications.
[6] Progress In Electromagnetics Research Symposium, Cambridge, Massachusetts, July
7-11, 1997: Organized and chaired a special session on Remote Sensing of the Great
Lakes, in which we presented 2 papers.
[7] Workshop on Remote Sensing of Planetary Ices: Earth and Other Solid Bodies, Flag
staff, Arizona, June 11-13, 1997: Presented a paper in the session on Europa, Sea Ice,
and Lake Ice.
[8] The Fourth International Conference on Remote Sensing for Marine and Coastal En
vironments, Orlando, Florida, March 17-19, 1997: Presented 2 papers in the session
on Air-Sea Interaction and Sea Ice.
[9] CGLAS/CILER Symposium, University of Michigan, Ann Arbor, MI, February 4,
1997: Presented a paper on Great Lakes Ice Remote Sensing.
[10] The Sixth Workshop of the Canadian Ice Workin,g Group, RADARSAT for Ice and
Oceans, Ottawa, Canada, November 19-21, 1996: Presented a paper in the session on
Ice.
14
IV. PROJECT SUMMARY
A. Milestones
• Initial algorithm and early RADARSAT results (1996)
• Arrangement/ coordination for field experiment ( 1996-1997)
• Modification JPL C-band radar configuration for USCG ship (1997)
• Completed software for shipborne radar control and radar data acquisition (1997)
• Field Experiments - Obtained about 2000 radar data sets and collected ground truth
for various ice types (1997)
• Completed shipborne radar data processor with full calibration algorithm (1997)
• Algorithm (supervised selection of training data sets) using field-experiment training
ice areas for uncalibrated RADARSAT data {1997)
• Ice map from RADARSAT imagery {1997)
• Shipborne radar data processing and calibration for various ice types (1997-1998)
• Algorithm (automatic) using lookup table from backscatter signature library of various
ice types for ERS data (1998)
• Ice map from ERS imagery (1998)
B. Budget
The total budget for FY98 includes $80K for the Jet Propulsion Laboratory and $18K
for NOAA Great Lakes Environmental Research Laboratory, the same as in the original
proposal (JPL Task Plan No. 80-4237, NOAA Assigned Project No. 56).
15

C. Period of Performance
The period of performance for FY98 has been extended to November 1998.
V. PROJECT OUTLOOK
A. Outlook
While the present task plan develops the basic algorithm for the Great Lakes ice cover
mapping using RADARSAT and ERS SAR data with extensive field experiment data and
observations. There are issues that have not been included in the scope of this short-term
task plan. These issues can be addressed in a continuing follow-on task plan. Furthermore,
the results from this project lead to promising outlook for the remote sensing of the Great
Lakes ice cover. We discuss these subjects as follows:
1. Ice Mapping Issues:
The first issue is diurnal effects. RADARSAT ans ERS satellites are on (near) sun
synchronous orbits which overpass a given location on the Great Lakes along ascend
ing and descending orbit paths at daytimes and nighttimes. Since the solar radiation
and temperature can induce changes in snow covered ice, the backscatter for the same
ice type may appear different at different times of the day. The change depends on
several factors including the magnitude of the change in environmental parameters at
different times and the time delay of thermal response in ice. Thus, the sensitivity
of backscatter to diurnal cycles needs to be determined. The results on the diurnal
backscatter sensitivity will dictate whether the diurnal effect needs to be incorporated
in the ice algorithm. The second issue is min effects. Rain can have a strong impact on
backscatter signature of ice. This effect is not just simply the trans-atmospheric radar
wave attenuation introduced by rain. Rain increases the wetness of the ice surface
or the snow cover. The surface wetness can increase surface scattering while sub
dues volmne scattering from snow ice layers. Consequently, ice backscatter signature
changes. The change is different at different polarizations and the copolarized ratio of
16

the backscatter may be reversed. Radar backscatter measurements over snow ice and
lake ice with dry snow cover were taken at several locations during the Mackinaw expe
dition. Only one case of wet snow cover was measured for backscatter signature during
the Biscayne Bay experiment. This case can be studied to make an initial assessment
of the rain impact on ice backscatter and further measurements and observations are
necessary. The third issue is seasonal changes. Over a given winter season, the ice
growth, environmental conditions, and physical characteristics of ice in the lakes vary
from freeze-up in early winter to break-up in late winter. For example, total snow
accumulation on lake ice changes throughout the winter season affecting the radar
backscatter from lake ice. Higher temperatures and insolation in late winter increase
snow wetness and modify the radar return. To account for these effects, data from
several winter seasons need to be used to extract statistically meaningful results. The
next issue is the interannual va·riability. The total degree-days and snow fall vary from
year to year. These factor affects the distribution between snow ice and lake in the
total ice thickness distribution. Thus, an interannual bias may need to be introduced
in the ice algorithm to obtain consistent results. This study requires long-term cali
brated data from the same sensors to avoid artificial biases caused by changes or drift
in sensor characteristics. Another issue is lower latitude ice (in lower lakes). The 1997
winter were carried out over northern Lake Michigan and over Lake Superior. The
results are valuable because the experiments cover the usual navigation routes opened
by the USCG ice breakers. However, ice in lake locations at lower latitudes are also
important such as the St. Clair River area, which is susceptible to flooding caused by
ice jam. Ice mapping needs to be accurate in such particular areas at lower latitudes
to provide accurate input ice coverage parameters to flooding forecast models. Thus,
the applicability of backscatter signatures for ice mapping between higher and lower
latitude ice needs to be examined. This is because ice at different latitudes is subject
to different local weather conditions during the winter, which cause differences in the
ice growth and ice physical characteristics.
2. Application of Interferometric SAR for Three-Dimensional Ice Mapping over the Great
17

Lakes:
The 1997 experimental results show that C-band radar can propagate through the
typical ice thickness on the Great Lakes. This radar penetration capability is funda
mental for radar waves to carry information on ice thickness. NASA has approved
our proposal to carry out interferometric airborne SAR experiment on NASA DC-8
aircraft over the Great Lakes during winter (Dr. E. D. Paylor, NASA Headquarters).
NASA will fund DC-8 aircraft flights, interferometric and/or polarimetric airborne
SAR system operations at multiple frequencies (C-band, L-band, and P-band) and
multiple incidence angles (20 to 50 degrees), SAR data acquisition, and interferogram
and polarimetric radar image products. The flight schedule is not decided and still
needs to be arranged. The U.S. Coast Guard has approved continuing support for the
USCG ship and helicopter use (Captain T. S. Sullivan, by direction of Commander, 9th
Coast Guard District). The Canadian Coast Guard also indicates that the Canadian
ship (the CCGS Samuel Risley) can be used in the experiment (Tom Anderson, Sup.
Icebreaking, Canadian Cost Guard). The U.S. National Ice Center has indicated that
ice thickness mapping products are important and NIC is supportive of the efforts to
demonstrate the ice thickness measurements with interferometric SAR (Commander
D. L. Martin, Director, NIC). The Canadian Ice Service has expressed the interest
to participate in the field experiment (Ken Armus, CIS). The Great Lakes Research
Consortium has identified ice coverage and ice thickness to be among the most impor
tant parameters that need to be determined (Professor H. Shen et al., Publication [3]
above).
3. Application of spaceborne NSCAT (NASA Scatterometer) radar data to Great Lakes
ice mapping:
In the results discussed above, we have shown that dual polarization HH and VV data
are appropriate for ice mapping regardless of wind speed over open water. We have
applied the approach to demonstrate the ice mapping with NSCAT data. NSCAT is
a spaceborne radar operated at Ku band. NSCAT coverage is excellent (full-swath
covering the entire globe in 2 to 3 days); however, the resolution is much coarser (25
18

km by 7 km) compared to satellite SAR. As an example, we enclose two NSCAT
copolarization ratio images (blue is open water), which compare relatively well with
Great Lakes ice charts from NIC in the same time periods. NSCAT operation was
terminated by middle 1997. However, NASA follow-on missions have been in prepa
ration including QuickScat to be launched in 1999 and SeaWinds to be launched soon
afterward. Even though scatterometer resolutions are coarse, the data can be used
to supplement SAR data in terms of coverage and observation frequency (increasing
temporal resolution). Ice mapping products from scatterometer data can be used to
produce ice cover animation video for the entire winter sea.'3on and the data set will
be useful for climate studies.
4- Application of spacebome ENVISAT SAR data to Great Lakes ice mapping:
Again, as our C-band radar data indicate the use of copolarization ratio for Great Lakes
ice mapping, ENVISAT SAR data which have both HH and VV backscatter with a
high resolution are excellent. We have submitted a proposal for the European Space
Agency to support the ENVISAT SAR data acquisitions over the Great Lakes and SAR
data products to be supplied to us with no charge. We propose to obtain SAR data
in dual polarization image modes at large incidence angles, where our measurements
show that the differences between HH and VV are larger (with HH larger than VV)
for typical Great Lakes ice. Note that polarimetric data to be obtained at C-band
by the NASA aircraft SAR (discussed above) will be valuable to evaluate the use of
the multiple polarization capability of the satellite ENVISAT SAR for Great Lakes ice
mapping regardless of wind speeds and sea states. The ENVISAT SAR also has some
interferometric capability with the repeat pass configuration.
B. Collaboration
JPL and NOAA/GLERL have firmly establish a close working collaboration through
out the progress of this project as evident in the productive results in the pass years. We
continue to foster such collaboration in the present and future joint research on the Great
Lakes ice mapping between these institutions. We also have the great support for the
19

United Sates Coast Guard from ground station, to shipborne experiments, and to airborne
ice reconnaissance. These collaborations are important to the success of the present and
future research work on the Great Lakes.
C. Projected Resources
For the outlook year studies, it is of the first importance to obtain a continuous data
stream of SAR data from present satellite such as RADARSAT and from future satellites
such as ENVISAT and RADARSAT-11 for the continuing development, improvement, and
application of the ice mapping over the entire Great Lakes. The full NSCAT data set is
already available at JPL and is ready to be applied to Great Lakes ice cover mapping. The
USCG facilities such as ship, air, and ground stations are necessary for field experiments
to validate the ice mapping over the Great Lakes. To this objective, NOAA and USCG
supports are essential.
REFERENCES
Ice Glossary, U.S. Department of Commerce, National Oceanic and Atmospheric Admin
istration, National Ocean Survey, Lake Survey Center, Detroit, MI (HO 75-602) p.9,
1971.
Laur, H., P. Bally, P. Meadows, J. Sanchez, B. Schaettler, and E. Lopinto, Derivation of
the Backscattering Coefficient a-0 in ESA ERS PRJ Products, ERS SAR Calibration
Doc. No. ES-TN-RS-PM-HL09, Issue 2, Rev. 4, 41 p., May 1997.
Leshkevich, G., W. Pichel, and P. Clemente-Colon, "Great Lakes SAR ice research appli
cations demonstration," Proc. of the Second ERS-1 Symp. - Space at the Service of
our Environment, Hamburg, Germany, p.675-679, 11-14 October, 1993. ESA SP-361,
Jan. 1994.
Leshkevich, G., W. Pichel, P. Clemente-Colon, R. Carey, and G. Hufford, "Analysis of
coastal ice cover using ERS-1 SAR data," Int. J. Remote Sensing, 16(17), p. 3459-
20

3479, 1995.
Lillesand, T. M. and R. W. Kiefer, Remote Sensing and Image Interpretation, John Wiley
and Sons, New York, 612 p., 1979.
Nghiem, S. V., C-band polarimetric scatterometer: System, operation, sensitivity and cali
bration, ONR Sea Ice Electromagnetics Workshop, Hanover, New Hampshire, Septem
ber 14-16, 1993.
Nghiem, S. V., R. Kwok, S. H. Yueh, A. J. Gow, D. K. Perovich, J. A. Kong, and C. C.
Hsu, "Evolution in Polarimetric Signatures of Thin Saline Ice under Constant Growth,"
Radio Science, VoL 32, No. 1, pp. 127-151, January-February 1997.
21
LIST OF FIGURES
Figure 1: RADARSAT ScanSAR Wide image of Lake Superior on March 20, 1996.
Figure 2: RADARSAT ScanSAR Narrow image of Lake Superior on March 16, 1996.
USCG ship tracks are plotted on the image.
Figure 3: JPL C-band Polarimetric Scatterometer mounted on the USCG Ice Breaker
Mackinaw. The diagonal horn antenna is on the two support arms which
are rotated to scan in azimuth. The incidence angle is controlled by a motor
connected with a chain to the antenna. The box covered inside the dark
plastic bag above the antenna contains the RF circuitry which is temperature
controlled.
Figure 4: The Mackinaw ship track on Lake Superior mapped from GPS data.
Figure 5: Close-up photograph showing the stratification of snow and lake ice into dif
ferent layers. The scale of the ruler is in inch.
Figure 6: Polarimetric backscatter signature at C band for rough consolidated ice floes.
Figure 7: Polarimetric backscatter signature at C band for brash ice.
Figure 8: Polarimetric backscatter signature at C band for patchy snow cover on snow
ice covered black ice.
Figure 9: Map of classified ice types derived from the RADARSAT SAR image in Figure
2 with the supervised level slicing classification method. Green is for new lake
ice, red for snow ice, and yellow for open water.
Figure 10: ERS SAR image (copyright ESA 1997) taken on 22 March 1997 over south
central Lake Superior. Part of the Keweenaw peninsula is seen in the lower
right portion of the image.
22

Figure 11: Map of classified ice types derived from the ERS SAR image in Figure 10 using
the backscatter signature library together with the level slicing classification
method. Yellow is for consolidated ice floes, red for brash ice, green for patchy
snow cover on snow ice covered black ice, and other colors for unidentified
types.
Figure 12: ERS SAR image (copyright ESA 1997) taken on 22 March 1997 over north
central Lake Superior. The elongated feature in the middle of the image is
Isle Royale.
Figure 13: Map of classified ice types derived from the ERS SAR image in Figure 12 using
the backscatter signature library together with the level slicing classification
method. Yellow is for consolidated ice floes, red for brash ice, green for patchy
snow cover on snow ice covered black ice, and other colors for unidentified
types.
23