final summer internship report new_
TRANSCRIPT

1
Analysis of Transcriptional
Interference in Gene Regulation
By
Panchanan Verma
SRFP 2015 Application No. LFS752
Summer Research Fellowship Programme 2015
Conducted by Indian Academy of Sciences, Bangalore
Guide: - Dr. Supreet Saini
Indian Institute of Technology, Bombay, Mumbai
Department of Chemistry

2
Table of Contents
1- Project Title 2- Description A) Gene Expression B) Regulation Of gene expression C) Prokaryotic Transcription D) RNA Polymerase
E) Transcriptional Interference
3- Analysis of Transcriptional Interference in
gene regulation A) Based on strength of promoters B) Table and Graph between rate of Transcription and Transcriptional
Interference (%) on M. EXCEL.
4-Dynamics of Rate of Transcription
5-Random Stimulation bases on Probability
Distribution on MATLAB.
6-Conclusion

SUMMER INTERNSHIP REPORT
Project Title: - Analysis of T
Interference in Gene R
Description: gene's information is converted into the structures and functions of
a cell by a process of producing a biologically functional molecule
of either protein or RNA (gene product) is made
The process of gene expression is used by all known life
eukaryotes (including multicellular organisms), prokaryotes
(bacteria and archaea), and ut
macromolecular machinery for life
Several steps in the gene expression process may be modulated,
including the transcription
translational modification
Gene expression is assumed to be controlled at various points in the
sequence leading to protein
3
SUMMER INTERNSHIP REPORT
Analysis of Transcriptional
Interference in Gene Regulation.
- Gene expression is the process by which a
gene's information is converted into the structures and functions of
a process of producing a biologically functional molecule
of either protein or RNA (gene product) is made.
The process of gene expression is used by all known life
eukaryotes (including multicellular organisms), prokaryotes
(bacteria and archaea), and utilized by viruses - to generate the
macromolecular machinery for life.
Several steps in the gene expression process may be modulated,
transcription, RNA splicing, translation
modification of a protein.
is assumed to be controlled at various points in the
sequence leading to protein synthesis.
SUMMER INTERNSHIP REPORT
ranscriptional
he process by which a
gene's information is converted into the structures and functions of
a process of producing a biologically functional molecule
The process of gene expression is used by all known life -
eukaryotes (including multicellular organisms), prokaryotes
to generate the
Several steps in the gene expression process may be modulated,
translation, and post-
is assumed to be controlled at various points in the

4
Some simple examples of where gene expression is
important are:
Control of insulin expression so it gives a signal for blood glucose regulation.
X chromosome inactivation in female mammals to prevent an "overdose" of the genes it contains.
Cyclin expression levels control progression through the eukaryotic cell cycle.
Regulation of gene expression: - The first system of gene
regulation that was understood was the Lac Operon in E. coli, worked out by
Francois Jacob and Jacques Monod in 1962.
Regulation of gene expression includes a wide range of mechanisms
that are used by cells to increase or decrease the production of
specific gene products (protein or RNA), and is informally termed
Gene Regulation.
Gene regulation gives the cell control over structure and function, and
is the basis for cellular differentiation, morphogenesis and the
versatility and adaptability of any organism. Gene regulation may also
serve as a substrate for evolutionary change, since control of the
timing, location, and amount of gene expression can have a profound
effect on the functions (actions) of the gene in a cell or in a multicellular
organism.
Regulated s
Any step of gene expression may be modulated, from the DNA
RNA transcription
protein. The following is a list of stages where gene expression is
regulated; the most extensively utilized point is Transcription
Initiation:
Chromatin domains
Transcription
Post-transcriptional modification
RNA transport
Translation mRNA degradation
Gene expression must be regulated in several different
dimensions—
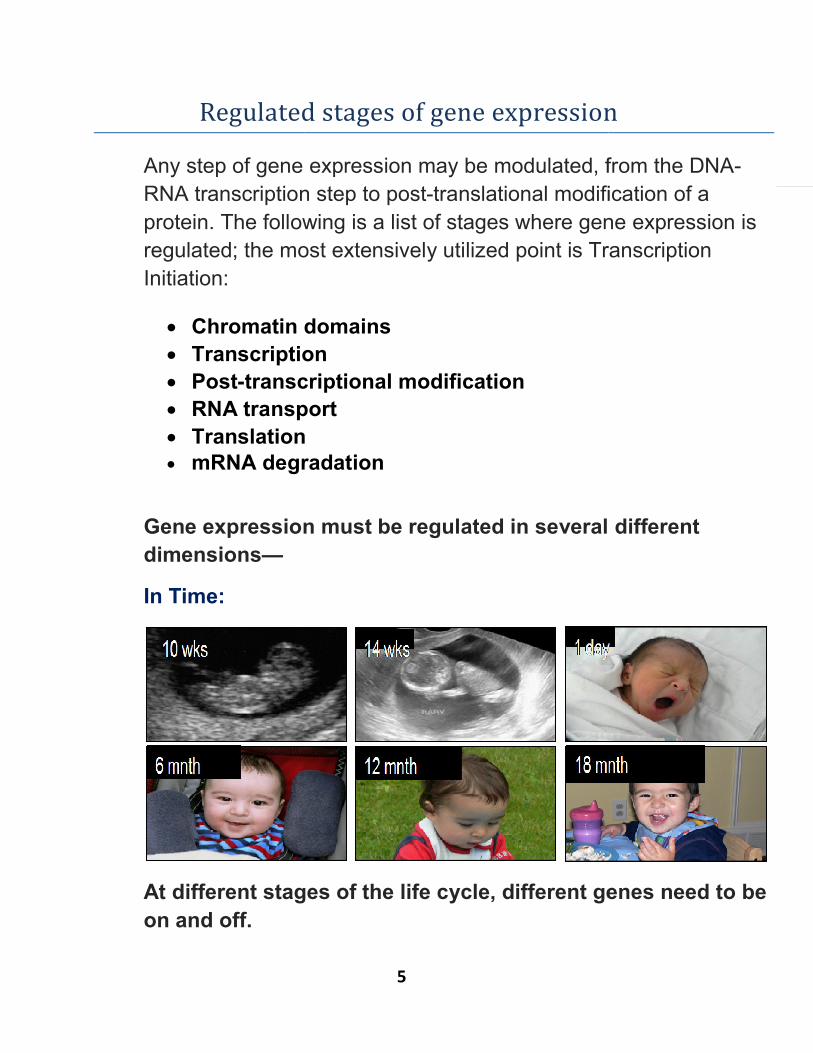
In Time:
At different stages of the life cycle, different genes need to be
on and off.
5
Regulated stages of gene expression
Any step of gene expression may be modulated, from the DNA
RNA transcription step to post-translational modification of a
protein. The following is a list of stages where gene expression is
regulated; the most extensively utilized point is Transcription
Chromatin domains
Transcription
transcriptional modification
RNA transport
Translation mRNA degradation
Gene expression must be regulated in several different
At different stages of the life cycle, different genes need to be
tages of gene expression
Any step of gene expression may be modulated, from the DNA-
translational modification of a
protein. The following is a list of stages where gene expression is
regulated; the most extensively utilized point is Transcription
Gene expression must be regulated in several different
At different stages of the life cycle, different genes need to be

6
Examples of gene regulation Enzyme induction is a process in which a molecule (e.g., a drug) induces
(i.e., initiates or enhances) the expression of an enzyme. The induction of heat shock proteins in the fruit fly Drosophila melanogaster. The Lac operon is an interesting example of how gene expression can be
regulated. Viruses, despite having only a few genes, possess mechanisms to regulate
their gene expression, typically into an early and late phase, using collinear systems regulated by anti-terminators (lambda phage) or splicing modulators (HIV).
GAL4 is a transcriptional activator that controls the expression of GAL1, GAL7, and GAL10.
• Negative and Positive Regulation: - The lac operon is negatively regulated: the regulatory protein (repressor) causes transcription to stop. Positive regulation, where the regulatory protein causes transcription to start, is more common. The lac operon also contains an example of positive regulation, called “catabolite repression”.

7

8
Mechanisms of gene regulation include:
Regulating the rate of transcription. This is the most economical method of regulation.
Regulating the processing of RNA molecules, including alternative splicing to produce more than one protein product from a single gene.
Regulating the stability of mRNA molecules.
Regulating the rate of translation.
1. Transcription control of gene regulation is controlled by:
1. Promoters
• Occur upstream of the transcription start site.
• Some determine where transcription begins (e.g., TATA), whereas others
determine if transcription begins.
• Promoters are activated by specialized transcription factor (TF) proteins (specific
TFs bind specific promoters).
• One or many promoters (each with specific TF proteins) may occur for any given
gene.
• Promoters may be positively or negatively regulated.
2. Enhancers
• Occur upstream or downstream of the transcription start site.
• Regulatory proteins bind specific enhancer sequences; binding is determined by
the DNA sequence.
• Loops may form in DNA bound to TFs and make contact with upstream enhancer
elements.
• Interactions of regulatory proteins determine if transcription is activated or
repressed (positively or negatively regulated).

Control of Gene Expression
Lac Operon: - The Lac operon acts like a switch
9
Control of Gene Expression: -
operon acts like a switch.

10
Prokaryotic Transcription: - It is the process in which mRNA transcripts of
genetic materials in prokaryotes are produced, to be translated for production of
proteins. It occurs in the cytoplasm alongside translation.
Several different types of RNA are produced, including messenger RNA(mRNA),
which specifies the sequence of amino acids in the protein product, plus transfer
RNA (tRNA) and ribosomal RNA (rRNA), which play a role in the translation
process.
There are Four distinct stages of transcription:-
1) Initiation, 2) Elongation, 3) Termination 4) Processing
1) Initiation: - The regions of the DNA that signal initiation of transcription in
prokaryotes are termed promoters. (A)RNA polymerase searches for a promoter site. (B) It recognizes a promoter site and binds tightly, forming a closed complex. (C) The holoenzyme unwinds a short stretch of
DNA, forming an open complex. Transcription begins, and the σ factor is released. The synthesis of RNA proceeds in a 5' to 3' direction, so the template strand must be 3' to 5'.
2) Elongation: - Shortly after initiating transcription, RNA polymerase moves along the template strand, synthesizing an mRNA molecule. the sigma factor dissociates from the RNA polymerase. The RNA is always synthesized in the 5′ → 3′ direction with nucleoside triphosphates (NTPs) acting as substrates for the enzyme.
3) Termination: - Two termination mechanisms are well known:

11
Intrinsic termination (also called Rho-independent transcription termination) involves terminator sequences within the RNA that signal the RNA polymerase to stop. The terminator sequence is usually a palindromic sequence that forms a stem-loop hairpin structure that leads to the dissociation of the RNAP from the DNA template. Rho-dependent termination uses a termination factor called ρ factor (rho factor) which is a protein to stop RNA synthesis at specific sites. This protein binds at a rho utilization site on the nascent RNA strand and runs along the mRNA towards the RNAP.
4) Processing: - After transcription the RNA molecule is processed in a number of ways: introns are removed and the exons are spliced together to form a mature mRNA molecule consisting of a single protein-coding sequence. RNA synthesis involves the normal base pairing rules, but the base thymine is replaced with the base uracil. Transcription factors are proteins that play a role in regulating the transcription of genes by binding to specific regulatory nucleotide sequences. Transcription Enzyme - RNA polymerase
RNA polymerase
(RNAP) is an enzyme that produces primary transcript RNA. In cells, RNAP is
necessary for constructing RNA chains using DNA genes as templates, a
process called transcription. RNA polymerase enzymes are essential to life and
are found in all organisms and many viruses. In chemical terms, RNAP is a
nucleotidyl transferase that polymerizes ribonucleotide at the 3' end of an RNA
transcript.
The core enzyme contains two α polypeptides, one β polypeptide, and one β′
polypeptide. The beta (β) subunit has a molecular weight of 150,000 , beta
prime (β′) 160,000, alpha (α) 40,000, and sigma (σ) 70,000.The σ subunit can
dissociate from the rest of the complex,leaving the core enzyme. The complete
enzyme with σ is termed the RNA polymerase Holoenzyme and is necessary

12
for correct initiation of transcription, whereas the core enzyme can continue
transcription after initiation.
Structure of RNA polymerase: -
This enzyme that controls transcription and is characterized by:
Search DNA for initiation site,
It unwinds a short stretch of double helical DNA to produce a single-stranded DNA
template,
It selects the correct ribonucleotide and catalyzes the formation of a phosphodiester
bond,
It detects termination signals where transcript ends.
Eukaryotic RNA polymerases have different roles in transcription.
Polymerase I Nucleolus Makes a large precursor to the major rRNA (5.8S,18S and 28S rRNA in vertebrates
Polymerase II Nucleoplasm Synthesizes hnRNAs, which are precursors to mRNAs. It also make most small nuclear RNAs (smRNAs)
Polymerase III Nucleoplasm Makes the precursor to 5SrRNA, the tRNAs and several other small cellular and viral RNAs.

13
Transcriptional Interference
Transcriptional Interference usually refers to the direct negative impact of one
transcriptional activity on a second transcriptional activity in cis. Transcriptional
interference (TI) specifically as the suppressive influence of one transcriptional
process, directly and in cis on a second transcriptional process.
TI can arise as a result of several different promoter arrangements: -
(a) Convergent promoters, directing converging transcripts that overlap for at least part of their sequence,such as the coliphage 186 lytic and lysogenic promoters;
(b) Tandem promoters, one upstream of the other but transcribing in the same direction, with their transcripts possibly but not necessarily overlapping, for example, the promoters of yeast SRG1 and SER3;
(c) Overlapping promoters- either divergent, convergent or tandem, in which the two RNAP-binding sites share at least a common DNA sequence, such as the E. coli aroP P1 and P3 promoters.

14
Mechanisms of Transcriptional Interference: -Of the mechanisms of
TI that we will outline, three are implemented at the initiation phase of transcription and
two at the elongation stage.
Mechanisms of transcriptional interference (TI). Five possible mechanisms by which TI
can occur are: (a) promoter competition; (b) sitting duck interference; (c) occlusion; (d)
collision; and (e) roadblock. For the example shown here where a strong (aggressive)
promoter pA is oriented convergently to a weak (sensitive) promoter pS, all five
mechanisms are possible. For promoters arranged in tandem, all mechanisms except the
collision mechanism [shown in (d)] can apply. When the promoters are arranged
divergently, only the promoter competition mechanism shown in (a) can apply, but only
when the promoters are also overlapping.

15
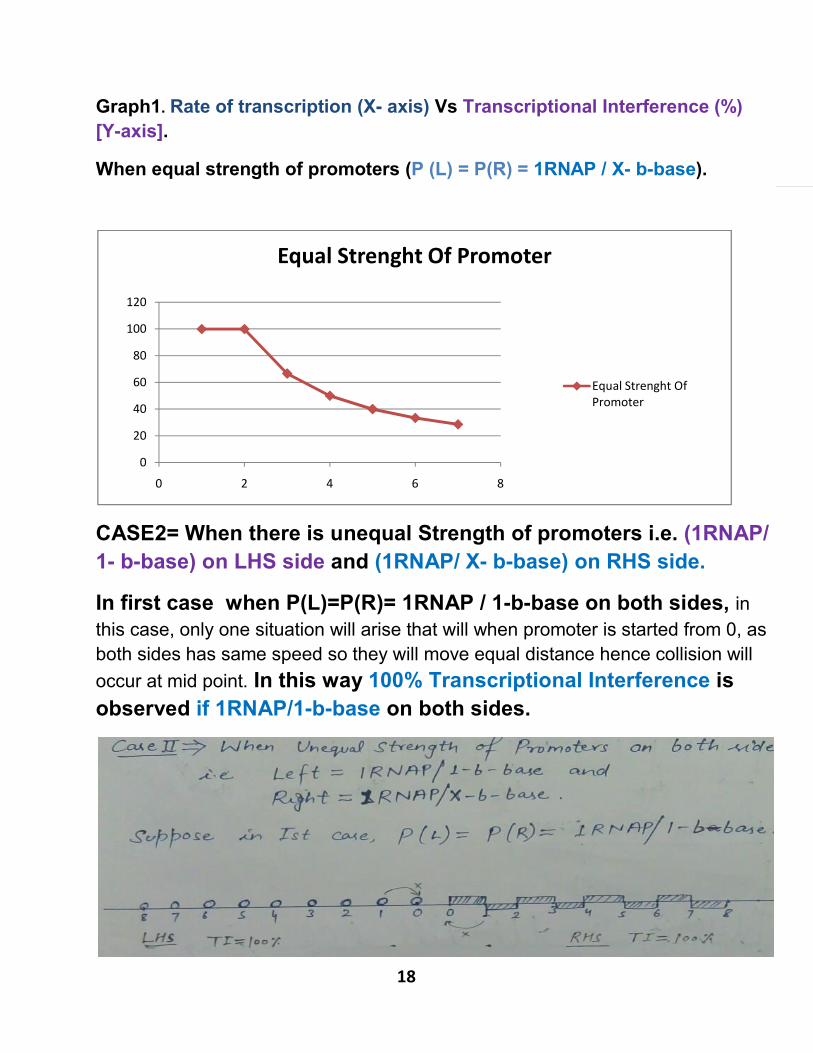
Transcriptional Interference: - There are three cases arises when RNAP collision occurred:-
Suppose - Two promoters P (L) and P(R) are moving along opposite side
on the axis depending on the different strength of promoters.
CASE 1= When there is Equal strength of promoters on both LHS and RHS
sides i.e. (P (L) = P(R) = 1RNAP / X- b-base).
Suppose if P(L)=P(R)= 1RNAP / 1-b-base,in this case, only one situation will
arise that will when promoter is started from 0, as both sides has same
speed so they will move equal distance hence collision will occur at mid
point. In this way 100% Transcriptional Interference is observed if 1RNAP/1-
b-base.
16
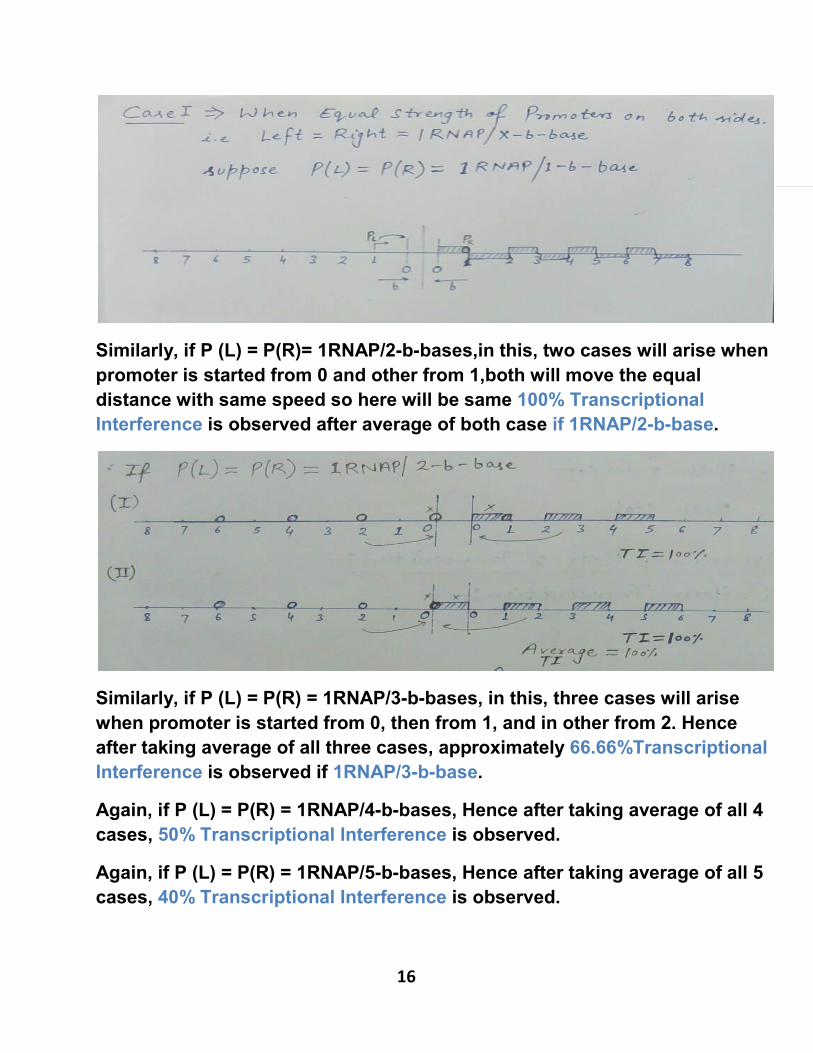
Similarly, if P (L) = P(R)= 1RNAP/2-b-bases,in this, two cases will arise when
promoter is started from 0 and other from 1,both will move the equal
distance with same speed so here will be same 100% Transcriptional
Interference is observed after average of both case if 1RNAP/2-b-base.
Similarly, if P (L) = P(R) = 1RNAP/3-b-bases, in this, three cases will arise
when promoter is started from 0, then from 1, and in other from 2. Hence
after taking average of all three cases, approximately 66.66%Transcriptional
Interference is observed if 1RNAP/3-b-base.
Again, if P (L) = P(R) = 1RNAP/4-b-bases, Hence after taking average of all 4
cases, 50% Transcriptional Interference is observed.
Again, if P (L) = P(R) = 1RNAP/5-b-bases, Hence after taking average of all 5
cases, 40% Transcriptional Interference is observed.

17
Again, If P (L) = P(R) = 1RNAP/6-b-bases, Hence after taking average of all 6
bases, 33.33% Transcriptional Interference is observed.
And if P (L) = P(R) = 1RNAP/7-b-bases, Hence after taking average of all 7
cases, 28.58% Transcriptional Interference is observed.
So, these are the seven different cases depending on different X-b-bases
when there is equal strength of promoters on both sides which we observed
and performed.
Now make the Table of First case for all 7 different cases on Microsoft Excel
when equal strength of promoters.
Then plot the corresponding graph between Rate of transcription on X-axis
and Transcriptional Interference (%) on Y-axis.
Table1. When equal strength of promoters (P (L) = P(R) = 1RNAP / X- b-
base).
Rate of Transcription (X-axis) Transcriptional Interference (%) (Y-axis)
1 100.00 2 100.00 3 66.66 4 50.00 5 40.00 6 33.33
7 28.58
18
Graph1. Rate of transcription (X- axis) Vs Transcriptional Interference (%)
[Y-axis].
When equal strength of promoters (P (L) = P(R) = 1RNAP / X- b-base).
CASE2= When there is unequal Strength of promoters i.e. (1RNAP/
1- b-base) on LHS side and (1RNAP/ X- b-base) on RHS side.
In first case when P(L)=P(R)= 1RNAP / 1-b-base on both sides, in
this case, only one situation will arise that will when promoter is started from 0, as
both sides has same speed so they will move equal distance hence collision will
occur at mid point. In this way 100% Transcriptional Interference is
observed if 1RNAP/1-b-base on both sides.
0
20
40
60
80
100
120
0 2 4 6 8
Equal Strenght Of Promoter
Equal Strenght Of Promoter

19
In 2nd case when P (L) =1RNAP/1-b-base on LHS and
P(R)=1RNAP/2-b-base on RHS , two cases will arise in which on LHS side
TI=50% in Both case and on RHS side TI=100% in both case, hence after taking
average on LHS side of both case we get TI=50% and on RHS side we get
average TI=100%.
Similarly in 3rd case when P (L) = 1RNAP/1-b-base on LHS and
P(R)=1RNAP/3-b-base on RHS , three cases will arise in which on
LHS side TI=50% in all three cases and on RHS side TI=100% in all
three cases, hence after taking average on LHS side of both case
we get TI=50% and on RHS side we get average TI=100%.
Similarly in 4th case average TI=50% on LHS and average TI= 75%
on RHS side.
And in the 5th case we found average TI=50% on LHS and average
TI=60% on RHS side.
So, these are the five different cases depending on different X-b-
bases when there is unequal strength of promoters on both sides
which we observed and performed.

20
Now make the Table of second case for all 5 different cases on
Microsoft Excel when unequal strength of promoters on both
sides.
Then plot the corresponding graph between Rate of transcription on X-axis
and Transcriptional Interference (%) on Y-axis for both LHS and RHS on the
same graph.
Table2. When unequal strength of promoters P (L) = 1RNAP / 1- b-base on
LHS and P(R) = 1RNAP/X-b-base on RHS.
Rate of Transcription (X-axis) Transcriptional Interference (%) (Y-axis) (LHS)
Transcriptional Interference (%) (Y-axis) (RHS)
1 100.00 100.00 2 50.00 100.00 3 50.00 100.00 4 50.00 75.00 5 50.00 60.00
Graph1. Rate of transcription (X- axis) Vs Transcriptional Interference (%)
[Y- axis].
When unequal strength of promoters P (L) = 1RNAP / 1- b-base on LHS and
P(R) =1RNAP/X-b-base on RHS.
0
20
40
60
80
100
120
0 1 2 3 4 5 6
Unequal Strength of promoter(LHS)
Unequal Strength of promoter(RHS)

21
So, these are the graph of TI based on strength of
promoters, plotted on Excel.
Now we will see how these different processes occur
randomly in actual and observe the dynamics of rate of
transcription and see the determined average time for the
transcription by Using Probability Distribution on MATLAB
and Rough both.
Dynamics of rate of transcription: -
A) Uniform Transcription: - In this case N times transcription is occurred at a uniform interval of long time‘t0’ so if N times transcription is
occurred in t time then for 1 time it will take (t0/N) times for transcription. B) Random Transcription: - In this case N times transcription is
occurred at random interval when RNA comes and bind and then they form the open complex. In this way bursting are found during this transcription. And transcription is occurred randomly at and distance and random time. This is the figure which showing the uniform and random transcription.

22
Three cases we will observe from this: -
1) RNAP comes & binds- Transcription at a random time(Poisson
Distribution)
2) Pause(Wait) – (open complex formation)(Normal Distribution)
3) Movement(Transcription)- Uniform Speed
MATLAB FILE CODE (M-file code) which is used here to calculate the random time of these cases for the transcription are found in an array upto 500 seconds.
% random time generation from Poisson Distribution Lambda = 1 R1 = random ('Poisson',1:500,1,500) for n=1:499 Sum = [R1(n)+R1(n+1)] end % random time generation from Normal Distribution mu=0.2 sigma=0.0002 r2=normrnd(0.2,0.0002,1,500) for m=1:499; sum1=(r2(m)+r2(m+1)) end
Now, taking the average time of transcription of both cases A and B.

23
So these three cases are observed from this: -
4) RNAP comes & binds-
5) Pause(Wait) – (open complex formation)
6) Movement(Transcription)
Conclusion: - After the observation of dynamics of rate of transcription on
Rough and Excel, we performed Random Stimulation based on Probability
Distribution using the MATLAB for the dynamics of rate of transcription. We made
the array of average time upto 500 seconds which actually required for the
transcription in gene regulation and we concluded that transcription is occurred
randomly.
Transcriptional Interference occurs in most genomes and has probably
persisted during evolution because of its potential use in regulating
gene expression. A variety of mechanisms have been identified and
24
successfully studied, at least in simple systems. A major aim is to exploit
mathematical modeling to characterize TI, and a major issue to explore further is
the fate of an elongating RNAP when it meets a DNA-bound obstacle, either
moving or stationary.