final second five year review report - epa.gov · five-year review summary form.....16 ii. response...
TRANSCRIPT

FINAL SECOND FIVE-YEAR REVIEW REPORT FOR THEHUDSON RIVER PCBs SUPERFUND SITE
Prepared by
U.S. Environmental Protection AgencyRegion 2
NewYork,NY
(\ u·----~---------,---~Peter D. Lopez Date
Regional Administrator

i Final Second Five-Year Review Report for the Hudson River PCBs Superfund Site April 2019
FINAL SECOND FIVE-YEAR REVIEW REPORT FOR THE HUDSON RIVER PCBs SUPERFUND SITE
TABLE OF CONTENTS
EXECUTIVE SUMMARY .............................................................................................................1 I. INTRODUCTION ...........................................................................................................11
1.1 Site Background ..............................................................................................................12 1.1.1 Site Location .............................................................................................................12 1.1.2 Physical Characteristics ............................................................................................12 1.1.3 Land and Resource Use ............................................................................................13 1.1.4 Site Chronology ........................................................................................................14 1.1.5 History of Contamination .........................................................................................14 1.1.6 Initial Response .........................................................................................................14
FIVE-YEAR REVIEW SUMMARY FORM ............................................................................16 II. RESPONSE ACTION SUMMARY ...............................................................................17
2.1 Basis for Taking Action ..................................................................................................17 2.2 Response Actions ............................................................................................................18
2.2.1 Remedial Action Objectives for OU1 and OU2 .......................................................18 2.2.2 OU1: ..........................................................................................................................18 2.2.3 OU2: ..........................................................................................................................19
2.3 Status of Implementation ................................................................................................22 2.3.1 OU1: ..........................................................................................................................22 2.3.2 OU2: ..........................................................................................................................22
2.4 Institutional Controls .......................................................................................................23 2.4.1 OU1: ..........................................................................................................................23 2.4.2 OU2: ..........................................................................................................................23
2.5 Systems Operations/Operation and Maintenance ...........................................................24 III. PROGRESS SINCE THE LAST REVIEW ....................................................................26 IV. FIVE-YEAR REVIEW PROCESS .................................................................................28
4.1 Community Notification, Involvement, and Site Interviews ..........................................28 4.1.1 Five-Year Review Team ...........................................................................................28 4.1.2 Community Notification ...........................................................................................29 4.1.3 Public Involvement ...................................................................................................29 4.1.4 Public Workshops .....................................................................................................30 4.1.5 Availability of the Second Five-Year Review Report, Public Comment
Period & Public Meetings .........................................................................................31 4.2 Data Review ....................................................................................................................31 4.3 Site Inspections ...............................................................................................................32
V. TECHNICAL ASSESSMENT ........................................................................................33 5.1 Question A: Is the Remedy Functioning as Intended by the Decision
Documents? .....................................................................................................................33 5.1.1 Remedial Action Performance ..................................................................................38 5.1.2 System Operations/OM&M ......................................................................................64 5.1.3 Implementation of Institutional Controls and Other Measures .................................64

ii Final Second Five-Year Review Report for the Hudson River PCBs Superfund Site April 2019
5.2 Question B: Are the Exposure Assumptions, Toxicity Data, Cleanup Levels, and Remedial Action Objectives (RAOs) Used at the Time of the Remedy Still Valid? ..............................................................................................................................66
5.2.1 Changes in Standards and TBCs ...............................................................................67 5.2.2 Changes in Exposure Pathways ................................................................................67 5.2.3 Changes in Toxicity and Other Contaminant Characteristics ...................................68 5.2.4 Changes in Risk Assessment Methods .....................................................................69 5.2.5 Determination Regarding Remedial Action Objectives in 2002 ROD .....................70 5.2.6 Risk Considerations ..................................................................................................70
5.3 Question C: Has Any Other Information Come to Light that Could Call into Question the Protectiveness of the Remedy? ..................................................................70
5.3.1 Considerations Regarding Model Forecasts .............................................................70 VI. ISSUES/RECOMMENDATIONS ..................................................................................72
6.1 Issues and Recommendations Identified in the Five-Year Review .................................72 6.2 Other Findings .................................................................................................................73
6.2.1 IRIS database ............................................................................................................73 6.2.2 Outreach on NYSDOH Fish Advisories ...................................................................73 6.2.3 Institutional Controls ................................................................................................74 6.2.4 Fish Recovery ...........................................................................................................74 6.2.5 Operations, Maintenance & Monitoring Adjustments ..............................................75
VII. PROTECTIVENESS STATEMENT ..............................................................................76 VIII. NEXT REVIEW ..............................................................................................................77 IX REFERENCES ................................................................................................................78

iii Final Second Five-Year Review Report for the Hudson River PCBs Superfund Site April 2019
LIST OF APPENDICES
APPENDIX 1 - EVALUATION OF WATER COLUMN PCB CONCENTRATIONS AND LOADINGS
APPENDIX 2 - MASS REDUCTION EVALUATION APPENDIX 3 - ASSESSMENT OF PCB LEVELS IN FISH TISSUE APPENDIX 4 - SURFACE SEDIMENT CONCENTRATIONS APPENDIX 5 - PCB AROCLORS DATA TREATMENT APPENDIX 6 - PCB AIR ANALYSIS APPENDIX 7 - CAPPING EVALUATION APPENDIX 8 - DIFFERENCES BETWEEN ANTICIPATED AND IMPLEMENTED
DREDGING OPERATIONS FOR THE SELECTED REMEDY APPENDIX 9 - ADDITIONAL INFORMATION ON STATUS OF IMPLEMENTATION OF
THE REMEDY APPENDIX 10 - INSPECTION FORMS APPENDIX 11 - RISK ANALYSIS APPENDIX 12 - FIVE-YEAR REVIEW TEAM AND STAKEHOLDER INVOLVEMENT APPENDIX 13 - NYSDOH OUTREACH AND COMMUNICATION REGARDING FISH
ADVISORIES AND FISHING RESTRICTIONS APPENDIX 14 - BIBLIOGRAPHY APPENDIX 15 - CHRONOLOGY OF MAJOR SITE EVENTS

iv Final Second Five-Year Review Report for the Hudson River PCBs Superfund Site April 2019
LIST OF TABLES
Table 2-1 Phase 2 Sediment Removal and Dredging Seasons
Table 2-2 Summary of Implemented Institutional Controls
Table 3-1 Protectiveness Determinations/Statements from the 2012 FYR
Table 3-2 Status of Recommendations from the 2012 Five-Year Review
Table 4-1 Public/CAG engagement throughout Second Five-Year Review Process
Table 5-1 Volume and mass of PCB contaminated sediments removed

v
Final Second Five-Year Review Report for the Hudson River PCBs Superfund Site April 2019
LIST OF ABBREVIATIONS AND ACRONYMS
A1016 Aroclor 1016
A1221 Aroclor 1221
A1242 Aroclor 1242
A1254 Aroclor 1254
ADD Average Daily Dose
ARAR Applicable or Relevant and Appropriate Requirement
AT Albany-Troy
ATSDR Agency for Toxic Substances and Disease Registry
BERA Baseline Ecological Risk Assessment
BMP Baseline Monitoring Program or best management practice
BSAF Biota Sediment Accumulation Factor
BW body weight
CAG Community Advisory Group
CAM Corrective Action Memo
CCC Criteria Continuous Concentration
CCE Cornell Cooperative Extension
CDC Centers for Disease Control and Prevention
CDF cumulative distribution function
CERCLA Comprehensive Environmental Response, Compensation, and Liability Act
CFR Code of Federal Regulations
cfs cubic feet per second
CIP Community Involvement Plan
cm centimeter
COC chemical of concern
COPC chemical of potential concern
CS Catskill
CSF Cancer Slope Factor
CSM Conceptual Site Model

vi
Final Second Five-Year Review Report for the Hudson River PCBs Superfund Site April 2019
CT central tendency
CTE Central Tendency Exposure (Exposed)
CU Certification Unit; dredging target area within which performance metrics were applied
DAD Dredge Area Delineation
DDS Downstream Deposition Study
DDT dichlorodiphenyltrichloroethane
DEC see NYSDEC
DoC depth of contamination
DOH see NYSDOH
DQO Data Quality Objective(s)
dw dry weight
EDI equal discharge increment
EPA see USEPA
EPC Exposure Point Concentration(s)
EPS Engineering Performance Standards
ERRD EPA Region 2’s Emergency and Remedial Response Division
ERT Environmental Response Team
FCA Fish Consumption Advisory(ies)
FIR food ingestion rate
FS Feasibility Study
FISHRAND mechanistic, time-varying, fish tissue contaminant bioaccumulation model
ft foot (or feet)
FWQC Federal Water Quality Criteria
FWS Fish and Wildlife Service
FYR Five-Year Review (unless otherwise indicated, the Second Five-Year Review report initially released as “Proposed” in June 2017)
g/cm3 grams per cubic centimeter
g/day gram per day
g/m2 gram per square meter

vii
Final Second Five-Year Review Report for the Hudson River PCBs Superfund Site April 2019
GAC granular activated carbon
GC/ECD Gas Chromatography/ Electron Capture Detection method
GCL geosynthetic clay liner
GE General Electric Company
HDC high-density core
HHRA Human Health Risk Assessment
HI Hazard Index
HQ Hazard Quotient
HQ-OSRTI EPA Headquarters’ Office of Superfund Remediation and Technology Innovation
HUDTOX Upper Hudson River Toxic Chemical Model; a mechanistic, numerical chemical fate and transport model for water and sediment
IARC International Agency for Research on Cancer
IC Institutional Control(s)
IRIS Integrated Risk Information System
kg kilogram
Kg/day or kg/d kilogram per day
Kg/month kilogram per month
Kg/yr kilograms per year
Km kilometers
Kow octanol/water partition coefficient
L/day liters per day
Lb Pound
LCL Lower Confidence Limit
LHR Lower Hudson River
LOAEL Lowest Observed Adverse Effect Level
LPCB lipid normalized PCBs
M1668 EPA high-resolution gas chromatography / mass spectrometry (HRGC/HRMS) congener-based PCB analysis method; version 1668c of the method (M1668c) has been used primarily since 2016
M8082 EPA gas chromatography (GC) Aroclor-based PCB analysis method

viii
Final Second Five-Year Review Report for the Hudson River PCBs Superfund Site April 2019
MADIS Multiple Aliquot Depth Integrated Sampler
MCA Monte Carlo Analysis
MCL maximum contaminant level
mGBM modified Green Bay Method; gas chromatography / electron capture detector (GC/ECD) congener-based PCB analysis method adapted by GE for the Hudson River from one originally developed for the Great Lakes
mg/kg milligram per kilogram
mg/kg-ww milligram per kilogram wet weight
MNA Monitored Natural Attenuation
MNA1 baseline MNA scenario
MNA2 “updated” MNA scenario used in Field et al (2016)
MNR Monitored Natural Recovery
MPA Mass Per Unit Area; typically expressed as grams per square meter (g/m2)
MPUV mass per unit volume
NAPL non-aqueous phase liquid
NCP National Oil and Hazardous Substances Pollution Contingency Plan
ND Northumberland Dam
ng/L nanogram per Liter
ng/m3 nanograms per cubic meter
NHANES National Health and Nutrition Examination Survey
NIST National Institutes of Standards and Technology
NLOM non-lipid organic matter
NOAA National Oceanic and Atmospheric Administration
NOAEL No Observed Adverse Effect Level
NPL National Priorities List
NYC New York City
NYS New York State
NYSCC New York State Canals Corporation
NYSDEC New York State Department of Environmental Conservation
NYSDOH New York State Department of Health

ix
Final Second Five-Year Review Report for the Hudson River PCBs Superfund Site April 2019
NYSDOT New York State Department of Transportation
O&M Operations and Maintenance
OM&M Operations, Maintenance, and Monitoring
OSWER Office of Solid Waste and Emergency Response
OU Operable Unit; an officially designated portion of a CERCLA site for investigation and remediation purposes
PAH polycyclic aromatic hydrocarbon
PCB Polychlorinated Biphenyl
PCRDMP Post-Construction Remnant Deposit Monitoring Plan
PE Performance Evaluation
PKSD Pumpkinseed
ppb parts per billion
ppm parts per million
ppt parts per trillion
PRA probabilistic analysis
PRG Preliminary Remediation Goal
PRP Potentially Responsible Party
PSCP Performance Standards Compliance Plan
PWS public water supplies
QA Quality Assurance
QAPP Quality Assurance Project Plan
QoLPS Quality of Life Performance Standard
RA Remedial Action
RAM Remedial Action Monitoring
RAMP Remedial Action Monitoring Program
RAWP Remedial Action Work Plan
RAO Remedial Action Objective
REM 3/10/Select Removal Criteria by respective River Sections as stated in the ROD
RfC Reference Concentration
RfD Reference Dose

x
Final Second Five-Year Review Report for the Hudson River PCBs Superfund Site April 2019
RI Remedial Investigation
RI/FS Remedial Investigation and Feasibility Study
RM River Mile
RME Reasonable Maximum Exposure (Exposed)
ROD Record of Decision
RPM Remedial Project Manager
RS River Section
SAV Submerged Aquatic Vegetation
SEDC Supplemental Engineering Data Collection
Site Hudson River PCBs Superfund Site
SMR standardized mortality ratio
SOP Standard Operating Procedure
SOW statement of work
SRM Standard Reference Material
SSAP Sediment Sampling and Analysis Program
TBC To Be Considered; criteria explored as potentially germane to remedial decision-making in parallel with ARARs
TCDD 2,3,7,8-tetrachlorodibenzo-p-dioxin
TID or TD Thompson Island Dam
TIP Thompson Island Pool
TOC Total Organic Carbon
TPCB Total PCB
TPCBAroclor PCB compounds measured as Aroclors
TPCBHE PCB compounds measured as homolog equivalents
Tri+ PCBs PCBs containing three or more chlorines
TRV toxicity reference values
TSCA Toxic Substances and Control Act
TSS Total Suspended Solids
UCL Upper Confidence Limit
UE Unrestricted Exposure

xi
Final Second Five-Year Review Report for the Hudson River PCBs Superfund Site April 2019
µg/L microgram per liter
μg/m3 micrograms per cubic meter
UHR Upper Hudson River
USEPA United States Environmental Protection Agency
USGS Unites States Geological Survey
UU Unlimited Use
WCS Waste Control Specialists, LLC
WIR water ingestion rates
WQ Water Quality
ww wet weight

1 Final Second Five-Year Review Report for the Hudson River PCBs Superfund Site April 2019
EXECUTIVE SUMMARY
Background The purpose of this second five-year review (FYR) is to determine whether the remedial actions at the Hudson River PCBs Superfund Site (Site) are protective of public health and the environment and functioning as designed. This FYR was conducted for both the Remnant Deposits and the in-river sediments of the Upper Hudson River, which is the approximately 40-mile stretch of the river between Fort Edward and the Federal Dam at Troy. The review was conducted pursuant to Section 121(c) of the Comprehensive Environmental Response, Compensation, and Liability Act of 1980, as amended (CERCLA), 42 U.S.C. § 9621(c), and 40 C.F.R. § 300.430(f)(4)(ii) and undertaken in accordance with EPA’s Comprehensive Five-Year Review Guidance, OSWER Directive 9355.7-03B-P (June 2001). The triggering action for this second FYR is EPA’s June 1, 2012, signature of the previous FYR. In order to complete the second FYR report by the triggering date, EPA selected December 2016 as the end date for data and other information to be considered by this report. EPA continues to collect and analyze data on an ongoing basis as it is received. Data and information obtained after December 2016 will be included in the next FYR1. This statutory FYR has been prepared because hazardous substances, pollutants, or contaminants remain at the Site above levels that allow for unlimited use and unrestricted exposure.
The U.S. Environmental Protection Agency (EPA) is addressing the Site in discrete phases or components known as operable units (OUs). The 1984 Record of Decision (ROD) (EPA, 1984) for the first OU (OU1) addresses areas, discussed below, known as the Remnant Deposits, and in addition called for a treatability study of the Waterford Water Works to determine whether upgrades or alterations of that facility were needed. The 2002 ROD (EPA, 2002) for the second OU (OU2) selected dredging to address PCB-contaminated sediments of the Upper Hudson River, as well as monitored natural attenuation (MNA) of PCB contamination that remains in the river after dredging.
Monitored natural attenuation (MNA) is a risk reduction approach that uses ongoing naturally occurring processes to contain, destroy, or reduce the availability or toxicity of contaminants in the environment to living organisms. Monitoring of the ecosystem during MNA ensures that the conditions needed for MNA are occurring and that progress is being made towards cleanup goals. The primary MNA processes that occur in the Hudson River include cleaner sediment entering the river from upstream and tributaries, sediment movement and/burial, and PCBs binding to organic matter making them less bioavailable. MNA is often a necessary and relied upon process at contaminated sediment sites such as the Hudson River, where PCBs have been distributed over large areas.
1 As requested by New York State and various stakeholders, EPA has considered additional surface sediment data collected by NYSDEC in 2017. The NYSDEC 2017 surface sediment data supplemented surface sediment data already collected by GE in 2016 and included in this FYR. NYSDEC’s data yielded similar estimates for sediment PCB concentrations to those used in this FYR. Additional details regarding EPA’s analysis of the combined GE 2016 and NYSDEC 2017 surface sediment data can be found in EPA’s March 2019 Technical Memorandum (www.epa.gov/hudson). For that Technical Memorandum, the NYSDEC 2017 surface sediment data have been incorporated with EPA’s monitoring data for the Site, providing a more robust understanding of the conditions in the Upper Hudson shortly after dredging.

2 Final Second Five-Year Review Report for the Hudson River PCBs Superfund Site April 2019
In addition to OU1 and OU2, in 1999 EPA removed approximately 4,400 tons of contaminated soil from Roger’s Island under CERCLA’s removal action authority. Additionally, General Electric Company (GE) has conducted Superfund removal actions in the floodplain of the Upper Hudson River under an administrative consent order with EPA, and under a separate administrative consent order GE currently is performing a remedial investigation and feasibility study (RI/FS) of PCB contamination in the Upper Hudson River floodplain from upstream of one of the Remnant Deposits (Remnant Deposit 1) in Hudson Falls, New York, to Troy, New York. EPA plans to issue a separate ROD for the floodplain following GE’s completion of the RI/FS.
This FYR addresses the remedial actions for OU1 and OU2. EPA’s remedy for the Remnant Deposits, OU1, includes in-place capping of the Remnant Deposits (areas of PCB-contaminated sediments that became exposed when the Fort Edward Dam was removed in 1973 and the river’s water level dropped). Major components of the OU2 remedy include:
1. removal of PCB-contaminated sediments via environmental dredging within areas targetedfor remediation, followed by placement of backfill or capping;
2. MNA of PCB contamination that remains in the river after dredging;3. monitoring of fish, water, and sediment to determine when remediation goals are reached;4. habitat replacement and reconstruction and associated monitoring; and5. implementation of appropriate institutional controls such as fish consumption advisories
and fishing restrictions by the responsible authorities.
In 1991 GE completed capping of Remnant Deposit Sites Nos. 2, 3, 4 and 52 as called for in the 1984 ROD and pursuant to a 1990 consent decree with the United States.
GE is implementing the OU2 remedy pursuant to a 2006 Consent Decree with the United States. Dredging was conducted in two phases and completed in 2015; in total, GE reported that 2.75 million cubic yards of sediment were dredged from the river, processed, and shipped via train to approved landfills for disposal during the two dredging phases (Phase 1 and Phase 2). Demobilization of the sediment processing facility was largely completed in December 2016 although certain demobilization activities, including sampling associated with the filter presses and their removal, were not completed until April 2017. The project is currently transitioning from the active remedial action phase to the Operation, Maintenance & Monitoring (OM&M) phase during the MNA period of the remedy.
OU2 data reviewed for this FYR included water, fish, and sediment data, as well as any other applicable data collected as part of the remedial action. These data have been collected throughout the various phases of the project, including pre-design information, the baseline monitoring program, remedial design data collection, the remedial action monitoring program, and monitoring under the OM&M program. The data collected up through 2016 reflect conditions less than a year after completion of dredging and are still influenced by dredging-related impacts. Source control
2 Remnant Deposit 1 originally appeared as an island, but due to flooding in 1976 and 1983 most of the exposed sediment associated with this deposit was scoured.

3 Final Second Five-Year Review Report for the Hudson River PCBs Superfund Site April 2019
actions at the former GE plant and the reductions in sediment PCBs from the dredging have also led to declines in surface water concentrations in the Upper Hudson. EPA is anticipating a similar reduction in PCB levels in fish, followed by continued but more gradual declines in fish tissue concentrations during the post-dredging MNA period. Further monitoring will be required to verify remedy effectiveness, but the analyses presented in this report demonstrate that the models used to support decision making were well-designed, remedial action objectives (RAOs) were appropriately developed, and remedy implementation is proceeding as planned.
Institutional Controls
The 1984 ROD did not identify institutional controls for the Remnant Deposits (OU1). Consistent with the 2012 FYR, EPA is working with New York State to determine the ownership of the properties in order to implement appropriate institutional controls so that potential future use would not compromise the integrity of the cap system or result in unsafe exposures to contaminants.
The 2002 ROD (OU2) included institutional controls in the form of fish consumption advisories and fishing restrictions until the relevant remediation goals are met. These controls are designed to prevent or limit exposure to PCBs through consumption of contaminated fish.
In 1976, as a result of PCB contamination in the Hudson River, the New York State Department of Environmental Conservation (NYSDEC) banned all fishing in the Upper Hudson and most commercial fishing in the Lower Hudson. In 1995, NYSDEC reopened the Upper Hudson River (from Baker’s Falls in the Village of Hudson Falls to the Federal Dam in Troy) to sport fishing on a catch-and-release basis only. The mid- and lower regions of the Hudson River are not subject to the catch-and-release regulation. They are, however, subject to a sportfish consumption advisory issued by the New York State Department of Health (NYSDOH). This advisory is an institutional control that seeks to limit human exposure to PCBs through the consumption of fish and crab from the Hudson River.
The NYSDOH River Fish Advisory Outreach Project has been established to promote awareness of the fish advisories and regulations and to encourage people to adhere to them. Various outreach initiatives, including placing signs at major fishing access sites to warn people of the dangers of consuming fish from the Hudson River, are being implemented.
Five-Year Review Process
EPA’s Comprehensive Five-Year Review Guidance states that, for complex projects, a multidisciplinary five-year review team of experts may be needed to adequately review the protectiveness of the remedy. Because of the complexity of the Hudson River PCBs Site remediation, EPA assembled an FYR team that included representatives of state agencies, federal agencies, Community Advisory Group members, and EPA subject matter experts. The team provided input on remedy implementation and performance based on information that includes environmental data and document review. Team members participated in meetings throughout the review period. Three public workshops were also held during a 90-day public comment period as part of the second FYR to provide information about the review to the public, and to allow for the

4 Final Second Five-Year Review Report for the Hudson River PCBs Superfund Site April 2019
public to provide input to the FYR. Written correspondence was received during the FYR from multiple State and Federal agencies, environmental groups, and elected officials. All input received was considered by EPA during the development of the second FYR report.
Technical Assessment
Question A: Is the Remedy Functioning as Intended by the Decision Documents?
OU1: The caps on the Remnant Deposits are intact and functioning as intended to prevent potential contact with and volatilization of the PCB waste.
OU2: The remedial action was implemented consistent with the expectations of the ROD, and while human health and ecological remedial goals have not yet been achieved, the limited post-dredging data indicates that the remedy is consistent with modeling analyses and expectations presented in the FS and ROD. The following summarizes of the status of the OU2 remedy:
• NYSDEC and NYSDOH have maintained the fishing restrictions and advisories, withmodifications as appropriate, and those departments continue to conduct public outreachto minimize human consumption of fish.
• Remedial work at GE’s Fort Edward and Hudson Falls plants, overseen by NYSDEC, hasresulted in reduced water column PCB concentrations entering the project area, at or belowthe levels anticipated in the ROD.
• The dredging and related activities (capping, backfilling and habitat reconstruction) wereimplemented fully and within expectations described in the 2002 ROD and 2006 ConsentDecree.
o The project was implemented in compliance with the Engineering PerformanceStandards (EPS) and Quality of Life Performance Standards (QoLPS) developedfor the project and revised for Phase 2 based on lessons learned following peerreview of the Phase 1 dredging. The area capped in Phase 2 was 7.7 percent of the area dredged (based on
metrics developed for the project), which is less than the 11 percent limitestablished by the EPS for dredging residuals. PCB inventory capping was0.5 percent of the area dredged, which is less than the 3 percent limit forthose areas established in the standard. The estimated PCB mass capped issmall relative to the mass removed by dredging.
Capped areas are required to be monitored at intervals of one, five, and 10years following placement, and subsequently every 10 years in perpetuityfor Phase 2 caps, and for thirty years following placement of the Phase 1caps. The primary monitoring methodology is via bathymetric surveys.Evaluation of cap stability in areas dredged during Phase 1 indicates thatsubaqueous cap material has remained stable with no measurable erosion,as defined in the OM&M Plan, both at the one-year and five-year intervalsfollowing placement. Further, assessment of cap stability following a 100-

5 Final Second Five-Year Review Report for the Hudson River PCBs Superfund Site April 2019
year storm event in 2011 found no measurable loss of cap material in Phase 1 areas.
Net load to the Lower Hudson River associated with Phase 2 of the dredgingwas 0.7 percent (i.e., less than the EPS for dredging-related resuspension of1 percent) of the Tri+3 PCB mass removed.
o Total PCB (TPCB) and Tri+ PCB mass removed were greater than planned, due tounderestimates of the depth of contamination during the original remedial design.PCB mass in non-dredged areas is also greater than estimated in the 2002 ROD,although to a lesser extent than within the dredged areas. As calculated by EPA, thevolume of sediment, mass of Total PCBs, and mass of Tri+ PCBs removed duringboth Phases 1 and 2 were approximately 2,630,000 cubic yards of sediment,156,000 kg of TPCBs, and 48,600 kg of Tri+ PCBs, respectively.
o Surface sediment data in conjunction with fish and water column concentrationsindicate that surface sediment PCB concentrations are decreasing with time. Thereduction in surface sediment concentration associated with dredging alone by riversection was 87 percent, 36 percent, and 5 percent in River Sections 1, 2, and 3,respectively. Although the reduction associated with dredging in River Section 2(RS 2) was less than expected and may cause a lag in recovery, the overall surfacesediment reduction is within ROD expectations.
o EPA estimates that approximately 76 percent of the overall PCB mass from theUpper Hudson River was removed by the dredging, which exceeds the 65 percentreduction assumed in the ROD.
o Habitat replacement and reconstruction was conducted as anticipated. OM&M ofrestored habitat will continue until project objectives are met.
• Monitored natural attenuation is occurring and rates of decline are generally in agreementwith the modeling done for the ROD.
o For the pre-dredging MNA period (1995-2008), water column Tri+ PCBconcentrations declined at rates ranging from approximately 5 to 13 percent peryear at the four Upper Hudson monitoring stations, and HUDTOX modelsimulations for this period were generally faithful to both seasonal and long-termtrends.
o Fish tissue concentrations declined during the pre-dredging MNA period (1995-2008). Rates of decline in the Upper Hudson for wet weight and lipid-normalizedfish tissue PCB concentrations were approximately 12 to 20 percent per year andapproximately 8 percent per year, respectively, consistent with rates estimated fromthe FISHRAND model output. Lower rates of decline were observed at locationsfarther downstream in the Lower Hudson River.
3 Tri+ PCBs represents the sum of all measured PCB congeners with three or more chlorine atoms per molecule. PCBs are a group of chemicals consisting of 209 individual compounds known as congeners. The congeners can have from one to ten chlorine atoms per molecule, each with its own set of chemical properties. Tri+ PCB was found to represent 90 percent or more of the total PCB burden in fish samples.

6 Final Second Five-Year Review Report for the Hudson River PCBs Superfund Site April 2019
o The modeling was an important tool used for decision making in the ROD.Consistent monitoring of the fish in the river during the pre-dredging MNA period(1995-2008) allowed EPA the opportunity to evaluate if the model reasonablypredicted fish tissue declines over time. Declines during dredging could not becompared to the modeling due to disturbances in the river from dredging. It isimportant to note that EPA is not indicating in this review that the rates calculatedfor the pre-dredge MNA period are the expected declines that will occur in the post-dredging period. Post-dredging rates of decline will be calculated from actualmeasured changes and compared to the modeled recovery trends.
o Available surface sediment data indicate that PCB concentrations are decreasingwith time. Although the exact rate of decline is difficult to determine, as thesediment data were not collected in a consistent manner over time, the resultsindicate a decay rate similar to that predicted at the time of the ROD.
• For the pre-dredging period 1998-2008, trends in Upper Hudson water column PCBconcentrations were generally consistent with forecasts obtained from EPA’s models.During the 2009-2015 dredging period, the highest observed concentrations of watercolumn PCBs were outside the range seen during the preceding Baseline Monitoring Period(2004-2008). Nevertheless, due to operational controls that were implemented duringPhase 2 of the dredging effort (2011-2015), PCB loadings to the Lower Hudson due toPhase 2 dredging were in compliance with the EPS. For the first post-dredging year, 2016,Upper Hudson water column PCB concentrations were substantially lower than the 2004-2008 pre-dredging baseline period and were generally consistent with ROD expectationsfor the first year after dredging. In the Lower Hudson River, very similar trends before,during, and after dredging efforts were observed at Albany (immediately downstream ofthe Upper Hudson River). Mid-Hudson water column PCB concentrations (as measuredfurther downstream at Poughkeepsie) displayed minimal increases during dredging, andappear to be influenced primarily by local conditions, including legacy impacts of historicalPCB loadings from the Upper Hudson.
• Fish, sediment and water data at this early time are not sufficient to identify post-dredgingtrends with a high degree of confidence, and likely reflect continued impacts from dredgingoperations. Additional years of monitoring data are needed. As noted in the ROD (e.g., pp68-69), EPA’s expectation was that following dredging, the system would require at leasta year or more to equilibrate to post-dredging conditions and exposures.
o For the post-dredging period, 2016 Tri+ PCB water column concentrations at UpperHudson monitoring stations were generally consistent with ROD expectations forthe first post-dredging year. Concentrations in 2016 were lower than during thedredging period and also lower than in 2008, the last year prior to dredging.Concentrations in summer were about two to three times lower than during the2004-2008 baseline monitoring period.
o Based on comparison of the 2002-2005 Sediment Sampling and Analysis Plan(SSAP) and the 2016 OM&M sediment sampling datasets, the percentage declinesin average Tri+ PCB concentrations in surface sediments as a result of dredgingand MNA were 96 percent, 88 percent and 80 percent in RS 1, RS 2 and RS 3,respectively. Surface-area-weighted average PCB concentrations across each river
7 Final Second Five-Year Review Report for the Hudson River PCBs Superfund Site April 2019
section are close to or below the ROD’s post-dredging residual target of 1 mg/kg Tri+ PCB for dredged areas.4 These percent reductions suggest that the net positive effect of the dredging and natural recovery continued in non-dredged areas through the dredging period, despite the resuspension releases of PCBs during dredging.
o 2016 fish data suggest that PCB levels in fish have begun to recover from dredgingimpacts and are generally declining. It is important to recognize that as many aseight or more years of fish tissue data may be necessary to draw statistically-basedconclusions about trends, with a high degree of confidence, depending on the actualrate of decline that is experienced.
• Monitoring of water, fish, and sediment will continue under the OM&M program toconfirm that natural attenuation continues to occur, and that the remedy is functioning asintended.
• Limited data collection from the Lower Hudson River indicates that recovery rates areslower than in the Upper Hudson River and may not be strongly associated with PCBloading from the Upper Hudson River.
o The rate of decline of fish tissue PCB concentrations generally decreases withdistance downstream. As a result, there is a decrease in the correlation between fishPCB concentrations in the Upper Hudson River and Lower Hudson River withdistance downstream. This indicates that PCB sources in the Upper Hudson Rivercurrently have less of an impact on Lower Hudson River fish than on fish in theUpper Hudson.
o Water column concentrations at Albany/Troy were consistent with modelingpredictions during the pre-dredging MNA period and increased during dredgingactivities. By contrast, results at Poughkeepsie were generally higher than modelpredictions and not impacted by dredging, indicating that water columnconcentrations are less dependent on Upper Hudson River conditions with distancedownstream. It should be noted that there are other sources of PCBs in the LowerHudson River, including external sources (sources originating beyond the banks ofthe river) and contaminated ‘legacy sediment’ deposits containing PCBsoriginating from both GE’s releases to the Upper Hudson River and other sources.
• Overall, the project has been implemented as anticipated in the ROD. Dredging activitiesdid include several operational differences from assumptions in the ROD with potentialimpacts on recovery rates in fish. Some of these differences included a delayed start todredging, significantly increased mass removal, the use of a single processing facility, anddredging in multiple river sections simultaneously.
• As it pertains to ecological risk, the remedy has reduced PCB inventory in the sedimentthrough dredging, and MNA is ongoing.
4 The ROD expected a residual target of 1 mg/kg Tri+ PCB post-dredging. This is an appropriate benchmark for comparison to average surface sediment concentrations in this FYR because, while surface sediment concentrations will continue to decline as a result of natural attenuation, the effects of natural attenuation at this early stage after the completion of dredging are small. The ROD expected that further reduction in surface sediment PCB concentrations via MNA will be required to achieve the remedial goals for fish tissue.

8 Final Second Five-Year Review Report for the Hudson River PCBs Superfund Site April 2019
This FYR is based on post-dredging data up to December 2016 for sediment, water column and fish tissue PCB concentrations, and provides preliminary indications of system response to implementation of the remedy.
Question B: Are the Exposure Assumptions, Toxicity Data, Cleanup Levels, and Remedial Action Objectives Used at the Time of the Remedy Still Valid?
Risks at OU1 (Remnant Deposits) were evaluated for this FYR and EPA determined that the capping of PCBs greater than 5 mg/kg would be consistent with current risk practices.
For OU2 (in-river sediments), the risks that were calculated for the ROD were re-assessed using current exposure assumptions, toxicity values, and standards to determine if the conclusions of the risk assessment or the protectiveness of the remedy has changed. Although there have been some updates to the exposure assumptions used in the human health risk, the updates do not change the conclusions of the risk assessment. Toxicity values for human health were taken from the Integrated Risk Information System (IRIS) for both cancer and non-cancer health effects, consistent with EPA guidance. EPA determined that the human health RAOs developed in the 2002 ROD are still valid and appropriate for the Site.
For ecological risk, there were some changes to exposure parameters (some increasing and some decreasing) and toxicity values (i.e., the Lowest Observed Adverse Effect Level (LOAEL) and No Observed Adverse Effect Level (NOAEL)). Overall, use of these updated values would result in calculated risk ranges that are narrower than presented in the ROD, with a slight reduction in the upper bounds of the risk-based concentration ranges for PCBs in fish consumed by river otter and mink. This refinement results in risk-based ranges that reduce uncertainty and focus the range of PCBs in fish expected to be protective of the ecological exposure pathway. The lower bounds of the updated ranges are not lower than the lower bounds for both ranges identified in the ROD, and the refinements of toxicity values and exposure parameters do not affect the protectiveness determination of the selected remedy.
Question C: Has Any Other Information Come to Light that Could Call into Question the Protectiveness of the Remedy?
No other information has come to light that could call into question the protectiveness of the OU1 and OU2 remedies. For the OU2 remedy, EPA estimates that as many as eight or more years of post-dredging fish tissue data are needed to establish statistically relevant rates of decline in post-dredging fish tissue PCB levels. The following information regarding the fish tissue targets for OU2 is provided for clarification.
At the time of the ROD, a number of details for the implementation of the remedy had not yet been defined, including the timing, number of sediment processing/transfer facilities, and certain operational details. The modeling done for the Feasibility Study was sufficiently accurate to compare remedies and support remedy selection. The models, however, were not intended to predict the specific years in which specified PCB levels would be achieved in fish. Additionally, EPA acknowledged in the ROD that the model forecasts included uncertainties, and that they were more appropriately used to compare relative benefits of different remedial alternatives. It was also

9 Final Second Five-Year Review Report for the Hudson River PCBs Superfund Site April 2019
recognized at the time of the ROD that forecasts of fish tissue concentration become increasingly uncertain for the longer time periods predicted to be needed to achieve risk targets. Further, dredging caused perturbations to the system that were not all anticipated and were not modeled. These perturbations are discussed in Appendix 8, and their effects are also shown in Appendices 1 and 3. One year of post-dredging data indicate a reduction in water column PCB concentrations consistent with EPA’s expectations at the time of the ROD, as shown in Appendix 1. EPA will continue to collect data as needed to establish a trend for the post-dredge period and obtain an increasing degree of certainty about times to achieve risk-based fish tissue targets.
Protectiveness
OU1: The remedy at the Remnant Deposits (OU1) currently protects human health and the environment as the in-place containment and cap system prevents human exposure, and as perimeter fencing and signage continue to be maintained. However, in order for the remedy to be protective in the long-term, an institutional control needs to be implemented to ensure that the future use of the areas with the Remnant Deposits does not compromise the integrity of the cap system or result in unsafe exposures.
OU2: A protectiveness determination of the remedy at OU2 cannot be made until further information is obtained. There is not enough data available since the completion of dredging and related project activities in 2015 to determine if the remedy will be protective within the time frame anticipated by the Record of Decision (ROD). There is also not sufficient data available to assess whether the interim targets identified in the ROD will be reached in the time frames estimated at the time the ROD was issued in 2002. A critical factor needed for the protectiveness determination is a reliable calculation of the rate of decline in post-dredging fish tissue PCB levels. It is necessary to examine the annual record over a longer period of time in order to calculate this rate with statistical certainty. EPA estimates that as many as eight or more years of post-dredging fish tissue data are needed. This information will be obtained through the collection and evaluation of fish tissue data along with the water and sediment data collected as part of the long-term monitoring program. Once statistically relevant rates of decline in post-dredging fish tissue PCB levels can be established, EPA will estimate the rates of recovery and determine if they are reasonably consistent with those predicted in the ROD. It is anticipated that this additional information will be obtained with the results of the 2024 fish data (which will be available in 2025) after which time a protectiveness determination could be made. Remedial activities completed to date have substantially reduced PCB source materials in the Upper Hudson River. Natural attenuation is ongoing within the Upper Hudson River, and these processes are expected to result in the River eventually reaching the long-term remediation goal for the protection of human health with regard to fish consumption (0.05 mg/kg PCBs in species-weighted fish fillet). As EPA indicated in the ROD, EPA believes it likely that improvement will occur gradually over more than five decades. In the interim, the State of New York has in place fishing restrictions and advisories against consumption of fish to control human exposure pathways that could result in unacceptable risks. EPA acknowledged in the ROD that the consumption advisories are not fully effective in that they rely on voluntary compliance in order to prevent or limit fish consumption. EPA will continue to work with New York State to ensure the ongoing maximum effectiveness of the advisories.

10 Final Second Five-Year Review Report for the Hudson River PCBs Superfund Site April 2019
This Second Five-Year Review Report does not include a sitewide protectiveness statement because additional operable units are still undergoing investigation, with the possibility of future remedial action. In particular, there is an ongoing comprehensive investigation of PCB contamination in the Hudson River floodplain and EPA is planning a further investigation of PCB contamination in the Lower Hudson River.

11 Final Second Five-Year Review Report for the Hudson River PCBs Superfund Site April 2019
I. INTRODUCTION
The purpose of a five-year review (FYR) is to evaluate the implementation and performance of a remedy in order to determine if the remedy is and will continue to be protective of human health and the environment. FYR reports document the methods, findings, and conclusions of reviews. In addition, FYR reports identify issues found during the review, if any, and document recommendations to address them.
The U.S. Environmental Protection Agency (EPA) prepared this FYR pursuant to Section 121 of the Comprehensive Environmental Response, Compensation, and Liability Act (CERCLA), consistent with the National Contingency Plan (NCP; 40 CFR Section 300.430(f)(4)(ii)), and also considered EPA policy.
This is the second FYR for the Hudson River PCBs Superfund Site (Site). The triggering action for this statutory review was June 1, 2012, the date of signature of the previous FYR. CERCLA requires EPA to review certain types of remedial actions no less often than every 5 years. The FYR has been prepared because hazardous substances, pollutants, or contaminants remain at the Site above levels that allow for unlimited use and unrestricted exposure (UU/UE).
EPA is addressing the Site in discrete phases or components known as operable units (OUs). The 1984 Record of Decision (ROD) for the first OU (OU1) provided for the in-place containment of the “Remnant Deposits”5 and a treatability study of the Waterford Water Works to determine whether upgrades or alterations of the facilities were needed. The 1984 ROD also included an interim “no action” decision for PCB-contaminated sediments in the Upper Hudson River. The 2002 ROD (EPA, 2002) for the second OU (OU2) selected active remediation (dredging) to address PCB-contaminated in-place sediments of the Upper Hudson River, as well as monitored natural attenuation of PCB contamination that remains in the river after dredging. This FYR addresses these two OUs (OU1 and OU2)
• In addition to OU1 and OU2, there have been other response actions at the Site that arenot addressed in this FYR. In 1999, EPA removed approximately 4,400 tons ofcontaminated soil from Roger’s Island under CERCLA’s removal action authority.Additionally, General Electric Company (GE) has conducted Superfund removal actionsin the floodplain of the Upper Hudson River under an administrative consent order withEPA, and under a separate administrative consent order GE currently is performing aremedial investigation and feasibility study (RI/FS) of PCB contamination in the UpperHudson River floodplain from the base of Bakers Falls, which is located upstream ofRemnant Deposit 1 and the historical GE plants in Hudson Falls and Fort Edward, NewYork to the Federal Dam in Troy, New York. To date approximately 60 removal actionshave been conducted in the floodplain. EPA plans to issue a separate ROD for thefloodplain following GE’s completion of the RI/FS.
5 The Remnant Deposits are PCB-contaminated sediment deposits along the banks of the Hudson River upstream of Fort Edward that became exposed when the water level dropped following removal of the Fort Edward dam.
12 Final Second Five-Year Review Report for the Hudson River PCBs Superfund Site April 2019
The second Hudson River PCBs Superfund Site FYR was led by EPA Project Director, Gary Klawinski, and EPA Office of Superfund Remediation and Technology Innovation (OSRTI) - Environmental Response Team (ERT) manager Marc S. Greenberg, Ph.D. Participants also included other EPA staff within EPA Region 2’s Emergency and Remedial Response Division (ERRD) and EPA Headquarters’ Office of Superfund Remediation and Technology Innovation (HQ-OSRTI) as appropriate. This document was prepared following EPA Office of Land and Emergency Management (OLEM) Guidance 9211.0-89 – Five-Year Review Recommended Template.
1.1 Site Background
1.1.1 Site Location The Site includes an approximately 200-river-mile stretch of the Hudson River in eastern New York State from the Village of Hudson Falls to Battery Park in New York City. The Site is divided into the Upper Hudson River (the length of river between Hudson Falls and the Federal Dam at Troy, New York) and the Lower Hudson River (the length of river between Federal Dam at Troy and Battery Park). For purposes of OU2, EPA further divided the Upper Hudson River area into three main sections known as River Section 1 (RS 1), River Section 2 (RS 2), and River Section 3 (RS 3).
The Site also includes five Remnant Deposits located upriver from River Section 1. As noted above, Remnant Deposit 1 originally appeared as an island, but due to flooding in 1976 and 1983 most of the exposed sediment associated with this deposit was scoured. Remnant Deposit 2 is approximately 3.5 acres and is located on the west bank of the Hudson River, in the Town of Moreau. Remnant Deposit 3 is approximately 17 acres and is located on the east bank of the Hudson River, in the Town of Fort Edward. Remnant Deposit 4 is approximately 24 acres and is located on the west bank of the Hudson River in the Town of Moreau. Remnant Deposit 5 is approximately 3.5 acres and is located on the east bank of the Hudson River in the Town of Fort Edward.
Figure 1 provides the location of OU1. Figure 2 provides the location of OU2. Rogers Island, the location of the 1999 EPA soil removal action, is also identified in Figure 2 and is located in the Town of Fort Edward, New York. The Upper Hudson River floodplain consists of the low-lying shoreline areas on the east and west banks of the river between Hudson Falls and Troy.
1.1.2 Physical Characteristics The Upper Hudson River is freshwater and non-tidal. Downstream of Fort Edward, the river is joined by several tributaries, the largest of which are the Mohawk River, Batten Kill, Fish Creek, and the Hoosick River. The flow in the Upper Hudson River is primarily controlled by several reservoirs above Glens Falls, including the Great Sacandaga Lake. The Upper Hudson River has an average depth of less than 8 feet in the shoal areas and approximately 18 feet in the channel, with a maximum depth of more than 45 feet. The New York State Canal Corporation (NYSCC) navigation channel is generally identified as being a minimum of 12 feet deep by design in the project area.

13 Final Second Five-Year Review Report for the Hudson River PCBs Superfund Site April 2019
The Champlain Canal is coincident with portions of the Hudson River, extending from Waterford on the Hudson to Whitehall at the southern end of Lake Champlain. Bedrock, cut away to form the Champlain Canal, is exposed in some areas of the river, while lacustrine silts and clays of glacial age are exposed in other areas. Coarser-grained sediments are often observed in the river channel, while finer-grained sediments are more common in shallow water.
Areas adjacent to the Upper Hudson River are primarily residential and agricultural with some commercial/industrial land. Floodplain land categories include forested shoreline wetlands, transitional uplands, and vegetated backwater such as emergent marsh and scrub-shrub wetlands.
1.1.3 Land and Resource Use In the Upper Hudson River, land use is primarily residential and agricultural with some commercial and industrial activities. Such uses of the river and lands surrounding the river are anticipated to remain the same. The Site passes through 14 different counties as the river flows to its final discharge point in New York Harbor. Four counties (Albany, Washington, Rensselaer, and Saratoga) lie adjacent to the Upper Hudson River. Within these four counties, forest and farmlands surround urban centers and historic villages. In addition to the GE Hudson Falls and Fort Edward plants, the area is home to other businesses including technology, oil service and food companies. Both the GE Hudson Falls and Fort Edward Plants are no longer being actively used by GE for industrial purposes and many of the plant buildings have been removed. Environmental investigations and active remediation under NYSDEC oversight are occurring at both sites.
The following entities or municipalities obtain at least a portion of their water supplies directly from the Hudson River or from well fields located near the river, and these water supplies were monitored during the implementation of the remedy: the City of Poughkeepsie, the Dutchess County Water and Wastewater Authority, the Village of Rhinebeck, the Castle Point Medical Center, the Highland and Port Ewen water districts, the Village of Schuylerville, and the Village of Green Island. The Towns of Waterford and Halfmoon also have inactive intakes for Hudson River water; both Towns currently obtain their water from the City of Troy via an EPA-constructed water line. During the implementation of the OU2 remedy, EPA paid certain of the Towns’ increased costs of purchasing water from Troy as an alternate water source. Now that dredging work is complete and the waterline is no longer needed in association with the project, EPA is in the process of turning ownership of the waterline over to the respective municipalities. The Town of Moreau and Village of Stillwater source their water from the Saratoga County Water Authority, which obtains its water from the Hudson River upstream of the GE plants in Hudson Falls and Fort Edward. The river has been utilized for hydroelectric and thermal power generation, as well as for manufacturing processes, cooling, and fire protection. The river is also used for irrigating agricultural lands and watering domestic lawns and gardens.
The river supports a variety of water-based recreational activities including sport fishing, waterfowl hunting, swimming, and boating; however, at the current time, there is an “eat none” fish advisory for the entire Upper Hudson River and for “women under 50 years and children under the age of 15 years” for the Lower Hudson. In addition to fish the advisories include crab. See Appendix 13 for detailed information regarding New York State’s Hudson River regulations and advisories.
14 Final Second Five-Year Review Report for the Hudson River PCBs Superfund Site April 2019
The Town of Moreau is considering whether to construct a park on top of Remnant Deposit sites 2 and/or 4. Before one or both of these areas is used for such a park, further measures such as more frequent inspections or additional sampling may be needed to ensure that the use of these sites will not cause unacceptable risks of exposure for recreational use. EPA will continue to discuss the potential future use of these sites and their ownership with the Town of Moreau, New York State, and GE.
1.1.4 Site Chronology A chronology of events is included as Appendix 15.
1.1.5 History of Contamination From approximately 1947 to 1977, GE discharged an estimated 1.3 million pounds of PCBs into the Hudson River from its capacitor manufacturing plants at Hudson Falls and Fort Edward. The two plants are located adjacent to or near the Hudson River. These discharged PCBs were transported through the river and adhered to sediments that settled and accumulated in the impounded pool behind the Fort Edward Dam, as well as other depositional areas farther downstream. In 1973, the Fort Edward Dam was removed due to its deteriorating state which resulted in the remobilization and downstream distribution of PCBs that had accumulated behind the dam. The Remnant Deposits were also exposed after the river’s water level dropped when the Fort Edward Dam was removed. During subsequent floods, PCB-contaminated sediments from the Fort Edward Dam area were scoured and transported downstream.
1.1.6 Initial Response The New York State Department of Environmental Conservation (NYSDEC) surveyed the Upper Hudson River sediments from 1976 to 1978 and again in 1984. Areas with average TPCB6 concentrations of 50 parts per million (ppm) or greater were identified and became known as the NYSDEC-defined PCB “hot spots.” There were 40 NYSDEC-identified hot spots, located between river mile (RM) 194 at Rogers Island and Lock 2 at RM 163. Hot spots 1 through 4 were dredged by New York State for navigational purposes in the 1970s.
NYSDEC brought legal action against GE in 1975, which resulted in a $7 million program for the investigation of PCBs and the development of methods to reduce or remove the threat of PCB contamination in the river. In 1975, the New York State Department of Health (NYSDOH) began to issue health advisories recommending that people limit their consumption of fish from the Hudson River. In 1976, NYSDEC issued a ban on all fishing in the Upper Hudson River from Hudson Falls to the Federal Dam at Troy, due to the potential risk from consuming PCB-contaminated fish. NYSDEC also issued a ban on most commercial fishing, including striped bass in the Lower Hudson River. NYSDEC reopened the Upper Hudson River to “catch-and-release” sport fishing in 1995.
In 1974, the New York State Department of Transportation (NYSDOT) dredged approximately 250,000 cubic yards of PCB-contaminated sediment in the vicinity of Rogers Island for navigational purposes. The dredged materials were placed in a disposal area known as Special
6 Total PCBs represents the sum of all measured PCB congeners. PCBs are a group of chemicals consisting of 209 individual compounds known as congeners. The congeners can have from one to ten chlorine atoms per molecule, each with its own set of chemical properties.

15 Final Second Five-Year Review Report for the Hudson River PCBs Superfund Site April 2019
Area 13, which is located along the west bank of the river just south of Roger’s Island. Another approximately 380,000 cubic yards of sediment were dredged from the east and west channels around Roger’s Island in 1974 and 1975 and disposed of in the Old Moreau Dredge Spoil Area, located on the west shore of the river opposite the southern end of Rogers Island and north of Special Area 13.
In 1978, NYSDEC removed approximately 14,000 cubic yards of highly contaminated sediments from Remnant Deposit Area 3A and placed these sediments in a secure encapsulation site in Moreau, along with approximately 215,000 cubic yards of sediment that had been dredged by NYSDOT from the east channel of Rogers Island to clear the navigational channel just below the location of the former Fort Edward Dam. Unstable river banks at two of the Remnant Deposits were reinforced at that time. Three remnant sites were re-vegetated to prevent public contact with the sediments and to minimize erosion and release of PCBs into the environment.
Historical use of Rogers Island for staging and disposal of PCB-contaminated dredge spoils in the late 1970s presented an environmental concern. This concern was prompted by historical reports and information received by NYSDEC from a citizen alleging that PCB-contaminated soil was spread on the island. In October 1998, EPA initiated an evaluation of the extent of PCB-contaminated soils to determine if health concerns existed for the residents of the island. EPA’s sampling results indicated that surface soils within the floodplain on Rogers Island were contaminated with PCBs and lead. Between June and December of 1999 EPA excavated a total of 4,440 tons of contaminated soil from nine Rogers Island properties and disposed of the soil off-site under CERCLA’s removal authority. This action was taken to address risks to human health from direct contact with the contaminated soil. After excavation, areas were backfilled with clean materials, and erosion controls were installed. This removal action is not evaluated in this Second Five-Year Review Report.
Appendix 15 contains additional information about initial response actions and other events in the history of the Site.

16 Final Second Five-Year Review Report for the Hudson River PCBs Superfund Site April 2019
FIVE-YEAR REVIEW SUMMARY FORM
SITE IDENTIFICATION
Site Name: Hudson River PCBs Superfund Site
EPA ID: NYD980763841
Region: 2 State: NY City/County: Hudson Falls to Battery in NYC
SITE STATUS
NPL Status: Final
Multiple OUs? Yes
Has the site achieved construction completion? No
REVIEW STATUS
Lead agency: EPA
Author name (Federal or State Project Manager): Gary Klawinski
Author affiliation: EPA
Review period: 4/24/2012 – 4/23/2017
Date of site inspection: OU1 (3/2/2017) and OU2 (11/10/2016 and 11/30/2016)
Type of review: Statutory
Review number: 2
Triggering action date: 6/1/2012
Due date (five years after triggering action date): 6/1/2017

17 Final Second Five-Year Review Report for the Hudson River PCBs Superfund Site April 2019
II. RESPONSE ACTION SUMMARY
2.1 Basis for Taking Action In 1984, EPA signed a ROD for the Hudson River that selected a remedial action for OU1 and a treatability study of the Waterford Water Works. The 1984 ROD (EPA, 1984) also included an interim no-action decision for PCB-contaminated sediments in the Upper Hudson River.
EPA determined that the Remnant Deposit sites posed an unacceptable threat that warranted remediation to protect human health and the environment. Without remediation, discharges from these sites through bank scouring during periods of high flow would continue to transfer PCBs to the Hudson River. The remediation required sediment PCB concentrations greater than 5 mg/kg to be capped. This approach is consistent with current risk assessment practices for potential recreational use.
In December 1989, EPA announced its decision to initiate a detailed Reassessment RI/Feasibility Study (Reassessment RI/FS) of the interim no-action decision for the sediments. The Reassessment RI/FS was divided into three phases. Phase 1 consisted primarily of a review of existing data and was completed in August 1991. Phase 2, which included the collection and analysis of new data as well as modeling studies and human health and ecological risk assessments and peer reviews, began in December 1991 and concluded in November 2000. Phase 3, known as the FS, formally began in September 1998 and was released concurrently with the Proposed Plan in December 2000.
The Reassessment RI/FS indicated that the primary contaminants and chemicals of concern were as follows:
• Sediments: Once introduced to the river PCBs adhere to the sediments. Physical, chemical,and biological release mechanisms allow PCBs in the sediment to be available forredistribution and to be a source of PCB contamination to the water column. Sedimentswould continue to release contamination to the water column and to biota, through aquaticand benthic food chains, unless they are managed or remediated.
• Surface water: Some fraction of PCBs is carried in the water column.
The Human Health Risk Assessment (HHRA) determined that, under the baseline conditions, the cancer risks and the non-cancer health hazards from ingestion of fish from the Upper Hudson River are expected to exceed EPA’s generally acceptable levels for a 40-year exposure duration beginning in 1999.
• The total cancer risk for the reasonable maximum exposed (RME) individual assuming aningestion rate of 51 half-pound meals/year with appropriate adjustments based on age is 1x 10⁻³ or 1,000 times higher than the goal for protection and 10 times higher than the highestrisk level generally allowed under the federal Superfund law.
• Non-cancer health hazards for the RME young child, adolescent, and adult, respectively,are 104, 71, and 65 times higher than the level considered protective of public health (i.e.,a Hazard Index of 1).

18 Final Second Five-Year Review Report for the Hudson River PCBs Superfund Site April 2019
• Ingestion of one half-pound fish meal every two months, the average ingestion rate, resultsin cancer risks to the central tendency exposed (CTE) individual that are within the cancerrisk range and for the non-cancer assessment that are above the goal of protection of aHazard Index of 1.
• The non-cancer health hazards for the CTE individual, with appropriate modifications foringestion rates based on bodyweight for the individual age groups, are 7, 8, and 12 timeshigher for the adult, adolescent, and young child, respectively, than the level considered tobe protective (i.e., Hazard Index = 1). The cancer risks and non-cancer health hazards fromingestion of fish from the Mid-Hudson River are about half as high as those in the UpperHudson, due to lower concentrations of PCBs in fish, but are also above levels of concern.
EPA’s 2000 Baseline Ecological Risk Assessment (BERA) evaluated assessment endpoints across the multiple trophic levels of the Hudson River aquatic environment. The BERA showed elevated, unacceptable risks to ecological receptors, namely mink and river otter (piscivorous mammals), from the consumption of PCB contaminated fish.
2.2 Response Actions
2.2.1 Remedial Action Objectives for OU1 and OU2 The Remedial Action Objective (RAOs) and selected remedy for OU1 as described in the 1984 ROD are as follows:
2.2.2 OU1: The ROD states that the OU1 remedy was intended to address direct physical contact with PCBs on the Remnant Deposit sites and exposure of adjacent communities to PCBs through dust particles and volatilization, and also to address the continuous discharge of PCBs from the Remnant Deposits into the river. The 1984 ROD also called for a treatability study of the Waterford Water Works to determine whether upgrades or alterations of the facilities were needed to treat PCBs in the water.
Selected Remedy: The major components of the selected remedy consisted of the following:
Remnant Deposits
• In-place capping of the exposed remnant deposits (sites 2, 3, 4, and 5), consisting of a soilcover using 18 inches of subsoil placed in 6-inch lifts and a final 6-inches layer of topsoil;
• Upgrading the riprap stabilization system to above the 100-year flood level; and
• Installing fencing and posting to prevent public access.
Waterford Water Works Treatability Study
• Evaluating the Waterford Water Works treatment facilities in detail; and

19 Final Second Five-Year Review Report for the Hudson River PCBs Superfund Site April 2019
• Sampling and analyzing treatment operations to determine if upgrades or alterations of thefacilities were needed.
River Sediments
• Interim No-Action decision with regard to PCBs in the sediments of the Upper HudsonRiver.
The 1984 ROD did not call for the implementation of institutional controls.
2.2.3 OU2: The selected remedy for OU2 was identified in the ROD issued on February 1, 2002. This remedy included human health RAOs and a remedial goal based on the results of the Revised HHRA, and an ecological RAO and remedial goals that were based on the results of the BERA. The RAOs and major components of the selected remedy for OU2, as described in the 2002 ROD, are as follows:
RAOs:
• Reduce the cancer risks and non-cancer health hazards for people eating fish from theHudson River by reducing the concentration of PCBs in fish;The risk-based preliminary remediation goal (PRG) for the protection of human health is0.05 mg/kg PCBs in fish fillet based on non-cancer hazard indices for the RME adult fishconsumption rate of one half-pound meal per week (this level is protective of cancer risksas well). Other target concentrations are 0.2 mg/kg PCBs in fish fillet, which is protectiveat a fish consumption rate of one half-pound meal per month and 0.4 mg/kg PCBs in fishfillet, which is protective of the CTE or average angler, who consumes one half-poundmeal every two months. Attaining such levels might facilitate the relaxation of the fishconsumption advisories and fishing restrictions (e.g., the “eat none” advisory for the UpperHudson could be relaxed as conditions improve).
• Reduce the risks to ecological receptors by reducing the concentration of PCBs in fish;The risk-based PRG for the ecological exposure pathway is a range from 0.3 to 0.03 mg/kgPCBs in fish (largemouth bass, whole body), based on the LOAEL and the NOAEL forconsumption of fish by the river otter. The ecological PRG is considered protective of allthe ecological receptors evaluated because it was developed for the river otter, thepiscivorous mammal calculated to be at greatest risk from PCBs at the Site. In addition, arange from 0.7 to 0.07 mg/kg PCBs in spottail shiner (whole fish) was developed based onthe NOAEL and LOAEL for the mink, which is a species known to be sensitive to PCBs.Other species, such as the bald eagle, were considered but are at less risk than the riverotter.
• Reduce PCB levels in sediments in order to reduce PCB concentrations in river (surface)water that are above applicable or relevant and appropriate requirements (ARARs);
The ARARs for surface water are: 0.5 µg/L [500 ng/L] TPCBs, the federal maximumcontaminant level (MCL) for drinking water; 0.09 µg/L [90 ng/L] TPCBs, the New YorkState standard for protection of human health and drinking water sources; 1 ng/L TPCBs,

20 Final Second Five-Year Review Report for the Hudson River PCBs Superfund Site April 2019
the federal Ambient Water Quality Criterion; 0.12 ng/L TPCBs, the New York State standard for protection of wildlife; 0.001 ng/L TPCBs, the New York State water quality standard for the protection of the health of human consumers of fish; 0.014 µg/L [14 ng/L] TPCBs, the criteria continuous concentration (CCC) Federal Water Quality Criterion (FWQC) for freshwater; and 0.03 µg/L [30 ng/L] TPCBs, the CCC FWQC for saltwater7. Reduce the inventory (mass) of PCBs in sediments that are or may be bioavailable; PCBs in sediments may become bioavailable by various mechanisms (e.g., groundwater advection, pore water diffusion, scour, benthic food chains, etc.). Reducing the inventory of PCBs in sediments that are susceptible to such mechanisms will ultimately reduce PCB levels in fish and the associated risks to human health and the environment.
• Minimize the long-term downstream transport of PCBs in the river;PCBs that are transported downstream in the water column are available to biota,contributing to the risks from the Site. Downstream transport also moves PCBs from highlycontaminated areas to lesser contaminated or clean areas, and from the Upper HudsonRiver to the Lower Hudson River.
Additional information about the remedial goals can be found in the 2002 ROD. In the ROD, EPA adopted the preliminary remediation goals identified above as the remediation goals for the Site.
Selected Remedy: The remedy selected in the 2002 ROD called for dredging to remove PCB-contaminated in-place sediments of the Upper Hudson River, and MNA of PCB contamination remaining in the river after dredging. The selected remedy assumes separate source control action near the GE Hudson Falls plant and Fort Edward facilities, which are under NYSDEC jurisdiction. The major components of the selected remedy as stated in the 2002 ROD are:
• Removal of sediments based primarily on a mass per unit area (MPA) of 3 g/m 2 Tri+ PCBsor greater (approximately 1.56 million cubic yards of sediments) from River Section 1;
• Removal of sediments based primarily on an MPA of 10 g/m 2 Tri+ PCBs or greater(approximately 0.58 million cubic yards of sediments) from River Section 2;
• Removal of selected sediments with high concentrations of PCBs and high erosionalpotential (NYSDEC Hot Spots 36, 37, and the southern portion of 39) (approximately 0.51million cubic yards) from River Section 3;
• Dredging of the navigation channel, as necessary, to implement the remedy and to avoidhindering canal traffic during implementation. Approximately 341,000 cubic yards ofsediments will be removed from the navigation channel (included in volume estimates inthe first three components, above);
7 In the ROD, EPA waived three chemical-specific ARARs pertaining to water column concentrations, because of technical impracticability: the 1 ng/L TPCBs federal Ambient Water Quality Criterion; the 0.12 ng/L TPCBs New York State standard for protection of wildlife; and the 0.001 ng/L TPCBs New York State standard for protection of human consumers of fish.

21 Final Second Five-Year Review Report for the Hudson River PCBs Superfund Site April 2019
• Removal of all PCB-contaminated sediments within areas targeted for remediation, withan anticipated residual of approximately 1 mg/kg Tri+ PCBs (prior to backfilling);
• Performance standards for air quality and noise are included in this ROD consistent withstate and federal law;
• Other performance standards (including but not necessarily limited to resuspension ratesduring dredging, production rates during dredging, and residuals after dredging) will bedeveloped during the design with input from the public and in consultation with the stateand federal natural resource trustees. These performance standards will be enforceable andbased on objective environmental and scientific criteria. The standards will promoteaccountability and ensure that the cleanup meets the human health and environmentalprotection objectives of the ROD.
• Independent external peer review of the dredging resuspension, PCB residuals, andproduction rate performance standards and the attendant monitoring program, as well asthe report prepared at the end of the first phase of dredging that will evaluate the dredgingwith respect to these performance standards;
• Performance of the dredging in two phases whereby remedial dredging will occur at areduced rate during the first year of dredging. This will allow comparison of operationswith pre-established performance standards and evaluation of necessary adjustments todredging operations in the succeeding phase or to the standards. Beginning in phase 1 andcontinuing throughout the life of the project, EPA will conduct an extensive monitoringprogram. The data EPA gathers, as well as the Agency’s ongoing evaluation of the workwith respect to the performance standards, will be made available to the public in a timelymanner and will be used to evaluate the project to determine whether it is achieving itshuman health and environmental protection objectives;
• Backfill of dredged areas with approximately one foot of clean material to isolate residualPCB contamination and to expedite habitat recovery, where appropriate;
• Use of rail and/or barge for transportation of clean backfill materials within the UpperHudson River area;
• MNA of PCB contamination that remains in the river after dredging;
• Use of environmental dredging techniques to minimize and control resuspension ofsediments during dredging;
• Transport of dredged sediments via barge or pipeline to sediment processing/transferfacilities for dewatering and, as needed, stabilization;
• Rail and/or barge transport of dewatered, stabilized sediments to an appropriate licensedoff-site landfill(s) for disposal. If a beneficial use of some portion of the dredged materialis arranged, then an appropriate transportation method will be determined (rail, truck, orbarge);
• Monitoring of fish, water and sediment to determine when remediation goals are reached,and also monitoring the restoration of aquatic vegetation; and,

22 Final Second Five-Year Review Report for the Hudson River PCBs Superfund Site April 2019
• Implementation (or modification) of appropriate institutional controls such as fishconsumption advisories and fishing restrictions by the responsible authorities, untilrelevant remediation goals are met.
2.3 Status of Implementation
2.3.1 OU1:
Remnant Deposits The remedial action for the Remnant Deposits was implemented by GE pursuant to a 1990 consent decree with the United States. Maintenance of the OU1 remedy, including access restrictions, are ongoing in accordance with the 1990 consent decree.
Waterford Water Works Treatability Study The Waterford Works Treatability Study was completed following release of a NYSDEC study in 1990. There was no new work on the Waterford Water Works treatability study during the period covered by this FYR.
2.3.2 OU2: GE completed Phase 2 dredging of the Hudson River on October 3, 2015, and backfilling was completed on November 5, 2015 (see Appendix 9). Table 2-1 shows the volume of sediment removed each year and the dredging season during each year of Phase 1 and Phase 2. In total, GE reported that 2.75 million cubic yards of sediment were dredged from the river, processed, and shipped via train to approved landfills for disposal during Phase 1 and Phase 2. Demobilization of the sediment processing facility was largely completed in December 2016, although certain demobilization activities, including sampling associated with the filter presses and their removal, were not completed until April 2017. GE’s other land support facilities were demobilized early in 2016. The habitat reconstruction portion of the remedial action continued until August 8, 2016.
Table 2-1 Phase 2 Sediment Removal and Dredging Seasons
Year Dredge Season Duration
(Days) Volume Removed
(CY) TPCB Mass Removed
(kg) 2009 May 15-Oct 27 166 286,354 16,320 2011 Jun 6 – Nov 8 156 351,728 25,163 2012 May 9 – Nov 16 192 542,176 36,757 2013 Apr 29 – Nov 3 189 632,210 34,534 2014 May 7 – Nov 4 182 610,963 29,147 2015 May 7 – Oct 3 150 236,949 10,140 Total 1,035 2,641,926 155,760
GE submitted its Remedial Action Completion Report to EPA, the federal natural resource trustees and New York State in December 2016. EPA received the report on January 3, 2017. GE provided a revised report to all the parties on March 6, 2019, responding to comments provided by EPA. In its report, GE states that it completed the activities constituting “Remedial Action” as defined in

23 Final Second Five-Year Review Report for the Hudson River PCBs Superfund Site April 2019
the 2006 Consent Decree, on December 22, 2016. EPA must determine whether those activities have been completed before it may issue the Certification of Completion of the Remedial Action.8
2.4 Institutional Controls
2.4.1 OU1: The 1984 ROD did not identify institutional controls for the Remnant Deposits. As called for in the 2012 FYR, an institutional control should be implemented that would ensure future use of the remnant properties would be limited to uses and activities that would not compromise the integrity of the cap system or result in unacceptable risks of exposures to contaminants. EPA is working with New York State to determine the ownership of the properties in order to implement the appropriate institutional controls.
2.4.2 OU2: The 2002 ROD included institutional controls in the form of fish consumption advisories and fishing restrictions until the relevant remediation goals are met. These controls are designed to prevent or limit exposure to PCBs through consumption of contaminated fish.
In 1976, due to PCB contamination in the Hudson River, NYSDEC banned all fishing in the Upper Hudson and most commercial fishing in the Lower Hudson. In 1995, NYSDEC reopened the Upper Hudson River (from Baker’s Falls in the Village of Hudson Falls to the Federal Dam in Troy) to sport fishing on a catch-and-release basis only. This regulation applies to all tributaries in this section of the Hudson River up to the first barrier (dam or waterfall) that is impassable to fish.
The mid- and lower regions of the Hudson River (from the Federal Dam to the Battery in New York City) are not subject to the catch-and-release regulation. They are, however, subject to a sportfish consumption advisory that was issued in 1975 by NYSDOH. 9 This advisory is an institutional control that seeks to limit human exposure to PCBs through the consumption of fish and crab from the Hudson River.
• Women under 50 and children under 15 are encouraged not to consume any fish or crabcaught in Hudson River waters south of the Route 9 Bridge in South Glens Falls to theBattery in New York City.
• Women over 50 years old and men over the age of 15 are advised to not eat any fish fromthe Route 9 Bridge Dam in Glens Falls to the Troy Dam.
8 The term “Remedial Action” has a specific meaning in the 2006 Consent Decree. This term does not include Operation, Maintenance and Monitoring (OM&M). While the post-dredging monitored natural attenuation period is a key explicit part of the remedy, it is part of the OM&M rather than the “Remedial Action” under the Consent Decree. In the Consent Decree, the term “Remedial Action” refers to the dredging itself and the associated construction work by GE (principally, the construction and later decommissioning of the sediment processing facility, capping, backfilling, and habitat reconstruction). GE remains responsible for carrying out OM&M under the Consent Decree.
9 See New York State Department of Health - Hudson River Health Advice on Eating Fish You Catch for more information (https://www.health.ny.gov/publications/2794.pdf).

24 Final Second Five-Year Review Report for the Hudson River PCBs Superfund Site April 2019
The New York State Department of Health Hudson River Fish Advisory Outreach Project has been established to promote awareness of the fish advisories and regulations and to encourage people to adhere to them. Various outreach initiatives including placing signs at major fishing access sites to warn people of the dangers of consuming fish from the Hudson River have been implemented. Since 2012 more staff and funding resources have been available to the outreach project, which has allowed for a total of six funded partnerships with grantees and enabled more information about the demographics of the project area and the consumption of fish to be gathered. This has allowed for increased and focused outreach, including efforts designed to more effectively reach a broader and more diverse audience. These efforts include making written materials more accessible to non-English speaking and lower-literacy individuals, by enhancing existing materials, and designing new materials in ways that use colors and graphics to effectively communicate information. More of the materials are also now available in English, Spanish, simplified Chinese, traditional Chinese, Polish, and Russian. Institutional controls to limit contaminant consumption and NYSDOH’s outreach techniques that have been implemented since 2012 are covered in greater detail in Appendix 13. It is noted that the fish advisories rely on voluntary compliance and therefore are not completely effective in preventing human fish consumption.
Table 2-2 Summary of Implemented Institutional Controls Media,
Engineered Controls, and Areas That Do Not Support
UU/UE Based on Current
Conditions
Institutional Control Needed
Description of Institutional
Control Impacted Parcel(s)
Institutional Control
Objective
Title of Institutional
Control Instrument
Implemented and Date (or planned)
All fish species Yes Fishing Regulation (Catch and Release Only)
Upper Hudson (Baker’s Falls to Federal Dam at Troy)
Institutional control fish regulation and fish advisories have been implemented and are performing as described in the ROD.
1976 and modified in 1995
All fish species Yes Fish Advisory – SeeAppendix 13(discussion ofthe NYSDOHoutreachprogram)
Mid-Hudson and Lower Hudson (Federal Dam to Battery in New York City)
Institutional control fish regulation and fish advisories have been implemented and are performing as described in the ROD.
1975
2.5 Systems Operations/Operation and Maintenance Currently, the project is in transition from dredging under the remedial action into the OM&M program. The OM&M plan for caps and sediment monitoring is complete and the plans for water and fish monitoring are under development. In general, habitat monitoring transitioned from construction to OM&M the following year after each area was planted. EPA is currently considering whether any modifications are necessary to the OM&M programs identified in the
25 Final Second Five-Year Review Report for the Hudson River PCBs Superfund Site April 2019
Phase 2 OM&M Scope of Work, which is an attachment to the Consent Decree under which GE is implementing the OU2 remedy. The work plan for sediment sampling under OM&M was completed in October 2016 in part to get the sediment samples collected as soon as possible post- dredging since it takes long periods of time (5 years) between sample events to properly measure changes in concentration.
The OM&M sediment sampling program targeted 226 samples outside of dredge areas and 149 samples inside dredge areas, for a total of 375 samples. The sampling program is designed to be able to detect an approximate 5 percent annual change in TPCBs over a 10-year monitoring time period, with sampling in five-year increments. In addition, a subset of these sampling locations was separately analyzed for all PCB congeners (using method EPA 1668), and a subset of sampling locations were analyzed for grain size. Areas outside of dredge areas were sampled in fall 2016. Backfill areas inside the dredge areas were sampled in fall 2017.
In addition, habitat and cap OM&M activities have been ongoing with annual reports (the Monitoring, Maintenance, and Adaptive management plans) based on the yearly OM&M plans submitted by GE and reviewed and approved by EPA. These activities included non-destructive random sampling and analysis of habitat reconstruction areas, and annual and five-year bathymetry surveys of installed engineered caps.
Potential Site impacts from climate change have been considered and the performance of the remedy may be impacted by climate change effects in the region and near the Site due to increasing frequency of heavy precipitation events and/or increasing intensity of storms (winds, precipitation). The climate change effects may cause increased erosion of the caps and cleaner sediment covering more highly contaminated sediment. The OM&M plan addresses these potential impacts through the Sediment Monitoring Program and Cap Monitoring and Maintenance Program.
Under the Sediment Monitoring Program, a bathymetric survey of Select Areas (i.e., areas that exceeded the MPA removal criteria but were not targeted for removal because they were buried by cleaner sediments) will be performed in the first and ninth years following the completion of the Phase 2 dredging program. The surveys will show if there is erosion of the cleaner sediments and will be used to determine if further action is needed to isolate contaminated sediments.
The Cap Monitoring and Maintenance Program requires bathymetric surveys in the first, fifth, and tenth years following the placement of a cap, following which the caps will be surveyed every ten years in perpetuity for the Phase 2 caps, and for thirty years following placement of the Phase 1 caps. The program also requires a bathymetric survey and soil core collections as soon as practical following a storm event with a magnitude at or exceeding the design recurrence interval. If bathymetric surveys show areas of suspected cap loss, a visual investigation (underwater camera, diver, side-scan sonar, etc.) will be used to determine the degree of loss. Losses of more than three inches over 4,000 square feet, or 20 percent of the cap area, whichever is less, of a contiguously capped area, will require cap repairs. As discussed in Appendix 7, a 100-year flood event occurred in April 2011 and required a survey of Phase 1 caps installed in 2009. The results of that survey indicated very minimal cap disturbance.

26 Final Second Five-Year Review Report for the Hudson River PCBs Superfund Site April 2019
III. PROGRESS SINCE THE LAST REVIEW
This section includes the protectiveness determinations and statements from the 2012 five-year review as well as the recommendations from that review and the current status of those recommendations. Additional progress on the implementation of the remedial action since 2012 is outlined in detail in Appendix 9.
Table 3-1 Protectiveness Determinations/Statements from the 2012 FYR
OU# Protectiveness Determination Protectiveness Statement
1 Short Term Protective
The remedy at the formerly exposed Remnant Deposits at the Hudson River PCBs Superfund Site currently protects human health and the environment as the in-place containment and cap system prevents human exposure, and as perimeter fencing and signage continue to be maintained. However, in order for the remedy to be protective in the long-term, an institutional control needs be implemented to ensure that future use of the Remnant Deposits does not compromise the integrity of the cap system or result in unsafe exposures.
2 Will Be Protective
Based on data collected and reviewed to date, EPA expects that the remedy at OU2 will be protective of human health and the environment upon completion. In the interim, human exposure pathways that could result in unacceptable risks are being controlled.
Sitewide Will Be Protective
EPA anticipates that once the institutional control has been implemented at OU1 and the dredging and MNA remedy have been completed at OU2, the remedies at the Hudson River PCBs Superfund Site will be protective of human health and the environment. In the interim, exposure pathways that could result in unacceptable risks are being controlled.
Table 3-2 Status of Recommendations from the 2012 Five-Year Review
OU # Issue Recommendations Current Status
Current Implementation
Status Description Completion
Date 1 The 1984 ROD
does not contain any requirement for institutional controls.
An institutional control should be implemented which would ensure that future use of the OU1 does not compromise the integrity of the cap system or result in unsafe exposures.
Assessing property ownership status
EPA, New York State, and GE are researching ownership of the remnant sites so that an appropriate institutional control can be permanently established.
N/A
2 No Issues Identified Sitewide This Second Five-Year Review Report does not include a sitewide protectiveness statement.

27 Final Second Five-Year Review Report for the Hudson River PCBs Superfund Site April 2019
A number of follow-up actions that did not impact protectiveness were identified during the development of the 2012 five-year review, and have been addressed as noted:
• Action: NYSCC has requested that EPA consider performing additional sampling adjacentto CU1 to determine if additional sediment qualifies for dredging. EPA will have furtherdiscussions with NYSCC regarding this request;
o Implementation Status: Approximately 10,000 cubic yards were removed from thearea near CU1 during September and October of 2015. This area was backfilledwith approximately 12 inches of Type 2 backfill mixed with greater than 2 percenttotal organic carbon. Item complete.
• Action: EPA expects to evaluate surface sediment data collected from River Section 2 aspart of EPA’s evaluation of the 2012 dredging season. Surface sediment data collectedfrom River Section 3 will be evaluated as part of EPA’s evaluation of the 2013 dredgingseason. EPA will evaluate changes over time in surface sediment concentrations from RiverSections 2 and 3 once GE has collected the samples;
o Implementation Status: Surface sediment data collected from River Section 2 andRiver Section 3 in 2012 and 2013 was evaluated as part of this Second Five-YearReview (see Section 5 and Appendix 4). Item complete.
• Action: Determine if there are additional or more effective outreach techniques availableto communicate fish advisories and fishing restrictions to the public. EPA will work withcounterparts at New York State to assess what additional and/or more effective outreachtechniques are available;
o Implementation Status: EPA worked with its counterparts at New York State andhelped to establish a number of additional or more effective outreach techniques tocommunicate fish advisories and fishing restrictions to the public. The details ofthe outreach program are discussed in Section 6 and outlined in Appendix 13. EPAwill continue to work with the state on outreach regarding the advisories. Itemongoing.
• Action: As the dredging project moves south, there may be locations that will requireadditional dredging to allow passage of vessels in the channel or to access shallow dredgeareas. EPA will annually review proposed dredge prisms submitted as part of the annualdesign work plan.
o Implementation Status: Over the course of Phase 2, approximately 450,000 cubicyards of sediments were dredged from the navigation channel. Item complete.
28 Final Second Five-Year Review Report for the Hudson River PCBs Superfund Site April 2019
IV. FIVE-YEAR REVIEW PROCESS
4.1 Community Notification, Involvement, and Site Interviews EPA guidance allows for different levels of outreach and public engagement during the five-year review process, depending on the nature of the site and the level of community interest. Community involvement activities during a five-year review typically include notifying the community that the five-year review will be conducted and when it is completed. Because the Hudson River PCBs Site covers a large geographic area and has significant public interest, the EPA expanded its community involvement activities for this second five-year review to provide multiple opportunities for stakeholder involvement and public engagement.
The agency has engaged the community in various ways throughout the process by establishing an active and robust five-year review team, conducting public workshops at various locations along the Hudson River, corresponding with stakeholders face-to-face and via conference call, and providing updates at regularly scheduled Community Advisory Group (CAG) meetings. Additionally, EPA project staff at the Hudson River Office in Albany, N.Y., have been accessible and available throughout the five-year review process to answer questions from stakeholders and members of the public.
EPA also provided an opportunity for the public to comment on the findings of the review and held a series of public meetings in the project area during the public comment period to explain the findings of the report.
4.1.1 Five-Year Review Team This second five-year review was informed by a five-year review team that represented diverse perspectives. Upon initiation of the second five-year review, EPA identified potential members and alternates and established a team (19 primary members and 16 alternates) which included state agencies, federal agencies, CAG members, and EPA subject-matter experts. Between June 22, 2016, and February 23, 2017, 11 five-year review team meetings were held (see Appendix 12) to discuss various topics associated with the five-year review process.
During these meetings, members of the team, including EPA technical experts, consultants, and representatives of other agencies led technical discussions on a number of topics ranging from interpretation of EPA’s guidance documents on the performance of five-year reviews to detailed analyses of the data being considered. At each meeting, members of the team were given the opportunity to provide input on the technical presentations or provide additional information for the discussion. Meetings were held using multiple communication methods, with the majority of the meetings being held in person, while some were held as web presentations or conference calls. For all meetings, a teleconference line was available to allow those who were unable to attend an opportunity to participate.
Appendix 12 contains an active list of team members and alternates, meeting agendas, and meeting summaries.

29 Final Second Five-Year Review Report for the Hudson River PCBs Superfund Site April 2019
4.1.2 Community Notification On March 29, 2016, EPA issued a news release announcing that the agency had begun its second five-year review of the cleanup of the Hudson River PCBs Superfund Site. The news release was distributed to media outlets in the upper and lower Hudson River, elected officials in the project area, and the Hudson River PCBs Site email Listserv, which includes more than 500 subscribers.
In addition, EPA issued public notices of the five-year review in the Glens Falls Post Star and Albany Times Union on April 9 and April 13, 2016, respectively (see Appendix 12). The notice was also provided to the Site’s CAG and distributed via the Hudson River email Listserv. The announcement described the purpose of the five-year review, described how the public could be involved in the process, and provided the anticipated timeline and schedule for completion of the review. The notice also identified EPA’s points of contact for the five-year review and solicited comments and questions from the public related to the five-year review process or to the Site.
On June 1, 2017, EPA issued a news release to Upper and Lower Hudson River media outlets and elected officials announcing the release of the Proposed Second Five-Year Review Report and the initiation of the public comment period. The news release was also posted on the EPA site webpage, provided to the Site’s CAG and distributed via the Hudson River email Listserv. The comment period was originally set to end after 30 days on June 30, 2017. Shortly after the release, on June 8, 2017, EPA extended the public comment period to 90 days until September 1, 2017 in response to a request from several parties.
4.1.3 Public Involvement EPA has maintained a robust outreach and public involvement program to keep the public aware and informed of the Site’s progress throughout the design and implementation of the dredging project. EPA developed a Community Involvement Plan (CIP) in 2003, and subsequently updated the CIP in 2009, to facilitate two-way communication between EPA and the communities affected by and interested in the Hudson River PCBs Superfund Site and to encourage community involvement in Site activities. In developing the plan, EPA made an extensive effort to gather public input and drew upon many information sources, including numerous and detailed community interviews, meetings, and Site files. Prior to the commencement of the second five-year review, the CIP was reviewed by the EPA project team to help determine the appropriate level of community involvement during the review.
In 2004, EPA coordinated the development of a CAG to further ensure routine and consistent communication between EPA and the communities and stakeholder groups along the entire Site. CAGs are autonomous entities that rely on EPA for organizational and informational support. Key stakeholders are represented on the active CAG which sets meeting agendas and meets in person 4-5 times per year. The meetings are open to the public and publicized on a CAG website(www.hudsoncag.ene.com), via the Hudson River Listserv email distribution list, and an emaildistribution list circulated by the CAG facilitators (Consensus Building Institute). The EPAprovided updates on the progress of the five-year review during the regularly scheduled meetingsof the CAG held on March 31, July 21, October 27 and December 8, 2016 and presented to theCAG on the findings of the Proposed Second Five-Year Review Report on July 20, 2017.
While the second five-year review was underway, written correspondence was received from various stakeholders and interested parties, including NYSDEC, NOAA, the New York State
30 Final Second Five-Year Review Report for the Hudson River PCBs Superfund Site April 2019
Office of the Attorney General, Senator Kristen Gillibrand, and Congressional representatives Nita Lowey, Sean Patrick Maloney, Yvette Clarke, Joseph Crowley, Elliot Engel, Steve Israel, Hakeem Jeffries, Carolyn Maloney, Grace Meng, Jerold Nadler, Kathleen Rice, Jose Serrano, Louise Slaughter, Nydia Velazquez, Chris Gibson, and Paul Tonko. Scenic Hudson, Inc., Hudson River Sloop Clearwater, Inc., Riverkeeper, Inc., Natural Resources Defense Council, Sierra Club, and Environmental Advocates of New York also sent correspondence to EPA regarding the review. All input received was considered during the development of the Second Five-Year Review Report. Copies of the letters received while the review was underway are included in Appendix 12.
The formal public comment period on the Proposed Second Five-Year Review Report ran from June 1 to September 1, 2017. EPA reviewed and considered all written comments received by mail or email during the public comment period, as well as written comments received at the public information meetings during the public comment period. The comments were compiled and developed into a set of Master Comments. Responses to Master Comments are presented in a separate document entitled “Final Five-Year Review Comment Response for the Hudson River PCBs Superfund Site.” That document further explains the public outreach and engagement process.
4.1.4 Public Workshops As part of the EPA’s commitment to conduct the five-year review in a transparent manner, the public was invited to three workshops held in 2016 during the five-year review to discuss the five-year review process and timeline, to hear updates, and to provide comments and ask questions (see Table 4-1). The facilitated workshops took place at varying times and locations throughout the project area to help ensure participation by residents and stakeholders in the upper, mid- and lower river communities.
Table 4-1 Public/CAG engagement throughout Second Five-Year Review Process
Date Meeting Type Location March 31, 2016 CAG meeting Saratoga Springs, NY May 5, 2016 CAG / public workshop Saratoga Springs, NY July 21, 2016 CAG meeting Schuylerville, NY Oct 13, 2016 Public workshop Hyde Park, NY Oct 27, 2016 CAG meeting Saratoga Springs, NY November 30, 2016 Public workshop Albany, NY December 8, 2016 CAG meeting Schuylerville, NY May 11, 2017 CAG meeting Schuylerville, NY June 28, 2017 Public meeting Poughkeepsie, NY July 19, 2017 Public meeting Saratoga Springs, NY July 20, 2017 CAG meeting Schuylerville, NY August 9, 2017 Public meeting New York City, NY
During the public comment period on the Proposed Second Five-Year Review Report, EPA hosted three additional public information meetings in communities in the Upper Hudson River, Lower Hudson River, and New York City. EPA discussed the purpose, scope and findings of the five-year review and answered questions from the public.

31 Final Second Five-Year Review Report for the Hudson River PCBs Superfund Site April 2019
Information about the meetings was posted on the EPA’s Hudson River PCBs Superfund Site webpage, distributed via email to elected officials in the project area, and sent via Listerv. News advisories were distributed to local media outlets in advance of the meetings (see Appendix 12).
It should be noted that during the remediation EPA maintained a public website providing access to project data and locations of work activities. General information and project documents are available at www.epa.gov/hudson.
4.1.5 Availability of the Second Five-Year Review Report, Public Comment Period & Public Meetings
This five-year review report is available on the EPA’s Hudson River website at www.epa.gov/hudson and will be provided to the local repositories established for the Site: Edgewater Public Library, 49 Hudson Avenue, Edgewater, NJ 07020; Adriance Memorial Library, 93 Market Street, Poughkeepsie, NY 12601; NY State Library, Cultural Education Center, Empire State Plaza, Albany, NY 12230; Crandall Public Library, 251 Glen Street, Glens Falls, NY 12801; Saratoga County EMC, 50 W. High Street, Ballston Spa, NY 12020; EPA Hudson River Field Office, 187 Wolf Road, Suite 303, Albany, NY 12205; and at the EPA Region 2 Superfund Records Center, 290 Broadway – 18th Floor, New York, NY 10007.
As noted previously, the EPA provided a 90-day public comment period on the Proposed Second Five-Year Review Report, which ran from June 1 to September 1, 2017. EPA is providing responses to comments received during the public comment period with this Final Second Five-Year Review Report.
A news release regarding the availability of the final version of this Second Five-Year Review Report will be distributed to media outlets in the upper and lower Hudson River, elected officials in the project area, the email Listserv and the Hudson River CAG upon signature of this report.
4.2 Data Review Data reviewed for this five-year review included water, fish, and sediment data, as well as any other applicable data collected as part of the remedial action. These data have been collected throughout the various phases of the project, including pre-design information, the baseline monitoring program, remedial design data collection, the remedial action monitoring program, and monitoring under the operation, maintenance and monitoring program. A list of the documents utilized in the development of this five-year review is included in Appendix 14.
Data utilized for the second five-year review and discussed in detail in Section 5 (Technical Analysis) are discussed in the following appendices:
• Water – Appendix 1
• Fish – Appendix 3
• Sediment – Appendix 2 (Mass) and Appendix 4 (Surface Sediment)
• Air – Appendix 6

32 Final Second Five-Year Review Report for the Hudson River PCBs Superfund Site April 2019
Section 6 describes issues identified during the data review and technical analysis that could potentially affect the protectiveness of the remedy.
4.3 Site Inspections Site inspections were conducted for OU1 on March 2, 2017, and for OU2 on November 10, 2016 (with a follow up inspection on November 30, 2016). The inspections were conducted by EPA and included representatives from GE, NYSDEC and NYSCC.
During the OU1 inspection, some vandalism of the fencing was noted around the Remnant Deposits. The damage has since been repaired by GE.
The inspection of OU2 involved visits to all the land-based facilities along the river that were used during the remedial action, including the sediment processing facility in Fort Edward. No issues were noted during the OU2 inspection.
Inspection forms for OU1 and OU2 are included in Appendix 10.
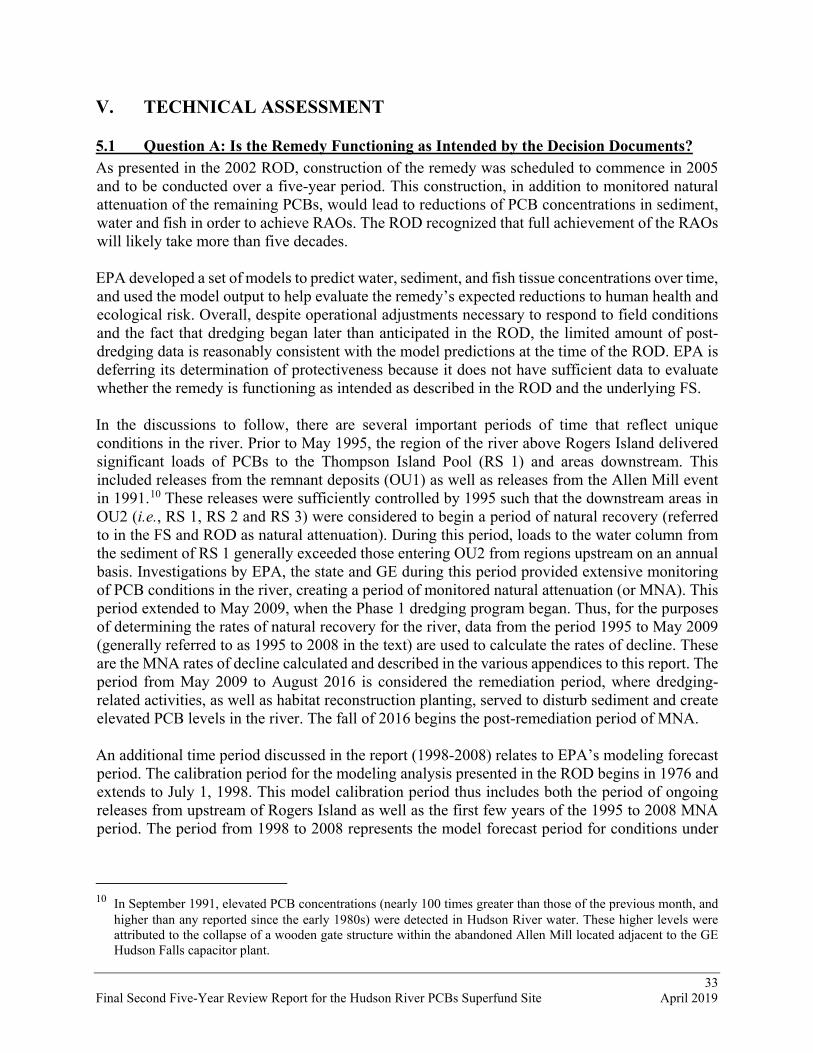
33 Final Second Five-Year Review Report for the Hudson River PCBs Superfund Site April 2019
V. TECHNICAL ASSESSMENT
5.1 Question A: Is the Remedy Functioning as Intended by the Decision Documents? As presented in the 2002 ROD, construction of the remedy was scheduled to commence in 2005 and to be conducted over a five-year period. This construction, in addition to monitored natural attenuation of the remaining PCBs, would lead to reductions of PCB concentrations in sediment, water and fish in order to achieve RAOs. The ROD recognized that full achievement of the RAOs will likely take more than five decades.
EPA developed a set of models to predict water, sediment, and fish tissue concentrations over time, and used the model output to help evaluate the remedy’s expected reductions to human health and ecological risk. Overall, despite operational adjustments necessary to respond to field conditions and the fact that dredging began later than anticipated in the ROD, the limited amount of post-dredging data is reasonably consistent with the model predictions at the time of the ROD. EPA is deferring its determination of protectiveness because it does not have sufficient data to evaluate whether the remedy is functioning as intended as described in the ROD and the underlying FS.
In the discussions to follow, there are several important periods of time that reflect unique conditions in the river. Prior to May 1995, the region of the river above Rogers Island delivered significant loads of PCBs to the Thompson Island Pool (RS 1) and areas downstream. This included releases from the remnant deposits (OU1) as well as releases from the Allen Mill event in 1991.10 These releases were sufficiently controlled by 1995 such that the downstream areas in OU2 (i.e., RS 1, RS 2 and RS 3) were considered to begin a period of natural recovery (referred to in the FS and ROD as natural attenuation). During this period, loads to the water column from the sediment of RS 1 generally exceeded those entering OU2 from regions upstream on an annual basis. Investigations by EPA, the state and GE during this period provided extensive monitoring of PCB conditions in the river, creating a period of monitored natural attenuation (or MNA). This period extended to May 2009, when the Phase 1 dredging program began. Thus, for the purposes of determining the rates of natural recovery for the river, data from the period 1995 to May 2009 (generally referred to as 1995 to 2008 in the text) are used to calculate the rates of decline. These are the MNA rates of decline calculated and described in the various appendices to this report. The period from May 2009 to August 2016 is considered the remediation period, where dredging-related activities, as well as habitat reconstruction planting, served to disturb sediment and create elevated PCB levels in the river. The fall of 2016 begins the post-remediation period of MNA.
An additional time period discussed in the report (1998-2008) relates to EPA’s modeling forecast period. The calibration period for the modeling analysis presented in the ROD begins in 1976 and extends to July 1, 1998. This model calibration period thus includes both the period of ongoing releases from upstream of Rogers Island as well as the first few years of the 1995 to 2008 MNA period. The period from 1998 to 2008 represents the model forecast period for conditions under
10 In September 1991, elevated PCB concentrations (nearly 100 times greater than those of the previous month, and higher than any reported since the early 1980s) were detected in Hudson River water. These higher levels were attributed to the collapse of a wooden gate structure within the abandoned Allen Mill located adjacent to the GE Hudson Falls capacitor plant.

34 Final Second Five-Year Review Report for the Hudson River PCBs Superfund Site April 2019
MNA, and this report examines the model output for this period against actual river conditions under MNA.
A last set of time periods discussed in this report relates to tissue data. The trend analyses presented in this report exclusively examine fish data collected in 1993 and later. Fish tissue data obtained by NYSDEC are available for the period from 1976 to 2011, and therefore fish data from NYSDEC are used for 1993 to 2011. Fish tissue data from GE are available from 2004 to 2016. However, from 2007 to 2013 the GE fillet samples were processed while excluding the ribs of the fillet (i.e., “rib-out” fillets), which is not consistent with New York State protocols. For this period, time trend analyses of PCB levels in fish fillets on a wet weight basis do not include these data, although the data are displayed in the various graphs of the report. The “rib-out” issue does not apply to whole body trend analysis (typically performed on fish collected in the fall) and does not significantly affect lipid-normalized fillet trend analyses.
Dredging was completed in 2015. Due to the extensive disturbance of the river bottom as a result of dredging, the post-dredging data collected in 2016 was still influenced by dredging-related impacts. Further monitoring will be required to verify remedy effectiveness, but the analyses presented in this report demonstrate that the models used to support decision making were well-designed, RAOs were appropriately developed, and remedy implementation is proceeding as planned. The project is currently transitioning from remedial action to the OM&M phase.
The following summarizes the status of the OU1 and OU2 remedies:
• The caps on the Remnant Deposits are intact and functioning as intended to preventpotential contact with and volatilization of the PCB waste.
• NYSDEC and NYSDOH have maintained the fishing restrictions and advisories withmodifications, as appropriate, and those departments continue to conduct public outreachto minimize human consumption of fish.
• The dredging portion of the remedy was fully implemented and within expectationsdescribed in the ROD. MNA continues.
o The dredging was implemented in compliance with the EPS and QoLPS developedfor the project and revised for Phase 2 based on lessons learned following peerreview of the Phase 1 dredging. The area capped in Phase 2 was 7.7 percent, which is less than the allowable
project residual capping standard of 11 percent. The area capped for PCBinventory was 0.5 percent, which is less than the allowable project standardof 3 percent. The estimated PCB mass capped is small relative to the massremoved by dredging.
Net load associated with dredging was 0.7 percent (i.e., less than theallowable Resuspension Standard of 1 percent at Waterford) of the Tri+PCB mass removed.
o Total sediment volume and TPCB and Tri+ PCB mass removed were greater thanplanned in the remedial design, due to underestimates of the depth of contamination(primarily caused by wood debris that interfered with sediment sampling) during
35 Final Second Five-Year Review Report for the Hudson River PCBs Superfund Site April 2019
the original remedial design. It is recognized that PCB mass in non-dredged areas is likely greater than originally estimated, based on the 2002-2005 SSAP data. However, more recent surface sediment data obtained by GE suggest lower surface concentrations than anticipated by the SSAP data, and by inference, less mass than estimated from the SSAP data.
o The overall reduction in surface sediment Tri+ PCB concentrations in the threeriver sections as a result of dredging was 87 percent, 36 percent, and 5 percent inRiver Sections 1, 2, and 3, respectively, based on the areas dredged and the SSAPdata. Based on the SSAP data alone, the reduction associated with dredging in RiverSection 2 was less than expected. However, the 2016 data obtained by GE suggestthat all three river sections have average surface sediment concentrations (0-2inches) close to those anticipated by the ROD for the period immediately afterdredging, indicating that a greater reduction in surface sediment contamination hasoccurred beyond the reduction calculated using the SSAP data alone. While thesedata are encouraging, in general there may be a lag in recovery in RS 2 due to thelower-than-anticipated surface sediment reductions.
o It is estimated that 76 percent of the overall PCB mass from the Upper HudsonRiver was removed by the dredging, which exceeds the 65 percent reductionassumed in the ROD.
o Habitat reconstruction and replacement were conducted as anticipated to mitigateimpacts from the dredging operations. OM&M of reconstructed habitats willcontinue until project metrics are met.
• MNA is occurring at rates of decline that are generally in agreement with the modelingdone for the ROD
o For the pre-dredging MNA period (1995-2008), water column Tri+ PCBconcentrations declined at rates ranging from approximately 5 to 13 percent peryear at the four Upper Hudson monitoring stations, and HUDTOX modelsimulations for this period were generally faithful to both seasonal and long-termtrends.
o Wet weight and lipid-normalized fish tissue concentrations declined during the pre-dredging MNA period (1995-2008). Wet weight and lipid-normalized rates ofdecline in the Upper Hudson were approximately 12 to 20 percent per year andapproximately 8 percent per year, respectively. The rates of decline in lipid-normalized tissue concentration were consistent with rates estimated from theFISHRAND model output. Lower rates of decline were observed at locationsfarther downstream in the Lower Hudson River.
o Available surface sediment data in conjunction with fish and water columnconcentrations indicate that surface sediment PCB concentrations are decreasingwith time. Although the exact rate of decline is difficult to determine becausesediment data sets were all collected for different purposes, the results using theavailable data indicate a decay rate similar to those predicted at the time of theROD.

36 Final Second Five-Year Review Report for the Hudson River PCBs Superfund Site April 2019
• Post-dredging data (2016) are encouraging, but additional monitoring is needed. Fish,sediment and water data are not sufficient to evaluate post-dredging trends and likelyreflect continued impacts from dredging operations. As noted in the ROD (e.g., pp 68-69),EPA’s expectation was that following dredging, the river system would require at least ayear or more to equilibrate to post-dredging conditions and exposures.
o For the post-dredging period, 2016 Tri+ PCB water column concentrations at UpperHudson monitoring stations were generally consistent with ROD expectations forthe first post-dredging year. Concentrations in 2016 were lower than during thedredging period and also lower than in 2008, the last year prior to dredging. Further,concentrations in summer of 2016 were about two to three times lower than duringthe corresponding months of the 2004-2008 baseline monitoring period.
o Based on comparison of the 2002-2005 SSAP dataset and the 2016 OM&Msediment sampling dataset, the percentage declines in average Tri+ PCBconcentrations in surface sediments as a result of dredging and MNA were 96, 88and 80 percent in RS 1, RS 2 and RS 3 (as opposed to 87, 36, and 5 percentreductions, respectively, based on the areas dredged and the SSAP data only).Current (2016) surface PCB concentrations are estimated to be 0.77, 1.34 and 0.83mg/kg Tri+ PCB in each river section, respectively. Each of these values is close toor below the ROD’s post-dredging residual target of 1 mg/kg Tri+ PCB for dredgedareas.11 These percent reductions suggest that the net positive effect of the dredgingand natural recovery continued in non-dredged areas through the dredging period,despite the resuspension releases of PCBs during dredging.
o 2016 fish data suggest that fish have begun to recover from dredging impacts andare generally back to pre-dredging levels. The average PCB concentration in UpperHudson River fish at the time of the 2002 ROD was approximately 3 mg/kg(species-weighted, wet weight); prior to the start of dredging in 2009 the species-weighted, wet weight average was 1.4 mg/kg; in 2016 the average was 1.3 mg/kg.It is recognized that as many as eight or more years of fish tissue data will benecessary to draw statistically valid conclusions about post-dredging trends in PCBlevels.
• Currently, the New York State advisories recommend that no fish from the Upper HudsonRiver be consumed. In the 2002 ROD, EPA determined that a PCB concentration in fishfillet of 0.4 mg/kg would be protective at a fish consumption rate of a single half-poundfish meal every two months. A PCB concentration of 0.2 mg/kg in fish fillet would beprotective at a consumption rate of a single half-pound meal every month. A concentrationof 0.05 mg/kg in fish fillet – the remedial goal for protection of human health based on fishconsumption – would be protective at a consumption rate of a single half-pound fish mealevery week. While the ROD did not anticipate meeting the 0.05 mg/kg level in fish filletfor decades, it did expect to reach the interim targets of 0.4 and 0.2 mg/kg in the UpperHudson River sooner.
11 See footnote 4 for further discussion of this target level.

37 Final Second Five-Year Review Report for the Hudson River PCBs Superfund Site April 2019
• Monitoring of water, fish, and sediment will continue under the OM&M program toconfirm that natural attenuation continues to occur, and to assess whether the remedy isfunctioning as intended.
• Limited data collection from the lower river indicates that recovery rates are slower thanin the Upper Hudson River and may not be strongly associated with PCB loading from theUpper Hudson River.
o The rate of decline of fish tissue PCB concentrations generally decreases withdistance downstream. As a result, there is a decrease in the correlation between fishPCB concentrations in the Upper Hudson River and Lower Hudson River withdistance downstream. This indicates that PCB sources in the Upper Hudson Riverhave less of an impact on Lower Hudson River fish than on fish in the UpperHudson.
o Water column concentrations at Albany/Troy were consistent with modelingpredictions during the MNA period and increased as a result of the dredging. Bycontrast, results at Poughkeepsie were generally higher than model predictions andwere not impacted by dredging, indicating that the strength of the relationshipbetween Upper and Lower Hudson River water column concentrations weakenswith distance downstream. It should be noted that there are other sources of PCBsin the Lower Hudson River, including legacy sediment contamination and possiblelocal sources. Although the local sources have been less significant than the GEsources of PCBs originating in the Upper Hudson, both these Lower Hudson Riversources and legacy sediment contamination should continue to be furtherinvestigated.
• Overall, the project has been implemented as anticipated in the ROD. The projectimplementation did include several operational differences from assumptions in the RODwith potential impacts on recovery rates in fish. Some of these differences included adelayed start to dredging, significantly increased mass removal, the use of a singleprocessing facility, and dredging in multiple river sections simultaneously.
• Remedial work at GE’s Fort Edward and Hudson Falls plants, overseen by NYSDEC, hasresulted in water column concentrations entering the project area at about the levelsanticipated in the ROD.
• EPA does not have sufficient data to evaluate whether the remedy is functioning asintended. As projected in the ROD, full achievement of human health and ecologicalremedial goals will likely take decades; however, interim targets are expected to be metsooner, indicating progress toward long-term goals.
Limited post-dredging data are available, and the fish collected during this brief period are likely to still be impacted from dredging-related activities. Also, limited higher flow events have occurred since the dredging was completed; such events tend to bring the system into equilibrium. Additional years of monitoring data are required for a robust statistical evaluation of post-dredging MNA trends. This five-year review assesses the current status of conditions in the river using approximately one year of post-dredging data for sediment, water column and fish tissue PCB concentrations, and provides preliminary indications of system response to implementation of the remedy.

38 Final Second Five-Year Review Report for the Hudson River PCBs Superfund Site April 2019
The following Appendices provide the technical analyses supporting the results presented in this Section:
• Appendix 1 provides a detailed evaluation of water column concentrations and load overthe Federal Dam at Troy.
• Appendix 2 presents analyses of the volume and mass of PCBs removed during dredgingactivities, the amount of dredge area capped, and estimates of the total mass of PCBsremoved from the Upper Hudson River.
• Appendix 3 discusses fish tissue concentrations and trends over time as they compare tomodel predictions.
• Appendix 4 presents an assessment of the surface sediment concentrations, trends overtime, and model predictions.
• Appendix 5 summarizes the translation schemes used to convert Aroclor-basedmeasurements to congener-based quantitation in sediment, water and fish.
• Appendix 7 presents analyses of the stability of cap material placed during Phase 1dredging activities and discusses current and future activities required to monitor capeffectiveness.
• Appendix 8 describes how operational considerations resulted in short-term and localizedimpacts on fish tissue and water column PCB concentrations.
• Appendix 11 presents a review of the exposure assumptions and toxicity data used for thehuman health and ecological risk assessments, and an assessment of the human health andecological remedial goals established in the ROD.
• Appendix 13 summarizes NYSDOH’s outreach efforts regarding the fish consumptionadvisories and fishing restrictions.
5.1.1 Remedial Action Performance
5.1.1.1 Remnant Deposit Cap System Functioning as Intended The Remnant Deposits remedy is functioning as intended by the 1984 ROD. In-place containment of the formerly exposed Remnant Deposits (sites 2, 3, 4, and 5) was completed in 1991. A cap system consisting of a soil cover, geosynthetic clay liner, and a topsoil and vegetative layer was placed over materials with PCB concentrations over 5 mg/kg, with a buffer extending at least five feet beyond the 5 mg/kg concentration boundary. This cap system prevents direct public contact with PCB-contaminated sediments and potential volatilization of the PCBs.
Approximately 46 rounds of semi-annual inspections have been conducted in accordance with the EPA-approved Post-Closure Maintenance Plan for the PCB Remnant Site Remediation Project. Follow-up activities from the semi-annual Remnant Deposit inspections have generally included maintenance of the vegetative cover, access roadways, diversion ditches, culverts and site security. EPA’s observations made after the 100-year flood event in 2011 indicated no bank scouring or significant damage to the rip-rap. Also, a site inspection following the significant rain event related to Hurricane Irene in late August 2011 (where 3.67 inches of rain fell in a 24-hour period) revealed

39 Final Second Five-Year Review Report for the Hudson River PCBs Superfund Site April 2019
the containment systems for Remnant Deposits 2-5 to be in stable and generally good condition. Additional actions have been taken to repair areas of settlement that may have been related to the decomposition of organic material beneath the cap system on Remnant Deposit 3.
As a result of the ongoing remedial work conducted at GE's Fort Edward and Hudson Falls plants, which is overseen by the NYSDEC, the water column concentrations detected at Rogers Island since 2004 have averaged approximately 2 ppt, which is the upstream source control target identified in the ROD. The low PCB level in the river immediately downstream of the Remnant Deposits suggests that the Remnant Deposits are not a significant source of PCBs to the river.
While the remedy is functioning as intended by the 1984 ROD, it should be noted that the 1984 ROD did not identify institutional controls. In order for the remedy to be protective in the long-term, an institutional control needs to be implemented to ensure that potential future use of the Remnant Deposits does not compromise the integrity of the cap system or result in unsafe exposures. EPA understands that there is interest in passive recreational use of the Remnant Deposits (i.e., Remnant Deposits 2 and 4) and is cooperating with local municipalities to explore potential park development.
5.1.1.2 Phase 1 and 2 Dredging Project Implemented and Functioning as Designed The remedy selected in the 2002 ROD called for a combination of upstream source control, dredging, and MNA to achieve the RAOs. During 2009 (Phase 1 dredging) and 2011-2015 (Phase 2 dredging), EPA provided field oversight of construction activities, reviewed associated annual designs and Remedial Action Work Plans (RAWPs) for each year of dredging, and reviewed project monitoring data to evaluate the project compliance with the EPS, QoLPS, and applicable or relevant and appropriate requirements (ARARs). In addition, the Phase 1 dredging activities were peer reviewed in 2010. This iterative, adaptive management approach is described and discussed throughout this five-year review report.
Phase 1 was implemented at the upstream end of the Site (RS 1) and included an extensive monitoring program as documented in Phase 1 Evaluation Reports submitted by both EPA (2010a) and GE (2010). Utilizing environmental dredging techniques, GE removed approximately 268,000 cubic yards of sediments from River Section 1 in 2009, targeting areas with an MPA of 3 g/m2 Tri+ PCBs or greater or surface concentrations exceeding 10 ppm Tri+ PCBs. The quantity of sediments removed during Phase 1 met or exceeded the design estimates. The mass of PCBs removed during Phase 1 was equivalent to the planned mass of 20,000 kg for all 18 originally planned Phase 1 CUs and represented an 80 percent increase over what was expected for the 10 CUs that were actually completed (11,000 kg). There were limited shutdowns due to the exceedances of the Resuspension Standard. Increased fish tissue PCB concentrations were observed within RS 1 and the immediately downstream reach of RS 2 (EPA 2010a, Appendix 1-C; EPA 2012). The 2009 data did not indicate measurable impacts to fish or water quality in the Lower River (EPA 2012).
Phase 2 dredging activities occurred from 2011 to 2015, inclusive (Phase 2, Years 1 through Year 5) and were summarized in Annual Progress Reports submitted by GE. In accordance with thePhase 2 Statement of Work (SOW) these reports provided quantitative information on dredgingactivities (area dredged, volume and mass of sediment removed, etc.). In addition, the Annual

40 Final Second Five-Year Review Report for the Hudson River PCBs Superfund Site April 2019
Progress Reports provided data to support evaluation of compliance with the EPS, QoLPS, and substantive Water Quality (WQ) Requirements. Changes to the EPS, which included improved residuals management as part of an updated Residuals Standard (EPA 2010b), proved successful in Phase 2. Throughout Phase 2, the project demonstrated compliance with the revised Residuals, Resuspension, and Productivity Standards. In addition, and as intended by the 2002 ROD, the QoLPS were implemented throughout Phase 2 and continued to be protective of the community’s quality of life.
Now that Phase 2 remedial construction activities are complete, and the system is in the MNA recovery period, important continuing components of OM&M are water column, fish tissue, and sediment sampling programs. These programs will quantitatively document system recovery by monitoring changes in PCB concentrations through time. The first OM&M sediment sampling event was conducted during the fall of 2016. It is anticipated that sediment sampling will be repeated approximately every 5 years and is expected to be conducted prior to the next five-year review. The OM&M sediment sampling program, specifically designed to monitor long-term changes in sediment PCB concentrations, will produce the most comprehensive sediment dataset to evaluate PCB concentration trends in Upper Hudson River sediments. As there are no RAOs or remediation goals specifically linked to sediment PCB concentrations, the OM&M sampling is intended to create a diagnostic dataset to better understand recovery from dredging-induced disturbances in the Upper Hudson River, but is not intended as a direct means to determine whether (nor where) further remediation of the Upper Hudson River may be warranted. Post-dredging water and fish sampling have continued under the Remedial Action Monitoring Plan while EPA - in close coordination with the involved federal and state agencies -determines the appropriate scope of work for these OM&M programs.
For this five-year review, the following criteria represent the primary metrics for evaluation of remedy function:
• Baseline trends and construction impacts:o Water column PCB concentrations prior to and during Phase 1 and Phase 2
dredging (refer to Section 5.1.1.3.3).o Fish tissue PCB concentrations prior to and during Phase 1 and Phase 2 dredging
(refer to Section 5.1.1.3.4).
• Sediment and PCB mass removal via Phase 1 and Phase 2 dredging (refer to Section5.1.1.3.2).
• Pre-dredging MNA period trends (refer to Section 5.1.1.3.5)
• Capping Effectiveness (refer to Section 5.1.1.4).
For this five-year review, one year of post-dredging monitoring data was considered. A complete evaluation of post-dredging natural attenuation trends is not feasible without additional years of monitoring data. Therefore, this five-year review focuses on an initial evaluation of the predictions that formed the basis of the 2002 ROD by comparing model results to data collected before, during and after remedy implementation.
41 Final Second Five-Year Review Report for the Hudson River PCBs Superfund Site April 2019
Appendix 8, Table A8-1 compares the principal components and underlying assumptions of dredging design from the FS that were reflected in the model forecasts used to compare remedial alternatives for the 2002 ROD. As described in detail in Appendix 8, during Phase 1 and Phase 2 dredging, unanticipated operational considerations were encountered that resulted in modifications to the dredging approach envisioned in the FS and the 2002 ROD. For example, in the FS and 2002 ROD, it was assumed that dredging would begin in 2004 or 2005 and would be accomplished following an upstream to downstream approach (to minimize potential impacts from resuspension, such as recontamination of dredged and backfilled or capped certification units). However, implementation of the dredging took place from 2009-2015 and presented several engineering challenges (e.g., dredging near dams, unanticipated high flows, and shallow water levels in certain years) which made it difficult to adhere to this approach without significant delays. Also, some operational adjustments were necessary to minimize quality of life impacts and to conduct the work safely. As a result, EPA authorized dredging in a general upstream to downstream fashion, while skipping over the areas that presented safety, quality of life, engineering or logistical challenges until they could be addressed appropriately (e.g., CU 60, located just north of the Thompson Island Dam (TID), a section of river known as the “Landlocked Area” between the TID and the Fort Miller dam, and CU95 and CU96 near the Lock 2 dam). As a consequence, dredging occurred in multiple river sections at the same time, particularly during the last 3 years of dredging (2013-2015). Working in multiple areas at the same time was determined by EPA to be an acceptable approach, because downstream deposition was minimal (see Downstream PCB Deposition Study [DDS; GE, 2011a]).
As documented in Figure A8-2 of Appendix 8, dredging was conducted in RS 1 in each year during which dredging occurred, and CUs 01, 51, 60, 63-66, and 95-96 were each dredged after work had already been completed in CUs located downstream of these locations. RS 2 was effectively dredged downstream to upstream as Reach 6 (CUs 67-78) was dredged in 2013 while Reach 7 (CUs 61-66) was dredged in 2014-2015 (See Figure A8-1) although the CUs within those reaches were still dredged upstream to downstream. The significance of this difference in dredging sequence is that ROD modeling forecasts assumed a sequential upstream to downstream resuspension pattern that did not occur because of how the remedy was implemented. The ROD forecasts assumed that dredging-related impacts would abate from upstream- to downstream- as dredging was completed and progressed downstream (i.e., given time to recover from the perturbation of implementation). Figure A8-4 of Appendix 8 illustrates this pattern of allowing upstream areas to begin to recover while dredging continued downstream. However, the actual dredging pattern and continued project vessel traffic throughout the Upper Hudson for the duration of the project (discussed below) prevented these upstream areas from beginning to recover until after dredging operations were completed. The modeling was not designed to predict the short-term impacts from dredging because it was understood from other projects that the fish could return to pre-impact levels quickly (within a season or two).
In addition, it was envisioned in the FS and the 2002 ROD that up to two facilities would process dredged material and that at least one facility would be located downstream of most dredging operations. During design and facility siting, EPA agreed with GE’s proposal that the project could be implemented efficiently with a single facility in Fort Edward (upstream of almost all of the dredging areas) and that a second downstream facility at the southern end of the project area was not required. While GE’s analyses demonstrated that dredging efficiency was not adversely

42 Final Second Five-Year Review Report for the Hudson River PCBs Superfund Site April 2019
impacted by this decision, the single, upstream facility location resulted in more barge, tug, and support vessel traffic over the length of the project area in the later years of dredging. As discussed in Appendix 8, when combined with simultaneous dredging in all three river sections in 2013-2015, this additional traffic presented the potential for increased localized sediment resuspension releases that contributed to short-term, transient impacts on fish tissue levels as compared to FS/model assumptions.
Dredging in multiple river sections while transporting dredge materials to the upstream facility resulted in significant simultaneous activity occurring throughout the project area during dredging. These activities included more than 92,000 barge miles logged; over 4,800 barges unloaded; and more than 35,497 total lockages (sediment barges and support vessels combined passing through the New York State Canal Corporation locks). Of these 35,000+ lockages, approximately 86 percent were support vessels (not dredged sediment barges, See Tables A8-4 and A8-6). The sum of these project activities resulted in anticipated localized increases in PCB exposure levels in water that were reflected in fish tissue PCB levels during implementation. PCB levels in the water column and fish were closely monitored throughout the implementation of the project and engineering adjustments to reduce impacts were made as necessary.
It is not unexpected for a large complex project such as this to encounter challenges in implementation that may not have been anticipated by the modeling and design assumptions outlined in the ROD, and for the project team to respond with necessary operational adjustments to the original design assumptions. Examples of adjustments in addition to those already discussed include the anticipated timing of dredging in the ROD (i.e., 2005 – 2010) as compared to the actual dates of dredging (i.e., 2009 – 2015), and the anticipated number of years for implementation (5 or 6 in design versus 7 as implemented). Appendix 8 provides a detailed evaluation of differences between the remedy and operating assumptions as anticipated in the FS and 2002 ROD and as implemented between 2009 and 2015.
Finally, the assumed versus observed rates of resuspension represent another notable difference between the ROD model forecast assumptions and actual implementation. While the project was in compliance with the EPS developed for the project, the actual resuspension was greater than originally anticipated in the modeling for the ROD (assumed to be 0.13 percent at the dredge-head). This resuspension is another factor contributing to short term impacts and a potential delay in post-dredging equilibrium.
Given the differences between ROD assumptions and implementation described above, quantitative comparisons of model results to observed data during and immediately after dredging are not directly comparable and therefore are not appropriate. Appendix 1 provides a discussion of pre-dredging trends in water column concentrations, and Appendix 3 provides the same for fish tissue data. Appendix 8 discusses short-term impacts caused by the dredging and the post-ROD operational adjustments.
5.1.1.2.1 Certification Unit-based Evaluation of Sediment and PCB Mass Removal EPA conducted an evaluation of sediment volume and PCB mass removed by the dredging project, as documented in Appendix 2, “Mass Reduction Evaluation.” The table and discussion below

43 Final Second Five-Year Review Report for the Hudson River PCBs Superfund Site April 2019
present the results of EPA’s evaluation of in-situ estimates of the volume and mass of PCB contaminated sediments removed from the Upper Hudson River.
Table 5-1 Volume and mass of PCB contaminated sediments removed
Category Source Tri+ PCB Mass (kg)
TPCB Mass (kg)
Total Area (acres) Volume (cy)
Dredge Removal Estimates
2002 ROD Resp. Summ. (Table 363334-
1 and 424851-1) 21,700 69,800 432 2,650,000
2007 Dredge Area Delineation (DAD) Report (Table 6-1)
N/A1 113,000 491 1,800,000
Actual Dredge
Removal
2010 Phase 1 EPA Evaluation Report and
Phase 2 Data 48,600 156,000 490 2,630,000
1 The 2007 DAD report did not report a Tri+ PCB mass.
2,360,000 cubic yards of sediment were removed from CUs in the Upper Hudson River during Phase 2, along with the removal of 136,000 kg of TPCB and 43,100 kg of Tri+ PCBs. Adding the volume of sediment and masses of TPCB and Tri+ PCBs removed during Phase 1 dredging (268,000 cubic yards, 20,000 kg and 5,460 kg, for volume dredged, TPCB mass removed and Tri+ PCBs mass removed, respectively) from the 2010 Phase 1 Evaluation Report (EPA, 2010a), the totals removed during both Phases 1 and 2 were 2,630,000 cubic yards of sediment, 156,000 kg of TPCB and 48,600 kg of Tri+ PCBs. On an annual basis, the highest total volume was dredged during 2012, and the lowest total volume was dredged during 2015 as the last remaining CUs were completed. These estimates agree well with values calculated by GE (GE, 2016); the estimated total volume removed (summed over all Phase 2 years) is within 5 percent of the amount calculated by GE, while estimates of TPCB and Tri+ PCB masses removed during Phase 2 are within 6 percent of amounts calculated by GE. GE reported that 2,750,000 cubic yards of sediment containing 140,000 kg of PCBs were removed. 450,000 cubic yards of the sediment removed came from within the NYSCC navigation channel. GE also dredged an additional estimated 27,000 cubic yards outside of targeted areas to provide access for dredging equipment.
Estimation of volume dredged and PCB mass removed relies not only on accurate measurements of volume and area dredged, but also requires extrapolating the concentration of TPCB and Tri+ PCB measured in cores (i.e., point estimates) to generate areal and volume estimates. Further, bulk density was not directly measured on residual cores collected during dredging activities, and assumptions were required regarding estimation of the bulk density of sediments dredged. Therefore, differences between values calculated by GE and EPA are likely related to small differences in calculation of area and volume dredged on a CU-by-CU basis, estimates of mass per unit volume (MPUV) and MPA using SSAP and residual core data on a CU-by-CU basis, and estimation of bulk density values for the residual cores where no bulk density was directly measured. EPA’s and GE’s values for volume of sediment and PCB mass removed should be considered as best estimates of the actual volume and mass removed given the available data, and the observation that both values agree well provides confidence that the methodology outlined in the 2010 EPS was applied consistently by both GE and EPA. Given the large quantities of material removed, it is not unexpected that EPA and GE’s estimates are slightly different.

44 Final Second Five-Year Review Report for the Hudson River PCBs Superfund Site April 2019
Dredged volumes in Phase 2 dredging years 2011 through 2014 met or exceeded the volume of sediment specified in the 2010 Productivity Standard. For the years 2011 to 2014, dredged volumes were approximately 100, 155, 181, and 175 percent, respectively, of the Productivity Standard goal (350,000 cubic yards). In 2015, 237,000 cubic yards of sediment were dredged, representing completion of the project.
To provide a context for the actual dredging volume and PCB mass removed, the volume of sediment and mass of PCBs dredged in Phases 1 and 2 were compared with the estimated volume of sediment and mass of PCBs to be removed as presented in the 2002 ROD and the 2007 DAD Report (GE 2007). The actual dredged volume was within 1 percent of the estimated 2,650,000 cubic yards presented in the 2002 ROD, and 47 percent more than the 1,800,000 cubic yards estimated in the 2007 DAD Report. Actual TPCB mass removed was 123 percent more than the 69,800 kg estimated in the 2002 ROD and 38 percent more than the 113,000 kg estimated in the 2007 DAD report. While the 2007 DAD Report did not estimate a specific amount of Tri+ PCBs to be removed, the actual amount of Tri+ PCBs removed was 123 percent more than the 21,700 kg estimated in the 2002 ROD. With regard to the total amount of PCBs removed from the Upper Hudson River, the 2002 ROD estimated that, overall, 65 percent of TPCBs would be removed as a result of dredging activities, with 80 percent expected to be removed from RS 1, 86 percent to be removed from RS 2, and 28 percent to be removed from RS 3. Following the completion of dredging, best estimates of the mass outside CUs combined with the mass removed via dredging indicate that, overall, approximately 76 percent of all TPCB mass was removed from the Upper Hudson River, with 94, 82 and 47 percent of TPCB mass removed from River Sections 1, 2 and 3, respectively. See Appendix 2 for the basis of these percentage removal estimates.
A comparison of 2002 ROD estimates of TPCB mass removed and mass outside CUs with the estimates of actual mass removed and mass outside CUs presented in Appendix 2 indicates that, as mentioned above, the actual mass removed (156,000 kg) was 123 percent more than 69,800 kg estimated in the 2002 ROD (i.e., the actual dredged mass was 2.2 times greater than the 2002 ROD estimate), while the best estimate of mass remaining outside dredged areas (41,000 kg) was 9 percent more than the 37,500 kg of TPCB mass outside dredged areas as estimated in the 2002 ROD. The observation of a larger increase in mass inside dredged areas compared to outside dredged areas relative to 2002 ROD estimates is consistent with the observation that the highest concentrations of PCBs were found primarily in fine-grained sediment and areas with high organic content (including wood debris) that were specifically targeted for removal during dredging. The areas outside the dredged areas generally were observed to be more coarse-grained in nature. Therefore, the observation of a larger increase in mass inside dredged areas compared to outside dredged areas is not unexpected and indicates that dredging activities successfully targeted areas with the largest inventory of PCBs. While our confidence in estimates of TPCB mass outside dredged areas is higher for River Sections 1 and 2 compared with River Section 3, there is no evidence to support the concept that because of the significant increase in mass within the CUs targeted for removal, there must be a correspondingly significant mass left outside of the CUs. In addition, the fact that dredging removed twice the anticipated mass is unrelated to the observation of higher-than-anticipated surface concentrations identified in the shallower core segments outside of targeted dredge areas based on the 2002 to 2005 SSAP data. The removal of twice the anticipated mass is related primarily to PCBs being found deeper than expected in debris areas that were dredged. While the SSAP data indicated higher than anticipated surface concentrations
45 Final Second Five-Year Review Report for the Hudson River PCBs Superfund Site April 2019
outside the CUs, the more recent data obtained in 2016 indicate that current surface concentrations are near or below the ROD’s post-dredging residual target of 1 mg/kg Tri+ PCB for dredged areas.12
The greater-than-expected dredged volumes and PCB mass removals likely contributed to differences in expected versus actual water column and fish tissue concentrations during dredging, as discussed in Appendices 1 and 3.
Although the annual Productivity Standard was exceeded in all but the final year of Phase 2, dredging activities complied with the 2010 EPS Residuals Standard throughout Phase 2. The number of capped nodes with residuals and inventory left in place was below compliance thresholds. Remedial activities functioned as intended relative to the Phase 2 EPS for dredging residuals and productivity.
5.1.1.2.2 Sediment Processing and Transport to Disposal Facility Phase 1 sediments were dredged from CUs 1-8 and 17-18 and conveyed by barge to the sediment processing facility in Fort Edward, NY. Overall, dredged sediments were transported by barge to the (upstream) Fort Edward sediment processing facility where they went through a multi-stage dewatering process before being loaded into railcars for off-site transport to a permitted disposal landfill. During both Phase 1 and Phase 2, dredged sediments were processed at a single, upstream facility rather than the two facilities (one upstream and one downstream) contemplated in the FS. A single upstream processing facility was both feasible and appropriate because approximately 75 percent of the volume of sediment and 80 percent of the area (acres) targeted for removal were located north (upstream) of CU78 within RS 2 (and also north of NYSCC Lock C5, located at the boundary of RS 2 and RS 3 at RM182.5). The entire Upper Hudson River project area is 40 miles long but RS 1 and RS 2 comprise only 13 miles (33 percent) of the total project length (and thus only 1/3 of the potential travel miles). As a result, although only one (upstream) facility was used, approximately 75-80 percent of the sediment barges bound for the upstream processing facility would only need to pass through 2 locks and travel less than 15 miles to the processing facility. In contrast, barges travelling to a southern or downstream processing facility would have needed to travel up to 28 miles and pass through 5 locks (including the Federal Lock and Dam at Troy, NY at RM 154) to get to that facility. Thus, a single, northern processing facility was both feasible and efficient as compared to the two facilities approach.
During Phase 1 (2009), 268,000 CY were dredged from 10 CUs. Dredged sediments containing approximately 5,460 kg (Tri+ PCB) were transported by 638 dredge barges and off-loaded at the processing facility. Approximately 35 percent of the processed sediments were shipped by the end of the 2009 Phase 1 dredging season. These processed sediments were sent to Waste Control Specialists, LLC (WCS) in Andrews, Texas. Remaining Phase 1 processed sediments were shipped to Clean Harbors Grassy Mountain, LLC in Grassy Mountain, Utah, US Ecology Idaho, Inc. in Grand View, Idaho, and Wayne Disposal, Inc. in Bellville, Michigan. The water produced through the dewatering process from both phases was treated and discharged into the Champlain Canal from 2009-2015 in accordance with the applicable Substantive WQ Requirements.
12 See footnote 4 for further discussion of this target level.

46 Final Second Five-Year Review Report for the Hudson River PCBs Superfund Site April 2019
Following the Phase 1 Peer Review during 2010, a total of 352,000 cubic yards of sediment was dredged and processed in 2011 (Phase 2 Year 1). This volume came from 12 CUs (CU09-CU16 and CU19-CU25) and exceeded the Phase 2 Productivity Standard. A total of 670 barges of dredged sediments was unloaded at the processing facility which represented a total of 9,070 kg Tri+ PCB mass removed. Processed sediments were shipped to US Ecology Idaho, Inc. in Grand View, Idaho and Wayne Disposal, Inc. in Bellville, Michigan, for disposal.
During 2012 (Phase 2 Year 2) CUs 26-48 and CU50 (24 CUs) yielded approximately 542,000 CY of dredged sediment containing 10,900 kg Tri+ PCB, exceeding the Productivity Standard. This effort involved 1,270 dredge barge offloads. Processed sediments were shipped to Environmental Quality, Inc. in Bellville, Michigan, Clean Harbors Landfill in Waynoka, Oklahoma, and Tunnel Hill Landfill in New Lexington, Ohio, for disposal.
In 2013 (Phase 2 Year 3) approximately 632,000 CY of sediment was dredged from CU49, CU51-CU59, CU67-CU79, CU83, 84 and 100 (26 CUs) containing 9,820 kg Tri+ PCB was off-loaded from 1,124 dredge barges. This volume exceeded the Productivity Standard. Processed sediments were shipped to Environmental Quality, Inc. in Bellville, Michigan, Clean Harbors Landfill in Waynoka, Oklahoma, and Tunnel Hill Landfill in New Lexington, Ohio, for disposal.
In 2014 (Phase 2 Year 4) the Productivity Standard was exceeded again with 611,000CY of sediment dredged from 20 CUs (CU51, CUs 61, 62, and 64, CU80-CU83, CU85-CU93, and CU97-99). This volume contained approximately 10,100 kg Tri+ PCB and required 869 dredge barge offloads. Processed sediments were shipped to Environmental Quality, Inc. in Bellville, Michigan, Clean Harbors Landfill in Waynoka, Oklahoma, and Tunnel Hill Landfill in New Lexington, Ohio, for disposal.
In the final year of dredging (2015) 236,949 CY of sediment containing approximately 3,780 kg Tri+ PCB was dredged from 10 CUs (CU01a, CU60, CU63-66, CU94-96, and CU99). This effort involved 327 dredge barge offloads and processed sediment was shipped off Site for disposal at Environmental Quality, Inc. in Bellville, Michigan, Clean Harbors Landfill in Waynoka, Oklahoma, and Tunnel Hill Landfill in New Lexington, Ohio.
Sediments were dredged, transported by barge, and processed (dewatered and stabilized) in accordance with approved work plans and general project requirements. In addition, also in accordance with the ROD, processed materials were shipped off Site by rail to licensed disposal facilities.
5.1.1.2.3 Habitat Reconstruction Habitat reconstruction was conducted in various phases throughout the dredging project. The work extended into 2016, the year following the end of dredging. Habitat reconstruction monitoring is on-going and will continue to be assessed and conducted under the OM&M phase of the project. Therefore, habitat reconstruction is not being evaluated as part of the EPA five-year review. However, this section summarizes the remedial activities associated with habitat construction.
As described in the 2002 ROD, project habitat reconstruction activities included backfilling of dredged areas to isolate residual PCB contamination and expedite habitat recovery, along with a
47 Final Second Five-Year Review Report for the Hudson River PCBs Superfund Site April 2019
monitoring program to facilitate implementation in an adaptive management context. Specifically, approximately 1.4 million CY of backfill and cap materials, including approximately 1 foot of clean backfill material, and approximately 13.5 miles of shoreline stabilization measures were placed as required to isolate residual PCB contamination and support re-establishment of shoreline (SHO), riverine fringing wetland (RFW), submerged aquatic vegetation (SAV), and unconsolidated river bottom (UCB) habitats. Details regarding specific backfill and cap installations or habitat reconstruction areas can be found in the CU Form 2 and Form 3 packages that were submitted by GE.
Placement of backfill/cap and shoreline stabilization measures was completed in November 2015. Backfill and cap materials were placed in accordance with project requirements, which included monitoring to ensure placement of the appropriate material to within specified thicknesses. Backfill and cap materials underwent extensive review and were approved by EPA, obtained from local sources, tested to ensure compliance with and placed in accordance with project requirements. Installation of planting materials (seed and plants) in support of habitat reconstruction was completed by August 2016. The plant species selected for use in seed mixes and planting plans were selected after an extensive review involving state and federal trustees and were based on pre-dredging habitat monitoring results (GE 2005, GE 2009a, GE 2009b). Project records indicate that approximately 1.5 million individual plants and approximately 1,700 pounds of seed mix were installed over approximately 29 acres of RFW, 39 acres of SAV, and SHO habitats. Specifications regarding backfill/cap placement and habitat planting material installation and associated project requirements were provided in the annual design drawings and technical specifications described in each year’s Final Design Reports (FDRs) and Remedial Action Work Plans (RAWPs). EPA provided field oversight of project dredging, backfill/cap placement, and habitat reconstruction as well as the sediment, water column, habitat, and fish/wildlife monitoring associated with these activities and also reviewed the CU Certification Forms 2 and 3. The “as built” conditions for dredging (CU Certification Form 2) and habitat reconstruction (CU Certification Form 3) are documented in the respective form packages.
Monitoring of backfill/cap placement and habitat installation began with pre-construction habitat characterization in 2003 and is on-going. Specifically, this monitoring commenced with habitat delineation and assessment (in the form of in-river wetland and other habitat identification and delineation), dredging (in the form of post-dredging bathymetry checks through EPA approval of the CU Certification Form 1 packages), backfill placement (in the form of post-placement bathymetry checks through EPA approval of the CU Certification Form 2 packages) and habitat installation (in the form of contract compliance inspections and final acceptance inspections through EPA approval of the CU Certification Form 3 packages). Habitat monitoring is on-going in accordance with the SOW and the Phase 1 and Phase 2 Adaptive Management Plans and, in accordance with the Attachment E to the SOW (OM&M Monitoring Scope) will continue.
Overall and in terms of protection of human health and the environment, the roles of shoreline stabilization measures and 1-foot of backfill are to prevent erosion, support habitat reconstruction (as a planting substrate), and allow natural riverine flows to redistribute sediment without significant erosion while acting as an isolating layer against residual PCB contamination. Shoreline, backfill/cap, and habitat reconstruction monitoring data indicate that these fills are remaining in place and are not significantly eroding. As such, the shoreline stabilization and

48 Final Second Five-Year Review Report for the Hudson River PCBs Superfund Site April 2019
backfill placement dimensions of the overall habitat reconstruction component of the remedy are functioning as designed.
5.1.1.3 PCB levels in Fish, Sediment and Water are Declining The length of time needed to achieve remedial goals and remedial action objectives was an important factor considered by EPA in comparing remedial alternatives in the 2002 ROD. EPA’s mechanistic HUDTOX model was used to predict sediment and water column concentrations in the Upper Hudson which, along with outputs of the Farley model of the Lower Hudson (Farley et al. 1999), served as exposure inputs to the FISHRAND model used to predict fish tissue concentrations. Although the models do not have the spatial resolution to predict highly-localized dredging impacts, predictions of resuspension and residuals served as inputs for the dredging period to simulate anticipated reductions in sediment concentrations, consistent with the expected removal footprint for the dredging scenarios. The models were calibrated to all available water column, sediment, and fish tissue PCB data for the period 1977-1998. The HUDTOX model computed an effective rate of decay in sediment concentrations of approximately 8 percent per year for the calibration period. Consistent with the close relationships among sediment, water, and fish tissue PCB concentrations, FISHRAND generated rates of decline of PCBs in fish tissue similar to rates observed in HUDTOX over the 1977-1998 time period, as discussed in Appendix 3. Following dredging, the models predicted continued declines in tissue concentrations, althoughthe upstream project boundary PCB load ultimately results in asymptotic non-zero PCBconcentrations in fish (see, e.g., 2002 ROD, p. 54).
The risk-based remediation goal presented in the ROD is 0.05 ppm (or mg/kg) PCBs (wet weight) in fillet, based on the reasonable maximum exposure adult fish consumption rate of one half-pound meal per week. In addition, EPA considered a target concentration of 0.2 ppm PCBs (wet weight) in fillet based on one half-pound meal per month, and a target concentration of 0.4 ppm based on the average (central tendency) consumption rate of one half-pound meal every 2 months. The target concentrations (which can be considered interim milestones) correspond to points at which the fish consumption advisories could be relaxed from the current “eat none” recommendation in the Upper Hudson River to allow a limited number of fish meals (i.e., ranging from 6 to 12) per year, as recovery of the river progresses to the ROD goal of 0.05 ppm. It should be noted that the fish consumption advisories are under the control of NYSDOH.
Modeling presented as species-weighted averages in Table 11-2 of the ROD projected that neither MNA nor the selected remedy would achieve the human health remediation goal of 0.05 ppm PCBs for RS 1, RS 2, or for the Upper Hudson River as a whole, within the modeling time frame (to 2067), but that it would be achieved in about 40 years in RS 3 (RM168-154). The model results, presented in Table 11-2 of the ROD, projected that for the Upper Hudson River as a whole, a target level of 0.4 mg/kg wet weight could be achieved in about 5 years after completing dredging and after about 16 years for the 0.2 mg/kg wet weight target level.13 This FYR is based on one year of
13 Note that although the original model forecasts estimated that the 0.4 mg/kg interim target level would be achieved in the Upper Hudson as a whole about 5 years after completion of dredging, the model forecasts were primarily intended as a basis to compare the relative impacts of various remedial scenarios, and not to predict the actual year of attainment of the interim targets. Additionally, although fish body burdens may achieve the interim target of 0.4 mg/kg after 5 years, it may require several more years of monitoring to confirm that this target has been met.

49 Final Second Five-Year Review Report for the Hudson River PCBs Superfund Site April 2019
post-dredging data available for fish tissues (although note for some species and locations, these data reflect concentrations within six months of completion of dredging). As discussed in Appendix 3, Figure A3-2 shows that in RS 1 (RM189), the 2016 post-dredging fish concentrations are lower than the concentrations observed during the dredging period. The median largemouth bass concentration of PCBs is close to the 0.4 mg/kg target level, and the yellow perch median is below this target level. Similarly, Figures A3-3 and A3-4 show that in RS 2 (RM184) and RS 3 (RM154-168), largemouth bass median tissue concentrations are close to 0.4 mg/kg and median yellow perch levels have achieved the 0.4 mg/kg target concentration.
The 2002 ROD also included RAOs targeting Upper Hudson River water column PCB concentrations. Water column RAOs relied on four federal and New York state drinking water, freshwater, and salt water ARARs:
• 500 ng/L TPCBs, the federal maximum contaminant level (MCL) for drinking water;
• 90 ng/L TPCBs, the New York State standard for protection of human health and drinkingwater sources;
• 14 ng/L TPCBs, the criteria continuous concentration (CCC) Federal Water QualityCriterion (FWQC) for freshwater; and
• 30 ng/L criteria continuous concentration (CCC) Federal Water Quality Criterion (FWQC)for saltwater.14
As discussed above and in Appendix 8, implementation of remedial activities did not precisely follow the plan presented in the ROD due to operational constraints and other considerations that arose after the ROD was issued. For example, the 2002 ROD assumed dredging activities would commence in 2005 and be completed by 2010. However, due to circumstances not anticipated at the time of the 2002 ROD, dredging did not begin until 2009. Dredging was completed in October 2015 with final backfilling and capping completed in November 2015. As a result, the timing of recovery and transition to post-dredging MNA differs from what was presented in the ROD. However, with some offset due to timing, EPA anticipates achieving these ARARs in the general timeframes anticipated in the ROD.
As discussed earlier, actual dredging activities deviated from the upstream-to-downstream pattern of dredging anticipated at the time of the ROD. For example, dredging occurred in RS 1, the most upstream river section, during the final year of the remedy. As a result of this and other operational modifications (described in Appendix 8), specific predictions of dredging-related impacts to water column, sediment, and fish tissue concentrations as presented in the ROD differed in some respects from what was observed. Appendix 8 also discusses short term impacts to fish tissue concentrations as a result of these modifications. As expected, these impacts were spatially and temporally transient.
14 In the 2002 ROD, EPA waived three ARARs that were also identified for the project (1 ng/L total PCB federal Ambient Water Quality Criterion, the 0.12 ng/L total PCB NYS standard for protection of wildlife, and the 0.001 ng/L total PCB NYS standard for protection of human consumers of fish) due to technical impracticability.
50 Final Second Five-Year Review Report for the Hudson River PCBs Superfund Site April 2019
Limited post-dredging data is available, and additional years of monitoring data are required for a robust statistical evaluation of post-dredging MNA trends. This five-year review assesses the status of the river using post-dredging data for sediment, water column and fish tissue PCB concentrations, and provides preliminary indications of system response to implementation of the remedy.
5.1.1.3.1 Sediment PCB Mass Inventory Reduced The selected remedy required the development of EPS with multiple interrelated objectives: to ensure that the clean-up would be protective of human and environmental health, specifically through reduction of Site risk via sediment removal (Residuals Standard) and control of downstream transport (Resuspension Standard), and also to satisfy criteria for the pace of dredging (Productivity Standard). An independent peer review panel assessed Phase 1 project performance relative to the Phase 1 EPS. Their recommendations were incorporated in the 2010 EPS for Phase 2 dredging (Bridges et al., 2010; EPA, 2010b), consisting of revised Residual, Resuspension and Productivity Standards.
An important component of the 2010 EPS was the accurate determination of the volume of sediment dredged and the mass of PCBs removed. The 2010 Productivity Standard specified minimum sediment volumes to be dredged during each year of Phase 2. The Resuspension Standard limited resuspension to a percentage of the PCB mass removed. The Residuals Standard contained directives that affected the sediment volume dredged from each CU: a limit on the number of dredging passes, characterization and management of potential contaminated sediment remaining after dredging, and how dredged areas were to be closed (i.e., covered with clean backfill material or an engineered cap) to limit post-dredge exposure and resuspension of residuals.
The Residuals Standard for Phase 2 incorporated “lessons learned” from the 2009 Phase 1 dredging (Bridges et al., 2010). In particular, the peer review concluded that the depth of PCB contamination in CUs dredged during Phase 1 was not accurately defined prior to dredging, resulting in both a greater number of dredging passes per CU, and ultimately, PCB mass left behind. During Phase 1, as many as five dredging passes were required to remove PCB-contaminated sediment within a single CU due to inadequate characterization of the depth of contamination (DoC) prior to dredging. The recognition that existing core data were inadequate to delineate the DoC was an important factor driving modifications incorporated into the Phase 2 Residuals Standard. GE conducted additional sediment coring in Phase 2 CUs prior to dredging to more accurately define DoC (GE, 2011b). Similarly, GE was required to dredge six inches below the DoC elevation and collect confirmatory sediment cores (hereinafter referred to as Residual Cores) after each dredging pass. Based on the PCB concentration in the Residual Cores, the Residuals Standard directed whether additional dredging passes would be required or whether the CU could be closed with clean backfill or an engineered cap. The maximum area allowed to be capped was also defined in the Residuals Standard using a nodal capping index. Additional details regarding the nodal capping index can be found in the 2010 EPS (EPA, 2010b).
The sediment and bathymetric data collected during implementation of the Phase 2 Residuals Standard provided a means to assess compliance with the 2010 EPS; these data also allow verification of estimates of dredging volume and PCB mass present in the CUs as estimated in the 2002 ROD (EPA, 2002), as well as values reported by GE during Phase 2 dredging activities.

51 Final Second Five-Year Review Report for the Hudson River PCBs Superfund Site April 2019
Finally, these data can also facilitate estimates of the PCB mass that remains within the CUs now that Phase 2 dredging has been completed, as described in Appendix 2.
Volumes of sediment and mass of PCBs removed were estimated from predesign and Residual Core data, as well as pre-and post-dredge bathymetry. The sediment volume removed in each year of Phase 2 was in compliance with the Productivity Standard. Total sediment volume and masses of TPCB and Tri+ PCBs removed in Phases 1 and 2 were found to be much greater than anticipated at the outset of the remedy, due to prior underestimates of DoC that were ameliorated by 2010-2012 coring to support Phase 2 remedial design. The estimated masses of PCBs removed were also used to assess compliance with the Resuspension Standard, which limited downstream transport to a percentage of dredged PCB mass. Areal estimates of capped and backfilled areas demonstrate compliance with limits set in the Residuals Standard, and the estimated PCB mass left in place in capped and sand-covered areas is small relative to the mass removed by dredging.
The analyses documented in Appendix 2 indicate that 2,360,000 cubic yards of sediment were removed from CUs in the Upper Hudson River during Phase 2, which facilitated the removal of 136,000 kg of TPCB and 43,100 kg of Tri+ PCBs. Using values of volume and mass of TPCB and Tri+ PCBs removed during Phase 1 dredging (268,000 cubic yards, 20,000 kg and 5,460 kg, for volume dredged, TPCB mass removed and Tri+ PCBs mass removed, respectively) from the 2010 Phase 1 Evaluation Report (EPA, 2010a), the totals removed during both Phases 1 and 2 were 2,630,000 cubic yards of sediment, 156,000 kg of TPCB and 48,600 kg of Tri+ PCBs.
The TPCB mass removed was 123 percent more than the amount estimated in the 2002 ROD (69,800 kg), and 38 percent more than estimated in the 2007 Phase 2 DAD report (113,000 kg). While the 2007 Phase 2 DAD Report did not estimate a specific amount of Tri+ PCBs to be removed, the actual amount of Tri+ PCBs removed was 123 percent more than originally estimated in the 2002 ROD (21,700 kg).
With regard to the total amount of PCBs removed from the Upper Hudson River, the 2002 ROD estimated that overall 65 percent of TPCBs would be removed as a result of dredging activities, with 80 percent removed from River Section 1, 86 percent removed from River Section 2, and 28 percent from River Section 3. Following the completion of dredging, estimates of the mass outside CUs combined with the mass removed via dredging indicate that overall, approximately 76 percent of all TPCBs were removed from the Upper Hudson River, with 94 percent, 82 percent and 47 percent of TPCBs removed from River Sections 1, 2 and 3, respectively. These values represent best estimates of the mass removed. EPA also calculated lower bound estimates of the mass removed which yielded similar but lower estimates of the percentage mass removed. The lower bound estimate for the entire Upper Hudson River was 70 percent, which exceeded the ROD’s estimate (additional details on calculations are documented in Appendix 2).
5.1.1.3.2 Surface Sediment PCB Concentrations Reduced As stated in the 2002 ROD, one of the RAOs is to reduce the cancer risks and non-cancer health hazards to people eating fish from the Hudson River by reducing the concentration of PCBs in fish. Fish tissue concentrations are linked to the mass of PCBs that may become bioavailable and are closely related to the concentration of PCBs in surface sediments throughout the Upper Hudson. In the selected remedy, this RAO is to be achieved through two important processes: 1)

52 Final Second Five-Year Review Report for the Hudson River PCBs Superfund Site April 2019
contaminated sediment removal by dredging and 2) post-dredging MNA. Both processes are required to achieve the goals of the ROD. In general, fish body burdens are expected to track the changes in PCB concentrations in the surface sediments (i.e., if PCB concentrations decrease in the surface sediment, then they should also decrease in the overlying water column, and with reductions in sediment and water concentrations the contaminant residues in fish are expected to decline as well).
Appendix 4 presents the available surface sediment PCB concentration data from the pre-dredging, dredging, and post-dredging periods and calculates the post-remediation mean surface sediment PCB concentration for each river section. The datasets considered for evaluation of PCB surface sediment trends consist of:
• NYSDEC 1976-1978 sediment survey
• GE 1991 sediment survey
• GE 1998 sediment survey
• GE 2002-2005 Sediment Sampling and Analysis Program (SSAP)
• GE 2011-2013 Downstream PCB Deposition Study
• GE 2016 OM&M surface sediment sampling program
A discussion of the different sampling methods and the laboratory analytical programs that produced these datasets is provided in Appendix 4. In brief, the sampling programs were not designed to specifically enable a temporal trend analysis of PCB surface sediment concentrations throughout the Upper Hudson, and so caution must be used in combining them for a trend evaluation. This type of limitation is not unusual for the investigation of a complex, contaminated sediment site where investigation priorities develop over decades of study. The ongoing study designed to assess long-term recovery is the OM&M program initiated by GE in November 2016, which collected approximately 226 surface sediment samples in non-dredged areas. GE collected additional samples from dredged areas in the fall 2017 field season to supplement the 2016 dataset. Receipt of these data from GE is expected in early 2019.
Given the limitations associated with comparability of the available datasets and pending future OM&M surface sediment sampling, robust statistical analyses were conducted which included comparisons that subdivided the data to account for known differences in sample collection over time and less complex statistical analyses that do not attempt to control for differences in sampling, analysis, and handling methods, aside from recognizing the important role of sediment sample texture. The results of the analyses indicate that:
1) Based on measured Tri+ PCB concentrations, there is evidence of natural recoveryoccurring in surface sediments in all three sections of the Upper Hudson River,
2) Best estimates of Tri+ recovery rates ranged from 5 to 7 percent annual reductions in bothcohesive and non-cohesive sediments, for all three river sections, for the period 1976-2016,

53 Final Second Five-Year Review Report for the Hudson River PCBs Superfund Site April 2019
3) Uncertainty bounds in each of these estimates were generally on the order of 3 to 10 percentper year, indicating that the 8 percent decay rate simulated by HUDTOX for the pre-dredging MNA period is within the margins of error of EPA’s empirical estimates,
4) Estimated mean concentrations in sediment generally fall within 95 percent confidencelimits of best-fitting trend lines, starting at mean 1976 levels, followed by river-section-specific decay rates on the order of 3 to 10 percent, in both cohesive and non-cohesivesediments, and
5) Tri+ PCB concentrations measured in surface sediments in 2016 appear to be at or belowlevels that would be predicted by the empirical recovery time trends as presented inAppendix 4.
The 2002 ROD anticipated that the remedy would reduce sediment PCB concentrations. The SSAP survey conducted in 2002 -2005 was used as a baseline in the first five-year review report (EPA, 2012) to re-estimate expected reductions in average Tri+ PCBs concentrations. Since that time, data from 2011-2013 and 2016 suggest that concentrations in non-dredged areas have declined, presumably due to recovery processes, and the availability of 2016 data make it possible to re-evaluate the net change in surface sediment concentrations as a result of remedy implementation and recovery processes.
Calculations in Appendix 4 are based on stratification of the Site by river section (i.e., RS 1, RS 2, and RS 3) and by sediment texture classification (cohesive or non-cohesive) within each river section. Generally, estimates of percentage change for RS 1 are the most robust because of denser sample coverage and more certainty in associating samples with cohesive and non-cohesive areas, whereas estimates in RS 2 and, to a greater degree, RS 3 are likely to be influenced by differences in spatial representation of the surveys. It should be noted that in RS 2 and RS 3, the focus of SSAP sampling was on depositional areas, with decreasing sampling effort in areas not expected to be depositional, potentially resulting in overstatement of the effects of natural recovery in non-dredge areas.
With these caveats, estimated percentage changes are reported as follows. In 2016, average Tri+ PCBs concentrations in cohesive surface sediments were 1.8 mg/kg, 1.3 mg/kg and 0.8 mg/kg in RS 1, RS 2 and RS 3, respectively. In comparison, these values were estimated to be 3.9 mg/kg, 7.3 mg/kg and 3.0 mg/kg, respectively, in 2002-2005 based on the SSAP data. In non-cohesive sediments in 2016, Tri+ PCBs were 1.7 mg/kg, 1.7 mg/kg and 0.9 mg/kg in RS 1, RS 2 and RS 3, respectively, in 2016. In 2002-2005, these averages were estimated to be 4.4 mg/kg, 9.6 mg/kg and 4.2 mg/kg. A summary table is provided below:

54 Final Second Five-Year Review Report for the Hudson River PCBs Superfund Site April 2019
River Section and Sediment Texture
2002-05 Avg. Tri+ PCB
Conc.
Predicted Reduction as
of 20121 2016 Avg. Tri+
PCB Conc.
Calculated Reduction based
on 2016 data2 RS 1 cohesive 3.9 mg/kg 87 percent 1.8 mg/kg 96 percent RS 1 non-cohesive 4.4 mg/kg 1.7 mg/kg RS 2 cohesive 7.3 mg/kg 36 percent 1.3 mg/kg 88 percent RS 2 non-cohesive 9.6 mg/kg 1.7 mg/kg RS 3 cohesive 3.0 mg/kg 5.1 percent 0.8 mg/kg 80 percent RS 3 non-cohesive 4.2 mg/kg 0.9 mg/kg Notes: 1 See EPA (2012) 2 See Appendix 4
Based on these comparisons of SSAP and OM&M survey data, the apparent percentage declines in average Tri+ PCBs concentrations in surface sediments were 96, 88 and 80 percent in RS 1, RS 2 and RS 3, respectively (Table A4-5) in Appendix 4. The updated rates suggest that natural recovery with minimal dredging impact has continued in non-dredged areas through the dredging period, despite demonstrable releases of PCBs during dredging (as discussed in Appendix 1). The effects of natural recovery were greatest in RS 2 and RS 3 where larger proportions of the Site were not dredged and the influence of non-dredged areas on overall averages was the greatest.
While PCB levels in surface sediment in the Upper Hudson have been reduced as a result of dredging, natural resource trustees have indicated to EPA that residual PCBs may continue to be a concern for trust resources. EPA supports efforts by the federal and state natural resource trustees to address ongoing potential injury through the natural resource damage (NRD) assessment and claims process. EPA will continue to communicate with federal and state natural resource trustees on the Hudson River. In addition, EPA understands that the NYSCC may assert a claim for damages resulting from the increased costs of navigational dredging due to PCB contamination. Should either the NRD process or a possible claim by NYSCC result in an undertaking to perform any additional remedial activities beyond that completed pursuant to the EPA ROD, EPA will coordinate fully with GE, the trustees and/or the NYSCC to ensure these efforts are considered in relation to the ongoing monitoring and recovery of the river.
5.1.1.3.3 Downstream Transport of PCBs via Water Column Controlled Processes Water column PCB concentration data (and associated PCB load estimates) collected after the publication of the ROD were compared to the expectations for implementation of the remedy expressed in the ROD documents. The data evaluations are documented in Appendix 1, “Evaluation of Water Column PCB Concentrations and Loadings.” The key findings of the evaluation are organized by comparing data collected subsequent to the ROD to expectations for the following:
• Pre-dredging time period (1998 to 2008)
• Phase 1 and Phase 2 implementation period (2009 to 2015)
• Post-dredging period
• Objectives for the Lower Hudson River

55 Final Second Five-Year Review Report for the Hudson River PCBs Superfund Site April 2019
Pre-dredging Water Column Data The 1998-2008 time period, prior to Phase 1 dredging, provides an opportunity to evaluate natural recovery rates in the Upper Hudson River relative to expectations. At the stations displayed on Figure A1-1 in Appendix 1 (Thompson Island Dam, Schuylerville, Stillwater, and Waterford), the data exhibit a characteristic seasonal trend, cycling between the lowest PCB concentrations during winter and the highest PCB concentrations during late spring and early summer months. Data at each of the four stations also show declining concentrations on a decadal time scale, confirming the long-term attenuation anticipated in the ROD under the MNA scenario. Rates of attenuation for 1995-2008 were estimated by fitting an exponential decline to the data at each station, producing the following estimated water column PCB attenuation rates:
• 9.7 +/- 1.9 percent per year at Thompson Island Dam.
• 13.1 +/- 2.0 percent per year at Schuylerville.
• 4.5 +/- 1.7 percent per year at Stillwater.
• 6.3 +/- 1.7 percent per year at Waterford.
In order to compare 1998-2008 MNA performance to ROD expectations, EPA extended its simulations through 2008 using EPA’s HUDTOX mechanistic PCB fate and transport model and observed (replacing hypothetical) Hudson River flows for the period as inputs to the model. Those simulations also include estimated tributary flows and solids loads for this period, using the same methods that were developed when HUDTOX was built and calibrated. Figure A1-3 in Appendix 1 compares simulated water-column concentrations at the four Upper Hudson River sampling locations to available data for 1998-2008. The model-data comparison shows the HUDTOX simulation of water column PCBs to be generally consistent with both seasonal and long-term trends in water-column PCBs for the full period, including the intensive data collection period of 2003-2008, representing the final 6 years of an 11-year simulation.
The following are the key conclusions for the pre-dredging MNA period:
• Water column data at four Upper Hudson River monitoring stations for the MNA period1998-2008 confirm the long-term attenuation of PCB concentrations anticipated in theROD for MNA periods.
• HUDTOX simulations for 1998-2008 are generally consistent with long-term and seasonaltrends in water column PCB concentrations, verifying its usefulness as a forecasting toolfor MNA periods.
Remedial Construction Period Water Column Data As stated in Section 5.1.1.1, dredging activities were in compliance with the 2010 EPS Resuspension Standard for all Phase 2 years.
The ROD anticipated localized temporary (short-term) increases in suspended PCB concentrations in the water column and possibly in fish PCB body burdens as a result of dredging activities (2002 ROD, p. 85):
56 Final Second Five-Year Review Report for the Hudson River PCBs Superfund Site April 2019
… the release of PCBs from the contaminated sediments into the surface water during construction (dredging and cap placement), will be controlled by operational practices (e.g., control of sediment removal rates, use of environmental dredges and use of sediment barriers). Although precautions to minimize resuspension will be taken, it is likely that there will be a localized temporary increase in suspended PCB concentrations in the water column and possibly in fish PCB body burdens. Analysis of yearly sediment resuspension rates, as well as resuspension quantities during yearly high flow events, shows the expected resuspension due to dredging to be well within the variability that normally occurs on a yearly basis. The performance standards and attendant monitoring program, that are developed, and peer reviewed during design, will ensure that dredging operations are performed in the most efficacious manner, consistent with the environmental and public health goals of the project.
As noted in this ROD excerpt, EPA’s expectations were predicated on an analysis of yearly resuspension rates during the dredging period. This analysis assumed a PCB mass to be dredged and a schedule of removal, as expected at the time of the ROD. In fact, the actual mass of PCBs removed was much greater than anticipated in the ROD, and there were deviations from the assumed upstream-to-downstream pattern of dredging. Ideally, dredging proceeds in an upstream-to-downstream sequence to avoid recontamination of dredged areas, whereas resuming dredging in an upstream location potentially promotes resuspension of PCBs in a river reach that would otherwise be recovering.
The resuspension analysis performed for the ROD also assumed that:
• PCBs detected in the water column would be associated primarily with resuspended solidsat the same PCB concentrations as the dredged material,
• Resuspended solids would comprise less than 0.3 percent of the solids dredged, and
• Only PCBs dredged in association with fine solids would be transported to far-fieldlocations (EPA, 2000).
The data points shown in orange in Figure A1-1 of Appendix 1 show water column Tri+ PCB concentrations during the dredging period 2009-2015. Figure A1-1 shows, contrary to ROD expectations, that the upper range of elevated PCBs during dredging at these four stations did exceed the variability that normally occurs on an annual basis (where normal annual variability is reflected in the blue pre-dredge data series). Notably, this was true not only for the Phase 1 and Phase 2 dredging periods, but also to a lesser degree for 2010, a pause year (for peer review) between the Phase 1 and Phase 2 dredging periods. (Figure A1-5 shows water column concentrations from 2008-2016 to highlight the dredging period, showing one year before and one year after dredging for comparison to non-dredging conditions.) The data suggest that Phase 1 dredging residuals remained susceptible to resuspension during 2010. Figure A1-5 in Appendix 1 also indicates that resuspended PCBs were mobile throughout the Site: in particular, monitoring at Waterford showed elevated PCBs throughout Phases 1 and 2, although dredging did not reach River Sections 2 and 3 until 2013, the third year of dredging.

57 Final Second Five-Year Review Report for the Hudson River PCBs Superfund Site April 2019
In Phase 1, a resuspension criterion of 117 kg/yr loading was exceeded at all three monitoring stations (EPA, 2012). For Phase 2, the Resuspension Standard was revised to 1 percent of mass removed, tracked as 7-day running averages of Tri+ PCBs attributable to dredging activities, as monitored at Waterford, consistent with the recommendation of the Peer Review Panel. After this revision of the Residuals Standard for Phase 2, the remedy was in compliance during all five years of Phase 2. Special studies conducted to further evaluate the impact of dredging on downstream transport of PCBs in the water column are summarized in the 2012 Five-Year Review Report (EPA, 2012). The key findings from evaluation of water column data collected during dredging are as follows:
• During the dredging period 2009-2015, the upper range of variability of water column PCBconcentrations exceeded the variability that normally occurs on an annual basis, contraryto ROD expectations. This may be attributable to an increase in the mass of PCBs dredged,relative to expectations, to the unanticipated resuspension of dissolved and non-aqueous-phase PCBs, and to unanticipated changes in the timing and upstream-to-downstreamsequence of dredging.
• During Phase 1 dredging in 2009, net loading limits specified in the Resuspension Standardwere exceeded. During Phase 2 dredging in 2011-2015, the Resuspension Standard wasmet due to improvements to the Residuals Standard and associated engineering andoperational changes.
Post-dredging Water Column Data Data points shown in green on Figures A1-1 and A1-5 indicate that 2016 water column Tri+ PCB concentrations were lower in 2016 than during the dredging period, and also lower than in 2008, the last year prior to dredging. An exception to the seasonal and temporal trends was a spike in 2016 concentrations at Waterford that was measured during elevated flows on February 25th and 26th, when redeposited sediments generated in the prior year may still have been available for resuspension.
Data collected in 2016 establish a post-dredging baseline against which ROD expectations for recovery can be compared. Table A1-10 in Appendix 1 presents HUDTOX modeling forecasts for water column Tri+ PCB concentrations the first year after dredging (envisioned in the ROD to occur in 2010) under the remedy. 2016 concentrations at Thompson Island Dam, Schuylerville, Stillwater, and Waterford were generally consistent with ROD expectations for the first post-dredging year: Table A1-10 shows that average and median values for 2016 at each station were generally consistent with ROD expectations. Notably, the measured mean values for Thompson Island and Waterford include the ROD-expected value within their 95 percent confidence intervals (mean + 2 x standard error). The mean concentration at Waterford exceeded the ROD mean expectation, but much of the difference was due to the elevated concentrations during the February event.
The reduced concentrations at Waterford after the late February 2016 event are also reflected in the loading estimate for 2016, shown in Table A1-11 in Appendix 1. The estimated load at Waterford for 2016 is 63 kg, with a Root Mean Squared Error of 10 kg. This is very similar to the predicted load in a simulation of the remedy performed for the FS, where HUDTOX predicted a Tri+ PCB load of 60 kg for the first year after dredging (then expected to be 2010). More than half
58 Final Second Five-Year Review Report for the Hudson River PCBs Superfund Site April 2019
of the estimated loading occurred during the first two months of 2016, when redeposited sediments from dredging may have been susceptible to resuspension during the late February event. Even considering the full year, the estimated 2016 Tri+ PCB load at Waterford of 63 kg was much less than the estimated 2004-2008 baseline loads at the same location, which ranged from 103 to 174 kg (see Table A1-8) in Appendix 1.
The 2002 ROD anticipated that post-dredging MNA would lead to water column Tri+ PCB concentrations of approximately 5 ng/L at Thompson Island Dam and Schuylerville in 2067, the end of the HUDTOX forecast period in the ROD. Table A1-12 in Appendix 1 presents the projected year for concentrations at the four Upper Hudson water column monitoring stations to decline to 5 ng/L, assuming attenuation rates of 1, 3, 6, and 14 percent per year. These recovery rates encompass the attenuation rates estimated for all four stations, using observed data for the 1995-2008 pre-dredging MNA period. Table A1-12 in Appendix 1 assumes the 2016 data-based averages shown in Table A1-10 as starting points for post-dredging MNA.
Table A1-12 in Appendix 1 shows that water column concentrations would fall to 5 ng/L sooner than 2067 (by 2036) at Thompson Island Dam and by 2067 at Schuylerville, even if one assumes a post-dredging MNA recovery rate as low as 1 percent per year. This recovery rate would be well below the rates estimated above for these stations, using the observed data for the 1995-2008 pre-dredge MNA period. With a recovery rate of 3 percent, lower than any of the 1995-2008 recovery rates estimated for the four Upper Hudson River stations, concentrations at Thompson Island Dam and Schuylerville would reach 5 ng/L decades before 2067.
Time to reach 5 ng/L can also be projected for Waterford, using 2016 averages and assuming a range of recovery rates. With a 1 percent per year recovery rate, concentrations at Waterford would reach 5 ng/L by 2078 and would reach that level much sooner with recovery rates of 3 percent or better.
With respect to ARARs related to water column PCB concentrations:
• The Federal MCL for drinking water (500 ng/L) was not exceeded during 2016 at any ofthe stations, or during the prior MNA period from 1995-2008.
• The New York State standard for protection of human health and drinking water sources(90 ng/L) was not exceeded at any station in 2016, although it was exceeded at times duringthe prior 1995-2008 MNA period, and regularly during dredging.
• The Criterion Continuous Concentration (CCC) Federal Water Quality Criterion (FWQC)for freshwater (14 ng/L TPCBs) was routinely exceeded prior to 2016, during both the pre-dredging MNA period and the dredging period. During 2016, the majority of TPCBsamples were below this threshold at Thomson Island Dam, Schuylerville, and Waterford,while all three observations at Stillwater were below 14 ng/L.
• The CCC FWQC for saltwater (30 ng/L TPCBs) was not exceeded at Poughkeepsie in the2014-2016 monitoring, and was exceeded on only two occasions in Albany in the 2004-2016 period of record. The upstream limit of salt intrusion in the Hudson River dependson flows rates and tides, but is typically far downstream of Albany.

59 Final Second Five-Year Review Report for the Hudson River PCBs Superfund Site April 2019
It is expected that these ARARs will be met consistently in the future. However, it should be noted that there have been minimal high flow events (which have the potential to cause elevated PCB concentrations) since dredging ended in 2015. Therefore, until more data are collected over time during these events, there is uncertainty regarding potential to exceed ARARs. High flow events will be monitored at Waterford and additional upstream locations as necessary for the foreseeable future as part of OM&M. EPA will continue to provide water data to users of river water.
The following key conclusions were reached:
• Initial 2016 water column data for the post-dredge MNA period indicate that PCBconcentrations are much lower than during the Baseline Monitoring Period and weregenerally consistent with expectations for the first year after dredging.
• Comparisons of water column data to non-waived ARARs indicates that TPCBconcentrations at the four monitoring stations were near or below these thresholds in 2016,at the beginning of the post-dredge MNA period.
• High flow event monitoring is needed for the foreseeable future.
Lower Hudson River Water Column Data For the Reassessment RI/FS, a model of the Lower Hudson River developed by Dr. Kevin Farley of Manhattan College and colleagues (Farley et al. 1999) was used to simulate water column and surficial sediment concentrations below Federal Dam. EPA has re-run the Farley model through 2008 using flows and loads from HUDTOX that reflect actual Upper Hudson River flows and associated tributary flow and solids load estimates. The resulting Tri+ PCB forecasts are compared to data for 2004-2008 at Albany and Poughkeepsie in Figure A1-4. Figure A1-4 shows that simulated Tri+ PCB concentrations at Albany, which is in the first model segment downstream from Troy, are in close agreement with 2004-2008 data. The model-data comparison for Poughkeepsie shows that the Farley model systematically under predicts Tri+ PCB at this station for the period 2004-2008. These simulated concentrations serve as inputs to FISHRAND, so that the downward bias would tend to also bias FISHRAND fish tissue predictions downward for the same period at mid-Hudson Stations near Poughkeepsie.
Figure A1-2 in Appendix 1 shows measured concentrations in the Lower Hudson during the dredging period, shown in orange as in Figure A1-1, as monitored at Albany and Poughkeepsie. The Albany data show some dredging impacts, with peak concentrations during the dredging period exceeding the maxima observed during the pre-dredge period (shown in blue). The Poughkeepsie data do not appear show notable dredging impacts.
Figure A1-2 shows that at both Lower Hudson monitoring stations, 2016 water column Tri+ PCB concentrations were generally lower than 2004-2008 baseline concentrations.
5.1.1.3.4 Decline in Fish Tissue PCB Concentrations As discussed in Appendix 3 (Assessment of PCB Levels in Fish Tissue), fish were collected in the Upper Hudson River and analyzed for PCBs by the NYSDEC from 1976 to 2011 and by GE from 2004 to 2016. NYSDEC has collected fish in the Lower Hudson River from 1976 to 2016 for analysis of PCBs. These timeframes of fish tissue data collection represent both a period of natural attenuation from 1976 to 2003 (interrupted by the 1992 Allen Mill failure) and a period of active

60 Final Second Five-Year Review Report for the Hudson River PCBs Superfund Site April 2019
remediation (the 2009-2015 dredging period). These data were grouped into six primary locations that represent fish collection areas generally revisited by the samplers each year, two of which are located in the Upper Hudson River (refer to Table A3-1 in Appendix 3).
Early NYSDEC fish tissue samples were analyzed using Aroclor-based standards, while more recent NYSDEC and GE samples were analyzed using congener-based standards. To ensure consistency and comparability across datasets, all Aroclor-based results were converted to estimates of TPCBs based on homologue equivalents (TPCBHE) through application of conversions documented in Appendix 5. There have also been differences in sample processing between NYSDEC and GE laboratories. All data used to evaluate trends and comparisons to model predictions were standardized to account for differences in sample processing and changes in analytical procedures, with the exception of the period from 2007 to 2013 when GE’s laboratory processed fish ribs out. These data are highlighted and/or qualified in this document, as necessary, depending on the analysis completed by EPA. EPA also completed a special study related to the rib out data that is described in Appendix 3.
Fish tissue trends over time were examined using several metrics, including wet weight TPCBHE in fish tissue (the basis of target levels and used as inputs to the human health and ecological risk assessments), lipid-normalized TPCBHE in fish tissue (obtained by dividing observed wet weight concentrations by the lipid content expressed as a fraction), and on a lipid-restricted basis (focusing on a narrow and consistent range of lipid levels over time to control for collinearity between lipid content and PCB levels). These different approaches are used because PCB levels in fish can decline in response to declines in both lipid content and environmental exposures. Although TPCBHE and lipid levels in fish are often correlated, these relationships may not always be proportional. In order to address this non-linearity, trends were also estimated using the lipid-restricted approach.
The fish tissue time trend evaluations were limited to those fish species used to estimate human and ecological exposures in the risk assessments supporting the 2002 ROD. These include largemouth bass, brown bullhead, yellow perch, pumpkinseed, spottail shiner and white perch. Striped bass, an important sport fish for the Lower Hudson, and smallmouth bass, often collected as a surrogate species when largemouth bass were absent, are both also included although they were not modeled.
The overall conclusions of the data evaluations presented in Appendix 3 are as follows:
• Wet weight tissue concentrations declined at approximately 12 to 20 percent per year inthe Upper Hudson and at Albany/Troy (RM152) during the MNA period, with lower ratesobserved at locations farther downstream in the Lower Hudson River.
• Lipid normalized tissue concentrations declined at approximately 8 percent per year in theUpper Hudson and at Albany/Troy (RM152), with slower rates observed at Catskill(RM113).
• Decay rates near Poughkeepsie/Kingston (RM90) and Newburgh (RM50) for the MNAperiod are not statistically different from zero.

61 Final Second Five-Year Review Report for the Hudson River PCBs Superfund Site April 2019
• All three decay rate estimation methods show similar patterns of decline across species andlocations and highlight the role of lipid versus exposure in observations of decreasing PCBconcentrations in fish tissue.
• Lack of correspondence between the rates of decline in fish tissue PCBs between Upperand Lower Hudson River monitoring locations indicates that Lower Hudson exposures maynot be closely connected to Upper Hudson conditions as discussed in Appendix 3.Differences in exposure could relate to a number of factors, including other sources in theLower Hudson watershed and/or fate and transport of PCBs within the Lower HudsonRiver. The difference in Upper Hudson and Lower Hudson exposures is in part supportedby the apparent lack of response in Lower Hudson fish to dredging-related releases during2009-2015. The effects of PCB load reduction from the Upper Hudson to the LowerHudson are not yet fully known but are expected to benefit the recovery of the lower river.Therefore, it is important that PCB load to the Lower Hudson continue to be monitoredunder OM&M for the foreseeable future and additional information be collected aboutother sources and PCB fate and transport in the lower river.
5.1.1.3.5 Comparisons of Modeled MNA from FISHRAND to Observed Trends in Fish Tissue Concentrations
The FISHRAND model was used to predict PCB concentrations in brown bullhead, largemouth bass, yellow perch, pumpkinseed, and spottail shiner in the Upper Hudson River and those species with the addition of white perch in the Lower Hudson River under MNA and a variety of remedial alternatives as presented in the FS, Responsiveness Summary to the FS, and ROD (EPA, 2000; EPA, 2002). As dredging did not begin until 2009, the period 1998–2008 provides an opportunity to compare MNA results from the FISHRAND model to observed data.
Table A3-4 in Appendix 3 shows the percentage of comparisons between modeled output and observed data on a mean basis by species and location that fall within factors of two, three, or five for the pre-dredging MNA period. In the Upper Hudson River, all comparisons are within a factor of three and over 75 percent of comparisons are within a factor of two over the ten-year period. In the Lower Hudson River, all comparisons are within a factor of five, and nearly 75 percent within a factor of two. Moreover, observed tissue concentrations at these locations have declined comparably to, or in several instances, more rapidly than model predictions as discussed above.
The furthest downstream locations where fish were collected in the Lower Hudson River (i.e., Poughkeepsie/Kingston (RM90) and Newburgh (RM60) compare well for all species except spottail shiner (a forage fish) on a wet weight basis (all within a factor of five and 90 percent within a factor of three), but compare less well on a lipid-normalized basis. It is important to note the FISHRAND model was not calibrated for the Lower Hudson River, and relied on a different fate and transport model (Farley Model) for exposure concentrations. As described in Appendix 1 and Section 5.1.1.3.3, the Farley Model tended to under predict water column concentrations at downstream locations in the Lower Hudson River relative to recently observed data. However, it should be noted the Farley model was calibrated to sediment and fish data, and very little water column data for the Lower Hudson River was available to constrain the model calibration. For the post-ROD period, the model tended to under predict water column concentrations at downstream locations in the Lower Hudson.

62 Final Second Five-Year Review Report for the Hudson River PCBs Superfund Site April 2019
In summary:
• Model forecasts of fish tissue under MNA agree well with observations of fish tissueTPCBHE levels for the Upper Hudson and RS4 (RM152) and RS5 (RM113) river sectionson both a wet weight and lipid normalized basis, with most comparisons within a factor of2. The model performs comparatively less well in downstream Lower Hudson Riversections where it was not calibrated to data and was driven by inputs from the Farley model,which tended to under predict water column concentrations.
• ROD forecasts for the Lower Hudson did not predict significant impacts or majorimprovements from remedy implementation as compared to MNA, and these predictionsare consistent with observations. Overall, observations support a lack of significantresponse between Upper Hudson processes, e.g., dredging releases, and Lower Hudsonimpacts.
• Overall, EPA’s evaluation of the available data, including post-dredging data from 2016,indicates declines in tissue concentrations are generally consistent with ROD predictions.Although further monitoring will be required to verify that RAOs are being achieved, thelines of evidence to this point indicate that the system is responding as anticipated. Asadditional post-dredging data are collected, EPA will be able to further assess the specifictimeframes to achieve the 0.2 mg/kg and 0.4 mg/kg target levels.
5.1.1.4 Sediment Capping is Effective Due primarily to an improper initial characterization of DoC, approximately 36 percent of the Phase 1 dredge areas were capped. This was a greater percentage than EPA anticipated based on the Residuals Standard. It was necessary to cap portions of several CUs out of compliance with the Residuals Standard due to schedule constraints. Areas which met the Residuals Standard were backfilled with approximately 1 foot of clean material to isolate residual PCB contamination and to expedite habitat recovery. The effectiveness of the cap material was tested in 2011 during a 100-year storm event. In 2011, post-storm bathymetry demonstrated the stability of Phase 1 capsas little scouring was observed.
Based on analyses presented in Appendix 2, 3,900 kg of TPCB and 1,100 kg of Tri+ PCB remaining after dredging were subsequently covered by clean backfill or an engineered cap during the Phase 2 dredging years. This represents 2.9 and 2.7 percent of the TPCB and Tri+ PCB removed during Phase 2, respectively, which is within the Residual Standard goal of removal of 96 to 98 percent of PCBs within the dredged areas. Thus, the calculation of PCB mass remaining within the CUs indicates that the dredging activities were carried out in a manner that not only met the Productivity and Residuals Standards for Phase 2 but removed the vast majority of PCB-contaminated sediment in the areas targeted for dredging.
5.1.1.4.1 Nodal Capping Analysis As described in Appendix 2, the total area within each CU covered by an engineered cap was determined using the Nodal Capping Index (NCI) and compared with the actual area capped, based on analysis of EPA-approved capping design plans for each CU. The total area closed out with engineered caps using the NCI was 34 acres, and the total area closed out with engineered caps that contained undredged inventory (i.e., the node contained sediment below 6 inches containing Tri+ PCB concentrations equal to or greater than 6 mg/kg) was 2.2 acres. When compared to the
63 Final Second Five-Year Review Report for the Hudson River PCBs Superfund Site April 2019
compliance thresholds for percentage of dredge area capped and area capped with undredged inventory, the NCI-calculated area capped (which is the area used for determination of compliance) was 7.7 percent of the total area dredged in Phase 2 (442 acres), and the NCI-calculated area capped with inventory was 0.5 percent of the total area dredged in Phase 2. Both of these categories were below the compliance thresholds set out in the Residuals Standard (i.e., 11 and 3 percent for total area capped and area capped with inventory, respectively).
As noted in Section 2 of Appendix 2, the NCI acted as a surrogate for the exact extent of capping and backfilling. An important factor in the decision to use the NCI as a measure of dredged area capped was the need to expeditiously determine compliance with capping limitations in the Residuals Standard while active dredging was taking place to avoid delaying the closure of dredged areas and potentially increasing the amount of sediment resuspension. Additionally, as the NCI required the capped areas to extend out to surrounding compliant nodes, the approach was inherently conservative in capping the full extent of non-compliant sediment.
As described in Appendix 7, bathymetric surveys are required by the OM&M plans for the Phase 1 and Phase 2 caps to evaluate the stability and effectiveness of sub-aqueous caps constructed in the Upper Hudson River to contain contaminated sediment. The following survey activities have been implemented at some or all of the capped areas to date:
• Baseline bathymetric surveys, conducted just after placement of a cap (post-placementsurvey), and Year 1 surveys, conducted the following year for comparison.
• Tier 1 bathymetric surveys conducted 5 and 10 years after initial cap placement, and thenat intervals of 10 years in perpetuity (with the exception of Phase 1 caps which GE needsto monitor and maintain for 30 years), or as otherwise agreed to with EPA. Tier 1bathymetric surveys are intended to determine longer term cap stability, as defined by thecriterion of “Measurable Loss.”
o Measurable Loss is defined as a loss of more than 3 inches of cap thickness over acontiguous 4,000 square foot (sf) area or a contiguous area representing over 20percent of the cap area, whichever is less, considering the accuracy of themeasurement technique and the nature of the cap surface.
o If a Measurable Loss of cap material is observed during the Tier 1 bathymetricsurveys, follow-up visual (and, as necessary, physical) investigations are to beconducted to confirm whether there has been a Significant Loss of cap material. ASignificant Loss of cap material is defined by the same criterion (more than 3 inchesetc.) as a Measurable Loss; however, the additional lines of evidence serve toconfirm the conclusion. If the investigations confirm a Significant Loss, affectedareas of the cap(s) will be repaired as necessary.
• ‘High-flow’ bathymetric surveys to be conducted as soon as possible following a 100-yearflood event.
The OM&M plans also require the implementation of additional cap integrity monitoring activities that have not yet been implemented, but are also summarized in Appendix 7, such as the selection and monitoring of ‘sentinel areas’ (chemical isolation layer monitoring).
64 Final Second Five-Year Review Report for the Hudson River PCBs Superfund Site April 2019
Year 1 bathymetric surveys were performed in 2010 for areas capped during Phase 1 and from 2012-2016 for areas capped during Phase 2 dredging activities. EPA analyzed bathymetric survey maps produced by GE for each of the Year 1 surveys conducted and did not identify any capped areas that underwent Measurable Loss as defined above. EPA’s analysis indicates that during the first year following cap placement, cap material remained stable.
A High Flow survey of Phase 1 caps installed in 2009 was performed in June 2011, following a 100-year flood event that occurred in April 2011. Results of the bathymetric comparison to priorsurvey data indicate that the 100-year flood produced depositional conditions in the areas of theriver that were capped in Phase 1, and no Measurable Loss was identified. Further discussion ofthe measured rates of deposition on a CU-by-CU basis is provided in Appendix 7.
Two 5-year recurrence Tier 1 surveys have been completed to date: in 2014 the 5-year Tier 1 survey was carried out in the areas dredged as part of Phase 1 (2009), and in 2016, the 5-year Tier 1 Survey was carried out for areas dredged during Phase 2 Year 1 (2011). While the 2016 survey data are not yet available for evaluation, the cap areas surveyed under the 2014 5-year Tier 1 survey were net depositional between 2009 and 2014. Future 5-year Tier 1 surveys will be conducted in 2017, 2018, 2019, and 2020, and will provide further data on the stability of caps in River Section 2 and River Section 3, along with the chemical isolation layer monitoring to be conducted in the future in selected CUs, as described in Appendix 7.
5.1.2 System Operations/OM&M
5.1.2.1 Cap Operation and Maintenance GE’s Phase 1 and Phase 2 OM&M plans for caps and habitat replacement/reconstruction each call for a bathymetric survey to be conducted one year following cap placement to evaluate the integrity of the caps. Subsequent bathymetric surveys are to be performed five and ten years after construction of the cap and continued thereafter at 10-year intervals. In addition, if a flood event with a magnitude at or exceeding the design recurrence interval for the cap occurs, the cap shall be inspected through a bathymetric survey and collection of sediment cores, as soon as practical after the event. Routine Phase 2 cap monitoring will be performed in perpetuity at 10-year intervals after cap installation. Monitoring of the Phase 1 caps will be performed for 30 years after cap construction.
5.1.3 Implementation of Institutional Controls and Other Measures
5.1.3.1 Fishing Restrictions and Fish Consumption Advisories NYSDOH and NYSDEC have implemented (and modified in some instances) fish consumption advisories and fishing restrictions due to PCBs in the Hudson River. As described in the 2002 ROD, the remedy called for the achievement of the remedial goal of 0.05 mg/kg in fish tissue, as well as the continuation of fishing restrictions and fish consumption advisories until the remedial goal is met. NYSDOH is conducting outreach activities to inform the public about fish advisories throughout the Site.
Completion of the dredging, in conjunction with implementation of separate upstream source control actions and continued MNA, is expected to facilitate achievement of the RAOs. The 2002

65 Final Second Five-Year Review Report for the Hudson River PCBs Superfund Site April 2019
ROD acknowledges that protectiveness of human health will rely on institutional controls and therefore included institutional controls (ICs) in the form of fish consumption advisories and fishing restrictions until the relevant remediation goals are met. In particular, reductions in human health risks would rely on knowledge of and voluntary compliance with fish consumption advisories as well as compliance with fishing restrictions. The 2002 ROD also acknowledged that even after construction was completed the remedy would still rely on ongoing ICs, including the fish consumption advisories and fishing restrictions.
Monitoring of fish tissue PCB concentrations is performed annually by GE under agreement with EPA. Monitoring of fish will continue to document progress towards achievement of the 0.05 mg/kg remediation goal. NYSDOH will continue to evaluate fish tissue level data into the future to determine if and when fish advisories can be modified. In addition to evaluating fish tissue PCB levels, NYSDOH implements the Hudson River Fish Advisory Outreach Project (Outreach Project) with the goal that throughout the 192-mile stretch of the Hudson River from Hudson Falls to the Battery in New York City, everyone eating Hudson River fish knows, understands, and follows NYSDOH advice on fish consumption (NYSDOH 2016). The program also seeks to reduce contaminant consumption without reducing overall healthy fish consumption.
As described in detail in Appendix 13, NYSDOH fish advisory outreach work has been conducted in partnership with other state and local agencies. While the goal is to educate a range of Hudson River fish consumers, the project focuses on reaching women, children, and low-income citizens. The Outreach Project uses various outreach strategies that include distribution of written and electronic materials, partnerships, and a presence at community events and public venues to achieve its objectives. To accomplish Outreach Project objectives, NYSDOH has established partnerships with commercial fisherman’s associations, recreational anglers, boating community representatives, environmental justice advocates, immigrant rights advocates, local health officials, environmental conservation officials, parks and recreations officials, health care provider representatives, community group leaders, and food pantries/community food networks. Much of the outreach focuses on communicating locations in the Hudson River that have high PCB concentrations in fish, strategies to reduce exposure to PCBs during fish consumption, and the recommended frequency of consumption of Hudson River fish.
NYSDOH uses a variety of means to reach out to potential fish consumers including direct communication and providing materials to the public to convey the health advice on eating Hudson River fish, including brochures, wallet cards, posters, a coloring book, and a “Cut the Fat to Cut PCBs” magnet. These materials have been disseminated at various locations along the river, public presentations and community events, and are offered via list-serves and websites. According to NYSDOH, previous consumption surveys indicated that certain communities in the Lower Hudson River region (south of Bear Mountain Bridge) may be less aware of the fish advisories than communities in the Mid- and Upper regions of the Hudson River. EPA also understands from NYSDOH that since the 2012 Five Year Review, the demographics of persons fishing in the Hudson may be changing. Therefore, according to NYSDOH, they continued their outreach efforts on the Lower Hudson River region and, since 2012, to more recently observed demographic groups. As detailed in Appendix 13, NYSDOH has engaged in more signage posting, updated graphics and informative materials, and conducted angler convenience surveys to target and expand it outreach.
66 Final Second Five-Year Review Report for the Hudson River PCBs Superfund Site April 2019
The 2002 ROD anticipated challenges to implementing fishing restrictions (e.g., catch and release) and fish consumption advisories such as the importance of informing citizens and the voluntary nature of advisory compliance. EPA acknowledged in the 2002 ROD that the consumption advisories are not fully effective in preventing or limiting fish consumption. EPA understands the challenges faced by NYSDOH regarding informing the public about fish consumption and the importance of the Outreach Project to reducing human exposure to contaminated fish. Given the iterative and ongoing nature of outreach and recent NYSDOH efforts to enhance and focus efforts, the institutional controls (fishing restriction and fish consumption advisories) appear to be functioning as intended. EPA will continue to work with NYSDOH to identify potentially additional and/or more effective outreach techniques into the future.
5.1.3.2 Coordination with NYSCC Regarding Caps and Navigation on the Champlain Canal
EPA understands the importance of identifying cap locations to mariners. In 2017, GE provided GIS location of caps to New York State to assist in informing mariners about the locations of capped areas on the Hudson River. EPA anticipates that this information will be used by the NYSCC to inform mariners about the locations of caps on the Upper Hudson.
5.1.3.3 Potential OU1 Public Use EPA is working with New York State to establish an institutional control for the Remnant Deposits (OU1). The Town of Moreau has informed EPA that it would like to use Remnant Deposits 2 and 4 for passive park use. Likely use would consist of passive recreation activities such as hiking and cycling over the area. Currently, EPA and New York State are working to determine the ownership of the parcels as part of the institutional control. Use of the property as a park would need to be limited to uses and activities that would not compromise the integrity of the cap system. Consideration would need to be given to the fences on the area that limit use of the area. If the fences are modified in the development of passive use of the parcel, additional engineering controls may be necessary. Details of the passive use and any additional design measures on the OU1 area would need to be developed in close consultation between EPA, NYS, and the parcel owners. Access to sites is currently restricted by fencing and locked gates.
5.2 Question B: Are the Exposure Assumptions, Toxicity Data, Cleanup Levels, and Remedial Action Objectives (RAOs) Used at the Time of the Remedy Still Valid?
As to OU1, there have been no changes in the physical conditions of Remnant Deposits 2 through 5 that would change the protectiveness of the remedy. The cap system on the Remnant Deposits prevents exposure to the capped sediments, and perimeter fencing prevents access to the sites. Posted signage provides an additional barrier to exposure. There is limited access to the Remnant Deposits because of their location in the deeper gorge section of the Upper Hudson River. The ongoing procedures to inspect and re-establish the fencing, where appropriate, should continue as a barrier to exposure. In the event access to these areas is provided for a passive park at Remnant Deposit sites 2 and/or 4, further considerations and measures may be needed, such as more frequent inspections or additional sampling. As noted in the first Five-Year Review in 2012, an institutional control needs to be implemented to ensure that future use of the Remnant Deposits does not compromise the integrity of the cap system or result in unsafe exposures.

67 Final Second Five-Year Review Report for the Hudson River PCBs Superfund Site April 2019
In 1984, when the Remnant Deposits remedy was selected, guidance on the development of risk assessment was just beginning at EPA and, as a result, a risk assessment was not conducted. EPA’s selection of 5 mg/kg as the basis for determining areas for capping is nevertheless consistent with a potential recreational use of the properties using current risk assessment tools. Currently, 1 mg/kg is the concentration associated with a residential property assuming exposures to a young child, 1 to 6 years of age, exposed 350 days/year for six years, and an oral Reference Dose for Aroclor 1254 of 0.00002 mg/kg-day. Considering the less frequent exposures of an adolescent trespassing on the property, the difference in body weight, capping of all PCB concentrations greater than 5 mg/kg would be consistent with current risk assessment practices.
GE currently is performing an RI/FS for PCB contamination in low-lying Hudson River floodplain areas, from approximately upstream of Remnant Deposit 1 to Troy, New York. The low-lying areas adjacent to the capped Remnant Deposits will be included in the ecological and human health risk assessments to be conducted for the floodplain.
5.2.1 Changes in Standards and TBCs There are no ARARs or to-be-considered requirements (TBCs) for PCBs in fish and sediment. A risk-based remediation goal for the protection of human health of 0.05 mg/kg PCBs in fish fillet (wet weight) was established in the 2002 ROD based on the RME adult fish consumption rate of 51 half-pound meals/year. Target levels were also set at 0.2 mg/kg PCBs in fish fillet (protective at a fish consumption rate of one half-pound meal per month) and 0.4 mg/kg PCBs in fish fillet (which is protective at a consumption rate of one half-pound meal every two months). These targets of higher concentrations in fish represent points at which fish consumption advisories and fishing restrictions might become less stringent (e.g., the “eat none” advisory for the Upper Hudson may be relaxed as conditions improve).
5.2.2 Changes in Exposure Pathways
5.2.2.1 Human Health Exposure This FYR includes a review of the exposure and toxicity parameters used for the 2002 ROD to determine if any of the risk assessment conclusions would change. Since the last five-year review, HHRA exposure assumptions were updated with the release of EPA’s Human Health Evaluation Manual, Supplemental Guidance: Update of Standard Default Exposure Factors. Updates include changes in exposure assumptions for body weight for the adult, skin surface area for the adult and child, drinking water ingestion rate for the young child and adult, and other parameters. These updates do not change the conclusions of the risk assessment or the protectiveness of the selected remedies.
5.2.2.2 Ecological Exposure The values associated with four exposure parameters (body weight [BW], food ingestion rate [FIR], water ingestion rate [WIR], and sediment ingestion rate [SIR]) used to estimate exposure for piscivorous mammals (mink and river otters) have been updated since completion of the final BERA (see Appendix 11 for details). Some of the parameters have increased, while others have decreased. Use of the updated values for BW, WIR, and SIR would not greatly affect the calculated risks for mink and river otter. Conversely, the updated wet weight FIR is higher for both mink and river otter, and the updated dry weight FIR is higher for mink. Overall, use of updated exposure

68 Final Second Five-Year Review Report for the Hudson River PCBs Superfund Site April 2019
parameters would result in slightly more conservative estimates of exposure and risk (i.e., an increase in average daily dose and hazard quotient). Consequently, use of updated values for the exposure parameters identified above would reduce the upper-bound of the risk-based concentration ranges for the ecological exposure pathway identified in the ROD. It should be noted that adjustments to the risk-based concentration ranges depend less on the updated exposure parameters than on the updated PCB toxicity values, which are discussed below.
5.2.3 Changes in Toxicity and Other Contaminant Characteristics
5.2.3.1 Human Health Toxicity EPA relied on toxicity values from the Integrated Risk Information System (IRIS) for the cancer slope factor (CSF) and the non-cancer toxicity values. This approach is consistent with the updated EPA guidance memorandum Human Health Toxicity Values in Superfund Risk Assessments (OSWER Directive (9285.7-53, December 5, 2003)) that recommends IRIS as a Tier 1 toxicity value in selecting toxicity values for use in the Human Health Risk Assessment (HHRA) for the ROD. The IRIS cancer toxicity information used in the HHRA meets the Tier I toxicity criteria for the Superfund Program. The toxicity values developed by the IRIS included an evaluation of studies in animals (specifically monkeys) who had reached a pharmacokinetic steady-state based on PCB concentrations in adipose tissue and/or blood (e.g., the animals had a body burden). There are many studies available related to the toxicity of PCBs; however, there are limitations of human studies including limited knowledge of the original PCB mixtures, exposure levels, and other details of exposure that are not known. Based on these limitations, the animal studies were used in the derivation of the toxicity values for the evaluation of non-cancer toxicity. EPA relied on studies of four Aroclors in the derivation of the cancer slope factor.
Plans to update cancer toxicity values are not identified on the IRIS agenda that lists chemicals being assessed under the IRIS program. The IRIS chemical file identifies PCBs as a Probable Human Carcinogen (B2 classification). Consistent with Superfund guidance, chemicals classified as known, probable or possible human carcinogens are all evaluated for carcinogenic risk when a Cancer Slope Factor (CSF) necessary to calculate cancer risk is available.
A subset of PCB congeners is considered to be dioxin-like, that is, they are structurally similar to dibenzo-p-dioxins, bind to the aryl hydrocarbon receptor, and cause dioxin-specific biochemical and toxic responses (reviewed in EPA, 1996). The 2012 Five Year Review noted the update to the dioxin-toxic equivalence factors (TEFs) for dioxin-like PCBs (EPA 2010c). A comparison of the results from the original risk assessment with those calculated with the current reference dose for the dioxin-like PCBs indicate the dioxin-like PCBs do not show enhancement (EPA 1996).
At the current time, the IRIS Agenda indicates plans to update the non-cancer toxicity values for PCBs. Any available updates to the non-cancer toxicity values would be considered in the next five-year review for the Hudson River.
5.2.3.2 Ecological Toxicity Regarding ecological risk, the LOAEL and NOAEL toxicity values for PCBs used in the final Baseline Ecological Risk Assessment (BERA) (0.044 and 0.0044 mg/kg/day, respectively), which was performed during the Reassessment RI/FS and formed the basis for the remedial goal reported

69 Final Second Five-Year Review Report for the Hudson River PCBs Superfund Site April 2019
in the ROD for protection of the ecological exposure pathway, are similar to such toxicity values available today. For this five-year review, EPA reviewed recent toxicity data for effects of PCBs on wildlife to determine if any changes to the toxicity data used in the original BERA were warranted (see Appendix 11 for full details). EPA policy allows for EPA to exercise professional judgment in selecting specific LOAEL and NOAEL toxicity values for use in an ecological risk assessment, and careful review of the literature is an important step in the selection of the values. Based on this review, EPA concluded that refinements to the LOAEL and NOAEL used to evaluate risks to the otter and mink in the final BERA were appropriate in order to reduce the uncertainty in the risk-based ranges reported in the ROD, each of which span an order of magnitude.
These risk-based ranges in the ROD are (i) 0.3 to 0.03 mg/kg PCBs in whole fish (largemouth bass) consumed for protection of the river otter, which is the remedial goal for ecological exposure, and (ii) 0.7 to 0.07 mg/kg PCBs in whole fish (spottail shiner) for protection of the mink, a species known to be sensitive to PCBs. EPA’s review of recent toxicity data suggested that the LOAEL and NOAEL toxicity values used in the original BERA could be revised to 0.033 and 0.011 mg/kg/day, respectively. The refinements to the LOAEL and NOAEL toxicity values and, to a lesser degree, the otter and mink exposure parameters ultimately would result in narrower risk-based concentration ranges for PCBs in largemouth bass and spottail shiner for protection of the otter and mink, respectively. Specifically, the recalculated remediation goal range for largemouth bass consumed by the river otter would be 0.2 to 0.07 mg/kg PCBs in fish compared to 0.3 to 0.03 mg/kg PCBs in fish as reported in the ROD. The recalculated risk-based concentration range for spottail shiner consumed by the mink would be 0.34 to 0.11 mg/kg PCBs in fish compared with 0.7 to 0.07 mg/kg PCBs in fish in the final BERA. The recalculated ranges for PCBs in fish would be narrower than and lie wholly within the original ranges developed in the ROD for both the fish tissue remediation goal for the river otter and risk-based concentration range for mink. Thus, refinement of the toxicity values would result in risk-based ranges of PCBs in largemouth bass and spottail shiner that would be less uncertain and bring into better focus the ranges of PCBs in fish expected to be protective of the ecological exposure pathway. The lower bounds of the updated ranges are not lower than the lower bounds for both ranges identified in the ROD, and the refinement of toxicity values and recalculation of the ecological remediation goal for the river otter and risk-based concentration range for the mink do not affect the protectiveness determination of the selected remedy with respect to ecological receptors.
5.2.4 Changes in Risk Assessment Methods EPA reviewed directives from the Office of Solid Waste and Emergency Response (OSWER, now the Office of Land and Emergency Management) to update the methodologies in assessing risk. The OSWER directives used in this assessment are current with the update of OSWER 9200.1-120 (Update of Standard Default Exposure Factors, EPA OSWER 2014). The changes in the OSWER Directive do not change the overall conclusions and the protectiveness of the remedy.
EPA followed the Ecological Risk Assessment Guidance for Superfund: Process for Designing and Conducting Ecological Risk Assessments – Interim Final (OSWER 9285.7-25, June 1997) in conducting the BERA. The methodologies in that guidance are current and were followed in the updates to the risk calculations discussed above.

70 Final Second Five-Year Review Report for the Hudson River PCBs Superfund Site April 2019
5.2.5 Determination Regarding Remedial Action Objectives in 2002 ROD Based on the evaluations discussed above and in Appendix 11 with regard to the human health risks at the Site, EPA has determined that the RAOs for protection of human health identified in the 2002 ROD, including the remedial goal 0.05 mg/kg PCBs in fish filet, are still valid and appropriate. Although the target concentrations of 0.2 mg/kg and 0.4 mg/kg in fish fillet are not remedial goals, EPA continues to believe that they are valid and appropriate targets.
Based on the evaluations discussed above and in Appendix 11 with regard to ecological risks at the Site, EPA also has determined that the RAO in the 2002 ROD to reduce the risks to ecological receptors by reducing the concentration of PCBs in fish is still valid. As noted above, refinement of toxicity values and recalculation of the ecological remediation goal for the river otter and risk-based concentration range for the mink does not affect the protectiveness determination of the selected remedy with respect to ecological receptors.
5.2.6 Risk Considerations Risks to subsistence anglers, which would include subsistence anglers in environmental justice communities, were evaluated for the risk assessment performed for the ROD, and EPA’s evaluation of available literature regarding subsistence consumption led EPA to conclude that cancer risks and non-cancer health hazards to subsistence anglers were adequately evaluated in the risk assessment. Review of the limited literature available on subsistence or highly exposed angler populations supports the assumption that these subpopulations are likely to be adequately represented in the total distribution of fish ingestion rates developed for Upper Hudson River anglers. As presented in the HHRA (p. 46):
in a thesis by Wendt entitled "Low Income Families’ Fish Consumption of Freshwater Fish Caught From New York State Waters," low-income families in 12 counties throughout New York, including Albany and Rensselaer counties were interviewed (Wendt, 1986). Wendt reported that between 9 percent and 49 percent of the low-income families in each county ate freshwater fish from New York State waters. Wendt then conducted a more in-depth survey of low-income families in Wayne County, New York, bordering Lake Ontario and determined fish consumption rates. The average consumption rate was 17.5 meals per year, or 10.9 g/day. In comparison, the arithmetic average consumption rate from the distribution selected to represent Upper Hudson River anglers is 27.8 meals per year, or 17.3 g/day.”
5.3 Question C: Has Any Other Information Come to Light that Could Call into Question the Protectiveness of the Remedy?
No other information has come to light that could call into question the protectiveness of the remedy. However, the following items regarding fish tissue targets are provided for clarification.
5.3.1 Considerations Regarding Model Forecasts At the time of the ROD, a number of details for the implementation of the remedy, including the timing, number of sediment processing/transfer facilities, and certain operational details had not yet been defined. The modeling done for the Reassessment RI/FS was sufficiently accurate to compare remedies and support remedy selection. The peer reviewed models, however, were not intended to predict the specific years in which specified PCB levels would be achieved in fish. Additionally, EPA acknowledged in the ROD that the model forecasts included uncertainties, and

71 Final Second Five-Year Review Report for the Hudson River PCBs Superfund Site April 2019
that they were more appropriately used to compare relative benefits of different remedial alternatives. The accuracy of that modeling for MNA periods is discussed in Appendices 1 and 3. It was also recognized at the time of the ROD that forecasts of fish tissue concentration become increasingly uncertain for the longer time periods needed to forecast time to achieve risk targets. Further, dredging caused perturbations to the system that were not all anticipated and were not modeled. These perturbations are discussed in Appendix 8, and their effects are also shown in Appendices 1 and 3. One year of post-dredging data indicate a reduction in exposures consistent with EPA’s expectations at the time of the ROD, as shown in Appendix 1. EPA will continue to collect data as needed to establish a trend for the post-dredge period and obtain an increasing degree of certainty about times to achieve risk-based fish tissue targets.

72 Final Second Five-Year Review Report for the Hudson River PCBs Superfund Site April 2019
VI. ISSUES/RECOMMENDATIONS
6.1 Issues and Recommendations Identified in the Five-Year Review
The table below describes issues that were identified during the five-year review process that could potentially affect the protectiveness of the remedy. The inclusion of an item on the table does not necessarily indicate that the issue has an impact on the remedy, but it does indicate follow-up measures for each item. EPA will continue to coordinate with the appropriate federal and state support agencies and the public (including the project Community Advisory Group) regarding these potential issues.
Issues/Recommendations
OU(s) without Issues/Recommendations Identified in the Five-Year Review:
None
Issues and Recommendations Identified in the Five-Year Review:
OU(s): OU1 Issue Category: Institutional Controls
Issue: The 1984 ROD does not contain requirements for institutional controls. An institutional control to ensure that future use of the Remnant Deposits does not compromise the integrity of the OU1 cap system or result in unsafe exposures should be implemented.
Recommendation: EPA will coordinate as appropriate with municipalities about potential plans for accessing and/or utilizing the Remnant Deposits. The Town of Moreau has informed EPA that it would like to use Remnant Deposits 2 and 4 as a passive park. Use of one or both properties as a park would need to be limited to uses and activities that would not compromise the integrity of the cap system.
EPA will also coordinate with NYS to determine land ownership, which would be needed in order for institutional controls to be properly established. Currently, fences installed at the Remnant Deposits restrict access to the sites.
Affect Current Protectiveness
Affect Future Protectiveness
Party Responsible
Oversight Party Milestone Date
No Yes PRP EPA/NY State 5/31/2022
OU(s): OU2 Issue Category: - Additional Information Needed
Issue: There are not enough data available since the completion of dredging and related project activities in 2015 to determine if the remedy will be protective within the time frame anticipated by the Record of Decision (ROD). EPA estimates that as many as eight or more years of post-dredging fish tissue data are needed to establish a statistically relevant trend.

73 Final Second Five-Year Review Report for the Hudson River PCBs Superfund Site April 2019
Recommendation: Additional information will be obtained through the ongoing collection and evaluation of fish tissue data along with the surface water and sediment data collected as part of the long-term monitoring program. Once statistically relevant rates of decline in post-dredging fish tissue PCB levels can be established, EPA will estimate the rates of recovery and determine if they are reasonably consistent with those predicted in the ROD. Once this information is obtained a protectiveness determination will be made.
Affect Current Protectiveness
Affect Future Protectiveness
Party Responsible
Oversight Party Milestone Date
No Unknown PRP EPA/NY State 2025
6.2 Other Findings The following are findings related to OU2 that do not impact protectiveness but may inform future OM&M:
The monitoring programs for fish, water, and sediment require multiple sampling events over a period of time in order to establish the trends in the data to further evaluate the effectiveness of the remedy. The amount of time necessary to evaluate each medium will vary. EPA estimates that as many as eight or more years of post-dredging fish tissue data are needed. This information will be obtained through the ongoing collection and evaluation of fish tissue data along with the water and sediment data collected as part of the long-term monitoring program.
General Electric Co., with oversight by EPA and the state, will implement the operation, maintenance and monitoring program for fish/water/sediment. EPA will continue to conduct five-year reviews for the foreseeable future.
In addition, the following are recommendations that were identified during the second five-year review:
6.2.1 IRIS database Some members of the five-year review team requested that EPA consider additional PCB toxicity information in order to re-evaluate human health risks at the Site. It should be noted that EPA uses the Integrated Risk Information System (IRIS), a Tier 1 Toxicity source, for data regarding the toxicity of PCBs. EPA will continue to review new or updated information in IRIS in future assessments of risk at the Site.
6.2.2 Outreach on NYSDOH Fish Advisories NYSDEC acknowledges that the institutional control fish advisories have been implemented and are performing as intended by the ROD (NYSDEC 2016). The 2012 five-year review included recommendations for assessing what additional and/or more effective outreach techniques may be available. This five-year review includes a discussion of efforts undertaken by New York State to improve the effectiveness of the advisories (see Appendix 13). The New York State Department of Health has informed EPA that the outreach program is continually seeking out new populations to inform of the advisories. In addition to the outreach program, NYSDEC provides fishing

74 Final Second Five-Year Review Report for the Hudson River PCBs Superfund Site April 2019
licensees with data on the advisories when anglers purchase a license to fish in the Upper Hudson River. EPA suggests that NYSDEC evaluate the extent to which advisory information is provided to anglers who register for the Recreational Marine Fishing Registry to fish in the Lower Hudson River. EPA will continue to work closely with NYSDEC and NYSDOH on the implementation of the outreach program.
6.2.3 Institutional Controls In addition to the fish consumption advisories and fishing restrictions, EPA believes that additional institutional controls may be needed in order to protect the subaqueous caps installed by GE during the dredging and to protect areas in which GE conducted habitat reconstruction and replacement measures until, for example, the new plantings become established. Such institutional controls may include restrictions on anchoring and other activities that may damage the caps or the new plantings. EPA will work closely with the state (including the New York State Canal Corporation), the U.S. Army Corps of Engineers and GE regarding limiting potential disturbances of these areas.
6.2.4 Fish Recovery Data trends observed from fish monitoring measurements collected under the monitored natural attenuation (MNA) period from 1995 to 2008 were compared to MNA forecasts developed as part of the ROD for 1998 to 2008. These comparisons showed that fish tissue data reflected the anticipated consistent decline in fish tissue concentrations when moving downstream within the project area. In addition, observed PCB concentrations in fish tissue in the Upper Hudson River and upstream from the Green Island Bridge in Troy were declining more rapidly than in the rest of the Lower Hudson River, downstream from the Green Island Bridge. These comparisons (details are provided in Appendix 3) suggest potential differences in exposures between the Upper Hudson River and Lower Hudson River, in addition to suggesting that MNA is potentially working more slowly in the Lower Hudson River than in the Upper Hudson River. There are other sources of PCBs in the Lower Hudson River (although less significant than the GE sources of PCBs at Hudson Falls and Fort Edward), the Lower Hudson River is a tidal estuary with characteristics that are very different than the freshwater Upper Hudson River, and PCB contamination in the Lower Hudson has been studied less than in the Upper Hudson River. It will therefore be important to collect additional data and other information in order to better understand the PCB contamination in the Lower Hudson River.
NYSDEC has expressed doubt that the fish PCB targets will be achieved in the timeframes anticipated by the ROD (NYSDEC 2016). The first rounds of post-dredging fish data (from 2016) indicate that concentrations have generally returned to pre-dredging or slightly below pre-dredging levels, which is encouraging (See Appendix 3). EPA has developed the remedy performance monitoring actions under the Operation, Maintenance and Monitoring (OM&M) program to collect data necessary to address uncertainty to the extent reasonably possible. It is important to keep in mind that EPA anticipates as many as eight or more years of actual post-dredging fish data are needed to establish a statistical trend in PCB levels in fish. This generally expected timeframe for obtaining more certainty regarding post-remedial fish trends is based upon scientific analysis and has been known since the establishment of the Baseline Monitoring Program. EPA has shared this information with involved parties since 2003.

75 Final Second Five-Year Review Report for the Hudson River PCBs Superfund Site April 2019
6.2.5 Operations, Maintenance & Monitoring Adjustments OM&M of water, fish, sediment, caps and habitat is an important part of the remedy. It is necessary that OM&M plans reflect the current understanding of the system being monitored and that monitoring plans have the flexibility to be adjusted as necessary during the ongoing MNA period of the remedy.
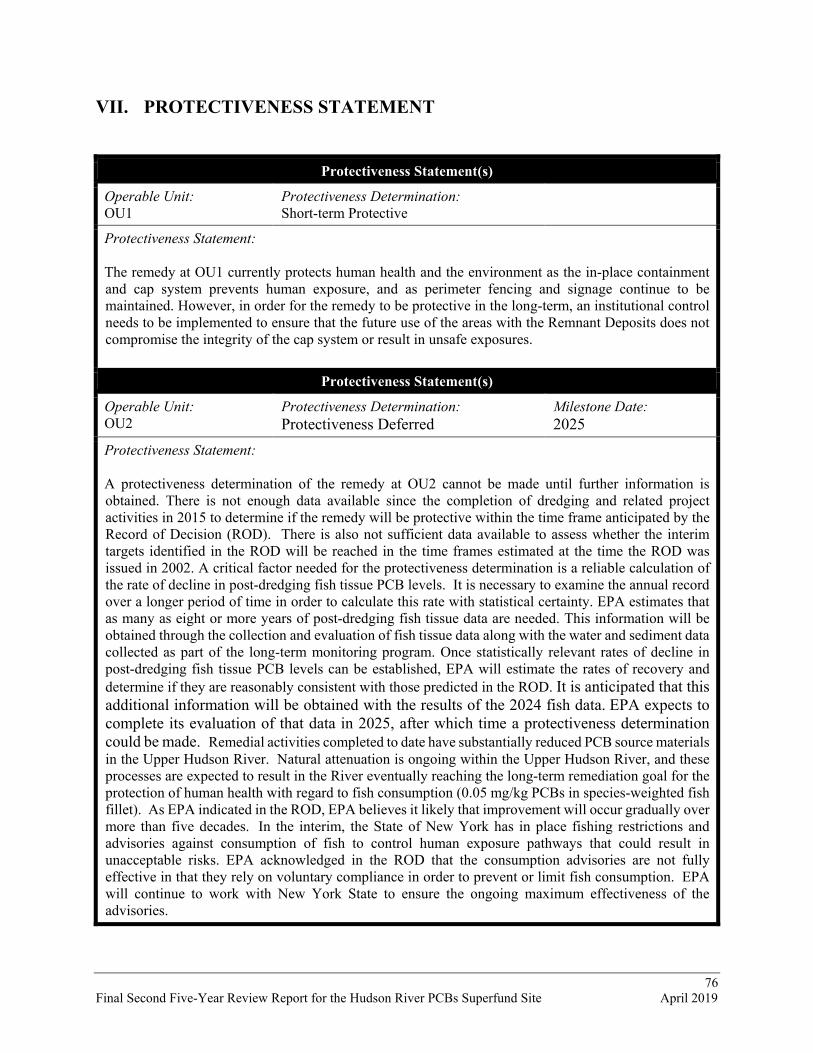
76 Final Second Five-Year Review Report for the Hudson River PCBs Superfund Site April 2019
VII. PROTECTIVENESS STATEMENT
Protectiveness Statement(s)
Operable Unit: OU1
Protectiveness Determination: Short-term Protective
Protectiveness Statement:
The remedy at OU1 currently protects human health and the environment as the in-place containment and cap system prevents human exposure, and as perimeter fencing and signage continue to be maintained. However, in order for the remedy to be protective in the long-term, an institutional control needs to be implemented to ensure that the future use of the areas with the Remnant Deposits does not compromise the integrity of the cap system or result in unsafe exposures.
Protectiveness Statement(s)
Operable Unit: OU2
Protectiveness Determination: Protectiveness Deferred
Milestone Date: 2025
Protectiveness Statement:
A protectiveness determination of the remedy at OU2 cannot be made until further information is obtained. There is not enough data available since the completion of dredging and related project activities in 2015 to determine if the remedy will be protective within the time frame anticipated by the Record of Decision (ROD). There is also not sufficient data available to assess whether the interim targets identified in the ROD will be reached in the time frames estimated at the time the ROD was issued in 2002. A critical factor needed for the protectiveness determination is a reliable calculation of the rate of decline in post-dredging fish tissue PCB levels. It is necessary to examine the annual record over a longer period of time in order to calculate this rate with statistical certainty. EPA estimates that as many as eight or more years of post-dredging fish tissue data are needed. This information will be obtained through the collection and evaluation of fish tissue data along with the water and sediment data collected as part of the long-term monitoring program. Once statistically relevant rates of decline in post-dredging fish tissue PCB levels can be established, EPA will estimate the rates of recovery and determine if they are reasonably consistent with those predicted in the ROD. It is anticipated that this additional information will be obtained with the results of the 2024 fish data. EPA expects to complete its evaluation of that data in 2025, after which time a protectiveness determination could be made. Remedial activities completed to date have substantially reduced PCB source materials in the Upper Hudson River. Natural attenuation is ongoing within the Upper Hudson River, and these processes are expected to result in the River eventually reaching the long-term remediation goal for the protection of human health with regard to fish consumption (0.05 mg/kg PCBs in species-weighted fish fillet). As EPA indicated in the ROD, EPA believes it likely that improvement will occur gradually over more than five decades. In the interim, the State of New York has in place fishing restrictions and advisories against consumption of fish to control human exposure pathways that could result in unacceptable risks. EPA acknowledged in the ROD that the consumption advisories are not fully effective in that they rely on voluntary compliance in order to prevent or limit fish consumption. EPA will continue to work with New York State to ensure the ongoing maximum effectiveness of the advisories.
77 Final Second Five-Year Review Report for the Hudson River PCBs Superfund Site April 2019
VIII. NEXT REVIEW
The next five-year review report for the Hudson River PCBs Superfund Site is required five years from the completion date of this review.

78 Final Second Five-Year Review Report for the Hudson River PCBs Superfund Site April 2019
IX REFERENCES
Bridges, T., Fox, R., Fuglevand, P., Hartman, G., Magar, V., Schroeder, P., Thompson, T., 2010. Hudson River PCBs Site Peer Review of Phase 1 dredging, September 2010.
EPA (United States Environmental Protection Agency). 1984. Superfund Record of Decision: Hudson River PCBs Site, NY.
__________. 1996. “PCBs: Cancer Dose-Response Assessment and Application to Environmental Mixtures.” Office of Research and Development, National Center for Environmental Assessment, Washington Office. Washington, D.C. EPA/600/P-96/001F.
__________. 2000. Hudson River PCBs Reassessment RI/FS Phase 3 Report: Feasibility Study. Prepared by TAMS Consultants, Inc. December 2000.
__________.2002. Record of Decision for the Hudson River PCBs Superfund Site. U.S. Environmental Protection Agency. February 2002.
___________. 2010a. Hudson River PCBs Site EPA Phase I Evaluation Report. Prepared for USEPA, Region 2 and the U.S. Army Corps of Engineers by the Louis Berger Group. March 2010.
__________. 2010b. Hudson River PCBs Site Revised Engineering Performance Standards. December 2010.
__________2010c. Recommended Toxicity Equivalence Factors (TEFs) for Human Health Risk Assessments of 2,3,7,8-Tetrachlorodibenzo-p-dioxin and Dioxin-Like Compounds. Risk Assessment Forum. Washington, D.C. EPA/600/R-10/005.
__________. 2012. First Five-Year Review Report for Hudson River PCBs Superfund Site. June 1, 2012.
__________ 2014. Human Health Evaluation Manual, Supplemental Guidance: Update of Standard Default Exposure Factors. Office of Superfund Remediation and Technology Innovation. OSWER Directive 9200.1-120. February 2014.
Farley, K., J. Thomann, R. V. Cooney, T. F. Damiani, and J.R. Wands, J. R. (1999). An Integrated Model of Organic Chemical Fate and Bioaccumulation in the Hudson River Estuary, Final Report to the Hudson River Foundation, Manhattan College, Riverdale, NY.
GE 2005. Habitat Assessment Report for Candidate Phase 1 Areas, Hudson River PCB Superfund Site. Prepared by Exponent and Blasland, Bouck, and Lee for General Electric Company, Albany, NY.
__________. 2007. Hudson River PCBs Site Phase 2 Dredge Area Delineation Report. Prepared for General Electric Company by QEA, LLC. December 17, 2007.

79 Final Second Five-Year Review Report for the Hudson River PCBs Superfund Site April 2019
__________ 2009a. Habitat Delineation Report, Hudson River PCB Superfund Site. Prepared by Blasland, Bouck and Lee, and Anchor QEA, LLC for General Electric Company, Albany, NY.
__________ 2009b. Habitat Assessment Report for Phase 2 Areas, Prepared by Blasland, Bouck and Lee, and Anchor QEA, LLC for General Electric Company, Albany, NY
__________ 2010. Phase 1 Evaluation Report, Hudson River PCBs Superfund Site. Prepared by Anchor QEA, LLC and ARCADIS for General Electric Company, Albany, NY, March 2010.
__________. 2011a. Technical Memorandum: Results of Baseline Surface Sediment and Downstream PCB Deposition Special Studies. Prepared for General Electric Company by Anchor QEA, LLC. January 2011.
__________ 2011b. Phase 2 Performance Standards Compliance Plan For 2011. Appendix D to Remedial Action Work Plan for Phase 2 Dredging and Facility Operations in 2011, Hudson River PCBs Superfund Site. Revised April 2011.
__________. 2016. Phase 2 Year 5 Annual Progress Report. Prepared for General Electric Corporation by Parsons Corp. April 2016.
NYSDEC 2016. “Recommendations to EPA for the ‘Five Year Review Report’ for Hudson River PCBs Site.” December 2016.
NYSDOH. 2016. Hudson River Fish Advisory Outreach Project Update (2009-2016) Wendt, M.E. 1986. Low Income Families’ Consumption of Freshwater Fish Caught From New York State Waters. Thesis, Cornell University. August.