final research report - washington state department … research report research project t9903, task...
TRANSCRIPT

Final Research ReportResearch Project T9903, Task 43
Busview
BUSVIEW:AN APTS PRECURSOR AND A DEPLOYED APPLET
by
D.J. Dailey, S. Maclean, I. PaoITS Research Program
College of Engineering, Box 352500University of Washington
Seattle, Washington 98195-2500
Washington State Transportation Center (TRAC)University of Washington, Box 354802
University District Building1107 NE 45th Street, Suite 535
Seattle, Washington 98105-4631
Washington State Department of TransportationTechnical Monitor
Morgan Balogh
Prepared for
Washington State Transportation CommissionWashington State Department of Transportation
Olympia, Washington 98504-7370
And in cooperation withU.S. Department of Transportation
Federal Highway Administration
June 2000

TECHNICAL REPORT STANDARD TITLE PAGE1. REPORT NO. 2. GOVERNMENT ACCESSION NO. 3. RECIPIENT'S CATALOG NO.
WA-RD 467.1
4. TITLE AND SUBTITLE 5. REPORT DATE
Busview: an APTS Precursor and a Deployed Applet June 20006. PERFORMING ORGANIZATION CODE
7. AUTHOR(S) 8. PERFORMING ORGANIZATION REPORT NO.
D.J. Dailey, S. Maclean, I. Pao
9. PERFORMING ORGANIZATION NAME AND ADDRESS 10. WORK UNIT NO.
Washington State Transportation Center (TRAC)University of Washington, Bx 354802 11. CONTRACT OR GRANT NO.
University District Building; 1107 NE 45th Street, Suite 535 Agreement T9903, Task 43Seattle, Washington 98105-463112. SPONSORING AGENCY NAME AND ADDRESS 13. TYPE OF REPORT AND PERIOD COVERED
Washington State Department of TransportationTransportation Building, MS 7370
Final research report
Olympia, Washington 98504-7370 14. SPONSORING AGENCY CODE
Project Manager: Gary Ray, 360-705-797515. SUPPLEMENTARY NOTES
This study was conducted in cooperation with the U.S. Department of Transportation, Federal HighwayAdministration.16. ABSTRACT
The Busview-X project constructed and demonstrated the use of an advanced publictransportation system (APTS) to show the viability of providing real-time transit information to transitriders. This project (1) designed an advanced graphical transit information system using data from KingCounty Metro Transit’s existing automatic vehicle location (AVL) system and the Puget Sound’sregional intelligent transportation systems (ITS) backbone; (2) created a World Wide Web page tolaunch the application; and (3) demonstrated the system’s viability by providing real-time transit coachlocations to personal workstations on the University of Washington campus.
As a precursor to an APTS for the Puget Sound region, Busview-X was designed to (1)provide real-time coach location information to the test group; (2) enhance King County Metro’sexisting investment in AVL technology without disrupting existing operations; (3) evaluate AVLaccuracy; (4) encourage increased ridership, modal change, and productivity; and (5) be compatiblewith federal efforts to develop a national ITS architecture. Busview-X was constructed in an opensystems model that supported a distributed computing environment. It used the X-windowing systemfor graphical support. Busview-X was used 2, 490 times over a period of 670 days from November1995 to September 1997.
During the Seattle Smart Trek Model Deployment Initiative, the ideas developed in the campus-based version of Busview-X were used to create a new version, Busview, that could be widelysupported on the Internet. Busview was written in the Java programming language so that graphicalrepresentation of transit information could be available anywhere on the Internet. The incorporation ofa graphical toolkit into Java and its inclusion in widely available WWW browsers allowed theresearchers to replace the X-window system with WWW browsers as the graphic user interface.
Both versions were well received by users. Comments from Buxview-X were used to improvethe design of Busview during the Smart Trek deployment. Refinements to Busview are ongoing.
17. KEY WORDS 18. DISTRIBUTION STATEMENT
Automatic vehicle location (AVL), positioning,transit, real-time data, Java applet
No restrictions. This document is available to thepublic through the National Technical InformationService, Springfield, VA 22616
19. SECURITY CLASSIF. (of this report) 20. SECURITY CLASSIF. (of this page) 21. NO. OF PAGES 22. PRICE
None None

i
Disclaimer
The contents of this report reflect the views of the authors, who are responsible for the
facts and accuracy of the data presented herein. The contents do not necessarily reflect the
official views or policies of the Washington State Transportation Commission, Department of
Transportation, or the Federal Highway Administration. This report does not constitute a
standard, specification, or regulation.

1
Table of Contents
1. Introduction ..........................................................................................................5
Busview-X ..................................................................................................................... 5Busview ......................................................................................................................... 6
2. System Architecture ............................................................................................7
2.1 Application from Components .................................................................................. 72.2 Graphical User Interface: Busview-X .................................................................... 10
Application Launch/Web Browser............................................................................. 11Map Support................................................................................................................. 13User Interface............................................................................................................... 13Source Code File Description ..................................................................................... 15
C files ..................................................................................................................................... 15Tcl files ................................................................................................................................... 16
2.3 Graphical User Interface: Busview......................................................................... 17Introduction.................................................................................................................. 17Window Menu.............................................................................................................. 17Maps Menu................................................................................................................... 18Options Menu............................................................................................................... 19Help Menu.................................................................................................................... 19Route Selection/Visual Filtering ................................................................................. 19Street Names................................................................................................................. 20Bus Location Icon........................................................................................................ 20Route Schedule............................................................................................................ 21Bus Progress................................................................................................................. 21Alarm Setting ............................................................................................................... 22Latest Data Arrival Time Display ............................................................................... 23
3. Usage Statistics and Survey Responses ........................................................25
3.1 Usage Statistics for Busview-X .............................................................................. 253.2 Survey Results for Busview-X ............................................................................... 263.3 Usage Statistics for Busview .................................................................................. 28
3.3.1 Use Statistics for Busview Applet Download .................................................. 293.3.2 Use Statistics for Busview Data Stream ........................................................... 32
3.4 User Comments on Busview .................................................................................. 34
4. Conclusion .........................................................................................................35
BIBLIOGRAPHY ......................................................................................................37
APPENDIX A: Busview-X Comments ...................................................................39
APPENDIX B: Busview Comments.......................................................................55
APPENDIX C: 1994 World Congress Paper .........................................................61
APPENDIX D: 1999 ITS America Paper .................................................................73

2
List of Figures
Figure 2.1 Data Flow and Architecture of Busview ................................................................. 8
Figure 2.2 Busview graphical user interface .......................................................................... 10
Figure 2.3 Busview Homepage .............................................................................................. 11
Figure 2.4 UW Affiliation Verification Page .......................................................................... 12
Figure 3.1 Numbers of Busview uses as a function of time ................................................... 25
Figure 3.2 Busview survey page ............................................................................................ 26
Figure 3.3 Users’ UW status .................................................................................................. 27
Figure 3.4 Frequency of transit use ........................................................................................ 27
Figure 3.5 JAR downloads by months ................................................................................... 28
Figure 3.6 Downloads by weeks ............................................................................................ 29
Figure 3.7 Downloads by day ................................................................................................ 29
Figure 3.8: Downloads by time of day .................................................................................... 30
Figure 3.9: Data stream connections by week ......................................................................... 32
Figure 3.10: Data Stream connections by day ......................................................................... 32
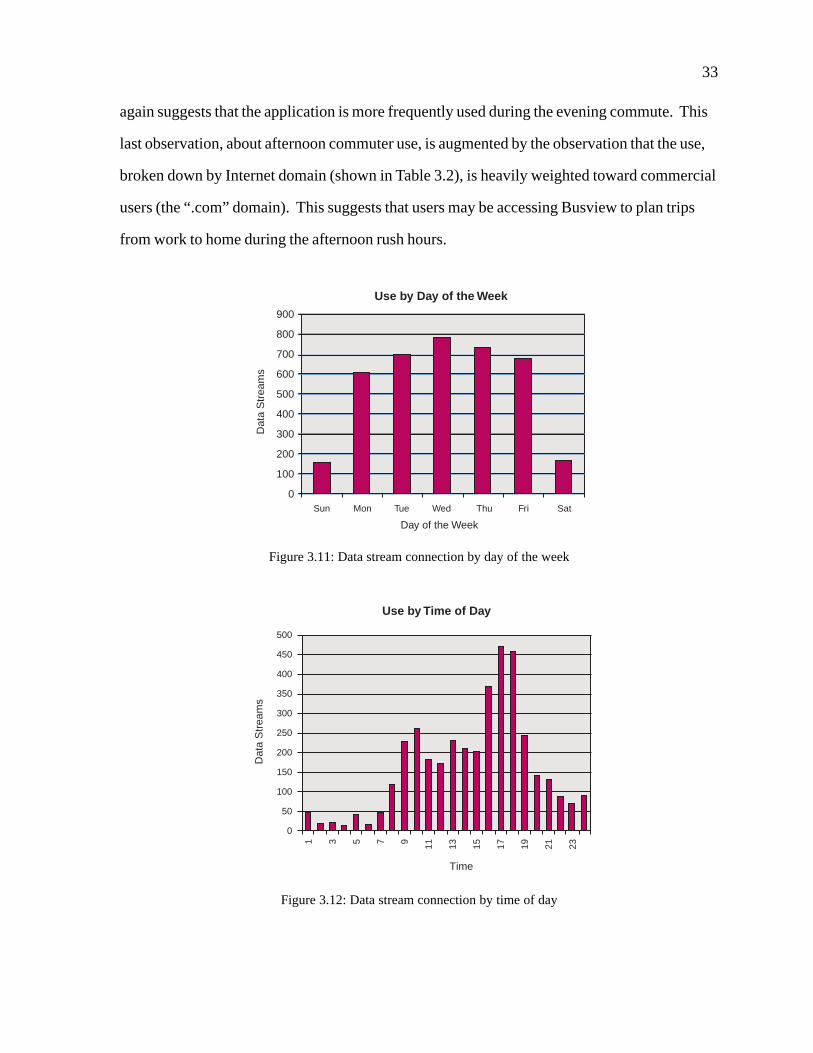
Figure 3.11: Data stream connection by day of the week ........................................................ 33
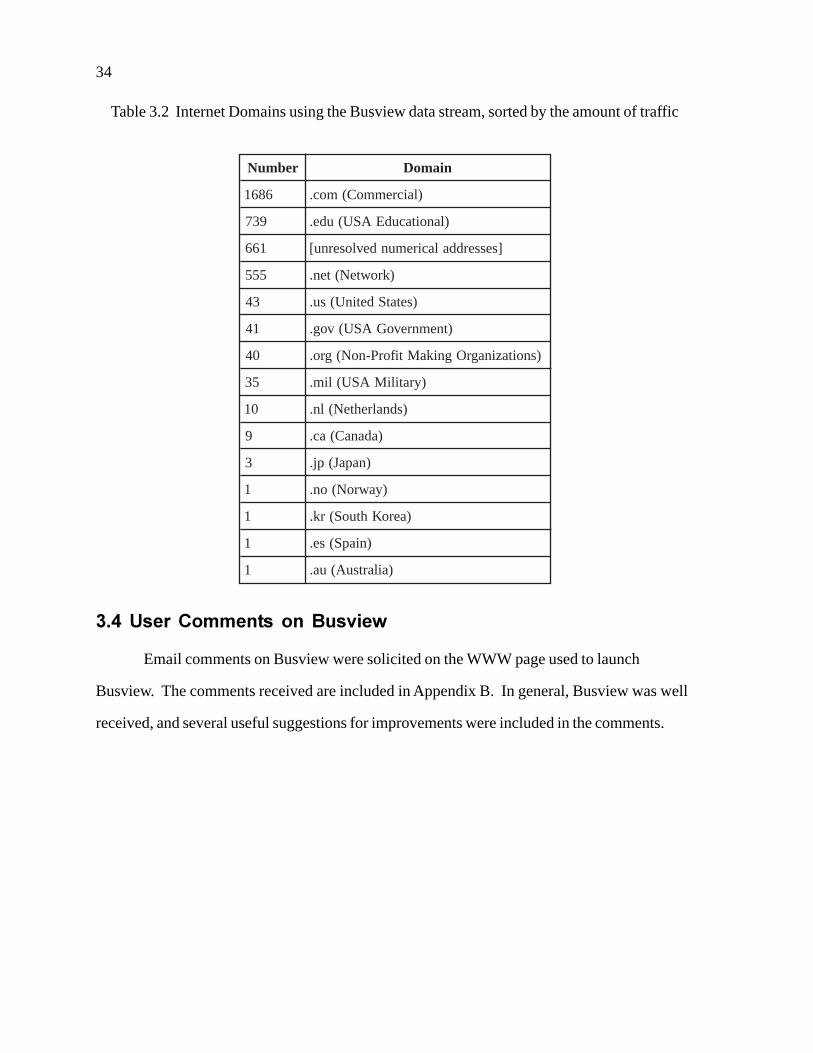
Figure 3.12: Data stream connection by time of day ............................................................... 33

3
List of Tables
Table 3.1 Internet Domains downloading the Busview applet,
sorted by the amount of trafic ................................................................................. 31
Table 3.2 Internet Domains using the Busview data stream,
sorted by the amount of traffic ................................................................................ 34

4

5
1. Introduction
This report describes two phases of the development of the Busview project. The first
phase was done as a research project and designed principally for University of Washington
campus users. The second phase was the construction of a Java applet to make an expanded
version of the information available to a regional audience. The report is effectively divided
into two major sections. The first section deals with the construction and use of an Advanced
Public Transportation System (APTS) as a demonstration of the viability of providing real-time
transit information to transit riders on the UW campus. The second section describes the
deployment of a Java application that was designed to be accessed from anywhere on the
Internet.
Busview-X
The Busview-X project designed and demonstrated a system that displayed real-time
transit coach locations on a digital map to the University of Washington campus community.
This project (1) designed an advanced graphical transit information system using data from
King Count Metro’s existing automatic vehicle location (AVL) system and the Puget Sound’s
regional intelligent transportation systems (ITS) backbone, (2) created a World Wide Web page
to launch the application, and (3) demonstrated the system’s viability by providing real-time bus
location information to individuals at their personal workstations.
As a precursor to an APTS for the Puget Sound region, this system was designed to (1)
provide real-time coach location information to the test group; (2) enhance Metro’s existing
investment in AVL technology without disrupting existing operations; (3) evaluate AVL
accuracy; (4) encourage increased ridership, modal change, and productivity; and (5) be
compatible with federal efforts to develop a national ITS architecture. BusView-X, was
constructed in an open systems model that supported a distributed computing environment. It
used the X-windowing system for graphical support.

6
The Busview application leveraged previous work performed in the Automatic Transit
Location System project, sponsored by the Washington State Department of Transportation, to
create a widely available application that would provide real-time transit information.
Busview
During the Seattle Smart Trek Model Deployment Initiative (MDI), the ideas
developed in the campus-based version of Busview-X were used to create a version that could
be widely supported on the Internet. Several technological changes made this wider
deployment possible. First, the Java programming language, which facilitates the “write once,
run anywhere” philosophy of software authorship, provided a medium that allowed graphical
representation of transit information to be made available anywhere on the Internet. Second,
World Wide Web (WWW) browsers that can download and execute a Java applet (an
interactive program that works inside Web browers on computers and other devices) allowed a
wider audience to access Busview. Finally, the incorporation of a graphical toolkit into Java
and its inclusion in widely available browsers allowed us to replace the X-window system with
WWW browsers as the graphical user interface (GUI). Java in browsers means that powerful
GUI support is available on users’ computers at no cost to the user. This set the stage for
deploying a working version of Busview that could reach into the individual commuter’s home
and work environments.

7
2. System Architecture
Both versions of the Busview application were built with the component architecture
described in Dailey et al [1]. In this model, the GUI is only one component of the application.
The component model includes the notion of a data stream flowing sequentially through a
series of components that perform data fusion activities on the data stream. The last component
in the stream is the GUI . The Busview project focused on the component that the user
touches, the GUI (often thought of as the application in other environments), and leveraged the
existence of the components from a previous project [2]. This chapter overviews the total
application by briefly considering the non-GUI components. It then focuses on the two types
of GUI components used in the two stages of the project.
2.1 Application from Components
Busview is a distributed application created within the framework described in Dailey
et al [1]. This framework identifies four component types: Source, Redistributor, Operator and
Sink, and the Busview application uses all four types.
Busview, shown in Figure 2.1, uses a transit carrier’s automatic vehicle location (AVL)
system as the sensor for the Source component. In this case, the Source component (labeled
AVLUW) eavesdrops on communication between components of a proprietary AVL system
used by the transit carrier’s operations staff to measure schedule adherence and to provide
traffic managers with coach locations in the event of an incident. The data in this case are
distance along a planned path, which, with knowledge of the routes and several coordinate
transformations, can be used to estimate location.
AVL_AVLUW is an Operator component located on a computer in the AVL operations
center of the transit carrier. It limits the information that can leave the agency’s operations
center. In this case, numerical identification of the driver is in the data received by AVLUW but
is removed for privacy reasons before the data are allowed out of the physical control of the

8
transit agency. This component is also behind the firewalls protecting the transit AVL system
from Internet users. Once again, this Operator component provides for network security and
agency autonomy, as well as removal of information from the data stream.
The raw data, a distance along a known path, are multiplexed by a Redistributor
(labeled AVL_Rebroadcast). AVL_Rebroadcast multiplexes the original data to make these raw
data widely available.
The data from AVL_Rebroadcast are passed to an Operator (labeled AVL_Trip), which
uses information in the AVL data packet to associate a specific vehicle with a specific trip in the
transit schedule. The data from the AVL system arrive at an average rate of 11 coaches per
second, and a 20,000-record database of scheduled trips is searched for each coach to obtain
the corresponding schedule information. This trip information is added to the record for each
coach and made available to the downstream clients.
Figure 2.1 Data Flow and Architecture of Busview
Data Source
State and Connection Maintenance
Schedule Information
Geolocating the Vehicles
Multiplexing the Data Stream
ApplicationFormatting
METRO AVL
AVL_Trip
AVL_Position
AVL_Fanout
AVL_ITS
BusviewBusviewBusview
AVL_Rebroadcast
AVL_AVLUW

9
The data from AVL_Trip are passed to an Operator (labeled AVL_Position), which can
use the data, information about planned routes, digital maps, and coordinate transformations to
calculate a latitude and longitude value for the transit (probe) vehicles. The calculation of
position requires (1) identifying the particular coordinate lists in one of 2,500+ files that
represent every possible vehicle route, (2) selecting the segment within the list on which the
vehicle is estimated to exist, and (3) using a Newton’s method to perform an inverse Lambert
projection from the proprietary coordinate system of the AVL system, at a rate of 11 vehicles
per second. We designed into our approach the possibility of components operating on
independent CPUs so that we can select a CPU of appropriate power for each of the individual
tasks. This Operator, for example, takes the entire resources of one computer to keep up with
the data flow, and therefor it does not coexist on a CPU with the other Operators in these
examples.
Downstream of the AVL_Position server is a Redistributor labeled AVL_Fanout, which
multiplexes the data stream containing the vehicle positions to a variety of users. In addition to
performing the positioning solution, this Redistributor frees the upstream process from
multiplexing.
The server component labeled AVL_Its creates a very customized data stream for the
Busview presentation. The connection between this server and the Busview sink can
potentially be over slower media. This component minimizes the amount of data that need be
sent per update of each transit vehicle on the Busview screen. A digital map and the vehicle
location information, along with schedule information, are displayed graphically on the
Busview screen, creating an information system for transit riders. The Busview graphical user
interface shown in Figure 2.2 operates in an X-Window environment. It is a distributed
application example created within the ITS framework [1]. The Busview GUI produces a
representation of map data on an X-terminal that may be located anywhere on the Internet.
10
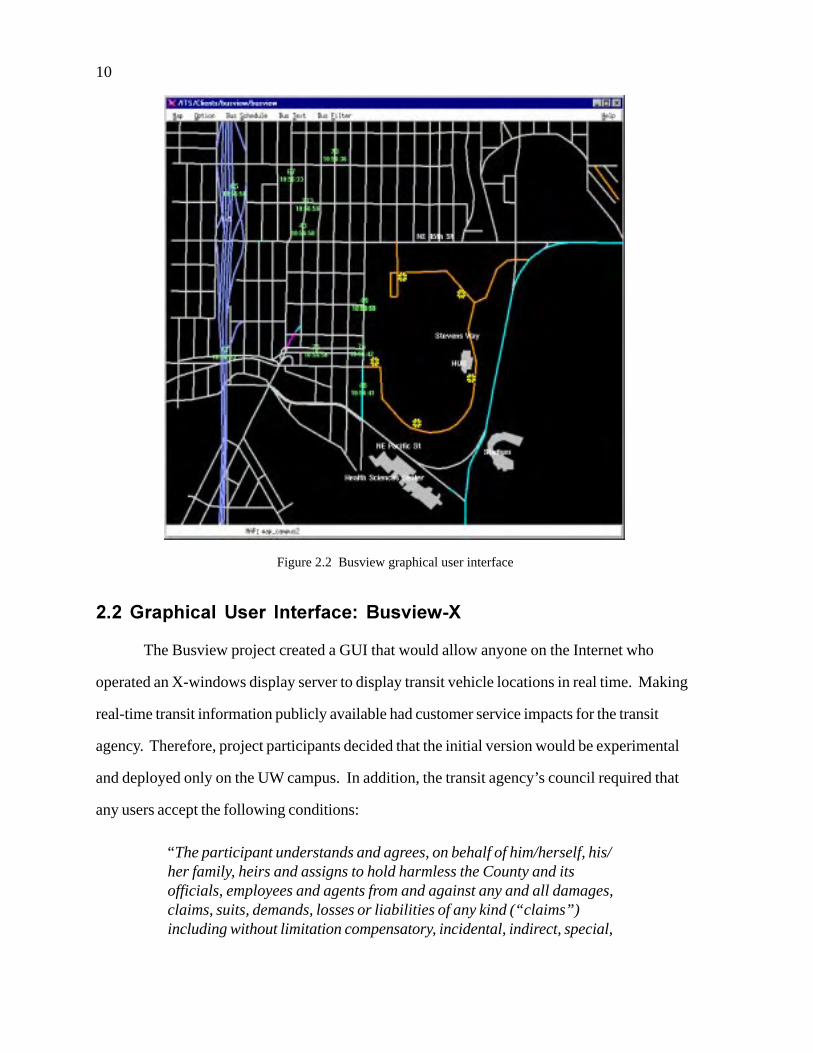
Figure 2.2 Busview graphical user interface
2.2 Graphical User Interface: Busview-X
The Busview project created a GUI that would allow anyone on the Internet who
operated an X-windows display server to display transit vehicle locations in real time. Making
real-time transit information publicly available had customer service impacts for the transit
agency. Therefore, project participants decided that the initial version would be experimental
and deployed only on the UW campus. In addition, the transit agency’s council required that
any users accept the following conditions:
“The participant understands and agrees, on behalf of him/herself, his/her family, heirs and assigns to hold harmless the County and itsofficials, employees and agents from and against any and all damages,claims, suits, demands, losses or liabilities of any kind (“claims”)including without limitation compensatory, incidental, indirect, special,

11
consequential, or exemplary damages, or loss of any goodwill, whicharise out of any interruption, failures or errors in the provision of data,information or any items under this Agreement, or the inability to useany such data, information or items, irrespective of whether the Countyhas been informed of, knew of, or should have known of the likelihoodof such claims. This limitation applies regardless of whether such claimsare based on breach of contract, breach of warranty, negligence, strictliability, misrepresentation or any other legal or equitable theory.”
Application Launch/Web Browser
To facilitate the use of the Busview application, a World Wide Web (WWW) page was
created to launch the X-windows application (see Figure 2.3). The first WWW page required
the user to acknowledge the conditions of use required by the transit agency. A subsequent
Figure 2.3 Busview Homepage
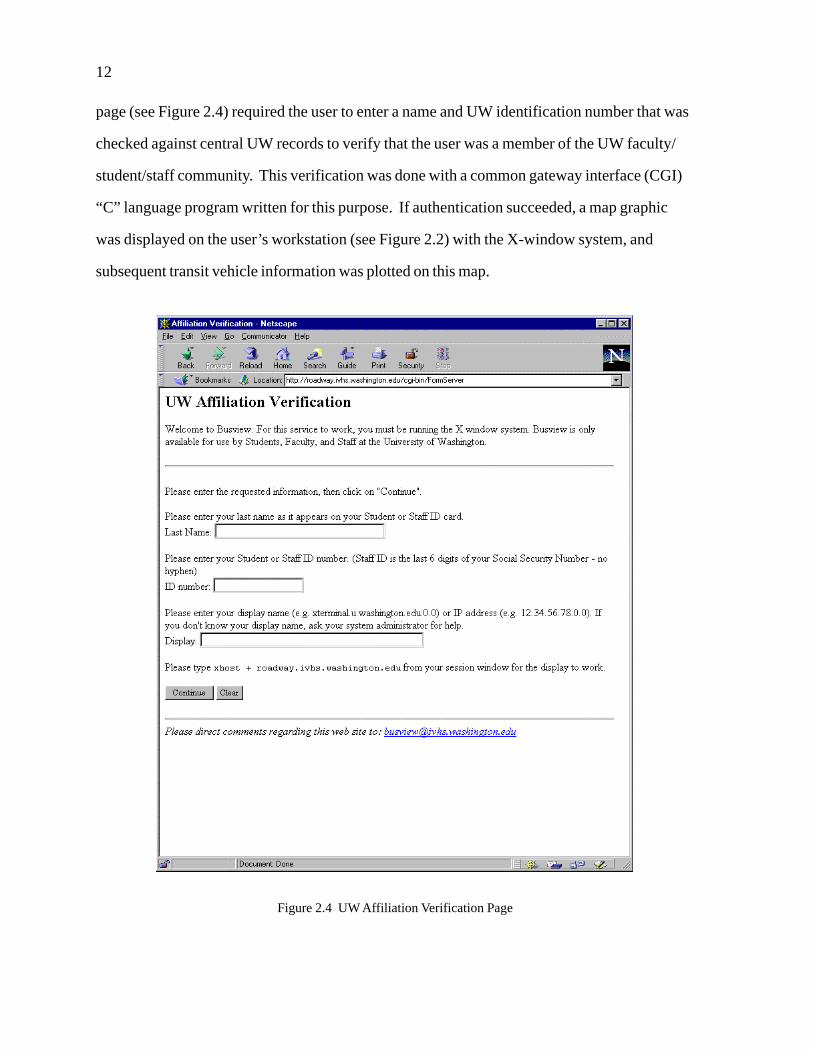
12
page (see Figure 2.4) required the user to enter a name and UW identification number that was
checked against central UW records to verify that the user was a member of the UW faculty/
student/staff community. This verification was done with a common gateway interface (CGI)
“C” language program written for this purpose. If authentication succeeded, a map graphic
was displayed on the user’s workstation (see Figure 2.2) with the X-window system, and
subsequent transit vehicle information was plotted on this map.
Figure 2.4 UW Affiliation Verification Page

13
Map Support
The map database for this project was derived from a digital map created by the King
County Metro GIS division. The geo-location data about roadways were converted from the
METROKC format (ASCII) to a data structure developed in this project and stored as a much
smaller binary file. The Busview display application used this locally developed binary file
structure to create the map graphic. The data format was converred for two reasons: (1) the
structure of the binary information improved the speed of accessing items that were part of the
map, and (2) the structure reduced the memory requirements placed on the display client when
the system displayed either maps of a large area or maps containing a high density of
information (e.g., an urban area with all the streets, arterials, and highways).
User Interface
The Busview client read a binary map file and displayed the map on an X-terminal
whose address was determined at the bottom of the Web page shown in Figure 2.2. Real-time
transit vehicle locations were obtained by establishing a connection to the AVL_IVHS
information server component shown in Figure 2.1. The transit vehicles were represented by
an icon containing the service route number and time stamp indicating when the transit vehicle
was observed at the location shown. When a vehicle was observed more than once, an arrow
was added to the icon to indicate direction.
In addition to the transit service route number, the user interface provided some simple
GIS functions, such as
• selection of different areas (UW campus and downtown Seattle)• zoom in• point to a feature and get information (street names and bus schedules)• adjust the bus text font shown in the map• select the bus route numbers.
The menu bar displayed all the available functions supported by the Busview system.
Each of these menu bar items had a pull-down menu. For example, the Map menu had the
following:

14
• Open - This selection opened a new display of the map files. Userscould choose a map of either the UW campus or the downtown area.
• Exit - This selection exited the Busview program.
The Option menu had the following:
• Zoom - This option allowed users to zoom in on a specific area of themap by creating a rectangular area. Users could return to a largerviewing area by refreshing the screen with the Open selection under theMap pull-down menu.
• St Name - This option produced a pop-up screen that allowed users toplace street names on the map.
The Bus Schedule menu allowed access to the static schedule information through a
Routes pull down:
• Routes - Users could display a printed time schedule for a specific busroute. Following the arrows to the right of each category narrowed theselection, and the schedule appeared in another window on the screen.Users could also produce a time schedule for a bus route by clickingdirectly on the bus number where it appeared on the map.
The Bus Text menu item selected the font sizes for the text in the icon representing the
transit vehicle:

15
• Normal - This was the default option for displaying the bus numbers onthe map. The numbers were shown in 12 pixels format.
• Large - This option allowed the bus numbers to be displayed in a largertype format of 18 pixels.
Finally, the Bus Filter menu item allowed users to select which transit service route
would appear on the map display:
• All Buses - This was the default selection and displayed all buses thatwere transmitting location information.
• Manual Selection - This option narrowed the display to specific busroutes. A pop-up screen allowed users to enter a route number and thenclick on the Add button to create a custom list of routes to view.Clicking on the OK button displayed them on the map.
• Edit Buslist - This option either added or removed bus routes after a listhad been created with the Manual Selection option.
Source Code File Description
This section describes each of the source files (written in the C and Tcl/Tk languages)
that, along with the Makefile that controlled the compilation and linking of the applications,
made up the software developed for the Busview-X client system.
Tcl/Tk was used to build the Busview-X client system because it is a powerful
programming environment for creating graphical user interfaces. Tcl stands for Tool Command
Language, and Tk is its associated X-windows toolkit. Tcl/Tk provides a rapid development
environment and many sophisticated built-in features. The communication and map retrieval
portions of Busview were implemented in the C language, and the GUI portion was
implemented in the Tcl/Tk language.
C files
main.c: This ws the central routine for the Busview client system. Thisroutine created a Tcl interpreter and defined Tcl commands for theBusview application.
rdbf.c: This routine read binary map data from a file to memory.draw.c: This file contained subroutines to process events, such as resize and
zoom-in, as well as to draw or redraw when needed.
16
socket.c: This routine handled the communication with the AVL_IVHS serversystem to get the real-time Metro transit vehicle locations.
bus.c: This routine processed the data received from the AVL_IVHS server.It decided whether the bus was in or out of the map area. It alsotransformed the latitude and longitude of the bus location into thecoordinate system used for the display.
street.c: This routine searched the map database and returned the name of thestreet that had been selected by the user.
Tcl files
map.tcl: This file containd the initial setup of the Busview-X system display,such as window height, window width, foreground and backgroundcolor, menubar location, and contents of the menubar.
bus.tcl: This file contained the routines to display the bus route number, timestamp, and bus direction on the map. It also contained the routine toremove vehicles that no longer appear in the data stream.
bussize.tcl: This routine resized the bus route number font.businfo.tcl: This routine showed the bus schedule selected by the user.buslist.tcl: This routine created the list of routes the user wished to see on the
map.help.tcl: This routine contained the help contents for the Busview application.street.tcl: This routine showed the street name selected by the user.landmark.tcl: This routine displayed the landmarks (buildings, hospital, and
stadium) on the map.zoom.tcl: This file included subroutines to select a sub-map from an existing
map window and create a new map based on the subarea selected. Itused rubber lines when selecting a sub-area from the map window.

17
2.3 Graphical User Interface: Busview
Introduction
The image above is a generic screen shot of the Busview applet showing the default
map of the University of Washington campus. Users can select another location from maps
that cover the King County area. Each black and white icon on the map represents a different
bus moving along its route. In the upper right corner is a time display that shows the last time
the Busview applet received data. The route selection box at the top allows users to limit the
number of bus routes being displayed on the map.
Window Menu
There are three options under the Window menu: new, close, and exit. The “new”
option allows a user to have multiple windows open for various locations. By choosing “new”
and then selecting a different location from the Maps menu, a user can create as many maps as
18
needed. The “close” option closes the current window. The “exit” option closes all open
windows, thus shutting Busview down completely.
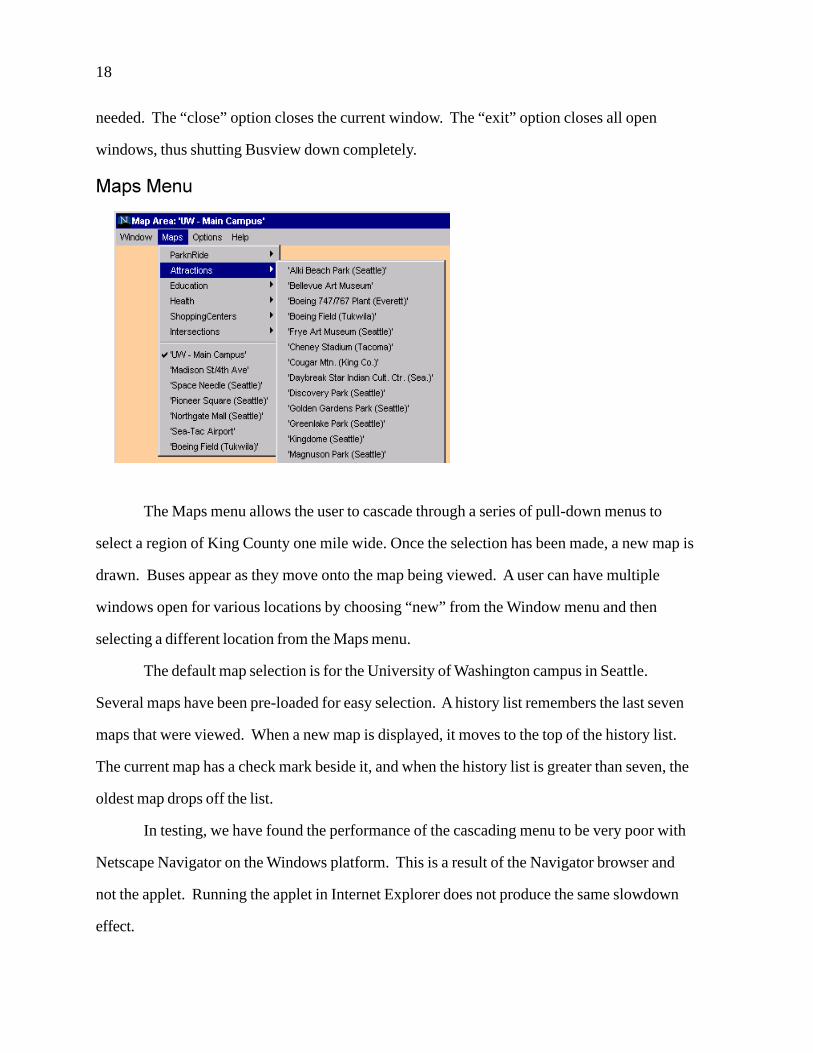
Maps Menu
The Maps menu allows the user to cascade through a series of pull-down menus to
select a region of King County one mile wide. Once the selection has been made, a new map is
drawn. Buses appear as they move onto the map being viewed. A user can have multiple
windows open for various locations by choosing “new” from the Window menu and then
selecting a different location from the Maps menu.
The default map selection is for the University of Washington campus in Seattle.
Several maps have been pre-loaded for easy selection. A history list remembers the last seven
maps that were viewed. When a new map is displayed, it moves to the top of the history list.
The current map has a check mark beside it, and when the history list is greater than seven, the
oldest map drops off the list.
In testing, we have found the performance of the cascading menu to be very poor with
Netscape Navigator on the Windows platform. This is a result of the Navigator browser and
not the applet. Running the applet in Internet Explorer does not produce the same slowdown
effect.

19
Options Menu
Currently, only one option is available under this menu. This option toggles the vehicle
identification number (VIN) on and off for the bus location icon. The VIN is a number that is
painted on the back and top of each bus. As other options are available, they will be listed
under this pull-down menu.
The image on the left shows the bus location icon with the VIN on, and the second
image shows it with the VIN off. The default for the main maps is for the VIN to be off.
When the bus progress bar is being viewed, the VIN is always on. This allows the user to
track the correct bus along an entire route.
Help Menu
Choosing “Busview Help” links the user’s browser to this Web page. Choosing
“About Busview” displays the Busview version number.
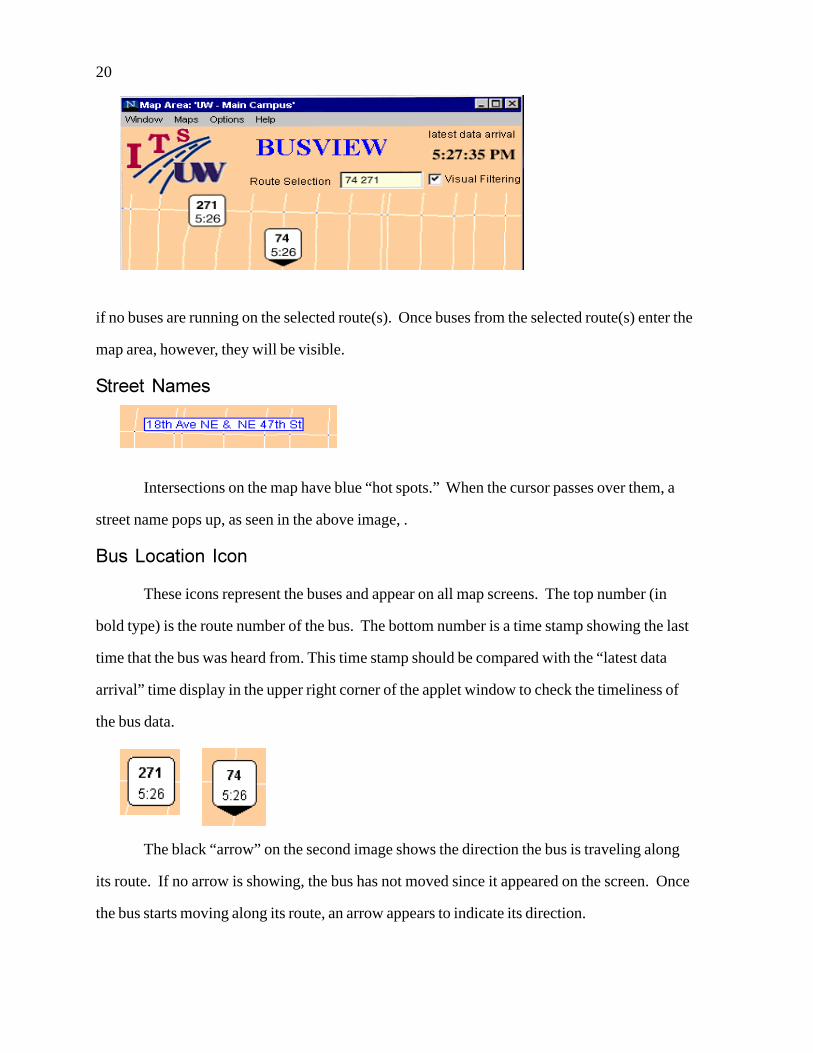
Route Selection/Visual Filtering
Users can select which bus routes to view by checking the “Visual Filtering” box and
entering one or more bus routes separated either by commas or spaces. This will filter out other
bus routes, allowing users to monitor only routes of immediate interest. In the image below,
two routes have been entered in the “Route Selection” box. This may produce a blank screen
20
if no buses are running on the selected route(s). Once buses from the selected route(s) enter the
map area, however, they will be visible.
Street Names
Intersections on the map have blue “hot spots.” When the cursor passes over them, a
street name pops up, as seen in the above image, .
Bus Location Icon
These icons represent the buses and appear on all map screens. The top number (in
bold type) is the route number of the bus. The bottom number is a time stamp showing the last
time that the bus was heard from. This time stamp should be compared with the “latest data
arrival” time display in the upper right corner of the applet window to check the timeliness of
the bus data.
The black “arrow” on the second image shows the direction the bus is traveling along
its route. If no arrow is showing, the bus has not moved since it appeared on the screen. Once
the bus starts moving along its route, an arrow appears to indicate its direction.

21
At times, some bus icons may be partially hidden because of the number of buses
showing on the screen. Clicking on a bus location icon will bring up four additional options.
The last two options, “To Front” and “To Back,” allow the user to choose which icon to view.
In the images above, clicking on “To Front” will bring the selected bus icon to the top of the
stack, and choosing “To Back” will send it to the bottom of the stack.
Route Schedule
After clicking on a bus location icon, one option is “Route Schedule,” as shown above.
Selecting this option links the user’s browser to the Metro bus schedule for that bus route.
Bus Progress
After a bus location icon has been selected, the “Bus Progress” option allows the user
to see a visual, linear representation of the chosen bus route with the coach location(s) along it.
The blue arrows represent intersections and work the same as the intersection hot spots on the
main display. When the cursor passes over an intersection, the intersection’s name pops up for
viewing, and the corresponding arrow turns red.

22
Buses move from left to right on the screen. The beginning and ending points for the
route are listed both at the ends of the blue “roadway” and at the top of the window bar.
Alarm Setting
An alarm can be set along any progress bar by clicking on the blue “roadway.” The
alarm notifies users when a bus has passed a particular point on the route. This allows users to
better estimate their departure time when catching a bus. Since the buses move from left to
right, the alarm must be set to the right of the chosen bus to be effective. Only one alarm may
be set on each progress bar. After the roadway is clicked , an alarm clock will show on the
screen, along with information about where it has been set, as seen in the image above.
Once the bus has reached the alarm setting, a notification window appears (see below).
The alarm also emits an audible reminder when the bus passes. The “Alarm Setting” in the
progress window is then set to “off.” The alarm will not go off again if another bus on the
progress bar reaches the alarm location. Manually setting the alarm status to “on” will re-prime
the alarm and produce further notifications.

23
Latest Data Arrival Time Display
The time display in the upper right of the window shows when data were last received
by the Busview applet. Information comes approximately every second. Data packets do not
contain information on every bus, as new data are available for each bus approximately every
minute. Comparing the time display to the time on a bus icon helps indicate the timeliness of
the information. If the disparity between the two times is large (i.e., the bus time is 2:55 and
the display time is 3:00), then the bus information is out of date. The icon shows the last
KNOWN position of a bus, and until the bus sends more data, the image is stationary. As a
result, the buses appear to “hop” across the screen. Busview presently shows only current data
and makes no attempt to predict bus locations.

24
25
350
300
250
200
150
100
50
0
1995
Nov
1996
Jan
1996
Mar
1996
May
1996
Jul
1996
Sep
1996
Nov
1997
Jan
1997
Mar
1997
May
1997
Jul
1997
sep
Time
Num
ber
of B
usvi
ew U
sers
3. Usage Statistics and Survey Responses
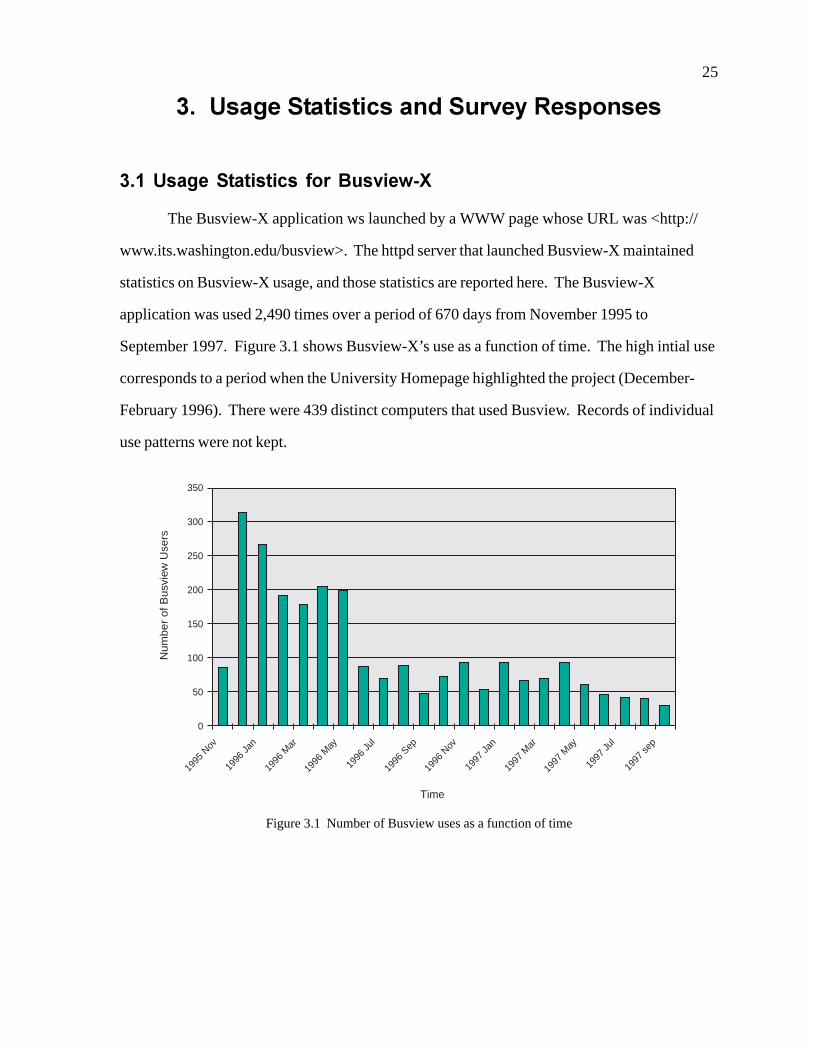
3.1 Usage Statistics for Busview-X
The Busview-X application ws launched by a WWW page whose URL was <http://
www.its.washington.edu/busview>. The httpd server that launched Busview-X maintained
statistics on Busview-X usage, and those statistics are reported here. The Busview-X
application was used 2,490 times over a period of 670 days from November 1995 to
September 1997. Figure 3.1 shows Busview-X’s use as a function of time. The high intial use
corresponds to a period when the University Homepage highlighted the project (December-
February 1996). There were 439 distinct computers that used Busview. Records of individual
use patterns were not kept.
Figure 3.1 Number of Busview uses as a function of time

26
3.2 Survey Results for Busview-X
A survey was displayed after the Busview-X application was launched. Respondents
were free to respond to any or all of the questions in the survey instrument, shown in Figure
3.2. The first question requested an email address; question two requested their UW status
(faculty/student/staff); and question three inquired about their transit use pattern. A total of 115
Figure 3.2 Busview survey page

27
responded to the request for UW status. Of these, the majority were students, half as many
were staff, and a small percentage were faculty, as shown in Figure 3.3. A total of 217 users
responded to question three concerning the frequency of transit use, and Figure 3.4 indicates
that the majority of the people interested enough to use the application were regular transit
users. It is noteworthy that the users were not forced to fill in a survey, and so, of the 2,490
uses by 439 individuals, we received a 26 percent response-per-user rate (115) to the status
reports and a 49 percent response-per-user rate (217) to the transit frequency use reports.
Clearly, many of the uses did not result in survey information.
Figure 3.3 Users’ UW status
Figure 3.4 Frequency of transit use
70
60
50
40
30
20
10
0
student faculty staff
Status
Num
ber
com
plet
ed
Every day 3-5 times 1-2 times less than once
frequency of transit use during week
num
ber
of u
sers
160
140
120
100
80
60
40
20
0
28
In addition to the specific items above, we asked the users three open-ended questions:
1) Are the areas of coverage and map elements sufficient?2) Are the elements easy to identify and understand?3) What, if anything, did you use them for, and how well did they work?4) Other comments.
The comments from the users are included in Appendix A.
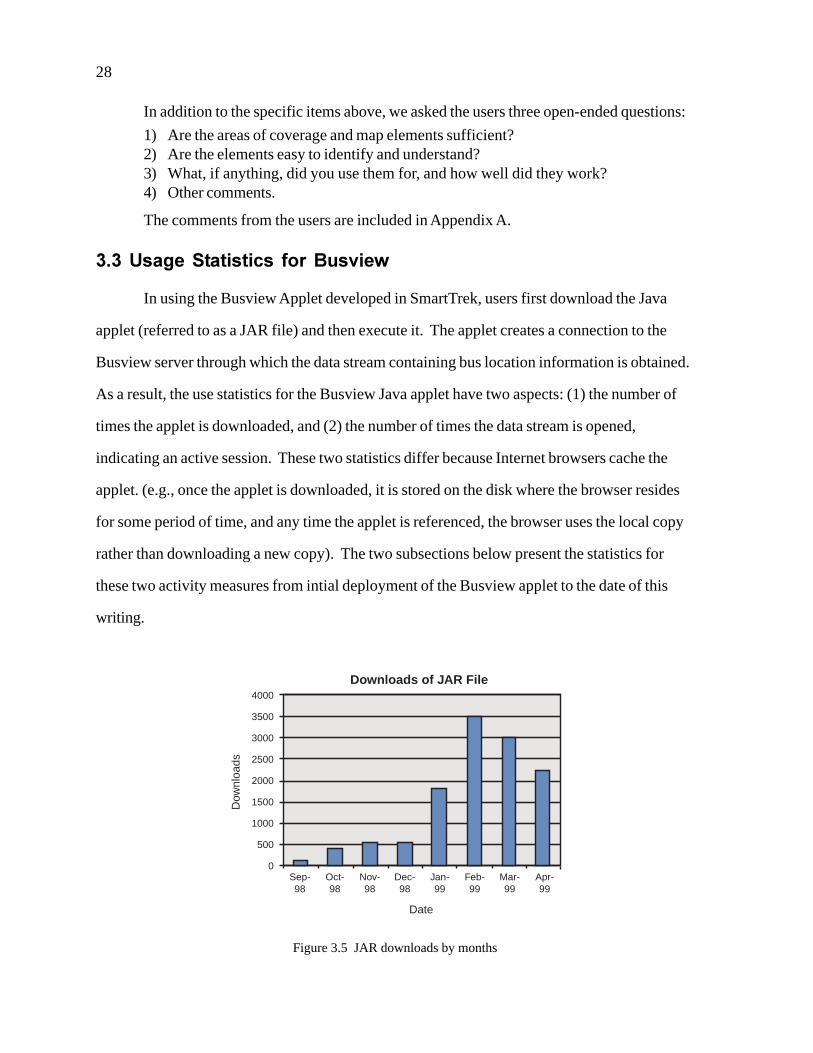
3.3 Usage Statistics for Busview
In using the Busview Applet developed in SmartTrek, users first download the Java
applet (referred to as a JAR file) and then execute it. The applet creates a connection to the
Busview server through which the data stream containing bus location information is obtained.
As a result, the use statistics for the Busview Java applet have two aspects: (1) the number of
times the applet is downloaded, and (2) the number of times the data stream is opened,
indicating an active session. These two statistics differ because Internet browsers cache the
applet. (e.g., once the applet is downloaded, it is stored on the disk where the browser resides
for some period of time, and any time the applet is referenced, the browser uses the local copy
rather than downloading a new copy). The two subsections below present the statistics for
these two activity measures from intial deployment of the Busview applet to the date of this
writing.
Figure 3.5 JAR downloads by months
Sep-98
Oct-98
Nov-98
Dec-98
Jan-99
Feb-99
Mar-99
Apr-99
Date
4000
3500
3000
2500
2000
1500
1000
500
0
Dow
nloa
ds
Downloads of JAR File
29
3.3.1 Use Statistics for Busview Applet Download
Statistics for downloading the Busview applet (a JAR file) were collected from
September 1998 to April 1999. Over that period, there were 12,300 successful downloads,
averaging 53 per day. These requests were made from 6,115 distinct hosts. The download rate
changed with time as the applet was discovered and used. In Figure 3.5, the downloads as a
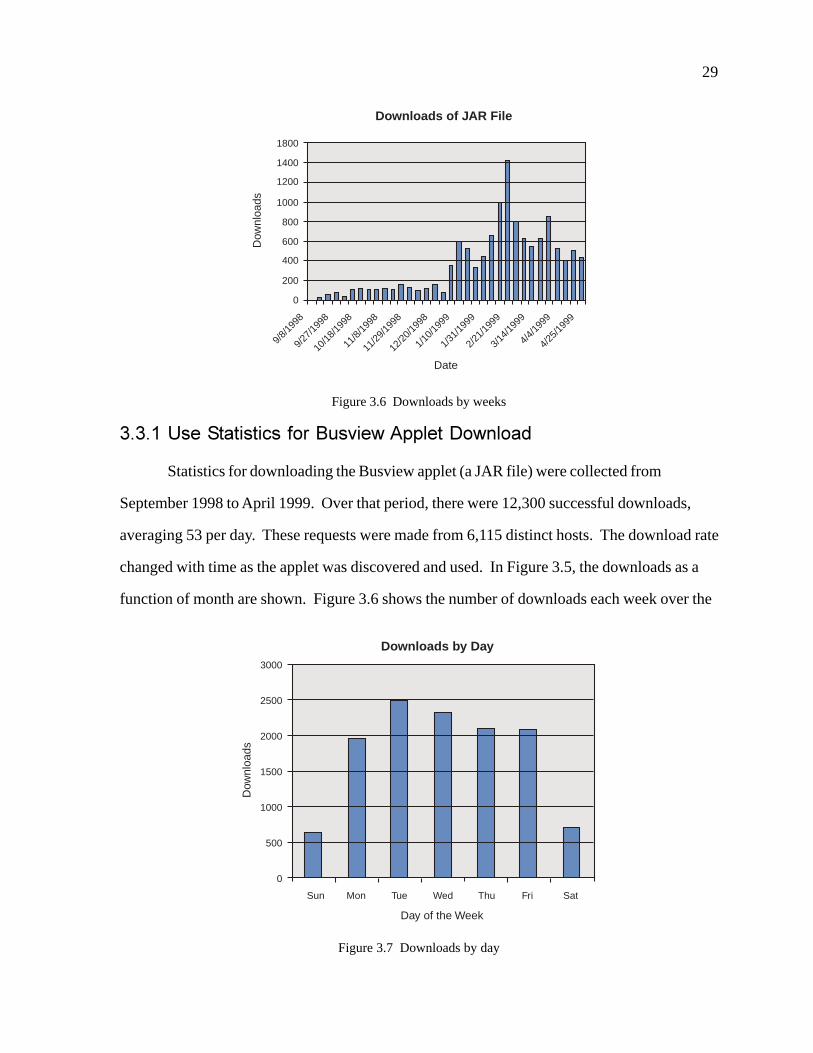
function of month are shown. Figure 3.6 shows the number of downloads each week over the
Figure 3.6 Downloads by weeks
Figure 3.7 Downloads by day
Downloads of JAR File
1800
1400
1200
1000
800
600
400
200
0
Dow
nloa
ds
9/8/
1998
9/27
/199
8
10/1
8/19
98
11/8
/199
8
11/2
9/19
98
Date
12/2
0/19
98
1/10
/199
9
1/31
/199
9
2/21
/199
9
3/14
/199
9
4/4/
1999
4/25
/199
9
Sun Mon Tue Wed Thu SatFri
Day of the Week
Dow
nloa
ds
3000
2500
2000
1500
1000
500
0
Downloads by Day

30
reporting period. It is noteworthy that two events seem to be reflected in the use pattern: (1) a
link to Busview appeared on the site <http://www.scripting.com>, a popular site among
programmers, on February 23, 1999, and (2) signs appeared on Metro buses around March 31,
1999. Both of these events seem to have increased use immediately afterward. Figure 3.7
shows the use by day of week, indicating that the applet is more heavily used during the work
week than on weekends. Figure 3.8 shows the downloads by time of day and suggests that the
application is more frequently used during the evening commute. This last observation, about
afternoon commuter use, is augmented by the observation that the use, broken down by
Internet domain (shown in Table 3.1), is heavily weighted toward commercial users (the
“.com” domain). This suggests that users may be using Busview to plan trips from work to
home during the afternoon rush hours.
Figure 3.8: Downloads by time of day
Downloads by Time of Day
Dow
nloa
ds
1400
1200
1000
800
600
400
200
0
1 3 5 7 9 11 13 15 17 19 21 23

31
Table 3.1 Internet Domains downloading the Busview applet, sorted by the amount of traffic
rebmuN niamoD
4624 )laicremmoC(moc.
1952 )lanoitacudEASU(ude.
7932 ]sesserddalaciremundevlosernu[
0622 )krowteN(ten.
372 )sdnalrehteN(ln.
631 )setatSdetinU(su.
521 )snoitazinagrOgnikaMtiforP-noN(gro.
68 )tnemnrevoGASU(vog.
03 )adanaC(ac.
12 )napaJ(pj.
91 )nedewS(es.
91 )modgniKdetinU(ku.
01 )ynamreG(ed.
9 )yratiliMASU(lim.
9 )ailartsuA(ua.
7 )muigleB(eb.
6 )eropagniS(gs.
7 )gnoKgnoH(kh.
4 )niapS(se.
4 )kramneD(kd.
5 )dnalniF(if.
5 )ylatI(ti.
3 )dnalaeZweN(zn.
2 )dnalerI(ei.
1 )rataQ(aq.
1 )aeroKhtuoS(rk.
1 )anitnegrA(ra.
1 )dnalecI(si.
1 )airtsuA(ta.
1 )nawiaT(wt.
1 )ocixeM(xm.
1 )dnaliahT(ht.

32
3.3.2 Use Statistics for Busview Data Stream
Statistics for the use of the Busview data stream are available from April 1, 1999. This
section summarizes the use of the data stream from April 1, 1999 to May 1, 1999. During the
month of April, there were 3,826 successful uses of the data stream, averaging 153 uses per
day by 1,386 distinct computers. Figure 3.9 shows the number of uses each week over the
reporting period. Figure 3.10 shows the number uses each day for the reporting period. Figure
3.11 shows the use by day of week, indicating that the applet is more heavily used during the
work week than on weekends. Figure 3.12 shows the data stream usage by time of day, and
Figure 3.9: Data stream connections by week
Figure 3.10: Data Stream connections by day
Use by Week1400
1200
1000
800
600
400
200
0
Dat
a S
trea
ms
Date
4/4/1999 4/11/1999 4/18/1999 4/25/1999
4/5/
1999
4/7/
1999
4/9/
1999
4/11
/199
9
4/13
/199
9
4/15
/199
9
4/17
/199
9
4/19
/199
9
4/21
/199
9
4/23
/199
9
4/25
/199
9
4/29
/199
9
4/27
/199
9
300
250
200
150
100
50
0
Dat
a S
trea
ms
Date
Use by Day
33
again suggests that the application is more frequently used during the evening commute. This
last observation, about afternoon commuter use, is augmented by the observation that the use,
broken down by Internet domain (shown in Table 3.2), is heavily weighted toward commercial
users (the “.com” domain). This suggests that users may be accessing Busview to plan trips
from work to home during the afternoon rush hours.
Figure 3.11: Data stream connection by day of the week
Figure 3.12: Data stream connection by time of day
Sun Mon Tue Wed Thu Fri Sat
Day of the Week
Dat
a S
trea
ms
900
800
700
600
500
0
300
400
200
100
Use by Day of the Week
500
450
400
350
300
250
200
150
100
50
0
1 3 5 7 9 11 13 15 17 19 21 23
Time
Dat
a S
trea
ms
Use by Time of Day
34
Table 3.2 Internet Domains using the Busview data stream, sorted by the amount of traffic
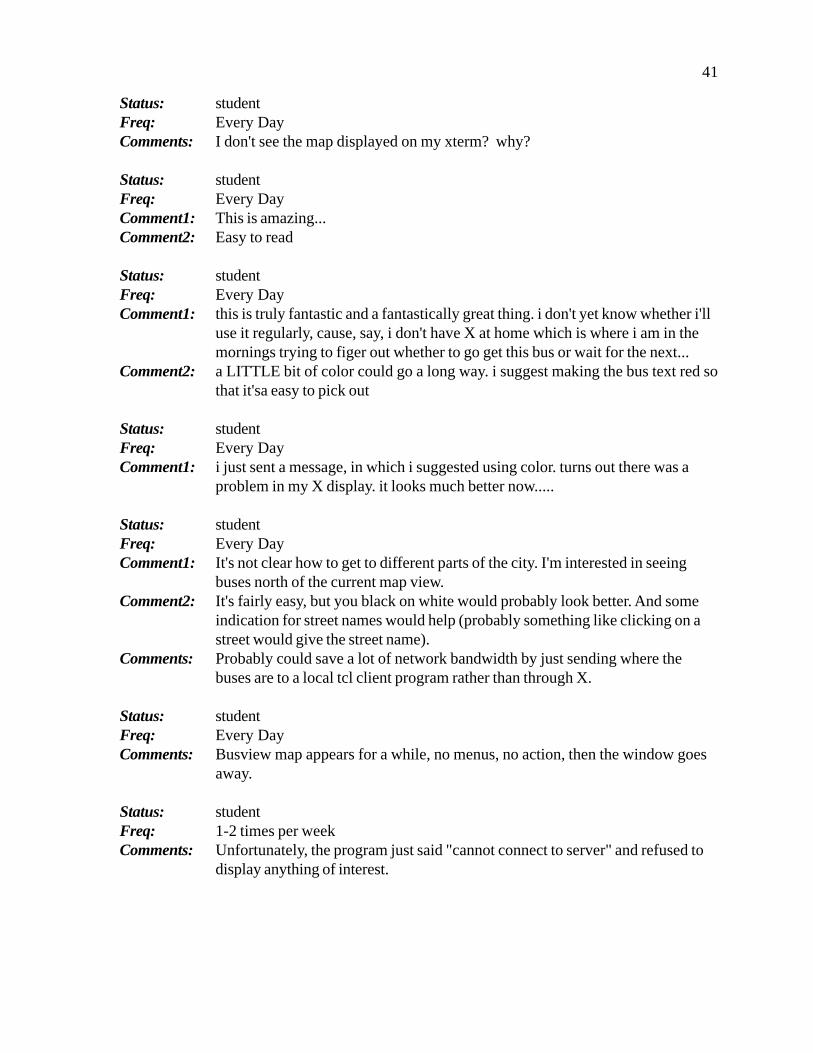
3.4 User Comments on Busview
Email comments on Busview were solicited on the WWW page used to launch
Busview. The comments received are included in Appendix B. In general, Busview was well
received, and several useful suggestions for improvements were included in the comments.
rebmuN niamoD
6861 )laicremmoC(moc.
937 )lanoitacudEASU(ude.
166 ]sesserddalaciremundevlosernu[
555 )krowteN(ten.
34 )setatSdetinU(su.
14 )tnemnrevoGASU(vog.
04 )snoitazinagrOgnikaMtiforP-noN(gro.
53 )yratiliMASU(lim.
01 )sdnalrehteN(ln.
9 )adanaC(ac.
3 )napaJ(pj.
1 )yawroN(on.
1 )aeroKhtuoS(rk.
1 )niapS(se.
1 )ailartsuA(ua.

35
4. Conclusion
Both Busview versions were well received by users. Comments from Busview-X were
used to improve the design of Busview during the SmartTrek deployment. Refinements to
Busview are ongoing in response to the comments received through the SmartTrek program.
Increased use is expected as additional sites on the Internet include a link to Busview. Internet
visibility seems to have the greatest likelihood of increasing the number of users. In general,
both applications, Busview-X and Busview, seemed to acquire a set of “hard core” users over
time.

36
37
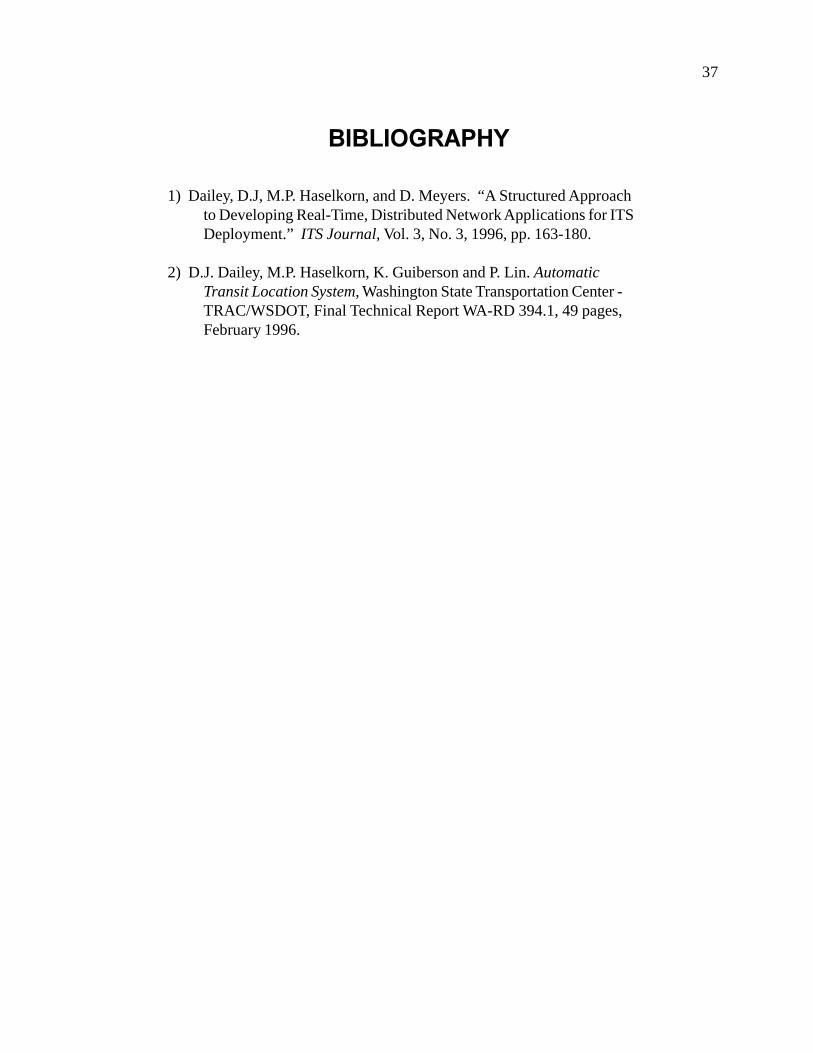
BIBLIOGRAPHY
1) Dailey, D.J, M.P. Haselkorn, and D. Meyers. “A Structured Approachto Developing Real-Time, Distributed Network Applications for ITSDeployment.” ITS Journal, Vol. 3, No. 3, 1996, pp. 163-180.
2) D.J. Dailey, M.P. Haselkorn, K. Guiberson and P. Lin. AutomaticTransit Location System, Washington State Transportation Center -TRAC/WSDOT, Final Technical Report WA-RD 394.1, 49 pages,February 1996.

38

39
APPENDIX A: Busview-X Comments
Status: studentFreq: Every DayComment1: First of all I'd like to say this is awesome! I'm quite impressed, good job so far.
Let's see, I couldn't get the zoom feature to work. I would be nice if i couldzoom out a little. It would be nice to see farther than the UW, just to know if mybus is coming. Remember most people can't check this at the bus stop, so weneed tim to get out there.
Comment2: Yeah, the content of the map looks fine. Perhaps you could put a few morestreet labels though.
Comment3: I really don't see this as being "useful" so to speak, until it has a larger range.Like I said before i can't really watch my bus coming, and then get out fastenough to catch it.
Comments: As I said before I think this is really neat. I am curious as to how you are gettingyour data from the busses? Are you filtering raw data? or are you gettingupdated bus positions electronically? Also, what tools did you use to developthis? Again, great job!
Status: studentFreq: 3-5 times per weekComment1: Great!!!!!! A bit bigger coverage would be great.Comment2: Fine . Great. Clear.Comment3: I just found about it. I plan to use it so I can figure out when the 48 leaves
montlake so I can make it to the bus stop from my office. The 48 is always late,so this is absolutely wonderful, specially in the cold winter and rainy months.
Comments: good job. great idea.
Status: studentFreq: Every DayComment1: seems pretty sufficient for leaving campus -- obviously a larger range would be
great.Comment2: obviously the maps could use some work. I certainly wouldn't want to navigate
by them (i.e. discerning between 15th and the ave). As long as you know thebasic layout of the area, they work.
Comment3: I will try using them later tonight when I go home (which brings me to an idea).It would be excellent if you could click on a bus, then click on a location andget a guestimate of when that bus would be at that location. (even better wouldbe the option where you tell it where you are, and it beeps to warn you to leaveto catch the bus!)

40
Comments: the x-windows interface is a little awkward. that is, it'd be nice to have this inJava or something that was multi-platform (so I could run it from my home). butoverall, this is really cool!
Status: studentFreq: 3-5 times per weekComment1: I live at 55th St and 29th Ave NE, and would like coverage of that area. Also, if
I can't have the system predict an arrival time (see below) I need a larger viewto extrapolate for myself, 15-20 minutes BEFORE arrival in the U district
Comment2: It's tough to read the route numbers when they overlap with a street, on mygreyscale monitor. Large view helps, as does the manual filter. I'd like a filteroption to view one DIRECTION only You could eliminate seconds from theyime displays The street names don't help me and clutter the display. The onlyway I know which streets the names in the U district refer to is because I knowthe U district. Otherwise I'd be totally confused. As it is, I don't need them.
Comment3: Curiosity only. By the time I see that bus X is at the U-district, it's too late forme to get there from my office on campus. After trying 'zoom' I got an error"can't read zmx2. No such variable'
Comments: I'd prefer a system in which I could name a route and a stop, and I would receive aprediction of when the next bus(es) would leave the stop. Impressive use ofweb technology! It'd be nice to see the direction of movement on the FIRSTdisplay of the bus. Otherwise you will encourage people to leave busviewrunning all day, so it will be updated when they need it. Will that impact yourserver?
Status: facultyFreq: Every DayComment1: Map regions should be expanded north and between downtown and campusComment2: bus numbers and times are difficult to read through the streets on a black and
white terminal.Comment3: Mostly useful if I need to take a bus different from those I usually take.
Status: staffFreq: 3-5 times per weekComment1: This is really cool. But how do you track the buses?Comment2: Pretty nice layout for as much area as you have to cover.
Status: studentFreq: 3-5 times per weekComments: I'm getting to this survey form, but never getting busview to actually appear on
my screen. Do I need to be running Netscape on the same machine that Ispecify as my display? Thanks.
41
Status: studentFreq: Every DayComments: I don't see the map displayed on my xterm? why?
Status: studentFreq: Every DayComment1: This is amazing...Comment2: Easy to read
Status: studentFreq: Every DayComment1: this is truly fantastic and a fantastically great thing. i don't yet know whether i'll
use it regularly, cause, say, i don't have X at home which is where i am in themornings trying to figer out whether to go get this bus or wait for the next...
Comment2: a LITTLE bit of color could go a long way. i suggest making the bus text red sothat it'sa easy to pick out
Status: studentFreq: Every DayComment1: i just sent a message, in which i suggested using color. turns out there was a
problem in my X display. it looks much better now.....
Status: studentFreq: Every DayComment1: It's not clear how to get to different parts of the city. I'm interested in seeing
buses north of the current map view.Comment2: It's fairly easy, but you black on white would probably look better. And some
indication for street names would help (probably something like clicking on astreet would give the street name).
Comments: Probably could save a lot of network bandwidth by just sending where thebuses are to a local tcl client program rather than through X.
Status: studentFreq: Every DayComments: Busview map appears for a while, no menus, no action, then the window goes
away.
Status: studentFreq: 1-2 times per weekComments: Unfortunately, the program just said "cannot connect to server" and refused to
display anything of interest.

42
Status: studentFreq: 3-5 times per weekComment1: The map itself is great, but the area of coverage is not. My office is about 5
minutes from the bus-stop, so I would like a much wider range of coverage sothat I can see when a bus (the 48) is approaching the University from CapitolHill.
Comment2: The appearance of the maps are good, except for one problem. The contrastbetween the light green bus time and the white of the streets makes the bus timedifficult to read at some points on the map.
Comment3: Once the area of coverage is extended, I will use the system frequently todetermine when to leave my office so that I can spend less time waiting at thebus stop. With the current area of coverage, the system is not very useful to me.
Status: studentFreq: Every DayComment1: Further south of U of W would be helpful. Perhaps using a smaller map?Comment2: Text indicating buses hard to read. Perhaps add X or bus icon to make easier to
spot and sort out from the clutter?Comments: Very interesting service! Hope this is expanded!
Status: studentFreq: Every DayComment1: It's more than enough for U-Dist, but of course it will be much better to include
other maps besides downtown.Comment2: A bit congested even for small fonts. It is horrible when I want to display the
street name at the same time.
Status: staffFreq: 3-5 times per weekComments: I haven't looke at them yet --don't know if this mails off first --or will give me a
chance to comment after I've browsed abit.
Status: staffFreq: Every DayComment1: Looks Great for Metro Riders. (I ride CT, but I enjoy watching Metro Routes
move around)Comment2: The Busses (#'s and times), Roads, and street names are all the same color. And
they tend to overlap and make it more difficult to read. Is there anyway to makedifferent colors for different things? (it could be my Xserver running out ofcolors also)
Comments: I have heard a lot about this program and this is my first experience with it. Ireally enjoyed this and will probably reference it more in the future. Is there away to examine other areas than downtown and the u district? (i.e. pan theviewing area or zoom out?)

43
Status: studentFreq: Every DayComments: I can't get the damn thing to work!!!!
Status: studentFreq: Every DayComment2: The direction of the buses are difficult to see. Maybe adding color or enlarget
the mark would help. Help is not available to explain what the metro logos arefor on the map and what the time under each bus means.
Comment3: Useful to help me decide when to leave. And it's fun!!Comments: Need help to develop a Windows version? Maybe I can help write it.
Status: studentFreq: Every DayComment2: Very hard to see on grey scale monitor.Comment3: I'm not sure, it's my first time.Comments: On line time table is definitely good to keep.
Status: studentFreq: Every DayComment1: it would be nice if a bus you are trying to follow is out of the screen but you
are told here it is.
Status: studentFreq: Every DayComment3: The display could not share colors with Netscape (the only other color
application running) on my Sun 4/110. In monochrome, the menus did nothave visible text. The map and schedule windows did not redraw in response toexpose events, but did redraw if I made some menu request.
Status: staffFreq: Every DayComment1: Cannot tell the content of the map since it disappears so quickly.Comment2: Map not visable long enough to tell.Comment3: See responses above.Comments: As noted above, the screen doesn't appear long enough to see anything useful.
The initial image with the map appears. Next, some asterisks appear with somewriting near them appears. Instantly, after that, the screen disappears. When thisproblem gets fixed, please send an email and let me know and I'll try again.
Status: staffFreq: 3-5 times per weekComment1: It would be nice to see more of the city, especially NW and NE Seattle and
Capital Hill.Comment2: The maps are quite clear

44
Comment3: Very useful (and cool :-). I used it to see where my bus was.Comments: Are there any plans to make the software available for running on any UW
Unix system?
Status: studentFreq: 3-5 times per weekComment1: The maps could extend a little bit further south of Montlake, and the lines to
draw the streets could maybe be kept thinner, or be given less intense colors. Asit is now they sometimes make it hard to read the bus sugnals.
Comment2: see aboveComment3: I just used them to explore this new service, I will probably use them more often
in the future to time the departure from my office.Comments: Sometimes a bus seems to "disappear", i.e. stop sending signals even though it's
last signal was somewhere in themiddle of the map.
Status: staffFreq: 3-5 times per weekComment1: It would be nice to extend the range a bit more. The elements seem fine.Comment2: Use of color would be nice to key out items. I get a white on black display and
it is hard read if more than a few buses are there.Comment3: They looks like they could be usefull for me, except that our group at work is
now using magic cookies for x-term authentification, so the current system ofxhost + to get in will not work without re-starting the terminal in a less securemode. This means that I bascially could not use it as a 'real' monitoring tool. Ireallyt like it otherwise, and if there were a way around this problem, I woulddefinitely get a lot of use out of it.
Status: staffFreq: 3-5 times per weekComment1: yesComment2: just fineComment3: not too useful. The initial drawing I could not find route 370...So I selected only
route 370 and it was nowhere to be seen. At 5:10 I think one of them shouldhave been on the map at least...
Status: studentFreq: 3-5 times per weekComments: The color map does not work really well when I am also using Netscape
Status: studentFreq: 3-5 times per weekComment1: the maps are great.Comment2: Put the bus info in a different color. like red It is currently VERY difficult to
read.Comment3: they are a great tool

45
Comments: who are you guys located? ivhs? what department is that?
Status: staffFreq: Every DayComments: I was never able to access your site due to my inability to find the "session
window". Your instructions were not very clear.
Status: studentFreq: 3-5 times per weekComments: I would like a way of marking up a certain bus so that something beeps on my
terminal when my bus is within range. For example, when the 48 hits NEPacific I would like to get a beep.
Status: studentFreq: Every DayComment1: Yes, everything is great! Now, all the colors are working! Please read the
comments.Comments: I've another question. I'd like to automate the opening of the busview in a
UNIX script, but therefore I need some information about what I have to sendto which computer. Maybe you have a special port, to which I can send myname and ID-number and Display, and the busview will automatically started.It's a little bit boring to enter all this stuff everytime in Netscape and loadingNetscape takes so long! I'd really appreciate some info, because your busview isused a lot here in our lab!
Status: staffFreq: Less than one time per weekComment1: Maps are OK. Much more accessableComment2: On Screen OK (Monochrome monitor). Still waiting for the print out.Comment3: As good as the kiosk maps.Comments: Myn kids fly metro, this may help me help them. We have Mac at home, not X-
term so use is limited.
Status: studentFreq: Every DayComment1: It might be neat to extend further south (since I live in the south end). I really
like the idea of both the downtown and the U-dist maps.
Comment2: The map is very easy to understand and follow.Comments: I think this is a really neat, clever, and wonderful idea. It might be nice to format
the schedules a little better, though.

46
Status: studentFreq: Every DayComment1: The two maps are nice. It doesn't look like they are adjcent, though. Could that
be changed?Comment2: The bus numbers are difficult to read when the map is viewed in full size. How
about a menu option that toggles opaque or transparent text? That is, I couldoptionally make a block of text overwrite the map background, obscuring theunderlying streets.
Comment3: This is my first use of the system, so it's more for my personal enjoyment thananything. In the future, what I'd probably do is figure out (1) how long it takesto walk to the bus stop, (2) how far my bus can travel in that time, and then (3)work backwards when I must leave in order to just catch the bus; I hate waitingfor the bus.
Comments: I'd like to be able to open more than one map at a time. Is this possible? Also,what about seeding the bus locations when the system first starts, instead ofopening an empty map? Great system!
Status: studentFreq: Every DayComment1: greater resolution would be good...many students are not from the area !Comment2: what is there is OK for itselfComment3: it didn't work. The buslines should be displayed on a smaller scale map.
Status: studentFreq: 3-5 times per weekComment1: I live on Beacon Hill. I didn't see an option for viewing the South end.Comment2: The maps were too cluttered. I think that a less detailed map should be drawn
by default. The user can then use the zoom function to get greater detail. Notethat you don't have a zoom out function. Though I figured out that the originalview could be restored by reselecting which map I wanted to see, a zoom out orrestore original view should be listed next to the zoom choice on the menus.
Comment3: The maps were pretty slow to come up. Maybe a less detailed map could beused to setup a zoomed view. TRhat might speed things up a little, though Idon't know what's going on at your end.
Comments: Why not have this accessable through the Web? Make it work like the WSDOT traffic maps. As for the functions, those can be put in a form that the userfills in. Sure it's not real-time, but it's real close.
Status: studentFreq: 3-5 times per weekComment1: Nothing came up. The screen flashed and I was dropped into the survey
screen...
47
Status: studentFreq: 3-5 times per weekComment1: I got a message about insufficient colors and ended up with a black and white
map that was pretty useless--even with the large ofnts option it was almostimpossible to make out buses and route information.
Status: staffFreq: Every DayComment1: Fairly sufficient.Comment2: The zooming mechanism could be improved on.
Status: staffFreq: Every DayComments: No buses appear on the map and attempting to use the bus filter results in the
following message: Error: font "-*-helvetica-medium-r-normal-*-12-*-*-*-p-*iso8859-1" doesn't exist The map's colors appear good however no busnumbers appear nor times. Perhaps related to the font problem noted above.
Status: facultyFreq: 1-2 times per weekComment1: sufficientComment2: Appearance is fineComment3: Just checking them out, but the map will be very useful in the future.Comments: Unbelievable!!
Status: facultyFreq: Less than one time per weekComment1: I see no maps, and it is not clear how to bring them up.
Status: studentFreq: 3-5 times per weekComment1: More map areas would be good.Comment2: The maps appear OK.
Status: staffFreq: Less than one time per weekComment1: Did not get a route map when selected it. (Crossroads)Comment2: Very niceComment3: May use maps for patient information. I think they will be very heplpful.
Status: s tudentFreq: 1-2 times per weekComment1: The maps are well done, but it would be nice to have a larger range of areas,
such as Green Lake, Ballard, etc. It would also be nice to have info avaible indata form, so that users or devolopers can customize use. What I mean is, if I

48
take the 48 every day, I might want to know when it reaches 50th street, since Iget on at 45th. By using the data, rather than the image, I could write a program(or use a pre-devoloped one) to sound a buzzer or something when this eventoccurs.
Status: staffFreq: Every DayComment1: yesComment2: often hard to read bus number, even if large; often hard to tell direction of travel.
Tried it on a 1-bit VaxStatation -- displayed prety well. Tried it on an SGI -- thecolor helped. Tried it on a color NCD xterm -- got *no* bus info?!
Comment3: 1. Very neat. 2. I commute from the U to Kirkland; take the 260. I was able tosee when it left the downtown area an estimate when it would get to Montlake.It was 15 min. late yesterday and I could wait/work in my office instead of waitat the bus stop.
Comments: How about a text version -- in a schedule format -- either in place of a scheduleor have actual time next to schedule times. on the web, of course
Status: studentFreq: Every DayComments: Menus on top don't respond to mouse -- but they do respond to keypresses.
This is on a SGI IRIX 5.2. This makes it impossible not to look at all theroutes. Really I'm only interested in one bus...
Status: staffFreq: Every DayComment1: Looks like it could be very useful for checking on when to leave for my bus!
Will the map show tunnel buses in the tunnels?Comment2: What is the significance (if any) of color?
Status: staffFreq: Every DayComments: Could there be a warning (bell, popup, whatever) when a particular bus leaves a
particular stop? This would allow me to, for instance, work up to the lastsecond, and not have to worry about missing my bus, and not having to wait fora very late bus.
Status: studentFreq: Every DayComment2: It is difficult (sometimes impossible) to see when there are more than one bus
stop at one place and the texts overlap each other.

49
Status: studentFreq: Every DayComment1: I'd like the area South of Montlake to be larger so that buses approaching from
that side can be seen earlier (eg: #25).Comment2: I use a monochrome Xterm, so the small lettering is hard to see. Perhaps using a
highlight color would help.
Status: studentFreq: 1-2 times per weekComment1: The map coverage is adequate.Comment2: The maps are actually too detailed. They illustrate streets on which buses never
run. For those who are not from Seattle, I think that these maps may bconfusing. Maybe an option for a map with only 45th, 15th, the ave, roosevelt...and other major streets would help.
Comment3: The N_S orientation is ok. For some, that not the way they see the U-dist.Could there be orientation options?
Comments: I didn't see any buses on the maps.. Is the prog working or did I do somethingwrong. On this page. Maybe some steps telling what options should be set inorder to see a common route. 44?
Status: studentFreq: Every DayComment1: The map coverage is very useful for the areas that are most used.Comment2: Everything is very small. It will be difficult for people with smaller monitors. I
think it's necessary though to get all the information though. The zoom featureworks well and fixes that problem.
Comment3: I might use them to get bus schedules and see when my bus was coming.Comments: It might be useful to overlay a route onto the map for a given bus. That way you
could see where it takes you since not all the street names are on the map yet.Also, an alarm feature that would let you know when a particular bus reaches acertain point would be useful for people that want to work up to the last minute,but not miss the bus. :)
Freq: Less than one time per weekComment1: Nice map
Status: studentFreq: 3-5 times per weekComment1: Would like to see more coverage.Comment2: Use of color would help discriminate buses from background. Other use of
color, e.g. types of streets. (Appeared only black & white)Comment3: Not used, but could indicate whether one's missing a bus or nor :-)Comments: Looks promising.
50
Status: studentFreq: Every DayComment1: Should contain all possible routes serviced by meto and community transit.Comment2: More detail
Status: staffFreq: Every DayComment1: I don't know how to run thisComment2: I don't see any mapComment3: this is useless
Status: studentFreq: Less than one time per weekComment1: The content is fineComment2: It is nice and clearComment3: I was just curious because I stubled across the maps.Comments: It is *way* too difficult to bring the maps up to actually be of use. To get a bus
map, you would have to go to a campus computing center, sign out an X-term,log in, launch netscape, find the page (or have it bookmarked), add the xhost,type in your ID information, and click OK on the legal mumbo-jumbo. It's justnot worth the effort to bring up a map of where the busses are! It *would* becool to have it displayed at the bus stops on campus, though. I'm not sure ifthere is any way to do so without risking vandalism to the displays though.
Status: staffFreq: 1-2 times per weekComment1: The coverage is adequateComment2: Perhaps you should remove or dash streets where buses don't travelComment3: They're useful. They helped me select a bus to use and when I should leave my
office. I will use it in the future.Comments: When two buses having the same number are on the same street but traveling in
opposite directions, perhaps they should be a different color, as well as havinthe directionsl arrows.
Status: staffFreq: 3-5 times per weekComment1: The coverage is fine for catching a bus from the U-district, but won't help for
coming in to work from the Eastside in the morning.Comment2: Sometimes I couldn't see the direction arrows. Otherwise they were adequate.Comment3: I may begin using the maps to decide when to actually leave my office and
walk to my bus stop. Also it will be helpful to know if I have missed my busand should wait for the next one. This will provide up to 30 minutes ofadditional work time. If I walk to the bus stop and then find out I have missedthe bus, I don't have time to return to work and accomplish anything useful.But if I know before I leave that I am going to miss the bus, then I can continue
51
to work until the next one comes. Also, I can phone my wife to let her know Iwill be late.
Comments: The route schedule for the 167 should have come up wider on my screen orwith a smaller font so that I could see the whole route listing in one line.
Status: facultyFreq: Less than one time per weekComment1: I like the bus filter. It's too busy otherwise.Comment2: The windows-like interface is dumb. Motif style buttons would be preferable.Comment3: I'll be using them to see when I should catch a bus. Thanks
Status: studentFreq: 1-2 times per weekComment1: It's too bad Bellevue is left off, but I'm sure that would have made the program
twice as hard. Seattle and UW areas are covered well.Comment2: The bus text is hard to read because the white streets obstruct the light green bus
text. The bus text is the most important, and should be the dominant color. Thestreet names show in the same white as the street, so they are even harder toread. If I had it my way, the background would be white, not black. The streetwould be a 50% grey, good enough to see but not obstructive. The buses andstreet names should have unique and dominant colors, like blue and dark green.
Comment3: The interface to showing street names is a bit clugey. First it brings up aseperate window. It should just change the cursor. You can't remove streetsnames that you already showed. You have to reset the entire map I guess.
Comments: The way this program is set up, a person must have an X Server (which is notcommon), and they cannot have their preferences saved. I think a better way togo would be to write a Java front-end that accesses your database. Anyone inthe world could see the maps, zoom in on them, whatever. If they wanted to see"live" buses, they would have to enter the student number, name, and click 'OK'to accepting the terms. The Java program could also save their preferences, sothey could have their own selection of bus filters, default map choice, and evencolor selection!
Status: studentFreq: Less than one time per weekComment1: Whenever I open an extra box, the color map goes to monochromeComment2: Whenever I open an extra box, the color map goes to monochrome
Status: studentFreq: Less than one time per weekComment1: Seems OK.Comment2: Everything looks quite nice.

52
Comment3: I was curious to see if the service had changed any since I last saw this service,over 6 months ago. It's kinda neat that it works, but not too useful since it takesso long to bring up the service. (By the time you found your bus, it would havestopped at your pickup point, and left again!!)
Comments: This doesn't seem very useful, but it sure is cool!!
Status: studentFreq: 3-5 times per weekComment1: More extensive coverage would be nice, if possible.Comment2: The overall appearance of the maps is good. I like the feature of clicking on a
bus number and having the scheduke pop up.Comment3: I think BusView is a wonderful program! I always look at the map before
catching the bus at night. I now have it timed so I can be at the bus stop justbefore the bus arrives.
Comments: I wish the program was working today, Nov. 19, 1996, because the snowstormhas made the bus schedule irrelevant. It would be really nice to know wherethe buses are in real time.
Status: studentFreq: Every DayComment1: Where is it?
Status: studentFreq: Every DayComment1: It would be neat if a map extending South of Seattle could be provided. It may
already, but I simply couldn't access it (BusView is slow over a 28.8Kmodem!).Comment2: Sure!Comments: What would be _really_ neat is if the BusView client could be downloaded and
run _locally_ on my X-windows machine, and all that's sent over the networkare the bus position updates. That way, the client is pretty snappy (runninglocally), but still requires access to roadway.ivhs for the bus data.
Status: studentFreq: Every DayComment1: perfectComment2: yepComment3: quite useful
Status: staffFreq: 3-5 times per weekComment1: It would be helpfull to have city wide maps.Comment2: There should be a way to eliminate the street names after adding them.Comments: Good work!!

53
Status: studentFreq: 3-5 times per weekComment1: Around the campus, the coverage is sufficient. Of course, since I live away
from campus, I'd like coverage improved off campus!Comment2: The elements are fairly easy to identify, mainly because I know the exact lay of
the land. If I didn't, I'd like to have more landmarks, and a more accurate pointerto each of the landmarks (rather than the large, relatively ambiguous labelscurrently used).
Comment3: I was just checking the map out; just learnt about it. I haven't used it yet.Comments: First off, I think this is a great idea; hope you guys can push it through to
something widely used! The following additional features may be useful:1)Arrows showing which way the bus is moving (because most buses ply inboth directions simultaneously on a given road). 2)More frequent updates: thisis because I most need the service when I think I may have missed the bus (orhave very little time to catch it). Since the bus-stop is about 30 secs from myoffice (it's probably so for many people on campus), I'd like a resolution ofaround 30 seconds at least.
Status: studentFreq: Every DayComment1: Richmond Beach, Richmond Highlands, Shoreline are areas in which I would
be interested in seeing.Comment2: It would be helpful to identify in which directions the buses are moving, special
conditions on particular buses (e.g., is my bus dead?), highlight routes ofinterest, and center the map on buses of routes of interest. Some indication ofwhether the bus is approximately on schedule would be useful, too. Estimatedtimes of arrival at selected stops?
Comment3: I think it's pretty cool, but... It doesn't seem very useful. If your bus doesn'tappear, you don't know why. Also, the interval between updates is too great.Finally, unless the maps are displayed on consoles at major bus stations, nobodywill have access to the information when they need it.What information do people need?- what route goes to my destination and how long will it take?- where is the nearest stop for that route?- when will the next bus reach that stop?- (once the person reaches the stop) did I miss the bus or not? if I did, do anyother routes take me where I want to go?which of the above questions do the maps address?
Comments: Shouldn't this be a Java applet? That might make it easier to integrate withMetro's web page, allow people to use it from home, etc. Could yousuperimpose current-traffic data from the DOT web site onto your maps?

54
Status: staffFreq: Every DayComment1: I have never used it before, and currently all I can is this survey form.
Status: staffFreq: Every DayComment1: Very niceComments: I would like to be able to set "permanent" bus filters. That is, I don't want to
have to constantly add the buses I am interested in watching one at a time.

55
APPENDIX B: Busview Comments
**Date: Thu, 07 Jan 1999 16:34:37 -0800From: Stefan Kramer <[email protected]>Subject: Does the Busview service exclude Community Transit buses? I didn’t see anystatement at http://www.its.washington.edu/busviewplus/ that Busview only shows METRObuses, but after having looked at the map for the UW campus area for a while, it seems like it.Otherwise, this is very impressive!
**Date: Mon, 25 Jan 1999 10:59:04 -0800From: “Mark Falge” <[email protected]>Subject: Busview!Wow! Busview has really come a long way since I last took a look! Looks like this is going tobecome a very valuable tool for me. I’m sure you’re busy with many suggestions but I had anidea that I know would at least be very useful to me. Would it be possible in the future to set upsomething similar to a proximity alert for buses?Thanks for all of the hard work.Mark
**Date: Tue, 26 Jan 1999 17:13:21 -0800From: “Victoria H. Brophy” <[email protected]>Subject: Busview suggestions and questionsI recently discovered busview and I really like it. Does every Metro bus send a signal forbusview or are some not shown on the map? There are two features I would find useful. One isthe ability to scroll the map. The other is a find feature. I ride bus 205 and I’d like to knowwhere on its route it is, but “route progress” doesn’t help me because there’s only one bus at atime. I have to find it before Ican ask where it is.Thanks,Tori BrophyUniversity of Washington
**Date: Wed, 10 Feb 1999 19:48:48 -0800To: [email protected]: Don Sheythe <[email protected]>Subject: Busview - locating bus on map is difficultDear busview team,I think busview is really cool. It has greatly improved since the version that I saw a few monthsago.
56
**Date: Sat, 13 Feb 1999 08:04:03 -0800From: Jim & Debbie Weiss <[email protected]>Subject: BusViewThis is WAY cool. Please please please, get CT on here, you could make my commute life somuch better. Great idea, great job, and fantastic use of technology.Thanx-jww
**From: “Sylvia French (ApRoberts) (Exchange)” <[email protected]>To: Seattle Web Grrls List <[email protected]>Subject: RE: (discuss) see where your bus isDate: Tue, 16 Feb 1999 15:13:54 -0800
This is the BEST applet EVER!!!!
>——Original Message——>From: Anne Baker [mailto:[email protected]]>Sent: Tuesday, February 16, 1999 3:09 PM>To: [email protected]; [email protected]>Subject: NWR: (discuss) see where your bus is>Here’s a very cool site that allows you to actually see, in real time,>where the buses are. You need NS 4.5 or better or IE 4.01 or better.>>http://www.its.washington.edu/busviewplus/bus_launch.html>>Enjoy!
**From: Jones, Steve [SMTP:[email protected]]Sent: Tuesday, February 23, 1999 2:51 PMTo: ‘Michael J. West’Subject: testimonial & suggestion boxWith Busview, I was able to select the route and “watch” on my PC to see when my bus wasactually starting its route. When I saw the bus enter the route about 8 blocks from my office, Ihad just enoughtime to leave my building and go to the bus stop. The bus ended up being about 20 minutes latethat day, but with Busview, I was able to spend the wait time in my office catching up on workinstead ofwaiting out in the cold.

57
**From: “Glenna Johnson” <[email protected]>Subject: Re: Fwd: Busview no longer worksDate: Tue, 2 Mar 1999 09:39:32 -0800Thanks for the prompt response! It works again! Also, I wanted to let you know that I love thisapplet. I was wondering, though, if there were any plans to set up some type of outboundphone system to “warn” people that their bus was a given distance or number of minutesaway?Thanks again for your help!
**Subject: BusView feature suggestionFrom: Tessa Lau <[email protected]>Date: Wed, 03 Mar 1999 11:09:34 -0800Hi there,I’m very impressed by the current BusView applet. I’ve tried it in the past, and you have sincemade vast improvements in the user interface and stability of the applet. Thanks for a greatservice! I’m glad to see it improving.
**Date: Wed, 03 Mar 1999 10:44:18 -0800From: Don Sheythe <[email protected]>Subject: Busview Comments - You guys are soooo close!You are really close to something I would use if it were easier/more convenient to use.PS I can see that you guys have put a lot of hard work into this project. It’s really cool.
**From: “David and Kaylin” <[email protected]>Subject: Your site is brilliant!!Date: Tue, 27 Apr 1999 07:21:19 -0700Someone just sent me an e-mail with a link to your site. After 5 minutes of playing around withit I can say only one thing. Freaking Genius!! Excellent work. This is by far one of the mostuseful sites I’ve ever seen. Way to go guys. Keep it up.David Neil
**Date: Mon, 22 Mar 1999 09:55:33 -0800From: “Mark Falge” <[email protected]>Subject: Bus ViewLooks like Busview is really coming along...thanks for the program. I see that the perimeteralarm on the ‘Route Progress’ bar is going to be added soon...I can’t seem to get it to work yet.I was also wondering if it would be possible, at some point, to set up preferences forBusview...for example when I launch the application the specific map for my area would beloaded and my perimeter alarms would be set. Thanks again for the program it’s really provingvery useful these days!

58
**From: “Mark Falge” <[email protected]>Subject: RE: Fwd: Bus ViewDate: Mon, 22 Mar 1999 11:12:24 -0800Thanks! That did the trick. This program is getting better and better... You have no idea howmuch your program has helped in alleviating the frustration my girlfriend and I have in missedbusses! More people should know about this. Thanks again Joel.
**Date: Thu, 25 Mar 1999 00:45:23 -0500 (EST)From: Miles Erickson <[email protected]>X-Sender: [email protected]: Future of BusView?Are there any plans to migrate BusView to a stand-alone Java application that, while still beingOS-independent, would allow the flexibility to do such things more efficiently? Just curious..thanks for your excellent work!
**Date: Sat, 27 Mar 1999 11:48:56 -0800From: Don Sheythe <[email protected]>Subject: Busview Comments - Cool! I like the new route selection!Dear Busview team,I have seen the new features you’ve added to busview and I am very impressed. It makes it somuch easier to use! It used to take me about 5 minutes to get the bus I wanted, now it takesabout 10 seconds! The only thing that confused me was that the timepoints listed in the rideselection window were not in sequential order along the route. (for example 32nd and 143rdwere listed below 35th and 125th on the 65 route into the UW) However this is a minorcomplaint on a major improvement!Now if busview could save the state of the open windows to some cookies so I wouldn’t haveto bring up the same route and set the same alarm each time I launch it 8-)
Thanks a bunch, I think I’ll be using Busview a lot more now!Don
**Date: Wed, 31 Mar 1999 13:43:50 -0800From: Andrew Williams <[email protected]>Subject: BusViewGreat idea putting this on the net! My bus stop is uncovered and it’s great to know when thebus is actually coming. I just wish I had found this at the beginning of the rainy season ratherthan near the end! I’ll just hang out in my nice warm office instead of freezing waiting for thebus.Thank you,Drew WilliamsREI Adventures

59
**Date: Wed, 31 Mar 1999 13:44:27 -0800From: Gary Lewis <[email protected]>Subject: a couple of suggestions for busviewHello,Again (I have sent prior messages), I want to commend you on a great application. I love theaddition of the alarm on the bus progress applet. Thanks for the opportunity to give youfeedback and keep up the great work.
**Date: Thu, 01 Apr 1999 19:17:04 -0800From: Don Sheythe <[email protected]>Subject: Re: Busview Comments - the case of the missing route 65 8-)I can imagine what a tangled web of route information that you must have to sort through.Thanks for all your hard work, this is really cool stuff! It saves me having to wait out in thecold (a couple of nights this week have really been cold!) I cant wait for the latest version to beposted! 8-)Don
**Date: Thu, 08 Apr 1999 16:32:57 -0700From: Chris Maly <[email protected]>Subject: Fwd: Re: transit resourcesThanks for the tip. How are you doing this? GPS tracking? Very cool. Is this informationpublic domain? Could we integrate it into SeattleInsider.com?
**From: “Swick, Reid” <[email protected]>Subject: BusViewDate: Thu, 15 Apr 1999 13:51:29 -0700This thing is really cool!Is there a way to preserve your Map and filter between invocations of the program?
**From: Chris Arthur MacGregor <[email protected]>Subject: busview comments/problemsDate: Thu, 15 Apr 1999 14:46:19 -0700Busview is veeeeeeeeeeery cool. I just wish I’d known about it sooner - it could have saved mea lot of waiting in the rain this past winter.
**Date: Fri, 16 Apr 1999 10:28:55 -0700From: “MAGER,GARY (HP-Seattle,ex1)” <[email protected]>I just found your Busview project on the Internet. It looks very interesting. Can you tell mehow you track the buses? Does each bus have a GPS device? Thanks, -gary

60
**Sent: Friday, April 16, 1999 3:31 PMFrom: R. ManeySubject: BusviewHello and congratulations on a great application! My life is much easier since I discoveredBusview. Thanks for your help,Todd ManeyUniversity of Washington Department of Physiology and Biophysics

61
APPENDIX C: 1994 World Congress Paper

62
Demonstration of an Advanced Public TransportationSystem in the Context of an IVHS Regional
Architecture
D.J. Dailey, M.P. Haselkorn
University of Washington
Seattle, Washington U.S.A.
1. INTRODUCTION
In previous papers,1 we have presented an overview of an architecture for a regional
IVHS network. Numerous benefits were associated with the IVHS development strategy
presented in those papers, including:
1) easy sharing of interagency and multi-jurisdictional data withoutdisruption of existing operations.
2) support of existing investment in IVHS technology and systemdevelopment.
3) easy expansion of sensor technologies and user applications in astraightforward, principled manner.
4) encouragement of future innovation.5) interoperability among local, regional, and national IVHS development
efforts.
This paper describes a concrete demonstration of this architectural concept - a prototype
Advanced Public Transportation System (APTS) that displays on a single GIS screen (1) real-
time bus locations from an AVL system owned and operated by Seattle Metro, the seventh
largest transit company in the U.S.A., and (2) real-time freeway congestion data from
1"A Conceptual Framework for IVHS System Development," Proceedings of the IVHS America 1993 AnnualMeeting, pp 1-7; "Traffic Information and Management in a Geographically Distributed ComputingEnvironment," Proceedings of Pacific Rim TransTech Conference/ASCE Third International Conference onApplications of Advanced Technologies in Transportation Engineering, Seattle, WA.: ASCE, pp. 159-165.
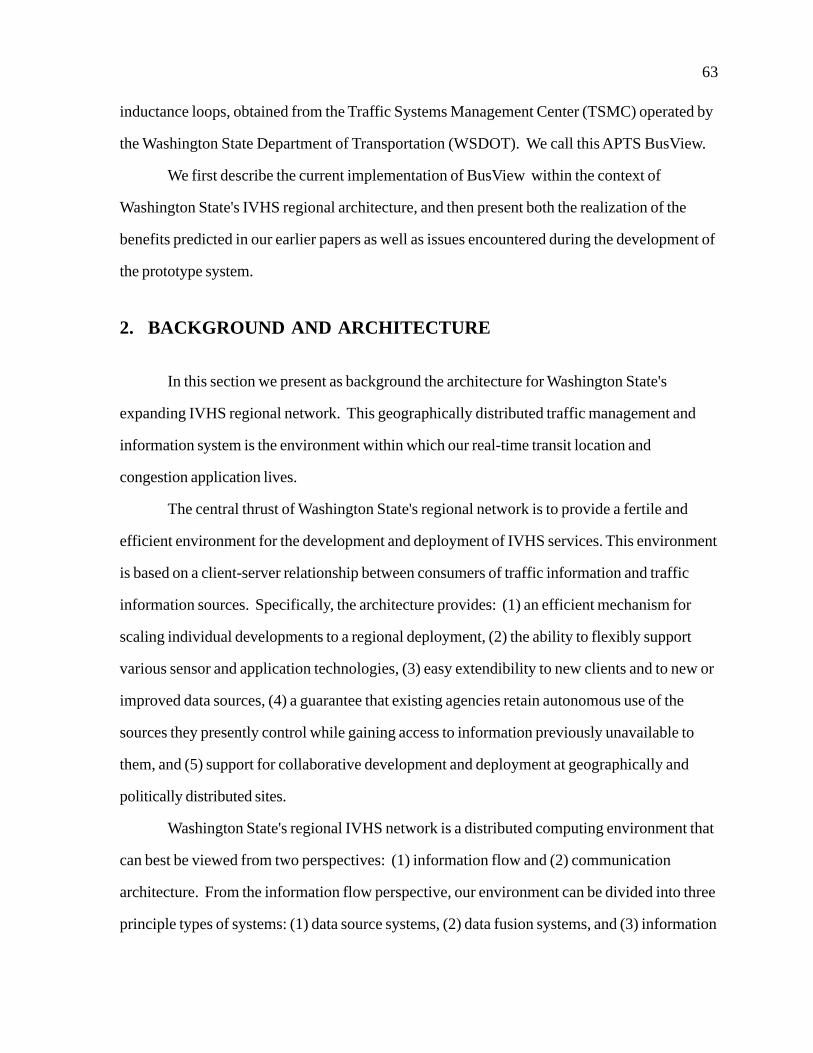
63
inductance loops, obtained from the Traffic Systems Management Center (TSMC) operated by
the Washington State Department of Transportation (WSDOT). We call this APTS BusView.
We first describe the current implementation of BusView within the context of
Washington State's IVHS regional architecture, and then present both the realization of the
benefits predicted in our earlier papers as well as issues encountered during the development of
the prototype system.
2. BACKGROUND AND ARCHITECTURE
In this section we present as background the architecture for Washington State's
expanding IVHS regional network. This geographically distributed traffic management and
information system is the environment within which our real-time transit location and
congestion application lives.
The central thrust of Washington State's regional network is to provide a fertile and
efficient environment for the development and deployment of IVHS services. This environment
is based on a client-server relationship between consumers of traffic information and traffic
information sources. Specifically, the architecture provides: (1) an efficient mechanism for
scaling individual developments to a regional deployment, (2) the ability to flexibly support
various sensor and application technologies, (3) easy extendibility to new clients and to new or
improved data sources, (4) a guarantee that existing agencies retain autonomous use of the
sources they presently control while gaining access to information previously unavailable to
them, and (5) support for collaborative development and deployment at geographically and
politically distributed sites.
Washington State's regional IVHS network is a distributed computing environment that
can best be viewed from two perspectives: (1) information flow and (2) communication
architecture. From the information flow perspective, our environment can be divided into three
principle types of systems: (1) data source systems, (2) data fusion systems, and (3) information
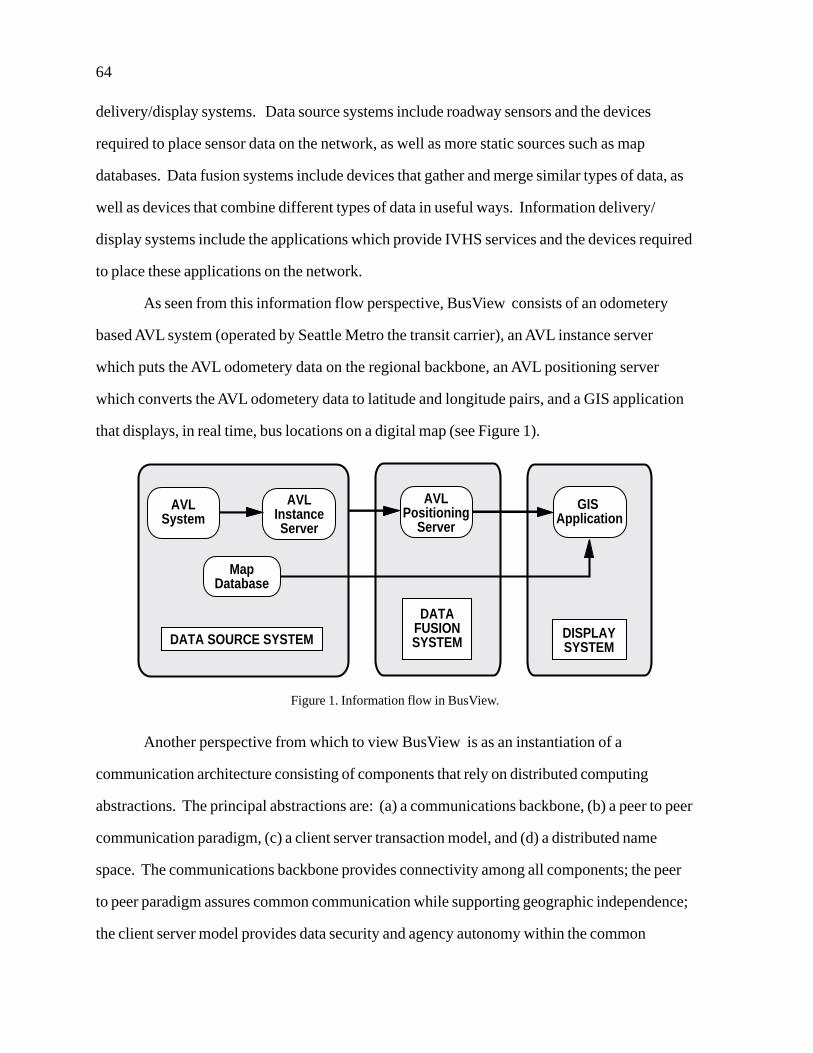
64
delivery/display systems. Data source systems include roadway sensors and the devices
required to place sensor data on the network, as well as more static sources such as map
databases. Data fusion systems include devices that gather and merge similar types of data, as
well as devices that combine different types of data in useful ways. Information delivery/
display systems include the applications which provide IVHS services and the devices required
to place these applications on the network.
As seen from this information flow perspective, BusView consists of an odometery
based AVL system (operated by Seattle Metro the transit carrier), an AVL instance server
which puts the AVL odometery data on the regional backbone, an AVL positioning server
which converts the AVL odometery data to latitude and longitude pairs, and a GIS application
that displays, in real time, bus locations on a digital map (see Figure 1).
Figure 1. Information flow in BusView.
Another perspective from which to view BusView is as an instantiation of a
communication architecture consisting of components that rely on distributed computing
abstractions. The principal abstractions are: (a) a communications backbone, (b) a peer to peer
communication paradigm, (c) a client server transaction model, and (d) a distributed name
space. The communications backbone provides connectivity among all components; the peer
to peer paradigm assures common communication while supporting geographic independence;
the client server model provides data security and agency autonomy within the common
AVLSystem
AVLInstanceServer
MapDatabase
DATA SOURCE SYSTEM
AVLPositioning
Server
GIS Application
DATAFUSIONSYSTEM
DISPLAYSYSTEM

65
communication model; and the distributed name space provides a mechanism for locating any
system component.
This perspective emphasizes the nature of the communication within our APTS transit
application (compare Figure 2 and Figure 1). In addition, this perspective emphasizes the
Figure 2. Communication architecture in BusView.
Figure 3. Overall IVHS communication architecture.
AVLInstanceServer
AVLSystem Map
DatabaseSystem
GISApplication
AVLPositioning
Server
IVHS BACKBONE
ITS BACKBONE
GPSInstance Server Data
Fusion Server
AVLPositioning Server
GISApplication
TrafficWorkstation Traffic
ReporterApplication
MapDatabase System
AVLSystem
AVLInstance Server
LoopSystem Loop
Instance Server
GPSData
GPSType Server

66
potential for similar communication with the other components in our architecture (compare
Figure 2 and Figure 3). The protocols and interfaces that create the peer to peer relationships
are such that a new application can communicate directly with an existing component for its
own purposes. For example, a new application could communicate with BusView's AVL
instance server to obtain odometery information for the purpose of tracking bus maintenance
needs, rather than providing latitude and longitude coordinates (as BusView's positioning
server does). Thus in this framework, a clear paradigm exists for adding new components, and
new IVHS applications are designed by selecting components from the communication
architecture (Figure 3) and defining the information flow (as in Figure 1).
3. HOW BusView WORKS
The BusView application is a good example of the development strategy described
above. We obtain real time transit vehicle locations by interfacing with an existing automatic
vehicle location system (AVL) owned and operated by Seattle METRO, and we obtain
freeway congestion information by interfacing with an existing loop data system owned and
operated by the Washington State Department of Transportation (WSDOT). METRO's AVL
system consists of several components including a data acquisition control system (DACS) and
a set of GIS command and control consoles. The data acquisition system polls each of the
coaches to obtain an odometery based distance along planned routes. The DACS then
broadcasts, on an Ethernet, the bus route number, vehicle ID and distance along one of 3000
patterns from which the routes are constructed. The GIS/Display system receives information
about the routes assigned to each console operator and provides a graphical display. It is at the
juncture of the DACS and the METRO GIS/Display system that we have placed an instance
server which eavesdrops on the network and obtains the information about each of the coaches.
(See Figure 4.)
METRO's AVL system is extremely complicated, but in Figures 1, 2, & 3 it is
represented only by a box labeled "AVL System." This is because from the point of view of

67
the IVHS architecture it simply represents another data source and is connected to the network
in the same principled manner as a single GPS receiver would be connected. The AVL data is
tapped by attaching the AVL Instance Server to the Ethernet interconnecting the components of
the AVL system and in effect eavesdropping on the odometery information. In this way,
METRO's information is made available to approved participants on the network without
impacting METRO's use of the data. In return, METRO gains access to the data of others (e.g.
WSDOT loop data) as well as to various network services and applications .
Figure 4. Implementation of BusView.
One class of network services are called fusion servers and the type server is an
example of this generic category. Once the instance server has placed the AVL information on
the network, it is reencapsulated and sent to a type server process running on a computer at the
University of Washington (UW). The type server performs several functions:
1) it receives the coach data and, through a series of coordinatetransformations and extended data structure searches, translates thelocation of the coach from the distance along a route pattern (a
IVHS BACKBONEAVL
InstanceServer
GISCommand
&ControlConsole
GISCommand
&ControlConsole
MetroRadio and DACS
Seattle Metro Transit Operations
Washington State DOT Universityof
Washington
AVLPositioning
Server
GISApplication
LoopSystem
LoopInstanceServer

68
proprietary system) to latitude and longitude coordinates suitable forcomparison and display on a GIS system,
2) it provides a connection service that negotiates the addition of the clientto the list of clients presently receiving the coach information, and
3) it transfers the coach data to each of the clients as the real time databecomes available.
All of these communication tasks take place over Internet style interprocess
communication ports. The AVL data fusion server (physically located at the UW) is shown in
the upper right of Figures 2 & 3 and called "positioning server." This component acts as the
fusion and redistribution point for the AVL positioning data. It initializes a connection to the
AVL instance server and requests the real time odometery information. This odometery
information is combined with the routing information to produce a latitude and longitude
position value for each of the buses as they are polled. The position information for each of the
coaches is then available to clients for a number of uses. The first of these is a map display of
real time bus locations.
To present the probe vehicle location information in a useful way, our implementation
includes a traffic management type display of traffic information. In our example
implementation a locally developed GIS display application accesses a set of map data derived
from TIGER files, the USGS 1:100,000 scale digital maps (augmented by local
measurements.) These maps can be displayed on Xterminals located anywhere on the
backbone. These maps are used to give context to the probe vehicle information just
developed. Access to vehicle location data, vehicle information (implemented as a network
data base), and congestion data (implemented by the Loop Instance Server) is handled in the
same client/server way used to establish communication between the AVL fusion server and
instance server. The GIS application (BusView) makes a request for data from the server and
then uses this data to build the display.
The demonstration display consists of the street network displayed on an Xterminal (the
traffic workstation in Figure 3), along with the real time location of any probe vehicles and real
time freeway congestion data from WSDOT. The user of this display can make selections to
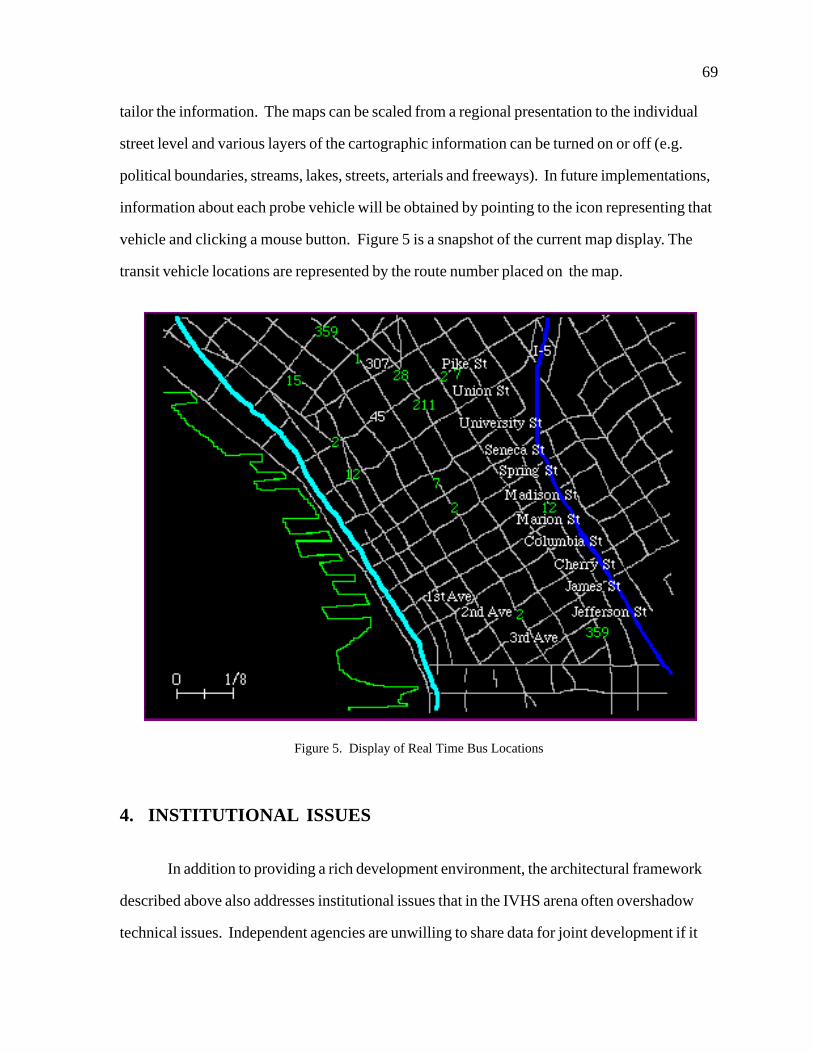
69
tailor the information. The maps can be scaled from a regional presentation to the individual
street level and various layers of the cartographic information can be turned on or off (e.g.
political boundaries, streams, lakes, streets, arterials and freeways). In future implementations,
information about each probe vehicle will be obtained by pointing to the icon representing that
vehicle and clicking a mouse button. Figure 5 is a snapshot of the current map display. The
transit vehicle locations are represented by the route number placed on the map.
Figure 5. Display of Real Time Bus Locations
4. INSTITUTIONAL ISSUES
In addition to providing a rich development environment, the architectural framework
described above also addresses institutional issues that in the IVHS arena often overshadow
technical issues. Independent agencies are unwilling to share data for joint development if it

70
means they must adjust their current procedures or sacrifice the security and integrity of their
data. Our IVHS architecture is a political as well as a communication entity, since it
encourages regional cooperation of transportation agencies through a principle of "enlightened
self-interest." In other words, the cost of making data available on the network is minimal; the
benefits are considerable.
4.1 Benefits
In the case described here, we were able to make transit data from Seattle METRO and
traffic congestion information from WSDOT available on a wide area network without
impacting the operations, philosophies, or integrity of the agencies whose mission it is to gather
this information. For example, Seattle METRO's system is set up in a command and control
model, while WSDOT's is less hierarchical. In addition, these two units do not have a history
of joint development efforts. Nevertheless, a prototype of BusView was constructed with
components and cooperation from these two large and complex agencies, despite the fact that
they are geographically separate, philosophically distinct, and highly conscious of data
integrity.
With future implementation, we anticipate benefits for both the transit operator and the
traveling public. On the transit operator side the ability to generalize the geographically limited
command and control AVL systems will allow the transit carrier to make real time coach
information available to a range of internal users beyond the six consoles constructed for the
command and control center. This should allow planners to use the real time coach information
in positioning stops and planning routes, as well as allow systems personnel to evaluate the
accuracy of the AVL information and install or reposition communications infrastructure to
guarantee the desired level of accuracy. These functions are unavailable in the closed
command and control environment.

71
As for the traveling public, a range of possible benefits are possible, including:
1) Increased productivity: If the transit rider can be told when the coachwill be at their stop in real time, they are less likely to leave their worksite earlier than necessary to allow for the perceived wait time needed toassure catching the coach of their choice.
2) Reduced stress: If the transit user can be assured that the coach she/he isplanning to ride has not passed their chosen stop and that it will bearriving in a timely manner, the stress level associated with the lack ofinformation will be reduced
3) Increased public safety: Providing timely information to transit riderswill allow them to spend less time in potential dangerous waitingsituations.
4) Increased ridership and mode change: The above benefits would lead toa perception that transit is responsive to public needs and that transit isan attractive alternative to SOV travel. This would reduce congestion aswell as have a beneficial impact on environmental pollution.
4.2 Additional Issues
An additional issue which complicated the design and development of a BusView
prototype was the fact that the AVL system purchased by METRO is a closed proprietary
system. Using the eavesdropping technique described above, we were able to obtain coach
distance along planned routes as well as some rudimentary status information. However, the
proprietary arrangement made it difficult to fine tune the system. For example, when a coach is
off route for any reason (e.g. the driver is lost, static rerouting as a result of weather conditions
or planned events, or dynamic rerouting in response to congestion or incidents) the present
AVL system is unable to place the vehicle geographically. This limitation also applies to non
routed para-transit such as that used in response to the ADA legislation. In addition METRO
has not as of yet had a real time validation of location on a large scale. Until issues like these
can be dealt with, METRO is understandably reluctant to broadcast real time coach location
information to the general public for fear of bad publicity or liability from mis-information.
Another issue, yet to be fully addressed, is one of usability. The scope of a test of real
time transit location information has been limited to users at the University of Washington who

72
have agreed to participate in an experiment in delivery of APTS information. We are just
embarking on obtaining user feedback in a controlled environment at the University of
Washington. It is hoped that through iterative design techniques and user feedback, we will
produce a prototype that effectively delivers transit information capable of achieving the
benefits enumerated.

73
APPENDIX D: 1999 ITS America Paper

74
BusView and Transit Watch:
Two Products from the
Seattle SMART TREK Model Deployment Initiative
D. J. Dailey, G. Fisher, S. Maclean
The Seattle model deployment initiative has created a new technology for data sharing in
an ITS environment. This technology, the ITS Backbone that uses Self Describing Data,1
creates a framework in which to build applications. These applications use Self Describing
Data (SDD) to obtain real-time data over the Internet to perform functions ranging from
Advanced Traffic Management Systems (ATMS) to Advanced Traveler Information Systems
(ATIS). Since the applications depend only on knowledge of SDD, they are portable to any
jurisdiction where SDD is employed as the data transfer support.2 This paper describes the
implementation of two such portable applications.
INTRODUCTION
As part of the Seattle Smart Trek model deployment, two new applications where created
to provide real-time transit information. The two venues where transit riders need
information are (1) on the desktop and (2) at the transit center. The first project, Busview, is
a desktop display of the real-time location of all the transit vehicles operated by the regional
transit carrier, which operates one of the largest automatic vehicle location system (AVL)
1 http://www.its.washington.edu/bbone/2 SDD information and software are available for download from the ITS Backbone page noted above.

75
fleets of vehicles in the United States. The second project is Transit Watch, which is a real-
time arrival prediction system suitable for deployment in transit centers. Both of these
applications are designed to operate over the Internet as Java applets. Both are designed to
be sufficiently general so that they can easily be ported to other cities. This paper describes
the two applets and the underlying information technology that makes them possible.
BUSVIEW: http://www.its.washington.edu/busview
The first project, Busview Plus, implements a Java applet to display real-time transit
vehicle locations on a variety of computing and operating system platforms. Busview Plus is
platform-independent with the goal of making transit vehicle location information accessible
to anyone on the Internet. An additional goal is to develop an interactive interface that
promotes modal change and encourages the use of transit.
The Busview Plus project designed and demonstrated a system that displays real-time
transit coach location on a digital map to the Internet community. This project (1) designed
an advanced graphical transit information system using Metro’s existing AVL system and the
Puget Sound’s regional ITS backbone, (2) created a world wide web page to launch the
application, and (3) demonstrated the system’s viability by providing real-time bus location
information to individuals on their personal web browsers. This system, a graphical
Advanced Public Transportation System (APTS) for the Puget Sound region, is constructed
in an open systems model that uses a distributed computing environment. The Busview
application, from the University of Washington, leverages a previously installed and
expensive Automatic Vehicle Location (AVL) System operated by the transit carrier to create
a widely available application to provide real-time transit information.

76
System Architecture
The Busview applet is built using the component architecture described in [1]. This
architecture has been instantiated as the ITS Backbone of the Smart Trek MDI project. In
this model, the graphical user interface (GUI) is only one part of the overall application
environment. The component model includes the notion of a data stream (SDD) flowing
sequentially through a series of components that perform data fusion activities on the data
stream. The last of these components (the Sink Component from [1]) is the GUI applet
called Busview. Thus the Busview project focused on the component that the users touch,
the GUI (often thought of as the application in other environments).
The overall architecture for Busview is shown schematically in Figure 1. It consists of a
series of components that operate on the data; each of these components is represented by a
rectangle in Figure 1. To explain the overall operation, we describe several of these
components.
The transit carrier’s automatic vehicle location system is the sensor for the Source
component. In this case, the Source component (labeled AVLUW) eavesdrops on
communication between components of a proprietary AVL system used by the transit
carrier’s operations staff to (1) measure schedule adherence and (2) provide the transit
mangers a location in the event of an incident. The data in this case is distance along a
planned path, which, with knowledge of the routes and several coordinate transformations,
can be used to estimate location.
AVLUW is an Operator component located on a computer in the AVL operations center
of the transit carrier. It limits the information that can leave the agency’s operations center.
In this case, the numerical identification of the driver is in the data received by AVLUW, but it
is removed for privacy reasons before the data is allowed out of the physical control of the
transit agency. This component is also behind the firewalls protecting the transit AVL system

77
from Internet abuse. Once again, this Operator component provides network security and
agency autonomy, as well as removing information from the data stream.
The raw data (a distance along a known path) is multiplexed by a Redistributor
component (labeled AVL_Rebroadcast) to make it widely available. The data from
AVL_Rebroadcast is passed to an Operator component (labeled AVL_Trip) that uses
information in the AVL data packet to associate a specific vehicle with a specific trip in the
transit schedule. The data from the AVL system arrives at an average rate of 11-coaches-per-
second, and a 20,000-record database of scheduled trips is searched for each coach to obtain
the corresponding schedule information. This trip information is added to the record for each
coach and made available to the downstream clients. The data from AVL_Trip is passed to an
Operator (labeled AVL_Position) that can use the data (information about planned routes,
Data Source
State and Connection Maintenance
Schedule Information
Geolocating the Vehicles
Multiplexing the Data Stream
ApplicationFormatting
METRO AVL
AVL_Trip
AVL_Position
AVL_Fanout
AVL_ITS
BusviewBusviewBusview
AVL_Rebroadcast
AVL_AVLUW
Figure 1: Data Flow and Architecture of Busview

78
digital maps, and coordinate transformations) to calculate a latitude and longitude value for
the transit (probe) vehicles. The calculation of position requires (1) identifying the particular
coordinate lists in one of 2500+ files that represent every possible vehicle route, (2) selecting
the segment within the list on which the vehicle is estimated to exist, and (3) using a
Newton’s method to perform an inverse Lambert projection from the proprietary coordinate
system of the AVL system.
Downstream of the AVL_Position server is a Redistributor labeled AVL_Fanout that
multiplexes the data stream containing the vehicle positions to a variety of users. This
Redistributor frees the upstream process from multiplexing in addition to performing the
positioning solution. The Server component (labeled AVL_Its) creates a customized data
stream for the Busview presentation. The connection between this server and the Busview
sink can potentially be over slower media. This component minimizes the amount of data
that need be sent per update of each transit vehicle on the Busview screen. A digital map and
Figure 2: Busview screen

79
the vehicle location information, along with schedule information, are displayed graphically
on the Busview screen, creating an information system for transit riders.
The Busview graphical user interface (GUI) shown in Figure 2 operates as a Java applet.
This GUI produces a representation of map data on a browser that may be located anywhere
on the Internet. A web page to facilitate the use of the Busview applet (see Figure 3) is
available at http://www.its.washington.edu/busview.
Figure 3: Busview WWW launch page

80
The second project presented here is an applet to provide real-time information at the
transit station.
Transit Watch
This project deployed an Acvanced Public Transportation System/Advanced Traveler
Information System (APTS/ATIS) that provides a prediction of the arrival status of schedule
transit coaches. This prediction is quantized into four states: (1) ONTIME, (2) Delayed N
minutes, (3) Departed, and (4) No Information, as shown in Figure 4. The transit carrier’s
customer relations specialist selected the delay categorizations. The goal of the project is to
develop an interface that promotes the use of transit by reducing the stress inherent in
Figure 4: Transit Watch screen

81
transfers. This project leverages the ITS Backbone and Self Describing Data components of
the SmartTrek MDI project. This project was originally designed to be deployed at three
transit centers, but it has since been made available on the Internet at http://
www.its.washington.edu/TransitWatch.
System Architecture
Transit Watch is a multi-component client/server database application to disseminate
schedule and performance information to Metro riders at transit centers. The Transit Watch
application is comprised of four main elements: (1) a database engine, (2) a Predictor
Module (labeled “Predictor” in Figure 5), (3) a Display Server, and (4) client applets.
The database engine is central to the application (as shown in Figure 5). The data
storage, relational queries, and serialization capabilities are used to synchronize the Predictor
Figure 5: Transit Watch design

82
and Display Server components. The database stores information from the AVL stream
necessary for the Predictor to make arrival time predictions as well as storing the resulting
predictions for use by the Display Server. In this way, the Predictor and Display servers
operate asynchronously and autonomously but share a common set of validated data.
The Predictor is shown on the right side of Figure 5. To make predictions, several pieces
of information are necessary. The required data includes: (1) the real-time locations of the
vehicle from the AVL system, (2) the scheduled travel plan for the vehicle, (3) the
geographical route over which the vehicle travels, (4) mean travel speeds for vehicles, and (5)
past travel histories for the route of interest. These are combined in a prediction algorithm to
estimate the time until arrival at a selected transit center for a particular vehicle on the
specific route. The time horizon for this prediction is set such that vehicles scheduled to
arrive 30 minutes in the future and those that have departed within five minutes are included.
For the Seattle system, this means that approximately 50-100 vehicles are tracked at any one
time for a medium-size transit center.
The Predictor obtains the required data from a number of sources. Items (2) and (3) are
relatively static based on the transit carrier route planning and are provided by the carrier.
Item (1), the real-time data, utilizes an underlying SDD receiver from the SDD2.0.0b6 MDI
backbone code. Items (4) and (5) are derived information created as the SDD AVL data is
received and processed into the database by the Predictor. These data sources are the basis
for creating a reliable prediction algorithm.
The prediction algorithm operates in two modes. The first is to use an a-priori travel
speed, with the time and location of the transit vehicle, to make a linear prediction of the
arrival time. This linear prediction is returned to the database to make it accessible to the
Display Server. This simple form of prediction is the basis for most systems of this type.

83
The Predictor also operates in a second “statistical mode.” As each vehicle is observed
approaching the transit center of interest, the data points (position and time of observation)
are placed into the database. When the vehicle arrives at the transit center, the database is
updated to include the tuple (position, time of observation, delay between observation and
arrival). As the system operates, it collects data for each of the vehicles on each of the
scheduled routes. The Predictor examines the database each time a vehicle of interest is
observed in the AVL data stream. If sufficient observations of past trips have been made in a
small geographical region near this newest point, the Predictor can return a mean estimate of
arrival time from these data points. In addition, an estimate of the variance for vehicles at
this distance from the transit center can be produced. The statistics of the arrival time data
are approximated as normal in the treatment of the errors in the data. This approximation is
justified based on the results of a Kolmonogrov-Smirnoff distribution membership test
applied to the arrival time data. If operating in statistical mode, the results of this prediction
process are returned to the database.
Once reliable predictions are available in the database, the second specialized component
of the Transit Watch architecture is used to distribute the information either to applet clients
at transit centers or on the Internet. The Display Server is shown on the right of Figure 5.
This component is made up of several elements: (1) a super server to invoke the other
elements as needed, (2) a Data Server for each client display (denoted by j), (3) a Data Buffer
for each transit station (denoted by i), and (4) a Query Client for each transit center. The
clients (a display computer at a transit center) make a request to the Super Server for a
display of the information for one particular transit center. The Super Server then (1) creates
a Query Client to access the database for the data for that transit center, (2) creates a Data
Buffer to asychronously hold the information for the transit center, and (3) creates a Data
Server for the transit center of interest for the client requesting the data. This structure is
designed to support a large number of clients in real time. The client screen is shown in
Figure 4.

84
SUMMARY
SmartTrek, the Seattle MDI, deployed a new technology, Self Describing Data, and
created two example applications to use this technology. The applications, Busview and
Transit Watch, are directed at transit users in Seattle but are examples of applications that can
be generalized to any region, thus providing a model for ITS application deployment.
REFERENCES
1. Dailey, D. J., M. P. Haselkorn, and D. Meyers. “A Structured Approach to
Developing Real-Time, Distributed Network Applications for ITS Deployment.” ITS
Journal, Vol. 3, No. 3, pp. 163-80, 1996.