final report nasa grant nag 1-1959 earth radiation ... · this document is the final report for...
TRANSCRIPT

Final ReportNASA Grant NAG 1-1959
Earth Radiation Measurement Science
Submitted to
The National Aeronautics and Space Administration
Langley Research Center
Hampton, Virginia 24665-0001
Attention: Robert B. Lee III
Mail Stop 420
by
Department of Mechanical Engineering
Virginia Polytechnic Institute and State University
Blacksburg, Virginia 24061-0238
Professor G. Louis Smith
Period of Performance: 8/16/97-8/15/2000
August 16, 2000
https://ntrs.nasa.gov/search.jsp?R=20010069204 2018-06-19T17:38:02+00:00Z

F_
Li ....
==<;F
=:_
=
=_
Introduction
This document is the final report for NASA Grant NAGI-1959, "Earth Radiation Measurement
Science." The purpose of this grant was to perform research in this area for the needs of the
Clouds and Earth Radiant Energy System (CERES) project and for the Earth Radiation Budget
Experiment (ERBE), which are being conducted by the Radiation and Aerosols Branch of the
Atmospheric Sciences Division of Langley Research Center. Earth Radiation Measurement
Science investigates the processes by which measurements are converted into data products. As
such, it is not the purview of the instrument engineer, but begins with the measurements. It is not
the interest of the atmospheric scientist, who is not familiar with the measurements or the
implications of the data processing. Most of the work of RAAB is in this area. Under this grant,
research was to be conducted for 5 tasks. This grant was for one person, half time for 3 years. In
order to accomplish these tasks, the principle investigator collaborated extensively with RAAB
scientists, both in-house and contractor.
During the period of this grant 2 other Opportunities arose. The UK in collaboration with
Belgium and Italy built a Geosynchronous Earth Radiation Budget (GERB) instrument, to fly on
the MeteoSat Second Generation spacecraft in 2001. I became a member of the GERB
International Science Team. Also, the Triana project was begun to place a spacecraft at the first
Lagrangean point, a million miles from Earth toward the Sun. I was invited to participate on the
science team for this project.
A synopsis of research performed for each of the tasks is given here. A list of papers produced
under this grant follows. In the synopsis of research, the numbers in parentheses refer to the
numbers in the listing of papers documenting this work.
Task 1" Point Response Function Measurements
The measurements of the point response function for the CERES Proto-Flight Model (PFM),
Flight Model-1, -2, -3 and -4 were analyzed and reported. The steps to develop a point response
function were also reported (2, 23).
Calibration testing of the CERES instrument showed the presence of a spurious transient, which
could compromise the accuracy of the data if not properly treated. The PI designed a numericalfilter to eliminate this effect. Ground calibration data were analyzed to characterize the transient
for PFM and FM-1, -2, -3 and -4. The numerical filter was made operational in the data
processing software and the effects of the transient have been eliminated from the instrument
data stream (32).
The method for validating pixel location was developed and the pixel location was validated by
coastline studies for PFM (3).
Task 2: Temporal Sampling of Outgoing Longwave Radiation
Intercomparison studies of monthly-mean maps produced from the ERBS wide field-of-view
radiometers had shown that there were errors in the maps due to temporal sampling problems
when only the ERBS is available. Algorithms were developed for both outgoing longwave
radiation and reflected solar radiation (4, 5, 14) and made operational in the ERBE data
processing software and applied to 14 years of the ERBS data set (16). The results have been
studied and reported (26).

t
Task 3: Spatial Averaging of Radiation Budget Data
This task was made moot by the decision to use biaxial scanning data to compute spatial
averages and no action was taken here. This was good because it made the required time
available for the GERB and Triana opportunities,.
Task 4: CERES Data Validation and Applications
A number of papers were written to document and inform the scientific community of the status
of the CERES data, its validation and some applications (1, 6, 9, 10, 11, 12, 13, 21, 31, 33, 34,
35).
Task 5: ScaRaB Data Validation and Application
The ScaRaB 2 was placed into orbit aboard a Russian Meteor spacecraft. We made
Intercomparisons between ScaRaB-2 and the ERBS WFOV radiometers (18). The ERBS
compared as well with ScaRaB-2 as it did with the ERBS scanner.
Additional tasks:
In support of the GERB instrument, provided consultation for application of data to scientific
investigations (Attachment A) and validation of GERB data products (30)
In support of Triana, contributed to Science Plan and studied interpretation of measurements of
irradiance from full disc of Earth from Triana. It was demonstrated analytically that the
measurement of outgoing longwave radiation has a bias of 6 to 10 W-m-2, which is easily
computed and taken into account (20). Another paper formulates a phase function which
incorporates the anisotropy of the reflected solar radiation in order to interpret the reflected solar
radiation measurements (24).
Studies were made of the Surface Radiation Budget (SRB) data set which has been generated at
LaRC. It was demonstrated that the climate classification of a region can be determined from the
surface radiation data using very simple criteria, thus showing the close relation between SRB
and climate at the regional scale (7, 22, 28). Studies using the ERBE (19, 25, 29) data set found
an interannual variation in reflected shortwave radiation in the Indian and west Pacific Oceans.
There may be implications here for the Indian and Southwest Asian monsoons.
Other studies of Earth radiation measurements (8) and related topics were conducted relating to
biases induced by the orbit (15), anisotropy of upwelling radiation (17) and relation of spatial and
temporal sampling and requirements (27).
Copies of the following papers are attached, as they will not appear in print for some time:
Smith, G. L. and M. G. Mlynczak, 2000: "CERES and GERB validation," presented at the First
MSG RAO Workshop,, 17-19 May, Bologna, Italy (paper 30)
Smith, G. L., T. D. Bess, N. Manalo-Smith, V. Ramanathan, R. B. Lee III and B. R. Barkstrom
"Results from the CERES 8-12 micron window channel," presented 33-rd COSPAR
Scientific Assembly, Symposium on Space Studies of the Earth's Surface, Meteorology and
Climate, 16-23 July, Warsaw, Poland (paper 3 i).
Paperswrittenduring thePeriodof Performance
1. Smith, G. L., R. B. Lee gI, B. R. Barkstrom,B. A. Wielicki, K. J. Priestley,S. Thomas,J.Paden,R. S. Wilson, D. K. Pandeyand K. L. Thomhill, 1998:Overviewof CERESSensorsand In-flight Performance,Optical Sci., Eng. & Instrum., Proc., SPIE, v. 3439, 19-24 July,1998.
2. Paden, I., G. L. Smith, R. B. Lee, IIl, D. K. Pandey, K. J. Priestley, H. Biting, S. Thomas and
S. Wilson. 1998: Point Response Function Comparisons of Theory to Measurements for the
Clouds and the Earth's Radiant Energy System (CERES) TP,3/hM(PFM), and the EOS-AM
(FM-I & FM-2) Instruments, Optical Sci., Eng. & Instrum., Proc. SPIE, v. 3439, 19-24 July.
3. Currey, C., G. L. Smith: and R. Neely, 1998: Evaluation of Clouds and Earth's Radiant Energy
System (CERES) scanner pointing accuracy based on a coastline detection system, Optical
Sci., Eng. & lnstrum., Proc. SPIE, v. 3439, 19-24 July.
4. Smith, G. L., 1998: "Time-Sampling Errors of Albedo from Satellites." Proc. 14-th Conf.Prob. & Stats in Atmos. Sciences.
5. Rutan, D.A. and G. L. Smith, 1998: Diurnal Variations of Albedo," Proc Proc. 14-th Conf.Prob. & Stats in Atrnos. Sciences.
6. Manalo-Smith, N., G. L. Smith and R. N. Green, 1998: "Effects of Randomness of Radiation
Anisotropy on Empirical BDRFs," Proc. 14-th Conf. Prob. & Stats in Atmos.Sciences.
7. Wilber, A. C., G. L. Smith, and P. W. Stackhouse, Jr., 1998 "Regional Radiation Budget and
Climatology," Proc. 9-th Symp. on Global Change Studies
8. Smith, G. L., 1998: "Critical Overview of Radiation Budget Estimates from Satellites, " Adv.
Space Res., 24, 887-495, also Invited presentation at 32 na COSPAR Scientific Assembly,
Symposium on Satellite Applications For Energy Budgets and the Hydrological Cycle.
9. Smith, G. I., B. R. Barkstrom, R. B. Lee Ill, B. A. Wielicki,'R. N. Green, T. P. Charlock, P.
Minnis, B. A. Baum, D. F. Young and K. J. Priestley, 1998: "The Clouds and Earth Radiant
System Instrument aboard the Tropical Rain Measurement Mission (CERES/TRMM): Early
Results," 246-255, Proc. Symp. Sat. Remote Sensing of Clouds and Atmos IlL, EUROPTO,
Sept.
10. Wielicki, B. A., B. R. Barkstrom, B. A. Baum, T. P. Charlock, R. N. Green, D. P. Kratz, R.
B. Lee III, p. Minnis, G. L. Smith, T. Wong, D. F. Young, R. D. Cess, J. A. Coakley Jr., D.
H. Crommelynck, L. Donner, R. Kandel, M. D. King, J. Miller, V. Ramanathan, D. A.
Randall, L. L. Stowe, and R. M. Welch, 1998: "Clouds and the Earth's Radiant Energy
System (CERES): algorithm overview," IEEE Trans. Geosci. and Rem. Sens., 36, 1127-1141.
Lee, R. B. 1II, B. R. Barkstrom, H. C. Biting, D. A. H. Crommelynck, J. Paden, D. K.
Pandey, K. J. Priestley, G. L. Smith, S. Thomas, K. L. Thomhill and R. S. Wilson, 1998:
Prelaunch calibrations of the Clouds and Earth Radiant Energy System (CERES) Tropical
Rainfall Measuring Mission and Earth Observing System Morning (EOS-AM1) spacecraft
thermistor bolometer sensors," IEEE Trans. Geosci. and Rem. Sens., 36, 1173-1185.
Rutan, D. A., G. L. Smith, T. P. Charlock and R. N. Green, 1999: "Early Intercomparison of
CERES and ERBE Results," 209-212, Proc. Third Symp. Integrated Observing Systems,
American Met. Soc., Jan.
Manalo-Smith, N., G. L. Smith, T. P. Charlock and F. Rose, 1999: "Limb-Darkening
Functions as Measured by the CERES Alongtrack Experiment," 229-232, Proc. Third Symp.
bztegrated Observing Systems, American Met. Soc., Jan.
11.
12.
13.

"i
i "v
14. D. A. Spangenberg, D. A., G. L. Smith and D. F. Young, 1999: "Temporal Sampling Errors
of Monthly Mean Data Products from the Earth Radiation Budget Satellite Nonscanning
Radiometers," 219-222, Proc. Third Syrup. bztegrated Observing Systems, American Met.
Soc., Jan.
15. Smith, G. L., D. A. Rutan and D. F. Young, 1999: "Evaluation of Orbital Biases of Earth
Radiation Budget Data Products," Proc. Third Symp. Integrated Observing Systems,
American Met. Soc., Jan.
16. Bush, K. A., G. L. Smith, D. A. Rutan, B. R. Barkstrom and D. F. Young, 1999: "The Earth
Radiation Budget Satellite 13-Year Data Set," 504-507, Proc. Third Symp. Integrated
Observing Systems, American Met. Soc., Jan.
17. Smith, G. L., N. Manalo-Smith and T. P. Charlock, 1999: "Analytical Forms for Limb-
darkening and Bidirectional Reflectance Distribution Functions," Internat. Conf.e on the
Contribution of POLDER and New Generation Satellite-borne Sensors for Global Change
Studies, Meribel, France, 18-22 Jan.
18. Bess, T. D., G. L. Smith, K. A. Bush and D. A. Rutan, 1999: "Intercomparison of ScaRaB
and ERBS monthly mean radiation fluxes," 60-63, Proc. lOth Conf. Atmos. Rad., American
Met. Soc., Madison, Wisc. June.
19. Bush, K. A., G. L. Smith and D. F. Young, 1999: "The NOAA-9 Earth Radiation Budget
Experiment Wide Field-of-view Data Set," 95-98, Proc. lOth Conf. Atmos. Rad., American
Met. Soc., Madison, Wisc. June.
20. Smith, G. L., 1999: "Earth-emitted Irradiance at L-l," 296-299, Proc. lOth Conf. Atmos.
Rad., American Met. Soc., June, Madison, Wisc.
21. Weckman, S., G. L. Smith, M. Haeffelin, D. Young, B. Wielicki, R. Green and T. Wong,
1999: "A validation technique for CERES monthly mean Earth radiation scanner data using
ERBS nonscanner measurements," 64-67, Proc. lOth Conf. Atmos. Rad., American Met.
Soc., June, Madison, Wisc.
22. Wilber, A. C., G. L. Smith, and P. W. Stackhouse, 1999: "Regional Climatology and Surface
Radiation Budget," 524-527, Proc. lOth Conf. Atmos. Rad., American Met. Soc., June,
Madison, Wisc.
23. Paden, J, G. L. Smith, R. B. Lee 111, D. K. Pandey, K. J. Priestley, S. Thomas, and R. S.
Wilson, 1999: "Point response characteristics for the CERES/EOS-PM FM3 & FM4
instruments," Proc. Earth Observing Systems IV, Soc Photo & Instru,. Eng., July, Denver,Colorado.
24. Smith. G. L., 1999: Simulation of full Earth disc measurement at L-1 of reflected solar
radiation, Proc. Sensors, Systems and Next Generation Satellites III, 117-125, Europto, 20-
23 September, Horence, Italy.
25. Bess, T. D., G. L. Smith and C. Collimore, 2000: "Comparison of scanner and wide field-of-
view (WFOV) emitted radiation measurements from the ERBE NOAA 9 satellite," Proc. 15-
th Conf. on Prob. & Statistics in Atmos. Sci., 8-11 May, Asheville, North Carolina.
26. Smith, G. L., T-M. Wong and K. A. Bush, 2000: "Results of a stochastic quaslity assurance
algorithm for radiation budget data," Proc. 15-th Conf. on Prob. & Statistics in Atmos. Sci. ,
8-1 L May, Asheville, North Carolina
27. Smith, G. L.: "Spatial and temporal resolution-and accuracy of meteorological parameters,"
Proc. 15-th Conf. on Prob. & Statistics in Atmos. Sci. 8-11 May, Asheville, North Carolina.

L
28. Wilber, A. C., G. L. Smith and P. W. Stackhouse, Jr., 2000: "Regional climatology and
statistics of the surface radiation budget," Proc. 15-th Conf. on Prob. & Statistics in Atmos.
Sci., 8-11 May, Asheville, North Carolina.
29. Bush, K. A., G. L. Smith, and D. F. Young, 2000: Interannual variability of radiative fluxes
and sea surface temperature in the vicinity of the Indonesian throughflow, Proc. lO-th Conf.
Interaction of the Sea and Atmosphere, Amer. Met. Soc., 29 May-2 June, Fort Lauderdale,Florida.
30. Smith, G. L. and M. G. Mly'nczak, 2000: "CERES and GERB validation," Proc. First MSG
RAO Workshop, ESA-SP 452, 17-19 May, Bologna, Italy
31. Smith, G. L., T. D. Bess, N. Manalo-Smith, V. Ramanathan, R. B. Lee Ill and B. R.
Barkstrom "Results from the CERES 8-12 micron window channel," presented 33-rd
COSPAR Scientific Assembly, Symposium on Space Studies of the Earth's Surface,
Meteorology and Climate, 16-23 July, Warsaw, Poland. Also submitted to Advances in SpaceResearch.
Smith, G. L., D. K. Pandey, A. A1-Hajjah, B. R. Barkstrom, R. B. Lee Ill, J. Paden, K. J.
Priestley, S. Thomas, and R. S. Wilson, "Determination and validation of slow-mode
properties of the Clouds" and the Earth's Radiant Energy System (CERES) scanning
thermistor bolometers," Proc. SPIE, 4135-05, San Diego, CA, 2000.
Priestley, K. J., R. B. Lee III, B. R. Barkstrom, S. Thomas, R. S. Wilson, A. Al-Hajjah, J.
Paden, D. K. Pandey, P. L. Spence, and G. L. Smith, "Post-launch radiometric performance
validation of CERES Flight Models 1 and 2 located on NASA's Terra Spacecraft," Proc.
SPIE, 4135-04, San Diego, CA, 2000.
Wilson, R. S., R. B. Lee HI, B. R. Barkstrom, A. A1-Hajjah, J. Paden, D. K. Pandey, K. J.
Priestley, G. L. Smith, and S. Thomas, "On-Orbit solar calibrations using the Terra Clouds
and the Earth's Radiant Energy System (CERES) in-flight calibration system," Proc. SPIE,
4135-03, San Diego, CA, 2000
Lee, R. B. HI, K. J. Priestley, B. R. Barkstrom, S. Thomas, A. Al-Hajjah, J. Paden, D. K.
Pandey, R. S. Wilson, and G. L. Smith: "Terra Spacecraft CERES flight model 1 and 2 sensor
measurement precisions: ground to flight determinations," Proc. SPIE, 4135-05, San Diego,CA, 2000.
32.
33.
34.
35.

It-
CERES AND GERB VALIDATION STUDIES
G. Louis Smith t and M. G. Mlynczak"
1. Virginia Polytechnic Institute and State University
Langley Research Centre, NASA Mail Stop 420
Hampton, Virginia USA 23681
2. Atmospheric Sciences Division
Langley Research Centre, NASA Mail Stop 420
Hampton, Virginia USA 23681
1. LNTRODUCTION
The Geosynchronous Earth Radiation Budget GERB instrument aboard the MeteoSat Second Generation
Satellite will provide measurements every 15 minutes of the MeteoSat region of the Earth for OutgoingLongwave Radiation OLR and for Reflected Solar Radiation RSR. There are 2 Clouds and Earth Radiant
Energ7 System CERES instruments on the TERRA spacecraft in Sun-synchronous orbit whose results
can be compared to those of GERB. The AQUA spacecraft is scheduled to be placed in orbit and in early--
2001 should be providing data from 2 more CERES instruments. A major part of CERES validation is
comparison of results from the various CERES instruments and also with the Earth Radiation Budget
Experiment Wide field-of-view radiometers aboard the Earth Radiation Budget Satellite. The 19t3_er- .......comparisons provide a link with the ERBE data set, to give a continuity of Earth radiation measurements. __
Comparisons will place GERB on the same Broadband Radiometric Scale of satellite measurements as
ERBE and CERES. Figure 1 shows the Earth radiation budget record over the years.
There are several steps which produce a sequence of data products, each of which needs to be validated.
From the instrument counts and the calibrations the radiances are computed. Next, the radiances are used
to compute the radiant fluxes, which involves accounting for the anisotropy of the radiation leaving the"top of the atmosphere," by use of bidirectional reflectance distribution functions BRDFs. The fluxes are
computed then for grid regions, which are 1 degree in latitude and longitude. Finally, daily averages are
computed. The comparison of products between GERB and CERES for each of these steps will now be
described. Typically, the comparison of 2 data sets improves the products from both. For comparison
studies, the measurements should be taken as close together in time as possible. For GERB, this is no
problem. The CERES measurements will always be taken within 7.5 minutes of a GERB measurement.
2. RADIANCES
The instrument measures total and shortwave radiances at the detector. These radiances differ from the
radiances entering the instruments due to the spectral response of the instrument, so we denote them as
filtered radiances. From the filtered radiances, the longwave and shortwave The unfiltered radiances
which entered the instrument are computed, which we denote as unfiltered radiances. GERB uses anarray of 256 detectors, each of which views a narrow latitude band. The unfiltered radiances from each of
these detectors should be compared to unfiltered radiances from the CERES instruments. Because of the
anisotropy of reflected solar radiation, the ray which is observed by GERB should be close in angle to the
ray observed by CERES. CERES instruments operate primarily in one of 3 scan modes, each of which
impose constraints on the observation of a ray by both the GERB and by CERES. The sampling of
radiances measured by both instruments is now considered for each CERES scan mode.
For mapping the radiative flux from the Earth, a CERES instrument scans cross-track, as shown in Fig. 2.
The rays which are viewed by CERES lie in a plane which is normal to the TERRA orbit plane andmoves with the spacecraft as it goes around its orbit. The only ray which is observed by GERB and
CERES is the ray along the intersection of the orbit planes of the MSG and the TERRA spacecraft. It isthe nadir ray from each spacecraft as they cross, which is at I0:30 local solar time and 10:30 GMT.
There is a ray on the Sun-lit side of Earth (10:30 AM) and one on the night side (10:30 PM, or 2230

Lw
hours). Also, the radiance will be viewed only if TERRA crosses the intersection near the same time as
MSG. As a consequence, only measurements near the Equator can be compared with CERES in thecross-track mode, so that only a few detectors can be compared.
The other CERES instrument aboard TERRA is primarily for making radiance measurements for the
development of improved BRDFs. This instrument is periodically oriented so as to scan in the orbit
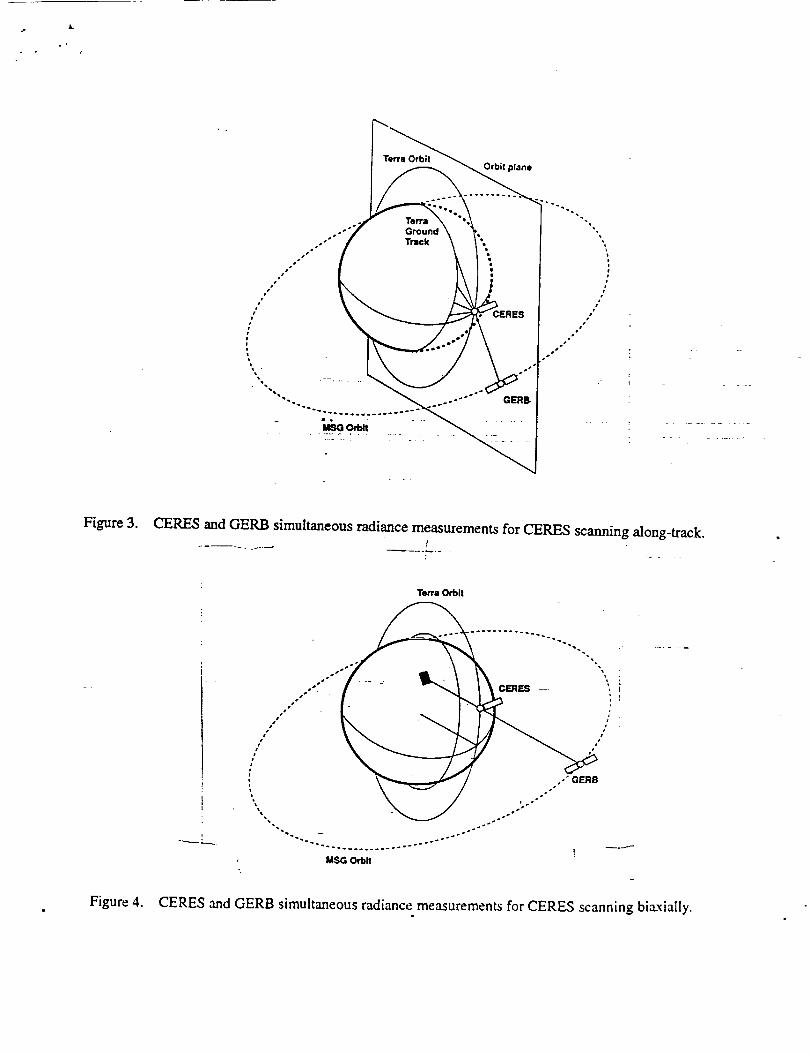
plane, i.e. alongtrack, as Fig. 3 shows. For this case, as MSG passes through the TERRA orbit plane, the
line from MSG to TERRA corresponds to a ray which is observed by both GERB and CERES. This ray
moves with the TERRA spacecraft. Each time the MSG passes through the TERRA orbit plane, TERRAwill be in a different location. Over a long period of time, in this CERES scan mode each of the GERB
detectors will observe radiances jointly with CERES.
For its third scan mode, the CERES instrument which is devoted to gathering data for BRDF
developments scans in azimuth as well as in elevation. Figure 4 shows the Rotating Azimuth Plane Scan
mode, For this case, there are no constraints on the geometry as for the first 2 scan modes and ameasurement is possible for any line from the MSG to the TERRA to Earth. Because measurements are
taken at a constant rate, and the scan rates in azimuth and elevation angle are constants, the number of
measurements is greatest near the orbit plane of TERRA. Over a period of time in this CERES scan mode -each of the GERB detectors will observe radiances jointly with CERES. - .................
In practice, these conditions must be relaxed, e.g. if the rays from a site to the 2 spacecraft are within 5°.........they will be used.
3. PIXEL FLUXES
The flux is derived from the radiances by use of BRDFs to account for the anisotropy of the OLR andRSR. Except for the special conditions described in the previous section, GERB and CERES will view
any site from different angles. Errors of the BRDFs will result in different fluxes being computed for the2 instruments. These checks will validate the fluxes produced by both instruments and also the BRDFs.
4. REGIONAL MEAN FLUXES
The GERB pixel is 49 km at the sub-satellite point, and is 125 km at the corners of the METEOSAT
sector, where the view zenith angle is 68 ° (J. Delderfield and Martin Caldwell, MSD-RAL-GE-TN-0007).
As a consequence, when regional averages are formed, there are errors associated with their computation
from the relatively large pixels, especially at the corners of the sector. The CERES has a pixel size which
is 20 km near nadir and TERRA orbit passes can be selected such that a g_ven GERB region, e.g. a sector
corner, is observed by CERES near nadir. In this manner the spatial averaging errors can be quantified
experimentally. There is a problem that the regional mean flux error includes not only the spatialaveraging error, but also the BRDF errors, for both instruments. The BDRF errors can be minimized byconsidering the OLR case, for which the BRDF (limb-darkening functions) are near 1 and errors aresmall compared to the RFR case.
5. TIN_ INTERPOLATED/AVERAGED FLUXES
GERB observes every 1° region within the METEOSAT sector of the Earth every 15 minutes. At this
spatial scale, the temporal sampling is sufficient that temporal sampling errors are practically zero. Oneof the major sources of error for the CERES daily mean and monthly mean data products is time-
sampling error. In order to form these means, it is necessary to interpolate in time between themeasurements. There are 3 effects to be taken into account for CERES. First, there are variations from
day to day, or synoptic variations. Next, there are diurnal variations of the scene. Finally, the albedoincreases as solar zenith angle increases. The latter effect is accounted for by use of a directional model,
which describes the variation of albedo with solar zenith angle. GERB data will provide information for"validating the CERES time interpolated and averaged data products.

J..
iZ
E@¢,-
C
8U)
NOAA ! 0ERBE
NO.a_A 9
ERBE
NIMBUS tl NIMBUS7ERB ER8
NIMBUS ? ERR
I,,I,,1975 1978
Iih
ERSS
I ! I
I
NOAA 10m
NOAA 9m
ERBSI
1984 1990
SCARAB
mmm
1994
Figure 1. Earth Radiation Budget da_t s. .... ; - :_. " - _......... ; TF. - .... . ......... : ....
GERB
SCARAB2
..._"
CERES
°1 I r I
1997 2000 : -
Terra Orbit
TerraGroundTrack
Equator
Figure 2. CERES and GERt_ simultaneous radiance measurements for CERES scanning cross-track.
&
Figure 3.CERES and GERB simultaneous radiance measurements for CERES scanning along-track.
t
Terra Orbit
sss o 1)
.-";''"" .-" GER8
_''''''_'- °- ........... "°''*''''°*'*
!
MSG Orbit
Figure 4. CERES and GERB simultaneous radiance measurements for CERES scanning biaxially.

It.
• °
RESULTS FROM THE CERES 8-12 MICRON WINDOW CHANNEL
G. L. Smith (1), T. D. Bess (2), N. Manalo-Smith (3), V. Ramanathan (4),
R. B. Lee llI (2) and B. R. Barkstrom (2)
(1) Virginia Polytechnic Institute and State University, Blacksburg, Virginia
(2) Langley Research Centre, NASA, Hampton, Virginia
(3) Analytical Services and Materials, Hampton, Virginia
(4) Scripps Oceanographic Institute, University of California, San Diego, California
......................
ABSTRACT .......
The CERES (Clouds and Earth Radiant Energy System) scanning radiometer has 3 channels: a
shortwave channel for measuring solar radiation reflected from the Earth, a total channel, which
combined with the shortwave channel gives the outgoing longwave radiation, and a channel for
measuring radiances in the 8 to 12 ix window of the atmosphere. The CERES instrument aboard
the Tropical Rainfall Measurement Mission (TRMM) spacecraft provided 8 months of data. This
paper discusses the 8-12 Ix channel of the CERES RMM data. In order to compute fluxes from
radiances measurements, limb-darkening functions are required. The limb-darkening functions
are computed from CERES measurements. These functions are then used to compute fluxes from
the measured radiances. Finally, maps are examined to show the features of radiation in the win-
dow channel.

I.
INTRODUCTION
The Clouds and Earth Radiant Energy System (CERES) instrument is a scanning radiometer
which was designed to measure the components of the Earth's radiation budget. The program
objectives are described by Barkstrom (1990) and Wielicki et al. (1996).The CERES scanning
radiometer has 3 channels: a shortwave channel for measuring solar radiation reflected from the
Earth, a total channel, which combined with the shortwave channel gives the outgoing longwave
radiation (OLR), and a channel for measuring radiances in the 8 to 12 micron window of the
atmosphere. The 8 to 12 g window is helivily affected by water vapor, which is a greenhouse gas
and varies strongly with location and time. Measurements by this channel will thus permit an
understanding of the variability of water vapor and its feedback effects in the climate system (e.g.
Inamdar and Ramanathan, 1994). The combination of the window channel with the simultaneous
broadband measurements of CERES will provide an especially important data set. The CERES
Proto-Hight Model, aboard the Tropical Rainfall Measurement Mission (TRMM), provided data
from January through August 1998 to cover the Earth from 40 ° S to 40 ° N. Flight Model 1 and 2
(FM1 and -2) CERES instruments aboard the Terra spacecraft have been operating since March
2000. Another pair of CERES radiometers are scheduled to fly aboard the Aqua (Earth Observa-
tion System Afternoon platform). CERESfI'R.MM pixel level data are now archived and available
for use by researchers. Computation of window fluxes from window radiance measurements
requires limb-darkening functions. This paper presents limb-darkening functions which were
computed from CERES measurements made as the instrument scanned alongtrack. These func-
tions are then used to compute fluxes from the measured radiances. Maps are examined to show
the features of radiation in the window channel and to compare with the broadband OLR map.
2_.
INSTRUMENT
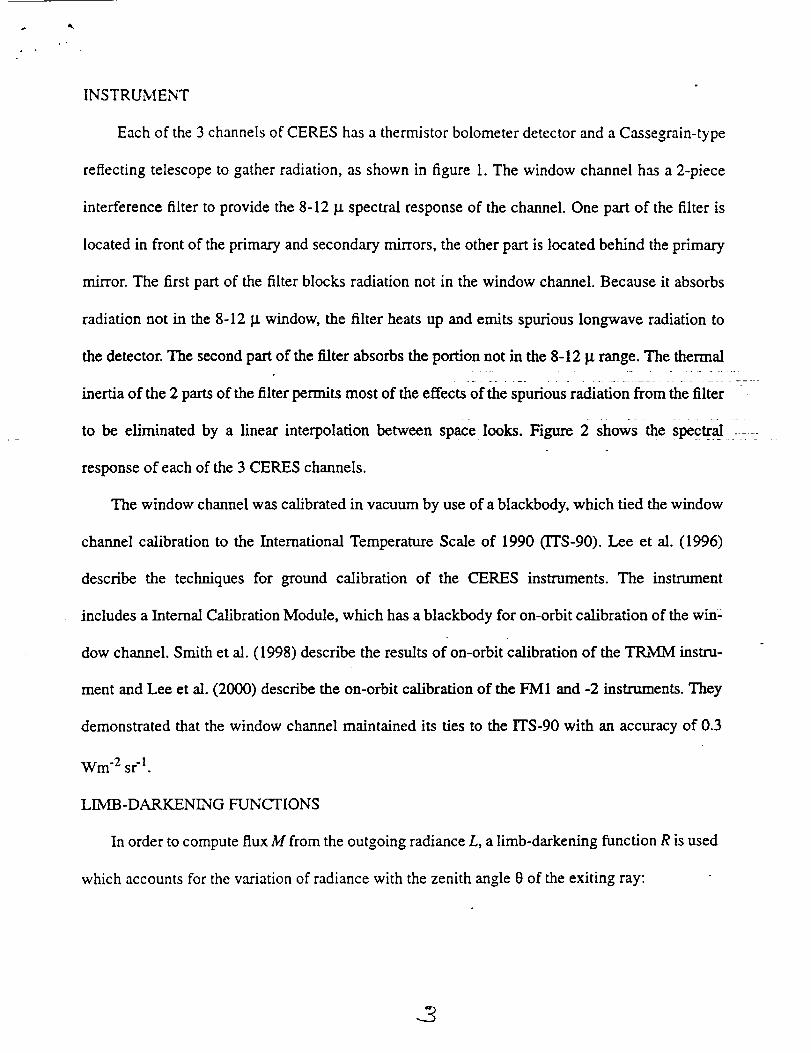
Each of the 3 channels of CERES has a thermistor bolometer detector and a Cassegrain-type
reflecting telescope to gather radiation, as shown in figure 1. The window channel has a 2-piece
interference filter to provide the 8-12 p. spectral response of the channel. One part of the filter is
located in front of the primary and secondary mirrors, the other part is located behind the primary
mirror. The first part of the filter blocks radiation not in the window channel. Because it absorbs
radiation not in the 8-12 l.t window, the filter heats up and emits spurious long'wave radiation to
the detector. The second part of the filter absorbs the portion not in the 8-12 I.t range. The thermal
..................................... - ....
inertia of the 2 parts of the filter permits most of the effects of the spurious radiation from the filter
to be eliminated by a linear interpolation between space looks. Figure 2 shows the specCal_/i
response of each of the 3 CERES channels.
The window channel was calibrated in vacuum by use of a blackbody, which tied the window
channel calibration to the International Temperature Scale of 1990 (ITS-90). Lee et al. (1996)
describe the techniques for ground calibration of the CERES instruments. The instrument
includes a Internal Calibration Module, wkich has a blackbody for on-orbit calibration of the win-
dow channel. Smith et al. (1998) describe the results of on-orbit calibration of the TRMM instru-
ment and Lee et al. (2000) describe the on-orbit calibration of the FM1 and -2 instruments. They
demonstrated that the window channel maintained its ties to the ITS-90 with an accuracy of 0.3
Wm-2 st-1.
LhMB-DARKENhNG FUNCTIONS
In order to compute flux M from the outgoing radiance L, a limb-darkening function R is used
which accounts for the variation of radiance with the zenith angle 0 of the exiting ray:

_LM = (t)
8(O)
The CERES/TR2vlM instrument was operated for 9 days to scan alongtrack, which provided
measurements from which the limb-darkening function LDF can be computed as was done with
Earth Radiation Budget Experiment (ERBE) data (Smith et al., 1988; Smith et al., 1994). The
same scene types were used as for ERBE (Suttles et al., 1988) and were computed for each 18°
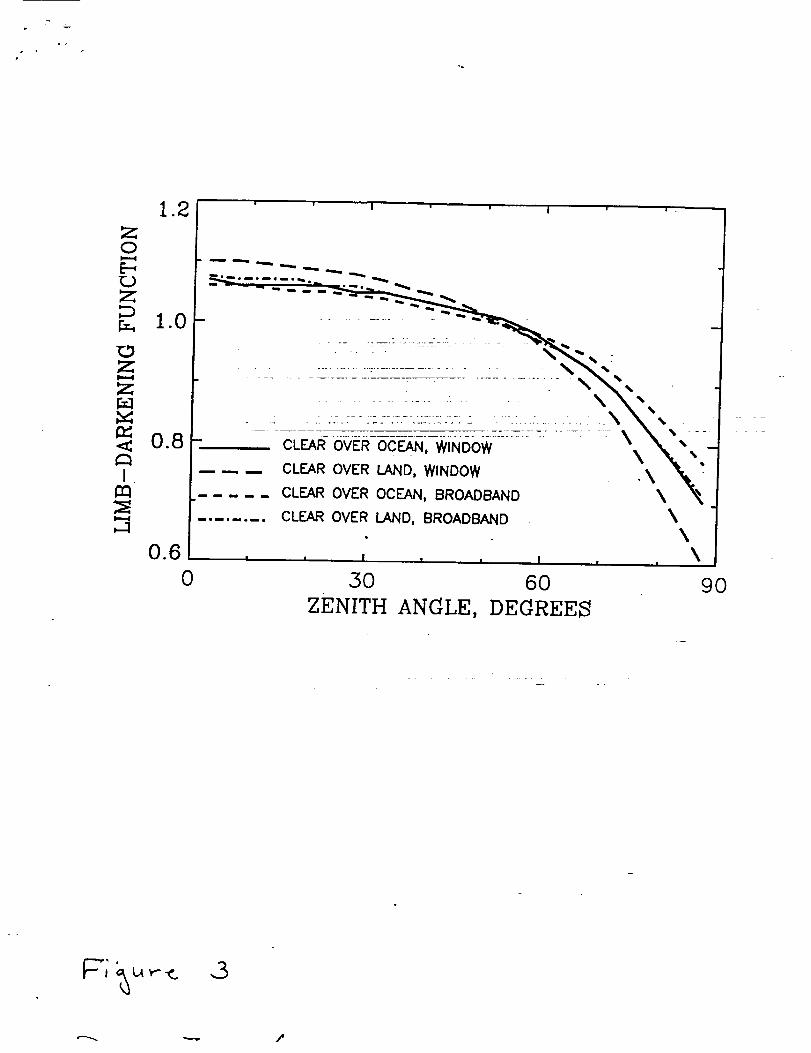
latitude zone from 36°S to 36°N for day and night. Figure 3 shows the LDF for clear sky over
ocean and for land in the zone 18°S to 36°S for the 8-12/.t radiances and also for broadband out-
going longwave radiances. Figure4 shows similar resultsfor partly cloudy sky over ocean and
land in the zone from the Equator to 18°N. The LDF for the 8-12 g window are very similartO
those for the broadband case. The LDF can be approximated very well by use of a 2-parameter
expression:
R(0) = 1 +pp.(1 -e-'t/la)-p_
1+ p[_ - 2E4(1:)- %]
(2)
where IX = cos 0, E 4 is the fourth-order exponential integral. The p and x are not considered to be
physical parameters but are fit to the data for each scene type. Root-mean-square error for the
curve fits are less than 0.005 for view zenith angle 0 less than 70 °. The p and x for the 12 scene
types for these 4 latitude bands for day and night. Table 1 lists p and x for the day models. With
these parameters and equation 2, an LDF can be computed which does not have the random
errors, primarily due to sampling, which are present in the direct computation of LDF from the
data.
4-

MAPS
Pixel data for CERES are listed on the ES-8 file, which includes the shortwave, broadband
longwave and window radiances for each channel and the broadband OLR, pixel location, the
scene type (under the ERBE classification) view zenith angle, solar zenith and azimuth angles, the
fluxes for OLR and reflected solar radiation and sundry other information. With the scene type
and view zenith angle listed for each pixel, the appropriate limb-darkening function' can be
selected and used to compute window channel flux for the pixel. Pixel flux values were gridded
-using a grid which is 1° in both latitude and longitude. Minnis et al. (1984) demonstrated that
window channel radiation has a diurnal cycle which can be described by a half-sine fit. Neverthe-
less, within each grid box a simple average was computed for the day for expediency. The quart- ........
tity listed for the window on ES-8 is the specific radiance, Wm'2sr'lgt "1. In order to compute
radiance, an effective window width of 3.7 g is used. Figure 5 is a map of the 8-12 gt flux thus
computed over the latitude range from 40°S to 40°N for 1 lanuary 1998.
Figure 6 is a map of broadband OLR, also for 1 January 1998, similarly computed for com-
parison. The 2 maps show very similar features but the broadband OLR flux is approximately 3
times the window flux. Although both fluxes were gridded and time-averaged in the same manner,
artifacts appear in the broadband map which do not appear in the window flux map. There are
other differences which are more subtle and which should be more interesting scientifically.
CONCLUDENG REMARKS
The pixel level data for the 8-12 gt window channel as well as the longwave and reflected
solar radiation are available to researchers for the CERESFI_MM data as ES-8 files at the Lan-
gley Distribute Active Archive Centre and can be accessed via the web at URL
http://eosweb.larc.nasa.gov/project/ceres/table ceres.html
5-

0
Z0_=4 "
r.T.I
I
0
rr",,
[.T.I _:0C..). u_

Data from the CERES/Terra instruments are being validated at present and should be available
within a year.
ACKNOWLEDGEMENTS
This work was supported by the Earth Science Enterprise of NASA through Langley
Research Centre by grant NAGl-1959 to VPI&SU and contract NAS 1-19579.
REFERENCES
Barkstrom, B. R.: Earth radiation budget measurements: pre-ERBE, ERBE, and CERES. Long-
Term Monitoring of the Earth's Radian'on Budget, Proc. SPIE 1299, 52-60, Bruce R. Barkstrom,
Editor, 1990.
Inamdar, A.K. and V. Ramariathan_ 1994: Physics of Greenhouse Effect and Convesti0n-in Wai_
Oceans, J. Climate, 7, 715-731.
Lee, R. B. llI, B. R. Barkstrom, G. L. Smith, J. E. Cooper, L. P. Kopia and R. W. Lawrence, S.
Thomas, D.K. Pandey and D.H. Crommelynck: The Clouds and the Earth's Radiant Energy Sys-
tem (CERES) sensors and preflight calibration plans, J. At. & O. Tech, 13, 300-313, 1996.
Lee, R.B., IlI, K.R. Priestley, B.R. Barkstrom, S. Thomas, A. AI-Haijah, J. Paden, D.K. Pandey,
R.S. Wilson and G.L. Smith: Terra Spacecraft CERES flight model 1 and 2 sensor measurement
precisions: ground to flight determination, Proc. SPIE 4135, luly, 2000.
Minnis, P. and Harrison, E.F.: Diurnal Variability of Regional Cloud and Clear-Sky Radiative
Parameters Derived from GOES Data, Part I: Analysis Method, J. Climate AppL Meteorol., 23,
993-1011, 1984.
Smith, G. L., N. Manalo-Smith and L. M. Avis: Limb-darkening models from along-track opera-
tion of the ERBE scanning radiometer, J. Appl. Met., 33, 74-84, 1994.

Smith, G.L., R.B. Lee II7, B.R. Barkstrom, B,A. Wielicki, K.J. Priestley,S. Thomas,J. Paden,
R.S.Wilson, D.K. PandeyandK.L. Thornhill: Overview of CERESSensorsand In-flight Perfor-
mance,Optical Sci., Eng. & lnstrum., Proc. SPIE, 3439, 19-24 July, 1998.
Smith, G. L., J. T. Suttles, and N. Manalo: The ERBE Alongtrack Experiment. IRS '88: Current
Problems in Atmospheric Radiation, A. Deepak Publ., pp. 242-244, 1988.
Suttles, J. T., R. N. Green, G. L. Smith, B. A. Wielicki, I. J. Walker, V. R. Taylor, and L, L. Stowe,:
Angular radiation mode!s.fgr¢ .a!?da-atmosphere system, Vol. II - Longwave radiation, NASA RP-
1184, 1988.r .: .... _.:..._ .......... :___ ................. : ....... _._ _----.-.......
Wielicki, B. A., B. R. Barkstrom, E. F. Harrison; R. B. Lee HI, G. L. Smith ahd J. E.-Co-b--i__F:-_.--:" ......... _--7.-7S_-"----__'7-'-.__'..'77Z-"---'.---'--.T7 ..................... -" "" ---..T__._7-_--?Ts-.
Clouds and the Earth's Radiant-Energy System (CERES): An Earth Observing System Experi-
ment, Bull Amer. Met. Soc., 77, 853-868, 1996.
7
List of Figures
Figure 1. Assembly of CERES 8-12 IXwindow channel.
Figure 2. Spectral response of 8-12 micron window channel for CERES/TRMM instrument.
Figure 3. LDF for clear sky over ocean and land for 18°S to 36°S for 8-12 _t band and for
broadband OLR.
Figure 4. LDF for partly cloudy sky over ocean and land, Equator to 18°N for 8-12 _ band and
for broadband OLR.- ...............
Figure 5. W'mdow channe_l_fl_-?_apfor 1 January 1998..
Figure 6. Broadband OLR fttix-map- for 1 January 1998.

7
n"
a.
O00
_-" C_ 0 0 0 0
_,ndqBnoJql IR.r,,0eds
0

r
.i
Z0
E-,T_)Z
Z
.......... Z
ICcI
1.2
1.0
0.6
0
' ' i ' ' I ' '
,,,I I I J w ! I ,
30 60
ZENITH DEGREES
9O
1.2
1.0
_ 0.8
u m I u ..... u | i _ ,
\\'..- CLEA R OVER OCEAN, WINDOW
___ CL_ROVERu_ND,W,_DOW .\ "%..... CLEAR OVER OCEAN, BROADBAND \
\\
........ CLEAR OVERLAND, BROADBAND
50
ZENITH ANGLE,
0.60 6O
DEGREES
9O
w
3

y
C0
\
\
- - - O_
.............. 0
3
C
0"3
0
(JC
0
"00
C0k.
U
('4
c0
mW
U./o
0
Z
W
0

• °
0
0_D
0
0(N
?Z_".El"

Rutherford Appleton Laboratory I
GERBR_'f; _ ISG-RA L-G E-PL-0009
Issue: 3Dale: I December 1997
ase: 25
APPENDIX K: NASA Langley Research Center, USA
Studies of Diurnal Processes
M. G. Mlynczak, G. Louis Smith and Bruce A. Wielicki
. ._ .-4
.... _ _-:2.__..__.._w.__._l ..
GERB measurements will be useful for a broad range of radiation budget studies. The
present discussion is limited to diurnal processes, for which GERB will provide
accurate radiation measurements for the first time. Diurnal processes have beenstudied using Meteosat and GOES data from narrow band channels (Minnis and
Harrison, 1984; Duvel and Kandel, 1985; Cheruy et al., 199l), but deficiences of
extracting broadband radiation components from narrowband channels limit the
accuracy with which one can retrieve outgoing longwave radiances and reflected
solar radiation. Diurnal variations are strongest in low latitudes, where radiation
plays a major role in deserts and in deep convective processes. A better
understanding of weather and climate in these regions will be provided by GERB -
data. Because weather systems are quite mobile, weather in these regions can :-.-
ultimately affect other regions far away. We discuss some phenomena for which ......GERB will provide greatly needed data for improved und erstanding.
The diurnal cycle of outgoing longwave radiation OLR over the Sahara Desert is the
strongest over the planet (Harrison et al., 1988) and has been studied by Duvel and
Kandel (1985). Charney (197?) explained the flow over a desert in terms of the
subsidence due to OLR. This explanation is verified by noting that the deserts stand
out in maps of monthly-mean net radiation as having large negative values.
The deep convection regions of the Congo Basin and the Amazon also have very
strong diurnal cycles. These are manifested by a pattern of clear mornings, with low
clouds developing in the afternoon and developing into deep convection in late
afternoon and evening, which clears by morning: The cycle operates as follows• Solar
energy is absorbed at the surfce and much is converted into latent heat by vaporizingsurface water and by evapo-transpiration. By afternoon, sufficient energy is stored at
low level that when the sensible heat has developed an unstable temperature profile,
the system erupts into a deep convection system in which the latent heat of
vaporization lifts air from the boundary layer to near the tropopause. The system is a
steam engine whichs absorbs solar energy, converts it to latent energy and then to
potential energy. The lifted air then flows from the deep convective region at highaltitude and is replaced by air flowing into the region in the boundary layer. Most of
the water in the process is recycled several times before flowing out the Congo or
Amazon River. Water which flows out the river is replaced by moisture in the
incoming boundary layer flow. The air which has been lifted to high altitude then
flows to the subgsidence regions of the globe. Thus, the coupled deep convection/
subsidence system is a heat engine with solar radiation in the deep convestive regionsas the heat source and outgoing longwave radiation in the subsidence regions as theheat sink.

Rutherford Applelon Laboratory GERB
l Ref: MSG-RA L-GE-PL-0009
Issue: 3
Date: t December 1997
Pase: 26
. , ". -. . . .
During boreal winter the deep convective regions move northward. The result is that
in Africa the deep convection moves toward the Sahel, bringing the wet season.
Meso-scale convective corn plexes MCC occur here frequently (Laing and Fritsch,
1997; Haile et al., 1994). MCC develop as the result of absorption of solar radiation to
generate latent and sensible heat to form a set of deep convective cells. When this setof cells is organized by the synoptic scale pattern, the individual storms can coalesce
into an MCC, which has a life of its own and lasts for several days. Such systems are
not only of regional interest. From June through October, depressions moving with
easterlies from West Africa across the Atlantic Ocean are carefully watched, as theycan organize the high latent heat over the Caribean region into tropical storms andhurricanes.
Although not in the part of Earth which is viewed by GERB, the Great Plains of theUnited States are greatly affected by MCC (Mattox, 1980). MCC.s were not discovered
until geosynchronous satellite imagery made it possible to observe them, However,
they are responsible for most summertime precipitation over the Plains. Furthermore, _ -'-
they develop into synoptic processes which then propagate to affect the eastwardpar:t ....
of the US. For this reason, a GERB on a GOES would be extremely valuable for -understanding these very important processes over the US.
._,_ - :___,,..a _ " -: "--
Charney, J., 1977: Classical deserification paper.
Cheruy, F., R. S. Kandel and J. P. Duvel, 1991: Outgoing longwave radiationand its diurnal variation from combined ERBE and Meteosat observations,
Part II: Using Meteosat data to determine the LW cycle, J. Geophys. Res.,96, 22623-22630.
Duvel and R. S. Kandel, 1985; Regional-scale diurnal variations of outgoing
longwave radiation observed by Meteosat, J'. Clim. Appl. Met., 24, 335-349.
Haile, M., J. R. Milford and G. Dugdale, 1994; Mesoscale Convective Complexesin Sahelian Africa asa Observed by Meteosat, 255-266, Proc. !0-th Meteosat
Scientific User's Conference, Cascais, Portugal, 5-9 September.
Harrison, E. F., D. R. Brooks, P. Minnis, B. A. wielicki, W. F. Staylor, G.G.Gibson, D. F. Young, F. M. Denn and the ERBE Science Team, 1988: First
estimates of the diurnal variation of longwave from the multiple-satelliteEarth radiation budget Experiment (ERBE), Bull. Amer. Met. Soc., 69,1144-1151.
Laing, A. G. and J'. M. Fritsch, 1997: The global population of mesoscale
convective complexes, Q. J. R. Meteorol. Soc., 123, 389-405.
Mattox, R. A., 1980: Mesoscale Convective Comlexes, Bull. Amer. Met. Soc.,61, 1374-1387.
Minnis, P. and E. F. Harrison, 1984: Diurnal variability of regional cloudand clear sky radiative parameters derived from GOES data, Part III:
November 1978 radiative parameters, J. Clim. Appl. Met., v. 23, pp1032-1052.