final report: membrane-mediated extraction and biodegradation … final report: membrane-mediated...
TRANSCRIPT

EPA-600/R-05/035AFRL-ML-TY-TR-2002-4506January 2005
Final Report:Membrane-Mediated Extraction andBiodegradation of Volatile OrganicCompounds from Air
Stephen W. Peretti and Robert D. ShepherdNorth Carolina State UniversityRaleigh, NC 27695
Russell K. Clayton and David E. ProffittARCADIS Geraghty & Milller4915 Prospectus DriveDurham, NC 27713
EPA Project OfficerNorman KaplanOffice of Research and DevelopmentNational Risk Management Research Laboratory109 T.W. Alexander DriveResearch Triangle Park, NC 27711
Approved for Public Release; Distribution Unlimited
AIR FORCE RESEARCH LABORATORYMATERIALS & MANUFACTURING DIRECTORATEAIR EXPEDITIONARY FORCES TECHNOLOGIES DIVISION139 BARNES DRIVE, STE 2TYNDALL AFB FL 32403-5323

Report Documentation Page Form ApprovedOMB No. 0704-0188
Public reporting burden for the collection of information is estimated to average 1 hour per response, including the time for reviewing instructions, searching existing data sources, gathering andmaintaining the data needed, and completing and reviewing the collection of information. Send comments regarding this burden estimate or any other aspect of this collection of information,including suggestions for reducing this burden, to Washington Headquarters Services, Directorate for Information Operations and Reports, 1215 Jefferson Davis Highway, Suite 1204, ArlingtonVA 22202-4302. Respondents should be aware that notwithstanding any other provision of law, no person shall be subject to a penalty for failing to comply with a collection of information if itdoes not display a currently valid OMB control number.
1. REPORT DATE 10 NOV 2001 2. REPORT TYPE
3. DATES COVERED -
4. TITLE AND SUBTITLE Membrane-Mediated Extraction and Biodegradation of VOCs from Air
5a. CONTRACT NUMBER F08637-98-c-6002
5b. GRANT NUMBER
5c. PROGRAM ELEMENT NUMBER 63716D
6. AUTHOR(S) Stephen Peretti; Robert Shepherd; Russell Clayton; David Proffitt
5d. PROJECT NUMBER 3904
5e. TASK NUMBER A3
5f. WORK UNIT NUMBER 3904A38B
7. PERFORMING ORGANIZATION NAME(S) AND ADDRESS(ES) ARCADIS Geraghty & Miller,4915 Prospectus Drive,Durham,NC,27713
8. PERFORMING ORGANIZATION REPORT NUMBER EPA-600/R-05/035
9. SPONSORING/MONITORING AGENCY NAME(S) AND ADDRESS(ES) 10. SPONSOR/MONITOR’S ACRONYM(S)
11. SPONSOR/MONITOR’S REPORT NUMBER(S)
12. DISTRIBUTION/AVAILABILITY STATEMENT Approved for public release; distribution unlimited
13. SUPPLEMENTARY NOTES

14. ABSTRACT This report describes feasibility tests of a two-step strategy for air pollution control applicable to exhaustair contaminated with volatile organic compounds (VOCs) from painting aircract. In the first step of thetwo-step strategy, the VOC-contaminated exhaust air passes over coated, polypropylene, hollow-fibermembranes while an involatile liquid (silicone oil, mineral oil, decanol, octanol) is pumped counter-currentthrough the filters. The organic liquid captures the VOCs, and their concentration in the circulating liquidincreases whenever exhaust air circulates. In the second step, the circulating organic loop passes through asecond set of hollow-fiber membranes that support a culture of microorganisms, which remove andmetabolize the VOCs, on their exterior surfaces. The concentration of VOCs in the circulating looposcillates as the painting process starts and stops because VOC capture by the liquid is a fast processwhereas removal and metabolization by microorganisms is a slow process. Despite constraints caused bylimited availability of commercial membrane packages, adequate rates of removal and transport into andout of circulating octanol were shown to be adequate to support the proposed technology. Biodegradationwas also qualitatively validated, although each of the organisms used in these tests selectively metabolizedspecific classes of solvents; however, other cultures or sequential treatment stages are expected to providestatisfactory removal. Scale-up revealed material incompatibility of the membranes and adhesives withoctanol. Silicone oils and vegetable oils were briefly tested as the circulating organic liquid at the end of theproject. Pressure drop also remains as an engineering challenge unless ventilation exhause rates are decreased.
15. SUBJECT TERMS
16. SECURITY CLASSIFICATION OF: 17. LIMITATIONOF ABSTRACT
18. NUMBEROF PAGES
186
19a. NAME OFRESPONSIBLE PERSON
a. REPORT unclassified
b. ABSTRACT unclassified
c. THIS PAGE unclassified
Standard Form 298 (Rev. 8-98) Prescribed by ANSI Std Z39-18

iii

iv
Foreword
The U.S. Environmental Protection Agency (EPA) is charged by Congress with protecting theNation’s land, air, and water resources. Under a mandate of national environmental laws, theAgency strives to formulate and implement actions leading to a compatible balance between humanactivities and the ability of natural systems to support and nurture life. To meet this mandate, EPA’sresearch program is providing data and technical support for solving environmental problems todayand building a science knowledge base necessary to manage our ecological resources wisely,understand how pollutants affect our health, and prevent or reduce environmental risks in thefuture.
The National Risk Management Research Laboratory (NRMRL) is the Agency’s center forinvestigation of technological and management approaches for preventing and reducing risks frompollution that threaten human health and the environment. The focus of the Laboratory’s researchprogram is on methods and their cost-effectiveness for prevention and control of pollution to air,land, water, and subsurface resources; protection of water quality in public water systems;remediation of contaminated sites, sediments and ground water; prevention and control of indoorair pollution; and restoration of ecosystems. NRMRL collaborates with both public and privatesector partners to foster technologies that reduce the cost of compliance and to anticipate emergingproblems. NRMRL’s research provides solutions to environmental problems by: developing andpromoting technologies that protect and improve the environment; advancing scientific andengineering information to support regulatory and policy decisions; and providing the technicalsupport and information transfer to ensure implementation of environmental regulations andstrategies at the national, state, and community levels.
This publication has been produced as part of the Laboratory’s strategic long-term researchplan. It is published and made available by EPA’s Office of Research and Development to assistthe user community and to link researchers with their clients.
Sally Gutierrez, Acting DirectorNational Risk Management Research Laboratory

v
EPA Review Notice
This report has been peer and administratively reviewed by the U.S. Environmental ProtectionAgency and approved for publication. Mention of trade names or commercial products does notconstitute endorsement or recommendation for use.
This document is available to the public through the National Technical Information Service,Springfield, Virginia 22161.

vi
Abstract
This report describes feasibility tests of a two-step strategy for air pollution control applicable toexhaust air contaminated with volatile organic compounds (VOCs) from painting aircraft. In the firststep of the two-step strategy, the VOC-contaminated exhaust air passes over coated, polypropylene,hollow-fiber membranes while an involatile organic liquid (silicone oil, mineral oil, decanol,octanol) is pumped counter-current through the fibers. The organic liquid captures the VOCs, andtheir concentration in the circulating liquid increases whenever exhaust air circulates. In the secondstep, the circulating organic liquid loop passes through a second set of hollow-fiber membranes thatsupport a culture of microorganisms, which remove and metabolize the VOCs, on their exteriorsurfaces. The concentration of VOCs in the circulating liquid loop oscillates as the painting processstarts and stops because VOC capture by the liquid is a fast process whereas removal andmetabolization by microorganisms is a slow process. Despite constraints caused by limitedavailability of commercial membrane packages, adequate rates of removal and transport into andout of circulating octanol were shown to be adequate to support the proposed technology.Biodegradation was also qualitatively validated, although each of the organisms used in these testsselectively metabolized specific classes of solvents; however, other cultures or sequential treatmentstages are expected to provide satisfactory removal. Scale-up revealed material incompatibility ofthe membranes and adhesives with octanol. Silicone oils and vegetable oils were briefly tested asthe circulating organic liquid at the end of the project. Pressure drop also remains as an engineeringchallenge unless ventilation exhaust rates are decreased.

vii
Acknowledgments
This research was supported by the U.S. Department of Defense through the Strategic Environ-mental Research and Development Program (SERDP). This report was prepared under ContractNumber 68-C-99-201 for the U.S. Environmental Protection Agency (EPA), Research Triangle Park,NC.
This final report describes work performed from 1 March 1998 to 30 January 2001. The Co-Principal Investigators were first Norman Kaplan then Jack Wasser of EPA’s National RiskManagement Research Laboratory (NRMRL) and Dr. Joe Wander of the Air Force ResearchLaboratory (AFRL/MLQ).
The authors particularly acknowledge the contributions and guidance of Bradley Smith and Dr.Robert Holst of the SERDP Program Office and the review panel members, without whose help thisstudy would not have been possible.

viii
Table of Contents
Section PageNotices . . . . . . . . . . . . . . . . . . . . . . . . . . . . . . . . . . . . . . . . . . . . . . . . . . . . . . . . . . . . . . . . . . . . iiForeword . . . . . . . . . . . . . . . . . . . . . . . . . . . . . . . . . . . . . . . . . . . . . . . . . . . . . . . . . . . . . . . . . iiiAbstract . . . . . . . . . . . . . . . . . . . . . . . . . . . . . . . . . . . . . . . . . . . . . . . . . . . . . . . . . . . . . . . . . . . vAcknowledgments . . . . . . . . . . . . . . . . . . . . . . . . . . . . . . . . . . . . . . . . . . . . . . . . . . . . . . . . . . viIndex of Tables . . . . . . . . . . . . . . . . . . . . . . . . . . . . . . . . . . . . . . . . . . . . . . . . . . . . . . . . . . . . ixIndex of Figures . . . . . . . . . . . . . . . . . . . . . . . . . . . . . . . . . . . . . . . . . . . . . . . . . . . . . . . . . . . . . xExecutive Summary . . . . . . . . . . . . . . . . . . . . . . . . . . . . . . . . . . . . . . . . . . . . . . . . . . . . . . . . . xi
1.0 Objective . . . . . . . . . . . . . . . . . . . . . . . . . . . . . . . . . . . . . . . . . . . . . . . . . . . . . . . . . . . . . . . 11.1 Background . . . . . . . . . . . . . . . . . . . . . . . . . . . . . . . . . . . . . . . . . . . . . . . . . . . . . . . . . . 1
1.1.1 Membrane BioTechnology Development Background . . . . . . . . . . . . . . . . . . . . 21.1.2 Treatment Process Concept . . . . . . . . . . . . . . . . . . . . . . . . . . . . . . . . . . . . . . . . . 5
1.2 Scope . . . . . . . . . . . . . . . . . . . . . . . . . . . . . . . . . . . . . . . . . . . . . . . . . . . . . . . . . . . . . . . 7
2.0 Technical Objectives . . . . . . . . . . . . . . . . . . . . . . . . . . . . . . . . . . . . . . . . . . . . . . . . . . . . . . 8
3.0 Results at Bench-Scale . . . . . . . . . . . . . . . . . . . . . . . . . . . . . . . . . . . . . . . . . . . . . . . . . . . . 103.1 Development of Coated Modules . . . . . . . . . . . . . . . . . . . . . . . . . . . . . . . . . . . . . . . . 103.2 Membranes Coated with Silicone Rubber . . . . . . . . . . . . . . . . . . . . . . . . . . . . . . . . . . 133.3 Experimental Structure . . . . . . . . . . . . . . . . . . . . . . . . . . . . . . . . . . . . . . . . . . . . . . . . 18
3.3.1 MBT Bench-Scale Separation Contactor . . . . . . . . . . . . . . . . . . . . . . . . . . . . . . 193.3.2 Pilot Testing . . . . . . . . . . . . . . . . . . . . . . . . . . . . . . . . . . . . . . . . . . . . . . . . . . . . 20
4.0 Results/Data . . . . . . . . . . . . . . . . . . . . . . . . . . . . . . . . . . . . . . . . . . . . . . . . . . . . . . . . . . . . 234.1 Separation Module Tests . . . . . . . . . . . . . . . . . . . . . . . . . . . . . . . . . . . . . . . . . . . . . . . 23
4.1.1 Bench-Scale Tests . . . . . . . . . . . . . . . . . . . . . . . . . . . . . . . . . . . . . . . . . . . . . . . . 234.1.2 Pilot-Scale Tests . . . . . . . . . . . . . . . . . . . . . . . . . . . . . . . . . . . . . . . . . . . . . . . . . 25
4.2 Biological Treatment System . . . . . . . . . . . . . . . . . . . . . . . . . . . . . . . . . . . . . . . . . . . . 294.2.1 Suspended-Cell Experiments . . . . . . . . . . . . . . . . . . . . . . . . . . . . . . . . . . . . . . . 30
4.2.1.1 Screening Studies . . . . . . . . . . . . . . . . . . . . . . . . . . . . . . . . . . . . . . . . . . . . 304.2.1.2 Xylene Degraders . . . . . . . . . . . . . . . . . . . . . . . . . . . . . . . . . . . . . . . . . . . 30

Table of Contents (continued)
Section Page
ix
4.2.1.3 Aliphatic Degraders . . . . . . . . . . . . . . . . . . . . . . . . . . . . . . . . . . . . . . . . . . 314.2.1.4 Growth Studies . . . . . . . . . . . . . . . . . . . . . . . . . . . . . . . . . . . . . . . . . . . . . 314.2.1.5 MX and X1 Growth on p-Xylene (GS 11, 12) . . . . . . . . . . . . . . . . . . . . . . 324.2.1.6 Effect of Ethylbenzene on Growth of X1 on m-Mylene (GS13) . . . . . . . . 334.2.1.7 Growth of X1 on m-Xylene and p-Xylene (GS14) . . . . . . . . . . . . . . . . . . 344.2.1.8 M1 Growth on Butyl Acetate and a 50:50 Mixture of Butyl Acetate
and MEK (GS 15, 19) . . . . . . . . . . . . . . . . . . . . . . . . . . . . . . . . . . . . . . . . 354.2.2 Flat-Sheet Biofilm Experiments . . . . . . . . . . . . . . . . . . . . . . . . . . . . . . . . . . . . . 35
4.2.2.1 Growth of X1 on m-Xylene and p-Xylene (FS 6, 7, 8) . . . . . . . . . . . . . . . 374.2.2.2 Growth of X1 on m-Xylene and p-Xylene (FS 9) . . . . . . . . . . . . . . . . . . . 39
4.2.3 Hollow-Fiber Membrane Experiments . . . . . . . . . . . . . . . . . . . . . . . . . . . . . . . . 394.2.4 Staged Biotreatment of VOC Mixtures in Lab-Scale Reactor . . . . . . . . . . . . . . 40
5.0 Conclusions . . . . . . . . . . . . . . . . . . . . . . . . . . . . . . . . . . . . . . . . . . . . . . . . . . . . . . . . . . . . 435.1 Separation System . . . . . . . . . . . . . . . . . . . . . . . . . . . . . . . . . . . . . . . . . . . . . . . . . . . . 435.2 Biotreatment System . . . . . . . . . . . . . . . . . . . . . . . . . . . . . . . . . . . . . . . . . . . . . . . . . . 45
5.2.1 Biodegradation Range and Extent . . . . . . . . . . . . . . . . . . . . . . . . . . . . . . . . . . . 455.2.2 Problems Arising from Metabolic Regulation . . . . . . . . . . . . . . . . . . . . . . . . . . 455.2.3 Treatment Strategy . . . . . . . . . . . . . . . . . . . . . . . . . . . . . . . . . . . . . . . . . . . . . . . 465.2.4 Implementation . . . . . . . . . . . . . . . . . . . . . . . . . . . . . . . . . . . . . . . . . . . . . . . . . . 46
6.0 Recommendations . . . . . . . . . . . . . . . . . . . . . . . . . . . . . . . . . . . . . . . . . . . . . . . . . . . . . . . 47
AppendicesAppendix A Literature Search and Review . . . . . . . . . . . . . . . . . . . . . . . . . . . . . . . . . . . . . . A-iAppendix B Bench-Scale Data . . . . . . . . . . . . . . . . . . . . . . . . . . . . . . . . . . . . . . . . . . . . . . . B-iAppendix C Pilot-Scale Data . . . . . . . . . . . . . . . . . . . . . . . . . . . . . . . . . . . . . . . . . . . . . . . . . C-i

x
Index of Tables
Table Page1 Compounds Successfully Biodegraded . . . . . . . . . . . . . . . . . . . . . . . . . . . . . . . . . . . . . . . . 32 Growth Rates of MX-2 with Modified Carbon Sources . . . . . . . . . . . . . . . . . . . . . . . . . . . 43 Partition Coefficient Values . . . . . . . . . . . . . . . . . . . . . . . . . . . . . . . . . . . . . . . . . . . . . . . . . 44 Oxygen Uptake Rates for Various VOCs . . . . . . . . . . . . . . . . . . . . . . . . . . . . . . . . . . . . . . 55 PDD-Coated Membrane Results . . . . . . . . . . . . . . . . . . . . . . . . . . . . . . . . . . . . . . . . . . . . 116 Fiber Coating Technique Development . . . . . . . . . . . . . . . . . . . . . . . . . . . . . . . . . . . . . . . 127 Air-in-Shell Tests – Cylindrical Parallel-Flow AMT Module . . . . . . . . . . . . . . . . . . . . . 148 Octanol-in-Shell Tests – Cylindrical Parallel-Flow AMT Module . . . . . . . . . . . . . . . . . . 159 Tertiary Mixtures in the Air Stream . . . . . . . . . . . . . . . . . . . . . . . . . . . . . . . . . . . . . . . . . 2210 Typical Flow Rates Used During Testing . . . . . . . . . . . . . . . . . . . . . . . . . . . . . . . . . . . . . 2211 Summary of Bench-Scale VOC Tests . . . . . . . . . . . . . . . . . . . . . . . . . . . . . . . . . . . . . . . . 2412 Summary of Pilot-Scale VOC Tests . . . . . . . . . . . . . . . . . . . . . . . . . . . . . . . . . . . . . . . . . 2613 Suspension-Culture Experiments . . . . . . . . . . . . . . . . . . . . . . . . . . . . . . . . . . . . . . . . . . . . 3214 Flat-Sheet Biofilm Experiments . . . . . . . . . . . . . . . . . . . . . . . . . . . . . . . . . . . . . . . . . . . . 3615 Biomembrane Mass Transfer . . . . . . . . . . . . . . . . . . . . . . . . . . . . . . . . . . . . . . . . . . . . . . . 4016 Biotreatment of VOC Mixtures in a Lab-Scale Reactor . . . . . . . . . . . . . . . . . . . . . . . . . . 4117 Concurrent Degradation . . . . . . . . . . . . . . . . . . . . . . . . . . . . . . . . . . . . . . . . . . . . . . . . . . . 45

xi
Index of Figures
Figure Page1 MBT System Schematic . . . . . . . . . . . . . . . . . . . . . . . . . . . . . . . . . . . . . . . . . . . . . . . . . . . 22 VOC Extraction in the S/C Unit . . . . . . . . . . . . . . . . . . . . . . . . . . . . . . . . . . . . . . . . . . . . . 63 Bioextraction of VOCs . . . . . . . . . . . . . . . . . . . . . . . . . . . . . . . . . . . . . . . . . . . . . . . . . . . . 64 AMT Cross-Flow Module – Overall Dimensions in Inches . . . . . . . . . . . . . . . . . . . . . . . 165 Pressure Drop for AMT Cross-Flow Module . . . . . . . . . . . . . . . . . . . . . . . . . . . . . . . . . . 176 Separation Module Bench-Scale Test Apparatus . . . . . . . . . . . . . . . . . . . . . . . . . . . . . . . 197 Process Schematic of Separation Module Bench-Scale Apparatus . . . . . . . . . . . . . . . . . . 208 Pilot-Scale System Design . . . . . . . . . . . . . . . . . . . . . . . . . . . . . . . . . . . . . . . . . . . . . . . . . 219 Flat-Sheet Contactor Schematic . . . . . . . . . . . . . . . . . . . . . . . . . . . . . . . . . . . . . . . . . . . . . 35

xii
Blank Page
xiii
Executive Summary
A. ObjectiveThe objective of this project was to examine the feasibility of capturing and destroying volatileorganic compounds (VOCs) from process or storage exhaust air by extracting the VOCs through acoated, hollow-fiber membrane into an involatile liquid and then metabolizing them with bacteriaresiding on the exterior surface of a second, coated, hollow-fiber membrane.
B. Background
1. VOC Emissions from Large Aircraft-Painting FacilitiesImplementation of the Clean Air Act in the form of the National Emission Standards for HazardousAir Pollutants for aerospace coating operations (Aerospace Manufacturing and Rework FacilitiesNESHAP) imposed a requirement that large aircraft-painting operations either apply an emissioncontrol system to decrease the amount of VOC emitted to the atmosphere by at least a thresholdamount (originally 81 percent) or apply coating materials that contain less than a specified (for each)threshold amount of VOCs. Strenuous efforts to develop competent low-VOC coatings have notbeen uniformly successful, and use of these compliant coatings generally involves compromises incoat quality and durability and in preparation, application, and curing time and effort.
By most standards, the option to control emissions is by far the superior approach because itpreserves availability of coatings that have been optimized after decades of development andexperience, because it involves no changes to the established painting methods and techniques, andbecause the amount of VOCs emitted are less than half that from an equivalent operation conductedwith low-VOC coatings. However, ventilation of an aircraft-painting facility makes inefficient useof air by continuously ventilating the entire volume of a hangar while painting is conductedintermittently in a much smaller part of it, so the exhaust volume is large and the level ofcontamination is low. Both factors act to drive up the cost to decontaminate these exhausts byconventional VOC control methods.
The Strategic Research & Development Program (SERDP) issued Statement of Need CP-98, VOCControl Technology for Aircraft Painting and Depainting Facilities as a call for develop-ment andevaluation of alternative technologies that, alone or in combination with flow-reduction technologies(e.g., exhaust recirculation), would decrease the cost to control emissions of VOCs from aircraft

xiv
painting operations. Heat generation and loss in processes handling flow rates approaching 1Mft3/min is commonly the main source of cost, fuel consumption, and greenhouse gas and airbornepollutant generation. As efforts to oxidize organic vapors by catalysis at low temperatures havefound success only with such easily oxidized materials as aldehydes and thioethers, the most-promising avenue of development is through concentration of the VOCs prior to destruction.Recovery is possible as well but rarely economical for gross mixtures of solvents.
2. Membrane Extraction and BiotreatmentWith appropriate modification of the structural polymeric surface, hollow-fiber membranes (HFMs)allow selective passage of molecules based on their physical properties. Significant research hasexamined separation and biotreatment of VOCs from air streams with varying degrees of success.A literature search performed during this project led to several pertinent conclusions regardingmembrane configuration, materials of construction, extraction fluid, module operation and controlof biofouling. These conclusions are summarized as follows:1. Hollow fiber shell-and-tube membrane modules offer the highest possible surface-area-to-
volume ratio, roughly an order of magnitude more than the nearest alternate, the spiral-woundconfiguration.
2. Asymmetric, composite membranes composed of a highly porous support membrane coated bya thin, nonporous, permselective film offer the most effective combination of perme-ability andselectivity.
3. For gas-liquid systems, it is most efficient to have the coating film contacted by the liquid phaseand the pores filled by the gas. For instances where the coating film is the predominant masstransfer resistance, the fluid that fills the pores is less important.
4. The composition of the coating film is critical to performance. In decreasing order ofpermeability to organic vapors, it was found that poly[(1-trimethylsilyl)-1-propyne] (PTMSP)is greater than polydimethylsiloxane (PDMS) which is greater than polyalkylsulfone (PAS-16),other rubbery polymers are greater than fluoropolymers. Although PTMSP exhibits the highestpermeability to organic vapors, its performance decays relatively rapidly over time, so it is notconsidered suitable for long-term commercial applications. PDMS is a rubbery polymer that,along with other silicone rubber derivatives, is the material of choice by researchers involvedin organic vapor separations. PAS-16 is relatively uncharacterized but offers excellent propertiesas a rubbery polymer with local crystallinity.
5. Lower temperatures favor organic vapor separations.6. Removal percentages in excess of 95 percent are possible with membrane extraction systems
operated with gas–membrane contact times on the order of 20 seconds.7. Low-vapor-pressure oils and alcohols (silicone oil, mineral oil, decanol, octanol) exhibit
excellent solubility and permeability characteristics for organic vapor separation, with silicone

xv
Figure E-1. MBT System Schematic
oil exhibiting optimal performance in composite membranes.
Peretti et al. have filed for a patent for the use of coated HFMs with involatile solvents to captureVOCs from furniture-finishing industries and to biodegrade the VOCs by a process of direct captureacross a second HFM by bacteria colonizing the external surface.
Figure E-1 depicts the functional elements and flows in the Membrane Extraction and Biotreatment(MBT) process. Contaminated exhaust gas enters at the bottom left and is stripped of VOCs as itpasses upward through an array of parallel HFMs. The stripped exhaust is released to theatmosphere, so the amount of VOC in the treated exhaust is the total amount released, and thisamount defines the efficiency of the control device. An involatile solvent circulates inside the HFMsopposite to the direction of airflow, so the concentration of captured VOCs increases downward tothe point of entry of the facility exhaust before entering the bottom of the membrane bioreactor(MBR).
The MBR is a similar array of parallel HFMs surrounded by a nutrient medium circulated downwardamong the HFMs to sustain a culture of microorganisms adhering to their surface. The solvent andits load of VOCs rises inside the HFMs while the microorganisms capture and consume part of theVOCs. During periods of painting, VOCs will enter the system faster than the microorganisms can

xvi
K
CP
C
Cp
C
AQ Q P
O
AO
AO
mO A
=
−
−
⎛
⎝
⎜⎜⎜⎜
⎞
⎠
⎟⎟⎟⎟
−⎛⎝⎜
⎞⎠⎟
ln
22
11
1 1
consume them. The stripping fluid storage tank is a reservoir of fluid with an unreacted VOCconcentration that increases gradually during painting and subsides during interludes betweenpainting episodes. This distribution of peak load serves both to decrease the size of the MBR andto ensure a fairly constant rate of delivery of VOCs to the MBR.
Operating equations were derived to describe the membrane separation processes for a system withnon-coated hollow fibers and using octanol as the stripping fluid. The final result for theseparation/concentration unit was a design equation that relates concentration, partition coefficient,membrane surface area, and flow rate to an overall mass transfer coefficient, Ko. The Ko is based onthe overall system driving force and is defined by a sum of resistances model. In the equation shownbelow for Ko in the separation/concentration unit, the concentration (C) subscripts A and O denotethe air and octanol phases, and subscripts 1 and 2 represent inlet and outlet conditions, respectively.P is the air/octanol equilibrium partition coefficient, Q is the volumetric flow of the respectivephases (cubic centimeters per second), and Am is the membrane surface area (square centimeters).
Experiments were initially conducted using individual pure VOCs that are typical components ofpaints to assess mass transfer rates and removal efficiencies. Studies progressed to include VOCmixtures and real military paint. Degradation of VOCs was measured for individual and mixedbiofilm cultures. All of these experiments were necessary because both the separation andbiotreatment processes are competitive among the species present.
C. ScopeThis is the final technical report for SERDP project CP-1105, Membrane-Mediated Extraction andBiotreatment of VOCs. Results of the first half of the project have been presented at two nationalmeetings. The associated long abstracts published in the respective meeting proceedings areincluded as Appendixes D and E.
xvii
D. MethodologyInitial evaluations of mass transfer coefficients for the membrane module were conducted byquantifying the removal of each individual VOC [m-xylene, toluene, methyl ethyl ketone (MEK)]from an air stream. Experiments were performed to determine the effect of airflow rate, strippingfluid flow rate, air stream VOC concentration, and stripping fluid VOC concentration on overallmass transfer coefficients. This early work was performed using the Celgard Liqui-Cell module. Thefocus of the separation/concentration process development was aimed at producing a module thatprovided high-efficiency removal of VOCs from the airstream at high air flow rates and lowpressure drop.
E. Test DescriptionNumerous biotreatment experiments were conducted to determine efficacy of the proposed biotreatmentmodule for enhanced VOC removal from the stripping fluid. These studies included the following:
! Screening experiments to identify organisms able to degrade paint VOCs! Liquid–liquid stripping efficiency of MEK with and without a biofilm present! Degradation of individual and mixed VOCs with individual and mixed organism biofilms! Growth of degraders and degradation of single and mixed VOCs to determine strain characterization,
substrate range, metabolic regulation, and organism interactions! Capacity of dual organisms in staged reactors to degrade mixtures of differently soluble VOCs
F. Results and DiscussionThe Celgard Liqui-Cell membrane module, or contactor, was used in the early bench-scaleexperiments. Because of the difference in pressures between the air and stripping fluid sides of theHFMs, some leakage of stripping fluid into the air occurred. Because it is not economically feasibleto pressurize the air side to prevent this leakage, the application of a thin coating of a VOC-permeable coating to the HFMs, preferably on the inside of the fibers to maximize mass transfer wasconsidered. Acceptable coated fibers and modules were not commercially available, and work witha number of vendors to provide a suitable contactor proved to be unsuccessful. An in situ coatingtechnique for the Celgard contactor was developed but was found to be too time consuming as acost-effective approach.
A secondary issue regarding cost-effective contactor design was the relatively high pressure requiredto drive the air through the Celgard module. Discussions were held with module vendors to developan efficient separation/concentration module with non-porous coated fibers and low pressure drop.Applied Membrane Technologies (AMT) was selected to provide a cross-flow module design withfibers externally coated with plasma-polymerized silicone rubber. The coating was found to perform

xviii
adequately, but the fibers themselves elongated when exposed to the octanol stripping fluid. Thisled to the substitution of silicone oil as the stripping fluid. Upon developing a feasible moduledesign, pilot testing was performed to validate its performance.
Two basic sizes were tested. Bench scale tests using 1 and 2 modules were done using the Celgardmicroporous hollow-fiber membrane module coated with perfluorodimethyldioxole and tetrafluoro-ethylene (PDD-TFE). Pilot scale studies with paint vapors were done using the AMT module coatedwith silicone rubber in arrangements of 2 and 10 modules. Test flow rates up to 200 crm providedcontact times of less than 0.1 sec with the coated membrane.
In the bench-scale testing, VOC removal rates ranged between 4.4 percent and 73.7 percent. Higherair side flow, lower oil flow, and lower VOC inlet concentrations were generally associated withlower removal rates. Pilot-scale test results were variable and sometimes difficult to understand.Average VOC removal rates were 34–80 percent, while removal of individual compounds rangedfrom17 to 82 percent. As in the bench-scale testing, MEK proved to be the most difficult compoundto extract from the air. A major problem with the cross-flow modules occurred when leakingmodules allowed the fibers to become wetted with the less-viscous silicone oil, causing fiberelongation and subsequent voids between some fibers and matting of others. This resulted in poorcontact with the air stream and reduced VOC removal rates. Time and funding limitations preventedactions to address these issues. These problems resulted in a reduction in planned pilot scale streamfrom 500 cfm to 200 cfm.
G. ConclusionsThe membrane-supported biofilm modules successfully removed VOCs from the recirculatingstripping fluid stream. Degradation of the aromatic compounds investigated (toluene, m-xylene) wasachieved; these compounds were not observed in the aqueous phase above the biofilm. MEKbiodegradation is problematic, appearing to be partially inhibited by toluene and m-xylene. Furtherstudies are required to ascertain the underlying mechanism.
A fully-integrated pilot system was not successfully demonstrated. Although the test results did notmeet the research goal of 85-95%, the MBT concept showed potential for being developed into atechnically feasible process. However, the MBT concept has been shown to offer several attractivebenefits:
! Continuous biotreatment of VOCs directly from the stripping fluid avoids the mechanicalcomplexities of sequential medium transfers found in most concentrate-and-treat designs(e.g., air-to-adsorber-to-lower-volume-air-stream, and thence to final treatment).
! Continuous recirculation of captured VOCs through the biotreatment module provides

xix
complete destruction of captured VOCs.! Modularity of the MBT unit allows linear scaling of a large system by connection of n units
in parallel! Modularity of the MBT unit allows amplification of the net capture-and-removal efficiency
by connection of two or more units in series.
H. RecommendationsSeveral serious obstacles remain before a practical MBT system can be applied to a paintingoperation:
! Available materials of construction must be compatible with each other (fiber, coating,assembly adhesives), with the stripping fluid, with the microorganisms, and with the VOCsto be treated.
! Manufacturing techniques for membrane modules must advance enough to allow costeffective fabrication of low-pressure drop, high efficiency, leak-free modules.
! Microbiological cultures must be identified that can coexist and metabolize all of the VOCsto be treated at practical rates.
! Some engineering relief may be possible, but the ventilation system must be able toaccommodate a fairly large pressure loss (>25 in. H2O) across the HFM array, consistentwith acceptable process economics.
Additional fundamental and applied research is needed to fill out the understanding of theseprocesses. Design and eventual commercial availability of properly configured and scaled hollow-fiber membrane modules must occur before MBT or related technologies can be implemented ona practical scale. Finally, this technology will be compatible only with processes that can toleratea moderate pressure (>20 in. H2O) loss through its control system, for example, low flow highconcentration sources.

1
1.0 ObjectiveThe objective of this project was to examine the feasibility of developing a practical VOC controlmethod using coated, hollow-fiber membranes to extract organic vapors from ventilation exhauststreams into a circulating pool of an involatile liquid and to deliver the organics at a buffered rateto a biofilm adhering to the exterior surface of a separate, coated membrane.
1.1 BackgroundThis project was performed in response to the Statement of Need for FY98 SERDP, Com-plianceNew Start Number 2 (CPSON2), entitled, “VOC Control Technology for Aircraft Painting andDepainting Facilities.” Painting and coating operations present a number of environmental problemsand economic challenges. Volatile organic compounds (VOCs) and other hazardous air pollutants(HAPs) are present in all currently used coatings. The toxic compounds include metals, metaloxides, and VOCs. Many of these compounds are either direct or indirect health threats; VOCs areozone precursors and may be designated as toxic, and many metals and metallic oxides are identifiedon toxic compound lists. In response to the Clean Air Act Amendments of 1990, VOCs and HAPsin coatings are being reduced, thereby reducing emissions of ozone precursors and toxic compoundsfrom painting operations. However, additional controls are mandated in specific instances, such asaircraft booths. The National Emissions Standard for Hazardous Air Pollutants (NESHAP) specificto aircraft painting will force the DoD to either implement volatile hazardous air pollutant (VHAP)control technology or replace existing coating formulations. Because efforts to develop replacementcoatings have met with only mixed success, implementation of control technology appears to be themost-promising near-term solution.
Control technology cost primarily depends on contaminated airflow rates. Paint spray boothexhausts are high-volume streams because an obsolete OSHA standard requiring a minimumvelocity of 100 ft/min) through all booth section areas remains in the public record. Conventionalbooth design approaches include no provision for adjusting flowrate, relying instead on using a highflowrate with clean filters that will remain above the 100-fpm threshold after the filters are dirtied.If controls are required for VOC destruction, the necessary equipment must be sized for themaximum exhaust flow rate. As a result, typical booths emit large volumes of air contaminated withdilute concentrations of VOCs and HAPs. Many current technologies treat the VOCs within theentire gas volume directly, leading to large-volume incineration, absorption, or biofiltration systems.These technologies are extremely expensive in terms of both capital and operating expenses. Also,they often generate hazardous byproduct streams that must be further treated. The system evaluatedin this research was designed to both minimize the treated volume and to concentrate the VOCswithin that treated volume in order to reduce the size and cost of the ultimate control device. These

2
Figure 1. MBT System Schematic
advantages would make this VOC treatment option applicable across a broad range of spray boothsizes.
Such a VOC control system could eliminate a significant portion of toxic materials emissions fromDoD installations. Past data regarding aircraft service reported in Air Force Times indicate that 5of the top 10 air discharges that triggered Toxic Release Inventory reporting thresholds from 131DoD installations were typical paint constituents. Significant reduction of these emissions in a cost-effective manner is important to DoD’s adherence to the 1995 Aerospace NESHAP for AerospaceManufacturing and Rework Facilities and to its meeting existing and evolving limits for VOCemissions in ozone nonattainment areas.
1.1.1 Membrane BioTechnology Development BackgroundDuring initial Membrane BioTechnology (MBT) development, tests were performed to assess theability of hollow-fiber membrane contactors to separate VOCs from an air stream. A membraneseparation system was constructed to allow contact of VOC- laden air streams with octanol insidea Hoechst-Celanese Liqui-Cel hollow-fiber module. The entire membrane separation system usedin initial experiments is shown schematically in Figure 1. A stripping fluid, octanol, was passedthrough the unit’s shell space while air flowed through the fibers. The two phases contacted incounter-current cross flow. The octanol reservoir was recycled to the module, but air passed throughthe system only once. Air flow rates were varied from 10 to 40 L/min, giving a minimumgas/membrane contact time of 0.004 seconds based on the inside volume of the hollow fibers. Theair-side pressure drop ranged from 0.5 to 2.0 psi, and the total surface area available for masstransfer was 1.4 m2.

3
Biological degradation experiments were conducted with naturally occurring microorganismsisolated from soil samples removed from a site contaminated with gasoline. Using a mixedconsortium of organisms isolated in liquid culture from soil samples removed from this site,degradability of model compounds from each of the species found in furniture exhaust gases wasexamined (Table 1). Following completion of these initial studies, organism subcultures weregenerated for specific compounds. By enrichment of the initial gasoline-adapted consortium inindividual flasks with isobutyl acetate (IBA), methanol (MeOH), methyl ethyl ketone (MEK),methyl isobutyl ketone (MIBK), m-xylene, and p-xylene, respectively, consortia capable ofdegrading each compound were developed.
Table 1. Compounds Successfully Biodegraded
Acetone Benzene
Diethylene glycol ethyl ether Ethylene glycol butyl ether
Formaldehyde Ethanol
Isobutyl isobutyrate Isobutyl acetate (IBA) *
Methyl ethyl ketone (MEK) * Methanol
Methyl n-amyl ketone Methyl isobutyl ketone (MIBK) *
n-Butyl alcohol * Styrene
Toluene * m-Xylene *
o-Xylene * p-Xylene *
* Indicates compounds common to DoD painting operations
One pure culture, designated MX-2, was established on m-xylene and another, PX-2, was establishedon p-xylene. Other consortia which grew on either IBA, MEOH, MEK, or MIBK consisted ofapproximately three different organisms each. Maximum growth rates for the isolated consortia weredetermined in shake flask studies containing low-ionic-strength buffer solution supplemented withthe appropriate carbon source. Growth rates obtained with m-xylene in the presence of additionalcarbon sources and with pure octanol are given in Table 2.
The partition coefficient is defined as the ratio of concentrations of a given compound in two phases(octanol/air and octanol/H2O) at equilibrium. Before beginning work with Liqui-Cel membranemodules, partition coefficient experiments were performed to investigate the equilibrium distributionof m-xylene, MEK, and MIBK between phases for stripping fluid/air and stripping fluid/aqueoussystems. Octanol was chosen as the stripping fluid. Values of the partition coefficient at differenttemperatures are given in Table 3.

4
Table 2. Growth Rates of MX-2 with Modified Carbon Sources
Carbon Source Specific Growth Ratea Degradation Rateb
m-Xylene 0.46 hr-1 3.60×10⁻¹⁰ mg/(hr-cell)
m-Xylene + 0.2% MeOH 0.45 hr-1 3.57×10⁻¹⁰ mg/(hr-cell)
m-Xylene + 0.2% EtOHc 0.40 hr-1 2.34×10⁻¹⁰ mg/(hr-cell)
m-Xylene + 500 ppmd octanol 0.46 hr-1 3.60×10⁻¹⁰ mg/(hr-cell)
500 ppm octanol (no m-xylene) 0.20 hr-1 not applicable
a The specific growth rates are reported as the rate of change of cell dry mass divided by the celldry mass.
b The degradation rate is the rate of removal of m-xylene (in mg per mL of medium per hour)divided by the cell density (in cells per mL).
c Ethyl alcohol.d Mass/mass
Table 3. Partition Coefficient Values
Temp.Partition Coefficient [octanol]/[air] Partition Coefficient [octanol]/[water]
m-Xylene MEK MIBK m-Xylene MEK MIBK6 °C 9865 2181 NAa NA NA NA
22 °C 7978 1634 22,045 NA NA NA
31 ° 7703 1344 8721 1021 33 2.1
a NA=not analyzed
Experiments were also conducted to examine the range of compounds degradable by enzymespresent in the meta- and para-xylene-degrading organisms. As shown in Table 4, these organismssuccessfully removed many compounds that are typically difficult to biodegrade. Higher values foroxygen uptake indicate a compound is being more rapidly degraded.
An additional set of experiments was run to evaluate alternative stripping fluids becausecommercially available octanol is fairly expensive. Partition coefficients were determined for m-xylene in corn oil, sunflower seed oil, and mineral oil at 31 °C. The respective partition coefficients([oil]/[air]) were 8283, 8244, and 7284, comparable to that of octanol. These oils cost about one-fourth that of octanol.

5
Table 4. Oxygen Uptake Rates for Various VOCs
CompoundOxygen Uptake, mmol/min-
mg Total Cell Protein
Strain PX-2 Strain MX-2p-Xylene 0.34 1.21
m-Xylene 0.31 0.82
o-Xylene NA 0.31
Toluene 0.17 0.18
Benzene 0.13 0.27
Styrene 0.47 0.55
Benzoic acid 2.34 0.66
Catechol 5.19 1.23
3-Methylcatechol 1.50 1.17
4-Methylcatechol 4.35 0.92
Protocatechuic acid 0.00 0.32
1.1.2 Treatment Process ConceptIn the Membrane BioTreatment (MBT) system, organic volatiles are first separated from the airstream, concentrated, and then completely metabolized by microorganisms. Selective removal andconcentration of VOCs from the exhaust stream enables significant reduction in the volume directedto the final control device, dramatically reducing equipment size and costs. The system allows forindependent optimization of each process. One process removes organics from the air, and the otherprocess biodegrades them. The system relies on micro-porous hollow-fiber membrane contactorsto mediate the extraction and concentration of vapors from the air into an organic stripping fluid andto provide a physical support for degradative microorganisms. A schematic of the MBT systemappears in Figure 1.
Exhaust gases laden with VOCs pass first through a particle filter, which removes solid particlesand any residual atomized droplets of coatings. Next, the gases enter a membraneseparation/concentration (S/C) unit composed of bundles of microporous, hydrophobic fibers. In theS/C unit, vaporized HAPs and VOCs (represented as dark particles) are transferred from the exhaustgases into a stripping-fluid medium (potentially octanol, silicone oil, sunflower seed oil, etc.), asshown in Figure 2. The stripping fluid is chosen to have low volatility, low water solubility, and high(fluid/air) partition coefficients for the VOCs. The medium serves as a pollutant sink and allowsaccumulation of significant HAP/VOC concentrations.

6
Figure 2. VOC Extraction in the S/C Unit Figure 3. Bioextraction of VOCs
Upon exiting the S/C unit, the stripping fluid is delivered to a biomembrane unit. There, thestripping fluid circulates past one side of another microporous membrane with VOC-degradingbacteria in a film on the opposite side of the membrane. Figure 3 illustrates diffusion of VOCsthrough the membrane pores (filled with stripping fluid) into the biofilm, in which they areselectively and completely metabolized by the bacteria. The solvent is then collected in a storagevessel and ultimately recycled through the S/C. When hydrocarbon pollutants are treated, outputsfrom the overall MBT System are clean air, carbon dioxide, and a mixture of water andnonhazardous cell mass.
In the design of a full-scale system for a military paint spray booth, further economic gains can berealized by reducing the contaminated air volume through the application of partitionedrecirculation. This patented technology was developed through EPA and Air Force funding to reducethe cost of VOC control by minimizing the treated volume. This technology takes advantage of thefact that, in horizontal-flow booths, the lower segment of a paint booth exhaust contains more highlyconcentrated VOCs, and conversely, the upper segment exhaust contains lower VOC concentrations.This characteristic allows both the recirculation of a significant portion of the exhaust (30 to 90percent) without adverse health and safety implications, and a comparable reduction in the size ofthe required VOC control device. Adding on this technology enables a two-step reduction in thevolume of VOC-contaminated streams to be treated: first, partitioned recirculation concentrates theVOCs into a smaller air volume; and second, the S/C unit concentrates the VOCs in a proportionallysmaller volume of stripping fluid for biodegradation.
MBT offers potential unique advantages due to the nature of the control technology and the impact

7
of implementation on coating operations. Advantages include the following:! High VOC destruction: Naturally occurring bacteria consume pollutants as food for growth
and energy.! Non-Pollutant-Generating Process: MBT is a clean process with no hazardous by-
products.! Optimized Rates of Removal and Degradation: Having separate processes for removal
and destruction of pollutant compounds allows each to be designed and operated formaximum efficiency, and equipment size is minimized.
! Adaptability: MBT is fully adaptable to individual sites. S/C units are modular, whichallows the pollutant-removal process to be tailored to site-specific operations, facilities, andregulatory permit requirements. Selection and optimization of suitable micro-organismsensures effective degradation of site-specific HAPs and VOCs.
! Extended Equipment Life: Each module of the S/C units may be changed on an individualbasis, and extra modules may be built into the system and/or kept on site to makereplacement easier.
! Operating Flexibility: The stripping fluid storage vessel allows the MBT system to operatecontinuously to control intermittent processes. For example, some coating operations aresingle-shift, resulting in eight hours of waste generation followed by 16 hours of down time.In other instances, painting facilities may be off line for days or even weeks. The storagetank mitigates the interruptions in waste generation—that is, the tank uncouples wastegeneration from biotreatment, which allows the biotreatment process to operate at optimallevels regardless of spray booth schedules. A VOC feedstock can be manually introducedto maintain the bacterial colonies during extended interludes between painting episodes.
! Cost-Effective Treatment: Original estimates indicated that this system would besignificantly less costly than other typical VOC control systems for medium and large paintspray booths.
1.2 ScopeThis is the final technical report describing a 2-year project supported by the StrategicEnvironmental Research and Development Program [SERDP].

8
2.0 Technical ObjectivesThe overall objective of this small, pilot project was to validate and extend development of apotentially cost-effective VOC control system for painting facilities that meets the requirements ofthe Aerospace Coatings NESHAP—81 percent reduction in VOCs from noncompliant coatings. Thiswas believed to be feasible by combining the partitioned recirculation technique for flow reductionwith a novel process that concentrates VOCs for biological treatment. The project was designed asa two-phase activity consisting of bench- and pilot-scale efforts. The objective of the project inphase I was to demonstrate that membrane-supported extraction, coupled with membrane-supportedbiotreatment, is a technically feasible VOC treatment process for DoD painting emissions. In phaseII, the objective was to establish the technical and econo-mical efficacy of this process to treat actualaircraft painting emissions. The original concept was to use the paint booth facilities at Tyndall AFBas the pilot test site, but that option was abandoned after technical difficulties caused delays andadded costs. Secondary goals of Phase II included both attention to the effects of particulate foulingon membrane transfer performance and dissemination of information about the technology byidentifying all DoD sites and organizations that could benefit from this technology and distributingappropriate technology transfer materials to them.
The original cost estimates for the technology were based on lab-scale performance. In support ofproject technical objectives and economic feasibility, it was necessary to answer the followingcritical questions:
1. Under conditions of 85–95 percent reduction of VOC emissions, what are the mass transferrates of VOCs present in DoD painting and depainting operations (e.g., MEK, MIBK,xylenes, toluenes)
a) from air to organic solvent via membrane?b) from organic solvent to aqueous phase via membrane?
2. What are the contact times needed to achieve the above mass transfer rates?3. Can a membrane-supported biofilm be stably maintained?4. What are the degradation rates of the above-cited VOCs?5. Using commercially available membrane units for design purposes, what is the projected
cost of treatment ina) dollars per cubic feet per minute of air treated?b) dollars per unit of VOC removal?
The design is to be based on modules capable of controlling streams from 20,000 to 300,000ft3/min of exhaust treated at typical VOC concentrations found in DoD operations.
6. What is the impact of particle and particle-bound contaminants such as isocyanates onmembrane performance? How does this impact filtration requirements?

9
Answers to these questions were the subject of this project and were necessary to scale-up anddesign the process and to determine process economics. Preliminary targets for mass transfer ratewere 10-4 cm/sec for VOCs from air and 3×10⁻¹⁰ mg/cell-hr for VOC degradation rate.
10
3.0 Results at Bench-ScaleDetails of progress in the bench-scale development phase (prior to pilot-testing) are described in twopublications, “Membrane-Mediated Extraction and Biodegradation of VOCs from Air,” reviewedand accepted 2/25/00, which was presented at the 2000 Spring National Meeting of the AmericanInstitute of Chemical Engineers (AIChE), and “Membrane Biotreatment of VOC-Laden Air,”reviewed and accepted 5/1/00, which was presented at the 2000 Annual Conference of the Air &Waste Management Association (AWMA).
3.1 Development of Coated ModulesThe project approach outlined in the Work Plan was initiated but was soon altered based on earlyfindings. One significant area of study, which was not the subject of the technical papers, was in situcoating of fibers in Celgard Liqui-Cell modules. Because significant back pressure was required onthe air side of the contactors to prevent oil seeping through the pores, it was deter-mined that coatedfibers were necessary to make the process cost competitive, but acceptable coated fibers werecommercially unavailable. Celgard did not manufacture any contactors with coated fibers, so workcontinued on testing the performance and ease of application of several coatings on smaller, bench-scale Celgard contactors. Significant effort was aimed at identifying or developing a suitably coated(nonporous polymer coating on a porous polypropylene sub-strate) separation/concentrationmembrane module. Discussions with Compact Membrane Systems (CMS) led to the acquisition andtesting of a module coated on the inside of the lumens (hollow fibers) with an amorphous copolymercomposed of perfluorodimethyldioxole and tetrafluoroethylene (PDD–TFE). Although PDD–TFEwould not have optimum transfer charac-teristics, CMS was the only vendor identified and judgedto be capable of applying in situ coatings to the inside of the lumens, and they would agree to workwith only this material. Methyl ethyl ketone (MEK) and m-xylene were the VOCs used to test airto octanol VOC mass transfer performance. Three conditions were examined in duplicate for eachcompound, for a total of 12 experiments. Air flow rate and VOC concentration were experimentalvariables while absorbent (octanol) flow was held constant. Experimental conditions were chosento emulate previous work with a Celgard Liqui-Cel module containing hollow fibers coated on theiroutside surface with PDD–TFE. The results of the tests (see Table 5) were similar to those ofprevious tests using a module coated with PDD–TFE on the outside of the lumens. These resultsindi-cated that the major resistance to mass transfer in modules coated with PDD–TFE may be inthe coating. Because PDD–TFE does have a relatively high resistance to mass transfer of VOCs, theneed for a better polymeric coating is needed to improve process economics.

11
Table 5. PDD-Coated Membrane Results
Mass Transfer Coefficients
PDD-Coated Membranes, Shell-Side (outside) Coating
CompoundTransferred
Air Stream Solvent Stream
Concentration(ppm)
Flow(L/min)
Loadinga
(ppm/s)Concentration
(mg/L)K0
(10-5 cm/s)
m-xylene
44 28 120 6.2 0.8550 130 6.2 0.91
110 28 290 6.2 0.966.0 1.0
64 60 370 6.3 1.3275 1600 5.9 1.6
MEK
270 28 720 550 0.7750 28 2000 105 2.0
1050 60 6000 1200 9.42200 30 5500 980 4.3
PDD-Coated Membranes, Tube-side (inside) Coating
m-xylene40 28 110 4080 0.1
230 60 1300 4300 2.0280 60 1600 850 2.7
MEK470 28 1300 8500 -4.0
2800 60 16,000 9500 2.05000 28 13,000 5500 5.3
Removal Efficiencies
PDD-Coated Membranes, Shell-Side Coating
CompoundTransferred
Air Concentration(ppm)
Air Flow(L/min)
Loading(ppm/s)
RemovalEfficiency
(%)
toluene800 105 8000 74900 60 5100 76
1300 30 3700 78
MEK/toluene
500 60 2800 80250 60 1400 60850 30 2400 80650 30 1900 70
Other activities aimed at acquiring a suitable coated module followed. Bend Research, Inc., suppliedtwo prototype hollow-fiber modules for wet testing of the microporous Rayon fibers typically usedin their scalable, high-flow, low-pressure-drop “box module” configuration. Results of the wettesting indicated that the pore size was too large for use in the system.

12
Chemica Technologies was contracted to coat a sample of the Celgard polypropylene fiber, andseveral small patches of coated material were received and tested as a VOC mass-transfer mediumat North Carolina State University (NCSU). The results indicated satisfactory VOC transfer, but thecoating partially delaminated from the substrate. Discussions continued with Chemica to assess theirability to improve coating adherence to internal lumen walls, but no satisfactory resolution wasreached.
Celgard recommended a polyalkyl sulfone (PAS-16) and supplied some PAS-16 as well as a methodfor in situ fiber coating, the only option available for coating the Celgard module. With advice fromCelgard and Anatrace, the PAS-16 manufacturer, a significant in-house effort with to coat the insideof the lumens with the PAS-16 polymer was begun. The coating attempts were based on Celgard’ssuggested method, which involved pumping a dilute polymer solution through the lumens whilepulling vacuum on the shell side of the module. This was followed by rinsing and drying, followedby annealing the inside of the lumens with warm nitrogen (~60 °C). Variations in solvent,concentration of polymer, amounts of nonsolvent additives, operating conditions, annealingprocedures, and drying and cleaning protocols were used. In initial attempts using tetrahydrofuran(THF) as a solvent (suggested by Celgard), the polymer did not dissolve completely, causingplugging in many of the lumens. Discussions with Anatrace and Celgard provided several new ideas,which included substituting toluene as the solvent, heating, blending, filtering, and centrifuging toimprove solubility. After several trials, two of the four general approaches tried seemed to showpromise toward achieving the desired results. These four approaches are summarized in Table 6.
Table 6. Fiber Coating Technique Development

13
To test for complete coating of the porous substrate, Anatrace suggested pressurizing one side ofthe membrane module with a mixture of nitrogen and carbon dioxide. Since carbon dioxide is seventimes more permeable to PAS-16 than nitrogen, an analysis of the permeate could be used todetermine whether coating was complete. Since that procedure is fairly difficult and time consumingto conduct, a simpler surrogate procedure was selected, at least for the initial tests as the coatingprocedure was being refined. This procedure is a permeation test in which nitrogen is admitted intothe lumen side of the modules. The flow rate of nitrogen penetrating the lumen walls and escapingthrough the shell side was measured. A new module allows ~21 L/min flow at a selected pressure.Coating attempts conducted during this research exhibited flows ranging from 21 (uncoated) to lessthan 0.35 L/min. A module, flow tested at 0.35 L/min of nitrogen, was then tested and found toperform, in terms of mass transfer rate, much like the PDD–TFE-coated module. Since the PAS-16coating is known to be more permeable to the VOCs tested than PDD–TFE, coating thickness wassuspected to be excessive. Samples of lumens were cut out and viewed using a scanning electronmicroscope. The samples indicated a coating thickness of ~15 to 20 µm on the inside of the lumens;~1 µm is the goal for coating thickness. Samples of a module that allowed nitrogen permeation at~0.7 L/min showed a coating thickness of ~7 to 10 µm. From these preliminary tests, it is estimatedthat the proper permeability may be in the 1-to-1.5-L/min flow range to achieve a 1-to-2-µm-thickcoating. It became evident that, although a reasonably successful technical exercise, this path wouldbe time-consuming and would not validate a cost-effective approach.
Many discussions were held with commercial companies to determine the best approach todeveloping a separation/concentration module with a quality nonporous coating and a low-pressuredrop. Proposals were solicited from Celgard, Bend Research, and Applied Membrane Technologies(AMT) for bench-scale modules and commitments to support the project with future larger-scalemodules. Bend Research and AMT responded with proposals, and AMT was eventually selected asthe manufacturer of choice.
3.2 Membranes Coated with Silicone RubberDuring searches for coated fiber modules, a company (AMT) was found that had developed modulesfor several water-stripping applications based on a coated fiber. They were asked to consider ourapplication, and they offered a small, cylindrical module to be used for initial testing. The parallel-flow, stainless steel, cylindrical-membrane module was filled with fibers coated on the exterior withplasma-polymerized silicone rubber at a nominal thickness of 1 µm. Upon inspection prior totesting, a concern was raised because of the unknown effectiveness of the air-to-fiber contact area.AMT suggested that contact efficiency issues could be eliminated in a cross-flow module.Therefore, though the cylindrical parallel-flow design of the existing AMT module did not lend
14
itself to high efficiency, it was used in preliminary testing to gather data for the design of a cross-flow module.
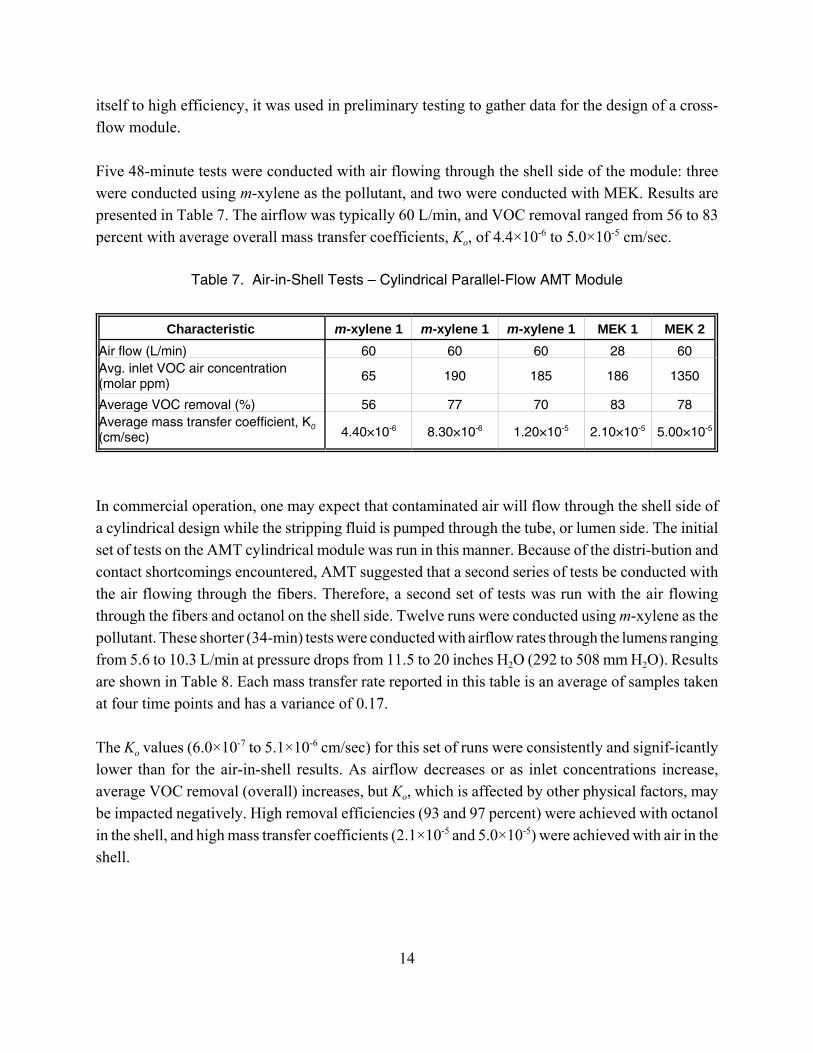
Five 48-minute tests were conducted with air flowing through the shell side of the module: threewere conducted using m-xylene as the pollutant, and two were conducted with MEK. Results arepresented in Table 7. The airflow was typically 60 L/min, and VOC removal ranged from 56 to 83percent with average overall mass transfer coefficients, Ko, of 4.4×10⁻⁶ to 5.0×10⁻⁵ cm/sec.
Table 7. Air-in-Shell Tests – Cylindrical Parallel-Flow AMT Module
Characteristic m-xylene 1 m-xylene 1 m-xylene 1 MEK 1 MEK 2Air flow (L/min) 60 60 60 28 60Avg. inlet VOC air concentration(molar ppm)
65 190 185 186 1350
Average VOC removal (%) 56 77 70 83 78Average mass transfer coefficient, K0(cm/sec) 4.40×10⁻⁶ 8.30×10⁻⁶ 1.20×10⁻⁵ 2.10×10⁻⁵ 5.00×10⁻⁵
In commercial operation, one may expect that contaminated air will flow through the shell side ofa cylindrical design while the stripping fluid is pumped through the tube, or lumen side. The initialset of tests on the AMT cylindrical module was run in this manner. Because of the distri-bution andcontact shortcomings encountered, AMT suggested that a second series of tests be conducted withthe air flowing through the fibers. Therefore, a second set of tests was run with the air flowingthrough the fibers and octanol on the shell side. Twelve runs were conducted using m-xylene as thepollutant. These shorter (34-min) tests were conducted with airflow rates through the lumens rangingfrom 5.6 to 10.3 L/min at pressure drops from 11.5 to 20 inches H2O (292 to 508 mm H2O). Resultsare shown in Table 8. Each mass transfer rate reported in this table is an average of samples takenat four time points and has a variance of 0.17.
The Ko values (6.0×10⁻⁷ to 5.1×10⁻⁶ cm/sec) for this set of runs were consistently and signif-icantlylower than for the air-in-shell results. As airflow decreases or as inlet concentrations increase,average VOC removal (overall) increases, but Ko, which is affected by other physical factors, maybe impacted negatively. High removal efficiencies (93 and 97 percent) were achieved with octanolin the shell, and high mass transfer coefficients (2.1×10⁻⁵ and 5.0×10⁻⁵) were achieved with air in theshell.

15
Table 8. Octanol-in-Shell Tests – Cylindrical Parallel-Flow AMT Module
Parameter MX7 MX8 MX9 MX10 MX11 MX12 MX13 MX14 MX15 MX16 MX17 MX18
Air-side pressure drop [in. (mm) H2O]11.5(292)
11.0(279)
11.5(292)
11.0(279)
16.0(406)
16.0(406)
16.5(419)
16.0(406)
20.0(508)
20.0(508)
20.0(508)
20.0(508)
Air flow [L/min] 5.6 5.6 5.6 5.6 8.6 8.6 8.6 8.6 10.3 10.3 10.3 10.3
Avg inlet VOC air concentration [molar ppm] 68 84 261 684 92 125 457 499 76 105 274 697
Average VOC removal [%] 91 91 80 97 51 44 93 89 60 52 73 85
Average Ko [cm/s]1.60×10-6
1.90×10⁻⁶
8.20×10⁻⁷
2.30×10⁻⁶
8.60×10⁻⁷
6.00×10⁻⁷
3.60×10⁻⁶
2.50×10⁻⁶
5.10×10⁻⁶
1.20×10⁻⁶
1.60×10⁻⁶
2.00×10⁻⁶

16
Figure 4. AMT Cross-Flow Module –Overall Dimensions in Inches
One problem encountered in all extraction experiments was swelling of the membrane material.Occasionally, this was accompanied by “sweating” of the octanol through the membrane. It will benecessary to evaluate alternate stripping fluids as a means to ameliorate this problem.
The information from this testing was used in the decision to develop a cross-flow module designedand manufactured specifically for this project by AMT (See Figure 4). This module containedroughly 2.3 m2 of available membrane surface packaged in a module with air contact dimensionsof roughly 3.5 × 10 × 1.0 inches (88.9 × 254 × 25.4 mm). Manufacturing methods requiredmanufacturing in pairs, so the minimum two modules were procured.
Differences in design between the cross-flow and radialmodules required a different potting material to seal thefibers into the end caps and plans were to use a urethane.This urethane material had not been previously used inapplications with octanol, so limited tests were done todetermine chemical compatibility. Initial results wereonly partially successful, showing softening of theurethane in longer periods of exposure. Using heataccelerated curing and longer setup times improvedperformance. These concerns and subsequent extendedtesting trials delayed the beginning of VOC tests. Theurethane manufacturer concurrently investigated theseissues, but they were unwilling to develop entirely newcompounds and were unable to create small batches ofexisting materials to test. Few options were readilyavailable.
After assembly of the modules, they were pressure-testedto prove compatibility with octanol. This was expectedto be an easy test to pass because no compatibility issuessurfaced with the radial module. However, during the test, elongation swelling of the polypropylenefibers was encountered in the new module. At this point, further testing was done with single fibersto prevent destroying the remaining module. It was also determined that, after removing the octanoland cleaning the module, the fibers returned to their original length. A number of tests werecompleted with single fibers exposed to octanol, and it was found that the stretching was limited toabout 5 percent of total length. Three different manufacturers’ fibers were tested; all producedsimilar results.Disassembly and testing by AMT resulted in destroying one of the two modules that were built.

17
Figure 5 Pressure Drop for AMT Cross-Flow Module
While a solution to the fiber stretching was being sought, the other module was received from AMTfor inspection and airflow testing to determine how the cross-flow module performed in comparisonto the goal of low pressure drop. The module was mounted in the custom steel transition sections,and a variable-speed blower and electrical controls were connected for the test. The results indicatethat the module was able to pass 20 ft3/min of air at 0.62 inch H2O pressure drop and 72 ft3/min atless than 4.0 inches H2O pressure drop. Limitations of the test apparatus prevented using higher airflows. The goal for flow vs. pressure drop was 10 ft3/min at less than 20 in H2O, so this designgreatly exceeded this goal. With such a low pressure drop, multiple modules could be arrayed inseries to increase VOC transfer performance, if needed. Inspection of the module and velocityprofiles measured at the face of the fibers indicated that some bypass was created on the long sideswhere the fibers lay parallel to the polycarbonate housing. To address this problem, AMT proposedto create a seal along the two sides to limit the bypass. The fibers also exhibited some tendency tovibrate during the test, especially at the midpoint of the fiber bundle. AMT provided a modificationto reduce or eliminate this vibration. At the end of the test, the module was returned to AMT for themodifications.
As indicated in Figure 5, the air pressure drop is negligible for this module, even at high flow rates.These results represent an order-of-magnitude improvement in pressure drop performance, relativeto the cylindrical module containing identically coated fibers.

18
The two approaches were available to address the fiber-swelling problem are (1) modify the housingin such a way that its length could be adjusted after the initial exposure to octanol, thereby re-tensioning the fibers, and (2) to use a stripping fluid other than octanol. The first method for fixingthe stretching problem would involve redesigning the module to allow for post octanol lengthadjustment; this was abandoned due to complexity and an increased leakage risk. Alternate strippingfluids, including silicone oil and canola oil, were considered. Canola oil was seen as the most-economic alternative, but it lacked the chemical purity needed during analysis for extractedcompounds. AMT then tested the fiber material with silicone oil in the same manner that had beenused to measure the length changes after exposure to octanol. Single-fiber tests showed that fiberstretching was not evident after exposure to silicone oil, so a decision was reached to pursueswitching to silicone oil. A change to silicone oil required repeating some of the initial octanoltesting to verify partition coefficients at different temperatures for the com-pounds of interest.Potential toxicity to the bacteria also required investigation.
The AMT cross-flow module was returned for slight modifications and more tests using silicone oilin place of the octanol. The tests using silicone oil were successful; no swelling was seen, as hadoccurred in the case of octanol. AMT then returned the module after modifications were made, anda final decision was reached that further work on the separation contactor module would be doneusing silicone oil stripping fluid. An oil of viscosity slightly less than that of octanol (5 cs) wasordered and received. The single module was set up in a new apparatus for bench-scale testing usinga simulated paint stream.
3.3 Experimental StructureThe bench scale S/C and biomembrane units were evaluated separately during the testing of thecross-flow separation contactor module. During the bench-scale testing, oil doped with the fourtarget compounds was used in biomembrane effectiveness studies at N.C. State. During the finalthree months of the project, the used oil from the pilot-scale testing separation contactor system atARCADIS was taken to N.C. State for biomembrane testing.
VOC mass transfer experiments require real-time sampling and analysis of VOC concentrations ininlet and outlet air and sampling of the stripping-fluid-reservoir VOC concentration for offlineanalysis. The VOC stream was created by a custom system configured as shown in Figure 6. TheVOC-laden air stream is created by first injecting the four-component liquid mixture into a fittingthat is heated by a small electric heater. This forces complete volatilization of the mixture beforeit is progressively diluted with filtered air until finally being force-mixed by a fan in the mixing box.During the mass transfer experiments, module inlet-stream VOC concentration was set viaadjustments to the syringe pump delivery and airflow rates. Silicone oil flows were adjusted by a

19
Figure 6. Separation Module Bench-Scale Test Apparatus
pump-speed setting and were read on a rotameter. The system was allowed 5–10 minutes to stabilizebefore testing began. Once the experiment began, samples of the air at the inlet and outlet of themodule (two air samples) were taken at approximately 2½-minute intervals and analyzed online bya gas chromatograph with a flame ionization detector (GC/FID). Oil samples were also withdrawnvia syringe from an oil-sampling port located between the module outlet and the oil reservoir. Theseoil samples were taken at 5–10-minute intervals. The oil samples were then stored, headspace-free,at 3 °C for later analysis by GC. Analysis of air-side data resulted in a separation contactor removalefficiency, and oil-side analysis permitted a mass balance analysis of the system and determinationof the oil condition from test to test.
3.3.1 MBT Bench-Scale Separation ContactorA schematic of the bench-scale system separation contactor is shown in Figure 6 and a process flowschematic is presented as Figure 7.

20
Figure 7. Process Schematic of Separation Module Bench-Scale Apparatus
3.3.2 Pilot TestingA schematic of the complete MBT system appears as Figure 1 in Section 1.1.1. A process such asa paint booth produces a dilute stream of VOCs in air. After particles are filtered from the stream,it enters an S/C unit, which employs bundles of microporous hydrophobic fibers with the VOC-laden air and stripping fluid flowing across and through the fibers, respectively. The VOCs aretransferred from the exhaust gases into the stripping fluid medium. The stripped air that leaves thisunit is taken to an exhaust stack. After the circulating silicone stripping fluid leaves the S/C unit, itis delivered to a biomembrane unit is stored in an intermediate storage vessel. In the biomembraneunit, the stripping fluid is circulated past one side of another microporous membrane module thathas a film of VOC-degrading bacteria on the opposite side of the membrane. VOCs diffuse throughthe membrane pores and are selectively and completely metabolized by the bacteria. The strippedsolvent is then collected in a storage vessel and recycled through the S/C unit. Outputs from theoverall MBT system are clean air, carbon dioxide, and a mixture of water and nonhazardous cellmass.

21Figure 8. Pilot-Scale System Design
A diagram of the pilot-scale system is shown in Figure 8. The pilot-scale system differed from thebench-scale description in a number of details, including that the system was much larger and thatthe stream was created from spraying actual coatings from a paint spray gun pointed at a target ina small tabletop paint booth. The coating used for these experiments were acquired from an AirForce refinishing facility, and its components were determined from Material Safety Data Sheets(MSDS). However, paints are not composed of pure compounds, and industrial versions of listedcompounds (e.g., MEK) are typically a mix of many compounds. Also, com-ponents below 1percent are not required to be listed on an MSDS. Therefore, the capture efficiency was measuredby using a total hydrocarbon analyzer on the upstream and downstream air streams rather than byspeciation with a GC/FID. For these same reasons, a hydrocarbon analyzer is the instrumenttypically used to measure paint booth control equipment destruction efficiency in commercialoperations. Based on previous work at NCSU, it was assumed that the separation contactor modulecould display selective removal behavior. To look for module compound preferences, samples werealso taken for analysis with a GC/mass spectrometer (MS). These samples were taken on charcoalsorbent tubes at input and output locations adjacent to the sampling ports for the total hydrocarbonanalyzer and were analyzed against a list of typical paint compounds, including those listed in Table9. The oil analysis was done the same as for the bench scale. Testing followed the matrix outlinedin Table 10.

22
Table 9. Tertiary Mixtures in the Air Stream
Mixture Component % VOCs in Paintby Volume
% VOCs in Paintby Weight
Bench ScaleXylene 8.7 7.5MEK 18.6 15Ethylbenzene 2.9 2.5Butyl Acetate 11.3 10
Pilot ScalePaint (Aerospace Coating) 63.95 50
Table 10. Typical Flow Rates Used During Testing
Test Air Flow(ft3/min)
Input VOC Concentration(ppm)
100 200 400Bench Scale
2 X X X4 X X X8 X X X16 X X X
Pilot Scale20 X X X100 X X X200 X X X

23
4.0 Results/DataThe following sections present the results of the experiments performed during this study. Pertinentdata from bench- and pilot-scale tests can be found in Appendices B and C, respec-tively.
4.1 Separation Module TestsSeparation module tests, described below, was performed in a number of bench- and pilot-scalemodules.
4.1.1 Bench-Scale TestsEighteen successful tests, summarized in Table 11, were completed using a variety of air flow rates,VOC loadings, and oil conditions. Average removal efficiencies varied from 4.4 to 73.7 percent, andpeak removal rates exceeded 79 percent twice for ortho-xylene. A question was raised about theperformance of the GC after test nine, so the steps were expanded to include pre and post testcalibrations. Preparation of calibration standards had also been inconsistent prior to this test, soalternate methods were found to improve consistency. For this reason, there is more confidence inthe results from tests 12 and higher, but tests did just as well with 17 percent of the loading.Nevertheless, the results show important trends and general information. Higher loadings, such asin Test 2, improved inlet/outlet removal efficiency. Typical paint booth operations will haveemissions in the range of 200 to 350 ppm, so most of the tests were run within that range. Higherair flow rates were used in a few tests to determine if increased turbulence improved performance,but it appeared that any such performance increase was negated by shortened contact time, resultingin lower removal efficiencies. Two modules arranged in series improved performance over a singlemodule. Higher oil flow resulted in higher removal rates, but leaks resulted if this flow were set toohigh, indicating that materials and the module structure required improvements. Although overallremoval efficiencies for individual compounds were as high as 79 percent, VOC removal rates werehighly variable; MEK removal was often well below acceptable values, especially considering itsprevalence in military coatings. Even though MEK removal was often at or close to zero, the otherthree compounds were consistently removed and were relatively comparable from test to test.
The first module received from AMT was the one not damaged during the initial testing. After a fewtrial runs with the lab apparatus, the module was tested for VOC removal efficiency. As a startingpoint, pressures and flows were chosen based on previous bench-scale investigations at NCSU usingthe uncoated fibers of the Celgard module. Oil flow was set at 1.0 L/min and air flow at 2.0 ft3/min.It became apparent after two tests that the module was leaking oil, and swelling of an internalsilicone rubber bridge was creating packs and voids in the fibers. This substantially reduced the

24
Table 11. Summary of Bench-Scale VOC Tests
Test DateNumber
ofModules
Air Flow(ft3/min)
Oil Flow(L/min)
Approx. InletLoad(ppm)
TestsSince
Last OilChange
Removal Rate(%)
MEK n-ButylAcetate
Ethyl-Benzene o-Xylene Avg.
1 4/27/00 1 2.0 1.0 450 0 18.5 47.9 19.6 50.4 34.1
2 4/27/00 1 0.5 1.0 2100 1 66.5 74.9 70.8 79.2 72.9
3 4/29/00 1 2.0 1.0 450 2 1.2 31.5 33.8 42.6 27.3
4 4/29/00 1 2.0 1.0 230 3 -5.1 14.7 12.5 30.8 13.2
5 4/29/00 1 2.0 1.0 850 4 19.2 41.0 44.1 48.9 38.3
6 5/03/00 1 2.0 0.2 300 5 13.0 34.5 42.8 43.4 33.4
7 5/05/00 1 2.0 0.2 170 6 18.6 31.8 38.9 43.2 33.1
8 5/06/00 1 2.0 0.2 450 7 26.3 44.4 50.0 51.9 43.2
9 5/09/00 1 2.0 0.2 350 8 58.0 22.4 27.2 28.6 34.1
10 5/11/00 2 4.0 0.4 350 0 23.5 54.2 58.5 62.3 49.6
11 5/12/00 2 4.0 1.0 350 1 63.5 75.6 76.2 79.4 73.7
12 6/06/00 2 4.0 1.0 200 4 -5.1 29.9 38.9 45.1 27.2
13 6/07/00 2 2.0 1.0 220 5 2.9 34.9 42.4 50.9 32.8
14 6/08/00 2 8.0 1.0 200 6 0.29 9.8 13.4 18.4 10.47
15 6/21/00 2 4.0 1.4 200 0 9.6 40.3 45.1 51.8 36.7
16 6/22/00 2 16.0 1.4 200 1 -5.6 5.5 6.3 11.5 4.4
17 6/22/00 2 8.0 1.4 200 2 -1.1 13.6 16.4 23.5 13.1
18 6/23/00 2 4.0 1.4 200 3 0.96 27.3 29.4 35.5 23.3

25
contact efficiency and performance was deteriorating, so testing was stopped after Test 5. Aninspection of the module was unable to locate the exact source of the leak, but previous experiencehad shown the corners where the module sections were assembled to be suspect. A problem withthe urethane material was assumed to be the culprit. Two modules received later were constructedsimilar to the first two, but an alternate potting material was used so that testing could continuewhile the urethane problems were investigated further. Tests with these modules were started witha lower oil pressure and more conservative flow rates (0.2 L/min) to prevent leakage failures.Removal efficiencies were lower during the next tests, most likely because of the lower drivingforces from the reduction of oil pressure and flow. A number of modifications were made to thereturn piping on the apparatus to reduce back pressure in hopes of increasing oil flow without raisingthe static pressure. This was successful in bringing flow up to 0.4 L/min with a back pressure ofabout 5.0 psi. Results showed an obvious increase in removal efficiency, although still lower thanthe target of 80 percent. The two modules were then arranged in parallel on the oil side and in serieson the air side to double the contact time without risking higher oil pressures. The efficiency againincreased, but not as dramatically as had been achieved with higher oil flow rates, so the next stepwas to increase the oil flow and pressure. Again, plumbing modifications were made to reduce backpressure, and flow was increased to 1.0 L/min with an increase in pressure to 12.5 psi. Althoughremoval efficiency increased, it quickly became apparent that both modules were again leaking oil.Based on these trials, AMT proposed a number of design modifications to be used in the pilot-scaleversion to prevent the leakage problems of the corners and joints.
4.1.2 Pilot-Scale TestsPilot-scale testing produced several tough challenges that reduced the number of successful tests.Initial runs were hampered by inconsistent spray gun paint application, although the apparatus wasdesigned to maintain a constant trigger position. In addition, only the last five tests were run withboth air-side analytical systems. Upon data review, the comparability of these two analyti-calmethods and its implications are important enough to focus primarily on these results, shown inTable 12. The overall removal rate is shown by averaging the GC/MS results for the eight listedcompounds and by the average removal reported by the total hydrocarbon analyzer. For all five tests,both methods passed pre-and post-analysis calibration checks. However, agreement was achievedonly for Tests 1 and 3, with 7.4 and 16.9 percent differences, respectively. Comparability for Test5 was lower at 35.6 percent difference, and Tests 2 and 4 show gross differences. Similar trendswere seen for the bench-scale module in that MEK shows much lower results compared to the othercompounds, and removal generally improves with higher oil flow and lower air flow.
To understand the removal results requires a short review of the methods used. During bench-scaletesting the air-side analytical method (GC/FID) agreed closely with the oil-side analysis method in

26
Table 12. Summary of Pilot-Scale VOC Tests
Test/VOCLoad(ppm)
Air FlowRate
(ft3/min)
Oil FlowRate
(L/min)
VOC Removal(%)
Individual Constituents Average
MIBKXylene 2-
Heptanone MEK n-ButylAcetate
Ethyl-benzene GC/MS Total HC
Analyzerpara meta ortho
1/300 200 4.6 49.5 55.2 53.0 33.5 59.9 33.9 49.8 55.7 48.8 45.3
2/260 100 3.85 69.9 73.9 73.9 50.5 77.4 63.2 71.6 73.9 69.3 0.0
3/310 100 1.8 38.6 50.4 47.2 45.2 54.1 35.0 46.3 48.3 45.6 54.0
4/225 100 6 78.6 81.7 81.5 73.8 84.2 75.2 81.3 81.3 79.7 20.0
5/260 140 4.4 26.0 40.8 37.6 36.5 45.2 17.6 33.4 38.1 34.4 24.0

27
total mass balance. This was largely due to using four pure compounds to create the pollutantstream, and each method could differentiate and quantify the known four compounds. The changeto pilot-scale brought the use of real paint to simulate a paint-booth exhaust. It was knownbeforehand that even compounds listed on the MSDS, such as MEK and xylene, would be impurecompounds that would have significant variations in constituents. For this reason, the air-sideanalysis was changed to a total hydrocarbon analyzer because it would be capable of analyzing allknown and unknown VOCs. Because no better alternative existed, the oil-side analysis wasunchanged and analyzed for only the same four constituents identified during the bench-scaletesting. An additional analysis was added for the air side with the knowledge that the module couldturn out to be selective in its removal rate; additional samples were taken parallel with the totalhydrocarbon analyzer to be analyzed by EPA Method 25. These carbon tube samples were extractedand analyzed on a GC that is normally used for identifying unknown compounds in coatingsformulations. A sample run identified eight compounds on the standard search list.
Pilot-scale test results were variable and, at times, difficult to understand. Initial test results usingthe total hydrocarbon analyzer showed inlet and outlet results varying from 20 to 65 percentremoval. Oil analysis, however, almost never agreed with those removal rates, and during later tests,when charcoal tubes were analyzed by GC/MS, averaged removal rates based on the eightconstituents were always reported higher than those with the other two methods. To understand this,it is important to remember that each method was different and comparability was not a given. Thetotal hydrocarbon analyzer measures total carbon atoms, and the relationship between its readoutin parts per million and the other methods requires the use of a multiplier to account for the more-complex molecular structure of organic compounds. Regardless, with any reasonable factor (e.g.,4.0 for typical paint compounds), the data from GC/MS barely exceed 1 percent of the readingproduced by the total hydrocarbon analyzer. This implies that the eight compounds that wereidentified by GC/MS represented only 1 percent of the total constituent VOC content of the paint,and while the module was relatively efficient at removing some compounds, especially thoseidentified by the GC/MS, it was unable to remove other compounds, especially after the oil had beenused. The total hydrocarbon analyzer reported an overall VOC removal rate that was comparableto the rate reported by GC/MS at times and not comparable at other times.
More problematic was that the oil analysis data rarely reflected the air side removal. In some cases,the oil showed no removal, while the air side showed removal of 20 percent or more. Onecontributing factor is that the oil analytical procedure was developed during the bench-scale studies,and calibrations were based on removal of four, well characterized, pure compounds rather than theeight identified in the GC/MS samples, or the many unknown compounds contributing to the totalhydrocarbon analyzer data. However, with even the four known compounds, the GC/MS data didnot always agree with the oil data. A possible explanation is that much of the stripped VOCs did not
28
pass through the fiber boundary but, rather, was adsorbed and temporarily held both on the wettedouter surface of the fibers and by the static oil that had formed a puddle inside the apparatus duringthe tests. Contributing to this theory is a daily operational aspect. Each time a test was completed,the air fan was left running to prevent migration of the paint vapors to office areas adjoining thelaboratory. During this time, the oil outside the fibers that had adsorbed VOCs was thus desorbed,and this cleaned oil was again the dominant remover during the next test.
To treat the needed 500 ft3/mim, 20 modules were ordered with the latest in design specificationsof the bench-scale module: 2.3 m2 area and 3.5 × 10 × 1.5 inches (89 × 254 × 38 mm). Althoughscaling up by using many small modules was not an ideal approach, project time requirements fordelivery required using existing production methods, and this was the largest size that could be madewith existing production equipment. To reduce bypass around the side, a shelf area was added tooverlap the fibers, and the silicone rubber bridge that became distorted on the first bench-scaleversion was dropped. One advantage of the small modules was that, to suit various test scenarios,they could be arranged in a range of patterns such as multiple banks of module for increased contacttime or parallel arrangements for greater air flow rates. The rest of the apparatus (module mountingframes, ducting, transitions, and oil piping) was designed with this in mind, and to reduce assemblytime, the transitions and mounting frames were constructed while the modules were in production.
After the 20 modules were delivered, a number of tests were done to determine their basic integrity.Although AMT tested the modules under pressure with air, no tests had been done with silicone oil.Therefore, each module was to be unpackaged, visually inspected, and then tested under 5 psi oilpressure. Based on visual inspection, several of the modules exhibited question-able potting materialwith bubbles and extrusions. The bubbles were due to the urethane curing at humidity that was notideal. Two with obvious porosity problems were chosen for pressure testing, and each leaked almostimmediately upon start up. This was seen as serious enough to warrant stopping further tests whileAMT addressed the problem. After these were sent back, AMT determined that one was damagedin shipment and could be repaired. To conserve the short time remaining in the project, a decisionwas reached to test some of the remaining modules. The apparatus was easily able to test 10 modulesarranged in two series-arranged banks. Therefore, they were assembled into a reduced-size, pilot-scale apparatus so testing could begin. This required a reduction in airflow from the planned 500cfm. The maximum treated stream was 200 cfm.
Meanwhile, AMT was unable to locate the leak in the second returned module. The leak that hadbeen seen during receiving tests was the result of a slow, but continuous, sweating of oil through thepores of the fibers. This suggested a difference between AMTs tests and the receiving tests; thereceiving tests had used silicone oil with a viscosity similar to octanol, or about 5 cs, whereasAMT’s tests were done with the more commonly available 50-cs oil. Further study revealed that the

29
thinner silicone oil was acting more solvent-like; it was seeping through the pores of the fibers, bothwetting the outside of the fibers and accumulating, over time, in a puddle at the bottom of themodule. Based on this information, AMT advised that further tests should be limited in pressure andoil flow rate.
After a number of tests with the 10-module arrangement, the apparatus was disassembled for avisual inspection, and it was apparent that wetting the fibers had created a problem that hadpreviously gone unnoticed. The fibers were again distorted much like had occurred during thebench-scale testing. It was then determined that the distortion was not due just to swelling thesilicone rubber bridge that had been deleted from the design but was also due to individual fibersswelling much as had occurred in the octanol compatibility tests. The thinner, 5.0 cs oil had actedon the fibers much like an aggressive solvent, and the stretching was creating voids and packedareas. Therefore, the modules had an unknown, but certainly not optimal, contact efficiency. At thistime, AMT recommended that we use the remaining 10 modules in another test using the thicker,50 cs oil. Their reasoning was that the thicker oil would be unlikely to seep through the fibers. Afterassembling the remaining 10 modules, a shakedown test was started. To attain the same flow ratethat was used in previous tests required a much higher pressure (about 30 psig) setting, and one ormore modules ruptured, causing a catastrophic loss of oil, and the testing was stopped. In retrospect,while thicker oil would be less likely to seep through the fiber, its viscosity requires much higherpressure for any given flow rate. To prevent failure of the urethane potting material would haverequired a much lower flow rate, and with lower flow rates, the driving forces would be reduced,so any advantages may have been lost. Contaminated stripper fluid from the pilot plant wastransferred to the NCSU laboratory for bio-treatment.
4.2 Biological Treatment SystemThe experiments related to the biological treatment system can be organized into four majorcategories of suspended cell experiments performed in shake flasks, biofilm experiments performedin flat-sheet membrane units, biofilm experiments performed in hollow-fiber membrane units, andexperiments involving hollow-fiber units in series with a stirred tank reactor. These categoriesrepresent qualitatively different objectives.
! Shake flask (suspended-cell) experiments determine organism and mixed-culturecharacteristics,
! Flat-sheet biofilm experiments determine the basic behavior of pure- and mixed-culturebiofilms,
! Hollow-fiber-module experiments determine the robustness of the degradative activity andevaluate biofouling control schemes, and
! Experiments involving the hollow-fiber module operated in series with a suspended-cell

30
reactor demonstrate the capability to simultaneously degrade aliphatic and aromatic VOCs.
Characterization of the performance of the bacterial consortium on mixed VOCs is confounded bythree facts: (1) growth and degradative behaviors of a mixed culture cannot be expected to be thesum of the behaviors for each organism in the culture grown separately; (2) immobilized-cell(biofilm) growth kinetics often deviate significantly from suspension-culture (shake-flask) growthkinetics; and (3) growth of a single organism on a mixture of compounds is not easily related togrowth on the individual compounds.
The complex interactions between species and compounds must be identified and quantified beforeone can effectively design and operate a biotreatment module. To adequately describe the behaviorof this system, a series of suspended-cell-growth studies and membrane-supported-biofilm-reactorexperiments were completed. Complete data sets for each experiment can be found in Appendix B.
4.2.1 Suspended-Cell ExperimentsA significant number of growth studies were performed during the course of this research, many inresponse to the degradative behavior exhibited by the mixed-biofilm reactor system. The first setof experiments to be described pertain to the need to identify degraders for compounds found inMilSpec paints; specifically m-xylene, p-xylene, ethylbenzene, butyl acetate, butanol, MEK andacetone.
4.2.1.1 Screening StudiesOriginal screening studies were performed to identify organisms capable of degrading m-xylene, andtwo organisms were ultimately established with those capabilities, respectively designated MX-1and X1. Subsequent screening studies were undertaken to establish degradation of p-xylene,ethylbenzene, butanol, butyl acetate, and acetone.
4.2.1.2. Xylene DegradersThe first of these studies involved the screening of MX and X1 for growth on p-xylene andethylbenzene. This was done to select one of the two different strains for further studies.
Methods: Cultures were grown under sterile conditions in 250-mL flasks incubated at 30 °C in ashaker (250 rpm). The flasks contained 50 mL of L-salts medium; individual VOCs were added asliquid in quantities of 5–7.5 µL. The flasks were covered with foil and sealed with Parafilm beforeincubation. Optical density of the culture at 600 nm was monitored for up to 72 hours to detectgrowth. The initial concentrations of p-xylene and ethylbenzene were 150 ppm and 100 ppm, respectively.

31
Results: Both organisms were able to grow on p-xylene, but only X1 grew on ethylbenzene. Basedon these results, X-1 was chosen for the staged biotreatment experiment.
4.2.1.3 Aliphatic DegradersTwo organisms that had been isolated previously, designated M1 and AOC-1, were screened forgrowth on butanol, butyl acetate, MEK, and acetone. This was done to select the better aliphatic-compound degrader of the two strains for the staged biotreatment study.
Methods: Cultures were grown under sterile conditions in 250-mL flasks incubated at 30 °C in ashaker (250 rpm). The flasks contained 50 mL of L-salts medium; individual VOCs were added asliquid in quantities of 5–7.5 µL. The flasks were covered with foil and sealed with Parafilm beforeincubation. Optical density of the culture at 600 nm was monitored for up to 72 hours to detectgrowth. Initial concentrations of all substrates were 150 ppm.
Results:
Organism MEK Acetone Butanol Butyl AcetateM1 + + + +AOC-1 (-) + + +
M1 grew on all four substances. AOC-1 grew on acetone, butanol, and butyl acetate; but growth onMEK was very uncertain. Therefore M1 was chosen for the staged biotreatment experiment.
4.2.1.4 Growth StudiesMany growth studies were carried out in conjunction with screening studies to quantify growth ratesand extents of VOC degradation. These growth studies involved the organisms MX, X1, and M1.Table 13 summarizes the experiments performed over the course of the project. Only theexperiments that have not been described in previous reports or publications will be commented ondirectly; the results of all the experiments can be found in the appendices. Although each experimentinvolved specific organisms and substrates, a general methodology was employed for culture growthand characterization.
Culture growth: Growth flasks were prepared under sterile conditions in screw-top flasks. L-saltswere added to the flask, and the headspace was filled with oxygen. The substrate was added, andinoculation was effected by adding a sufficient amount of an overnight culture to a total liquidvolume of 150 mL. The flask was sealed with an open-top closure with a PTFE-coated septum, anda needle pierced through the septum connected to a Teflon valve. A control flask was prepared ina similar way but without inoculation. Liquid was withdrawn by use of a glass syringe for optical

32
Table 13. Suspension-Culture Experiments
Experiment No. Organisms Substrates RationaleGS1 X1 m-Xylene Strain characterizationGS2 X1 Toluene Substrate rangeGS3 X1 m-Xylene, toluene Metabolic regulationGS4 M1 Toluene Substrate rangeGS5 M1 MEK, toluene Metabolic regulationGS6 M1 MEK, m-xylene Metabolic regulationGS7 M1 Toluene, m-xylene Substrate rangeGS8 M1 MEK, toluene, m-xylene Metabolic regulationGS9 M1, X1 MEK, toluene Metabolic regulationGS10 M1, X1 MEK, toluene, m-xylene Organism interactionsGS11 MX p-Xylene Substrate rangeGS12 X1 p-Xylene Substrate rangeGS13 X1 m-Xylene, ethylbenzene Metabolic regulationGS14 X1 m-Xylene, p-xylene Metabolic regulationGS15 M1 Butyl acetate Substrate rangeGS16 M1 MEK, butyl acetate Metabolic regulation
density (OD) and VOC measurements. During the sampling, oxygen was added to the flasks tocompensate for the volume withdrawn. The control flask was treated in the same way, but thesamples for OD were discarded.
General analytical procedure: The sample withdrawn for VOC analysis (1 mL) was transferred intoa 2-mL vial containing 1 drop of acetic acid to acidify the sample. Extraction of the VOCs wascarried out by addition of pentane (0.1–0.2g) containing heptane as internal standard. The samplewas shaken vigorously for 2 minutes and stored upside down at 5 °C. Analysis was performed witha Hewlett–Packard 5890 gas chromatograph (GC) equipped with a J&W Scientific capillary column(DB-624) and a FID detector. A 1-µL portion of the pentane phase was injected into the GC, andthe response was compared to the response from standards prepared in pentane.
4.2.1.5 MX and X1 Growth on p-Xylene (GS 11, 12)The objective of these experiments was to study the growth and degradation of p-xylene by the m-xylene-degraders in order to choose the best organism for xylene degradation in the stagedbiotreatment unit. The substrate (p-xylene) was added so that initial concentrations varied from100–150 ppm.
Results:

33
Organism Growth Rate(h-1)
MX 0.29X1 0.49
The inoculum was grown on m-xylene, so not surprisingly both organisms exhibited a long lag phase(20–30 hours). The growth rates indicate that X1 degrades p-xylene more rapidly than does MX.Although suspension culture behavior is not completely indicative of the behavior of organismswhen attached to a surface, X1 was selected for further evaluation.
4.2.1.6 Effect of Ethylbenzene on Growth of X1 on m-Xylene (GS13)The objective of this experiment was to determine whether ethylbenzene has a positive or negativeeffect on the rate of degradation of m-xylene by X1. This would indicate whether the pathwaysinvolved in the degradation of these two compounds were synergistic, antagonistic, or non-interactive.
Methods: Growth flasks were prepared as described above. The initial concentration of m-xylenewas 150 ppm in all flasks. Initial concentrations of ethylbenzene were varied: 0 ppm, 50 ppm, 100ppm, and 150 ppm. The flasks were closed as described above. Optical densities were followed for26 hours.
Results: Ethylbenzene appeared to have very little effect on the growth rate. It seems that the initiallag phase was shorter in the presence of ethylbenzene, indicating that the presence of ethylbenzenemight facilitate m-xylene degradation. Another possibility is that ethylbenzene was degraded as well.However, no VOC analysis was undertaken.
The presence of ethylbenzene in high concentrations (150 ppm) did affect the apparent growth yieldobtained after 26 hours. For an initial concentration of ethylbenzene of 150 ppm, the final opticaldensity was 0.17 compared to 0.24–0.26 for cultures exposed to lower concentrations ofethylbenzene. The growth had reached a stationary growth phase in all the flasks, which wasconfirmed by a sample point after 32.5 hours. The lower OD level for the high concentration ofethylbenzene indicated that the growth of X1 on m-xylene was inhibited rather than ethylbenzenewas degraded itself. For further study of the effect from ethylbenzene, VOC analysis should be doneto determine if ethylbenzene is being degraded. The table below shows the growth rates calculatedfor each concentration of ethylbenzene, and the optical densities of each culture after 26 hours.

34
Concentrationof Ethlybenzene
(ppm)
Growth Rate(h-1)
Period forExponential Growth
(h)
OD after26 hours
0 0.23 11 S 19 0.2450 0.20 7 S 16.5 0.26
100 0.24 7 S 16.5 0.24150 0.22 4 S 16.5 0.17
4.2.1.7 Growth of X1 on m-Xylene and p-Xylene (GS14)The objective of this experiment was to study the growth and degradation of mixtures of m- and p-xylene by X1. Again, the concern was that there might be negative interactions between the twodegradative pathways or intermediates generated therein.
Methods: Growth flasks were prepared as described above; m-Xylene and p-xylene were added toa concentration of 75 ppm each.
Analytical procedure: It was not possible to separate m-xylene from p-xylene, so a totalconcentration of the two xylenes was calculated.
Results: The growth curve indicated that the two substrates were degraded concurrently. The growthtook place within 10 hours, and no lag phase was observed. After 9 hours, m-xylene and p-xylenecould not be detected in the liquid. The growth rate obtained in this study is compared to growthrates determined in previous studies of X1 growing on m-xylene and p-xylene as single substrates.Results show that the growth rate obtained in the presence of both substrates is lower than the oneobtained when only m-xylene is present, but higher compared to the growth rate obtained for p-xylene.
Substrate Growth Rate(h-1)
m-Xylene 0.78p-Xylene 0.49m-Xylene + p-xylene 0.58

35
Figure 9. Flat-Sheet Contactor Schematic
4.2.1.8 M1 Growth on Butyl Acetate and a 50:50 Mixture of Butyl Acetate and MEK (GS15, 19)
The objective of these experiments was to study the effect of butyl acetate on the rate of MEKdegradation and of growth of M1 on MEK.
Methods: For the study with butyl acetate, the concentration of substrate in the flask was 150 ppm,whereas concentrations of butyl acetate and MEK were 75 ppm each for the mixed-substrate study.
Results: The growth curve indicated that butyl acetate and MEK were degraded concurrently. Aneffect from the presence of MEK was seen on the growth rate for butyl acetate; the growth rateobtained for the mixture of butyl acetate and MEK was lower than that obtained for M1 growing onbutyl acetate alone.
Substrate Growth Rate(h-1)
MEK 0.5Butyl Acetate 0.70MEK + Butyl Acetate 0.57
4.2.2 Flat-Sheet Biofilm ExperimentsExperiments were performed utilizing a small contactor using a flat, square section of porouspolypropylene substrate. The basic configuration employed in these studies is shown in Figure 9.

36
The system was operated under countercurrent flow with a flow rate significantly smaller than therecycle flow rate, resulting in well mixed fluid in the reservoirs and on each side of the membranewithin the contactor. This configuration was adopted because it allowed relatively rapidestablishment of films and determination of degradative activity and because the film could besampled directly for characterization (thickness, composition).
Initiation of all of these experiments involved aqueous phases on both sides of the membrane, withthe substrate being provided through the membrane in all cases. Subsequent to establish-ment of aviable, active biofilm, the feed fluid either remained aqueous or was switched to an oleophilic fluid(octanol or silicon oil, for example).
Flat sheet biofilm experiments were conducted according to the matrix in Table 14.
Table 14. Flat-Sheet Biofilm Experiments
Experiment No. Organism(s) Substrate(s) Comments
FS1 M1 MEK, toluene aq/aqFS2 M1 MEK aq/octanolFS3 M1, X1 MEK, toluene aq/aqFS4 M1, X1 MEK, toluene, m- xylene aq/aqFS5 M1, X1 MEK, toluene aq/octanolFS6 X1 p-Xylene aq/aqFS7 X1 m- Xylene aq/aqFS8 X1 m- Xylene, p-xylene aq/aqFS9 X1 m- Xylene, p-xylene aq/silicone oil
General experimental procedures: During experiments to determine the degradative capacity of thebiofilm developed on the membrane, a 1-L flask containing 800 mL of oxygenated L-salts(reservoir) replaced the chemostat (CSTR), and a 1-L flask with 800 mL feed solution replaced thefeed bottle. Both flasks were stirred, and flow rates were as given above. For analyses of VOCconcentration, 1.0-mL samples were withdrawn hourly. VOC concentrations in the reservoir andfeed bottle were followed for at least 5 hours.
General analytical procedures: The liquid samples were transferred to a 2-mL vial containing 1 dropof acetic acid for preservation. VOC extraction was carried out by adding pentane (0.1– 0.2g)containing heptane as an internal standard. The sample was shaken vigorously for 2 minutes andstored upside down at 5 °C. Analysis was performed with a Hewlett–Packard 5890 GC equippedwith a J&W Scientific capillary column (DB-624) and a FID. A 1-µL portion of the pentane phasewas injected into the GC, and the response was compared to the response from standards prepared
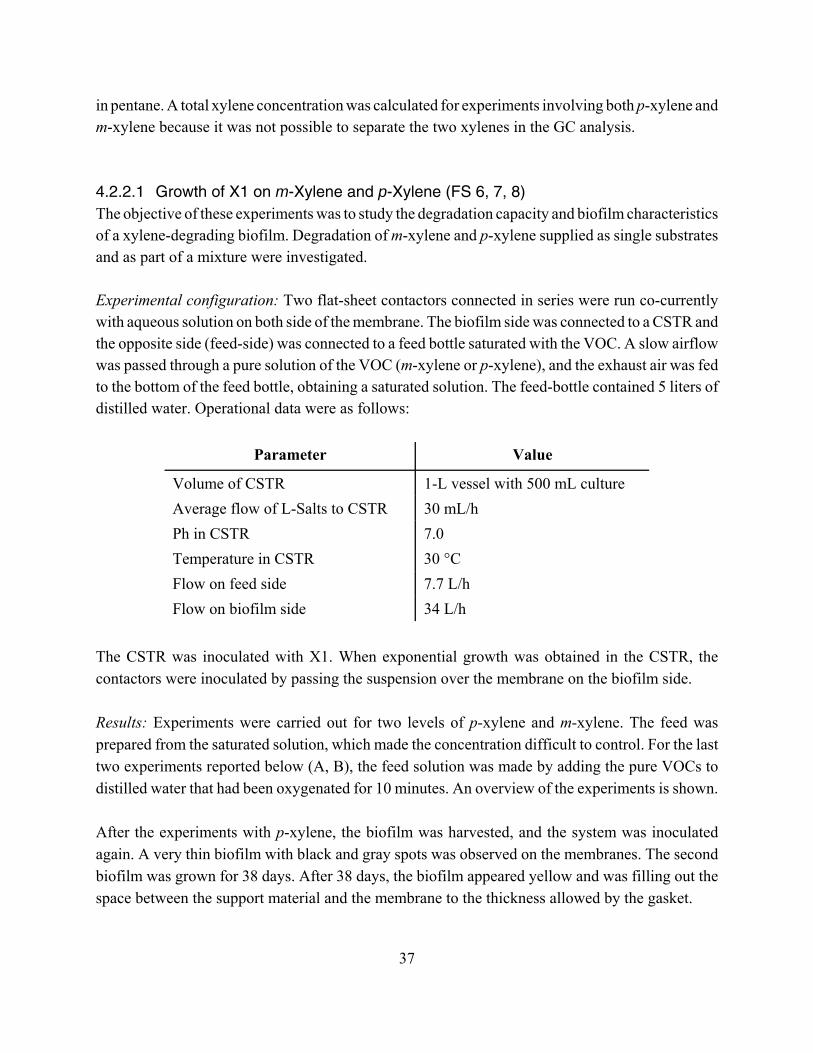
37
in pentane. A total xylene concentration was calculated for experiments involving both p-xylene andm-xylene because it was not possible to separate the two xylenes in the GC analysis.
4.2.2.1 Growth of X1 on m-Xylene and p-Xylene (FS 6, 7, 8)The objective of these experiments was to study the degradation capacity and biofilm characteristicsof a xylene-degrading biofilm. Degradation of m-xylene and p-xylene supplied as single substratesand as part of a mixture were investigated.
Experimental configuration: Two flat-sheet contactors connected in series were run co-currentlywith aqueous solution on both side of the membrane. The biofilm side was connected to a CSTR andthe opposite side (feed-side) was connected to a feed bottle saturated with the VOC. A slow airflowwas passed through a pure solution of the VOC (m-xylene or p-xylene), and the exhaust air was fedto the bottom of the feed bottle, obtaining a saturated solution. The feed-bottle contained 5 liters ofdistilled water. Operational data were as follows:
Parameter Value
Volume of CSTR 1-L vessel with 500 mL cultureAverage flow of L-Salts to CSTR 30 mL/hPh in CSTR 7.0Temperature in CSTR 30 °CFlow on feed side 7.7 L/hFlow on biofilm side 34 L/h
The CSTR was inoculated with X1. When exponential growth was obtained in the CSTR, thecontactors were inoculated by passing the suspension over the membrane on the biofilm side.
Results: Experiments were carried out for two levels of p-xylene and m-xylene. The feed wasprepared from the saturated solution, which made the concentration difficult to control. For the lasttwo experiments reported below (A, B), the feed solution was made by adding the pure VOCs todistilled water that had been oxygenated for 10 minutes. An overview of the experiments is shown.
After the experiments with p-xylene, the biofilm was harvested, and the system was inoculatedagain. A very thin biofilm with black and gray spots was observed on the membranes. The secondbiofilm was grown for 38 days. After 38 days, the biofilm appeared yellow and was filling out thespace between the support material and the membrane to the thickness allowed by the gasket.

38
Substrate Level Age of Biofilm(days)
p-XyleneHigh 5Low 7
m-XyleneHigh 5Low (150 ppm) 10A
p-Xylene + m-Xylene 100 ppm of each 25B
Results: All experiments exhibited very low VOC concentrations in the film-side reservoir. Theconcentrations were below 1 ppm except for the first experiment, for which a high concentration (26ppm) was observed for the very first point and an increase from 0.1 ppm to 4 ppm was observedduring the 10-hour run. Because of the insignificant concentrations in the film-side reservoir, theremoval of VOC from the feed may be considered as the amount degraded in the biofilm.
For the young biofilms (5–7 days), the average removals of p-xylene and m-xylene from the feedbottle were in the range 4–11 ppm/h. For the 10-day-old biofilm, the average removal of m-xylenewas 20 ppm/h. However, the removal appeared to take place only during the first 4–7 hours ofexposure to the substrate. After 4 hours, the concentration in the feed bottle established a constantlevel and no further degradation was seen. This could be due to oxygen limitation in the system, asno oxygen was supplied during the experiment. For the 10-day-old biofilm, the feed solution wasoxygenated prior to the experiment, which may explain the higher removal. This could also be dueto growth of the biofilm and, hence, an increase in active biomass. For the same experiment, thereservoir was replaced by a new oxygenated reservoir after 21 hours. After the replacement,additional substrate removal was observed, which may confirm that the m-xylene degradation wasoxygen-limited.
When p-xylene and m-xylene were supplied as a mixture, the biofilm was 25 days old, and anaverage removal of 60 ppm/h was observed for the first 2.5 hours. The feed solution was alsooxygenated prior to this experiment, making higher removal possible. However, the removalobtained in this study (150 ppm) compared to the removal obtained in the study with the 10-day-oldbiofilm (80 ppm) should be equal if the amount of oxygen was the critical limitation, since the sameamount of oxygen was supplied in the two experiments. The discrepancy between the two resultsmay still be oxygen limitation, but a limitation inside the biofilm rather than in the aqueous phases.

39
4.2.2.2 Growth of X1 on m-Xylene and p-Xylene (FS 9)The objective of these experiments was to determine the ability of the biofilm to extract substratefrom an oleophilic feed fluid.
Experimental configuration: Two flat-sheet contactors were connected in series. After establishmentof the biofilm (1–2 weeks), the activity of each contactor unit was determined separately. In eachcase, silicon oil was fed to the feed side, and L-salts medium was fed to the biofilm side. The oil andthe L-salts were run counter-current in closed loops. The capacity of the contactor unit wasdetermined by following the concentration of the substrate in both reservoirs after spiking the oilwith VOC. After determination of the capacity, the biofilm was harvested, and samples for biofilmthickness (wet weight), cell count, and protein content were collected.
Results: Removal of m-xylene and p-xylene from the silicone oil was not detectable during the 25-hour- long experiment.
Contactor Film Age(days)
BiofilmThickness
(µm)
ProteinContent(µg/cm2)
CellCount
(cells/cm2)1 12 14 4.7 24×106
2 19 95 — 86×106
4.2.3 Hollow-Fiber Membrane ExperimentsA series of experiments using hollow-fiber modules was performed to establish the efficacy of theproposed biotreatment module for enhanced VOC removal from the octanol. The liquid/liquidstripping efficiency of MEK (octanol to water) was determined for the biotreatment module bothwith and without a biofilm present. Three aqueous (absorbent) flow rates were examined, with aconstant 5000-ppm MEK concentration in octanol and an octanol flow rate of 290 mL/min. Sampleswere taken in duplicate. Results shown in Table 15 (comparing the 301-mL/min flow, abiotic vs.biofilm) indicate that the presence of a live biofilm enhanced MEK removal by approximately 43percent.

40
Table 15. Biomembrane Mass Transfer
Experiment Type Abiotic BiofilmAqueous Phase filtered tap water L-saltsa
Qaqueous (mL/min) 116 301 598 301Qoctanol (mL/min) 290MEK in Octanol (ppm) 5000Mass Transfer Rate (g/m2h) 1.80 2.07 4.45 2.97
a pH-balanced trace-nutrient source for microbiological organisms
4.2.4 Staged Biotreatment of VOC Mixtures in Lab-Scale ReactorA membrane bioreactor for treatment of a broad range of compounds found in paints for aircraft wasset up. Different levels of water solubility among the compounds suggested a staged bioreactorcomprising a membrane contactor (Liqui-Cel) and a chemostat (CSTR). VOCs were supplied to theLiqui-Cel in silicone oil. The Liqui-Cel served as the reactor for removal of compounds with lowwater solubility, whereas compounds with high water solubility are more likely to be removed inthe CSTR. The objective was to study the performance of the staged bioreactor system and to studythe degradative capacity for mixtures of VOCs with different water solubilities in the bioreactorsystem inoculated with two organisms. A limited number of VOCs were chosen, and the removalof these compounds was monitored. VOC-contaminated oil obtained during air treatment wastreated as well.
Experimental configuration: A Celgard Liqui-Cel unit with polypropylene fibers was used as themembrane contactor. The volume of the shell side was 0.4 L and of the lumen side was 0.15 L. Theoil passed through the lumen side at a flow rate of 54 mL/min. (3.2 L/h). A CSTR with a liquidvolume of 4 L was connected to the shell side, and the bacterial suspension was passed through theshell side in a counter-current mode. The flow rate of the aqueous phase was 400 mL/min (24 L/h).Aerated L-salt medium was supplied to the CSTR at 100 mL/h. The temperature was set at 30 °C,and pH was adjusted to 7.0. The supply of L-salt medium to the CSTR was turned off during theexperiment, and the outlet and the air vent from the reactor closed. Oil samples were withdrawnfrom the oil reservoir, and aqueous samples were taken at the inlet and outlet from the Liqui-Cel.M1 and X1 were cultivated in a 1-L chemostat, and when exponential growth was obtained, theLiqui-Cel was inoculated by passing the suspension through the shell side. The attached CSTR wasinoculated with M1, and after reaching exponential growth, the reactor was supplied with L-saltmedium containing MEK until a biofilm was established. The systems were combined, and oilcontaining both MEK and m-xylene served as the substrate source.

41
Analytical procedure: All oil samples and aqueous samples containing both MEK and butyl acetateor paint components were analyzed by ARCADIS. GC analysis was performed on the aqueoussamples for determination of the aromatics, and high performance liquid chroma-tography (HPLC)analysis was done to determine aqueous MEK concentrations. Samples for aromatics weretransferred to 2-mL vials containing 1 drop of acetic acid for preservation. Extraction of VOCs wascarried out by addition of pentane (0.1– 0.2g) containing heptane as internal standard. The sampleswere shaken vigorously for 2 minutes and stored upside down at 5 °C. Analysis was performed witha Hewlett–Packard 5890 GC equipped with a J&W Scientific capillary column (DB-624) and a FID.A 1-µL sample of the pentane phase was injected into the GC, and the response was compared tothe response from standards prepared in pentane. Samples for MEK were collected in 2-mL plasticvials and kept in the freezer until the analysis. HPLC analysis was performed by use of a SpectraPhysics HPLC equipped with a Waters 990 Photodiode Array Detector and a reverse-phase AltimaC-18 column. The mobile phase used was methanol and phosphate buffer (50 mM KH2P4) acidifiedwith 0.1 percent trifluoroacetic acid. The thawed samples were centrifuged to spin down the cellmass. Sample volumes of 100 µL were analyzed.
Experimental procedure: The substrates were chosen to represent constituents in paint were m-xylene and p-xylene (aromatics), MEK (ketones), and butyl acetate (BA) (esters). Table 16 describesthe substrate levels and combinations used in the experiments.
Table 16. Biotreatment of VOC Mixtures in a Lab Scale Reactor
ExperimentNo. Substrates
Concentrationsin Oil(ppm)
Volume Oil(mL)
Volume AqueousPhase(mL)
SB1 MEK + m-xylene 500 1000 4000SB2 MEK + m-xylene 1000 1000 4000SB3 MEK + m-xylene 1500 1000 4000SB4 MEK + p-xylene 500 1000 4000SB5 MEK + p-xylene 1000 1000 4000
SB6 MEK, BA, m-xylene 500 1000 4000
SB7Oil with MEK, BA,ethylbenzene, m-
Various 1800/2000 4000
SB8 Oil with paint Various 1800/2000 4000
Results: Treatment of MEK and m-xylene in mixture was examined in seven experiments. Thesystem was closed down after the first three experiments due to operational problems. The systemwas set up and inoculated again, and four more experiments were done with MEK and m-xylene.

42
In the first three experiments, a high removal of m-xylene from the oil was observed. In the aqueousphase, m-xylene was either not detectable or detectable only at low concen-trations. The waste outletand the air vent from the CSTR were not closed during the first three experiments, which may havecontributed to the high removal. Removal of m-xylene at rates up to 18 ppm/h was obtained duringan 8–10 hour period in the next four experiments. Rapid transfer of MEK from the oil to the aqueousphase was observed in all the experiments. However, the removal of MEK was very low, and anaccumulation of MEK in the aqueous phase was observed. After the experiments with MEK and m-xylene, p-xylene replaced m-xylene in the mixture. Removal of p-xylene was not detectable.Removal of MEK from the aqueous phase appeared to take place in the range of 5-14 ppm/h.
When mixtures of MEK, BA, m-xylene, and p-xylene were treated, MEK removal was observed aswell. It was not possible to separate m-xylene from p-xylene in the GC analysis, so total xyleneconcentration was determined. The rate of removal of the xylenes was 36 ppm/h. BA appeared tobe removed as well (standard curve for MEK was used for the GC-analysis).
Treatment of oil containing a mixture of BA, ethylbenzene, m-xylene, and o-xylene showed onlyinsignificant removal of VOCs from the oil. When oil run in the air treatment system with paint wastreated, only xylene removal was observed. MEK and BA appeared only in the oil run with paintfor two hours and both compounds were removed immediately from the oil.
43
5.0 ConclusionsThis study was performed to collect data on a novel hollow-fiber membrane-based technology toextract and process VOCs from a dilute stream produced by processes such as paint spray booths.The resultant reactions would form water and CO2 as a final exhaust stream. This system was at leastpartly developed during the execution of this project, and the components tested were judged bytheir capability to produce a system that is economically competitive with such other technologiesas thermal afterburners or adsorption systems (e.g., carbon filters). It is concluded that the processscience is sound. Under tests/evaluations in which process economics were not considered, VOCremoval rates (greater than 70 percent) of certain compounds were measured. Although many of theproblems were technical in nature, many could likely be resolved through further research andresource allocations.
5.1 Separation SystemNo suitable separation module currently exists, and the project’s development efforts failed toproduce a suitable module to deliver a complete, cost-competitive system for VOC control.Membrane-contactor developers are currently devoting their time and resources to applications theydeem more promising with brighter payoff potentials. Equipment size is a problem as well.Microfiber contactor modules are typically developed for small-scale processes, and a modulesuitable for extracting VOCs from a large paint booth would require manufacturing capabilities thatare not currently available. A suitable module could be as much as 20 to 50 times the size of thelargest module currently available for any process, and its production equipment would be requiredto outfit more than just paint booth processing equipment to meet the necessary economies of scale.In addition, radial modules are the most-commonly available, but the separation contactor for paintbooth work needs to be a box-type cross-flow module to reduce the air-side pressure drop toreasonable levels.
A number of microporous fibers were tested for their potential to develop appropriate high-performance modules. In early testing, a number of modules with uncoated fibers were tested thatproduced reasonable results, but pressure balancing between the air side and transfer-fluid side wasdetermined to be economically unfeasible, so modules with coated fibers were pursued as a solution.Pore size as well as coating thickness and consistency are the important parameters for producingthe appropriate extraction performance in fibers. The coating must be inert to prevent reactions andsuch performance detriments as coating swelling or softening. The coating must adhere to the fiberwalls. A plasma-polymerized silicone-rubber-coated fiber developed by AMT proved to have goodadherence and inertness properties, and this fiber displayed good endurance under a wide range ofpressures. The AMT fiber has a greater potential for module development than any other coated

44
fiber developed or tested in this project. Although testing showed this fiber leaked silicone oil, thecoating thickness could have been adjusted to address this problem if more time had been available.Other adjustment are also available to address this problem including coating treatments, pore size,and post-treatment processing steps.
A successful module must be developed simultaneously with testing the intended transfer fluid tobe certain of material and physical compatibility. Before modules are developed, potting andmodule-frame materials must be tested with the intended contact fluid using extended contact timesand under the intended operating pressure. Seals such as O-rings or other gaskets must be able towithstand constant immersion in the intended transfer fluid. Octanol attacked many O-ring materialsthat were used on the Celgard modules during early testing, and the only O-ring found to withstandthis fluid was cost prohibitive for production purposes. Subsequently, octanol was found to alsoswell the coated fibers that were used in the AMT cross-flow separation contactor. This swellingcaused bunching and voids in the fiber bundle that resulted in air flow channeling and poor contact.A number of alternate fluids were considered before settling on a replacement for octanol. Thesealternatives included canola oil and mineral oils, both of which have too many impurities to allowaccurate GC determination of extracted compounds, and silicone oil, which would be costprohibitive in a full-scale facility and would have unknown effects on bugs over a long period.Silicone oil was chosen as an alternative to octanol but, because of time constraints, was notthoroughly tested for partitioning performance, and this may have played a big role in thedisappointing removal efficiency test results. In addition, although materials compatibility testingwith a higher-viscosity silicone oil produced acceptable results, performance results with a lower-viscosity oil, chosen for its similarity to octanol, resulted in unforeseen problems such as weeping,leaking, and stretched fibers. An optimized module must be closely matched in all characteristicsto its extraction fluid. Based on the experience with this project, a fluid or fiber substitution willalmost always require a complete return to the beginning of the development cycle.
The AMT cross-flow module has the necessary characteristics for acceptable air-side pressure-dropperformance. However, distortion of the fibers caused by small leaks of the thin silicone oilproduced uneven contact that counteracted any performance improvements. Data showed thatperformance from a given arrangement of modules is adversely affected by increased airside flow.Extraction performance drops progressively as the oil absorbs higher quantities of VOCs, but theresults of testing may have showed the limited capacity of silicone oil compared to octanol. Thisconclusion seems particularly obvious when seeing that VOC absorbance dropped quickly duringsome runs, when the oil was still lightly loaded. On the other hand, increasing oilside flow andpressure enhances performance. This increased performance is, of course, limited by moduleintegrity, and running at higher pressures caused failure of several modules.

45
5.2 Biotreatment System
5.2.1 Biodegradation Range and ExtentThe screening studies, and subsequent growth studies, indicate that several organisms that wereisolated are capable of degrading the model compounds tested (m-xylene, p-xylene, toluene, methylethyl ketone, butyl acetate). As one would expect, no single organism was capable of simultaneouslydegrading all of the compounds used during the project. Therefore, a consortium of organisms wasused to effect degradation of VOC mixtures. The majority of the work performed focused on twoorganisms, designated M1 and X1. These organisms were isolated utilizing aliphatic and aromaticsubstrates, respectively.
The degree of degradation exhibited by the organisms used in the study was significant. Betweenthe two organisms, all of the compounds could be reduced to levels below 250 ppb in an aqueousphase. These levels were exhibited in experiments GS2–GS10, GS14, FS3, and FS5–FS8. In everycase, this VOC level represented greater than 99 percent reduction in the amount of compoundpresent initially.
5.2.2 Problems Arising from Metabolic RegulationThe experimental results obtained indicate that concurrent degradation of aromatic and aliphaticVOCs in a single bioreactor is problematic. Cultures containing M1 and X1 (individually or incombination) exhibited roughly concurrent degradation of the aromatic compounds, followed bydegradation of the aliphatics. Table 17 indicates those experiments where concurrent (or nearly so)degradation or aromatic–aliphatic sequential degradation was observed and identifies the compoundsinvolved.
Table 17. Concurrent Degradation
Experiment No. Organism(s) CompoundsGS3 X1 Toluene, m-xyleneGS5 M1 Toluene, MEKGS6 M1 m-Xylene, MEKGS7 M1 Toluene, m-xyleneGS9 M1 AND X1 Toluene, MEKGS10 M1 AND X1 Toluene, m-xylene, MEKGS14 X1 m-Xylene, p-xylene
Ethylbenzene was found to have a predominantly, but not exclusively, inhibitory effect on culture

46
growth and biodegradative activity, as indicated directly by the results of experiment GS13 and ascan be inferred from the results of experiments SB7 and SB8. The results from GS13 indicate thatethylbenzene stimulates growth to a small degree at aqueous phase levels below 100 ppm, but alevel of 150 ppm prematurely terminates cell growth. The low rate of degradation of aromaticcompounds exhibited in experiments SB7 and SB8 (ethylbenzene present) relative to results fromexperiments SB3, SB5, and SB6 (ethylbenzene absent) suggests that aqueous-phase ethylbenzenelevels as low as 40 ppm might have an inhibitory effect on aromatic degradation in biofilm cultures.This is, however, a supposition; further testing is necessary before this can be reliably concluded.Fortunately, no such inhibition was noted for degradation of butyl acetate or MEK.
5.2.3 Treatment StrategyGiven the sequential nature that was observed for aromatic/aliphatic degradation, the strategy wasadopted to circulate the aqueous phase of the biofilm reactor through a continuously stirred tankreactor containing primarily M1 (the aliphatic degrader). As indicated in experiments SB2 throughSB6, this strategy is quite successful in concurrently reducing aliphatics (MEK and/or butyl acetate)and aromatic compounds (m- or p-xylene) in the oil phase. This behavior was indicated by stagedbiotreatment systems with fresh films (SB4, 6) and films regenerated following EDTA-inducedsloughing (SB3, SB5).
5.2.4 ImplementationThe flat-sheet and staged-bioreactor studies indicate that “bioextraction” of VOCs from the carrierfluid occurs at rates sufficient to maintain active cell growth and activity. These studies also indicatethat the hollow-fiber membrane units available to this project had inadequate surface area toeffectively treat the carrier fluid in anything approaching real time. The hollow-fiber membraneunits do, however, offer effective contacting of the biofilm with the carrier fluid. It would appearthat the next steps in evaluation of this configuration would involve (1) identifying an effectivedegrader of ethylbenzene and (2) designing a membrane contactor that would enable sampling ofthe biomass so that comparisons can be made between the flat-sheet results (where biomass can besampled directly) and the hollow-fiber unit performance.

47
6.0 RecommendationsThe technology developed as a result of this project must be technically and fiscally sound beforea decision will be made for future full-scale implementation. Although the technology has beendemonstrated to have technical promise or potential, no results have been produced that warrantfurther consideration and study until manufacturing techniques for membrane modules advanceenough to allow the cost-effective fabrication of low-pressure-drop, high-efficiency, leak-freemodules. The potential cost and environmental benefits of such a system do warrant considerationof further basic development projects aimed at improved fibers, coatings, stripping fluids, andmodule designs.
Future efforts should concentrate on fiber and module development. Many options are available forfiber materials and for coatings (see AMT response), and more are being developed each year,usually for some specific application that suddenly becomes financially promising. Moduleconstruction is also undergoing groundbreaking development in many other applications.
Paints are also being reformulated, and this will make specific module development more difficult,especially considering the difficulty experienced in identifying paint constituents. Future workshould pay particular attention to the great difference between common paint constituents, such asindustrial-grade xylenes and pure compounds, when performance testing. The use of a totalhydrocarbon analyzer through each phase will more clearly establish whether performance goals arebeing achieved or if many compounds are escaping notice.
6.1 AMT RecommendationsApplied Membrane Technology, Inc.'s objective was to develop low-pressure-drop cross-flowhollow-fiber membrane modules for use in the MBT system intended for high volumetric flow ratescontaining low contaminant concentrations of fugitive target compounds. To provide suitable low-pressure-drop modules within the project time constraints, both module fabrication and membranecomposition needed to be based as much as possible upon known parameters of module constructionand chemical formulation. In other words, a thorough investigation of alternative materials ofconstruction that might be more suitable was not feasible during AMT's period of involvement.
AMT's module design was based on a previous project for the US Navy for use in a low-pressure-drop seawater application. This design was adapted for the ARCADIS VOC air project with severalminor alterations to make it more compatible for air-stripping applications. AMT successfullydesigned and built a winding fixture that could wind four cross-flow membrane modules at a time.(Scale-up to larger volumes would be straightforward based on this design). The modules produced

48
using this design yield a very low air side pressure drop as intended. The module housings wereconstructed from polycarbonate due to the need to rapidly tool fixture parts and module components.Other module housing materials suitable for long-term applica-tions could be utilized in the future.
The hollow-fiber membranes proved to be a more-problematic issue. Preliminary testing andevaluations of membrane fibers and prototype modules utilizing plasma-polymerized, silicone-coated, polypropylene fibers indicated adequate flux of VOCs and tolerance for contact with siliconeoil up to 35 to 40 psi. AMT lab evaluations of octanol stripping agents ruled them out due toexcessive swelling and distortion of polypropylene membrane substrates supplied by all vendors.
Membrane compositions for use with silicone-oil stripping agents could be made utilizing strongerpolypropylene substrates produced by Celgard US or AKZO Membrana, although they will exhibitsome degree of swelling depending on pressure, temperature, and the nature of the membrane topcoating. AMT could place copolymer coatings, such as silicone/Teflon or silicone/propylene, ontothese microporous substrates instead of the straight silicone membrane.
The latter copolymer compositions have shown higher resistance to oil permeation and swellingeffects in other AMT lab projects and during evaluation of flat-film samples conducted by outsideresearch groups. The ability to tailor the coatings’ chemical composition offers potential avenuesfor future improvements. Other groups encountered similar problems of oil and solventswelling/permeation during the successful development of solvent extraction from oil in the de-waxing process performed by petroleum companies. Mobil Oil and Texaco use several commercialunits based on flat membranes. AMT can make hollow-fiber versions of similar copolymers, whichmay merit investigation for applications such as the MBT system. AMT would need to evaluate aseries of potting compounds and determine appropriate potting techniques for assembling bundlesof such coated fibers because adhesion becomes more difficult as the concentration of Teflon orpolypropylene increases in the membrane coatings. It is a doable proposition, but the timeconstraints of this project would not have allowed for such trials.
In addition, AMT could evaluate both polymeric and ceramic non-propylene-based substrates. Forexample, new ceramic-based hollow fibers of dimensions comparable to conventional microporousmembranes and coated with a silicone/PTFE copolymer membrane via plasma polymerization mayoffer the ideal membrane composition for membrane-mediated extraction of VOCs. The ceramicmaterials would tolerate broad temperature and pressure regimes and exhibit no swelling behavior,and the membrane coatings could be tailored to optimize VOC flux while restricting oil permeation.The objective of such an endeavor would be to raise the operating window of the cross flow moduleso that higher pressures (i.e., faster liquid sweep rates) could be utilized to enhance module VOC-stripping performance as well as to fix the hollow fibers in place for air flow distribution without
49
later shifting due to swelling, as observed in the current units.
In summary, the general design and method used to fabricate the cross-flow membrane modules wasfound to be suitable for producing the low-pressure-drop units. More adequate allocation ofresources in terms of time and research expenditures directed at optimizing the hollow-fibersubstrate/coating composite formulation may result in superior membrane performance, which, inturn, would provide a more-economic and commercially viable operating window for the MBTprocess.

Appendix A
Literature Search and Review

A-1
The success of the VOC treatment technology we are developing is dictated by the performance of the separation and biotreatment modules. Certain design and operational criteria are recognized as essential to the efficient and economical operation of each contactor. For the air/VOC separation module, these criteria include the following: • High surface-area-to-volume ratio • Membrane composition and configuration to maximize VOC transfer • Membrane configuration to minimize leakage of transfer fluid into air stream • Module design to minimize airside pressure drop • Possibility for commercial availability of module For the bioreactor module these criteria include the following: • High surface-area-to-volume ratio • Membrane configuration to minimize leakage of transfer fluid into aqueous stream • Design and operation to minimize biofouling of the aqueous side • Maximize degradative activity of biofilm • Capability to rapidly degrade a wide variety of VOCs In consideration of these issues, the following extensive literature search was undertaken to guide the subsequent development of the process. AIR/VOC SEPARATION MODULE Module Type Although membrane-based gas separation was first commercialized in 1977 for the enrichment of oxygen from air, the predominant applications currently are for the production of high-purity (99.95%) and medium-purity (95–99.5%) nitrogen (Prasad, 1994), CO2 removal from natural gas (McKee, 1991), and hydrogen purification for recycle (Shaver, 1991). All of these processes employ asymmetric or composite polymer membranes (Stern, 1994). These applications have come on the heels of 20 years of intensive research that saw the development of asymmetric membranes that exhibited high fluxes (Loeb, 1963), a method for the synthesis of robust hollow fibers (Vos, 1969), and a method for the casting of ultrathin, high- permeability, nonporous polymer films onto existing membranes (Ward, 1976) [subsequently improved upon and commercialized by Monsanto (Henis, 1981; Henis, 1980)]. Commercial membrane-based nitrogen production processes, for example, predominantly utilize hollow-fiber membrane configurations instead of plate-and-frame or spiral-wound. The rationale for this choice is clear when considering the relative membrane module areas. Koros and Fleming report that membrane module areas for the three configurations are: 100–150 ft2/ft3 for plate-and-frame modules, 200–250 ft2/ft3 for spiral-wound, and 2000– 4000 ft2/ft3 for hollow-fiber modules (Koros, 1993). The advantageous surface-to-volume ratio attained by hollow-fiber systems was a major factor in our selection of this configuration for our modules. Membrane Composition Membrane transport To select among the plethora of materials available for membrane construction, it is important to first understand the molecular basis of flux through porous and nonporous polymeric materials. Because essentially all commercial gas-separation membrane systems utilize nonporous membranes, the

A-2
description of transport through strictly porous materials will be abbreviated. Flux is the rate of transport of a chemical species (also referred to as the penetrant) through a given membrane or pore-filling material. Flux is determined by the chemical potential gradient of the transported species across the membrane, the membrane thickness, and in the case of nonporous membranes, the solubility of the species in the membrane material. The mechanism of species flux through nonporous material has been generally described as solution–diffusion (Koros, 1989; Koros, 1991) and depends upon the solubility (or condensability) and the diffusivity of the species in the polymer. The chemical potential gradient is represented by the partial pressures of the species on either side of the membrane for gas–gas separations or, in the case of a gas–liquid separation, the "effective" partial pressure of the species on the liquid side of the membrane. An intrinsic property of polymeric material relative to species transport is the permeability (PA), which is "a parameter equal to the pressure-and-thickness-normalized flux" (Koros, 1993), as shown in Eq. 1:
PA = (flux of A per unit area)/(∆pA/dm) (1)
where ∆pA is the partial pressure gradient of species A across the membrane and dm is the membrane thickness. Permeability is a direct measure of the ease of transport of the species through the membrane, and it can be written as the product of the solubility coefficient, SA (a thermodynamic parameter) and the diffusion coefficient DA (a kinetic parameter);
PA = (SA) (DA) (2)
These coefficients can themselves be complex functions of many variables, including identity and concentrations of current and past sorbed species as well as temperature (Koros, 1989; Koros, 1991). What is of importance to those seeking to separate two gas-phase species (A, B) is the separation factor, or selectivity, (αAB), which is defined in terms of the mole fractions of the two species ( y A, y B) upstream (subscript 1) and downstream (subscript 2) of the membrane.
11
22
BA
BAAB yy
yy=α (3)
The separation factor can also be written in terms of the permeabilities of the two penetrants and the relative partial pressure driving forces (Ashworth, 1992; Koros, 1993; Stern, 1994):
1
1
1
1
BB
AA
B
A
B
A
BB
AA
B
AAB pp
pp
S
S
D
D
pp
pp
P
P
∆
∆××=
∆
∆×=α (4)
Written in this manner, the separation factor can be seen to have contributions derived from penetrant solubility (SA/SB) and penetrant mobility (DA/DB). Selective solubility is the controlling factor in processes involving the separation of vapors from gases, such as VOC removal from air (Baker, 1987; Watson, 1990; Lund, 1996; Deng, 1998). The motion of polymer segments in the membrane controls mobility selectivity. As these segments move, free volume becomes available to the penetrant and it "hops" from one intersegmental free volume to another (Kumins, 1968; Frisch, 1983; Zielinski, 1992). The frequency of these movements is affected by membrane temperature (Kulkarni, 1983), by the size of the side chains along the polymer backbone, and by whether the polymer is glassy or rubbery (above or

A-3
below the glass transition temperature for that polymer). This theory has been used successfully to describe the permeability of organic vapors in several rubbery polymers (Fujita, 1968; Suwandi, 1973), most particularly silicone rubber (Sok, 1992) or poly(dimethylsiloxane) (PDMS).
Membrane experimental configurations Use of membranes to separate VOCs from a contaminated stream has taken two primary forms: pervaporation and vapor-phase extraction. In pervaporation, a contaminated aqueous phase contacts the shell side of a microporous hollow fiber, which has been coated with a nonporous thin film, most often PDMS. A vacuum is drawn, or a carrier gas flows on the tube side of the membrane, and the VOCs permeate through and evaporate from the membrane. Vapor-phase extraction, on the other hand, generally involves a contaminated gas stream with a vacuum or extraction fluid on the other side of the membrane. The driving force in these cases is the same as described above, the chemical potential gradient caused by low downstream penetrant concentration. Porous membranes When a gas–vapor mixture is made to flow through a porous solid medium, the condensable species (vapors) have much higher transport rates than the noncondensable species (gases). This phenomenon is the result of several transport mechanisms, including adsorbed flow (Carman, 1952) and capillary condensation (Rhim, 1975, Lee, 1986; Qiu, 1991). For the condensable gas, capillary condensation can occur on the insides of the pores at a pressure much less than the ordinary condensation pressure (or at a concentration much less than normal). Once condensed, the transport of the condensate through small pores can be regarded as viscous flow, and this flow blocks the transport of the noncondensable gas through the pores. A mathematical treatment of these phenomena was presented by Qiu and Hwang (1991) and compared to experimental results using a porous glass membrane. Nonporous membrane materials A significant number of investigations have focused on the effect of polymer modifications on transport properties for both glassy and rubbery polymers. Two generalizations can be made regarding the results obtained: 1. Permeability and selectivity exhibit an inverse relationship. 2. Rubbery polymers exhibit high permeability and low selectivity; glassy polymers exhibit high
selectivity.
Several exceptions to these "rules" do exist, and it is instructive to investigate more closely the literature regarding glassy and rubbery polymers separately. Glassy Polymers Generally, these polymers exhibit higher selectivity and lower permeability than rubbery polymers. However, PTMSP (poly [(1-trimethylsilyl)-1-propyne]), a polyacetylene which has a repeating structure of [–(CH3)C=C(Si[CH3]3)–]x , is a glassy polymer that has been found to have roughly ten-fold higher permeability than PDMS with only somewhat lower selectivity (Masuda, 1983; Takada, 1985; Masuda, 1988; Ichiraku, 1987). Prior to these results, PDMS was found to have the highest permeability of any nonporous polymer. The high permeability of PTMSP is attributed to the bulky side groups (-Si[CH3]3) which generate a large free-volume fraction (estimated to be 0.20–0.27) (Platé, 1991) for penetrant diffusion. Unfortunately, since glassy polymers are non-equilibrium materials, their excess free volume
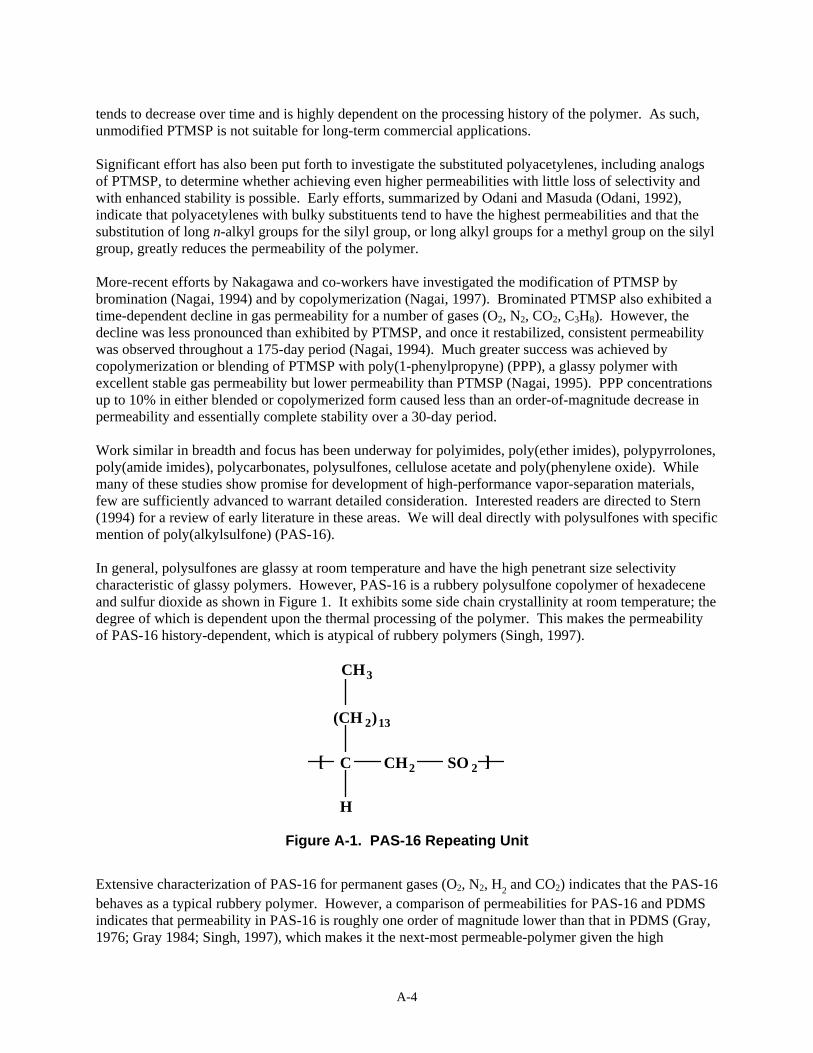
A-4
tends to decrease over time and is highly dependent on the processing history of the polymer. As such, unmodified PTMSP is not suitable for long-term commercial applications.
Significant effort has also been put forth to investigate the substituted polyacetylenes, including analogs of PTMSP, to determine whether achieving even higher permeabilities with little loss of selectivity and with enhanced stability is possible. Early efforts, summarized by Odani and Masuda (Odani, 1992), indicate that polyacetylenes with bulky substituents tend to have the highest permeabilities and that the substitution of long n-alkyl groups for the silyl group, or long alkyl groups for a methyl group on the silyl group, greatly reduces the permeability of the polymer. More-recent efforts by Nakagawa and co-workers have investigated the modification of PTMSP by bromination (Nagai, 1994) and by copolymerization (Nagai, 1997). Brominated PTMSP also exhibited a time-dependent decline in gas permeability for a number of gases (O2, N2, CO2, C3H8). However, the decline was less pronounced than exhibited by PTMSP, and once it restabilized, consistent permeability was observed throughout a 175-day period (Nagai, 1994). Much greater success was achieved by copolymerization or blending of PTMSP with poly(1-phenylpropyne) (PPP), a glassy polymer with excellent stable gas permeability but lower permeability than PTMSP (Nagai, 1995). PPP concentrations up to 10% in either blended or copolymerized form caused less than an order-of-magnitude decrease in permeability and essentially complete stability over a 30-day period. Work similar in breadth and focus has been underway for polyimides, poly(ether imides), polypyrrolones, poly(amide imides), polycarbonates, polysulfones, cellulose acetate and poly(phenylene oxide). While many of these studies show promise for development of high-performance vapor-separation materials, few are sufficiently advanced to warrant detailed consideration. Interested readers are directed to Stern (1994) for a review of early literature in these areas. We will deal directly with polysulfones with specific mention of poly(alkylsulfone) (PAS-16). In general, polysulfones are glassy at room temperature and have the high penetrant size selectivity characteristic of glassy polymers. However, PAS-16 is a rubbery polysulfone copolymer of hexadecene and sulfur dioxide as shown in Figure 1. It exhibits some side chain crystallinity at room temperature; the degree of which is dependent upon the thermal processing of the polymer. This makes the permeability of PAS-16 history-dependent, which is atypical of rubbery polymers (Singh, 1997).
[
CH3
H
SO 2CH2C
(CH 2)13
]
Figure A-1. PAS-16 Repeating Unit
Extensive characterization of PAS-16 for permanent gases (O2, N2, H2 and CO2) indicates that the PAS-16 behaves as a typical rubbery polymer. However, a comparison of permeabilities for PAS-16 and PDMS indicates that permeability in PAS-16 is roughly one order of magnitude lower than that in PDMS (Gray, 1976; Gray 1984; Singh, 1997), which makes it the next-most permeable-polymer given the high
A-5
permeability of PDMS. The permeability of PAS-16 to organic vapors is likewise high, though some crystallinity is manifested in these experiments, with permeability decreasing dramatically upon first exposure to toluene (induces local crystallization) and then remaining constant for a given penetrant (toluene, n-hexane, acetone and methanol) at different partial pressures (Singh, 1997). The relative permeability of the top two penetrants (toluene and n-hexane) is temperature dependent, with n-hexane permeability highest under 40 °C and toluene permeability highest at higher temperatures (Singh, 1997). This polymer behaves as do the rubbery and ultrahigh-free-volume glassy polymers (PTMSP, for example) regarding permeability dependence on penetrant solubility (Freeman, 1997), and as such, it deserves further investigation to establish its suitability for commercial application.
Rubbery Polymers PDMS (-(CH3)2SiO-)x has incredibly high permeability to a wide variety of gases; more than an order of magnitude greater than the nearest polymer (with the exception of PTMSP, as previously described). The high permeability of this polymer is generally accompanied by low overall selectivity for low-molecular- weight gases. The high permeability of PDMS is attributed to the flexibility of the siloxane (-SiO-) linkages of this polymer. Research with this polymer has focused on modifications that exhibit higher selectivity without sacrificing permeability. Results analogous to those obtained for PTMSP were obtained:
1. Bulkier functional groups on the side chain (replacing a methyl group) decreased permeability by
increasing chain stiffness (Stern, 1987; Lee, 1988). These substituents act by reducing the diffusivity of the penetrant in the polymer, not by reducing solubility.
2. An inverse relationship holds between permeability and selectivity. 3. Substituents that induce formation of crystalline domains greatly reduce permeability (Stern, 1987). 4. Specific interactions between the penetrant and the polymer that increase solubility dramatically
increase the permeability of the polymer to that penetrant (Ashworth, 1991). The overall selectivity of highly permeable silicone polymers is a function of the solubility selectivity (SA/SB), not the mobility selectivity (DA/DB) (Stern, 1987). Given this fact, and in light of item (4) above, a potentially effective method for increasing selectivity in silicone polymers, without impairing permeability, is to substitute functional groups that interact specifically with selected penetrants. Membrane Configuration Composites versus single-polymer (simple) membranes The transport mechanisms of gases through composite membranes involve two major diffusional pathways, as shown in Figure A-2 (adapted from Kimmerle, 1991). Path 1 runs through the nonporous top layer (thin film) polymer, which generally exhibits some selectivity, then into the pore space of the basement membrane. Path 2 runs through the thin film and then through the basement membrane polymer (substructure) itself before reaching a pore space. The basement membrane material is usually selected to provide structural support for the thin film and is of high porosity to minimize the contribution of basement membrane resistance to the overall resistance to transport of the penetrant. The key parameters determining the flux through composite membranes under a given driving force can be developed in the following manner.

A-6
Path 1 Path 2 coating
substructure
Figure A-2. Two Pathways for Transport Through a Composite Membrane
The volume flux of penetrant, J, can be related to membrane structure by substitution of the appropriate terms into the general relationship that flux is equal to the product of the driving force and area, divided by the resistance to transport. For path 1, this equation is (Pinnau, 1988):
( )
⎟⎟⎟
⎠
⎞
⎜⎜⎜
⎝
⎛+
×∆=
Pi
P
Li
L
PiPL
i
Pd
Pd
ApJ , (5)
where Pix is the permeability of penetrant i in membrane component x, where x = L denotes the top layer,
x = P denotes the pore and, in equation (6), x = S denotes the membrane substructure material. AP denotes the surface area of the pores and dx denotes the thickness of the particular membrane component x (=L, P). For path 2, transport can be expressed in the following way (Henis, 1981):
( )
⎟⎟⎠
⎞⎜⎜⎝
⎛+
×∆=
S
S
L
L
S
SL
iPd
iPd
Aip
iJ ,
(6)
where AS denotes the surface area of the substructure, which is equal to the total membrane surface area, AM, minus the pore area, AP. The porosity of the membrane ε can be expressed as
M
P
AA=ε (7)
The total flux of penetrant i through the membrane is given by
JiM = Ji
L ,S + JiL,P (8)
An expression for the total volume flux (per unit area), Ji,A, can be expressed by combining equations (5-8) to give:
Ji, AM = ε
dL
PiL +
dP
PiP
⎛
⎝ ⎜ ⎜
⎞
⎠ ⎟ ⎟
−1
+ 1− ε( ) d L
PiL +
dS
PiS
⎛
⎝ ⎜ ⎜
⎞
⎠ ⎟ ⎟
−1⎧
⎨ ⎪
⎩ ⎪
⎫
⎬ ⎪
⎭ ⎪ ∆pi
(9)

A-7
There are three scenarios to be considered using this equation relative to what controls the performance of the composite membrane: (1) top-layer controlled, (2) support-structure controlled, and (3) mixed-flux control. Kimmerle concludes the following regarding membrane configuration:
If the transport properties of a membrane are determined by the selective top layer it can be optimized in terms of its flux and selectivity by preparing a support structure which has the highest possible porosity and permeability in the pore structure. The permeability of the selectivity top layer should furthermore be as high and its thickness as low as possible. (Kimmerle, 1991)
This conclusion is endorsed by a large number of practitioners in the field (Koros, 1993; Parthasarathy, 1994; Stern, 1994; Prasad, 1994; Nagai, 1997; Zhu, 1983; Blume, 1990; Bessarabov, 1996; Das, 1998; Poddar, 1996b; Cha, 1996) who have evaluated single polymer and composite membranes for gas separation and VOC removal from liquid and air streams. In a recent review of commercial air separation processes, Prasad and co-authors list the development of ultrathin barrier layers as one of the key technical innovations in the commercial development of membranes in air separation. "The discovery by Loeb and Sourirajan (Loeb, 1963) of integrally skinned, high-flux asymmetric membranes was essential in transforming membranes to a technology of significant commercial interest" (Prasad, 1994). Ashworth provides an excellent illustration of the direct benefit of composite membranes using the separation of H2 from CO as the goal and polysulfone and silicone rubber as the membrane materials under consideration (Ashworth, 1992). The following data are taken from his paper.
Table A-1. Effect of Membrane Composition on Permeability and Selectivity
Polymer Permeability
(cm3(STP)-cm/cm
2-sec-cmHg)
H2 CO
αH2/CO
Silicone rubber (SR) 5.2 x 10⁻⁸ 2.5 x 10⁻⁸ 2.1
Polysulfone (PS) 1.2 x 10⁻⁹ 3.0 x 10
-11 40
SR/PS (99:1)a 3.65 x 10
-8 2.68 x 10
-9 13.6
SR/PS (91:9)a 1.08 x 10
-8 3.29 x 10
-10 32.8
a The ratio denotes the relative thicknesses of the two polymers in a bilayer composite. Obviously, the productivity of the composite membrane is nearly an order of magnitude higher than that achieved by the pure polysulfone membrane (approximately 80% selectivity, ninefold increase in H2 permeability). Experiments involving the separation of dichloroethane, chlorobenzene and chloroform from water across polyvinyl acetate, PTFE, or polysulfone membranes (simple or composite) also support such a conclusion. In all cases, the separation factor was at least an order of magnitude higher for the

A-8
composite membranes than the equivalent simple membrane (Zhu, 1983). In addition, the composite membranes exhibited greater structural stability (Zhu, 1983). Blume (1990) compared the permeability and separation factor for trichloroethane, ethyl acetate, acetone and ethanol in a pervaporation through PDMS and PDMS/polyolefin composite membranes. As expected, the PDMS membrane exhibited permeabilities that were an order of magnitude greater than those achieved by the PDMS/polyolefin composite, but the separation factors of the composite were an order of magnitude greater than that of the PDMS membrane so that the flux of a penetrant through the membranes was equivalent, and the concentration of penetrant in the downstream gas was much higher for the composite membrane (Blume, 1990). Film composition Baker and co-workers at Membrane Technology & Research Inc. (1987) investigated eight membrane materials for their permeabilities to acetone, toluene, octane, trichloroethane and nitrogen. Each membrane was a flat sheet, cast to a thickness of 25–50 µm, and evaluated at 40 °C. Figure A-3 is taken from Baker (1987) and presents the relationship between toluene permeability and selectivity when toluene was removed from a nitrogen gas stream by pervaporation. Note that the permeability of PDMS (silicone rubber) is nearly matched by that of chloroprene (Neoprene™), which exhibits a higher selectivity than PDMS. Figure A-4, which presents equivalent data for acetone, indicates that silicone rubber is not uniformly the best rubberized membrane for organic compound permeability (Baker, 1987).
Figure A-3. Toluene Permeability vs. Selectivity For Toluene Over Nitrogen

A-9
Figure A-4. Acetone Permeability Vs. Selectivity For Acetone Over Nitrogen
Inner versus outer films The question of placement of the thin film in a composite membrane relative to the liquid and gas phases is an important one. If the film is on the same side of the membrane as the liquid, then the pores will be gas-filled, and vice versa. Gas-phase diffusivities are several orders of magnitude larger than liquid-phase diffusivities (Semmens, 1989). This is significant because the resistances-in-series model has been found to be applicable to composite membrane transport. If one considers the composite membrane and the affiliated resistance, shown in Figure A-5, one finds four potential resistances, through fluid boundary layers, Rf1 and Rf2, through the film, RF, and through the porous membrane, RPM. Total resistance to transport, RT, is equal to:
RT = R f1 + RF + RPM + R f 2 (10)
Fluid 1 FilmPorous
Membrane Fluid 2
R f1 R f2R PMR F
Figure A-5. Transport of Penetrant Through Different Resistances of a Composite
Membrane

A-10
Studies of the transport of organics through uncoated pervaporation membranes indicate that the liquid-side boundary-layer mass transfer resistance is a significant fraction of the total mass transfer resistance (Raghunath, 1992). In some cases where nonporous films coat the fiber, the film resistance dominates so that all other resistances can be neglected, as was the case reported for transport of methylene chloride across a PDMS/polyethylene composite and absorption into either silicone oil 200 fluid or Paratherm NF mineral oil (Poddar, 1996a). However, using the same experimental system, the film resistance represented only 64% of the total resistance to transport of acetone (Poddar, 1996a). In that case, the porous membrane and liquid boundary layer were found to contribute significantly to the overall resistance. The resistance could have been lowered had the pores been filled with gas (Das, 1998; Semmens, 1989) instead of oil, a point made clearly by Semmens et al. (1989). In a study of pervaporation of several organic compounds (CCl4, C2Cl4, C2HCl3, CHCl3, C2H3Cl3) in a vapor phase across microporous polypropylene fibers without a coating film, Semmens found that the gas-filled membrane pores offered negligible resistance to transfer (Semmens, 1989). Cha et al. (1997) also studied vapor-phase pervaporation (gas/vapor mixture on one side on the membrane, vacuum on the other) where the feed side was varied from the film side to the non-film side of a PDMS-coated polypropylene hollow fiber. Surprisingly, the fastest permeation rates were achieved with the gas/vapor mixture exposed to the non-skin side of the composite membrane (tube side in this case). This was attributed to condensation of the vapors within the pores and decreased pressure drop within the pores (Cha, 1997). Sirkar and co-workers (Das, 1998) studied trichloroethylene (TCE) removal from water utilizing hydrophobic, microporous, polypropylene, hollow fibers (Celgard™ X-10) with a plasma-polymerized silicone coating on the fiber outside (shell side) in pervaporation studies. The aqueous stream was fed through the fiber (tube side) instead of the traditional shell-side contacting. TCE removal was found to be significantly lower when the feed was on the shell side compared to tube-side feed. The most plausible explanation proffered involved bypassing of the fluid flow on the shell side given the tight packing of the fibers and the relatively low fluid velocity. Such shell-side bypassing has been observed with similar modules used for liquid–liquid extraction (Tompkins, 1993). VOC Transport Solubility Preferential solubility of different penetrants in the membrane determines the permeability and selectivity of the membrane. High penetrant–membrane affinity leads to high permeation rates. Several investigators have evaluated the effect of membrane composition on separation and permeation performance. It has generally been established that penetrants with solubility parameters close to that of the membrane material sorb to the polymer and permeate more rapidly than those penetrants with solubility parameters significantly different from the membrane (Zhu, 1983). Table A-2 contains solubility parameters (δ) for several common polymers and organic compounds. The solubility parameter, δ, is defined in Eq. (11):
δ =⎛⎝⎜
⎞⎠⎟
∆UV
V
L
.5
Where ∆UV is the energy of complete vaporization of the liquid, and VL is the liquid molar volume. Table A-3 indicates the separation factors (α) achieved for different penetrant/membrane pervaporation systems.
(11)

A-11
Table A-2. Solubility Parameters (Zhu, 1983)
Compound δ (cal/cm3).5 Compound δ (cal/cm3).5
Chloroform (CF) 9.3 PTFE 6.2 chlorobenzene (CB) 9.5 polyvinyl acetate
(PVAc) 9.3
1,2 dichloroethane (DCE)
9.8 polysulfone (PSF) 10.2
water 23.4 cellulose acetate (CA) 11.5
Table A-3. Separation Factors for Membrane/Penetrant Pervaporation Systems (Zhu, 1983)
Polymer
α CF CB DCE
PTFE 5–19 7–16 2– 6 PVAc 50–75 46–55 45– 60 PSF 3–10 1–8 5– 7 CA 1 N/A N/A
Watson and Payne (1990) evaluated the separation factor and permeability of silicone rubber membranes (0.2 mm thickness) for n-alcohols (C1–C10) and a variety of other organic compounds in dilute aqueous solutions using pervaporation. The separation factor (α) was shown to rise monotonically with alcohol chain length (Watson, 1990), as shown in Table A-4. Included in Table A-4 are diffusion coefficients, D, measured at 80+ 3 °C in a 0.8 mm thick silicone rubber membrane.
Table A-4. Separation Factor Dependence on Chain Length for n-Alcohols
n-Alcohol Feed concentration (%v)
α D (x10-10m2-sec-1)
Methanol 1.0 9 10.0 Ethanol 1.0 17 7.1 Propanol 1.0 67 6.2 Butanol 1.0 74 5.5 Hexanol 0.5 1050 4.2 Octanol 0.05 3100 3.9 Decanol 0.005 5000 2.5

A-12
For pervaporation, since the downstream pressure of the penetrant is essentially zero, Eq. (4) reduces to
B
A
B
A
AB S
S
D
D×=α . The increase in separation factor exhibited by the n-alcohols in the face of declining
diffusivities, shown in Table 4, indicates that the increase in separation factor measured through the
silicone rubber membrane is driven by the selectivity factor, B
A
S
S, not the diffusivity factor,
B
A
D
D. The
results of further investigations are presented in Table A-5. The solubility factor (A) in Table 5 is based on the Scatchard–Hildebrand activity–solubility equation (Hildebrand, 1970), which allows the development of a relationship for the partition coefficient, P, of component i, between an aqueous solution (w) and a membrane (m), as defined in Eq. (12):
⎪⎪⎪
⎭
⎪⎪⎪
⎬
⎫
⎪⎪⎪
⎩
⎪⎪⎪
⎨
⎧
⎟⎟⎟⎟⎟⎟
⎠
⎞
⎜⎜⎜⎜⎜⎜
⎝
⎛
×==
ART
V
w
i
m
i
i
econstC
CP (12)
A = δw − δ i( )2 − δm − δi( )2[ ] (13)
As the solubility factor A, defined in Eq. (13), increases, the partitioning of component i into the membrane also increases.
Table A-5. Separation and Solubility Factors for a PDMS Membrane Pervaporation System
Compound Feed concentration (%v)
α separation
factor
A (cal/cm3) solubility factor
Methanol 1.0 9 -2.3 Ethanol 1.0 17 5.0 Phenol 1.16
a 97 24
Acetone 1.0 170 35 Octanol 0.05 3100 64 Nitrobenzene 0.1 4200 62 Chloroform 0.01 15,000 50 Benzene 0.1 20,000 69 Toluene 0.01 36,000 81 Ethylbenzene 0.01 43,000 97
aPercent mass The data presented in Tables A-4 and A-5 indicate that, for poly(dimethylsiloxane) (PDMS), solubility selectivity is the controlling factor in determining permeability, a conclusion which is in agreement with other findings (Bell, 1988).

A-13
Operating Conditions Leemann (Leemann, 1996) investigated the temperature and concentration dependence of the permeability of pure PDMS hollow fibers (OD approximately 1.0 mm, ID approximately 0.85 mm, length = 250 mm) operated as pervaporation membranes. The permeabilities for toluene, p-xylene, ethyl acetate, MEK, acetone and ethanol vapors decrease with increasing temperature, exhibiting Arrhenius dependence on temperature (Leemann, 1996). This is due to the strongly exothermic nature of absorption of organic vapors into PDMS (Leemann, 1996). Similar temperature dependence was noted for pervaporation of carbon dioxide and methane through polypropylene and PDMS membranes coated with fluoropolymer films (Oh, 1996), acetone and ethanol permeation through microporous glass (Qiu, 1991), and acetone pervaporation through silicone rubber (Deng, 1998) Penetrant concentration, as indicated by the partial pressure of the penetrant in the vapor phase, has a greater effect upon permeability through PDMS at lower temperatures (below 50 °C). At low feed-gas temperatures, permeability increases with penetrant partial pressure, presumably due to increasing diffusivity due to polymer swelling (Leemann, 1996). This was noted specifically for PDMS– polypropylene composite membranes with permeation of toluene, methanol, acetone and methylene chloride (Cha, 1997). However, studies of gas–liquid pervaporation systems indicate that as organic concentration increases in the aqueous feed phase, the separation factor falls dramatically for silicone rubber membranes (Seok, 1987; Ishihara, 1986; Leeper, 1987). The separation factor has also been found to decrease with increasing aqueous phase concentration of the solute until a limiting value is reached for a wide variety of organic compounds ( Zhu, 1983; Watson, 1990, Seok, 1987). The picture is rendered more complex when multiple organic vapors are considered. As different penetrants exhibit different permeation rates, the more slowly permeating compound will build up on the upstream membrane surface (Feng, 1992; Haraya, 1987; Psaume, 1988) diluting the faster penetrant at the membrane surface and resulting in lower permeation rates for the faster penetrant. A parametric study was undertaken to investigate the significance of this phenomenon, termed concentration polarization (Feng, 1992). It was determined that (1) concentration polarization is significant for highly permeable and selective membranes, (2) separation is effective for low vapor content, and (3) for highly selective membranes, variable permselectivity has little effect on permeant concentration but greatly influences permeant flux (Feng, 1992). However, Ji et al. (1994) found no decrease in membrane permeability for multiple VOCs in the liquid phase (toluene, trichloroethane, methylene chloride) through PDMS; instead, they found that for dilute liquid mixtures, downstream VOC dilution occurred, increasing permeability of all VOCs by increasing the driving force (Ji, 1994b). Similar results are reported for polyurethane and polyether–block–polyamides (Ji, 1994a). Pressure also plays a role in permeability though the picture is not quite clear. Nagai (Nagai, 1994) investigated the permeation properties of brominated PTMSP (Br-PTMSP) and untreated PTMSP above and below the glass-transition temperature. In both regions, for both polymers, permeability decreased with increasing upstream pressure for propane and carbon dioxide. Conversely, Strathmann reports increased permeability through PDMS as upstream pressure increases for octane, toluene, trichloromethane and acetone, up to 10–15 cmHg (Strathmann, 1986). Membrane-Mediated Absorption Kamalesh Sirkar's research group has investigated membrane-mediated absorption for VOC removal from gas streams (Poddar, 1996b; Poddar, 1996a, Poddar, 1997). Hollow fibers constructed of microporous,

A-14
hydrophobic Celgard™ X-10 polypropylene were used throughout. On the fibers of some of these modules, an ultrathin (approximately 1µm), plasma-polymerized, nonporous, PDMS coating was placed on the shell side of the fibers (Advanced Membrane Technologies, Inc, Minnetonka, Minn.). A VOC–N2 gas mixture was pumped through the tube side of the fibers, and an extracting liquid was pumped countercurrently in the shell space. Three absorbents were used; silicone oils 50-cs, 200 (Dow Corning, Midland, Mich.) and a mineral-oil-based fluid, Paratherm NF (Paratherm Corp., Conshohocken, Pa.). The VOC–N2 mixtures were supplied as standard cylinders (Matheson, E. Rutherford, N.J.) containing relatively high VOC concentrations (993 ppmv acetone, 999 ppmv dichloromethane, 514 ppmv methanol, 236 ppmv toluene). At gas residence times between 1 and 1.5 seconds in uncoated fibers, dichloromethane and toluene exit gas concentrations were lowered to 1–2 ppmv using fresh silicone oil flowing at approximately 5% of the gas flow rate (Poddar, 1996a). Similar performance was achieved using Paratherm NF with toluene, but the silicone oil performance was significantly superior for gas residence times between 0.2 and 0.5 seconds. Using coated fibers, residence times between 5 and 7 seconds are required to reduce dichloromethane to similar concentrations in the exit gas with fresh silicone oil. However, the difference between Paratherm™ NF and silicone oil is negligible to gas residence times down to a single second. A mixed VOC–N2 stream was evaluated, with the results summarized in Table A-6. What is obvious is that longer residence times are required for high removal percentage as VOC concentration decreases.
Table A-6 Absorption Data for VOC–N2 Gas Mixture
VOC feed concentration ppmv
Removal % at given gas contact times
17 seconds 5 seconds Acetone 226 93.8 61.5 Methylene chloride
201 95.5 91.0
Toluene 204 100.0 100.0 Methanol 163 52.7 21.5 Total 794 87.4 70.6
This absorption system was also operated in an absorbent recycle mode with an uncoated hollow-fiber module used to remove VOC from the gas stream (Poddar, 1996b). After extracting VOC from the air, the absorbent flows through the coated, hollow-fiber module membrane operated as a pervaporator. The absorbent then flows into a storage vessel before recirculation through the extracting module. The VOC–N2 mixtures were supplied in standard cylinders (Matheson, E. Rutherford, N.J.) containing relatively high VOC concentrations (993 ppmv acetone, 999 ppmv dichloromethane, 514 ppmv methanol, 236 ppmv toluene). At gas residence times of 1–1.5 seconds in silicone oil flowing at approximately 5% of the gas flow rate through the extraction module, the dichloromethane exit gas concentration was approximately 50 ppmv and the toluene exit gas concentration was about 25 ppmv (Poddar, 1996b). Comparison of these numbers to the 1–2 ppmv achieved with fresh absorbant indicates that residence times greatly in excess of 1 minute will be required for removal percentages near 90%. For a given VOC and process condition, silicone oil provided higher removal efficiency than Paratherm™. However, silicone oil exhibits deterioration over an 18 month period causing leakage of the

A-15
oil into the gas stream. For that reason, Paratherm™ is the preferred oil for these applications (Poddar, 1996a). BIOTREATMENT MODULE Biofouling, in the form of a biofilm colonizing a solid surface, has been a significant problem for many important industrial and medical systems, including water supplies, heat-transfer units, ship hulls, and implanted medical prostheses. To suppress the formation or growth of biofilms in these instances, application of biocides has been the dominant mode of operation. The following review will instead focus on efforts involving reduction of biofouling in biotreatment systems, where the emphasis is on maintenance of an active film, and avoidance of excess biofilm thickness. Membrane Biofouling Biological systems for the treatment of contaminated water or gas streams generally involve columns packed with solids operated either as a static or a fluidized bed. The biomass in these systems is generally in the form of a biofilm attached to a solid surface. Excess biomass concentration in the bed retards mass transfer (oxygen, inorganic ions, carbon and energy sources), blocks liquid and gas flow, and generally leads to a loss in reactor productivity. To maintain the reactor activity, two general approaches to prevention of biomass clogging have been evaluated; cleaning and metabolic strategies to suppress biomass growth rate. Cleaning Cleaning strategies involve the application of high shear forces or a cleaning treatment to remove a substantial fraction of the biofilm material. These approaches act by disrupting some aspect of the biofilm structure. Characklis (Characklis, 1981) was among the first to characterize the shear stresses (normal and parallel to the surface) that contributed to erosion of biofilms. Rittmann (Rittmann, 1980) developed a series of equations describing the friction factor and resulting shear stresses generated by liquid flow through a packed bed. These equations were modified, using data generated by Characklis, to calculate biofilm loss rates as a function of biofilm thickness, biofilm density, and the shear stress (Rittmann, 1982). Stress is applied to solid packing to remove unwanted biomass in several different ways. Wubker (Wubker, 1997) used a screw stirrer to periodically mix the polyamide-bead packing within a trickle-bed reactor and found that the amount of biomass removed was directly related to the magnitude of the applied shear stress (stirrer rotation rate) and the total stress applied (stirring time). Daily stirring was sufficient to maintain maximal toluene degradation in this reactor. Taylor et al. (Taylor, 1996) determined that weekly removal, washing, and reinoculation of packing material maximized the productivity of an ethanol fermentation process. Smith et al. (Smith, 1996) determined that the efficient operation of a highly VOC-loaded biofilter could be extended indefinitely if a backwash system that expanded the bed by roughly 40% was used twice weekly. The expansion of the bed led to vigorous mixing of the beads, shearing film from the bead surface. Backwashing, however, is necessarily limited to those biofilters containing packing that can be fluidized. Weber and Hartmans (Weber, 1996) reported chemical washing of a biotrickling filter. Every two weeks a 0.1M NaOH solution was flushed through the system for 3 hours. Curiously, the toluene removal rate of the bed after the washing was 50% higher than a similar bed that was unwashed. Loss of activity was observed immediately following washing, but recovered to pre-wash levels within 24 hours (Weber, 1996). This approach has significant advantages relative to fluidization, because of its applicability to

A-16
beds that are difficult to fluidize and that utilize fluid flow rates much lower than required for fluidization (Cox, 1998). Biofilm structure can also be disrupted ionically. The extracellular polysaccharide that forms the bulk of the biofilm is crosslinked by divalent cations (primarily Ca2+, to a lesser extent Mg2+). Release of biofilm-bound calcium could lead to biofilm dissolution or detachment from the surface. Gross biofilm detachment was observed by Turakhia (Turakhia, 1983) following exposure of a biofilm to a pulse of a calcium chelating agent, (ethylene glycol)bis(2-aminoethyl ether) (EGTA). Metabolic strategies All metabolic strategies are predicated on discovering a nutrient limitation that has a minimal negative effect on biodegradative activity but causes a significant growth rate decrease by increasing the maintenance energy requirement. For example, Schonduve (Schonduve, 1996) determined that while using nitrate as a nitrogen source rather than ammonium caused a noticeable decrease in mixed culture biomass formation rate, the degradation rate was more severely depressed. Smith (Smith, 1996) did find that for a toluene-degrading mixed culture, the use of nitrate in place of ammonium led to a 50% decrease in biomass yield without affecting degradation rates at all. Addition of 0.4M NaCl led to a 32% greater decrease in biomass formation rate than degradation rate (Schonduve, 1996). Similar results were reported for 30g/L NaCl (Strachan, 1996). Potassium and phosphate limitation were each shown to increase the specific butanol degradation rate of a mixed culture while decreasing the biomass yield by as much as a factor of five (Wubker, 1996), and potassium was shown to increase the specific toluene degradation rate while decreasing the biomass yield (Wubker, 1997).

A-17
References Ashworth, A. J., B.J. Brisdon, R. England, B.S.R. Reddy and I. Zafar (1991). “The permeability
of polyorganosiloxanes containing ester functionalities.” J. Membrane Sci. 56: 217. Ashworth, A. J. (1992). “Relation between gas permselectivity and permeability in a bilayer
composite membrane.” J. Membrane Sci. 71: 169–173. Baker, R. W., N. Yoshioka, J.M. Mohr and A.J. Kahn (1987). “Separation of organic vapors
from air.” J. Membrane Sci. 31: 259. Bell, C. M., F.J. Gerner, and H. Strathmann (1988). “Selection of polymers for pervaporation
membranes.” J. Membrane Sci. 36: 315. Bessarabov, D. G., E.P. Jacobs, R.D. Sanderson and I.N. Beckman (1996). “Use of nonporous
polymeric flat-sheet gas-separation membranes in a membrane–liquid contactor: experimental studies.” J. Membrane Sci. 113: 275–284.
Blume, I., J.G. Wijmans, and R.W. Baker (1990). “The separation of dissolved organics from
water by pervaporation.” J. Membrane Sci. 49: 253-286. Carman, P. C. (1952). “Diffusion and flow of gases and vapors through micropores.” Proc. Roy.
Soc. Ser. 211A: 526. Cha, J. S., R. Li and K.K. Sirkar (1996). “Removal of water vapor and VOCs from nitrogen in a
hydrophilic hollow-fiber gel membrane permeator.” J. Membrane Sci. 119: 139. Cha, J. S., V. Malik, D. Bhaumik, R. Li and K.K. Sirkar (1997). “Removal of VOCs from waste
gas streams by permeation in a hollow fiber permeator.” J. Membrane Sci. 128: 195. Characklis, W. G. (1981). "Fouling biofilm development - A process analysis." Biotechnol.
Bioeng. 23: 1923. Cox, H. H. J., and M.A. Deshusses (1998). “Biological waste air treatment in biotrickling
filters.” Current Opinion in Biotechnology 9: 256. Das, A., I. Abou–Nemeh, S. Chandra and K.K. Sirkar (1998). “Membrane-moderated stripping
process for removing VOCs from water in a composite hollow fiber module.” J. Membrane Sci. 148: 257.
Deng, S., A. Tremblay and T. Matsuura (1998). “Preparation of hollow fibers for the removal of
volatile organic compounds from air.” J. Appl. Polym. Sci. 69: 371–379. Feng, X., and R.Y.M. Huang (1992). “Organic vapor/gas mixture separation by membrane—a
parametric study.” Separation Sci. Tech. 27(15): 2109.

A-18
Freeman, B. D., and I. Pinnau (1997). “Separation of gases using solubility-selective polymers.”
Trends in Polymer Sci. 5: 167. Frisch, H. L., and S.A. Stern (1983). “Diffusion of small molecules in polymers.” CRC Crit. Rev.
Solid State Material Sci. 11: 123. Fujita, H. (1968). Organic vapors above the glass transition temperature. Diffusion in Polymers.
New York, Academic Press. 75. Gray, D. N. (1976). “Olefin/sulfur dioxide copolymers.” Polymer News 3: 141. Gray, D. N. (1984). Polymeric membranes for artificial lungs. Polymeric materials and artificial
organs. American Chemical Society. 151. Haraya, H., T, Hakuta, H. Yoshitome, and S. Kimura (1987). Sep. Sci. Technol. 22: 1425. Henis, J. M. S., and M.K. Tripodi (1980). “Multicomponent membranes for gas separation.” US
Patent 4,230,463: Henis, J. M. S., and M.K. Tripodi (1981). “Composite hollow fiber membranes for gas
separation: The resistance model approach.” J. Membrane Sci. 8: 233. Hildebrand, J. H., J.M. Prausnitz, and R.L. Scott (1970). Regular and Related Solutions. New
York, Van Nostrand Reinhold Co. Ichiraku, Y., S.A. Stern and T. Nakagawa (1987). “An investigation of the high gas permeability
of poly(1-trimethylsilyl-1-propyne).” J. Membrane Sci. 34: 5. Ishihara, K., Y. Nagesse, and K. Matsui (1986). “Pervaporation of alcohol water mixtures
through PTMSP.” Makromol. Chem. Rapid Commun. 7: 43. Ji, W., S.K. Sikdar, and S.–T. Hwang (1994a). “Modeling of multicomponent pervaporation for
removal of volatile organic compounds from water.” J. Membrane Sci. 93: 1. Ji, W., A. Hilaly, S.K. Sikdar, and S.–T. Hwang (1994b). “Optimization of multicomponent
pervaporation for removal of volatile organic compounds from water.” J. Membrane Sci. 97: 109.
Kimmerle, K., T. Hofmann and H. Strathmann (1991). “Analysis of gas permeation through
composite membranes.” J. Membrane Sci. 61: 1–17. Koros, W. J., and M.W. Hellums (1989). Transport Properties. Encyclopedia of Polymer Science.
New York, Wiley–Interscience Publishers. 724.
A-19
Koros, W. J., M.R. Coleman and D.R.B. Walker (1991). “Controlled permeability polymer membranes.” Annual Review of Materials Science 22: 47–90.
Koros, W. J., and G.K. Fleming (1993). “Membrane-based gas separation.” J. Membrane Sci. 83:
1–80. Kulkarni, S. S., and S.A. Stern (1983). “The diffusion of CO2, CH4, C2H4, and C3H8 in
polyethylene at elevated temperatures.” J. Polym. Sci., Polym. Phys. Ed. 21: 441. Kumins, C. A. and T. K. Kwei (1968). Free volume and other theories. Diffusion in Polymers.
New York, Academic Press. 107–140. Lee, C.–L., H.L. Chapman, M.E. Cifuentes, K.M. Lee, L.D. Merril, K.L. Ulman and K.
Venkataraman (1988). “Effects of polymer structure on the gas permeability of silicone membranes.” J. Membrane Sci. 38: 55.
Lee, K.–H., and S.–T. Hwang (1986). “The transport of condensable vapors through a
microporous Vycor glass membrane.” J. Colloid Interface Sci. 110: 544. Leemann, M., G. Eigenberger, and H. Strathmann (1996). “Vapour permeation for the recovery
of organic solvents from waste air streams: separation capacities and process optimization.” J. Membrane Sci. 113: 313.
Leeper, S. A. (1987). Membrane separations in the production of alcohol fuels by fermentation.
Membrane separations in biotechnology. New York, N.Y., Marcel Dekker. 161. Loeb, S., and S. Sourirajan (1963). “Sea water demineralization by means of an osmotic
membrane.” ACS Symp. Ser. 38: 117. Lund, L. W., W.J. Federspiel and B.G. Hattler (1996). “Gas permeability of hollow fiber
membranes in a gas–iquid system.” J. Membrane Sci. 117: 207–219. Masuda, T., E. Isobe and T. Higashimura (1983). “Poly 1-(trimethylsilyl)-1-propyne: a new high
polymer synthesized with transition-metal catalysts and characterized by extremely high gas permeability.” J. Am. Chem. Soc. 105: 7473.
Masuda, T., Y. Iguchi, B.–Z. Tang and T. Higashimura (1988). “Diffusion and solutions of gases
in substituted polyacetylene membranes.” Polymer 29: 2041. McKee, R. L., M.K. Changela and G.J. Reading (1991). “Carbon dioxide removal: Membrane
plus amine.” Hydrocarbon Processing 70(4): 63–71. Nagai, K., A. Higuchi and T. Nakagawa (1994). “Gas permeation and sorption in brominated
poly(1-trimethylsilyl-1-propyne) membrane.” J. Appl. Polym. Sci. 54: 1353.

A-20
Nagai, K., A. Higuchi and T. Nakagawa (1995). "CAS Permeability and stability of poly(1-trimethylsilyl-1-propyne-co-1-phenyl-1-propyne) membranes." J. Polym. Sci., Part B: Polym. Phys. 33: 289.
Nagai, K., M. Mori, T. Watanabe and T. Nakagawa (1997). “Gas permeation proerties of blend
and copolymer membranes composed of 1-trimethylsilyl-1-propyne and 1-phenyl-1-propyne structures.” J. Polym. Sci. Part B:Polym. Phys. 35: 119.
Odani, H., and T. Masuda (1992). Design of polymer membranes for gas separation. Polymers
for Gas Separation. New York, VCH. 107. Oh, S.-J., and W.P. Zurawsky (1996). “Gas permeation through poly(dimethylsiloxane) -plasma
polymer composite membranes.” J. Membrane Sci. 120: 89. Parthasarathy, A., C.J. Brumlik, C.R. Martin, and G.E. Collins (1994). “Interfacial
polymerization of thin polymer films onto the surface of a microporous hollow-fiber membrane.” J. Membrane Sci. 94: 249–254.
Pinnau, I., H.J. Wijmans, I. Blume, T. Kuroda and K.V. Peinemann (1988). “Gas permeation
through composite membranes.” J. Membrane Sci. 37: 81. Platé, N. A., A.K. Bokarev, N.E. Kaliuzhnyi, E.G. Litvinova, V.S. Khotimski, V.V. Volkov and
Y.P. Yampol'skii (1991). “Gas and vapor permeation and sorption in poly(trimethylsilyl-propyne).” J. Membrane Sci. 60: 13.
Poddar, T. K., S. Majumdar, and K.K. Sirkar (1996a). “Membrane-based absorption of VOCs
from a gas stream.” AIChE Journal 42(11): 3267. Poddar, T. K., S. Majumdar and K.K. Sirkar (1996b). “Removal of VOCs from air by
membrane-based absorption and stripping.” J. Membrane Sci. 120: 221. Prasad, R., F. Notaro, and D.R. Thompson (1994). “Evolution of membranes in commercial air
separation.” J. Membrane Sci. 94: 225–248. Psaume, R., P. Aptel, Y. Aurelle, J.C. Mora, and J.L. Bersillon (1988). “Pervaporation:
importance of concentration polarization in the extraction of trace organics from water.” J. Membrane Sci. 36: 373.
Qiu, M. M., and S.–T. Hwang (1991). “Continuous vapor–gas separation with a porous
membrane permeation system.” J. Membrane Sci. 59: 53–72. Raghunath, B., and S.–T. Hwang (1992). “Effect of boundary layer mass transfer resistance in
the pervaporation of dilute organics.” J. Membrane Sci. 65: 147. Rhim, H., and S.–T. Hwang (1975). “Transport of capillary condensate.” J. Colloid Interface Sci.
52: 174.
A-21
Rittmann, B. E., and P.L. McCarty (1980). "Model of steady-state-biofilm kinetics." Biotechnol.
Bioeng. 22: 2343. Rittmann, B. E. (1982). “The effect of shear stress on biofilm loss rate.” Biotechnol. Bioeng. 24:
501. Schonduve, P., M. Sara, and A. Friedl (1996). “Influence of physiologically relevant parameters
on biomass formation in a trickle-bed bioreactor used for waste gas cleaning.” Appl. Microbiol. Biotechnol. 45: 286.
Semmens, M. J., R. Qin, and A. Zander (1989). “Using a microporous hollow-fiber membrane to
separate VOCs from water.” Journal AWWA : 162. Seok, D. R., S.G. Kang, and S-T. Hwang (1987). “Use of pervaporation for separating azeotropic
mixtures using two different hollow fiber membranes.” J. Membrane Sci. 33: 71. Shaver, K. G., G.L. Poffenbarger and D.R. Grotewald (1991). “Membranes recover hydrogen.”
Hydrocarbon Processing 70(4): 77–82. Singh, A. (1997). "Gas and vapor sorption and permeation properties of high free volume glassy
polymers." Ph.D. thesis, North Carolina State University. Smith, F. L., G.A. Sorial, M.T. Suidan, A.W. Breen, and P. Biswas (1996). “Development of two
control strategies for extended, stable operation of highly efficient biofilters with high toluene loadings.” Environ. Sci. Technol. 30: 1744.
Sok, R. M., and H.J.C. Berendsen (1992). “Molecular dynamics simulation of the transport of
small molecules across a polymer membrane.” Polym. Prepr. Am. Chem. Soc., Div. Polym. Chem. 33: 641.
Stern, S. A., V.M. Shah and B.J. Hardy (1987). “Structure/permeability relationships in silicone
polymers.” J. Polym. Sci. Part B:Polym. Phys. 25: 1263. Stern, S. A. (1994). “Polymers for gas separations: the next decade.” J. Membrane Sci. 94: 1–65. Strachan, L. F., L.M. Freitas dos Santos, D.J. Leak, and A.G. Livingston (1996). “Minimisation
of biomass in an extractive membrane bioreactor.” Wat. Sci. Tech. 34: 273. Strathmann, H., C.M. Bell, and K. Kimmerle (1986). “Development of synthetic membranes for
gas and vapor separation.” Pure & Appl. Chem. 58: 1663. Suwandi, M. S., and S.A. Stern (1973). “Transport of heavy organic vapors through silicone
rubber.” J. Polym. Sci., Polym. Phys. Ed. 11: 663.

A-22
Takada, K., H. Matsuya, T. Masuda and T. Higashimura (1985). “Gas permeability of polyacetylenes carrying substituents.” J. Appl. Polym. Sci. 30: 1605.
Taylor, F., M.J. Kurantz, N. Goldberg, and J.C. Craig, Jr. (1996). “Control of packed column
fouling in the continuous fermentation and stripping of ethanol.” Biotechnol. Bioeng. 51(1): 33.
Tompkins, C. J., A.S. Michaels, and S.W. Peretti (1993). “Removal of p-nitrophenol from
aqueous solution by membrane–membrane solvent extraction.” J. Membrane Sci. 75: 277. Turakhia, M. H., K.E. Cooksey, and W.G. Characklis (1983). "Influence of a calcium-specific
chelant on biofilm removal." Appl. Environ. Microbiol. 46: 1236. Vos, K. D., and F.O. Burris (1969). “Drying of cellulose acetate reverse osmosis membranes.”
Ind. Eng. Chem., Proc. Res. Dev. 8: 84. Ward, W. J., W.R. Browall and M. Salemme (1976). “Ultrathin silicone/polycarbonate
membranes for gas separation processes.” J. Membrane Sci. 1: 99. Watson, J. M., and P.A. Payne (1990). “A study of organic compound pervaporation through
silicone rubber.” J. Membrane Sci. 49: 171–205. Weber, F. J., and S. Hartmans (1996). “Prevention of clogging in a biological trickle-bed reactor
removing toluene from contaminated air.” Biotechnol. Bioeng. 50(1): 91. Wubker, S.–M., and C.G. Friedrich (1996). “Reduction of biomass in a bioscrubber for waste gas
treatment by limited supply of phosphate and potassium ions.” App. Microbiol. Biotechnol. 46: 475.
Wubker, S.-M., A. Laurenzis, U. Werner, and C. Friedrich (1997). “Controlled biomass
formation and kinetics of toluene degradation in a bioscrubber and in a reactor with a periodically moved trickle-bed.” Biotechnol. Bioeng. 55(4): 686.
Zhu, C. L., C.–W. Yuang, J.R. Fried and D.B. Greenberg (1983). “Pervaporation membranes—A
novel separation technique for trace organics.” Environ. Prog. 2(2): 132. Zielinski, J. M., and J.L. Duda (1992). “Predicting polymer/solvent diffusion coefficients using
free-volume theory.” AIChE J. 38: 405.

APPENDIX B
BENCH-SCALE DATA

B-1
Table B-1. AMT Module, Test 1, 0.5 ft3/min Air, 1.0 L/min Oil, 500 ppm VOCs 042700Tes t 1Tes t Date 4/27/00Init ial S ett ings : m agnehelic (1) ~ 1.0"H2O ;pos it ive flow m eas urem ent 50 c c /m in;heater s et ~ 280C
m agnehelic (2) > 1.0"H2O ;sy ringe flow 2.0m l/hr;
run#
M E K Front Detec tor
M E K Rear Detec tor
% Difference
n-B uty l A c etate Front Detec tor
n-B uty l A cetate Rear Detec tor
% Differenc e
E thy l B enzene Front Detec tor
E thy l B enzene Rear Detec tor
% Differenc e
o-Xy lene Front Detec tor
o-Xy lene Rear Detec tor
% Differenc e
1 150.315 130.062 13.47371 89.126 67.699 24.041245 35.881 26.768 25.39784 214.818 155.381 27.668542 153.145 138.194 9.762643 91.612 70.278 23.287342 36.914 27.742 24.84694 221.479 161.184 27.22383 143.296 137.945 3.734228 87.884 72.005 18.068135 35.411 28.437 19.69445 213.098 165.741 22.223114 148.908 136.583 8.276923 88.65 72.437 18.288776 35.749 28.79 19.46628 214.407 168.397 21.459195 145.134 137.084 5.546598 87.979 73.853 16.056104 35.439 29.334 17.22678 213.086 172.465 19.06326 142.971 132.215 7.523204 86.233 73.949 14.245127 34.667 29.51 14.87582 208.276 174.276 16.324497 145.94 138.263 5.260381 88.783 75.424 15.046799 35.689 30.021 15.88164 214.788 177.675 17.27898 143.996 135.188 6.116837 87.305 75.6 13.407021 35.105 30.177 14.03789 210.832 178.909 15.141449 146.268 135.548 7.329012 88.615 75.617 14.667946 35.605 30.226 15.10743 213.969 179.796 15.97101
10 134.227 129.722 3.356255 83.79 75.48 9.9176513 33.638 30.224 10.14924 202.525 180.798 10.7280611 136.837 123.254 9.926409 82.883 73.603 11.196506 33.3 29.676 10.88288 200.097 178.365 10.8607312 150.697 102.9 31.71729 90.417 46.423 48.656779 36.409 19.275 47.05979 218.704 115.088 47.3772813 175.156 110.369 36.98817 103.662 44.659 56.918639 41.771 18.712 55.20337 250.329 108.054 56.835214 191.428 123.568 35.44936 112.785 47.188 58.161103 45.351 19.796 56.34936 271.844 112.28 58.696915 166.186 126.673 23.77637 102.004 48.609 52.345986 40.935 20.412 50.13558 246.625 113.708 53.8943716 136.714 112.95 17.38227 87.39 45.901 47.475684 34.99 19.489 44.30123 211.471 109.703 48.1238617 130.304 108.047 17.08083 81.858 44.409 45.748736 32.796 18.732 42.88328 197.83 103.539 47.6626418 142.684 105.631 25.96857 85.938 42.426 50.631851 34.525 18.088 47.60898 207.39 100.128 51.7199519 162.393 121.14 25.40319 96.488 45.4 52.947517 38.805 19.129 50.70481 232.733 104.992 54.8873620 148.302 119.684 19.29711 90.879 45.541 49.888313 36.466 19.156 47.46888 219.457 105.588 51.886721 146.432 117.69 19.62822 89.249 44.893 49.699156 35.766 18.913 47.12017 215.25 103.787 51.7830422 135.969 118.304 12.99193 85.13 46.149 45.789968 34.134 19.293 43.47864 205.983 106.105 48.4884723 142.63 116.638 18.22338 86.986 44.625 48.698641 34.868 18.843 45.95905 209.62 102.297 51.1988424 154.354 126.517 18.03452 93.55 47.05 49.70604 37.513 19.692 47.5062 225.313 106.584 52.6951425 142.248 122.586 13.82234 88.443 47.209 46.622118 35.447 19.741 44.3084 213.457 107.435 49.6690226 139.154 118.97 14.50479 85.307 46.315 45.707855 34.188 19.384 43.30174 205.426 105.148 48.8146627 138.814 122.3 11.89649 86.002 47.694 44.54315 34.458 19.876 42.31818 207.62 107.965 47.9987528 131.055 117.642 10.23463 81.987 47.276 42.3372 32.867 19.863 39.56552 198.192 107.077 45.973129 151.703 125.706 17.13677 90.754 47.488 47.673932 36.491 19.678 46.07437 218.836 106.18 51.4796530 137.319 123.105 10.35108 85.575 48.112 43.777973 34.342 20.001 41.75936 207.071 108.561 47.5730531 142.491 122.195 14.24371 86.57 47.598 45.017905 34.767 19.812 43.01493 209.006 106.946 48.8311332 141.586 126.176 10.88384 87.118 49.108 43.630478 34.911 20.349 41.71178 210.171 109.923 47.698333 135.562 121.383 10.45942 83.925 47.712 43.14924 33.653 19.849 41.01863 202.695 106.913 47.2542534 152.744 126.865 16.94273 90.981 48.734 46.43497 36.537 20.208 44.69168 219.093 108.378 50.5333435 148.702 132.139 11.13838 91.053 50.868 44.133636 36.501 21.014 42.42897 219.446 112.885 48.5591

B-2
Figure B-1: AMT Module, Test 1, 0.5 ft3/min Air, 1.0 L/min Oil, 500 ppm VOCs
Test 12 cfm air, 1 lpm oil
450 ppm
0
50
100
150
200
250
300
0 5 10 15 20 25 30 35 40
Sample #
ppm
MEK inletMEK outletButyl acetate inletButyl acetate outletEthylbenzene inletEthylbenzene outletXylene inletXylene outlet
Test 12 cfm air, 1 lpm oil
450 ppm
0
50
100
150
200
250
300
0 5 10 15 20 25 30 35 40
Sample #
ppm
MEK inletMEK outletButyl acetate inletButyl acetate outletEthylbenzene inletEthylbenzene outletXylene inletXylene outlet

B-3
Table B-2. AMT Module, Test 2, 0.5 ft3/min Air, 1.0 L/min Oil, 2100 ppm VOCs Tes t 2Run Date: 4/27/00sequence 042700aInit ial s ett ings : s y ringe pum p set at 2.0 m l/hr;0.5c fm ;tem p controller
290C;m agnehilic (1) rding 1"H20;m agnehelic (2) rding > 1"H20;Gen notes :did not experience any s oftware errors during sam pling
s hould have adjus ted sy ringe s am pling rate to a lower s ett ing (1/4 of what it was set) as a res ult our num bers are m uch higher than we expec ted.
run#
M E K Front Detec tor
M E K Rear Detec tor
% Differenc e
n-B uty l A cetate F ront Detec tor
n-B uty l A c etate Rear Detec tor
% Difference
E thy l B enz ene Front Detec tor
E thy l B enz ene Rear Detec tor
% Differenc e
o-Xy lene Front Detec tor
o-Xy lene Rear Detec tor
% Differenc e
1 681.961 377.218 44.68628 410.593 101.304 75.327392 171.399 38.443 77.57105 1043.313 204.793 80.37092 702.241 330.247 52.97241 432.769 87.043 79.88696 179.723 34.172 80.9863 1091.209 184.561 83.086563 625.748 361.555 42.22035 384.748 97.123 74.756724 160.54 37.504 76.63884 980.284 203.155 79.27594 675.842 350.573 48.12796 389.346 96.337 75.256713 162.387 37.329 77.01232 979.173 203.841 79.182335 709.953 334.148 52.93379 436.724 84.916 80.556141 181.329 33.055 81.7707 1101.906 176.789 83.956076 511.676 389.961 23.78751 339.472 107.931 68.206214 142.086 41.344 70.90213 879.358 224.101 74.515397 609.509 312.931 48.65851 343.157 94.794 72.37591 143.154 87.598 38.80856 859.247 207.1 75.89758 890.686 295.112 66.86689 483.275 76.617 84.146294 198.553 71.71 63.8837 1173.823 159.938 86.374619 693.19 379.609 45.23738 475.43 76.729 83.861136 197.178 28.914 85.33609 1221.902 144.917 88.14005
10 657.94 385.654 41.38462 381.081 105.657 72.274398 158.654 96.372 39.2565 959.683 221.517 76.9176911 697.476 363.508 47.88236 447.328 88.42 80.233743 177.678 33.267 81.2768 1077.098 176.13 83.6477312 698.65 380.423 45.54884 442.492 97.394 77.989659 175.995 37.457 78.71701 1065.251 193.751 81.811713 632.709 394.233 37.69126 407.762 104.566 74.35612 162.248 40.501 75.0376 984.326 210.261 78.6390914 574.213 376.799 34.37993 365.677 105.395 71.178116 145.245 40.817 71.89783 881.118 216.217 75.4610615 672.908 360.621 46.40857 416.343 93.11 77.636228 165.348 36.054 78.19508 997.284 187.441 81.2048516 568.607 400.99 29.47853 370.812 107.192 71.092629 147.615 40.731 72.40728 897.819 211.567 76.4354517 578.692 360.337 37.73251 363.342 100.622 72.306532 144.152 38.977 72.96118 870.6 205.926 76.3466618 687.882 358.966 47.81576 424.38 90.92 78.575805 168.437 35.188 79.1091 1013.724 181.146 82.1306419 642.209 403.282 37.20393 407.004 102.042 74.928502 161.922 38.609 76.1558 982.041 197.743 79.8640820 674.566 386.024 42.77447 421.249 98.041 76.726117 167.319 37.702 77.46699 1009.392 193.824 80.7979521 637.705 397.736 37.6301 408.842 100.912 75.317604 162.608 38.527 76.30682 986.365 197.63 79.9638122 617.514 384.006 37.8142 389.518 102.316 73.732664 154.649 39.22 74.63934 935.273 203.762 78.2136323 708 375.488 46.96497 436.517 94.715 78.302105 173.044 36.539 78.88456 1041.451 186.716 82.0715524 541.946 444.311 18.01563 368.106 112.969 69.310742 146.544 42.327 71.11652 896.285 215.611 75.9439225 398.468 361.162 9.362358 272.646 111.063 59.264761 108.163 100.795 6.811941 661.669 230.568 65.1535726 411.618 320.555 22.12318 266.533 101.209 62.027591 105.593 39.148 62.92557 640.938 210.336 67.183127 571.609 314.159 45.03953 346.246 86.748 74.946137 136.853 34.036 75.12952 820.518 175.728 78.5832928 748.405 347.828 53.52409 452.524 83.199 81.614456 178.974 32.136 82.04432 1070.831 158.686 85.18104

B-4
Figure B-2. AMT Module, AMT Module, Test 2, 0.5 ft3/min Air, 1.0 L/min Oil, 2100 ppm VOCs
Test 20.5 cfm air, 1.0 lpm oil
2100 ppm
0
200
400
600
800
1000
1200
1400
0 5 10 15 20 25 30Sample #
ppm
MEK inletMEK outletButyl acetate inletButyl acetate outletEthylbenzene inletEthylbenzene outletXylene inletXylene outlet
Test 20.5 cfm air, 1.0 lpm oil
2100 ppm
0
200
400
600
800
1000
1200
1400
0 5 10 15 20 25 30Sample #
ppm
MEK inletMEK outletButyl acetate inletButyl acetate outletEthylbenzene inletEthylbenzene outletXylene inletXylene outlet

B-5
Table B-3. AMT Module, Test 3, 2.0 ft3/min Air, 1.0 L/min Oil, 450 ppm VOCs Test 3Initial settings: pos itive flow measured 52cc/m in;magnehelic (2) rds >1.0"H20;magnehelic (1) ~1.0"H20;oil flow rate set at 110- rotameter
at 110 on rotameter;Sequence: 042900&o42900a&042900bTest Date: 4/28/00
run#
MEK Front Detector
MEK Rear Detector
% Difference
n-Buty l Acetate Front Detector
n-Buty l Acetate Rear Detector
% Difference
Ethy l Benzene Front Detector
E thy l Benzene Rear Detector
% Difference
o-Xy lene Front Detector
o-Xylene Rear Detector
% Difference
1 3.757 32.314 -760.101 5.623 13.999 -148.95963 2.166 5.653 -160.988 14.411 26.11 -81.1812 3.543 35.619 -905.334 5.246 13.385 -155.14678 2.028 6.132 -202.367 13.751 22.453 -63.28273 3.66 45.528 -1143.93 5.003 12.948 -158.80472 1.889 6.048 -220.169 12.645 21.451 -69.64024 3.177 44.738 -1308.18 4.618 12.862 -178.51884 1.741 6.088 -249.684 11.704 20.808 -77.78545 34.575 47.879 -38.4787 17.828 13.928 21.875701 7.569 6.53 13.72704 44.581 22.939 48.545346 4.057 49.392 -1117.45 5.933 14.864 -150.53093 2.194 6.917 -215.269 14.575 25.115 -72.31567 2.992 45.53 -1421.72 4.213 13.394 -217.92072 1.555 6.443 -314.341 10.518 21.304 -102.5488 2.816 45.604 -1519.46 3.782 13.097 -246.29825 1.42 6.416 -351.831 9.803 20.616 -110.3039 2.7 45.733 -1593.81 3.549 13.069 -268.24458 1.332 6.45 -384.234 9.237 20.344 -120.245
10 97.198 130.086 -33.8361 57.138 39.764 30.407085 23.454 15.821 32.54456 141.676 73.321 48.2474111 159.303 145.773 8.493249 92.56 50.205 45.759507 37.459 19.681 47.45989 224.81 98.965 55.9783812 13.58 69.131 -409.065 16.095 26.546 -64.933209 6.243 11.42 -82.9249 40.095 51.837 -29.285413 3.745 49.379 -1218.53 6.07 17.445 -187.39703 2.27 8.237 -262.863 15.338 30.816 -100.91314 4.136 46.849 -1032.71 5.201 15.396 -196.02 1.937 7.487 -286.526 12.81 26.018 -103.10715 124.961 125.973 -0.80985 71.011 41.594 41.425976 28.929 16.656 42.42456 173.228 79.313 54.2146816 134.06 136.895 -2.11472 79.728 49.515 37.895093 32.236 19.527 39.42487 194.064 98.636 49.1734717 133.615 137.501 -2.90836 80.918 51.76 36.03401 32.621 20.401 37.46053 196.848 104.484 46.9214818 129.124 135.529 -4.96035 79.073 51.745 34.560469 31.829 20.437 35.79126 192.195 104.869 45.4361519 138.012 140.345 -1.69043 83.759 53.479 36.151339 33.672 21.087 37.37527 203.042 108.343 46.640120 139.722 143.644 -2.807 86.295 54.88 36.404195 34.664 21.544 37.84907 209.467 110.974 47.0207721 132.683 136.536 -2.90391 81.828 53.903 34.12646 32.852 21.27 35.25508 198.336 110.077 44.4997422 126.854 121.63 4.11812 78.614 54.163 31.102603 31.518 19.206 39.06339 190.18 105.393 44.582523 123.283 118.879 3.572269 76.064 55.693 26.781395 30.486 21.182 30.51893 183.871 109.765 40.3032624 129.445 123.384 4.682298 79.119 56.29 28.854005 31.762 20.995 33.899 191.522 109.63 42.7585325 131.092 137.907 -5.19864 81.34 56.003 31.149496 32.582 21.206 34.91498 196.867 114.541 41.8180826 124.473 121.593 2.313755 77.96 55.433 28.895587 31.21 21.175 32.15316 188.668 112.209 40.5256927 126.922 123.426 2.754448 79.046 54.31 31.293171 31.65 21.477 32.14218 191.087 111.667 41.5622228 128.208 131.99 -2.94989 79.707 55.551 30.305996 31.894 21.663 32.07813 192.484 113.859 40.8475529 121.068 122.157 -0.89949 76.174 55.032 27.754877 30.475 21.553 29.27646 184.333 112.633 38.89730 128.288 123.072 4.065852 79.282 55.14 30.450796 31.783 21.369 32.76594 191.833 112.526 41.3416931 136.72 138.287 -1.14614 84.999 57.159 32.753327 34.055 22.414 34.18294 205.927 116.906 43.229432 138.344 135.802 1.837449 84.908 56.432 33.537476 34.025 22.063 35.1565 205.265 115.167 43.893533 143.485 138.543 3.444262 88.735 58.214 34.395673 35.513 22.648 36.22617 214.446 118.697 44.6494734 132.866 131.286 1.189168 83.492 58.042 30.481962 33.38 22.535 32.48951 201.816 118.431 41.3173435 140.485 140.769 -0.20216 86.925 58.208 33.036526 34.778 22.853 34.28892 210.01 119.085 43.2955636 138.949 139.632 -0.49155 86.766 58.337 32.765138 34.715 22.639 34.78612 209.783 118.869 43.3371637 139.296 130.346 6.425167 86.57 58.524 32.396904 34.62 22.284 35.63258 209.087 118.265 43.4374238 142.173 130.54 8.182285 88.287 58.595 33.631225 35.291 22.583 36.00918 213.183 119.004 44.1775439 129.481 129.824 -0.2649 81.965 58.018 29.216129 32.783 22.75 30.60428 198.621 118.828 40.173540 135.624 136.905 -0.94452 84.695 58.382 31.06795 33.869 22.86 32.50465 204.659 119.293 41.7113341 129.345 130.313 -0.74839 80.506 56.508 29.808958 32.206 22 31.68975 194.441 115.524 40.586642 135.328 130.21 3.781922 84.266 57.367 31.921534 33.707 22.494 33.26609 203.681 116.686 42.711443 134.72 136.918 -1.63153 84.271 58.252 30.87539 33.678 22.784 32.34753 203.618 118.717 41.6962244 130.53 126.024 3.45208 81.976 57.017 30.446716 32.733 22.25 32.02578 197.842 116.275 41.2283545 134.244 131.213 2.257829 84.873 58.852 30.658749 33.906 22.755 32.88798 205.262 119.129 41.9624746 131.524 127.052 3.40014 82.77 58.041 29.876767 33.072 22.435 32.16316 199.922 117.865 41.0445147 137.039 127.922 6.652851 84.483 58.02 31.323462 33.773 22.48 33.43795 203.613 117.589 42.24878

Figure B-3. AMT Module, AMT Module, Test 2, 0.5 ft3/min Air, 1.0 L/min Oil, 2100 ppm VOCs
Test 32.0 cfm air, 1.0 lpm oil
450 ppm
0
50
100
150
200
250
0 10 20 30 40 50
Sample #
ppm
MEK inletMEK outletButyl acetate inletButyl acetate outletEthylbenzene inletEthylbenzene outletXylene inletXylene outlet
Test 32.0 cfm air, 1.0 lpm oil
450 ppm
0
50
100
150
200
250
0 10 20 30 40 50
Sample #
ppm
MEK inletMEK outletButyl acetate inletButyl acetate outletEthylbenzene inletEthylbenzene outletXylene inletXylene outlet
B-6

B-7
Table B-4. AMT Module, Test 4, 2.0 ft3/min Air, 1.0 L/min Oil, 230 ppm VOCs Tes t 4Init ial s ett ings : s y ringe flow s et 1.0m l/hr;0.5c fm air;m agnehelic (1) ~ 0.9"H2O;m agnehelic (2) > 1.0"H20run date: 4/28/00sequence us ed : 042900c& dGen notes : s oftware error oc urred whic h autom atically aborted sequenc e-im m ediately s tarted new sequenc e (042900d)
run#
M E K Front Detec tor
M E K Rear Detec tor
% Differenc e
n-B uty l A cetate F ront Detec tor
n-B uty l A c etate Rear Detec tor
% Difference
E thy l B enz ene Front Detec tor
E thy l B enz ene Rear Detec tor
% Differenc e
o-Xy lene Front Detec tor
o-Xy lene Rear Detec tor
% Differenc e
1 66.225 69.884 -5.5251 41.646 35.677 14.332709 16.685 14.063 15.71471 100.718 69.825 30.672772 67.129 68.288 -1.72653 41.59 35.282 15.167107 16.635 14.728 11.46378 100.227 68.875 31.280993 69.965 74.479 -6.4518 43.662 36.869 15.558151 17.462 14.659 16.052 105.388 70.835 32.786474 68.354 70.326 -2.88498 42.871 35.988 16.055142 17.174 14.212 17.247 103.737 70.683 31.863275 65.418 68.88 -5.29212 41.149 36.592 11.074388 16.448 14.414 12.36625 99.33 70.073 29.454346 66.901 68.833 -2.88785 41.762 36.329 13.009434 16.704 14.322 14.26006 100.765 69.763 30.766647 71.567 73.801 -3.12155 44.6 36.662 17.798206 17.843 15.303 14.23527 107.638 71.795 33.299588 70.914 81.521 -14.9576 44.329 37.108 16.289562 17.715 15.4 13.06802 106.949 72.361 32.340659 70.793 75.56 -6.73372 44.699 37.48 16.150249 17.858 15.489 13.26576 107.988 73.32 32.10357
10 70.109 71.897 -2.55031 44.093 37.875 14.102012 17.625 14.655 16.85106 106.424 72.307 32.0576211 68.472 70.538 -3.01729 43.257 36.489 15.646023 17.284 15.197 12.07475 104.508 71.546 31.5401712 70.272 71.531 -1.79161 43.801 37.9 13.472295 17.516 14.57 16.81891 105.694 72.318 31.5779513 71.815 71.163 0.907888 44.497 36.734 17.44612 17.807 15.324 13.94395 107.229 72.501 32.3867614 69.01 70.579 -2.27358 43.289 36.424 15.858532 17.313 14.305 17.37423 104.441 71.315 31.7174315 68.487 68.816 -0.48038 42.955 36.117 15.918985 17.152 14.861 13.35704 103.49 71.055 31.3411916 71.998 80.286 -11.5114 44.673 36.783 17.661675 17.865 15.266 14.548 107.7 72.162 32.9972117 70.486 79.729 -13.1132 44.147 36.861 16.503953 17.624 15.315 13.10145 106.403 72.38 31.975618 70.25 75.262 -7.13452 44.188 37.388 15.388793 17.648 15.527 12.01836 106.658 73.016 31.5419419 71.417 74.997 -5.01281 44.507 37.234 16.34125 17.788 15.546 12.604 107.173 73.028 31.859720 69.171 73.45 -6.18612 43.449 36.796 15.312205 17.346 15.351 11.50121 104.73 72.042 31.2116921 67.824 73.352 -8.15051 42.251 37.244 11.850607 16.864 15.678 7.032732 101.631 71.788 29.3640722 69.692 70.423 -1.0489 43.512 36.775 15.483085 17.381 14.538 16.35694 104.838 72.291 31.0450423 68.943 69.619 -0.98052 43.464 37.076 14.697221 17.35 15.291 11.86744 104.828 72.508 30.8314624 67.639 70.38 -4.0524 42.634 36.358 14.720645 17.022 15.05 11.58501 102.772 71.556 30.3740325 69.136 70.085 -1.37266 43.088 36.516 15.252506 17.198 14.955 13.04221 103.662 71.583 30.9457726 67.33 69.073 -2.58874 42.146 36.556 13.263418 16.815 15.252 9.295272 101.488 71.92 29.1344827 65.916 69.09 -4.81522 41.603 36.284 12.785136 16.577 15.183 8.409242 100.193 71.602 28.5359328 63.953 69.793 -9.13171 40.672 36.04 11.38867 16.214 15.148 6.574565 98.055 71.224 27.3632129 64.112 74.936 -16.883 40.498 35.877 11.41044 16.154 15.032 6.945648 97.579 70.799 27.4444330 63.302 68.238 -7.79754 40.176 35.89 10.668061 16.002 15.075 5.793026 96.655 71.13 26.4083631 69.961 71.137 -1.68094 43.185 36.552 15.3595 17.259 15.33 11.17678 103.894 72.258 30.4502732 69.135 71.957 -4.08187 43.293 36.947 14.658259 17.267 15.463 10.44767 104.213 73.006 29.9454

B-9
Figure B-4. AMT Module, Test 4, 2.0 ft3/min Air, 1.0 L/min Oil, 230 ppm VOCs
0
20
40
60
80
100
120
0 5 10 15 20 25 30 35
Sample #
ppm
MEK inletMEK outletButyl acetate inletButyl acetate outletEthylbenzene inletEthylbenzene outletXylene inletXylene outlet
0
20
40
60
80
100
120
0 5 10 15 20 25 30 35
Sample #
ppm
0
20
40
60
80
100
120
0 5 10 15 20 25 30 35
Sample #
ppm
MEK inletMEK outletButyl acetate inletButyl acetate outletEthylbenzene inletEthylbenzene outletXylene inletXylene outlet
B-8

B-9
Table B-5. AMT Module, Test 5, 2.0 ft3/min Air, 1.0 L/min Oil, 850 ppm VOCs
Tes t 5run date: 4/28/00sequence used : 0429e& fInit ial sett ings : sy ringe pum p set at 3.5m l/hr;pos it ive net sam ple flow 50cc /m in;m agnehelic (1) ~0.9"H2O
m agnehelic (2) > 1.0"H2O
run#
M EK Front Detec tor
M EK Rear Detec tor
% Difference
n-Buty l A cetate Front Detec tor
n-B uty l Acetate Rear Detec tor
% Difference
E thy l B enzene Front Detec tor
E thy l B enzene Rear Detec tor
% Difference
o-Xy lene Front Detec tor
o-Xy lene Rear Detec tor
% Difference
1 258.118 196.099 24.02738 158.541 77.836 50.904813 63.119 29.327 53.53697 381.073 156.69 58.881892 235.798 189.425 19.66641 146.143 85.804 41.287643 58.13 32.671 43.79666 351.1 177.338 49.490743 246.903 201.885 18.23307 153.555 89.928 41.435968 61.018 34.127 44.0706 368.879 186.289 49.498624 255.548 208.471 18.42198 159.528 94.122 40.999699 63.397 34.963 44.8507 383.122 193.603 49.467015 238.781 193.458 18.98099 148.642 89.258 39.951023 59.05 33.327 43.56139 356.841 186.187 47.823546 226.632 181.656 19.84539 140.802 87.869 37.593926 55.888 32.773 41.3595 337.046 184.331 45.309847 228.48 189.155 17.21157 144.341 89.08 38.285033 57.273 33.677 41.19917 346.809 188.48 45.653088 252.031 202.259 19.74836 155.649 91.968 40.913209 61.791 34.945 43.44646 372.998 191.591 48.634859 254.606 194.285 23.6919 157.526 90.335 42.653911 62.493 34.263 45.17306 376.575 189.25 49.74441
10 230.948 203.771 11.76758 148.972 95.288 36.036302 59.075 35.309 40.23022 358.591 197.982 44.7889111 12.208 51.564 -322.379 24.672 44.703 -81.189202 9.251 18.621 -101.286 60.193 100.169 -66.41312 5.66 32.563 -475.318 11.193 28.586 -155.39176 4.175 12.375 -196.407 27.278 57.266 -109.935

B-10
0
50
100
150
200
250
300
350
400
450
0 2 4 6 8 10 12 14Sample #
ppm
MEK inletMEK outletButyl acetate inletButyl acetate outletEthylbenzene inletEthylbenzene outletXylene inletXylene outlet
0
50
100
150
200
250
300
350
400
450
0 2 4 60
50
100
150
200
250
300
350
400
450
0 2 4 6 8 10 12 14Sample #
ppm
MEK inletMEK outletButyl acetate inletButyl acetate outletEthylbenzene inletEthylbenzene outletXylene inletXylene outlet
Figure B-5. AMT Module, Test 5, 2.0 ft3/min Air, 1.0 L/min Oil, 850 ppm VOCs
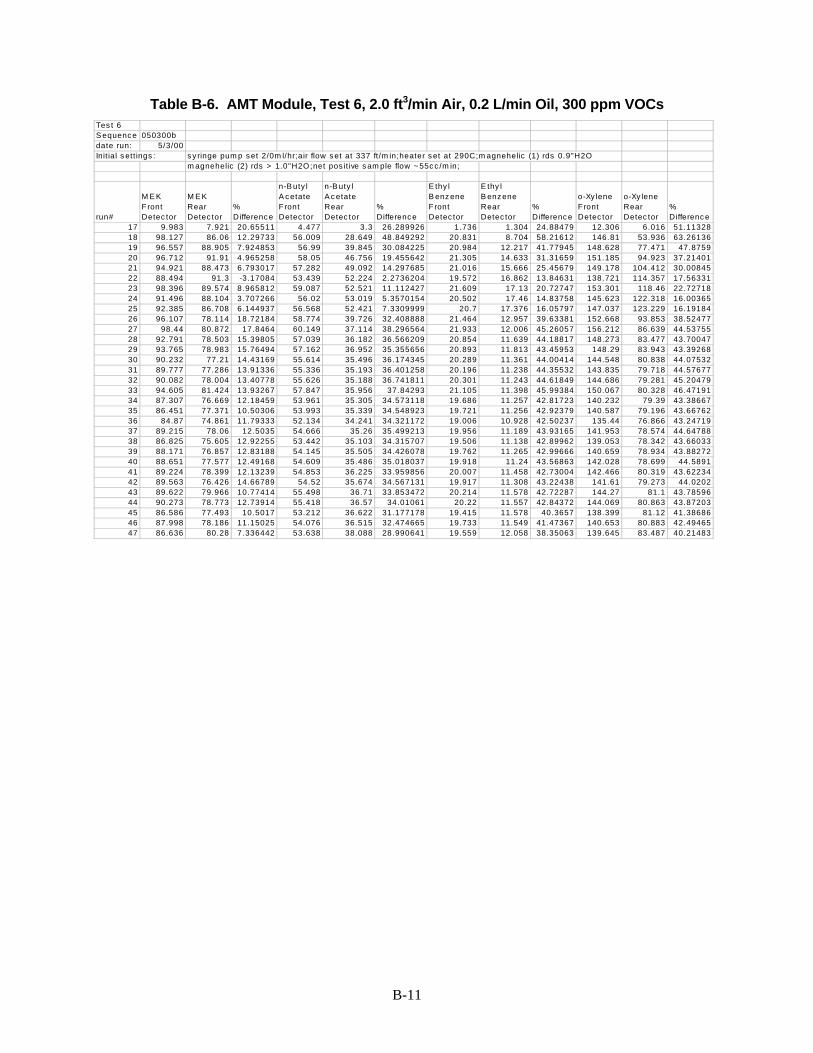
B-11
Table B-6. AMT Module, Test 6, 2.0 ft3/min Air, 0.2 L/min Oil, 300 ppm VOCs Tes t 6S equence 050300bdate run: 5/3/00Init ial s ett ings : s y ringe pum p set 2/0m l/hr;air flow set at 337 ft /m in;heater s et at 290C;m agnehelic (1) rds 0.9"H2O
m agnehelic (2) rds > 1.0"H2O;net pos it ive s am ple flow ~ 55c c /m in;
run#
M E K Front Detec tor
M E K Rear Detec tor
% Differenc e
n-B uty l A cetate F ront Detec tor
n-B uty l A c etate Rear Detec tor
% Difference
E thy l B enz ene Front Detec tor
E thy l B enz ene Rear Detec tor
% Differenc e
o-Xy lene Front Detec tor
o-Xy lene Rear Detec tor
% Differenc e
17 9.983 7.921 20.65511 4.477 3.3 26.289926 1.736 1.304 24.88479 12.306 6.016 51.1132818 98.127 86.06 12.29733 56.009 28.649 48.849292 20.831 8.704 58.21612 146.81 53.936 63.2613619 96.557 88.905 7.924853 56.99 39.845 30.084225 20.984 12.217 41.77945 148.628 77.471 47.875920 96.712 91.91 4.965258 58.05 46.756 19.455642 21.305 14.633 31.31659 151.185 94.923 37.2140121 94.921 88.473 6.793017 57.282 49.092 14.297685 21.016 15.666 25.45679 149.178 104.412 30.0084522 88.494 91.3 -3.17084 53.439 52.224 2.2736204 19.572 16.862 13.84631 138.721 114.357 17.5633123 98.396 89.574 8.965812 59.087 52.521 11.112427 21.609 17.13 20.72747 153.301 118.46 22.7271824 91.496 88.104 3.707266 56.02 53.019 5.3570154 20.502 17.46 14.83758 145.623 122.318 16.0036525 92.385 86.708 6.144937 56.568 52.421 7.3309999 20.7 17.376 16.05797 147.037 123.229 16.1918426 96.107 78.114 18.72184 58.774 39.726 32.408888 21.464 12.957 39.63381 152.668 93.853 38.5247727 98.44 80.872 17.8464 60.149 37.114 38.296564 21.933 12.006 45.26057 156.212 86.639 44.5375528 92.791 78.503 15.39805 57.039 36.182 36.566209 20.854 11.639 44.18817 148.273 83.477 43.7004729 93.765 78.983 15.76494 57.162 36.952 35.355656 20.893 11.813 43.45953 148.29 83.943 43.3926830 90.232 77.21 14.43169 55.614 35.496 36.174345 20.289 11.361 44.00414 144.548 80.838 44.0753231 89.777 77.286 13.91336 55.336 35.193 36.401258 20.196 11.238 44.35532 143.835 79.718 44.5767732 90.082 78.004 13.40778 55.626 35.188 36.741811 20.301 11.243 44.61849 144.686 79.281 45.2047933 94.605 81.424 13.93267 57.847 35.956 37.84293 21.105 11.398 45.99384 150.067 80.328 46.4719134 87.307 76.669 12.18459 53.961 35.305 34.573118 19.686 11.257 42.81723 140.232 79.39 43.3866735 86.451 77.371 10.50306 53.993 35.339 34.548923 19.721 11.256 42.92379 140.587 79.196 43.6676236 84.87 74.861 11.79333 52.134 34.241 34.321172 19.006 10.928 42.50237 135.44 76.866 43.2471937 89.215 78.06 12.5035 54.666 35.26 35.499213 19.956 11.189 43.93165 141.953 78.574 44.6478838 86.825 75.605 12.92255 53.442 35.103 34.315707 19.506 11.138 42.89962 139.053 78.342 43.6603339 88.171 76.857 12.83188 54.145 35.505 34.426078 19.762 11.265 42.99666 140.659 78.934 43.8827240 88.651 77.577 12.49168 54.609 35.486 35.018037 19.918 11.24 43.56863 142.028 78.699 44.589141 89.224 78.399 12.13239 54.853 36.225 33.959856 20.007 11.458 42.73004 142.466 80.319 43.6223442 89.563 76.426 14.66789 54.52 35.674 34.567131 19.917 11.308 43.22438 141.61 79.273 44.020243 89.622 79.966 10.77414 55.498 36.71 33.853472 20.214 11.578 42.72287 144.27 81.1 43.7859644 90.273 78.773 12.73914 55.418 36.57 34.01061 20.22 11.557 42.84372 144.069 80.863 43.8720345 86.586 77.493 10.5017 53.212 36.622 31.177178 19.415 11.578 40.3657 138.399 81.12 41.3868646 87.998 78.186 11.15025 54.076 36.515 32.474665 19.733 11.549 41.47367 140.653 80.883 42.4946547 86.636 80.28 7.336442 53.638 38.088 28.990641 19.559 12.058 38.35063 139.645 83.487 40.21483

B-12
Figure B-6. AMT Module, Test 6, 2.0 ft3/min Air, 0.2 L/min Oil, 300 ppm VOCs
0
20
40
60
80
100
120
140
160
180
17 19 21 23 25 27 29 31 33 35 37 39 41 43 45 47
Sample #
ppm
MEK inletMEK outletButyl acetate inletButyl acetate outletEthylbenzene inletEthylbenzene outletXylene inletXylene outlet
0
20
40
60
80
100
120
140
160
180
17 19 21 23 25 27 29 31 33 35 37 39 41 43 45 47
Sample #
ppm
MEK inletMEK outletButyl acetate inletButyl acetate outletEthylbenzene inletEthylbenzene outletXylene inletXylene outlet

B-13
Table B-7. AMT Module, Test 7, 2.0 ft3/min Air, 0.2 L/min Oil, 170 ppm VOCs Tes t 7Run Date: 5/5/00run s tart 3:15Init ial s ett ings : did not verify net pos itive s am ple flow; s y ringe pum p s et at 1.0 m l/hr;air flow set 341;tem p at sy ringe t ip
t ip 290C;m agnehilic (1) rding 1"H20;m agnehelic (2) rding > 1"H20;
run#
M E K Front Detec tor
M E K Rear Detec tor
% Differenc e
n-B uty l A cetate F ront Detec tor
n-B uty l A c etate Rear Detec tor
% Difference
E thy l B enz ene Front Detec tor
E thy l B enz ene Rear Detec tor
% Differenc e
o-Xy lene Front Detec tor
o-Xy lene Rear Detec tor
% Differenc e
1 52.52 44.503 15.26466 32.4 21.152 34.716049 12.922 7.42 42.57855 75.912 39.721 47.674942 52.909 42.708 19.28027 32.664 20.832 36.223365 13.003 7.447 42.7286 76.467 40.253 47.358993 53.834 42.879 20.34959 32.943 20.949 36.408342 13.098 7.5 42.73935 76.985 40.597 47.266354 51.304 41.942 18.24809 31.672 20.838 34.20687 12.609 7.472 40.74074 74.112 40.63 45.177575 50.703 41.517 18.11727 31.255 20.622 34.020157 12.421 7.392 40.48788 73.018 40.323 44.776636 53.456 43.012 19.53756 32.986 21.207 35.709089 13.087 7.579 42.08757 77.029 41.336 46.337097 51.818 42.066 18.81972 32.131 21.101 34.328219 12.758 7.548 40.83712 74.988 41.317 44.901858 50.982 42.066 17.48853 31.461 21.101 32.929659 12.489 7.548 39.56282 73.376 41.317 43.69149 52.202 42.377 18.82112 32.312 21.073 34.782743 12.83 7.533 41.28605 75.46 41.359 45.19083
10 51.247 41.892 18.25473 31.908 21.22 33.496302 12.679 7.584 40.18456 74.688 41.68 44.1945211 49.504 40.98 17.21881 30.735 20.982 31.732552 12.187 7.507 38.40158 71.726 41.232 42.5145712 50.484 41.414 17.96609 31.355 21.246 12.392 12.392 7.61 38.58941 73.15 41.445 43.3424513 53.219 42.519 20.1056 32.835 21.444 34.69164 12.963 7.635 41.1016 76.394 41.679 45.4420514 53.579 43.632 18.56511 33.458 21.995 34.260864 13.2 7.817 40.7803 77.824 42.75 45.0683615 52.533 42.575 18.9557 32.739 21.835 33.305843 12.906 7.776 39.74895 76.015 42.59 43.9715816 49.32 40.465 17.95418 30.865 21.274 31.074032 12.165 7.601 37.51747 71.653 41.73 41.7609917 48.944 40.199 17.86736 30.531 21.118 30.830959 12.034 7.557 37.20293 70.93 41.447 41.5663318 50.794 41.991 17.33079 31.844 21.654 31.999749 12.554 7.726 38.45786 74.035 42.278 42.8945819 53.114 42.093 20.74971 32.886 21.612 34.282065 12.956 7.712 40.47546 76.326 42.271 44.6178220 51.362 41.356 19.48133 31.936 21.628 32.277054 12.577 7.719 38.62606 74.111 42.356 42.8478921 51.299 41.39 19.31617 31.961 21.67 32.198617 12.58 7.741 38.46582 74.097 42.453 42.7061822 52.05 41.923 19.45629 32.359 21.907 32.300133 12.739 7.819 38.62156 75.021 42.912 42.8000223 53.31 42.394 20.47646 33.134 22.036 33.494296 13.031 7.852 39.74369 76.848 43.087 43.9321824 49.831 41.357 17.00548 31.461 22.026 29.989511 12.386 7.879 36.38786 73.16 43.343 40.7558825 49.312 40.455 17.96115 30.895 21.712 29.723256 12.167 7.777 36.0812 71.786 42.635 40.608226 51.265 41.201 19.63133 31.85 21.962 31.045526 12.542 7.845 37.45017 73.887 42.97 41.8436327 51.59 41.243 20.05621 32.134 22.039 31.415323 12.64 7.865 37.7769 74.542 43.026 42.2795228 51.296 41.914 18.28993 32.351 22.142 31.556984 12.714 7.905 37.82445 75.038 43.362 42.2132829 50.909 41.575 18.33468 31.871 22.272 30.118289 12.508 7.958 36.37672 73.864 43.712 40.8209730 51.634 41.934 18.78607 32.429 22.536 30.506645 12.755 8.046 36.91886 75.285 44.319 41.131731 50.322 40.311 19.89388 31.369 22.096 29.561032 12.347 7.917 35.87916 72.779 43.592 40.103632 47.509 39.588 16.67263 29.892 21.869 26.839957 11.755 7.853 33.19439 69.332 43.217 37.6665933 46.676 38.418 17.69218 29.42 21.454 27.076818 11.553 7.713 33.23812 68.225 42.399 37.85416

B-14
Figure B-7. AMT Module, Test 7, 2.0 ft3/min Air, 0.2 L/min Oil, 170 ppm VOCs
0
10
20
30
40
50
60
70
80
90
0 5 10 15 20 25 30 35
Sample #
ppm
MEK inletMEK outletButyl acetate inletButyl acetate outletEthylbenzene inletEthylbenzene outletXylene inletXylene outlet
0
10
20
30
40
50
60
70
80
90
0 5 10 15 20 25 30 35
Sample #
ppm
MEK inletMEK outletButyl acetate inletButyl acetate outletEthylbenzene inletEthylbenzene outletXylene inletXylene outlet

B-15
Table B-8. AMT Module, Test 7, 2.0 ft3/min Air, 0.22 L/min Oil, 170 ppm VOCs Tes t 8
Init ial s ett ings : s y ringe pum p 3.5m l/hr;s ilic on oil pres sure 5.1ps i;oil tem p 71;air flow reading 344; tem p at sy ringe t ip ~ 290Cm agnehelic 1(rding at s am ple port 1) ~ 1.0"H2O ;m ag. 2 (rding taken near vac . P um p) > 1.0"H2Onet pos itive flow verified at 50c c /m in
s tart/s top t im e 7:00am -9:45amrun date: 5/6/00Run s equenc e: 050600, 050600a, 050600b
run#
M E K Front Detec tor
M E K Rear Detec tor
% Differenc e
n-B uty l A cetate F ront Detec tor
n-B uty l A c etate Rear Detec tor
% Difference
E thy l B enz ene Front Detec tor
E thy l B enz ene Rear Detec tor
% Differenc e
o-Xy lene Front Detec tor
o-Xy lene Rear Detec tor
% Differenc e
1 4.552 3.65 19.81547 3.503 3.662 -4.5389666 1.393 1.906 -36.827 8.524 9.151 -7.35572 3.289 2.658 19.18516 2.646 3.125 -18.102797 1.046 1.652 -57.935 6.465 8.053 -24.5633 3.157 6.072 -92.3345 2.545 5.339 -109.78389 0.963 2.293 -138.11 6.079 10.402 -71.11374 3.524 6.179 -75.3405 2.519 6.002 -138.26915 1.006 2.44 -142.545 6.483 11.006 -69.76715 2.51 5.428 -116.255 1.968 6.017 -205.74187 0.742 2.443 -229.245 4.902 10.983 -124.0516 2.962 5.456 -84.1999 2.018 5.977 -196.18434 0.774 2.422 -212.92 5.113 10.915 -113.4757 1.649 5.365 -225.349 1.465 5.93 -304.77816 0.472 2.405 -409.534 3.42 10.808 -216.0238 1.137 4.698 -313.193 1.499 6.073 -305.13676 0.49 2.449 -399.796 3.592 11.098 -208.9649 0.834 4.179 -401.079 1.135 5.722 -404.14097 0.375 2.34 -524 2.78 10.47 -276.619
10 137.872 65.605 52.41601 69.982 15.888 77.297019 28.084 5.681 79.7714 163.814 29.695 81.8727311 151.286 102.345 32.34999 89.985 42.128 53.183308 34.858 14.152 59.401 207.138 78.021 62.3338112 142.512 98.408 30.94757 85.919 44.01 48.777337 33.181 15.136 54.38353 197.311 84.547 57.1503913 139.46 101.085 27.51685 85.927 45.668 46.852561 33.137 15.72 52.56058 197.591 88.826 55.0455214 138.875 101.811 26.68875 86.336 46.47 46.175408 33.274 16.052 51.75813 198.545 91.292 54.0194915 145.758 104.656 28.1988 89.561 47.204 47.294023 34.503 16.323 52.69107 205.751 93.335 54.6369216 142.474 104.737 26.48694 88.78 47.981 45.95517 34.195 16.804 50.85831 204.471 97.677 52.2294117 152.286 109.495 28.0991 94.257 49.884 47.07661 36.24 17.443 51.8681 216.196 100.626 53.4561218 159.376 111.562 30.00075 98.568 50.774 48.488353 37.933 17.637 53.50486 226.656 102.83 54.6316919 155.164 112.545 27.46707 97.672 51.512 47.260218 37.54 18.121 51.72882 225.039 104.066 53.7564620 146.13 108.617 25.67098 92.16 50.841 44.833984 35.406 17.617 50.2429 212.006 103.52 51.1711921 148.17 108 27.11075 93.482 51.22 45.208703 35.859 17.822 50.29979 214.562 104.314 51.3828222 145.813 110.063 24.5177 92.387 51.622 44.124173 35.485 17.833 49.74496 212.703 104.645 50.8022923 145.6 110.408 24.17033 92.216 52.007 43.603062 35.394 18.109 48.83596 212.24 105.455 50.3133224 148.854 111.876 24.84179 94.211 53.133 43.602127 36.144 18.231 49.56009 216.427 105.709 51.157225 156.511 115.287 26.33936 97.995 53.933 44.963519 37.605 18.519 50.75389 225.161 106.749 52.5899226 154.064 114.648 25.58417 96.341 54.222 43.718666 37 18.615 49.68919 221.235 107.161 51.5623727 155.588 114.328 26.51875 96.976 54.369 43.935613 37.234 18.669 49.86034 222.84 107.549 51.7371228 154.746 114.354 26.10213 97.155 54.495 43.909217 37.269 18.738 49.72229 223.296 107.871 51.6914829 151.776 111.986 26.21627 95.588 54.214 43.283676 36.662 18.635 49.1708 219.433 107.392 51.0593230 148.536 110.742 25.44434 93.973 54.513 41.990785 36.032 18.732 48.01288 215.84 108.106 49.9138331 149.849 114.368 23.67784 94.943 55.38 41.670265 36.44 19.006 47.84303 218.428 109.504 49.8672332 150.134 115.314 23.19261 95.226 55.63 41.581081 36.54 19.092 47.75041 218.946 109.932 49.7903633 145.804 110.928 23.91978 92.654 54.986 40.654478 35.541 18.932 46.73194 213.008 109.302 48.6864334 146.056 109.193 25.23895 91.772 54.055 41.098592 35.202 18.62 47.10528 210.566 107.482 48.9556735 145.557 109.421 24.82601 91.851 54.346 40.832435 35.19 18.692 46.88264 210.736 107.935 48.7818936 149.602 112.035 25.1113 93.961 54.919 41.551282 36.033 18.849 47.68962 215.74 108.557 49.6815637 148.367 111.632 24.75955 93.637 55.22 41.027585 35.912 18.98 47.14859 215.021 109.227 49.2017138 143.993 108.654 24.54217 90.839 55.134 39.305805 34.817 19.056 45.26812 208.587 109.495 47.50632

B-16
Figure B-8. AMT Module, Test 7, 2.0 ft3/min Air, 0.22 L/min Oil, 170 ppm VOCs
0
50
100
150
200
250
0 5 10 15 20 25 30 35 40
Sample #
ppm
MEK inletMEK outletButyl acetate inletButyl acetate outletEthylbenzene inletEthylbenzene outletXylene inletXylene outlet
0
50
100
150
200
250
0 5 10 15 20 25 30 35 40
Sample #
ppm
MEK inletMEK outletButyl acetate inletButyl acetate outlet
0
50
100
150
200
250
0 5 10 15 20 25 30 35 40
Sample #
ppm
MEK inletMEK outletButyl acetate inletButyl acetate outletEthylbenzene inletEthylbenzene outletXylene inletXylene outlet

B-17
Table B-9. AMT Module, Test 9, 2.0 ft3/min Air, 0.2 L/min Oil, 350 ppm VOCs Tes t 9
36655Init ial c ondit ions : m agnehelic (1) ~ 0.9"H2O;m agnehelic (2) > 1"H2O;ran at 200ppm & 4c fm = 4m l/hr and 680;oil pres sure 5ps i;
oil tem p 78;tem p controller sett ing 290C;sam ple flow through rotam eter 53;
Obs ervations : V OC rem oval was low during this tes t run. Rec om m end changing oil and running at a higher V O C c onc -c entrat ion.
run#
M E K Front Detec tor
M E K Rear Detec tor
% Differenc e
n-B uty l A cetate F ront Detec tor
n-B uty l A c etate Rear Detec tor
% Difference
E thy l B enz ene Front Detec tor
E thy l B enz ene Rear Detec tor
% Differenc e
o-Xy lene Front Detec tor
o-Xy lene Rear Detec tor
% Differenc e
1 0.631 7.321 -1060.22 1.025 10.458 -920.29268 0.316 4.126 -1205.7 2.324 20.191 -768.8042 0.592 7.327 -1137.67 1.041 10.621 -920.26897 0.311 4.159 -1237.3 2.366 20.18 -752.9163 0.603 7.17 -1089.05 0.992 10.579 -966.43145 0.294 4.123 -1302.38 2.266 20.134 -788.5264 0.668 7.031 -952.545 1.185 10.447 -781.60338 0.316 4.083 -1192.09 2.24 19.882 -787.5895 0.603 6.673 -1006.63 1.042 10.268 -885.41267 0.291 4.025 -1283.16 2.163 19.668 -809.2936 0.692 6.472 -835.26 0.269 10.166 -3679.1822 0.308 3.995 -1197.08 2.115 19.552 -824.4447 0.559 6.213 -1011.45 0.99 10.065 -916.66667 0.237 3.935 -1560.34 1.954 19.434 -894.5758 0.716 5.919 -726.676 1.323 9.928 -650.41572 0.319 3.949 -1137.93 2.117 19.36 -814.5029 0.72 5.888 -717.778 1.334 9.82 -636.13193 0.294 3.884 -1221.09 2.013 19.127 -850.174
10 0.655 5.662 -764.427 1.084 9.733 -797.87823 0.225 3.859 -1615.11 1.875 19.018 -914.29311 0.703 5.484 -680.085 1.282 9.617 -650.15601 0.288 3.829 -1229.51 1.923 18.919 -883.82712 0.382 5.294 -1285.86 1.062 9.441 -788.98305 0.265 3.772 -1323.4 1.913 18.69 -876.99913 0.636 5.006 -687.107 1.164 9.269 -696.30584 0.292 3.714 -1171.92 1.944 18.44 -848.5614 0.599 4.828 -706.01 1 9.107 -810.7 0.227 3.674 -1518.5 1.852 18.179 -881.58715 4.975 9.396 -88.8643 2.71 10.911 -302.61993 1.009 4.316 -327.75 6.049 21.923 -262.42416 79.607 68.491 13.9636 47.051 31.646 32.741068 18.528 11.399 38.4769 109.293 62.138 43.1454917 91.54 75.87 17.1182 55.828 39.67 28.942466 21.604 14.238 34.09554 128.364 79.611 37.9802718 85.396 76.173 10.80027 56.145 41.499 26.086027 21.691 14.988 30.90222 129.922 84.97 34.5992219 5.554 9.845 -77.2596 6.997 18.707 -167.35744 2.426 7.365 -203.586 15.225 42.504 -179.17220 3.666 7.675 -109.356 4.297 13.198 -207.14452 1.482 5.336 -260.054 9.175 30.346 -230.74721 81.17 53.965 33.51608 43.521 22.564 48.153765 17.341 8.406 51.52529 101.028 45.66 54.8046122 6.463 13.55 -109.655 10.362 21.204 -104.63231 3.631 7.974 -119.609 22.634 45.981 -103.1523 3.16 6.587 -108.449 3.979 12.834 -222.54335 1.356 5.103 -276.327 8.94 28.567 -219.54124 2.22 6.21 -179.73 2.988 11.303 -278.27979 0.952 4.57 -380.042 6.383 25.19 -294.64225 1.888 4.967 -163.083 2.657 10.478 -294.35454 0.805 4.2 -421.739 5.304 22.886 -331.48626 88.969 72.766 18.21196 52.085 33.297 36.071806 20.459 11.95 41.5905 120.944 66.25 45.2225827 92.782 78.099 15.82527 56.78 40.623 28.455442 22.058 14.535 34.10554 130.801 82.121 37.2168428 94.794 73.99 21.94654 58.039 41.684 28.179328 22.596 15.03 33.4838 134.027 86.213 35.674929 87.924 72.883 17.10682 55.353 42.146 23.859592 21.43 15.392 28.17545 127.459 89.125 30.0755530 84.366 73.662 12.68758 53.926 42.669 20.874903 20.805 15.571 25.15741 124.02 90.522 27.0101631 88.22 76.025 13.8234 56.077 43.14 23.070064 21.649 15.707 27.447 128.937 91.34 29.159232 91.059 74.687 17.97955 57.131 43.414 24.009732 22.08 15.832 28.2971 131.048 92.286 29.5784833 88.697 75.567 14.80321 56.414 43.272 23.295636 21.764 15.808 27.36629 129.557 92.133 28.8861334 88.202 74.665 15.34772 56.561 43.155 23.701844 21.804 15.772 27.66465 130.092 92.042 29.2485335 86.866 71.566 17.61334 55.012 42.789 22.218789 21.217 15.661 26.18655 126.134 91.581 27.3938836 85.83 72.856 15.11593 54.92 43.329 21.105244 21.183 15.855 25.15224 126.024 92.687 26.452937 91.721 78.726 14.16797 58.651 45.509 22.40712 22.643 16.523 27.02822 134.872 96.507 28.4454938 95.437 81.768 14.32254 61.606 46.901 23.869428 23.708 16.987 28.34908 141.706 99.275 29.9429839 96.661 80.491 16.72857 61.82 46.699 24.459722 23.804 16.925 28.8985 141.991 99.107 30.2019140 93.705 80.413 14.18494 60.159 46.691 22.38734 23.174 16.958 26.82316 138.243 99.444 28.065841 95.434 80.002 16.17034 61.035 46.468 23.866634 23.506 16.888 28.15451 140.175 98.926 29.4267942 96.435 77.94 19.17872 61.348 45.941 25.114103 23.626 16.737 29.15855 140.753 98.062 30.3304443 92.36 78.248 15.27934 59.478 46.378 22.02495 22.921 16.909 26.22922 136.655 99.143 27.4501544 91.043 79.597 12.57208 59.2 47.009 20.592905 22.815 17.129 24.9222 136.329 100.414 26.3443645 93.232 79.387 14.85005 59.922 46.539 22.334034 23.115 16.991 26.49362 137.928 99.601 27.7876946 94.528 79.312 16.09682 60.129 46.689 22.351943 23.192 17.039 26.5307 138.103 99.949 27.6272147 94.751 78.851 16.78083 60.285 46.571 22.748611 23.254 16.981 26.976 138.341 99.592 28.0097748 91.775 77.304 15.76791 59.015 45.955 22.129967 22.793 16.79 26.33703 135.783 98.465 27.4835649 89.062 74.638 16.19546 57.12 45.269 20.747549 22.028 16.578 24.74124 131.207 97.432 25.7417750 87.042 75.892 12.80991 56.641 45.856 19.040977 21.846 16.781 23.18502 130.375 98.558 24.4042251 90.907 78.336 13.82842 58.8 46.44 21.020408 22.663 16.967 25.13348 135.307 99.552 26.4250952 91.285 77.471 15.13283 58.703 46.252 21.21016 22.595 16.917 25.12945 134.867 99.344 26.3392853 89.465 76.244 14.77785 57.455 45.528 20.758855 22.179 16.679 24.79823 132.123 97.891 25.9091954 89.725 75.301 16.07579 57.322 45.067 21.379226 22.133 16.506 25.42358 131.794 96.898 26.4776855 91.056 73.616 19.15305 57.913 45.056 22.200542 22.36 16.515 26.14043 133.052 97.044 27.063156 85.559 72.865 14.83655 55.092 45.063 18.204095 21.262 16.535 22.23215 126.521 97.199 23.175657 86.82 74.576 14.10274 56.109 45.279 19.301716 21.651 16.604 23.3107 129.041 97.579 24.381458 95.245 78.84 17.224 60.555 45.877 24.239121 23.367 16.77 28.23212 139.344 98.307 29.4501459 93.165 79.109 15.08721 59.54 46.774 21.441048 22.981 17.105 25.56895 136.827 100.303 26.6935660 93.709 78.902 15.80104 59.971 46.791 21.977289 23.114 17.112 25.96695 137.831 100.201 27.30155

B-18
Figure B-9. AMT Module, Test 9, 2.0 ft3/min Air, 0.2 L/min Oil, 350 ppm VOCs
Test 92.0 cfm air, 0.2 lpm oil
350 ppm
0
20
40
60
80
100
120
140
160
10 20 30 40 50 60
Sample #
ppm
MEK inletMEK outletButyl acetate inletButyl acetate outletEthylbenzene inletEthylbenzene outletXylene inletXylene outlet
Test 92.0 cfm air, 0.2 lpm oil
350 ppm
0
20
40
60
80
100
120
140
160
10 20 30 40 50 60
Sample #
ppm
MEK inletMEK outletButyl acetate inletButyl acetate outletEthylbenzene inletEthylbenzene outletXylene inletXylene outlet
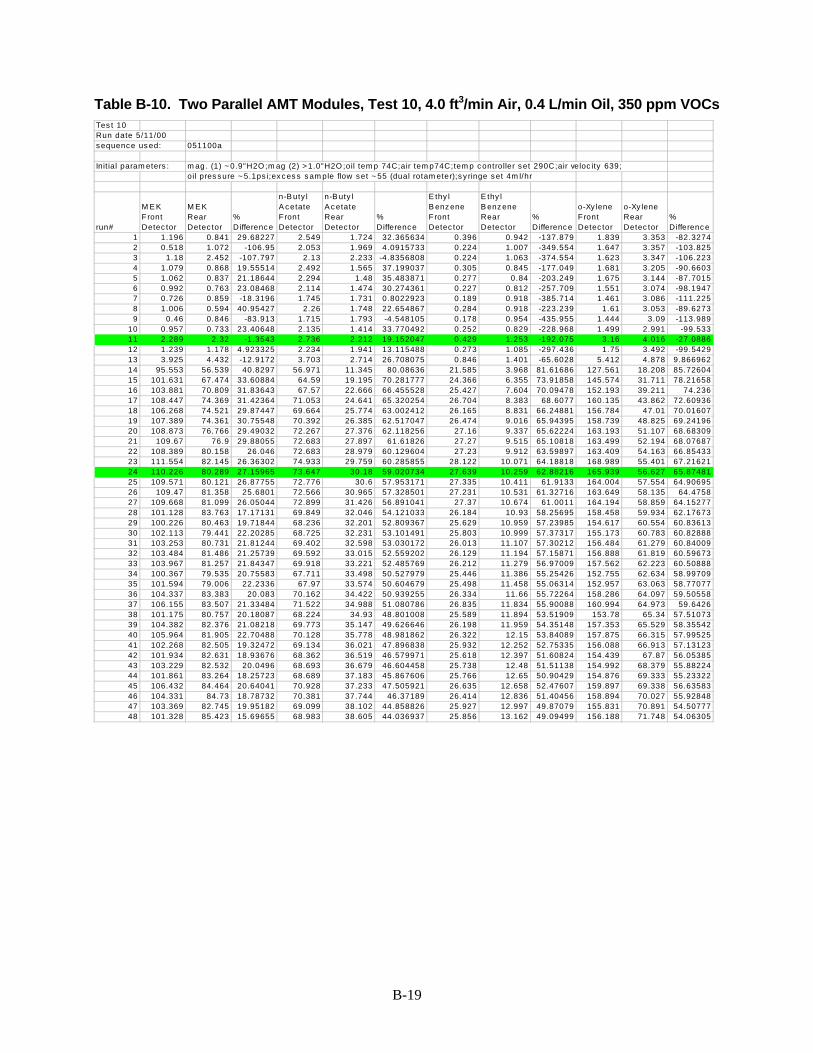
B-19
Table B-10. Two Parallel AMT Modules, Test 10, 4.0 ft3/min Air, 0.4 L/min Oil, 350 ppm VOCs Tes t 10 Run date 5/11/00sequence us ed: 051100a
Init ial param eters : m ag. (1) ~ 0.9"H2O;m ag (2) > 1.0"H2O ;oil tem p 74C;air tem p74C;tem p controller set 290C;air veloc ity 639;oil pres sure ~ 5.1ps i;ex c es s s am ple flow set ~ 55 (dual rotam eter);s y ringe set 4m l/hr
run#
M E K Front Detec tor
M E K Rear Detec tor
% Differenc e
n-B uty l A cetate F ront Detec tor
n-B uty l A c etate Rear Detec tor
% Difference
E thy l B enz ene Front Detec tor
E thy l B enz ene Rear Detec tor
% Differenc e
o-Xy lene Front Detec tor
o-Xy lene Rear Detec tor
% Differenc e
1 1.196 0.841 29.68227 2.549 1.724 32.365634 0.396 0.942 -137.879 1.839 3.353 -82.32742 0.518 1.072 -106.95 2.053 1.969 4.0915733 0.224 1.007 -349.554 1.647 3.357 -103.8253 1.18 2.452 -107.797 2.13 2.233 -4.8356808 0.224 1.063 -374.554 1.623 3.347 -106.2234 1.079 0.868 19.55514 2.492 1.565 37.199037 0.305 0.845 -177.049 1.681 3.205 -90.66035 1.062 0.837 21.18644 2.294 1.48 35.483871 0.277 0.84 -203.249 1.675 3.144 -87.70156 0.992 0.763 23.08468 2.114 1.474 30.274361 0.227 0.812 -257.709 1.551 3.074 -98.19477 0.726 0.859 -18.3196 1.745 1.731 0.8022923 0.189 0.918 -385.714 1.461 3.086 -111.2258 1.006 0.594 40.95427 2.26 1.748 22.654867 0.284 0.918 -223.239 1.61 3.053 -89.62739 0.46 0.846 -83.913 1.715 1.793 -4.548105 0.178 0.954 -435.955 1.444 3.09 -113.989
10 0.957 0.733 23.40648 2.135 1.414 33.770492 0.252 0.829 -228.968 1.499 2.991 -99.53311 2.289 2.32 -1.3543 2.736 2.212 19.152047 0.429 1.253 -192.075 3.16 4.016 -27.088612 1.239 1.178 4.923325 2.234 1.941 13.115488 0.273 1.085 -297.436 1.75 3.492 -99.542913 3.925 4.432 -12.9172 3.703 2.714 26.708075 0.846 1.401 -65.6028 5.412 4.878 9.86696214 95.553 56.539 40.8297 56.971 11.345 80.08636 21.585 3.968 81.61686 127.561 18.208 85.7260415 101.631 67.474 33.60884 64.59 19.195 70.281777 24.366 6.355 73.91858 145.574 31.711 78.2165816 103.881 70.809 31.83643 67.57 22.666 66.455528 25.427 7.604 70.09478 152.193 39.211 74.23617 108.447 74.369 31.42364 71.053 24.641 65.320254 26.704 8.383 68.6077 160.135 43.862 72.6093618 106.268 74.521 29.87447 69.664 25.774 63.002412 26.165 8.831 66.24881 156.784 47.01 70.0160719 107.389 74.361 30.75548 70.392 26.385 62.517047 26.474 9.016 65.94395 158.739 48.825 69.2419620 108.873 76.766 29.49032 72.267 27.376 62.118256 27.16 9.337 65.62224 163.193 51.107 68.6830921 109.67 76.9 29.88055 72.683 27.897 61.61826 27.27 9.515 65.10818 163.499 52.194 68.0768722 108.389 80.158 26.046 72.683 28.979 60.129604 27.23 9.912 63.59897 163.409 54.163 66.8543323 111.554 82.145 26.36302 74.933 29.759 60.285855 28.122 10.071 64.18818 168.989 55.401 67.2162124 110.226 80.289 27.15965 73.647 30.18 59.020734 27.639 10.259 62.88216 165.939 56.627 65.8748125 109.571 80.121 26.87755 72.776 30.6 57.953171 27.335 10.411 61.9133 164.004 57.554 64.9069526 109.47 81.358 25.6801 72.566 30.965 57.328501 27.231 10.531 61.32716 163.649 58.135 64.475827 109.668 81.099 26.05044 72.899 31.426 56.891041 27.37 10.674 61.0011 164.194 58.859 64.1527728 101.128 83.763 17.17131 69.849 32.046 54.121033 26.184 10.93 58.25695 158.458 59.934 62.1767329 100.226 80.463 19.71844 68.236 32.201 52.809367 25.629 10.959 57.23985 154.617 60.554 60.8361330 102.113 79.441 22.20285 68.725 32.231 53.101491 25.803 10.999 57.37317 155.173 60.783 60.8288831 103.253 80.731 21.81244 69.402 32.598 53.030172 26.013 11.107 57.30212 156.484 61.279 60.8400932 103.484 81.486 21.25739 69.592 33.015 52.559202 26.129 11.194 57.15871 156.888 61.819 60.5967333 103.967 81.257 21.84347 69.918 33.221 52.485769 26.212 11.279 56.97009 157.562 62.223 60.5088834 100.367 79.535 20.75583 67.711 33.498 50.527979 25.446 11.386 55.25426 152.755 62.634 58.9970935 101.594 79.006 22.2336 67.97 33.574 50.604679 25.498 11.458 55.06314 152.957 63.063 58.7707736 104.337 83.383 20.083 70.162 34.422 50.939255 26.334 11.66 55.72264 158.286 64.097 59.5055837 106.155 83.507 21.33484 71.522 34.988 51.080786 26.835 11.834 55.90088 160.994 64.973 59.642638 101.175 80.757 20.18087 68.224 34.93 48.801008 25.589 11.894 53.51909 153.78 65.34 57.5107339 104.382 82.376 21.08218 69.773 35.147 49.626646 26.198 11.959 54.35148 157.353 65.529 58.3554240 105.964 81.905 22.70488 70.128 35.778 48.981862 26.322 12.15 53.84089 157.875 66.315 57.9952541 102.268 82.505 19.32472 69.134 36.021 47.896838 25.932 12.252 52.75335 156.088 66.913 57.1312342 101.934 82.631 18.93676 68.362 36.519 46.579971 25.618 12.397 51.60824 154.439 67.87 56.0538543 103.229 82.532 20.0496 68.693 36.679 46.604458 25.738 12.48 51.51138 154.992 68.379 55.8822444 101.861 83.264 18.25723 68.689 37.183 45.867606 25.766 12.65 50.90429 154.876 69.333 55.2332245 106.432 84.464 20.64041 70.928 37.233 47.505921 26.635 12.658 52.47607 159.897 69.338 56.6358346 104.331 84.73 18.78732 70.381 37.744 46.37189 26.414 12.836 51.40456 158.894 70.027 55.9284847 103.369 82.745 19.95182 69.099 38.102 44.858826 25.927 12.997 49.87079 155.831 70.891 54.5077748 101.328 85.423 15.69655 68.983 38.605 44.036937 25.856 13.162 49.09499 156.188 71.748 54.06305

B-21
0
20
40
60
80
100
120
140
160
180
0 5 10 15 20 25 30 35 40 45 50
Sample #
ppm
MEK inletMEK outletButyl acetate inletButyl acetate outletEthylbenzene inletEthylbenzene outletXylene inletXylene outlet
0
20
40
60
80
100
120
140
160
180
0 5 10 15 20 25 30 35 40 45 50
Sample #
ppm
MEK inletMEK outletButyl acetate inletButyl acetate outletEthylbenzene inletEthylbenzene outletXylene inletXylene outlet
Figure B-10. Two Parallel AMT Modules, Test 10, 4.0 ft3/min Air, 0.4 L/min Oil, 350 ppm VOCs
B-20

B-21
Table B-11. Two Parallel AMT Modules, Test 11, 4.0 ft3/min Air, 1.0 L/min Oil, 350 ppm VOCs Tes t 11Run date 5/12/00
Init ial param eters : tem p c ontroller s et 290C;air veloc ity ~ 4c fm ;m ag (1) ~ 0.9"H2O;m ag (2) > 1.0 "H2Ooil flow 1L/m in;ex ces s s am ple flow s et ~ 55 (dual rotam eter);sy ringe s et 4m l/hr
run#
M E K Front Detec tor
M E K Rear Detec tor
% Differenc e
n-B uty l A cetate F ront Detec tor
n-B uty l A c etate Rear Detec tor
% Difference
E thy l B enz ene Front Detec tor
E thy l B enz ene Rear Detec tor
% Differenc e
o-Xy lene Front Detec tor
o-Xy lene Rear Detec tor
% Differenc e
1 0.167 0 100 0.6 0 100 0.0804 0 100 0.633 0 1002 0.185 0.0944 48.97297 0.623 1.609 -158.26645 0.0779 0.902 -1057.89 0.637 3.743 -487.5983 0.161 0 100 0.541 1.505 -178.18854 0.0821 0.838 -920.706 0.638 0.434 31.974924 0.175 0.708 -304.571 0.581 1.807 -211.01549 0.0783 1.022 -1205.24 0.594 3.915 -559.0915 0.165 0 100 0.603 1.693 -180.76285 0.0758 1.063 -1302.37 0.59 3.975 -573.7296 0.141 0.117 17.02128 0.589 1.755 -197.96265 0.0707 0.943 -1233.8 0.574 3.531 -515.1577 0.164 0 100 0.565 1.287 -127.78761 0.0743 0.798 -974.024 0.568 3.459 -508.9798 0.166 0 100 0.527 1.332 -152.75142 0.0681 0.778 -1042.44 0.576 3.328 -477.7789 0.17 0 100 0.541 1.231 -127.54159 0.0657 0.753 -1046.12 0.56 3.375 -502.679
10 0.167 0 100 0.551 1.365 -147.7314 0.0693 0.822 -1086.15 0.566 3.473 -513.60411 0.138 0 100 0.593 1.522 -156.66105 0.0672 0.908 -1251.19 0.572 3.533 -517.65712 0.438 0.336 23.28767 0.746 1.696 -127.34584 0.102 0.984 -864.706 0.596 3.714 -523.15413 2.651 1.749 34.0249 2.063 2.051 0.5816772 0.421 1.135 -169.596 3.456 4.706 -36.16914 91.613 28.112 69.3144 56.414 8.005 85.81026 19.254 2.735 85.79516 129.88 14.008 89.2146615 98.666 31.338 68.2383 62.718 10.845 82.708313 21.261 3.605 83.04407 144.055 19.688 86.33316 99.243 32.387 67.36596 63.42 11.947 81.162094 21.449 4.03 81.21125 145.064 22.469 84.5109717 100.032 30.637 69.3728 64.249 11.61 81.92968 21.706 3.974 81.6917 146.984 22.642 84.595618 94.5 29.651 68.62328 60.395 12.265 79.692027 20.353 4.131 79.70324 137.525 24.148 82.4410119 90.672 33.68 62.85513 59.439 13.621 77.084069 20.017 4.561 77.21437 135.864 26.633 80.3973120 96.57 35.03 63.72579 63.161 13.945 77.921502 21.264 4.663 78.07092 144.393 27.308 81.0877321 99.858 35.457 64.49258 64.854 14.348 77.876461 21.827 4.77 78.14633 148.138 27.837 81.2087422 98.082 32.521 66.84305 63.905 13.233 79.2927 21.485 4.428 79.39027 145.832 25.713 82.3680723 98.47 34.158 65.31126 63.999 13.686 78.615291 21.586 4.515 79.08367 146.387 26.379 81.9799624 101.48 33.959 66.53626 64.88 14.239 78.053329 21.836 4.758 78.21029 147.465 27.904 81.0775425 85.385 30.279 64.53827 56.963 13.195 76.835841 19.152 4.413 76.95802 130.192 25.873 80.1270426 91.338 33.577 63.23874 60.568 14.286 76.413288 20.385 4.739 76.75251 138.598 27.571 80.1072227 93.357 31.704 66.04004 61.75 14.047 77.251822 20.781 4.634 77.70078 141.376 27.457 80.5787428 100.211 37.655 62.42428 66.06 15.774 76.121708 22.253 5.16 76.81212 151.244 30.325 79.9496229 102.656 39.426 61.59406 67.151 16.39 75.592322 22.601 5.347 76.34175 153.35 31.62 79.380530 103.548 36.538 64.71395 67.276 15.683 76.688567 22.657 5.104 77.47275 153.487 30.468 80.1494631 89.665 32.365 63.90453 58.708 14.843 74.717245 19.708 4.918 75.04567 133.521 28.991 78.2873132 87.894 33.585 61.7892 58.912 15.131 74.315929 19.798 4.972 74.88635 134.829 29.466 78.1456533 94.948 35.449 62.66483 62.748 15.893 74.671703 21.113 5.226 75.24748 143.379 30.457 78.757734 100.195 38.518 61.55696 65.998 16.743 74.631049 22.194 5.461 75.39425 150.839 32.06 78.7455535 99.847 37.44 62.50263 65.791 16.398 75.075618 22.113 5.299 76.03672 150.372 31.394 79.1224436 98.724 35.81 63.72716 65.309 16.438 74.830422 21.986 5.332 75.7482 149.493 31.627 78.8438337 103.372 36.414 64.77383 66.509 16.883 74.615466 22.371 5.536 75.25368 150.98 32.694 78.3454838 89.169 35.871 59.77189 59.61 16.98 71.514847 20.037 5.524 72.431 136.233 32.705 75.9933339 94.252 37.411 60.30747 62.548 17.222 72.465946 21.039 5.595 73.40653 143.013 32.766 77.088840 96.381 35.333 63.34028 63.457 16.468 74.048568 21.337 5.39 74.73872 144.757 31.599 78.17141 98.367 37.034 62.3512 64.804 16.801 74.074131 21.788 5.527 74.63283 148.01 32.43 78.0893242 101.793 38.27 62.40409 66.393 17.483 73.667405 22.322 5.7 74.46465 151.408 33.421 77.9265343 102.717 34.905 66.01828 66.874 17.203 74.275503 22.488 5.643 74.90662 152.081 33.305 78.1004944 94.515 40.619 57.02375 62.536 19.612 68.638864 21.007 6.327 69.88147 142.765 37.854 73.485145 94.499 41.676 55.89795 63.291 19.767 68.768071 21.263 6.387 69.96191 144.796 37.778 73.909546 98.897 41.753 57.78133 65.393 19.723 69.839279 22.001 6.359 71.09677 149.575 37.681 74.8079647 97.976 37.6 61.62325 64.447 17.891 72.239204 21.652 5.824 73.10179 147.029 34.187 76.7481248 97.06 36.067 62.84051 64.099 17.405 72.84669 21.539 5.631 73.85673 146.46 33.412 77.1869549 99.215 34.905 64.81883 65.123 17.112 73.723569 21.893 5.58 74.5124 148.642 32.978 77.8138150 99.981 39.438 60.55451 64.974 19.932 69.323114 21.82 6.451 70.43538 147.667 38.622 73.84521

B-22
Figure B-11. Two Parallel AMT Modules, Test 11, 4.0 ft3/min Air, 1.0 L/min Oil, 350 ppm VOCs
0
20
40
60
80
100
120
140
160
180
0 5 10 15 20 25 30 35 40 45 50
Sample #
ppm
MEK inletMEK outletButyl acetate inletButyl acetate outletEthylbenzene inletEthylbenzene outletXylene inletXylene outlet
0
20
40
60
80
100
120
140
160
180
0 5 10 15 20 25 30 35 40 45 50
Sample #
ppm
MEK inletMEK outletButyl acetate inletButyl acetate outletEthylbenzene inletEthylbenzene outletXylene inletXylene outlet

B-23
Table B-12. Two Parallel AMT Modules, Test 14, 4.0 ft3/min Air, 1.0 L/min Oil, 350 ppm VOCs Tes t 14Run date 6/06/00
Init ial param eters : s y ringe set 4.0m l/hr;air 4c fm (1380-1390);s am ple flow rate 55c c 's ; injec tion tem p 290C;oil pres sure s et at 25ps i(11.2 at the m odule);
run#
M E K Front Detec tor
M E K Rear Detec tor
% Differenc e
n-B uty l A cetate F ront Detec tor
n-B uty l A c etate Rear Detec tor
% Difference
E thy l B enz ene Front Detec tor
E thy l B enz ene Rear Detec tor
% Differenc e
o-Xy lene Front Detec tor
o-Xy lene Rear Detec tor
% Differenc e
1 105.47 96.546 8.461174 46.818 22.832 51.232432 12.325 5.277 57.18458 39.746 15.632 60.670262 105.427 100.266 4.89533 47.38 24.09 49.155762 12.481 5.569 55.38018 40.365 16.462 59.217143 105.966 100.33 5.318687 47.578 24.867 47.734247 12.519 5.74 54.14969 40.482 16.911 58.225884 115.016 105.482 8.289281 51.301 25.81 49.68909 13.508 6.022 55.41901 43.632 17.982 58.787135 300.907 184.784 38.59099 129.936 25.698 80.222571 34.11 5.521 83.81413 109.754 15.308 86.052446 249.146 195.881 21.37903 115.282 29.271 74.609219 30.238 6.112 79.78702 98.35 16.631 83.089987 106.579 108.212 -1.5322 50.156 30.601 38.988356 13.117 6.932 47.15255 42.555 20.095 52.778768 106.103 108.816 -2.55695 49 29.572 39.64898 12.852 6.749 47.48677 41.613 19.784 52.457169 110.194 111.831 -1.48556 50.329 30.206 39.982912 13.215 6.837 48.26334 42.797 19.884 53.5388
10 108.751 111.051 -2.11492 49.584 30.4 38.6899 13.017 6.877 47.16909 42.149 20.03 52.4781111 109.137 110.57 -1.31303 49.243 30.717 37.621591 12.923 6.944 46.26635 41.748 20.117 51.8132612 107.887 110.557 -2.47481 49.189 30.786 37.412836 12.916 6.963 46.09012 41.788 20.216 51.6224813 109.278 111.426 -1.96563 49.377 30.869 37.483039 12.961 7.003 45.96868 41.859 20.387 51.2960214 108.253 110.739 -2.29647 48.737 31.175 36.034225 12.785 7.074 44.66953 41.28 20.63 50.0242215 106.088 111.303 -4.91573 48.138 31.451 34.664922 12.645 7.178 43.23448 40.934 20.991 48.7198916 106.963 113.362 -5.98244 48.702 32.115 34.05815 12.802 7.316 42.85268 41.441 21.317 48.560617 110.332 115.603 -4.7774 50.225 32.712 34.869089 13.185 7.449 43.50398 42.718 21.651 49.3164518 111.105 114.675 -3.21318 50.136 33.131 33.917744 13.155 7.535 42.7214 42.517 21.893 48.5076619 109.971 114.096 -3.75099 49.862 33.618 32.577915 13.085 7.635 41.65075 42.346 22.144 47.7069920 107.338 112.593 -4.89575 48.896 33.756 30.963678 12.812 7.691 39.97034 41.449 22.328 46.1313921 106.586 111.945 -5.02786 48.382 33.901 29.930553 12.699 7.73 39.12907 41.107 22.463 45.3548122 105.332 112.315 -6.62951 47.729 34.403 27.920132 12.524 7.853 37.29639 40.555 22.821 43.7282723 106.985 115.814 -8.25256 49.054 35.02 28.609288 12.869 8.005 37.79625 41.731 23.249 44.2884224 109.767 116.539 -6.16943 49.76 35.309 29.041399 13.051 8.074 38.13501 42.206 23.442 44.4581325 110.551 115.57 -4.53999 50.304 35.538 29.353531 13.187 8.145 38.23463 42.707 23.715 44.4704626 109.347 115.847 -5.94438 49.865 35.873 28.059761 13.061 8.216 37.09517 42.297 23.873 43.5586427 110.497 116.581 -5.50603 50.167 36.183 27.874898 13.159 8.289 37.00889 42.607 24.07 43.5069428 117.356 119.363 -1.71018 52.779 36.61 30.635291 13.856 8.352 39.72286 44.783 24.181 46.0040629 115.04 120.343 -4.6097 52.095 37.604 27.816489 13.65 8.552 37.34799 44.101 24.683 44.0307530 107.769 117.988 -9.48232 49.645 38.11 23.234968 12.967 8.71 32.82949 42.035 25.161 40.1427431 111.199 118.72 -6.76355 50.758 38.282 24.579377 13.283 8.749 34.13386 42.998 25.304 41.1507532 110.964 117.973 -6.31646 50.516 38.262 24.257661 13.216 8.762 33.70157 42.791 25.386 40.6744433 108.632 116.986 -7.69018 49.734 38.276 23.038565 13.024 8.782 32.57064 42.224 25.465 39.690734 106.497 113.877 -6.92977 48.584 38.201 21.371233 12.734 8.798 30.90938 41.206 25.558 37.9750535 105.282 112.155 -6.52818 47.979 38.387 19.99208 12.564 8.855 29.52085 40.633 25.724 36.6918536 102.929 111.133 -7.97054 47.052 38.27 18.664456 12.304 8.879 27.83648 39.825 25.9 34.9654737 100.181 109.982 -9.78329 46.052 38.283 16.87006 12.023 8.893 26.03344 38.935 25.963 33.3170738 103.344 113.257 -9.59224 47.655 38.827 18.524814 12.447 9.007 27.63718 40.304 26.223 34.93698
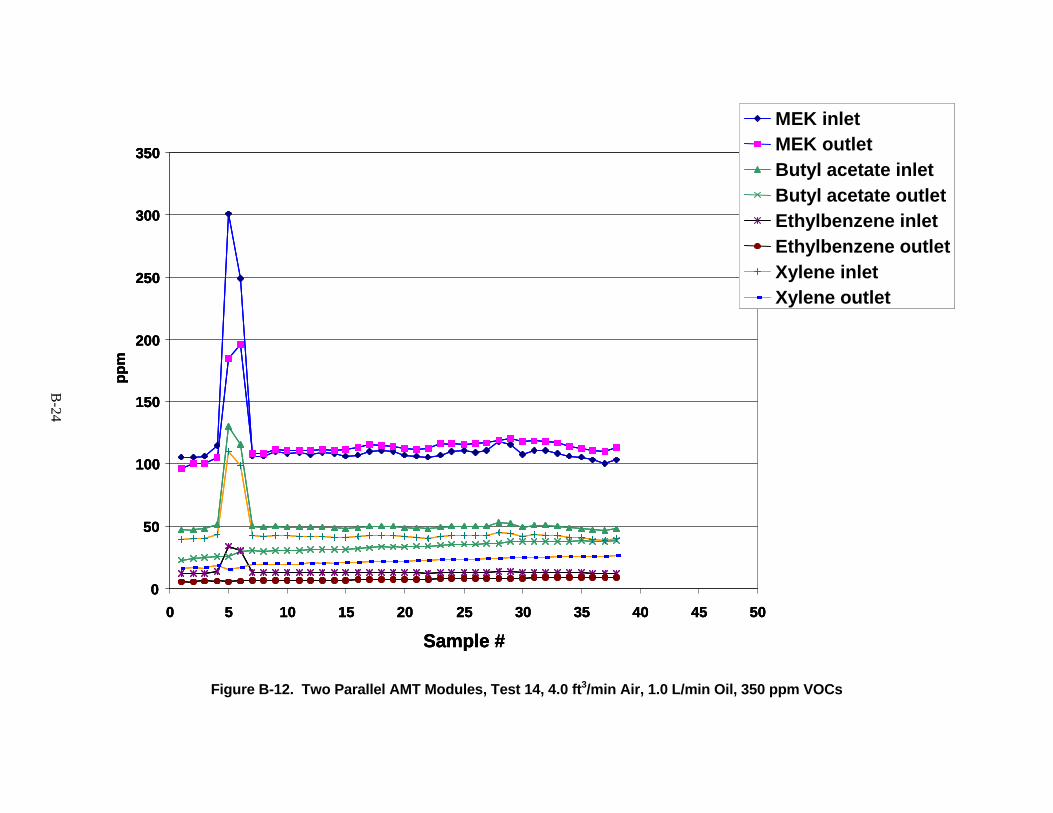
B-24
Figure B-12. Two Parallel AMT Modules, Test 14, 4.0 ft3/min Air, 1.0 L/min Oil, 350 ppm VOCs
0
50
100
150
200
250
300
350
0 5 10 15 20 25 30 35 40 45 50
Sample #
ppm
MEK inletMEK outletButyl acetate inletButyl acetate outletEthylbenzene inletEthylbenzene outletXylene inletXylene outlet
0
50
100
150
200
250
300
350
0 5 10 15 20 25 30 35 40 45 50
Sample #
ppm
MEK inletMEK outletButyl acetate inlet
0
50
100
150
200
250
300
350
0 5 10 15 20 25 30 35 40 45 50
Sample #
ppm
MEK inletMEK outletButyl acetate inletButyl acetate outletEthylbenzene inletEthylbenzene outletXylene inletXylene outlet

B-25
Table B-13. Two Parallel AMT Modules, Test 15, 2.0 ft3/min Air, 1.0 L/min Oil, 220 ppm VOCs Tes t 15Run date 6/07/00
Init ial param eters : s am ple flow rate 55c c 's ;sy ringe s et 2.0 m l/hr;air veloc ity ~ 2.0c fm (~ 500);
run#
M E K Front Detec tor
M E K Rear Detec tor
% Differenc e
n-B uty l A cetate F ront Detec tor
n-B uty l A c etate Rear Detec tor
% Difference
E thy l B enz ene Front Detec tor
E thy l B enz ene Rear Detec tor
% Differenc e
o-Xy lene Front Detec tor
o-Xy lene Rear Detec tor
% Differenc e
1 6.728 9.096 -35.1962 2.91 1.099 62.233677 0.81 0.277 65.80247 3.051 0.605 80.170442 13.384 34.031 -154.266 5.574 10.914 -95.801938 1.54 2.23 -44.8052 5.282 5.125 2.9723593 11.191 34.246 -206.014 5.035 13.751 -173.10824 1.353 3.169 -134.22 4.752 7.707 -62.18434 7.336 31.168 -324.864 3.705 15.283 -312.49663 0.973 3.57 -266.906 3.612 8.931 -147.2595 6.317 29.131 -361.152 3.055 16.239 -431.55483 0.82 3.802 -363.659 3.089 9.616 -211.2986 0 16.805 #DIV /0! 0.916 16.066 -1653.9301 0.195 3.85 -1874.36 0.932 9.94 -966.5247 0 4.907 #DIV /0! 0 13.229 #DIV /0! 0.0984 3.43 -3385.77 0.446 9.209 -1964.88 0 1.544 #DIV /0! 0 10.756 #DIV /0! 0.0786 3.002 -3719.34 0.341 8.363 -2352.499 0 8.601 #DIV /0! 0 9.206 #DIV /0! 0.065 2.672 -4010.77 0.28 7.599 -2613.93
10 0 14.966 #DIV /0! 0 12.432 #DIV /0! 0.0883 3.174 -3494.56 0.371 8.572 -2210.5111 41.27 35.461 14.0756 15.282 14.993 1.8911137 4.183 3.613 13.62658 13.417 9.544 28.8663612 48.805 52.175 -6.90503 21.061 18.214 13.517877 5.565 4.236 23.8814 18.133 11.143 38.548513 38.646 48.678 -25.9587 17.554 19.345 -10.202803 4.607 4.519 1.910137 15.096 11.964 20.7472214 123.869 62.397 49.62662 46.728 20.095 56.995806 12.385 4.675 62.25273 39.116 12.51 68.018215 129.843 105.223 18.96136 55.723 24.799 55.495935 14.551 5.548 61.87204 46.852 14.712 68.5989916 117.593 103.599 11.90037 51.623 27.364 46.99262 13.426 6.13 54.34232 43.32 16.406 62.1283517 119.69 100.921 15.68134 52.435 28.592 45.471536 13.631 6.434 52.79877 43.908 17.402 60.3671318 115.268 103.62 10.10515 51.258 29.534 42.381677 13.294 6.671 49.81947 42.938 18.15 57.7297519 121.178 109.174 9.906089 54.391 30.17 44.531264 14.115 6.817 51.70386 45.654 18.601 59.2565820 113.387 106.705 5.893092 51.57 30.96 39.965096 13.367 6.991 47.69956 43.248 19.128 55.7713721 117.521 109.113 7.154466 52.625 31.509 40.125416 13.648 7.215 47.13511 44.043 19.772 55.1075122 112.831 107.851 4.413681 51.287 31.716 38.159768 13.281 7.181 45.93028 43.031 19.778 54.0377923 115.453 106.038 8.154834 51.497 31.819 38.211935 13.344 7.236 45.77338 43.059 19.988 53.5799724 112.24 106.683 4.950998 51.037 32.071 37.161275 13.208 7.299 44.73804 42.711 20.212 52.677325 107.861 105.151 2.512493 48.986 32.237 34.191402 12.669 7.346 42.01594 40.973 20.338 50.3624326 111.484 109.778 1.530264 51.237 32.908 35.772977 13.248 7.559 42.94233 42.946 20.893 51.3505327 105.621 107.633 -1.90492 48.806 33.159 32.059583 12.616 7.656 39.31516 40.958 21.184 48.2787228 112.309 110.408 1.692652 51.428 33.397 35.060667 13.3 7.691 42.17293 43.153 21.276 50.6963629 113.297 108.437 4.28961 51.381 33.549 34.705436 13.292 7.762 41.60397 43.009 21.472 50.0755730 108.576 101.77 6.26842 47.691 32.715 31.402151 12.379 7.623 38.4199 39.878 21.117 47.0459931 107.545 107.399 0.135757 48.785 33.54 31.249359 12.662 7.758 38.73006 40.833 21.5 47.3465132 111.265 109.18 1.873905 50.511 33.99 32.707727 13.069 7.853 39.91124 42.305 21.754 48.5781833 111.241 112.387 -1.0302 51.243 34.594 32.490291 13.246 7.979 39.76295 42.977 22.084 48.6143834 105.404 110.399 -4.73891 49.118 34.774 29.203143 12.697 8.042 36.6622 41.257 22.291 45.9703835 113.319 111.859 1.288398 51.465 34.855 32.274361 13.318 8.069 39.41282 43.094 22.449 47.90693637 112.005 118.259 -5.58368 51.19 34.465 32.672397 13.215 7.875 40.40863 42.856 22.11 48.4086238 110.054 116.358 -5.7281 50.602 35.111 30.613414 13.066 8.042 38.45094 42.371 22.664 46.5105939 107.841 108.451 -0.56565 49.64 35.183 29.123691 12.822 8.032 37.35767 41.566 22.582 45.6719440 118.185 113.142 4.267039 53.58 35.505 33.734602 13.856 8.11 41.4694 44.817 22.755 49.2268641 109.017 116.007 -6.41184 50.772 37.108 26.912471 13.1 8.527 34.9084 42.541 23.552 44.6369442 111.357 112.726 -1.22938 51.069 37.043 27.464803 13.197 8.525 35.40199 42.744 23.6 44.7875743 112.028 113.582 -1.38715 51.283 37.274 27.317045 13.245 8.61 34.99434 42.887 23.836 44.4213944 109.266 111.869 -2.38226 50.268 37.304 25.789767 12.977 8.611 33.64414 42.027 23.891 43.1532145 110.727 115.051 -3.9051 51.107 38.477 24.712857 13.198 9.082 31.18654 42.734 24.068 43.67951

B-26
Figure B-13. Two Parallel AMT Modules, Test 15, 2.0 ft3/min Air, 1.0 L/min Oil, 220 ppm VOCs
Test 15 - 2 Parallel Modules2.0 cfm air, 1.0 lpm oil
220 ppm
0
20
40
60
80
100
120
140
0 5 10 15 20 25 30 35 40 45 50
Sample #
ppm
MEK inletMEK outletButyl acetate inletButyl acetate outletEthylbenzene inletEthylbenzene outletXylene inletXylene outlet
Test 15 - 2 Parallel Modules2.0 cfm air, 1.0 lpm oil
220 ppm
0
20
40
60
80
100
120
140
0 5 10 15 20 25 30 35 40 45 50
Sample #
ppm
MEK inletMEK outletButyl acetate inletButyl acetate outletEthylbenzene inletEthylbenzene outletXylene inletXylene outlet

B-27
Table B-14. Two Parallel AMT Modules, Test 16, 8.0 ft3/min Air, 1.0 L/min Oil, 200 ppm VOCs Tes t 16Run date 6/08/00
Init ial param eters : s am ple flow rate ~ 50 cc 's ;m ag(1) 1.75"H20;m ag(2) > 1.0"H20;air veloc ity ~ 8.0c fmoil pres sure 11.5ps i (on m odule);s y ringe flow 8.0m l/hr;oil sa m pling tim e 120 m in .
run#
M E K Front Detec tor
M E K Rear Detec tor
% Differenc e
n-B uty l A cetate F ront Detec tor
n-B uty l A c etate Rear Detec tor
% Difference
E thy l B enz ene Front Detec tor
E thy l B enz ene Rear Detec tor
% Differenc e
o-Xy lene Front Detec tor
o-Xy lene Rear Detec tor
% Differenc e
1 4.372 10.217 -133.692 1.726 9.928 -475.20278 0.528 2.653 -402.462 2.07 7.494 -262.0292 5.958 12.334 -107.016 2.579 10.821 -319.58123 0.734 2.869 -290.872 2.744 8.208 -199.1253 104.996 98.911 5.795459 44.006 30.255 31.248012 11.614 7.203 37.98002 37.457 20.648 44.875464 106.824 99.866 6.513518 45.573 35.676 21.716806 11.917 8.605 27.79223 38.428 25.219 34.373375 102.041 101.48 0.549779 45.093 37.504 16.829663 11.758 9.114 22.48682 38.144 27.003 29.207746 104.018 101.963 1.97562 45.89 38.17 16.822837 11.933 9.321 21.88888 38.668 27.871 27.922317 104.187 97.588 6.333804 45.683 38.365 16.019088 11.879 9.439 20.54045 38.365 28.465 25.804778 99.362 101.927 -2.58147 44.865 39.336 12.323638 11.636 9.63 17.2396 37.807 29.057 23.143869 104.011 102.392 1.556566 46.309 39.604 14.478827 12.017 9.705 19.23941 38.902 29.294 24.69796
10 105.478 101.654 3.625401 47.044 40.09 14.781906 12.198 9.823 19.4704 39.539 29.691 24.9070511 100.835 103.876 -3.01582 45.543 41.013 9.9466438 11.799 10.053 14.79786 38.31 30.37 20.7256612 104.359 104.31 0.046953 46.963 41.309 12.039265 12.174 10.117 16.89667 39.52 30.574 22.6366413 103.067 101.524 1.497084 46.281 40.838 11.760766 12 10.02 16.5 38.903 30.36 21.9597514 100.093 102.068 -1.97316 45.314 41.307 8.8427418 11.723 10.145 13.46072 38.045 30.803 19.0353515 101.703 103.98 -2.23887 46.066 41.339 10.261364 11.932 10.137 15.04358 38.765 30.824 20.4849716 103.974 103.048 0.890607 46.511 41.046 11.749909 12.043 10.112 16.03421 38.974 30.808 20.9524317 98.924 101.736 -2.84259 44.83 41.295 7.8853446 11.602 10.184 12.22203 37.675 31.076 17.5155918 7.051 21.364 -202.992 7.433 25.178 -238.73268 1.842 6.744 -266.124 6.596 21.383 -224.18119 8.567 17.154 -100.233 5.703 18.361 -221.95336 1.49 4.986 -234.631 5.245 16.016 -205.35720 96.129 81.157 15.5749 39.473 25.829 34.565399 10.348 6.415 38.00734 33.104 19.249 41.8529521 98.473 92.166 6.404801 42.91 35.465 17.350268 11.144 8.685 22.06569 35.981 26.169 27.2699522 98.099 100.21 -2.15191 44.061 39.362 10.66476 11.414 9.66 15.36709 37.063 29.144 21.3663223 5.387 22.932 -325.691 7.155 25.476 -256.0587 1.759 6.666 -278.965 6.363 21.135 -232.15524 12.629 19.566 -54.9291 6.981 18.011 -158.00029 1.824 4.818 -164.145 6.28 15.482 -146.52925 0 10.76 #DIV /0! 2.155 15.932 -639.30394 0.531 4.37 -722.976 2.345 13.937 -494.32826 109.227 115.757 -5.97838 50.742 38.5 24.125971 13.298 9.269 30.29779 42.884 27.663 35.4934227 2.216 13.342 -502.076 2.244 19.724 -778.96613 0.808 5.326 -559.158 3.204 16.67 -420.28728 94.879 83.61 11.87723 39.239 27.744 29.294834 10.301 7.092 31.15232 33.137 21.277 35.7908129 96.357 97.082 -0.75241 42.824 37.272 12.964693 11.104 9.082 18.20965 36.067 27.213 24.5487630 101.499 99.005 2.457167 45.101 39.286 12.893284 11.678 9.658 17.29748 37.871 29.137 23.062531 102.192 97.82 4.278221 45.622 39.871 12.60576 11.804 9.853 16.5283 38.298 29.973 21.7374332 99.815 100.198 -0.38371 44.847 40.987 8.6070417 11.595 10.14 12.54851 37.596 30.948 17.6827333 101.665 101.546 0.117051 45.979 41.262 10.259031 11.881 10.208 14.08131 38.619 31.248 19.0864634 105.134 103.295 1.749196 47.261 41.584 12.012018 12.218 10.296 15.73089 39.639 31.624 20.2199935 103.982 101.145 2.728357 46.413 42.068 9.3616013 11.99 10.431 13.0025 38.852 32.138 17.2809636 98.23 102.659 -4.50881 44.96 41.87 6.8727758 11.618 10.426 10.25994 37.782 31.127 17.6142137 103.712 102.89 0.792579 46.627 41.674 10.622601 12.05 10.375 13.90041 39.078 32.001 18.1099338 103.382 100.801 2.496566 46.56 41.532 10.798969 12.034 10.365 13.86904 39.071 32.014 18.0619939 99.235 101.77 -2.55454 45.08 42.219 6.3464951 11.654 10.517 9.756307 37.847 32.487 14.1622840 100.449 104.481 -4.01398 45.973 42.472 7.6153394 11.864 10.576 10.85637 38.64 32.648 15.50725

B-28
Figure B-14. Two Parallel AMT Modules, Test 16, 8.0 ft3/min Air, 1.0 L/min Oil, 200 ppm VOCs
T e s t 1 6 - 2 P a ra lle l M o d u le s8 .0 c fm a ir , 1 .0 lp m o il
2 0 0 p p m
0
20
40
60
80
100
120
140
0 5 10 15 20 25 30 35 40 45 50
S a m p le #
ppm
M E K in le tM E K o u tle tB u ty l a c e ta te in le tB u ty l a c e ta te o u tle tE th y lb e n ze n e in le tE th y lb e n ze n e o u tle tX y le n e in le tX y le n e o u tle t

B-29
Table B-15. Two Parallel AMT Modules, Test 18, 4.0 ft3/min Air, 1.0 L/min Oil, 200 ppm VOCs Tes t 18Run date 6/21/00
Init ial param eters : s am ple flow rate ~ 55 cc 's ;air veloc ity ~ 1.38 (4c fm )oil pres sure 11.0ps i (on m odule);s y ringe flow 4.0m l/hr;us ed "new" s ilic on oil for this run.
run#
M E K Front Detec tor
M E K Rear Detec tor
% Differenc e
n-B uty l A cetate F ront Detec tor
n-B uty l A c etate Rear Detec tor
% Difference
E thy l B enz ene Front Detec tor
E thy l B enz ene Rear Detec tor
% Differenc e
o-Xy lene Front Detec tor
o-Xy lene Rear Detec tor
% Differenc e
1 88.002 74.253 15.62351 38.384 18.968 50.583576 9.834 4.455 54.69799 31.919 12.864 59.697992 98.329 78.066 20.60735 41.959 19.522 53.473629 10.748 4.561 57.5642 34.748 13.265 61.825143 100.382 82.108 18.20446 44.044 20.361 53.771229 11.273 4.753 57.83731 36.618 13.864 62.138844 104.511 90.61 13.30099 45.41 27.819 38.738163 11.636 5.045 56.64318 37.795 14.488 61.666895 106.649 89.638 15.95045 47.186 25.384 46.204383 12.07 5.244 56.55344 39.268 15.223 61.233076 93.856 83.16 11.39618 41.742 22.67 45.690192 10.67 5.246 50.83411 34.727 15.434 55.55627 95.895 81.769 14.7307 42.483 22.552 46.915237 10.872 5.265 51.57285 35.322 15.583 55.883028 109.373 85.859 21.49891 47.383 23.043 51.368634 12.146 5.514 54.60234 39.32 15.846 59.69999 95.189 89.645 5.824202 43.777 24.283 44.530233 11.148 5.756 48.36742 36.518 16.6 54.54297
10 95.905 86.355 9.957771 43.286 24.361 43.720834 11.056 5.78 47.72069 36.053 16.711 53.6487911 97.77 89.541 8.416692 44.145 24.738 43.961944 11.278 5.861 48.03157 36.775 16.953 53.9007512 102.199 90.91 11.0461 45.585 25.125 44.883185 11.679 5.938 49.15661 37.989 17.167 54.810613 98.691 85.092 13.77937 43.932 24.762 43.635619 11.237 5.854 47.90424 36.552 17.085 53.2583714 94.481 86.745 8.18789 42.561 25.279 40.605249 10.874 6.005 44.77653 35.454 17.391 50.9477115 96.441 87.659 9.106086 43.501 25.728 40.856532 11.128 6.076 45.39899 36.279 17.62 51.4319616 95.747 88.644 7.418509 43.024 25.962 39.656936 11.002 6.166 43.95564 35.864 17.847 50.2370117 96.454 89.096 7.628507 43.224 26.093 39.633074 11.039 6.209 43.75396 35.987 17.884 50.3042818 99.554 90.258 9.337646 44.212 26.628 39.772008 11.301 6.343 43.87222 36.746 18.086 50.7810419 103.593 90.436 12.70067 45.5 27.284 40.035165 11.638 6.501 44.13989 37.815 18.397 51.3499920 99.296 92.753 6.589389 44.934 28.513 36.54471 11.467 6.755 41.09183 37.416 18.997 49.227621 121.198 108.551 10.43499 54.427 30.621 43.739321 13.906 7.224 48.0512 45.317 19.986 55.8973522 100.809 106.562 -5.70683 48.806 31.229 36.014015 12.414 7.398 40.40599 40.971 20.654 49.5887323 99.665 94.027 5.656951 45.047 30.085 33.214199 11.516 7.155 37.86905 37.52 20.078 46.4872124 103.82 91.322 12.03814 45.887 29.442 35.838037 11.736 7.073 39.73245 38.08 19.913 47.7074625 95.252 90.674 4.806198 43.298 29.788 31.202365 11.042 7.122 35.50082 36.048 20.062 44.3464326 92.419 89.217 3.464656 42.174 29.426 30.227154 10.742 7.051 34.36045 35.119 20.056 42.8913127 96.198 91.047 5.354581 43.616 29.987 31.247707 11.129 7.189 35.403 36.265 20.41 43.7198428 99.273 93.876 5.436524 44.692 30.2 32.426385 11.413 7.201 36.90528 37.176 20.539 44.7519929 96.808 90.61 6.402363 43.864 30.157 31.24886 11.192 7.213 35.55218 36.515 20.538 43.7546230 93.933 90.179 3.996466 42.589 30.32 28.807908 10.86 7.296 32.81768 35.441 20.732 41.5027831 96.878 92.791 4.218708 43.709 30.782 29.575145 11.149 7.352 34.05687 36.376 20.975 42.33835

B-30
Figure B-15. Two Parallel AMT Modules, Test 18, 4.0 ft3/min Air, 1.0 L/min Oil, 200 ppm VOCs
Test 18 - 2 Parallel Modules4.0 cfm air(1.38)
200 ppm
0
20
40
60
80
100
120
140
0 5 10 15 20 25 30 35 40 45 50
Sample #
ppm
MEK inletMEK outletButyl acetate inletButyl acetate outletEthylbenzene inletEthylbenzene outletXylene inletXylene outlet
Test 18 - 2 Parallel Modules4.0 cfm air(1.38)
200 ppm
0
20
40
60
80
100
120
140
0 5 10 15 20 25 30 35 40 45 50
Sample #
ppm
MEK inletMEK outletButyl acetate inletButyl acetate outletEthylbenzene inletEthylbenzene outletXylene inletXylene outlet

B-31
Table B-16. Two Parallel AMT Modules, Test 19, 8.0 ft3/min Air, 1.0 L/min Oil, 200 ppm VOCs Tes t 19Run date 6/22/00
Init ial param eters : s am ple flow rate ~ 55 cc 's ;air veloc ity ~ 4.75 (8c fm );sy ringe flow rate 8.0m l/hroil pres sure 11.3ps i (on m odule);M ag(1) ~ 1.85"H2O;M ag(2)> 1.0"H2O
run#
M E K Front Detec tor
M E K Rear Detec tor
% Differenc e
n-B uty l A cetate F ront Detec tor
n-B uty l A c etate Rear Detec tor
% Difference
E thy l B enz ene Front Detec tor
E thy l B enz ene Rear Detec tor
% Differenc e
o-Xy lene Front Detec tor
o-Xy lene Rear Detec tor
% Differenc e
1 87.752 6.59 92.4902 31.154 7.001 77.527765 8.579 1.989 76.81548 27.151 5.785 78.693232 98.834 89.061 9.888298 40.464 24.203 40.186338 10.638 5.768 45.77928 34.408 16.5 52.046043 94.184 92.763 1.508749 40.316 30.443 24.489037 10.516 7.336 30.23963 34.138 21.497 37.029124 101.746 102.712 -0.94942 44.876 33.737 24.821731 11.678 8.146 30.2449 38.068 24.035 36.862985 102.679 98.565 4.006662 44.031 36.08 18.057732 11.453 8.75 23.6008 37.066 25.96 29.962776 98.251 100.299 -2.08446 43.699 35.594 18.547335 11.362 8.622 24.11547 36.917 25.749 30.251657 100.983 97.21 3.736272 45.28 35.73 21.090989 11.758 8.676 26.21194 38.308 26.28 31.398148 95.234 99.253 -4.22013 42.497 36.26 14.67633 11.01 8.804 20.03633 35.869 26.615 25.799449 99.428 101.955 -2.54154 44.533 37.29 16.264343 11.54 9.427 18.31023 37.649 28.113 25.32869
10 105.346 98.155 6.826078 46.343 37.472 19.14205 12.032 9.491 21.11868 39.005 28.291 27.4682711 91.263 97.288 -6.6018 41.543 37.211 10.42775 10.741 9.445 12.06592 35.139 28.239 19.636312 101.782 103.667 -1.852 45.488 38.602 15.138058 11.786 9.742 17.34261 38.402 29.115 24.1836413 105.578 98.95 6.277823 46.032 38.622 16.097497 11.934 9.748 18.31741 38.619 29.365 23.962314 98.515 106.406 -8.00995 45.073 40.197 10.818006 11.674 10.124 13.27737 38.195 30.192 20.95315 101.406 103.804 -2.36475 45.902 39.628 13.66825 11.885 10.014 15.74253 38.814 30.052 22.5743316 97.151 101.602 -4.58153 43.782 39.84 9.0037002 11.234 10.087 10.21008 36.951 30.225 18.2024817 100.032 103.511 -3.47789 45.353 40.499 10.70271 11.755 10.269 12.64143 38.385 30.568 20.3647318 103.783 98.832 4.770531 46.622 40.179 13.819656 12.087 10.2 15.61181 39.422 30.52 22.581319 96.901 102.216 -5.48498 43.784 40.842 6.7193495 11.326 10.372 8.423097 36.968 30.918 16.3655120 102.452 105.128 -2.61195 45.858 41.313 9.9110297 11.877 10.466 11.8801 38.689 31.231 19.276821 103.431 99.416 3.881815 46.118 40.477 12.231667 11.956 10.13 15.27267 38.819 30.296 21.9557422 95.778 102.6 -7.12272 43.899 41.546 5.360031 11.346 10.498 7.474 37.128 31.203 15.9583123 102.836 105.654 -2.74029 46.293 41.998 9.2778606 11.984 10.61 11.46529 39.066 31.583 19.1547624 104.194 100.933 3.129739 45.502 42.163 7.338139 11.777 10.701 9.136452 38.208 31.96 16.352625 102.005 107.975 -5.85265 46.444 43.198 6.9890621 12.035 10.97 8.84919 39.317 32.688 16.8603926 104.829 106.848 -1.92599 47.359 42.427 10.414071 12.268 10.8 11.96609 39.961 32.479 18.7232627 94.909 105.07 -10.706 44.112 43.054 2.3984403 11.405 10.979 3.735204 37.366 32.862 12.0537428 101.171 106.11 -4.88183 45.978 43.358 5.6983775 11.898 11.063 7.017986 38.83 32.914 15.2356429 103.834 101.307 2.433692 46.772 42.906 8.265629 12.101 10.977 9.288489 39.426 32.77 16.88226

B-32
Figure B-16. Two Parallel AMT Modules, Test 19, 8.0 ft3/min Air, 1.0 L/min Oil, 200 ppm VOCs
Test 19- 2 Parallel Modules8 cfm air(4.75volts)
200 ppm
0
20
40
60
80
100
120
0 5 10 15 20 25 30 35 40 45 50
Sample #
ppm
MEK inletMEK outletButyl acetate inletButyl acetate outletEthylbenzene inletEthylbenzene outletXylene inletXylene outlet
Test 19- 2 Parallel Modules8 cfm air(4.75volts)
200 ppm
0
20
40
60
80
100
120
0 5 10 15 20 25 30 35 40 45 50
Sample #
ppm
MEK inletMEK outletButyl acetate inletButyl acetate outletEthylbenzene inletEthylbenzene outletXylene inletXylene outlet

B-33
Table B-17. Two Parallel AMT Modules, Test 20, 16.0 ft3/min Air, 1.0 L/min Oil, 200 ppm VOCs
Tes t 20Run date 6/22/00sequence us ed 062200c
Init ial param eters : air veloc ity 16m l/hr (1657 volts );s y ringe flow rate 16m l/hr;s am ple flow s et at 55 c c 's ;M ag(1) > 4.0"H2O ;M ag(2) > 1.0"H2O;oil pres sure at m odule 11.0ps i;sy s tem oil pres s ure ~ 25ps i
run#
M E K Front Detec tor
M E K Rear Detec tor
% Differenc e
n-B uty l A cetate F ront Detec tor
n-B uty l A c etate Rear Detec tor
% Difference
E thy l B enz ene Front Detec tor
E thy l B enz ene Rear Detec tor
% Differenc e
o-Xy lene Front Detec tor
o-Xy lene Rear Detec tor
% Differenc e
1 0 1.251 #DIV /0! 0 3.419 #DIV /0! 0.101 1.258 -1145.54 0.481 4.407 -816.2162 94.2 81.32 13.67304 39.143 14.503 62.948675 10.293 3.84 62.69309 32.703 11.25 65.599493 100.263 89.618 10.61708 42.406 30.555 27.946517 11.213 7.81 30.3487 36.398 23.817 34.565094 91.144 91.918 -0.84921 41.958 31.763 24.298108 10.98 8.116 26.08379 36.301 25.025 31.062515 96.268 90.056 6.452819 41.758 34.67 16.973993 10.798 8.911 17.47546 35.262 27.848 21.025476 96.069 94.893 1.22412 40.141 35.055 12.670337 10.33 8.992 12.95257 32.369 28.529 11.86327 94.809 93.514 1.365904 47.131 35.078 25.573402 12.374 8.96 27.59011 42.379 27.875 34.22458 81.154 93.845 -15.6382 40.825 37.375 8.4507042 10.572 9.596 9.231933 35.465 30.663 13.540119 100.559 94.362 6.162551 45.199 36.741 18.712803 11.553 9.404 18.60123 37.544 29.446 21.56936
10 97.699 99.159 -1.49439 43.812 39.689 9.4106637 11.39 10.139 10.98332 36.518 32.113 12.0625411 92.448 94.316 -2.0206 38.252 38.589 -0.8809997 9.812 9.889 -0.78475 31.751 31.437 0.98894512 95.587 99.716 -4.31963 40.184 39.453 1.819132 10.321 10.02 2.916384 33.734 30.904 8.38916213 94.787 99.908 -5.40264 45.001 38.815 13.746361 11.755 9.912 15.67843 38.955 30.993 20.4389714 94.682 103.119 -8.91088 41.141 39.233 4.6377093 10.576 10.016 5.295008 34.067 30.938 9.18484215 92.419 99.139 -7.27123 43.623 39.988 8.3327602 11.274 10.172 9.774703 37.746 31.606 16.2666216 100.865 97.135 3.698012 44.62 41.154 7.7678171 11.565 10.576 8.551665 38.54 33.61 12.791917 10.036 101.095 -907.324 18.313 40.565 -121.50931 4.627 10.363 -123.968 17.997 32.654 -81.441418 98.049 121.585 -24.0043 43.085 25.919 39.842172 11.195 6.657 40.53595 36.368 21.015 42.2156819 88.711 99.752 -12.446 41.696 39.287 5.7775326 10.794 10.059 6.809339 35.962 31.734 11.7568520 97.192 94.77 2.491975 43.112 40.141 6.8913528 11.261 10.294 8.587159 37.576 32.267 14.128721 97.516 98.534 -1.04393 45.042 39.707 11.844501 11.743 10.198 13.15677 37.722 32.228 14.5644522 96.367 101.079 -4.88964 43.825 41.436 5.4512265 11.329 10.595 6.478948 37.147 33.287 10.3911523 91.51 96.989 -5.98732 43.62 41.484 4.8968363 11.354 10.651 6.191651 37.398 33.537 10.3240824 98.372 94.135 4.30712 43.934 41.01 6.6554377 11.457 10.533 8.064938 37.653 33.054 12.2141725 97.53 100.278 -2.81759 43.962 41.724 5.0907602 11.375 10.726 5.705495 37.483 33.679 10.148626 94.823 98.003 -3.35362 41.885 40.956 2.2179778 10.786 10.543 2.25292 35.583 33.41 6.10684927 88.641 98.97 -11.6526 42.744 41.12 3.7993637 11.111 10.572 4.851049 36.678 33.233 9.39255128 97.423 94.395 3.108096 42.332 41.217 2.6339412 10.943 10.626 2.896829 35.988 33.395 7.2051829 97.894 99.854 -2.00217 44.702 41.551 7.0489016 11.617 10.703 7.86778 38.239 33.6 12.1315930 96.574 100.745 -4.31897 43.35 42.547 1.8523645 11.155 10.968 1.676378 36.603 34.233 6.47487931 90.151 97.876 -8.56896 42.7 42.216 1.1334895 11.069 10.893 1.590026 36.659 34.253 6.5631932 99.42 97.606 1.824583 43.292 42.314 2.2590779 11.199 10.93 2.402 36.307 34.202 5.79778

B-34
Figure B-17. Two Parallel AMT Modules, Test 20, 16.0 ft3/min Air, 1.0 L/min Oil, 200 ppm VOCs
Test 20 - 2 Parallel Modules16 cfm air 200ppm
0
20
40
60
80
100
120
140
0 5 10 15 20 25 30 35 40 45 50
Sample #
ppm
MEK inletMEK outletButyl acetate inletButyl acetate outletEthylbenzene inletEthylbenzene outletXylene inletXylene outlet
Test 20 - 2 Parallel Modules16 cfm air 200ppm
0
20
40
60
80
100
120
140
0 5 10 15 20 25 30 35 40 45 50
Sample #
ppm
MEK inletMEK outletButyl acetate inletButyl acetate outletEthylbenzene inletEthylbenzene outletXylene inletXylene outlet

B-35
Table B-18. Two Parallel AMT Modules, Test 21, 4.0 ft3/min Air, Maximum Oil Flow, 450 ppm VOCs
Tes t 21Run date 6/23/00
Init ial param eters : s am ple flow rate 54c c 's ;sy ringe s et 4.0 m l/hr;air veloc ity 4.0c fm (~ 680 shortridge);oil flow set to m ax out on rotam eter (147-150);M ag(1) 0.4"H2O;M ag(2) > 1.0"H2O
run#
M E K Front Detec tor
M E K Rear Detec tor
% Differenc e
n-B uty l A cetate F ront Detec tor
n-B uty l A c etate Rear Detec tor
% Difference
E thy l B enz ene Front Detec tor
E thy l B enz ene Rear Detec tor
% Differenc e
o-Xy lene Front Detec tor
o-Xy lene Rear Detec tor
% Differenc e
1 0 13.367 #DIV /0! 0 21.175 #DIV /0! 0.333 6.36 -1809.91 1.528 19.716 -1190.312 64.951 15.655 75.89721 11.895 22.193 -86.574191 3.618 6.654 -83.9138 9.712 19.985 -105.7763 192.374 134.858 29.89801 79.345 34.685 56.28584 20.934 8.844 57.75294 67.651 26.281 61.152094 177.908 141.566 20.42741 76.279 41.891 45.081871 19.989 10.427 47.83631 64.908 30.654 52.773165 159.284 142.272 10.68029 70.565 44.332 37.175654 18.434 11.141 39.56276 60.145 33.167 44.854936 147.608 141.718 3.990299 66.181 46.17 30.236775 17.267 11.632 32.63451 56.442 34.974 38.035517 187.124 158.048 15.53836 80.764 48.066 40.48586 21.135 12.12 42.65436 68.647 36.466 46.878968 209.879 173.806 17.18752 90.432 49.976 44.736377 23.642 12.519 47.04763 76.835 37.552 51.126449 157.312 156.131 0.750737 73.476 51.195 30.324187 19.149 12.823 33.03567 62.953 38.763 38.42549
10 154.252 160.913 -4.31826 70.418 52.651 25.230765 18.325 13.544 26.09004 60.038 40.342 32.8058911 147.451 158.278 -7.34278 68.075 52.786 22.459053 17.727 13.511 23.78293 58.125 40.832 29.751412 199.244 173.059 13.14218 87.198 53.199 38.990573 22.792 13.6 40.32994 74.163 40.954 44.7783913 193.64 179.061 7.52892 85.101 55.542 34.734022 22.199 14.115 36.41605 72.226 42.251 41.5016814 204.175 177.21 13.20681 88.932 56.089 36.930464 23.224 14.227 38.7401 75.477 42.707 43.417215 212.275 180.12 15.1478 91.825 57.228 37.677103 23.96 14.492 39.51586 77.672 43.388 44.1394616 185.903 191.249 -2.87569 84.123 59.379 29.414072 21.907 14.942 31.79349 71.636 44.495 37.8873817 208.892 202.261 3.174368 93.692 60.509 35.417111 24.436 15.197 37.80897 79.82 45.195 43.3788518 202.821 202.734 0.042895 91.208 61.411 32.669283 23.79 15.391 35.30475 77.665 45.757 41.0841419 165.335 179.37 -8.48883 75.77 60.947 19.563152 19.706 15.405 21.82584 64.54 46.197 28.4211320 161.36 164.754 -2.10337 72.637 59.238 18.446522 18.905 15.114 20.0529 61.758 45.66 26.0662621 158.441 165.971 -4.75256 71.346 59.358 16.802624 18.571 15.107 18.65274 60.615 45.696 24.6127222 183.288 190.975 -4.19395 81.923 61.373 25.084531 21.351 15.666 26.62639 69.698 46.06 33.9148923 169.199 182.179 -7.67144 77.232 62.189 19.477678 20.102 15.788 21.46055 65.799 46.553 29.2496824 169.133 177.753 -5.09658 75.214 61.979 17.596458 19.595 15.808 19.32636 63.869 46.603 27.0334625 191.006 180.675 5.408731 82.829 61.938 25.221843 21.629 15.818 26.86671 70.218 46.627 33.596826 177.96 180.756 -1.57114 79.051 62.759 20.60948 20.584 15.921 22.65352 67.088 47.466 29.2481527 161.095 185.522 -15.1631 74.957 63.982 14.641728 19.489 16.138 17.19431 63.996 48.022 24.9609428 154.299 174.384 -13.0169 71.385 64.022 10.314492 18.556 16.285 12.23863 60.84 48.448 20.3681829 230.611 218.196 5.383525 101.209 65.114 35.663824 26.446 16.386 38.03978 86.068 48.372 43.7979330 216.034 199.39 7.704343 94.797 66.031 30.344842 24.742 16.589 32.95207 80.415 49.264 38.737831 217.209 204.263 5.960158 95.316 67.522 29.159847 24.836 16.913 31.90127 80.771 49.928 38.1857332 152.515 185.308 -21.5015 72.493 68.527 5.470873 18.81 17.336 7.836257 61.914 50.919 17.7585

B-36
Figure B-18. Two Parallel AMT Modules, Test 21, 4.0 ft3/min Air, Maximum Oil Flow, 450 ppm VOCs
Test 21 - 2 Parallel Modules4.0 cfm air
0
50
100
150
200
250
0 5 10 15 20 25 30 35 40 45 50
Sample #
ppm
MEK inletMEK outletButyl acetate inletButyl acetate outletEthylbenzene inletEthylbenzene outletXylene inletXylene outlet
Test 21 - 2 Parallel Modules4.0 cfm air
0
50
100
150
200
250
0 5 10 15 20 25 30 35 40 45 50
Sample #
ppm
MEK inletMEK outletButyl acetate inletButyl acetate outletEthylbenzene inletEthylbenzene outletXylene inletXylene outlet

B-37
Flat Sheet Biofilm Experiments

B-38
Table B-19. FS1: Degradation of MEK and Toluene by an M1 Biofilm: Aq/Aq Operation
Time MEK Concentration - ppm (v) Toluene Concentration - ppm (v) Days Feed In Feed Out Film Out Feed In Feed Out Film Out MEK Feed Toluene
Feed 2 23.19 9.26 3.05 25 0 9 41.56 18.97 3.96 50 0 10 43.16 18.79 3.56 50 0 18 45.03 19.96 3.47 50 0 21 44.41 30.79 2.44 50 0 28 16.15 8.29 1.58 7.71 3.23 0 25 25 29 22.13 18.08 1.6 7.98 6.13 0 25 25 30 18.08 11.35 1.6 6.49 3.94 0 25 25
Figure B-19. FS1: Degradation of MEK and Toluene by an M1 Biofilm: Aq/Aq Operation
0
5
10
15
20
25
30
35
40
45
50
0 5 10 15 20 25 30 35
Time (d)
Con
c. (p
pmv)
MEK feed in
MEK feed outMEK film outtoluene feed intoluene feed outtoluene film out
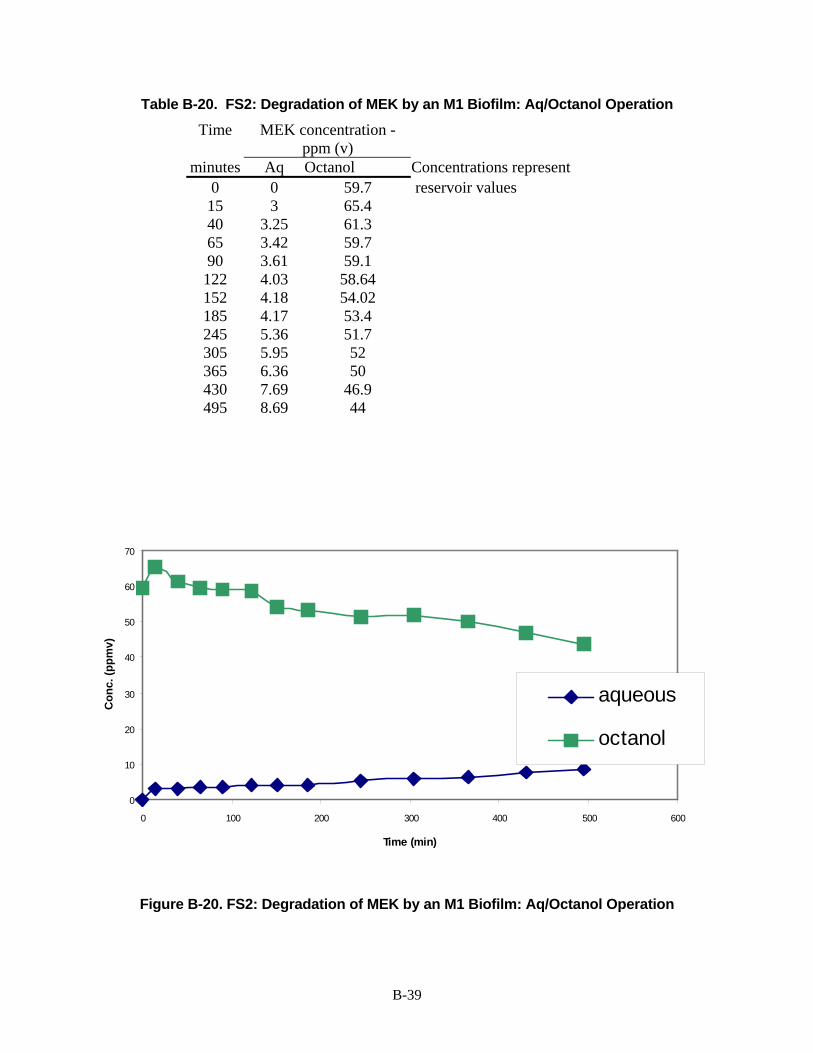
B-39
Table B-20. FS2: Degradation of MEK by an M1 Biofilm: Aq/Octanol Operation
Time MEK concentration - ppm (v)
minutes Aq Octanol Concentrations represent 0 0 59.7 reservoir values 15 3 65.4 40 3.25 61.3 65 3.42 59.7 90 3.61 59.1 122 4.03 58.64 152 4.18 54.02 185 4.17 53.4 245 5.36 51.7 305 5.95 52 365 6.36 50 430 7.69 46.9 495 8.69 44
Figure B-20. FS2: Degradation of MEK by an M1 Biofilm: Aq/Octanol Operation
0
10
20
30
40
50
60
70
0 100 200 300 400 500 600
Time (min)
Con
c. (p
pmv)
aqueous
octanol

B-40
Table B-21. FS3: Degradation of Toluene and MEK by an M1/X1 Biofilm: Aq/Aq Operation
Time Concentrations - ppm (v) hours MEK feed MEK film Toluene feed Toluene film
0 50 0 50 0 2 45.6 5.5 9.2 0.08 3 29.7 6.6 3.4 0.06 4 25.1 7.9 1.1 0.06 6 25.9 6.9 0.18 0.05 8 27.3 10.7 0.09 0.05
Figure B-21. FS3: Degradation of Toluene and MEK by an M1/X1 Biofilm: Aq/Aq Operation
0
10
20
30
40
50
60
0 1 2 3 4 5 6 7 8 9
Time (h)
Con
c. (p
pmv)
MEK feed
MEK film
toluene feed
toluene film

B-41
Table B-22. FS4: Degradation of M-Xylene, Toluene, and MEK by an M1/X1 Biofilm: Aq/Aq Operation
Time Concentrations - ppm (v) Hours MEK Feed
In MEK Feed
Out Tol Feed
In Tol Feed
Out Xyl Feed
In Xyl Feed
Out 20 27.8 24.1 26.3 20 20.6 14.9 24 27.9 25.4 35.2 15.3 27.4 11.6 47 24.9 26.1 21.2 19.4 16.7 14.9 50 28.4 23.4 17.4 13.5 17.4 13.5 67 26 22.2 19.5 15.1 15.2 11.5 71 33 34.9 20.8 14.9 16.6 11.6
Figure B-22. FS4: Degradation of M-Xylene, Toluene, and MEK by an M1/X1 Biofilm: Aq/Aq
Operation
20
25
30
35
40
0 10 20 30 40 50 60 70 80
Time (h)
MEK feed in MEK feed out
10
20
30
40
Con
c. (p
pmv)
toulene feed in toluene feed out
1015202530
xyl feed in xyl feed out

B-42
Table B-23. FS5: Degradation of Toluene and MEK by an M1/X1 Biofilm: Aq/Octanol Operation
Time Concentrations -
ppm (v)
Hours MEK Feed MEK Film Toluene Feed Toluene Film 1 21.5 3.3 5.1 0 2 24.4 3.4 2 0 3 27.4 2.9 0 0 4 24.9 3 0 0 5 25.5 3.2 0 0 6 24.4 3.2 0 0
Figure B-23. FS5: Degradation of Toluene and MEK by an M1/X1 Biofilm: Aq/Octanol Operation
0
5
10
15
20
25
30
0 1 2 3 4 5 6 7
Time (h)
Con
c. (p
pmv)
MEK feedMEK filmtoluene feedtoluene film

B-43
Table B-24. FS6: Degradation of p-xylene by an X1 Biofilm: Aq/Aq Operation
Time p-xylene conc. - ppm (w) Time p-xylene conc. - ppm (w)hours Feed Film hours Feed Film
0 80 25.7 0 34.2 0 1 52 0.3 1 53.6 0 2 53 0.1 2 50.4 0.1
3.33 40 0.2 3 51 0 4.5 41.5 0.1 4 41.6 0.2 5.5 40.4 0.8 5.08 45 0 6.5 41.8 1.8 6 33.3 0.3 7.5 41.2 3 7 30.4 0.3 9.5 34.5 4 10 43.5 3.7
Figure B-24. FS6: Degradation of p-xylene by an X1 Biofilm: Aq/Aq Operation
0
10
20
30
40
50
60
70
80
90
0 2 4 6 8 10 12
Time (h)
Con
c. (p
pmv)
feed
film

B-44
Table B-25. FS7: Degradation of m-xylene by an X1 Biofilm: Aq/Aq Operation
Hours Feed Film Hours Feed Film Hours Feed Film 0 60.2 0.2 0 141 0.1 21.3 62.3 0.2 1 64.9 0 1.4 78.9 0 23.1 37.5 0 2 51.8 0 2.1 79.7 0 24.1 47.4 0
3.25 48 0.2 3.1 70.1 0 25.4 41.2 0 4 34.4 0.2 4.1 53.2 1.1 26.1 42.5 0 5 46 0 5.1 61 0 27.1 45.6 0 6 35.6 0.2 6.1 62.7 0.8 28.7 44.4 0 29.4 40 0.2 30.1 40.2 0
Figure B-25. FS7: Degradation of m-xylene by an X1 Biofilm: Aq/Aq Operation
0
10
20
30
40
50
60
70
0 1 2 3 4 5 6 7
Time (h)
Con
c. (p
pmw
)
feed
film

B-45
Table B-26. FS8: Degradation of m-xylene and p-xylene by an X1 Biofilm: Aq/Aq Operation
initial concentration is 100 ppm each concentration reported is total xylenes
Time xylene conc. - ppm (w) hours Feed Film
0 203.2 0 1 78.7 0.2
2.5 42.7 0 3.7 49.7 0.2 4.5 50.2 0.2 20.5 35 0.1 21.5 22.5 0 22.5 23.6 0 23.5 25.5 0 24.6 23.3 0 25.6 24.3 0 27.5 22.3 0
Figure B-26. FS8: Degradation of m-xylene and p-xylene by an X1 Biofilm: Aq/Aq Operation
0
50
100
150
200
250
0 5 10 15 20 25 30
Time (h)
Con
c. (p
pmw
) Feed
Film

B-46
Growth Study Experiments

B-47
Table B-27. GS1: Growth of X1 on m-xylene
Initial conc. of m-xylene: 250 ppm (v) Initial conc. of m-xylene: 100 ppm (v)
Time OD600 OD600 Time OD600 OD600 Time OD600OD600 Time OD600OD600hours 250-I 250-II hours 250-III 250-IV hours 100-I 100-II hours 100-III 100-IV
0 0.006 0.011 0 0 0 0 0 0 0 0 0 2 0.005 0.008 4 0 0 3 0 0 4 0 0
3.5 0.016 0.016 5.33 0.002 0 6 0.011 0.041 5.33 0.002 0.0034.67 0.036 0.039 6 0.002 0 7 0.04 0.101 6 0.007 0.0075.5 0.062 0.062 6.5 0.002 0.002 7.25 0.052 0.125 7 0.013 0.0156 0.074 0.08 7 0.007 0.007 7.5 0.06 0.13 8 0.032 0.0367 0.127 0.156 8 0.016 0.01 7.75 0.073 0.152 9 0.068 0.069
7.75 0.201 0.235 9 0.034 0.025 8 0.083 0.178 10 0.131 0.1248 0.228 0.262 10 0.062 0.046 8.25 0.104 0.21 10.25 0.161 0.146
8.25 0.266 0.297 11 0.115 0.081 8.5 0.124 0.22 10.5 0.19 0.1768.5 0.283 0.333 11.5 0.16 0.109 8.83 0.149 0.223 10.75 0.223 0.2038.75 0.32 0.354 12 0.212 0.15 9 0.174 0.225 11 0.247 0.21
9 0.351 0.378 12.5 0.258 0.19 9.33 0.2 11.25 0.25 0.2199.25 0.367 0.399 13.08 0.323 0.259 9.5 0.203 11.5 0.25 0.2199.5 0.388 0.405 13.5 0.361 0.295 9.75 0.397 0.408 10 0.398 0.416
Figure B-27. GS1: Growth of X1 on m-xylene
0
0.05
0.1
0.15
0.2
0.25
0.3
0.35
0.4
0.45
0 2 4 6 8 10 12
Time (h)
OD
600

B-48
Table B-28. GS2: X1 on Toluene
Time OD600 tol hours ppm
0 0 80.8 10 0.007
11.5 0.012 12.5 0.016 13.5 0.022 60.6 14.5 0.034 48.6 15.5 0.053 16.5 0.063 39.8 17.5 0.111 18.5 0.127 17.4 19.5 0.209 20.5 0.225 0 21.5 0.222
Figure B-28. GS2: X1 on Toluene
0
0.05
0.1
0.15
0.2
0.25
0 5 10 15 20 25
Time (h)
OD
600

B-49
Table B-29. GS3: X1 on Toluene and m-xylene
Time OD600 tol m-xyl hours ppm (w) ppm (w)
0 0.001 44.7 44.7 2 0.001 4 0.009 5 0.009 45.6 45.1 6 0.018
6.5 0.032 57.6 57.6 7.5 0.059 36.6 38.5 8.75 0.128 11.7 16.7 9.5 0.234 9.3
10.67 0.28 0.15 0.14 11.75 0.267 0.15 0.12 12.75 0.267 0.02
Figure B-29. GS3: X1 on Toluene and m-xylene
GS2: X1 degradation of toluene
0
1020
30405060
7080
90
0 5 10 15 20 25
Time (h)
Tolu
ene
conc
. (pp
m)
GS3: Growth of X1 on toluene and m-xylene
0
0.05
0.1
0.15
0.2
0.25
0.3
0 5 10 15
Time (h)
OD
600
GS3: Degradation of toluene and m-xylene by X1
0
10
20
30
40
50
60
70
0 5 10 15
Time (h)
Con
cent
ratio
n (p
pmw
)
toluenem-xylene

B-50
Table B-30. GS4: M1 on Toluene
Time OD600 Time OD600 tol hours hours ppm (w)
0 0 0 0.001 77.6 12.5 0.002 21.5 0.023 14 0.003 24 0.043 70.2
15.5 0.003 25 0.048 17.5 0.005 26.5 0.063 61.8 19 0.008 27.5 0.069
20.5 0.01 30 0.106 39 24 0.031 31 0.133 25 0.038 32 0.17 16.9 26 0.046 33.42 0.227 27 0.071 34 0.238 0 28 0.078 35 0.232 29 0.088 35.5 0.229 30 0.113
30.5 0.118 31 0.13
31.42 0.139 40 0.3
Figure B-30. GS4: M1 on Toluene
GS4: Growth of M1 on toluene
0
0.05
0.1
0.15
0.2
0.25
0 10 20 30 40
Time (h)
OD
600
GS4: Degradation of toluene by M1
0
10
20
30
40
50
60
70
80
90
0 10 20 30 40Time (h)
Con
c. (p
pmw
)

B-51
Table B-31. GS5: M1 on MEK and Toluene
Time OD600 tol MEK Time OD600 tol MEK hours ppm (w) ppm (w) hours ppm (w) ppm (w)
0 0 24.9 46.3 0 0 17.01 179.4 8.25 0.012 8 0.002 13.2 195.2 9.25 0.013 24.7 42.9 10.5 0.002 10.25 0.015 12.5 0.005 9.6 175.7 11.25 0.021 13.5 0.008 12.25 0.025 18.6 34.6 14.75 0.013 7.2 186.6 13.25 0.03 15.75 0.018 14.25 0.033 12.8 27 16.75 0.024 2.3 171 15.25 0.046 17.75 0.034 16.25 0.063 7.27 11.9 18.75 0.046 0.1 159 17.25 0.085 19.75 0.07 18.25 0.141 0.155 6.4 20.75 0.079 0 124.7 19.25 0.167 21.75 0.096 20.25 0.171 0 6.6 22.75 0.099 0.2 101 21.25 0.171 23.75 0.134 22.25 0.165 24.75 0.174 0.1 43.4
25.75 0.189 26.75 0.248 0 0
Figure B-31. GS5: M1 on MEK and Toluene
GS5: Growth of M1 on MEK and toluene
0
0.05
0.1
0.15
0.2
0.25
0.3
0 10 20 30
Time (h)
OD
600
GS5: Degradation of MEK and toluene by M1
0
50
100
150
200
250
0 10 20 30
Time (h)
Con
c. (p
pmw
)

B-52
Table B-32. GS6: M1 on m-xylene and MEK
Time OD600 m-xyl MEK hours ppm (w) ppm (w)
0 0.001 33.8 68.1 9 0.056 3.7 68.7
9.75 0.082 10.5 0.089 0 70.1 11.25 0.093 12.25 0.094 13.25 0.102
14 0.108 30 14.75 0.125 15.5 0.133 3.93 16.25 0.145
17 0.15 2.89 17.75 0.154 18.75 0.148 2.58 20.75 1.99
Figure B-32. GS6: M1 on m-xylene and MEK
GS6: Growth of M1 on MEK and m-xylene
0
0.02
0.04
0.06
0.08
0.1
0.12
0.14
0.16
0.18
0 5 10 15 20 25
Time (h)
OD
600
GS6: Degradation of MEK and m-xylene by M1
0
10
20
30
40
50
60
70
80
0 5 10 15 20 25Time (h)
Con
c. (p
pmw
)
m-xyleneMEK

B-53
Table B-33. GS7: M1 on Toluene and m-xylene
Time OD600 tol m-xyl hours ppm (w) ppm (w)
0 0 8.75 0.005 32.6 35.2 9.75 0.008 10.5 0.011 32.4 31.3 11.25 0.015
12 0.024 28.8 23.1 12.75 0.032 13.5 0.044 28.4 14.5 14.25 0.065
15 0.089 27.4 0 15.75 0.109 16.5 0.12 19.2 0 17.5 0.125 18.5 0.132 0.4 0 20 0.154 21 0.151 0 0
Figure B-33. GS7: M1 on Toluene and m-xylene
GS7: Growth of M1 on toluene and m-xylene
0
0.02
0.04
0.06
0.08
0.1
0.12
0.14
0.16
0.18
0 10 20 30
Time (h)
OD
600
GS7: Degradation of toluene and m-xylene by M1
0
5
10
15
20
25
30
35
40
0 5 10 15 20 25
Time (h)
Con
c. (p
pmw
)
toluenem-xylene

B-54
Table B-34. GS8: M1 on Toluene, m-xylene and MEK
Time OD600 m-xyl tol MEK hours ppm (w) ppm (w) ppm (w)0.25 0 24.5 20.8 19.9 8.33 0.023 27.8 19.2 7.3 9.33 0.038 10 0.051 30.4 14.8 1 11 0.068
11.75 0.071 26.7 12.75 0.076 13.5 0.076 31.7 3.6 0 14.5 0.076 15.5 0.079 16 0.082 17.1 0.1 17 0.097 18 0.125 19.9 0 19 0.129 20 0.128 15 21 0.135 22 0.146 23 0.155 24 0.159 25 0.163 26 0.163
Table B-34. GS8: M1 on Toluene, m-xylene and MEK
GS8: Growth of M1 on toluene, MEK, and m-xylene
0
0.02
0.04
0.06
0.08
0.1
0.12
0.14
0.16
0.18
0 10 20 30
Time (h)
OD
600
GS8: Degradation of toluene, MEK, and m-xylene by M1
0
5
10
15
20
25
30
35
0 5 10 15 20 25
Time (h)
Con
c. (p
pmw
)
m-xylenetolueneMEK

B-55
Table B-35. GS9: M1 and X1 on MEK and Toluene
Time OD600 MEK tol Time OD600 MEK tol hours ppm (v) ppm (w) hours ppm (v) ppm (w)
0 0.001 49.4 41.7 0 0.005 19.4 3 0.004 53.2 33.7 10 0.068 44.7 0 4 0.007 11 0.073 5 0.01 59.4 32.2 12 0.078 39.7 6 0.014 13 0.089
7.5 0.026 11.9 14 0.097 28.5 8.5 0.039 15 0.104 9.5 0.055 8.8 16 0.113 10.5 0.054 17 0.118 10.1 11.5 0.101 58.3 0 18 0.121 12.5 0.103 19 0.121 7.3 13.5 0.1 58.5 0 22 0.122 7.2 14.5 0.101 24.67 0.125 15 0.1 26.67 0.12
Figure B-35. GS9: M1 and X1 on MEK and Toluene
GS9: Growth of M1 and X1 on MEK and toluene
0
0.02
0.04
0.06
0.08
0.1
0.12
0.14
0 10 20 30
Time (h)
OD
600
GS9: Degradation of MEK and toluene by M1 and X1
0
5
10
15
20
25
30
35
40
45
50
0 10 20 30
Time (h)
Con
c. (p
pm)
MEKtoluene

B-56
Table B-36. GS10: M1 and X1 on MEK, Toluene and m-xylene Time OD600 MEK tol m-xyl hours ppm (w) ppm (w) ppm (w)0.42 0.001 26.5 18.6 14
3 0.001 4.5 0.004 5.5 0.006 27.7 16.6 10.7 6.5 0.013 7.5 0.023 13.2 7.1 8.58 0.044 9.5 0.056 2.7 0.1 10.5 0.088 11.5 0.089 0 0 12.5 0.095 13.5 0.092 32.1 14.5 0.095 15.5 0.102 19.1 16.5 0.11 17.5 0.119 7.5 18.5 0.118 19.5 0.123 6.6 20.5 0.121 26.17 0.135 5.5
Figure B-36. GS10: M1 and X1 on MEK, Toluene and m-xylene
GS10: Growth of M1 & X1 on MEK, toluene, and m-xylene
0
0.02
0.04
0.06
0.08
0.1
0.12
0.14
0.16
0 10 20 30
Time (h)
OD
600
GS10: Degradation of MEK, toluene, and m-xylene by M1 & X1
0
5
10
15
20
25
30
35
0 10 20 30
Time (h)
Con
c. (p
pmw
)
MEKtoluenem-xylene

B-57
Table B-37. GS11: MX on p-xylene
Time OD600 hours
0 0 7.1 0.002 22.4 0.011 23.6 0.012 25.2 0.02 26.2 0.024 27.2 0.05 28.3 0.052 29.1 0.062 30.2 0.069 31.1 0.094 31.6 0.101 46.2 0.128
Figure B-37. GS11: MX on p-xylene
GS11: Growth of MX on p-xylene
0
0.02
0.04
0.06
0.08
0.1
0.12
0.14
0 10 20 30 40 50
Time (h)
OD
600

B-58
Table B-38. GS12: M1 on p-xylene
Time OD600 Time OD600 p-xyl Time OD600 p-xyl hours hours ppm(w) hours ppm(w)
0 0 0 0 57.8 0 0 122.9 22.3 0.082 10.8 0.064 32 9.4 0.007 113.4 23.5 0.105 12.2 0.091 20.1 33.4 0.008 61.5 25.2 0.129 12.8 0.114 35.4 0.021 26.3 0.136 13.5 0.13 4.8 36.4 0.03 35.3 27.2 0.157 14.2 0.141 0 37.4 0.054 18 28.2 0.151 14.8 0.152 38.4 0.098 9 28.9 0.145 15.5 0.155 39.4 0.114 0
16.6 0.159 40.4 0.148 18.4 0.161 41.4 0.161 21 0.175 42.4 0.177 43.9 0.182 44.6 0.18 45.1 0.182

B-59
Figure B-38. GS12: M1 on p-xylene
GS12: Degradation of p-xylene by X1
0
10
20
30
40
50
60
70
0 2 4 6 8 10 12 14 16
Time (h)
Con
c. (p
pmw
)
GS12: Growth of X1 on p-xylene
0
0.02
0.04
0.06
0.08
0.1
0.12
0.14
0.16
0.18
0.2
0 5 10 15 20 25
Time (h)
OD
600
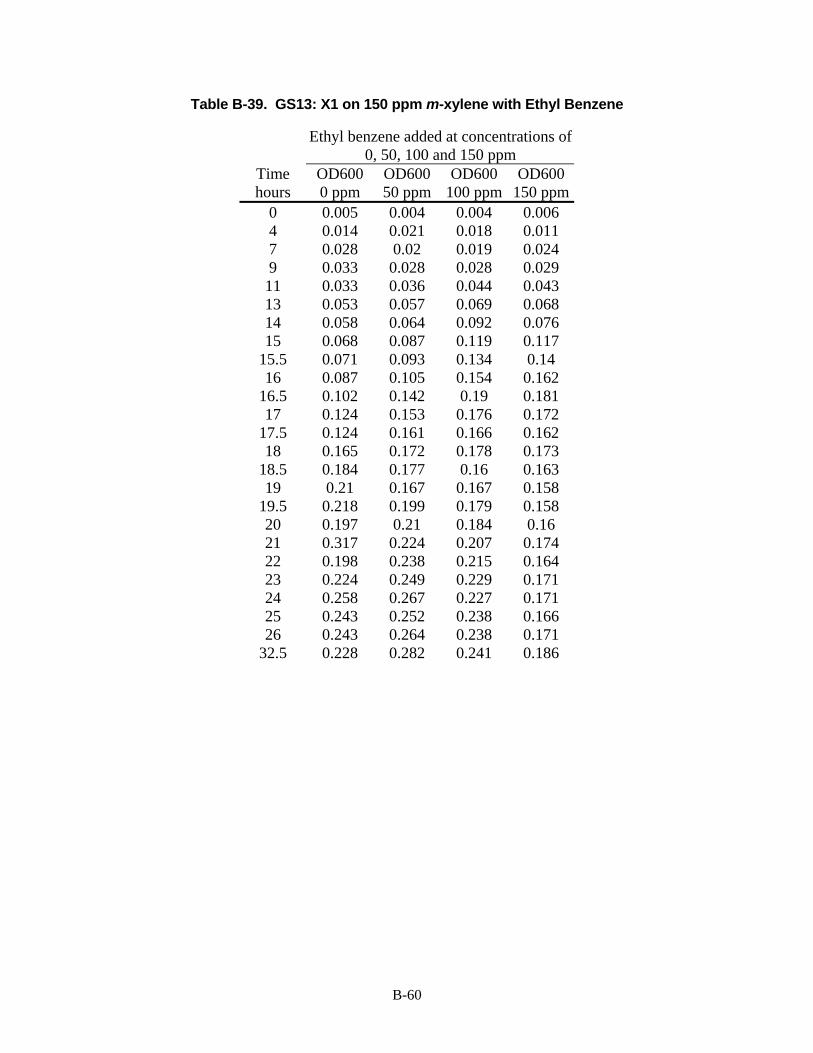
B-60
Table B-39. GS13: X1 on 150 ppm m-xylene with Ethyl Benzene
Ethyl benzene added at concentrations of 0, 50, 100 and 150 ppm
Time OD600 OD600 OD600 OD600 hours 0 ppm 50 ppm 100 ppm 150 ppm
0 0.005 0.004 0.004 0.006 4 0.014 0.021 0.018 0.011 7 0.028 0.02 0.019 0.024 9 0.033 0.028 0.028 0.029 11 0.033 0.036 0.044 0.043 13 0.053 0.057 0.069 0.068 14 0.058 0.064 0.092 0.076 15 0.068 0.087 0.119 0.117
15.5 0.071 0.093 0.134 0.14 16 0.087 0.105 0.154 0.162
16.5 0.102 0.142 0.19 0.181 17 0.124 0.153 0.176 0.172
17.5 0.124 0.161 0.166 0.162 18 0.165 0.172 0.178 0.173
18.5 0.184 0.177 0.16 0.163 19 0.21 0.167 0.167 0.158
19.5 0.218 0.199 0.179 0.158 20 0.197 0.21 0.184 0.16 21 0.317 0.224 0.207 0.174 22 0.198 0.238 0.215 0.164 23 0.224 0.249 0.229 0.171 24 0.258 0.267 0.227 0.171 25 0.243 0.252 0.238 0.166 26 0.243 0.264 0.238 0.171
32.5 0.228 0.282 0.241 0.186

B-61
Figure B-39. GS13: X1 on 150 ppm m-xylene with Ethyl Benzene
0
0.05
0.1
0.15
0.2
0.25
0.3
0.35
0 5 10 15 20 25 30 35
Time (h)
OD
600
0 ppm EB50 ppm EB100 ppm EB150 ppm EB

B-62
Table B-40. GS14: X1 on a 50:50 Mixture of m- and p-xylene
150 ppm total concentration
Time OD600 Xyleneshours ppm(w)
0 0.001 61.5 1 0.007 105.9 2 0.013 112.1 3 0.025 104.9
3.5 0.035 94.3 4 0.04 96.1 5 0.083 75.5 6 0.14 51.4
6.5 0.176 25.8 7 0.228 4.6
7.5 0.251 0.1 8 0.257 0.2
8.5 0.268 0.4 9 0.251 0 10 0.228
Figure B-40. GS14: X1 on a 50:50 Mixture of m- and p-xylene
GS14: Growth of X1 on m- and p-xylene
0
0.05
0.1
0.15
0.2
0.25
0.3
0 5 10 15
Time (h)
OD
600
GS14: Degradation of m- and p-xylene by X1
0
20
40
60
80
100
120
0 2 4 6 8 10
Time (h)
Con
c. (p
pmw
)

B-63
Table B-41. GS15/16: M1 on Butyl Acetate (150 ppm) or a Mixture of MEK and Butyl Acetate (75 ppm each)
Time OD600 OD600 hours BA BA & MEK0.25 0.006 0.011 1.3 0.018 0.019 2.25 0.028 0.023
3 0.048 0.05 3.7 0.072 0.077 4.3 0.088 0.09 5 0.094 0.102
5.7 0.116 0.151 6.15 0.129 0.19 6.8 0.141 0.212 7.25 0.156 0.236 8.25 0.197 0.276 9.25 0.217 0.206 10.25 0.219 0.239 11.25 0.265 0.209 12.25 0.28 0.199
13 0.266 0.205
Figure B-41. GS15/16: M1 on Butyl Acetate
0
0.05
0.1
0.15
0.2
0.25
0.3
0 2 4 6 8 10 12 14Time (h)
OD
600
butyl acetate
butyl acetate and MEK

B-64
Staged Bioreactor Experiments

B-65
Table B-42. SB1: Degradation of MEK in a Staged Bioreactor - 500 ppm Case
Oil Oil C Aq Oil Oil Aq Aq Oil Oil Aq Aq Aq Aq Time m-xyl MEK MEK MEK Time m-xyl MEK MEK MEK Time m-xyl MEK MEK MEK m-xyl m-xylhours ppm ppm ppm ppm hour ppm ppm ppm ppm hour ppm ppm ppm ppm ppm ppm
in out in out in out in out 0 458.7 * 0 449.8 413.6 350.6 426.1 0 1109.
7 356.0 166.3 177.8 0.00 0.00
1 402.0 0 1.17 496.0 365.5 460.5 443.6 1 1055.7
166.1 215.4 198.9 0.00 0.15
2 375.4 0 2.17 463.9 336.1 467.3 446.9 2 1094.5
158.4 222.3 207.3 0.00 0.00
3 332.7 0 3.25 439.4 351.1 473.6 445.0 3 1088.5
139.2 213.0 197.3 0.00 0.00
4 288.2 0 4.33 446.1 351.9 463.1 431.8 4 1047.3
160.0 216.7 175.7 0.00 0.52
5 259.3 0 5.42 409.2 317.4 455.3 417.6 5 1075.3
158.7 221.8 192.4 0.00 0.00
6 215.5 0 9.1 1.6 10.25 378.8 288.6 376.1 353.5 6 1051.4
164.4 158.2 191.2 0.53 0.00
7 172.3 0 2.8 11.42 373.4 270.8 352.0 359.0 7.5 1045.3
147.4 165.3 190.1 0.66 0.65
8 121.6 0 9.1 4.3

B-66
Figure B-42. SB1: Degradation of MEK in a Staged Bioreactor - 500 ppm Case
150.0160.0170.0180.0190.0200.0210.0220.0230.0
0 1 2 3 4 5 6 7 8
Time (h)
Con
c. (p
pmw
) MEK in
MEK out

B-67
Table B-43. SB2: Degradation of MEK and m-xylene in a Staged Bioreactor - 1000 ppm Case
Oil Oil Aq Aq Oil Oil Aq Aq Aq Aq Time m-xyl MEK MEK MEK Time m-xyl MEK MEK MEK m-xyl m-xylhours ppm ppm ppm ppm hours ppm ppm ppm ppm ppm ppm
in out in out in out 0 731.4 260.3 140.6 0 854.8 541.1 157.1 210.5 0 0.36
1.17 634.0 * 129.0 113.1 1 829.6 240.0 249.5 243.5 0 0.35 2.08 577.1 * 133.3 198.8 2 784.6 203.4 270.9 249.5 0 0.48 3.08 545.7 * 173.3 178.0 3 777.9 209.2 259.9 237.3 0 0 4.08 469.9 0 162.5 162.8 4 778.4 198.4 254.2 237.2 0.08 0.46 5.08 405.2 0 106.6 121.2 5 792.0 209.3 257.6 237.6 0.13 0.46 6.08 406.6 0 76.6 84.4 6 710.9 164.1 258.3 256.5 0.24 0.43 7.08 431.0 0 80.6 87.7 7 703.7 186.0 267.6 261.0 0.52 0.56
8 700.3 183.5 257.6 260.7 0.62 0.62 m-xylene not detected in aqueous phase *Matrix interference/acetic acid
Figure B-43. SB2: Degradation of MEK and m-xylene in a Staged Bioreactor - 1000 ppm
Case
0.0
100.0
200.0
300.0
400.0
500.0
600.0
700.0
800.0
900.0
0 1 2 3 4 5 6 7 8 9Time (h)
Con
c. (p
pmw
) m-xylene - oil MEK - oil
MEK - in MEK - out
m-xylene - in m-xylene - out
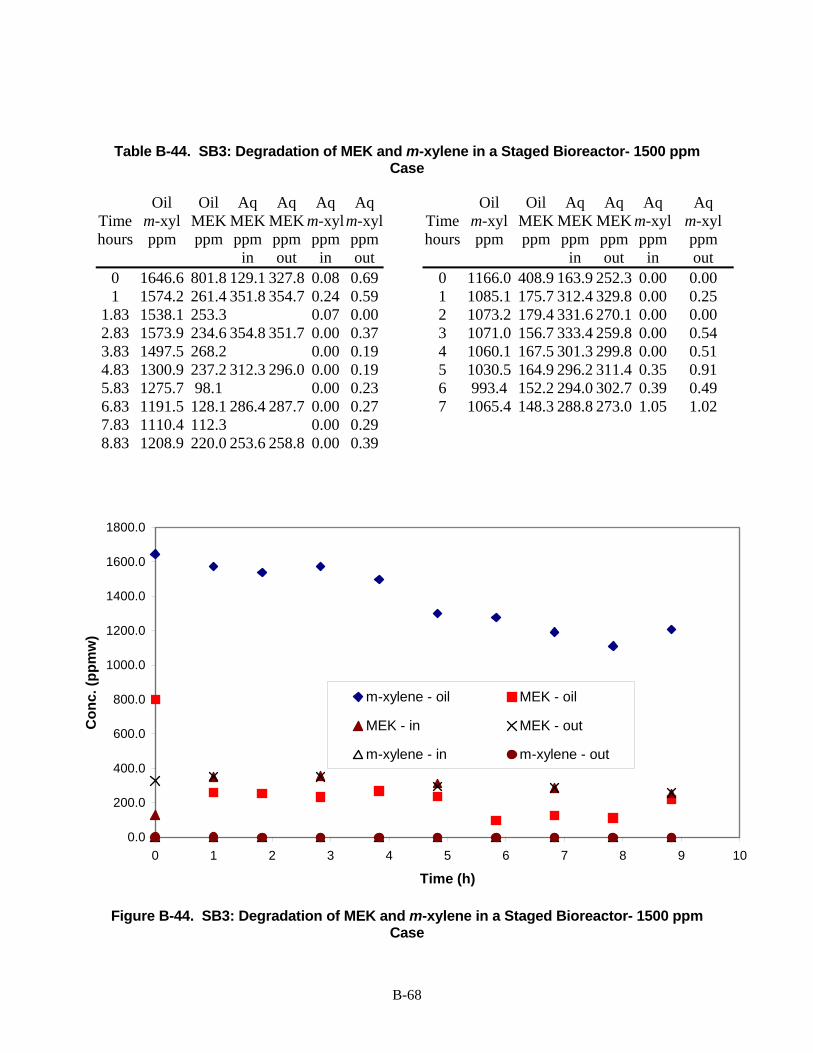
B-68
Table B-44. SB3: Degradation of MEK and m-xylene in a Staged Bioreactor- 1500 ppm Case
Oil Oil Aq Aq Aq Aq Oil Oil Aq Aq Aq Aq Time m-xyl MEK MEK MEK m-xylm-xyl Time m-xyl MEK MEK MEK m-xyl m-xyl hours ppm ppm ppm ppm ppm ppm hours ppm ppm ppm ppm ppm ppm
in out in out in out in out 0 1646.6 801.8 129.1 327.8 0.08 0.69 0 1166.0 408.9 163.9 252.3 0.00 0.00 1 1574.2 261.4 351.8 354.7 0.24 0.59 1 1085.1 175.7 312.4 329.8 0.00 0.25
1.83 1538.1 253.3 0.07 0.00 2 1073.2 179.4 331.6 270.1 0.00 0.00 2.83 1573.9 234.6 354.8 351.7 0.00 0.37 3 1071.0 156.7 333.4 259.8 0.00 0.54 3.83 1497.5 268.2 0.00 0.19 4 1060.1 167.5 301.3 299.8 0.00 0.51 4.83 1300.9 237.2 312.3 296.0 0.00 0.19 5 1030.5 164.9 296.2 311.4 0.35 0.91 5.83 1275.7 98.1 0.00 0.23 6 993.4 152.2 294.0 302.7 0.39 0.49 6.83 1191.5 128.1 286.4 287.7 0.00 0.27 7 1065.4 148.3 288.8 273.0 1.05 1.02 7.83 1110.4 112.3 0.00 0.29 8.83 1208.9 220.0 253.6 258.8 0.00 0.39
Figure B-44. SB3: Degradation of MEK and m-xylene in a Staged Bioreactor- 1500 ppm
Case
0.0
200.0
400.0
600.0
800.0
1000.0
1200.0
1400.0
1600.0
1800.0
0 1 2 3 4 5 6 7 8 9 10
Time (h)
Con
c. (p
pmw
)
m-xylene - oil MEK - oil
MEK - in MEK - out
m-xylene - in m-xylene - out

B-69
Table B-45. SB4: Degradation of MEK and p-xylene in a Staged Bioreactor - 500 ppm Case
Oil Oil Aq Aq Aq Aq Time p-xyl MEK MEK MEK p-xyl p-xyl hours ppm ppm ppm ppm ppm ppm
in out in out 0 554.5 301.5 43.0 75.20 0.00 0.00 1 540.4 100.6 83.6 73.74 0.19 0.00 2 538.3 127.0 95.7 92.21 0.20 0.00 3 533.1 95.5 88.2 88.30 0.32 0.00 4 551.5 91.7 83.4 70.67 0.48 0.10 5 538.5 57.2 80.0 80.03 0.10 6 549.7 51.1 76.6 74.49 0.49 0.45
7.75 534.7 0.0 67.4 63.99 0.44 0.40
Figure B-45. SB4: Degradation of MEK and p-xylene in a Staged Bioreactor - 500 ppm Case
0.0
100.0
200.0
300.0
400.0
500.0
600.0
0 1 2 3 4 5 6 7 8 9
Time (h)
Con
c. (p
pmw
) p-xylene - oil MEK - oil
MEK - in MEK - out
p-xylene - in p-xylene - out

B-70
Table B-46. SB5: Degradation of MEK and p-xylene in a Staged Bioreactor - 1000 ppm Case
Oil Oil Aq Aq Aq Aq
Time p-xyl MEK MEK MEK p-xyl p-xyl hours ppm ppm ppm ppm ppm ppm
in out in out 0 1212.6 605.2 29.30 88.54 0 0.13 1 1152.3 172.3 140.20 160.66 0 0.39 2 1174.8 143.3 132.15 147.19 0 0.00 3 1121.6 127.7 136.72 126.19 0.15 0.08 4 1125.2 78.8 116.76 130.93 0.69 0.46 5 1118.5 110.2 94.68 86.99 0.81 6 1141.7 162.9 96.00 96.74 0.95 0.69
Figure B-46. SB5: Degradation of MEK and p-xylene in a Staged Bioreactor - 1000 ppm Case
0.0
200.0
400.0
600.0
800.0
1000.0
1200.0
1400.0
0 1 2 3 4 5 6 7
Time (h)
Con
c. (p
pmw
)
p-xylene - oil MEK - oil
MEK - in MEK - out

B-71
Table B-47. SB6: Degradation of m-xylene, p-xylene, Butyl Acetate and MEK in a Staged Bioreactor
Oil Oil Oil Aq Aq Aq Aq Aq Aq
Time xyl MEK BA xyl xyl MEK MEK BA BA hour ppm ppm ppm ppm ppm ppm ppm ppm ppm
in out in out in out 0 1832.8 349.3 301.1 0 0 21.99 50.6 0.45 1.52 1 1761.7 135.9 0.0 0 0 62.17 66.4 0.88 1.11 2 1783.3 0.0 0.0 0.89 0.11 62.85 61.58 0.93 0.94 3 0.98 0.76 58.67 58.38 0.81 0.6 4 1717.1 0.0 0.0 1.08 0.56 51.99 58.04 0.62 0.47 5 1632.2 0.0 0.0 1.43 0.26 52.51 51.54 0.47 0.43 6 1714.3 0.0 0.0 1.51 1.58 48.91 50.76 0.22 0.16 7 1630.1 0.0 0.0 1.5 0.98 50.43 48.06 0.07 0 8 1440.9 0.0 0.0 24 0 0 3.67 2.77 0 0
Figure B-47. SB6: Degradation of m-xylene, p-xylene, Butyl Acetate and MEK in a Staged
Bioreactor
0.0
200.0
400.0
600.0
800.0
1000.0
1200.0
1400.0
1600.0
1800.0
2000.0
0 1 2 3 4 5 6 7 8 9
Time (h)
Con
c. (p
pmw
)
xylenes - oilMEK - oil
butyl acetate - oil

B-72
Table B-48. SB7: Degradation of VOCs in Oil Generated from Spray Booth Tests Containing BA, EB, m-xyl, o-xyl
Oil Oil Oil Oil Oil Aq Aq Aq Aq Aq Aq Aq Aq Aq Aq
Time MEK BA EB m-xyl o-xyl MEK MEK BA BA EB EB m-xyl m-xyl o-xyl o-xylhour ppm ppm ppm ppm ppm ppm ppm ppm ppm ppm ppm ppm ppm ppm ppm
MEK BA EB m-xyl o-xyl in out in out in out in out in out 0 0.0 256.0 105.0 129.0 355.7 0 0 0 0 0 0 0 0 0 0 1 0.0 114.1 100.7 130.4 340.0 0 0.97 0 0 0 0 0 0 0 0.414
2.08 0.0 0.0 98.1 130.9 333.7 0 4.15 3.50 0 0 0 0 0.352 0 3.08 0.0 0.0 96.4 127.0 332.5 0.81 1.76 2.63 2.54 0 0 0 0 0.348 0.364
4 0.0 0.0 94.1 124.1 328.7 5 0.0 0.0 92.1 126.0 325.4
6.25 0.0 0.0 91.8 129.4 324.6 7 0.0 0.0 95.4 128.0 339.2
23.8 0.0 0.0 91.3 124.4 328.7
Figure B-48. SB7: Degradation of VOCs in Oil Generated from Spray Booth Tests Containing BA, EB, m-xyl, o-xyl
0.0
50.0
100.0
150.0
200.0
250.0
300.0
350.0
400.0
0 5 10 15 20 25
Time (h)
Con
c. (p
pmw
)
BA EB
m-xyl o-xyl

B-73
Table B-49. SB8: Degradation of VOCs in Oil Run with Paint
SB8 Oil run
for 1 hour with paint
Oil run
for 2 hours with paint
Oil run
for 2 hours with paint
31.08.00
05.09.00
11.09.00
Oil Oil Oil Oil Oil Oil Oil Oil Oil Oil Oil Oil Oil Oil Oil Time MEK BA EB m-xyl o-xyl Time MEK BA EB m-xyl o-xyl Time MEK BA EB m-xyl o-xylhour ppm ppm ppm ppm ppm hour ppm ppm ppm ppm ppm hour ppm ppm ppm ppm ppm
MEK BA EB m-xyl o-xyl MEK BA EB m-xyl o-xyl MEK BA EB m-xyl o-xyl0 0.0 0.0 35.9 186.5 18.4 0 132.5 100.8 40.7 183.1 49.6 0 131.4 84.1 39.6 158.8 44.91 0.0 0.0 35.2 174.7 38.1 1 0.0 0.0 40.5 179.9 43.6 1 0.0 0.0 39.6 158.4 39.92 0.0 0.0 34.5 171.2 28.7 2 0.0 0.0 39.8 178.1 41.3 2 0.0 0.0 38.7 153.8 34.73 0.0 0.0 34.4 167.6 13.7 3 0.0 0.0 41.4 185.7 44.5 3 0.0 0.0 38.8 156.1 35.24 0.0 0.0 34.2 164.2 38.2 4 0.0 0.0 39.1 172.8 37.0 4 0.0 0.0 39.2 157.2 36.55 0.0 0.0 34.9 165.5 40.9 23 0.0 0.0 39.9 174.8 34.8 5 0.0 0.0 39.2 158.5 34.66 0.0 0.0 33.7 160.4 14.8 24 0.0 0.0 39.3 171.0 31.6 76 0.0 0.0 37.9 312.1 27.024 0.0 0.0 33.9 153.9 35.8 25 0.0 0.0 38.8 168.4 30.2
25.75 0.0 0.0 33.6 143.1 34.4 25.8 0.0 0.0 38.1 168.4 30.8 27.75 0.0 0.0 33.3 142.5 32.0
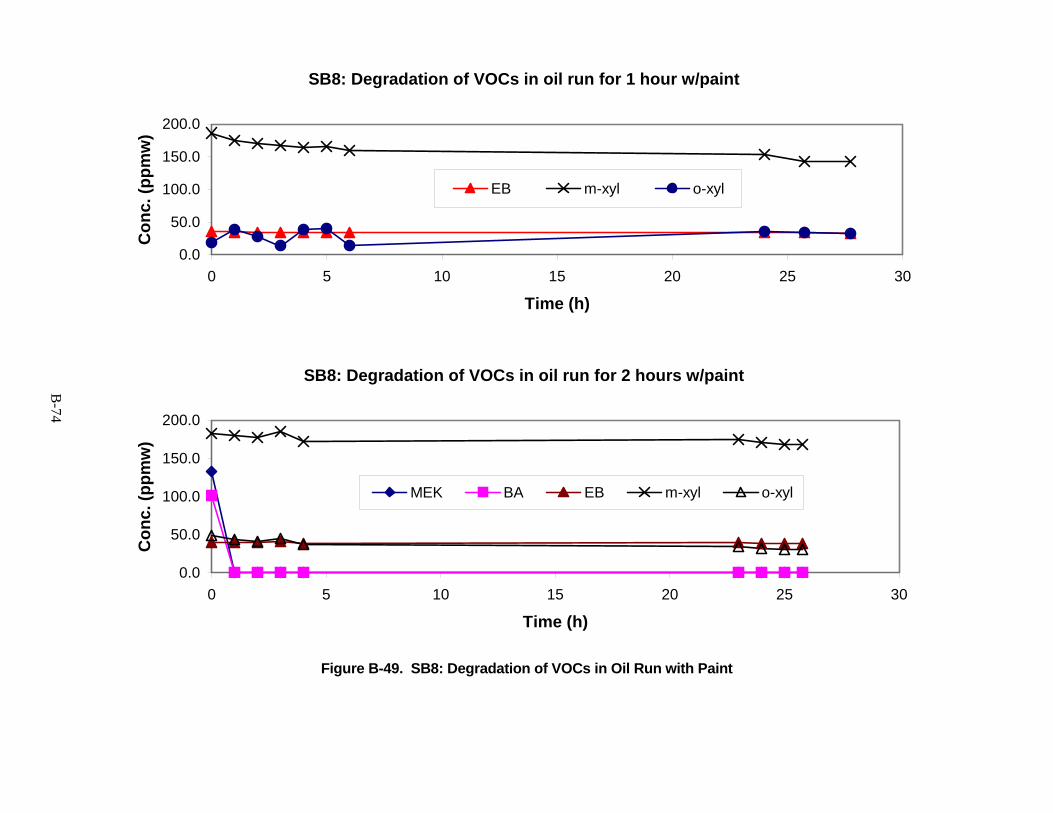
B-74
Figure B-49. SB8: Degradation of VOCs in Oil Run with Paint
SB8: Degradation of VOCs in oil run for 1 hour w/paint
0.0
50.0
100.0
150.0
200.0
0 5 10 15 20 25 30
Time (h)
Con
c. (p
pmw
)
EB m-xyl o-xyl
SB8: Degradation of VOCs in oil run for 2 hours w/paint
0.0
50.0
100.0
150.0
200.0
0 5 10 15 20 25 30
Time (h)
Con
c. (p
pmw
)
MEK BA EB m-xyl o-xyl

APPENDIX C
PILOT SCALE DATA

C-1
Table C-1. AMT Modules; Pilot Test 1 Arrangement : Two Banks of Five Modules in Series Oil : 5 PSIg Delivered, 5.0 Centistokes Viscosity, 3.8 L/min Oil Flow Air : 44.5 ft3/min
8/29/00Time Inlet PPM Time Outlet PPM
3:29 PM -0.88285 3:31 PM 2.511953:33 PM -1.2429 3:35 PM 2.56343:37 PM -1.19145 3:39 PM 1.74043:41 PM 50.70783 3:43 PM 61.71523:45 PM 311.5931 3:47 PM 118.44953:49 PM 336.0768 3:51 PM 135.93793:53 PM 356.3427 3:55 PM 151.31743:57 PM 324.8637 3:59 PM 155.22654:01 PM 284.8976 4:03 PM 153.88924:05 PM 312.0046 4:07 PM 163.30214:09 PM 296.4193 4:11 PM 164.9484:13 PM 293.899 4:15 PM 169.06294:17 PM 287.8295 4:19 PM 170.40034:21 PM 281.3485 4:23 PM 171.73764:25 PM 274.3017 4:27 PM 169.83454:29 PM 258.9737 4:31 PM 171.32614:33 PM 261.5455 4:35 PM 173.69224:37 PM 359.8918 4:39 PM 191.54064:41 PM 563.477 4:43 PM 221.88814:45 PM 598.5051 4:47 PM 241.43394:49 PM 568.6206 4:51 PM 249.35514:53 PM 581.2225 4:55 PM 259.38524:57 PM 570.3694 4:59 PM 271.78135:01 PM 548.7662 5:03 PM 272.08995:05 PM 554.2184 5:07 PM 277.90235:09 PM 574.793 5:11 PM 208.82325:13 PM 12.69633 5:15 PM 29.516055:17 PM 5.392425 5:19 PM 41.243555:21 PM 951.5129 5:23 PM 63.361185:25 PM 15.06245 5:27 PM 201.57075:29 PM 32.08785 5:31 PM 193.28955:33 PM 34.814 5:35 PM 179.55595:37 PM 35.7913 5:39 PM 168.03425:41 PM 33.21948 5:43 PM 159.39295:45 PM 33.52808 5:47 PM 150.75155:49 PM 32.1393 5:51 PM 141.18445:53 PM 31.47063 5:55 PM 135.32075:57 PM 31.93355 5:59 PM 126.11356:01 PM 29.51605 6:03 PM 118.8616:05 PM 28.02438 6:07 PM 113.56316:09 PM 26.78993 6:11 PM 107.85376:13 PM 18.35438 6:15 PM 50.913586:17 PM 11.87338 6:19 PM 21.23486:21 PM 9.301575 6:23 PM 14.342356:25 PM 8.272825 6:27 PM 11.51336:29 PM 7.346975 6:31 PM 10.536

C-2
Concentrations 8/29/00
-200
0
200
400
600
800
1000
3:30 PM 4:30 PM 5:30 PM 6:30 PM
Time
PPM Inlet
Outlet
Figure C-1. AMT Modules, Pilot Test 1, 44.5 ft3/min Air, 3.8 L/min Oil Flow

C-3
Table C-2A. AMT Modules; Pilot Test 2 Arrangement : Two Banks of Five Modules in Series Oil : 7 PSIg Delivered, 5.0 Centistokes Viscosity, 5.5 L/min Oil Flow Air : 44.5 ft3/min
8/30/00 ATime Inlet PPM Time Outlet PPM12:05 PM -1.24288 12:03 PM -0.0084212:09 PM -1.29433 12:07 PM -0.4713812:13 PM -1.29433 12:11 PM -0.2656312:17 PM -1.19145 12:15 PM -0.2141812:21 PM -1.19145 12:19 PM -0.2141812:25 PM -1.5515 12:23 PM -0.4713512:29 PM -1.44865 12:27 PM -0.3170312:33 PM -1.2429 12:31 PM -0.3170312:37 PM -1.2429 12:35 PM -0.3170512:41 PM -1.19145 12:39 PM -0.1627512:45 PM -1.03713 12:43 PM -0.1112812:49 PM -1.14003 12:47 PM -0.522812:53 PM -1.34575 12:51 PM -0.0084312:57 PM -1.50005 12:55 PM -0.52278
1:01 PM -1.5515 12:59 PM -0.419931:05 PM -1.24288 1:03 PM -0.52281:09 PM -0.98573 1:07 PM -0.214151:13 PM -1.50008 1:11 PM -0.214151:17 PM -1.34578 1:15 PM -0.162731:21 PM -1.55153 1:19 PM -0.36851:25 PM -1.5515 1:23 PM 0.0431:29 PM -0.8314 1:27 PM -0.162731:33 PM -1.39723 1:31 PM -0.625651:37 PM -1.55148 1:35 PM -0.214181:41 PM -1.0886 1:39 PM -0.059881:45 PM -1.3972 1:43 PM -0.265581:49 PM -1.50008 1:47 PM -0.26561:53 PM -1.3972 1:51 PM -0.368451:57 PM -1.14003 1:55 PM -0.00842:01 PM -1.34575 1:59 PM -0.26562:05 PM -0.98573 2:03 PM -0.214182:09 PM -1.2429 2:07 PM -0.471352:13 PM -1.39723 2:11 PM -0.419952:17 PM -1.44863 2:15 PM -0.57422:21 PM -1.14 2:19 PM -0.162732:25 PM -1.0886 2:23 PM -0.471352:29 PM -2.16875 2:27 PM -0.67712:33 PM 196.6328 2:31 PM 93.245732:37 PM 172.4577 2:35 PM 189.89472:41 PM -2.06588 2:39 PM -2.374532:45 PM 28.17873 2:43 PM 196.16992:49 PM -3.5575 2:47 PM 2.15195
2:51 PM -3.40318

C-4
Concentrations 8/30/00 A
-50
0
50
100
150
200
250
2:24 PM 2:31 PM 2:38 PM 2:45 PM 2:52 PM 3:00 PM
Time
PPM Inlet
Outlet
Figure C-2A. AMT Modules, Pilot Test 2, 44.5 ft3/min Air, 5.5 L/min Oil Flow

C-5
Table C-2B. AMT Modules; Pilot Test 2B
Arrangement : Two Banks of Five Modules in Series Oil : 7 PSIg Delivered, 5.0 Centistokes Viscosity, 5.5 L/min Oil Flow Air : 44.5 ft3/min
8/30/00 BTime Inlet PPM Time Outlet PPM
5:29 PM -2.2202 5:32 PM 21.029055:34 PM 3.38635 5:37 PM 7.449855:39 PM 3.9522 5:42 PM 19.79465:44 PM 22.1092 5:47 PM 9.6616255:49 PM 95.35458 5:52 PM 132.59455:54 PM 153.4262 5:57 PM 51.890885:59 PM 89.18223 6:02 PM 51.06796:04 PM 1001.612 6:07 PM 465.23356:09 PM 1001.715 6:12 PM 217.05316:14 PM 330.4188 6:17 PM 210.5726:19 PM 362.4637 6:22 PM 205.78856:24 PM 335.511 6:27 PM 195.34696:29 PM 281.8629 6:32 PM 181.15046:34 PM 257.8421 6:37 PM 171.53196:39 PM 229.9121 6:42 PM 266.89496:44 PM 657.9141 6:47 PM 302.90036:49 PM 678.2829 6:52 PM 315.34796:54 PM 643.2548 6:57 PM 328.92716:59 PM 194.061 7:02 PM 95.611787:04 PM 92.57703 7:07 PM 53.742587:09 PM 9.250125 7:12 PM 40.21487:14 PM 60.275 7:17 PM 929.03527:19 PM 45.97568 7:22 PM 1.2260757:24 PM -2.2716 7:27 PM 196.11847:29 PM 15.57678 7:32 PM -1.448637:34 PM -2.16873 7:37 PM -2.374537:39 PM -1.91158 7:42 PM -2.580237:44 PM -3.24888 7:47 PM 195.03837:49 PM 6.88405 7:52 PM 4.5179757:54 PM 2.923475 7:57 PM 13.416457:59 PM 13.51935 8:02 PM 12.696338:04 PM 12.49063 8:07 PM 12.284888:09 PM 12.64493 8:12 PM 11.46198:14 PM 11.30755 8:17 PM 11.20478:19 PM 11.41045 8:22 PM 10.690358:24 PM 10.48463 8:27 PM 10.124558:29 PM 9.6102 8:32 PM 9.97025

C-6
Figure C-2B, AMT Modules, Pilot Test 2A, 44.5 ft3/min Air, 5.5 L/min Oil Flow
Concentrations 8/30/00 B
-200
0
200
400
600
800
1000
1200
5:30 PM 5:58 PM 6:27 PM 6:56 PM 7:25 PM 7:54 PM
Time
PPM Inlet
Outlet

C-7
Table C-3. AMT Modules; Pilot Test 3 Arrangement : Two Banks of Five Modules in Series Oil : 6 PSIg Delivered, 5.0 Centistokes Viscosity, 4.6 L/min Oil Flow Air : 197 ft3/min
Pilot Test 3 - CEM Data, 9/1/2000Time Inlet PPM Time Outlet PPM
3:59 PM 150.0315 4:02 PM 86.558984:04 PM 264.4259 4:07 PM 148.07694:09 PM 310.9244 4:12 PM 163.55924:14 PM 308.044 4:17 PM 169.52584:19 PM 34.45393 4:22 PM 33.579534:24 PM 21.85203 4:27 PM 28.075834:29 PM 29.36175 4:32 PM 1001.663

C-8
Pilot Test 3 - CEM Data, 9/1/00
-200
0
200
400
600
800
1000
1200
4:00 PM 4:07 PM 4:14 PM 4:21 PM 4:28 PM
Time
PPM Inlet
Outlet
Figure C-3. AMT Modules, Pilot Test 3, 197 ft3/min Air, 4.6 L/min Oil Flow

C-9
Table C-4 . AMT Modules; Pilot Test 4 Arrangement : Two Banks of Five Modules in Series Oil : 6 PSIg Delivered, 5.0 Centistokes Viscosity, 4.4 L/min Oil Flow Air : 100 ft3/min
P ilot Tes t 4 - CE M Data, 9/5/2000Tim e Inlet P P M Tim e Outlet P P M
3:34 P M 0.19735 3:37 P M 0.7631253:39 P M 0.557375 3:42 P M 0.9688753:44 P M -0.57423 3:47 P M 0.814553:49 P M 0.763125 3:52 P M -1.86013:54 P M 221.1165 3:57 P M 220.75653:59 P M 221.3223 4:02 P M -2.014434:04 P M -1.963 4:07 P M 421.40974:09 P M 1002.486 4:12 P M 367.76164:14 P M 221.4766 4:17 P M -0.36854:19 P M -2.5288 4:22 P M 1001.1494:24 P M 219.1105 4:27 P M 220.96224:29 P M 221.0136 4:32 P M 168.49714:34 P M 0.608825 4:37 P M 4.3122254:39 P M -3.30035 4:42 P M -2.94034:44 P M 196.2213 4:47 P M 911.8044:49 P M 910.9296 4:52 P M 912.88414:54 P M 912.5241 4:57 P M 910.92954:59 P M 911.9069 5:14 P M 908.80975:17 P M 385.4817 5:19 P M 3.9192255:22 P M 2.898575 5:24 P M 3.3068255:27 P M 193.8074 5:29 P M 18.667335:32 P M -0.41845 5:34 P M 179.26345:37 P M 3.000675 5:39 P M 4.53165:42 P M 3.51095 5:44 P M 3.2558255:47 P M 3.357875 5:49 P M 3.5620255:52 P M 3.45995 5:54 P M 3.4599255:57 P M 3.306825 5:59 P M 3.510956:02 P M 3.459925 6:04 P M 3.000656:07 P M 2.337225 6:09 P M 2.0820756:12 P M 2.643425 6:14 P M 3.204756:17 P M 3.613025 6:19 P M 3.204756:22 P M 3.562 6:24 P M 3.5626:27 P M 3.61305 6:29 P M 3.306856:32 P M 3.408875 6:34 P M 4.2254256:37 P M 4.42955 6:39 P M 7.8996756:42 P M 14.38068 6:44 P M 40.15166:47 P M 169.5675 6:49 P M 226.87586:52 P M 760.8183 6:54 P M 175.2836:57 P M 465.5501 6:59 P M 358.23097:02 P M 74.4958 7:04 P M 336.18537:07 P M 284.7966 7:09 P M 215.90417:12 P M 200.8498 7:14 P M 151.60447:17 P M 257.2906 7:19 P M 117.92367:22 P M 157.7792 7:24 P M 144.00077:27 P M 19.38175 7:29 P M 45.50997:32 P M 990.1029 7:34 P M 997.04327:37 P M 68.32098 7:39 P M 488.56537:42 P M 18.66733 7:44 P M 47.44917:47 P M 9.9409 7:49 P M 37.395887:52 P M 8.409975 7:54 P M 31.272137:57 P M 6.368725 7:59 P M 24.99528:02 P M 6.6239 8:04 P M 34.129858:07 P M 995.257 8:09 P M 167.228:12 P M 50.91923 8:14 P M 59.95188:17 P M 23.9746 8:19 P M 79.956138:22 P M 59.59458 8:24 P M 70.515338:27 P M 57.80848 8:29 P M 58.829138:32 P M 46.4795 8:34 P M 46.377438:37 P M 45.5609 8:39 P M 44.029988:42 P M 39.3861 8:44 P M 41.733558:47 P M 43.92793 8:49 P M 41.580458:52 P M 41.88668 8:54 P M 42.192858:57 P M 39.3861 8:59 P M 39.947439:02 P M 41.42738 9:04 P M 38.87578

C-10
Figure C-4. AMT Modules, Pilot Test 4, 100 ft3/min Air, 4.4 L/min Oil Flow
Pilot Test 4 - CEM Data, 9/5/00
0
200
400
600
800
1000
1200
3:00 PM 4:00 PM 5:00 PM 6:00 PM 7:00 PM 8:00 PM 9:00 PM
Time
PPM Inlet
Outlet

C-11
Table C-5. AMT Modules; Pilot Test 5 Arrangement : Two Banks of Five Modules in Series Oil : 5.5 PSIg Delivered, 5.0 Centistokes Viscosity, 3.85 L/min Oil Flow Air : 100 ft3/min
P ilot Tes t 5 - CE M Data, 9/6/2000Tim e Inlet P P M Tim e Outlet P P M
7:02 P M 1.265575 6:59 P M 1.26567:07 P M 32.13963 7:04 P M 1.9800257:12 P M 141.3981 7:09 P M 93.683637:17 P M 297.1972 7:14 P M 237.49047:22 P M 273.0083 7:19 P M 289.44047:27 P M 372.6218 7:24 P M 269.74237:32 P M 364.865 7:29 P M 399.26027:37 P M 52.24605 7:34 P M 216.61857:42 P M 307.7097 7:39 P M 116.85197:47 P M 322.9171 7:44 P M 315.41557:52 P M 65.15703 7:49 P M 311.94537:57 P M 994.7977 7:54 P M 32.700958:02 P M 96.03108 7:59 P M 275.96828:07 P M 24.74005 8:04 P M 57.502288:12 P M 16.9833 8:09 P M 19.89218:17 P M 14.2276 8:14 P M 14.482738:22 P M 12.6456 8:19 P M 13.002838:27 P M 3.613025 8:24 P M 12.696638:32 P M 2.2862 8:29 P M 91.183088:37 P M 167.0669 8:34 P M 0.091858:42 P M 0.908375 8:39 P M 6.98118:47 P M 179.9269 8:44 P M 246.6258:52 P M 288.1647 8:49 P M 248.92158:57 P M 271.0181 8:54 P M 284.28629:02 P M 236.3167 8:59 P M 253.9736

C-12
Figure C-5. AMT Modules, Pilot Test 5, 100 ft3/min Air, 3.85 L/min Oil Flow
Pilot Test 5 - CEM Data, 9/6/00
-200
0
200
400
600
800
1000
1200
7:00 PM 7:14 PM 7:28 PM 7:43 PM 7:57 PM 8:12 PM 8:26 PM 8:40 PM 8:55 PM
Time
PPM Inlet
Outlet

C-13
Table C-6 AMT Modules; Pilot Test 6 Arrangement : Two Banks of Five Modules in Series Oil : 3.5 PSIg Delivered, 5.0 Centistokes Viscosity, 1.8 L/min Oil Flow Air : 100 ft3/min
Pilot Test 6 - CEM Data, 9/8/2000
Time Inlet PPM
Time Outlet PPM
3:29 PM 366.1821 3:32 PM 361.1989 3:34 PM 325.1082 3:37 PM 254.8396 3:39 PM 334.672 3:42 PM 247.4906 3:44 PM 320.6786 3:47 PM 247.6919 3:49 PM 295.3598 3:52 PM 229.9234 3:54 PM 276.4839 3:57 PM 89.58748 3:59 PM 33.56385 4:02 PM 50.67798

C-14
Pilot Test 7, 8, and 9 - CEM Data, 9/8/00
-200
0
200
400
600
800
1000
1200
3:30 PM 3:37 PM 3:44 PM 3:51 PM 3:58 PM
Time
PPM Inlet
Outlet
Figure C-6. AMT Modules, Pilot Test 6, 100 ft3/min Air, 1.8 L/min Oil Flow

C-15
Table C-7 AMT Modules; Pilot Test 7 Arrangement : Two Banks of Five Modules in Series Oil : 6.0 PSIg Delivered, 5.0 Centistokes Viscosity, 6.0 L/min Oil Flow Air : 100 ft3/min
Pilot Test 7 - CEM Data, 9/12/00 Time Inlet
PPM Time Outlet
PPM 2:47 PM 225.8462 2:49 PM 183.0105 2:52 PM 234.5039 2:54 PM 187.9937 2:57 PM 229.118 2:59 PM 190.7119 3:02 PM 228.0106 3:04 PM 187.9938 3:07 PM 221.316 3:09 PM 144.4534 3:12 PM 28.42958 3:14 PM 47.70815 3:17 PM 13.32888 3:19 PM 38.4464

C-16
Pilot Test 12 - CEM Data, 9/12/00
-200
0
200
400
600
800
1000
1200
2:49 PM 2:51 PM 2:54 PM 2:57 PM 3:00 PM 3:03 PM 3:06 PM 3:09 PM 3:12 PM 3:14 PM
Time
PPM Inlet
Outlet
Figure C-7. AMT Modules, Pilot Test 7, 100 ft3/min Air, 6.0 L/min Oil Flow

C-17
Table C-8 AMT Modules; Pilot Test 8 Arrangement : Two Banks of Five Modules in Series Oil : 6.0 PSIg Delivered, 5.0 Centistokes Viscosity, 4.5 L/min Oil Flow Air : 136 ft3/min
Pilot Test 8 - CEM Data, 9/13/00 Time Inlet
PPM Time Outlet
PPM 4:12 PM -0.16108 4:09 PM -0.1611 4:17 PM 100.8123 4:14 PM 0.090625 4:22 PM 275.9805 4:19 PM 298.984 4:27 PM 271.5007 4:24 PM 203.7992 4:32 PM 259.6215 4:29 PM 200.0743 4:37 PM 242.2556 4:34 PM 196.8025 4:42 PM 219.0509 4:39 PM 185.1246 4:47 PM 32.15445 4:44 PM 85.35928 4:52 PM 16.90273 4:49 PM 740.3273 4:57 PM 92.10428 4:54 PM 983.5494 5:02 PM 9.352375 4:59 PM 64.77195

C-18
Figure C-8. AMT Modules, Pilot Test 8, 136 ft3/min Air, 4.5 L/min Oil Flow
-200
0
200
400
600
800
1000
1200
4:15 PM 4:22 PM 4:29 PM 4:36 PM 4:43 PM
Time
PPM Inlet
Outlet