final report june 6, 2012 - freightworks.org · the contents of this report do not necessarily...
TRANSCRIPT

FINAL REPORT
JUNE 6, 2012
SOUTHERN CALIFORNIA DELIVERS THE GOODS


This report was prepared for Southern California Association of Government (SCAG) by HDR Decision Economics (HDR). Funding: The preparation of this report has been financed in part through grant[s] from the Federal Highway Administration and Federal Transit Administration, U.S. Department of Transportation [DOT]. The contents of this report do not necessarily reflect the official views or policy of the U.S. Department of Transportation [DOT]. Note: The contents of this report reflect the views of the author who is responsible for the facts and accuracy of the data presented herein. The contents do not necessarily reflect the official views or policies of SCAG or DOT. This report does not constitute a standard, specification or regulation.


Goods Movement Border Crossing Study and Analysis
ww.udot.utah.gov/mountainview
ACKNOWLEDGEMENTS This study was possible through direct and indirect support from the following agencies/organizations:
Southern California Association of Governments
Imperial County Transportation Commission
U.S. Department of Homeland Security
State of California Department of Transportation
County of Imperial
City of Imperial
City of Brawley
City of Calexico
City of El Centro
City of Holtville
City of Calipatria
San Diego Association of Governments
Calexico Chamber of Commerce
El Centro Chamber of Commerce
Brawley Chamber of Commerce
Mexican Consulate
Imperial Valley Economic Development Corporation
Mexico’s Aduanas (Customs)
Industrial Development Commission of Mexicali
City of Mexicali
Cross Border Group

Goods Movement Border Crossing Study and Analysis
-800-596-2556
The study would also like to acknowledge and recognize the following companies that participated in the interviews:
Asociación de Agentes Aduanales de Mexicali A.C. Ensambles de Silleria
Ulloa Agencia Aduanal Estrella Nueva S de R. L. de C. V.
COTO Technology Fevisa
Furukawa Mexico Fletes y transportes Express
CANACINTRA Mexicali Fruvemex
Empresas Titan Golden West Transport
Delivamex/Fruvemex Mexicali Goodrich Aerospace
Acurride International Graham Packaging
Qualitech de Mexico Hanna Label
Estrella Nueva S. de R. L. de C. V. Hodoyan Navarro Agencia Aduanal
Data Products Imaging Solutions Insteel Panelmex
Tetra Pak plastic Mexico IVEMSA (Masimo)
Technicolor Home Entertainment Jonathan MFG
Tecnologías Integrales de Manufactura S. A. JR Transportes
Alen del Norte Jumex
R.L. Jones L‐N Safety Glass (Pilkington)
Bill Polkinhorn, Inc. Mexicali California Waves
Daniel Romero Customs Broker Mitsubishi
AAPO Orthodental, S.A. de C.V. (Dentsply)
Acurride International Persal
Agencia Aduanal Carrasco PPIMA Thermoforming
Agencia Aduanal Mancilla Productos Hola
Agencia Aduanal Medrano ProServ
Agrivizion Integradora QISDA
Alen del Norte Quali‐Tech Mexico
AMCOR de Mexico RHEEM
Andercraft de Mexico Robert Bosch
Aqualung Rockteen Stone Container de Mexico
Bio‐Technologies Sai
Block Mex Santoyo Transport
Breg de Mexico Serlogin
Cali Baja International Skyworks
Care Fusion Southwest Mex. Distributors, Inc.
CB Produce Stanley Black and Decker
CDI Electronics Technologies Displays Mexicana
Chromalloy Timsa, General Dynamics
Comandos Shuttle S. de R.L. de C.V. Transcafe Trucking
Data Products Imaging Solutions Transporte Gutierrez
Deacero Transporters Mena
Emerson Network Power Transportes Binacionales
Empresas Titan Tri‐state de Mexico
Vanguard Electronics

Goods Movement Border Crossing Study and Analysis
Page | i
CONTENTS
EXECUTIVESUMMARY ................................................................................................................................. 1
1 INTRODUCTION,PROJECTOBJECTIVESANDOVERVIEWOFSTUDYAREA ..................................................... 5
1.1 Project Objectives ..................................................................................................................................... 5 1.2 Overview of Study Area ............................................................................................................................ 6
1.2.1 Definition of Study Area .............................................................................................................................. 6 1.2.2 Freight Infrastructure ................................................................................................................................. 6 1.2.3 Socioeconomic Trends .............................................................................................................................. 11 1.2.4 Regional Economy .................................................................................................................................... 13
2 TRADE,INTEGRATIONANDREGIONALECONOMICDEVELOPMENT ............................................................ 15
2.1 Regional Conditions Before NAFTA ........................................................................................................ 15 2.2 Trade Organization Under NAFTA .......................................................................................................... 15 2.3 The Importance of Maquiladoras ........................................................................................................... 17 2.4 Changes in Labor Markets ...................................................................................................................... 20 2.5 Changes in Economic Activity ................................................................................................................. 21 2.6 Regulations Impacting Trade Flows ........................................................................................................ 23
3 INTERNATIONALTRADE&GOODSMOVEMENTINIMPERIALCOUNTY ....................................................... 26
3.1 Overview of U.S. Trade with Mexico through Imperial County Ports of Entry....................................... 26 3.2 Estimates of Freight Flows by Truck ....................................................................................................... 27 3.3 Estimates of Freight Flows by Rail .......................................................................................................... 29 3.4 Supply Chain Management ..................................................................................................................... 31
3.4.1 Border Crossing Processes ........................................................................................................................ 31 3.4.2 Survey Findings and Other Supply Chain Management Processes in the Border Region ......................... 34
4 ORIGIN–DESTINATIONSURVEYS .......................................................................................................... 41
4.1 Shipment Data ........................................................................................................................................ 41 4.1.1 Characteristics of the Sample ................................................................................................................... 41 4.1.2 Origin – Destination Results ..................................................................................................................... 44 4.1.3 Additional Company Survey Results ......................................................................................................... 51
4.2 Truck Intercept Data ............................................................................................................................... 54 4.2.1 Characteristics of the Sample ................................................................................................................... 54 4.2.2 Origin – Destination Results ..................................................................................................................... 55 4.2.3 Additional Truck Intercept Survey Results ................................................................................................ 62
4.3 Willingness‐To‐Pay ................................................................................................................................. 64 4.3.1 Attitude Towards Paying a Fee ................................................................................................................. 65 4.3.2 Required Time Savings to Pay Fee ............................................................................................................ 67 4.3.3 Willingness to Pay for 2‐hour Reduction in Border Crossing Time ............................................................ 69
5 BORDER‐CROSSINGTIMEMEASUREMENT .............................................................................................. 74
5.1 Description of Data Collection Sites ....................................................................................................... 74 5.2 Data Collection for Commercial Vehicles ............................................................................................... 76
5.2.1 Commercial Vehicle Population Characteristics ....................................................................................... 77 5.2.2 Commercial Vehicle Survey Protocol ........................................................................................................ 77 5.2.3 Characteristics of the Commercial Vehicle Sample ................................................................................... 79
5.3 Data Collection for Passenger Vehicles .................................................................................................. 80

Goods Movement Border Crossing Study and Analysis
Page | ii
5.3.1 Passenger Vehicle Population Characteristics .......................................................................................... 81 5.3.2 Passenger Vehicle Survey Protocol ........................................................................................................... 83 5.3.3 Characteristics of the Passenger Vehicle Sample ..................................................................................... 85
5.4 Data Management and Consistency Checks .......................................................................................... 86 5.5 Border‐Crossing Time Results ................................................................................................................. 87
5.5.1 Border‐Crossing Time Results for Commercial Vehicles ............................................................................ 87 5.5.2 Measurement of Queue & Inspection Times for Northbound Commercial Vehicles ................................ 90 5.5.3 Comparison with Perceived Border‐Crossing Times for Truck Drivers ...................................................... 91 5.5.4 Border‐Crossing Time Results for Passenger Vehicles .............................................................................. 92 5.5.5 Interpretation of Results ........................................................................................................................... 95
5.6 Comparison of Commercial Vehicle Northbound Border‐Crossing Times with Other POEs .................. 96 5.7 Economic Impact of Border Delays ........................................................................................................ 97
6 ECONOMICDEVELOPMENTOPPORTUNITIES ........................................................................................... 99
6.1 Incentives and Constraints ..................................................................................................................... 99 6.1.1 Incentives .................................................................................................................................................. 99 6.1.2 Constraints .............................................................................................................................................. 101
6.2 Transportation/ Warehousing/ Distribution Opportunities ................................................................. 101 6.2.1 Existing Opportunities ............................................................................................................................ 102 6.2.2 Opportunities Arising From Infrastructure Enhancement ....................................................................... 102
6.3 Agricultural and Food Processing Opportunities .................................................................................. 102 6.3.1 Existing Opportunities ............................................................................................................................ 102 6.3.2 Opportunities Arising From Infrastructure Enhancement ....................................................................... 103
6.4 Tourism Opportunities ......................................................................................................................... 103 6.4.1 Existing Opportunities ............................................................................................................................ 103 6.4.2 Opportunities Arising From Infrastructure Enhancement ....................................................................... 103
6.5 Energy Opportunities ............................................................................................................................ 104 6.5.1 Existing Opportunities ............................................................................................................................ 104 6.5.2 Opportunities Arising From Infrastructure Enhancement ....................................................................... 104
7 SUMMARYOFFINDINGSANDCONCLUSIONS .......................................................................................... 105
7.1 Study Findings ....................................................................................................................................... 105 7.2 Discussion on Border‐Crossing Time Measurement Technologies ...................................................... 107
7.2.1 Data Collection Method Comparison ...................................................................................................... 107 7.2.2 Comparison of Results ............................................................................................................................ 111
7.3 Conclusions ........................................................................................................................................... 112 7.4 Policy Recommendations ..................................................................................................................... 114
7.4.1 Optimize Use of Existing Capacity .......................................................................................................... 114 7.4.2 Improve Throughput ............................................................................................................................... 116 7.4.3 Expand Capacity ..................................................................................................................................... 116
7.5 Next Steps ............................................................................................................................................. 117
APPENDIXA:COMPLETELISTOFDESTINATIONSINU.S.FORNORTHBOUNDTRAFFIC,COMPANYSURVEYS ............ 120
APPENDIXB:COMPLETELISTOFORIGINSINU.S.FORSOUTHBOUNDTRAFFIC,COMPANYSURVEYS ...................... 121
APPENDIXC:COMPLETELISTOFDESTINATIONSINU.S.FORNORTHBOUNDTRAFFIC,TRUCKINTERCEPTSURVEYS122
APPENDIXD:COMPLETELISTOFORIGINSINU.S.FORSOUTHBOUNDTRAFFIC,TRUCKINTERCEPTSURVEYS ......... 123
APPENDIXE:ESTIMATIONOFECONOMICIMPACTOFBORDERDELAYS ................................................................ 124
APPENDIXF:DATASOURCESANDREFERENCES ................................................................................................. 126

Goods Movement Border Crossing Study and Analysis
Page | iii
TABLES
Table ES‐1. Summary Statistics for Commercial Vehicles, by Trip Direction ................................................................. 2 Table ES‐2. Adjusted Summary Statistics for Passenger Vehicles, by POE and Trip Direction ...................................... 3 Table ES‐3. Economic Impacts of Commercial and Passenger Vehicle Delays at Calexico (downtown) and Calexico
East ....................................................................................................................................................................... 3 Table 1. Industry Data Summary, 2009 (dollar estimates expressed in millions) ........................................................ 13 Table 2. Example of potential clients in Mexico for transfer services ......................................................................... 17 Table 3. Maquiladora Clusters in Mexico, as recorded by INEGI in 2006 .................................................................... 21 Table 4. Foreign Direct Investment in Mexico, by Economic Sector ........................................................................... 23 Table 5. Total Value Transported by Truck, 2011 ........................................................................................................ 27 Table 6. Top Trucks Destinations, 2011 ....................................................................................................................... 28 Table 7. Top 10 U.S. Trading States with Mexico by Truck, Value of Trade in 2011 and 2010 .................................... 29 Table 8. Total Value Transported by Freight Trains, 2011 ........................................................................................... 29 Table 9. Top Freight Trains Destinations, 2011 ........................................................................................................... 30 Table 10. Top 10 U.S. States Trading with Mexico by Rail, Value of Trade in 2011 and 2010 ..................................... 31 Table 11. Forms of Goods Movement Across the Border using Truck ........................................................................ 32 Table 12. Characteristics of Stakeholders Interviewed ............................................................................................... 35 Table 13. Main O/D Pairs Identified by Logistic Companies (listed in alphabetical order) .......................................... 40 Table 14. Summary of Interviews with Selected Regional Freight Stakeholders ........................................................ 40 Table 15. Name and Classification of Interviewed Companies .................................................................................... 41 Table 16. Goods Transported in Sampled Shipments, by Direction of Shipment ........................................................ 43 Table 17. Origin and Destination of Shipments by Type of Facility, Aggregate ........................................................... 48 Table 18. Origin and Destination of Shipments by Type of Facility, Northbound Flows ............................................. 48 Table 19. Origin and Destination of Shipments by Type of Facility, Southbound Flows ............................................. 49 Table 20. Industrial Parks in Mexicali and Corresponding Zip Codes .......................................................................... 50 Table 21. Equipment Used to Transport Goods Across the Border, Shipments .......................................................... 51 Table 22. Use of Drayage in Shipments, by Direction of Trade Flow ........................................................................... 52 Table 23. Modes of Transportation Used in the Region, by Direction of Trade Flow ................................................. 52 Table 24. Goods Transported in Sampled Trucks, by Trip Direction ............................................................................ 54 Table 25. Origin and Destination of Truck Trips by Type of Facility, Aggregate .......................................................... 60 Table 26. Origin and Destination of Truck Trips by Type of Facility, Northbound Trips .............................................. 61 Table 27. Origin and Destination of Truck Trips by Type of Facility, Southbound Trips .............................................. 61 Table 28. Truck Type Classification for Truck Intercept Surveys, by Trip Direction ..................................................... 62 Table 29. Tractor Type Classification for Truck Intercept Surveys, by Trip Direction .................................................. 62 Table 30. Use of Drayage on Truck Trips, by Trip Direction ......................................................................................... 64 Table 31. Observations Collected by Lane Type and POE, Passenger Vehicles ........................................................... 85 Table 32. Example of Tabulated Data for Border‐Crossing Time Measurements ....................................................... 86 Table 33. Distribution of Observations Classified as "Outliers" ................................................................................... 86 Table 34. Summary Statistics for Commercial Vehicles, by Trip Direction .................................................................. 89 Table 35. Summary Statistics for Commercial Vehicles, by Trip Direction and Crossing Procedure ........................... 89 Table 36. Adjusted Summary Statistics for Commercial Vehicles, by Trip Direction ................................................... 90 Table 37. Summary Statistics for Observed & Perceived Queue Times, Northbound Commercial Vehicles .............. 92 Table 38. Summary Statistics for Border‐Crossing Times, Passenger Vehicles ............................................................ 94 Table 39. Adjusted Summary Statistics for Passenger Vehicles, by POE and Trip Direction ....................................... 95 Table 40. Economic Impacts of Passenger Vehicle Delays at Calexico (downtown) and Calexico East ....................... 97 Table 41. Economic Impacts of Commercial Vehicle Delays at Calexico East .............................................................. 98 Table 42. Economic Impacts of Commercial and Passenger Vehicle Delays at Calexico (downtown) and Calexico East
............................................................................................................................................................................ 98 Table 43. Summary of Study Findings, by Theme ...................................................................................................... 105 Table 44. Summary of Strengths, Weaknesses and Findings/Recommendations for Each Method ......................... 110

Goods Movement Border Crossing Study and Analysis
Page | iv
Table 45. Comparison of Time Measurement Results for License Plate and Bluetooth Methods, Passenger Vehicles (Calexico Downtown) ........................................................................................................................................ 111
Table 46. Comparison of Time Measurement Results from Photographic Time Stamp and Bluetooth Methods, Commercial Vehicles (Calexico East) ................................................................................................................ 112
FIGURES
Figure 1. Overview of California‐Baja California Border Region .................................................................................... 7 Figure 2. Major Truck Routes in Imperial County .......................................................................................................... 8 Figure 3. Imperial County Rail Lines .............................................................................................................................. 9 Figure 4. Location of Warehouses in Vicinity of Calexico (downtown) POE ................................................................ 10 Figure 5. Location of Warehouses in Vicinity of Calexico East POE ............................................................................. 11 Figure 6. Transfer Service Along U.S.‐Mexico Border .................................................................................................. 16 Figure 7. Sources of Revenue, Mexicali Maquiladoras (monthly, 2010‐2011) ............................................................ 19 Figure 8. Value of Trade (Nominal Dollar Amount) ..................................................................................................... 26 Figure 9. Top 10 Commodities Traded through Imperial County POEs by Trucks, 2011 ............................................. 28 Figure 10. Top 10 Commodities Traded through Imperial County POEs by Rail, 2011 ............................................... 30 Figure 11. Goods Movement Across the Border by Truck, Forms 1 and 2 .................................................................. 32 Figure 12. Goods Movement Across the Border by Truck, Form 3.............................................................................. 32 Figure 13. Goods Movement Across the Border by Truck, Form 4.............................................................................. 33 Figure 14. Map of Main Destinations in California, Northbound Flows, Company Surveys ........................................ 45 Figure 15. Reported Destination for Northbound Shipments, Company Surveys ....................................................... 46 Figure 16. Map of Main Origins in California, Southbound Flows, Company Surveys ................................................. 47 Figure 17. Reported Origin of Southbound Shipments, Company Surveys ................................................................. 47 Figure 18. Main Origins and Destinations in the City of Mexicali, Company Surveys ................................................. 49 Figure 19. Share of Industrial Parks in Origins and Destinations, Company Shipments .............................................. 51 Figure 20. Number of Truck Providers Used per Shipment, by Direction of Trade ..................................................... 53 Figure 21. Share of Shipments To/From Large Companies in the Sample .................................................................. 53 Figure 22. Use of Trusted Traveler Program in Northbound Shipments ..................................................................... 54 Figure 23. Map of Main Destinations in California, Northbound Flows, Truck Intercept Surveys .............................. 56 Figure 24. Reported Trip Destinations for Goods Moved by Truck, Northbound Trips ............................................... 57 Figure 25. Map of Main Origins in California, Southbound Flows, Truck Intercept Surveys ....................................... 58 Figure 26. Reported Trip Origins for Goods Moved by Truck, Southbound Trips ....................................................... 58 Figure 27. Map of Selected Destinations outside California, Northbound Flows, Company and Truck Intercept
Surveys ................................................................................................................................................................ 59 Figure 28. Map of Selected Origins outside California, Southbound Flows, Company and Truck Intercept Surveys .. 60 Figure 29. Frequency of Crossing Using a Truck, Aggregate Responses ...................................................................... 63 Figure 30. Use of Trusted Traveler Programs by Interviewed Trucks .......................................................................... 64 Figure 31. Attitude Towards Paying a Fee to Reduce Wait Times at the Border, Northbound Shipments ................. 65 Figure 32. Attitude Towards Paying Fee to Reduce Wait Times at the Border, Northbound Truck Trips ................... 66 Figure 33. Attitude Towards Paying a Fee to Reduce Wait Times at the Border, Southbound Shipments ................. 67 Figure 34. Attitude Towards Paying Fee to Reduce Wait Times at the Border, Southbound Truck Trips ................... 67 Figure 35. Required Average Time Savings for Northbound Flows of Goods, by Interviewee Type ........................... 68 Figure 36. Required Average Time Savings for Southbound Flows of Goods, by Interviewee Type ........................... 69 Figure 37. Average Toll for 2‐Hour Reduction on Border‐Crossing Time, Northbound Flows..................................... 70 Figure 38. Willingness‐To‐Pay Curves for Northbound Company Shipments for a 2‐hour Wait Time Reduction at the
Border ................................................................................................................................................................. 70 Figure 39. Willingness‐To‐Pay Curves for Northbound Trucks for a 2‐hour Wait Reduction at the Border ................ 71 Figure 40. Average Toll for 2‐Hour Reduction on Border‐Crossing Time, Southbound Flows ..................................... 72 Figure 41. Willingness‐To‐Pay Curves for Southbound Trucks for a 2‐hour Wait Reduction at the Border ................ 72 Figure 42. Location of Data Collection Sites for Border‐Crossing Time Measurements .............................................. 74

Goods Movement Border Crossing Study and Analysis
Page | v
Figure 43. Calexico (downtown) POE Characteristics .................................................................................................. 75 Figure 44. Calexico East POE Characteristics ............................................................................................................... 76 Figure 45. Northbound Commercial Vehicle Traffic at Calexico East POE, 2009‐2011 ................................................ 77 Figure 46. Example of Photographic Stamp Methodology .......................................................................................... 78 Figure 47. Border‐Crossing Time Measurement Diagram, Commercial Vehicles, Calexico East POE ......................... 79 Figure 48. Observations Collected by Cargo Type and Crossing Procedure, Commercial Vehicles ............................. 80 Figure 49. Number of Northbound Passenger Vehicles per Month, Calexico (downtown) POE, 2009‐2011.............. 82 Figure 50. Number of Northbound Passenger Vehicles per Month, Calexico East POE, 2009‐2011 ........................... 82 Figure 52. Border‐Crossing Time Measurement Diagram, Passenger Vehicles, Calexico (downtown) POE ............... 83 Figure 51. Use of PDA Methodology............................................................................................................................ 83 Figure 53. Border‐Crossing Time Measurement Diagram, Passenger Vehicles, Calexico East POE ............................ 84 Figure 54. Distribution of Data Collection Efforts Throughout Sampling Period, Passenger Vehicles ........................ 85 Figure 55. Border Crossing Time for Northbound Trips, Commercial Vehicles ........................................................... 88 Figure 56. Border‐Crossing Time for Southbound Trips, Commercial Vehicles ........................................................... 88 Figure 57. Perceived Queue Time for Truck Drivers, by Trip Direction ....................................................................... 91 Figure 58. Passenger Vehicle Border‐Crossing Times at Calexico (downtown) POE, Northbound.............................. 92 Figure 59. Passenger Vehicle Border‐Crossing Times at Calexico (downtown) POE, Southbound .............................. 93 Figure 60. Passenger Vehicle Border‐Crossing Times at Calexico East POE, Northbound ........................................... 93 Figure 61. Passenger Vehicle Border‐Crossing Times at Calexico East POE, Southbound ........................................... 94 Figure 62. Northbound Average Border Crossing Times by Crossing Type and POE, Commercial Vehicles ............... 96 Figure 63. License Plate Time Stamp Method ........................................................................................................... 107 Figure 64. Bluetooth Equipment ............................................................................................................................... 107 Figure 65. Example of Sample Sizes Collected Through Bluetooth ........................................................................... 108 Figure 66. GPS Output After Processing .................................................................................................................... 109


Goods Movement Border Crossing Study and Analysis
Page | 1
EXECUTIVESUMMARY
With today’s global economy and time‐based competition, efficient freight transportation networks serve as extremely critical links between manufacturers, distributors, and consumers. Therefore, planning agencies across the Country are faced with the difficult task of planning, pro‐actively, for adequate transportation infrastructure and freight facilities that enhance goods movement in their region. This is particularly challenging for border regions for which limited information on true origin‐destination patterns and end‐to‐end travel times is available. In addition, such planning should not only seek to reduce current congestion delay, improve travel time reliability or safety, but also anticipate potential shifts of commodity flows and traffic across modes, routes, and ports of entry. Successful infrastructure planning, therefore, hinges on accurate and reliable multi‐mode freight data, gathered and validated through consensus among various transportation and community organizations.
The primary purpose of this project was to gather and synthesize information on goods movement across the U.S.‐Mexico border in Imperial County, in order to assist SCAG in its assessment of current infrastructure needs and in its general planning efforts. For that purpose, Origin – Destination (O/D) surveys and measurement of wait times at the border were collected in the two main Ports of Entry (POEs) of Imperial County: Calexico (downtown) and Calexico East.
The study found that maquiladora1 activity, fostered by the benefits of Foreign Trade Zones (FTZs) and improved logistics, is a key driver for the regional economy. Similar findings are reported in other binational areas (e.g., San Diego – Tijuana, Laredo – Nuevo Laredo) and can be mainly attributed to the trade liberalization resulting from the North American Free Trade Agreement (NAFTA), which spurred the mobilization of investment and resources into the border region, creating clusters of industries favored by the trade agreement.
In particular, this ‘clustering’ behavior was observed among firms in the city of Mexicali. The study found that firms establish themselves in industrial parks, and that these locations are important generators of border‐crossing tips, representing an important share of the origins and destinations of international trade flows.
The study validated the high degree of integration between the States of California and Baja California. Data on goods transported through Imperial County’s POEs shows that the main origin for northbound flows is the city of Mexicali, whereas the main destinations are located in the State of California (particularly, in the SCAG region). Similarly, southbound flows originate primarily in California (and specifically, in the SCAG area) and are bound almost entirely for the city of Mexicali.
Furthermore, the study was able to provide a high‐level characterization of the supply chain in the region. One of the important findings is that the structure of supply chains is different for large, multinational firms and regional ones. Large firms seem to have an integrated supply chain that reaches across both sides of the border while regional firms usually contract local companies to transport their goods.
1 ‘Maquiladora’ is the term used in Mexico for manufacturing operations commonly established in a free trade zone (FTZ).

Goods Movement Border Crossing Study and Analysis
Page | 2
Additionally, drayage was found to be an important element in the transportation of northbound goods across the border. As a natural consequence, warehouses were identified as key locations in the supply chain of goods.
More interestingly, though, is the fact that border‐crossing procedures differ based on the type of transportation company used. In particular, shipping companies in the study area make limited use of trusted‐traveler programs (such as FAST), while trucking companies use these programs consistently. One possible explanation for this observed behavior is the share of border‐crossing time in the total travel time of goods. In general, shipping companies reported a larger portion of long‐haul trips compared to truck companies, thus reducing the importance of border‐crossing time relative to total travel time.
In order to provide a complete assessment of the current conditions on border‐crossing infrastructure in the area, the study measured performance and reliability indicators for commercial and passenger vehicle traffic in the two main POEs in Imperial County. A variety of methods of data collection were used to measure border‐crossing travel time – including license plate matching (both using hand‐recorded and photographic time stamp methods), anonymous Bluetooth signal recording, and GPS data collection. Each of these methods has strengths and weaknesses based on their capacity to collect data, installation requirements, operating requirements (including manual labor), mobility, capacity to distinguish different types of traffic and overall accuracy. No single method provides the best solution to measuring border crossing times, and their utilization depends primarily on the characteristics of the individual project.
Using the data collected, performance statistics were defined as those related to the crossing conditions that would be faced by the average user of the POE, including average border‐crossing time, standard deviation of crossing times as well as minimum and maximum crossing times. Reliability statistics, on the other hand, were defined to characterize the entire set of possibilities observed in the sample, including the border‐crossing time for the 10th and 90th percentile of the sample as well as the median (50th percentile) crossing time.
Regarding commercial vehicles that use the Calexico East POE, northbound traffic was found to have better performance and reliability indicators when compared to southbound traffic. Table ES‐1 presents the indicators used in this comparison.
Table ES‐1. Summary Statistics for Commercial Vehicles, by Trip Direction Adjusted Statistic Northbound Southbound
Mean 0:48 0:55
Standard deviation 0:35 0:52
Minimum 0:06 0:02
Maximum 3:24 4:34
10th percentile 0:16 0:11
90th percentile 1:35 2:10
50th percentile 0:39 0:36
This particular finding was surprising, since along the U.S.‐Mexico border the norm is to find northbound crossing times that exceed those of southbound traffic. One possible explanation for this result is related

Goods Movement Border Crossing Study and Analysis
Page | 3
to the administrative changes made in Mexican office of Aduanas (customs) during the course of the study, where several inspectors and other staff members were replaced, including the POE administrator for Calexico East.
Based on the border‐crossing indicators presented in this study, the Calexico East POE has little to no competitive advantage over other commercial POEs in the region. Although a proper comparison between average border‐crossing times for trucks between different POEs was not possible, a side‐to‐side comparison of average border‐crossing times with other POEs in the U.S.‐Mexico border showed that Calexico East ranks, for the most part, in the middle of the cohort.
When comparing aggregate border‐crossing times for passenger vehicles, neither POE has a clear advantage over the other. However, further disaggregation of the data showed that for those users of SENTRI in the region, the Calexico (downtown) POE represents a better option since it features lower average crossing times and better reliability metrics. Despite this, the difference in crossing times between the two POEs (in the order of 3‐4 minutes) is very unlikely to create an important number of SENTRI drivers to “switch” to the better‐performing POE. The performance and reliability measures for both POEs are reported in Table ES‐2.
Table ES‐2. Adjusted Summary Statistics for Passenger Vehicles, by POE and Trip Direction
Adjusted Statistic Calexico (downtown) Calexico East
Northbound Southbound Northbound Southbound
Mean 0:33 0:02 0:34 0:03
Standard deviation 0:17 0:03 0:21 0:03
Minimum 0:00 0:01 0:00 0:01
Maximum 1:28 0:34 1:47 0:32
10th percentile 0:08 0:01 0:07 0:01
90th percentile 0:54 0:05 1:00 0:05
50th percentile 0:31 0:02 0:35 0:03
Sample size 2,134 818 1,284 862
Furthermore, the observed border‐crossing times at Calexico (downtown) and Calexico East POEs for both commercial and passenger vehicles were used to estimate the economic implications of border delays. It was found that the observed border‐crossing times cause significant revenue and output losses in the region, though the majority of the output lost is recorded in the Mexican side of the border due to a lack of diversification and a high degree of dependence from the Imperial Valley economy. However, the majority of the employment losses are felt on the U.S. side of the border, since the large number of person‐trips originating in Mexico that are forgone due to delays translates into less spending by Mexican nationals in retail stores located in Imperial Valley. The aggregate economic impact of border delays is presented in Table ES‐3.

Goods Movement Border Crossing Study and Analysis
Page | 4
Table ES‐3. Economic Impacts of Commercial and Passenger Vehicle Delays at Calexico (downtown) and Calexico East
Impact Metric California Imperial County
Mexico Baja California
Total Output Losses, $million ‐$620 ‐$384 ‐$755 ‐$629
Total Employment Losses, jobs ‐4,844 ‐4,479 ‐4,552 ‐3,880
Total Tax Revenue Losses, $million ‐$88 ‐$66 n/a n/a
Faced with delays at the border that affect economic activity in Imperial County, stated preference surveys were conducted to capture shipping companies and truck drivers’ willingness‐to‐pay from hypothetical reductions in border‐crossing time and improved reliability at the border. Results of the surveys differ by interviewee type (shippers and truck drivers) and by direction of flows but in general show a higher disposition by POE users to pay a fee on northbound movement of goods compared to paying a fee on southbound flows. This finding is in line with other studies in the border region.
Finally, to minimize the negative economic effects of delays at the border, the study recommends a set
of policy options on both sides of the border to reduce border‐crossing times. The options were derived
based on the specific characteristics of the Imperial Valley POEs. In most cases, the options require
cooperation among Federal, state and local agencies to be successfully implemented. The options focus
on freight traffic (i.e., trucks) and can be divided into three broad categories: (i) optimize use of existing
capacity, (ii) improve throughput, and, (iii) expand capacity. Each option is described separately.

Goods Movement Border Crossing Study and Analysis
Page | 5
1 INTRODUCTION,PROJECTOBJECTIVESANDOVERVIEWOFSTUDYAREA
With today’s global economy and time‐based competition, the role of freight transportation has become more critical than ever as an efficient link between manufacturers, distributors and consumers. Public entities across the country are faced with the difficult task of ensuring adequate transportation infrastructure and freight facilities to enhance goods movement in their region. This is particularly challenging for regions along the United States‐Mexican border which have significant trade flows but lack information on true origin‐destination patterns and end‐to‐end travel times.
The Southern California Association of Governments (SCAG), the nation's largest metropolitan planning organization, hired HDR Decision Economics (HDR) to assess the mobility of commerce at the California‐Baja California border and to develop freight planning strategies that would address long term trade and transportation infrastructure needs in the region.
As part of that effort, this report provides an overview of commodity flows by truck and rail and associated economic activity in the border region, with a particular focus specifically on Imperial County. It examines the trends and characteristics of international trade that determine the demand for freight activities across the border, focusing on international trade between the United States (U.S.) and Mexico and regional economic integration along their border (including a detailed assessment of goods movement associated with the maquiladora industry).
1.1 ProjectObjectives
The objectives of this study are twofold. First, the findings and recommendations presented in this document will support SCAG in its planning efforts towards developing the 2012 Regional Transportation Plan. Second, this report assesses current infrastructure needs in the California – Baja California border region using four different approaches:
Review of recent cross‐border studies,
Analysis of data available from national and regional sources,
Primary data collection including freight flow O‐D surveys and cross‐border travel time measurements for commercial and passenger vehicles, and
Data analysis and stakeholder review.
The report is divided into 7 sections:
Section 1 is the introduction to the report including overview of the study area.
Section 2 discusses the close link between trade and regional economic integration, analyzing topics such as the organization of trade along the border, the relevance of the maquiladora industry in the regional economy and how recent regulatory and legislative changes in the U.S. and Mexico have impacted trade.
Section 3 describes the state of international trade and goods movement in Imperial County, providing detailed statistics on freight movement by Port of Entry (POE), mode and commodity.

Goods Movement Border Crossing Study and Analysis
Page | 6
This section also presents some results related to supply chain management characteristics in the region.
Section 4 presents results from the Origin – Destination surveys and the attitudes of users of border‐crossing infrastructure to pay to improve reliability at the Ports of Entry of Calexico (downtown) and Calexico East.
Section 5 describes the process used to collect border‐crossing travel times and reports the summary statistics for the data collected. Additionally, the estimated economic impacts of delays at the border are estimated and reported.
Section 6 analyzes future economic development opportunities for the study area, including not only freight‐related activities but also agriculture, tourism and energy production.
Section 7 provides a summary of findings and conclusions and provides policy recommendations and next steps.
1.2 OverviewofStudyArea
This chapter provides a general overview of the study area, with an emphasis on Imperial County. After a brief introduction, Section 1.2.2 presents the freight infrastructure (e.g., major roadways and ports of entry). Socioeconomic trends and projections as well as a discussion of today’s regional economy are provided in Sections 1.2.3 and 1.2.4, respectively.
1.2.1 DefinitionofStudyArea
The study area is defined as the California‐Baja California border region. It encompasses San Diego County and Imperial County on the U.S. side and the State of Baja California in Mexico (including all of its 5 counties). The region is home to six land Ports of Entry (POEs). Three of them are located in San Diego County (San Ysidro‐Puerta México, Otay Mesa‐Mesa de Otay and Tecate‐Tecate); and the remaining POEs are located in Imperial County (Calexico West‐Mexicali I, Calexico East‐Mexicali II and Andrade‐Los Algodones).
An overview map of the California‐Baja California border region with all major roadways is provided in Figure 1.
1.2.2 FreightInfrastructure
The freight infrastructure analyzed in this study consists of roads, rail, ports, airports and warehouse facilities used to move goods across Imperial County.
Roadway Infrastructure and Ports of Entry
Imperial County has a well‐developed roadway network that meets its current freight transportation needs, but may not in the near future. The highway system currently handles over 95 percent of all commodity flows across the county: in 2007, over 20 million tons of goods (valued at almost $50 billion) were transported by truck.2 Expected population growth (see Section 1.2.3) and increases in foreign
2 San Diego Association of Governments (2010), Comprehensive Freight Gateway Study, prepared by HDR Decision Economics, February 2010.

Goods Movement Border Crossing Study and Analysis
Page | 7
trade will likely require infrastructure improvements in order to accommodate future demand projections3.
Figure 1. Overview of California‐Baja California Border Region
The county is connected to Mexico through three (land) POEs: Calexico West‐Mexicali I, Calexico East‐Mexicali II, and Andrade‐Los Algodones. Only the last two process commercial truck traffic.
The Calexico East‐Mexicali II POE serves more than 99 percent of all commercial truck traffic crossing through Imperial County POEs4. It is located roughly 130 miles east of San Diego and 60 miles west of Yuma, Arizona. It is served by State Route 7, with direct connection to Interstate 8, about five miles to the north.
The Andrade‐Los Algodones POE is an important gateway for tourism between California and Baja California. This gateway is used primarily by pedestrians from the U.S. wishing to shop or use medical services in Los Algodones. The port‐of‐entry also accommodates privately owned vehicles, buses, and a limited amount of commercial traffic. It is sometimes used for relief of congestion at Calexico East‐Mexicali II. Vehicular access to Interstate 8, two miles to the north, is provided by State Route 186.
3 See, for example, the Comprehensive Freight Gateway Study prepared for the San Diego Association of
Governments (2010) for estimates of freight growth in the region.
4 Source: U.S. Department of Transportation, Bureau of Transportation Statistics. Transborder Surface Freight Data.

Goods Movement Border Crossing Study and Analysis
Page | 8
The major truck routes in Imperial County include three major north‐south freight corridors and two major east‐west corridors, as illustrated below.
The three major north‐south freight corridors are:
State Route 7 (SR‐7) to/from the Calexico East border crossing;
State Route 111 (SR‐111) to/from the Calexico West border crossing; and
State Route 86 (SR‐86).
The two major east‐west corridors are:
Interstate 8 (I‐8) which originates in San Diego County and ends at the junction with Interstate 10 (I‐10) just southeast of Casa Grande, Arizona; and
State Route 98 (SR‐98) which runs parallel to Interstate 8 through most of the county.
According to the Imperial County 2007 Transportation Plan Highway Element some of the most noticeable gaps in the county’s truck network include5:
Lack of direct freeway connections to rail yards and intermodal facilities;
5 Imperial Valley Association of Governments (2008), Imperial County 2007 Transportation Plan Highway Element. Prepared by KOA Corporation, March 2008.
Figure 2. Major Truck Routes in Imperial County
Source: Caltrans, 2010 Legend: Green routes – STAA National Network; Blue Routes – STAA Terminal Access; P – Rest Area
Goods Movement Border Crossing Study and Analysis
Page | 9
Lack of dedicated truck lanes, passing lanes, and truck bypass routes; and
High truck traffic through urban areas including Brawley and Westmorland.
Rail Infrastructure
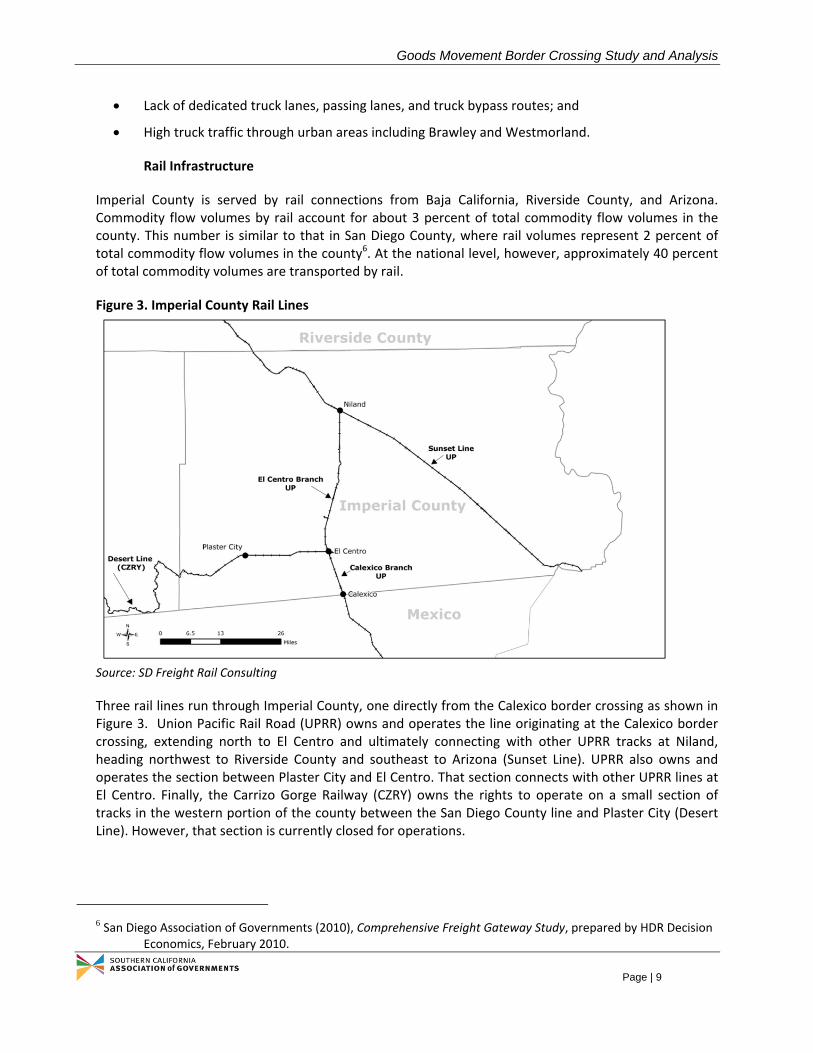
Imperial County is served by rail connections from Baja California, Riverside County, and Arizona. Commodity flow volumes by rail account for about 3 percent of total commodity flow volumes in the county. This number is similar to that in San Diego County, where rail volumes represent 2 percent of total commodity flow volumes in the county6. At the national level, however, approximately 40 percent of total commodity volumes are transported by rail.
Figure 3. Imperial County Rail Lines
Source: SD Freight Rail Consulting
Three rail lines run through Imperial County, one directly from the Calexico border crossing as shown in Figure 3. Union Pacific Rail Road (UPRR) owns and operates the line originating at the Calexico border crossing, extending north to El Centro and ultimately connecting with other UPRR tracks at Niland, heading northwest to Riverside County and southeast to Arizona (Sunset Line). UPRR also owns and operates the section between Plaster City and El Centro. That section connects with other UPRR lines at El Centro. Finally, the Carrizo Gorge Railway (CZRY) owns the rights to operate on a small section of tracks in the western portion of the county between the San Diego County line and Plaster City (Desert Line). However, that section is currently closed for operations.
6 San Diego Association of Governments (2010), Comprehensive Freight Gateway Study, prepared by HDR Decision
Economics, February 2010.

Goods Movement Border Crossing Study and Analysis
Page | 10
Seaport and Airport Infrastructure
Being landlocked, Imperial County has no seaport operations within its borders. Imperial County businesses do export goods through the major seaport ports of Los Angeles and Long Beach, as well as through the nearby Unified Port of San Diego.
Meanwhile, there are four airports in the County, including three open to the public: the Brawley Municipal Airport, the Cliff Hatfield Memorial Airport and the Imperial County Airport.
Located partially in the City of Imperial, the Imperial County Airport is the largest in the county (with two runways and a total surface of 429 acres). It is mostly used for general aviation and cannot handle large volumes of freight.
Warehousing Infrastructure
Imperial County houses a number of warehousing facilities adjacent to the Calexico POE and near the junction of the UPRR tracks north of El Centro at Niland.
Figure 4. Location of Warehouses in Vicinity of Calexico (downtown) POE

Goods Movement Border Crossing Study and Analysis
Page | 11
Figure 5. Location of Warehouses in Vicinity of Calexico East POE
Trucks originating from and traveling to the Calexico area move goods between the maquiladora industries located on both the U.S. and Mexican sides of the border at Calexico and Mexicali, as well as to other destinations within Imperial County, including El Centro.
Satellite images showing the exact location of warehousing facilities in the Calexico border crossing area are provided in Figure 4 and Figure 5.
1.2.3 SocioeconomicTrends
Located in the Colorado Desert, Imperial County is a sparsely populated county with relatively little economic activity. Over the last two decades economic growth in the area has been fueled by international trade, mainly due to its proximity to the Mexican border.
Population
As of January 2010, the county’s population represented 0.5 percent of the statewide population (or 183,029 individuals).7 More than 60 percent of the population was concentrated in three cities: El Centro, Calexico and Brawley.
Although home to a small number of residents overall, Imperial County has seen rapid growth in recent years. In the two decades since 1990, the population of Imperial County grew by 69 percent (or 2.7 percent per year on average), much faster than the 8.2 percent population growth during those two
7 California Department of Finance, Demographic Research Unit, Reports and Research Papers, http://www.dof.ca.gov/research/demographic/reports/view.php.

Goods Movement Border Crossing Study and Analysis
Page | 12
decades experienced by California overall. More than half of the increase in Imperial County population is attributed to net migration. However, since the onset of the recession in 2007 the rate of demographic growth has been declining. Nevertheless, over the 2008‐2035 period, population in Imperial County is expected to increase by 69 percent (from 170 to 288 thousand residents), adding pressure to POE facilities and connecting roads.8
Employment
Overall, employment has been increasing in Imperial County since 1990, though not at a high enough rate to keep pace with the growth in population. Employment in 2011 (estimated at 53,900 jobs) was 20 percent higher than in 19909. On the other hand, the unemployment rate has remained very high, averaging 23 percent over the last two decades. During 2011, the unemployment rate was 29.7 percent, one of the highest in the nation. This figure is partly due to the fact that communities with a seasonal economies (such as Imperial Valley’s agriculture), tend to have greater seasonal variations in employment, resulting in higher unemployment rates during off‐seasons. In addition, a considerable share of Imperial County residents are not proficient in English and therefore experience difficulties integrating into the educational system and the workplace environment. According to the U.S. Census American Community Survey, about 37 percent of Imperial County’s adults age 25 and over have not completed high school.
Future trends appear favorable, though, as employment is expected to grow 2.7 percent annually between 2010 and 2030, above the expected growth rate for California as a whole. Overall an additional 59,000 are projected.10 Three industries are projected to contribute to the majority of job growth in the county: professional and business services; leisure and hospitality; and government.
Income
In 2010 (latest available year) the median household income in Imperial County was $38,685, significantly lower than that for the state as a whole ($60,883).11 About 21.4 percent of the population was below the federal poverty level, including 28.3 percent of those under the age of 18 and 14.7 percent of those aged 65 or over.12
8 Southern California Association of Governments (2012). Regional Transportation Plan 2012‐2035, Growth Forecast Appendix. April 2012.
9 California Employment Development Department, Labor Market Information, http://www.labormarketinfo.edd.ca.gov/
10 SCAG (2008), 2008 Regional Transportation Plan: Making the Connections. May 2008.
11 U.S. Census Bureau. American Community Survey. 2006‐2010 American Community Survey 5‐Year Estimates, http://www.census.gov/acs/www/
12 Ibid.

Goods Movement Border Crossing Study and Analysis
Page | 13
Imperial County also has the lowest personal income per capita in California ($27,342 in 2010), in part because more than 30 percent of the population is not of working age. However, this figure did increase by 44 percent from 2000 to 2010, faster than the 27 percent increase at the State level.13
1.2.4 RegionalEconomy
The economy of Imperial County is dominated by the agriculture, retail trade and government. Together they account for more than half of total employment. Historically, the economy has been heavily based on agriculture supported by irrigation of water supplied from the Colorado River via the All‐American Canal. However, the structure of the economy has been changing since the enactment of the North American Free Trade Agreement (NAFTA) in 1994. Between 2010 and 2015 most new jobs will come from transportation warehousing and utilities (880 jobs), retail trade (700 jobs), construction (660 jobs), and state and local government (650 jobs). Farm production is actually forecast to decline by 1.0 percent per year over the same period.14
Table 1 below shows 2009 county industry data for a number of metrics, including employment (expressed in full‐ and part‐time jobs), business output (or total business sales), value added (i.e., business output minus the cost of purchasing intermediate products),15 and labor income (earnings). The data is reported by aggregate industry at the 2‐digit NAICS level.
Table 1. Industry Data Summary, 2009 (dollar estimates expressed in millions)
Industry Employment Output Total Value Added
Labor Income
Total 68,835 $9,931 $5,072 $3,283
Agriculture, forestry, fishing & hunting 10,418 $2,323 $825 $479
Mining 499 $222 $124 $30
Utilities 493 $537 $224 $58
Construction 1,737 $239 $123 $104
Manufacturing 2,238 $1,298 $184 $118
Wholesale trade 2,077 $329 $216 $125
Retail trade 8,011 $475 $401 $250
Transportation & warehousing 3,162 $355 $166 $128
Information 443 $102 $45 $20
Finance & insurance 1,420 $261 $124 $61
Real estate & rental 1,008 $617 $420 $23
Professional (scientific & technical services) 1,431 $118 $77 $63
Management of companies 222 $29 $14 $12
Administrative & waste services 2,166 $159 $101 $81
Educational services 370 $19 $12 $10
Health & social services 4,919 $294 $170 $157
Arts (entertainment & recreation) 313 $16 $10 $7
13 U.S. Department of Commerce, Bureau of Economic Analysis, Regional Economic Accounts. Local Area Personal Income, http://www.bea.gov/regional/reis/default.cfm?selTable=CA1‐3§ion=2
14 California Department of Transportation, California County‐Level Economic Forecast 2010‐2035, prepared for the Office of Transportation Economics by California Economic Forecast, March 2010.
15 Value added is also equivalent to the Gross Regional Product.

Goods Movement Border Crossing Study and Analysis
Page | 14
Accommodation & food services 3,297 $193 $100 $70
Other services 3,994 $223 $134 $121
Government & non NAICs 20,618 $2,120 $1,602 $1,367
Source: IMPLAN, Imperial County 2009 data
Goods Movement Border Crossing Study and Analysis
Page | 15
2 TRADE,INTEGRATIONANDREGIONALECONOMICDEVELOPMENT
In this section, a set of regulations and commercial practices that have increased the integration of the U.S.‐Mexico border since the implementation of the North American Free Trade Agreement (NAFTA)16 were analyzed, especially in the Imperial County‐Mexicali area. In particular, the analysis found that growth in maquiladora17 activity, fostered by the benefits of Foreign Trade Zones (FTZs) and improved logistics have generated a significant increase in economic activity and trade such that trade has become a key driver for the regional economy. Section 2.1 describes the Pre‐NAFTA border conditions while Section 2.2 discusses the trade organization after the Agreement was implemented. Section 2.3 introduces the topic of maquiladoras and their impact in the economic activity of the region. Section 2.4 and Section 2.5 describe changes in labor markets and economic activity as a result of NAFTA. Finally, section 2.6 focuses on regulation influencing commodity flows in the study area and recent changes to it.
2.1 RegionalConditionsBeforeNAFTA
Prior to NAFTA, communities along the border had different economic conditions relative to their national economies depending upon whether they were in the U.S. or Mexico. Counties and cities in the U.S. side of the border featured per‐capita income and education levels below the U.S. national average as well as unemployment rates above the national average, while cities in the Mexican side had income and education levels above the national average and low unemployment rates.18 These differences were recognized when NAFTA was negotiated and several studies predicted an increase in regional integration due to higher trade volumes which would lead to improve in economic indicators for the entire border region.
2.2 TradeOrganizationUnderNAFTA
Most of the merchandise flows in the California‐Baja California region are made by truck to and from to the export‐oriented manufacturing and maquiladora industries. NAFTA included the liberalization of trucking services between the U.S., Canada and Mexico (e.g., all restrictions on cross‐border trucking were to be lifted); however, safety concerns have prevented the full implementation of the NAFTA clauses. Under NAFTA regulations, trucks may not perform point‐to‐point transportation of goods within a country different from the one in which they are registered (a practice called cabotage in transportation). Operationally, access for trucks from the U.S. and Mexico into the other country’s territory can be granted to two different jurisdictions: within the commercial zone19 or beyond the
16 NAFTA is a trilateral economic agreement among Canada, Mexico, and the United States. The objective of NAFTA is to phase out barriers to trade in goods and services in North America, eliminate barriers to investment and strengthen the protection of intellectual property rights.
17 ‘Maquiladora’ is the term used in Mexico for manufacturing operations commonly established in a free trade zone (FTZ), where factories import material and equipment on a duty‐free and tariff‐free basis for assembly, processing, or manufacturing. The products resulting from the maquiladora activities are then re‐exported to the country where the materials came from.
18 Clement, Norris, Sergio J. Rey, Noé Aarón Fuentes and Alejandro Brugués (2000). The U.S.‐Mexican Border Economy in the NAFTA Era: Implications for the Environment, published in the webpage of the Southwest Consortium for Environmental Research and Policy, http://www.scerp.org/pubs/m3c3.pdf
19 As defined in 49 CFR 372.241: Basically contiguous municipalities along the U.S.‐Mexico border.
Goods Movement Border Crossing Study and Analysis
Page | 16
commercial zone (i.e. within the entire territory) of the neighboring country20. To operate within the U.S. commercial zones, Mexican truckers are required to apply to Federal Motor Carrier Safety Administration (FMCSA) for an OP‐2 permit, whereas to operate beyond that area they must apply for an OP‐1 (MX) permit. Similarly, U.S. truckers are required to apply to Mexican Secretariat of Communications and Transportations (Secretaría de Comunicaciones y Transportes, SCT) for a permit to operate in any part of the Mexican territory.
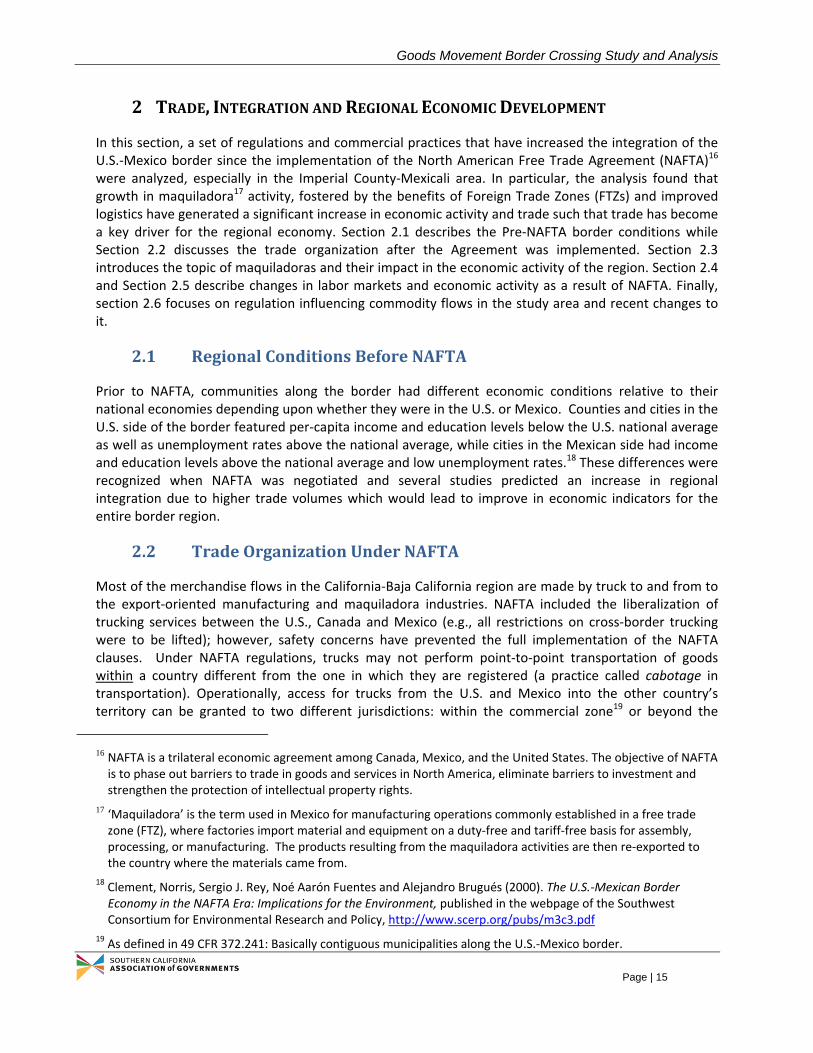
The large flow of commodities between Mexico and the U.S., the waiting times for cargo traffic at the international border crossings and the existence of a large number of warehouses used by freight forwarding companies along the commercial zones in the U.S. have encouraged the use of the “transfer” service to haul commodities across the border (see Figure 6). This service features a truck loading cargo within the commercial zone of one country and delivering it in the commercial zone of the other country (usually both pick‐up and drop‐off occur at warehouses). The goods transported are not necessarily produced in the commercial zone where they were picked‐up by the transfer truck and their final destination may not lie either in the commercial zone where they are to be dropped‐off. However, given its short‐haul characteristics, the transfer service is primarily used by firms producing goods in one commercial zone and needing to transport the final product to the neighboring country’s commercial zone (i.e. maquiladoras manufacturing goods for sale in the U.S.) as well as by long‐haul trucking companies hired by exporting firms to deliver the goods in the foreign country’s commercial zone (i.e. export‐oriented manufacturing firms). Table 2 shows an example of potential clients in Mexico for a transfer service company.
Figure 6. Transfer Service Along U.S.‐Mexico Border
Source: SCT, Unidad de Autopistas de Cuota
20 Mexican truckers under this category are also granted access to all the Canadian territory.

Goods Movement Border Crossing Study and Analysis
Page | 17
The main advantage of the transfer service depends on the market being served. For long‐haul transportation companies (hired by exporting firms located outside the commercial zone to carry goods across the border) use of the transfer service “frees up” resources that would otherwise have to spend time complying with the operating requirements of the other country and avoids idling their trucks and waiting at the border to clear inspections. For firms that produce goods within the commercial zones and either do not have their own transportation fleet or have trucks that are not permitted to operate in the other country’s roads, use of the transfer service represents the most convenient way to haul goods across the border.
Table 2. Example of potential clients in Mexico for transfer services U.S.
Transported Goods Origin (row) / Destination (column)
Within Commercial Zone Beyond Commercial Zone
Mexico Within Commercial Zone
Exporting firms in Mexico (including maquiladoras) with no transportation fleet or fleet without OP‐2 permit
Exporting firms in Mexico (including maquiladoras) with no transportation fleet or fleet without OP‐1 (MX) permit
Beyond Commercial Zone Long‐haul trucking companies in Mexico without OP‐2 permit
Long‐haul trucking companies in Mexico without OP‐1 (MX) permit
In addition to the transfers between the commercial zones of the two countries, increased trade across the border has been bolstered by the existence of multiple FTZs. In these zones, foreign goods are temporarily introduced and can benefit from tax savings based upon how they are used (including for transformations or repairs among other things).21 As a result of the associated tax savings and lower wages in Mexico, FTZs have been used by U.S. companies to export raw materials into Mexican manufacturing firms, where goods are processed or assembled, and then exported back in their finished state to the U.S. Originally these FTZs were located primarily along the border, but recent changes to the Mexican Customs Law now allow them to operate anywhere in the Mexican territory, and several FTZs have opened in mainland Mexico, creating logistic hubs such as San Luis Potosí and Guanajuato. Additionally, the ability to transfer goods from one FTZ to another within Mexican territory without losing any of the fiscal incentives (tax savings) is slowly creating a logistic and manufacturing network of FTZs that is expected to boost Mexican foreign trade with the U.S. (Intermodal México, 2010).
The existence of export‐manufacturing and maquiladora industries along the Mexicali‐Imperial Valley border (see below for a detailed analysis) means that transfers and FTZs play a key role in the regional trade patterns. Unfortunately, specific data on transfer operations cannot be found and thus the impact of this activity on regional integration can only be described in qualitative terms.
2.3 TheImportanceofMaquiladoras
The export‐oriented manufacturing and maquiladora industries have been an important factor in the growth of trade between the U.S. and Mexico since the implementation of NAFTA22. From January through‐September 2010, a total of 5,252 firms were enrolled in the Industria Manufacturera,
21 Guillén, Raúl (2010), ¿Qué son los Recintos Fiscalizados Estratégicos?, http://www.buenastareas.com/ensayos/Recinto‐Fiscalizado‐Estrategico/512898.html.
22 The index of physical volume of manufacturing production in Mexico increased 60% over the 1994‐2010 period.

Goods Movement Border Crossing Study and Analysis
Page | 18
Maquiladora y de Servicios de Exportación (IMMEX) program in Mexico, generating revenues for 1,742,224.5 million pesos (approximately 136.7 billion dollars).23 These same firms spent 1,572,920.4 million pesos (approximately 121 billion dollars) on production inputs, with 72.2 percent of those inputs imported).24
Firms participating in the IMMEX program can be located anywhere in Mexico, but most are in Baja California (927 firms, or 18.2 percent of total participants at the end of 2011). Within Baja California, the largest concentration of IMMEX businesses is in Tijuana (including Playas de Rosarito) with 554 firms, followed by Mexicali with 157, Tecate with 124 and Ensenada with 92 companies (at the end of 2011). At the State level, IMMEX businesses employed an average of 223,303 people during 2011 (including direct hires and subcontracting) and paid 28,341.1 million pesos (2.1 billion dollars) in wages, benefits and social security throughout the year. During 2011, these IMMEX companies recorded revenues for 104,279.9 million pesos (7.9 billion dollars) and bought inputs valued at 246,696.4 million pesos (18.6 billion dollars) – of the total revenues 85.0 percent came from exports and of the total inputs 97.7 percent were imported.25 These commercial flows have an important effect of regional economic integration, since the majority of the commodities traded remain within the California‐Baja California region26.
In Mexicali, companies listed as IMMEX are primarily maquiladoras in the traditional sense: industrial facilities near the border on the Mexican side where inputs are usually imported from U.S. suppliers to be processed and/or assembled and then exported back to the U.S. to be sold to the final consumers. As such, they focus on buying their inputs and selling their goods in the U.S. market, creating important commodity flows across the border in the process: the 157 firms listed in the program had 33,129.9 million pesos (2.5 billion dollars) in revenues during 2011, 74.4 percent of which were reported as exports (see Figure 7 for more details). Similarly, of the 45,688.8 million pesos (3.4 billion dollars) spent by these companies on inputs during that period, 93.7 percent were imports. Datasets prior to 2007 (where maquiladora activities are clearly identified) show that Mexicali’s maquiladoras produce several types of goods including electronics equipment, metalworking equipment, automotive products, plastics, aerospace products and textiles.27
Despite a lack of recent disaggregated data on maquiladoras (due to the introduction of a new Federal incentive program for the export manufacturing industry), Mexico’s National Institute of Statistics and Geography (Instituto Nacional de Estadística y Geografía, INEGI) estimates that 46.5 percent of the
23 The IMMEX program is a Federal incentives program in Mexico to foster economic activities related to manufacturing, maquiladora and export services.
24 INEGI (2010b). Estadística Mensual del Programa de la Industria Manufacturera, Maquiladora y de Servicios de Exportación (IMMEX): Cuadros y Gráficas con Cifras Nacionales (Julio 2007‐Septiembre 2010). http://www.maquilaportal.com/news/data/files/statistics/2010‐12%20INEGI's%20IMMEX%20Report.pdf
25 Ibid.
26 One recent study found that goods passing through POEs on the California‐Baja California border for the most part remain within those two states. Based on BTS data the study estimated that approximately 70 percent, of goods by value, crossing the border have both origin and destination in California or Baja California. See Kema, Inc. (2009). Increasing Fuel Efficiency and Alternative Fuel Use in Freight Movement Across the California/Baja California Border, prepared for the California Energy Commission.
27 See Kema, Inc. (2009). Increasing Fuel Efficiency and Alternative Fuel Use in Freight Movement Across the California/Baja California Border, prepared for the California Energy Commission.
Goods Movement Border Crossing Study and Analysis
Page | 19
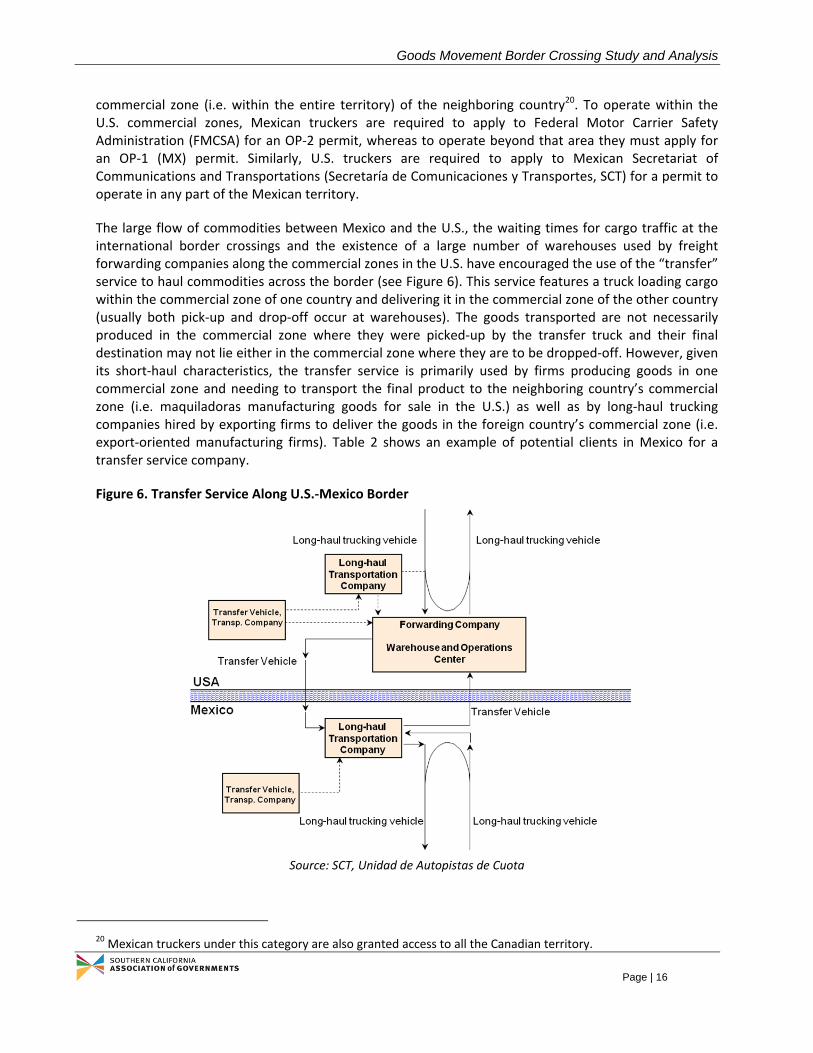
revenues generated by the IMMEX companies in Mexicali come from maquiladora activities. Since this sector is closely integrated with the U.S. economy, the recent recession had an impact on maquiladora revenues in Mexicali. Total revenues in 2009 declined by 11.0 percent compared to 2008, led mainly by an 18.0 percent reduction on revenues from foreign markets (i.e., U.S.) during the same period. Though the literature estimating the effects of increased economic activity along the U.S.‐Mexico border and regional economic integration is sparse, some authors estimate that a 10 percent increase in maquiladora output in a Mexican border city results in 1 to 2 percent increment in employment in the adjacent U.S. city.28 Using that estimate, the reduction in economic activity at the maquiladoras during the 2008‐2009 period resulted in a 1 to 2 percent decrease in employment in Imperial County.
Figure 7. Sources of Revenue, Mexicali Maquiladoras (monthly, 2010‐2011)
Source: INEGI, Banco de Información Económica (BIE)
The future economic performance of Mexican maquiladoras is uncertain, since competition from Asia (especially China) for low‐wage manufacturing jobs has eroded the maquiladoras that once had traditional competitive advantages. This global trend, along with the low‐degree of domestic supply‐
28 Cañas, Jesus and Robert Gilmer. The Maquiladora’s Changing Geography, Federal Reserve Bank of Dallas, Second Quarter 2009
‐
500
1,000
1,500
2,000
2,500
3,000
Million Pesos
Domestic Revenue Foreign Revenue
Goods Movement Border Crossing Study and Analysis
Page | 20
chain integration documented by some authors29, suggests that the traditional maquiladora model (e.g., based on low‐cost labor) may not be sustainable. In what could be a response to this situation, studies have found that some maquiladoras have evolved from the usual labor‐intensive activities to greater degrees of organization complexity, technology utilization, research and skill specialization and are even incorporating new activities based on coordination and information technologies to survive in the current global market.30 As such, the future of the manufacturing and maquiladora industry in the Baja California region could be shaped over the next few years by those strategic decisions.31
2.4 ChangesinLaborMarkets
The implementation of NAFTA generated important changes in the labor markets on the U.S.‐Mexico border region. A key factor underlying labor markets is migration, which usually is directed towards regions with high economic performance. The increase in trade along the U.S.‐Mexican border region since 1994 attracted a large number of migrants to the border cities, and net migration is recognized as the main source of population growth in Imperial Valley over the last 20 years.32
As expected, trade liberalization led to increased economic activity in the border region and in turn boosted the already fast‐growing employment. Employment in Mexican cities along the border grew at rates above the national average both before and after trade liberalization led mainly by jobs in the maquiladora and export‐oriented manufacturing industries.33 Similarly, total employment in metropolitan areas along the U.S. side of the border increased at a higher rate than the national average in both the pre‐NAFTA (1990‐93) and post‐NAFTA (1994‐1998) periods, however, the average annual percent increase in employment was higher in the post‐NAFTA.34
Despite this growth in employment, regional unemployment rates on the U.S. side have remained high and well above the national rate, indicating in increase in the labor market larger than the growing economy could absorb. Using data from eight Metropolitan Statistical Areas (MSAs) located in the U.S. side of the border researchers reported that between 1990 and 1993, border region unemployment rates averaged 133.0 percent of the national figure, but the corresponding figure between 1994 and 1998 was 150.6 percent.35 In line with these findings, Imperial County’s total employment grew 20 percent over the last 20 years, but its unemployment rate of 29.7 percent in 2011 is one of the highest in the country.
29 See, for example, Ruiz Durán, Clemente and Jorge Carrillo (2007). MNCs Strategies and their linkages with SMEs, http://www.colef.mx/jorgecarrillo/multinacionales/reportes/archivos/Ruiz%20y%20Carrillo%20MNCs%202007.pdf
30 Carrillo, Jorge and Arturo Lara (2005). “Mexican Maquiladoras: New Capabilities of Coordination and the Emergence of New Generation of Companies.” Innovation: Management, Policy & Practice, vol. 7/2 ‐ April 2005
31 Ibid.
32 See section 1.2.3 of this document.
33 Clement, et al (2000). The U.S.‐Mexican Border Economy in the NAFTA Era: Implications for the Environment. Published in the webpage of the Southwest Consortium for Environmental Research and Policy, http://www.scerp.org/pubs/m3c3.pdf
34 Peach, James T., and Richard V. Adkisson (2000), “NAFTA and economic activity along the U.S.–Mexico border.” Journal of Economic Issues 34(2): 481–89.
35 Ibid.

Goods Movement Border Crossing Study and Analysis
Page | 21
Despite the economic activity generated from increased trade flows, there has not been a significant increase in per‐capita income in cities along the border in either country. Even though Imperial County’s per‐capita income grew above the state’s average during the 2000‐2010 period, but is still the lowest per‐capita income in California.
2.5 ChangesinEconomicActivity
The trade liberalization from NAFTA spurred the mobilization of investment and resources into the border region and in industries favored by the trade agreement such as manufacturing, trade and financial services. As such, after 1994 there was an increase of Foreign Direct Investment (FDI) from U.S.‐based investors into the Mexican counties and cities along the border. This FDI concentrated mainly around the maquiladora industry due to the existence of (comparatively) low Mexican wages for manufacturing activities.
However, the maquiladora industry requires a well‐integrated supply chain to operate efficiently. As such, suppliers of inputs for this activity tried to minimize transportation costs and thus moved closer to the center of the maquiladora activity, opening depots in the U.S. counties along the border. Similarly, distributors of the finished products produced by the maquiladoras established warehouses and distribution centers in the U.S. side along the border with the idea of simplifying their distribution network, making it more efficient. This shift of economic factors towards the border region brought along the creation of “clusters” specialized in servicing the new model of maquiladora production.
Mexico’s INEGI gathered data on maquiladora activity from 1990 to 2006 and classified it into 11 main groups (and one category for “others”), each one presumably representing a cluster (see Table 3). In 2006 (the last year before data for the maquiladora industry was combined with data for the export‐manufacturing industry), the three main clusters of maquiladoras, measured by the number of firms, were 1) electric and electronics materials and accessories, 2) transportation equipment and 3) other manufacturing.
Table 3. Maquiladora Clusters in Mexico, as recorded by INEGI in 2006
Cluster Percentage of total
firms Percentage of man‐
hours worked
Electric and electronic materials and accessories 22.20% 15.07%
Transportation equipment and accessories 21.64% 11.12%
Other manufacturing industries 14.97% 16.14%
Clothing and other textile products 14.44% 17.24%
Assembly and repair of electric and electronic machinery, tools, appliances, equipment and articles
10.44% 6.05%
Furniture, accessories and other metal and wood products 5.08% 10.75%
Services 4.44% 11.06%
Chemical products 2.92% 6.36%
Tools, equipment and parts (non‐electrical) 1.80% 2.65%
Selection, processing, packaging and canning of food 0.94% 1.49%
Toys and sport articles 0.65% 1.21%
Shoes and leather products 0.49% 0.87%
TOTAL 100.00% 100.00%

Goods Movement Border Crossing Study and Analysis
Page | 22
Source: INEGI, Banco de Información Económica (BIE)
Most of these clusters were established along the U.S.‐Mexico border and in some cases specific locations (such as a city or county) tend to specialize in the production of a particular type of good to seize economies of scale and scope. Examples of such specialization include electric and electronic goods in Tijuana, electronic and autoparts in Ciudad Juarez and textiles in the center and south of Mexico.36 However, the creation of clusters was not exclusive to the U.S.‐Mexico border: for example shoes and leather product clusters were generated close to skilled workers in the Mexican State of Guanajuato.
Most of the maquiladoras and export‐manufacturing companies are located in Baja California in Mexico. As such, several clusters are located in Baja California including those producing electronics, vehicles, wood furniture, metallurgical articles and textiles. Mexicali, the second most important city in the state (after Tijuana) in terms of total number of maquiladoras, features a concentration of electronics equipment, metalworking equipment, automobile products, plastics, aerospace products and textiles. In line with the rest of the industry, Mexicali’s maquiladora proprietorship is mainly in the hands of foreign nationals: approximately 65 percent are owned by U.S. investors and the remaining 35 percent are owned by Asian, French and Mexican nationals.37
Two recent economic trends in the border region could have an important impact on the movement of goods across the border: (i) the appearance of new classes of maquiladora firms less focused on assembly activities, and (ii) a shift in FDI from manufacturing (including maquiladoras) into services.
Recent studies discuss the emergence of new classes of maquiladora and export‐manufacturing firms in Mexico, which are moving away from traditional labor‐intensive assembly activities and into higher degrees of technology utilization, research and skill specialization along with coordination of global supply chains.38 It is not clear if this trend will increase the production of physical goods in the maquiladora industry or shift resources from production of goods into complementary activities such as design and research. If the former, the result would be an increase in the level of goods transported across the border; if the latter, the net results would be a lower level of border freight movement.
Since the implementation of NAFTA, more than half of the FDI flowing into Mexico has concentrated in the manufacturing sectors, mainly associated with the establishment of maquiladoras. However, FDI in maquiladoras began to decline in 2004 and then dropped significantly in 2008 and 2009 (see Table 4). Some authors see this trend as a permanent shift of investment away from manufacturing activities and into services (mainly financial).39 If this trend were to continue, maquiladora production growth can be
36 Hualde, Alfredo (2001). Formación educativa y formación en la empresa: un balance sobre las maquiladoras de la frontera mexicana, published in ECLAC’s homepage, http://www.eclac.org/publicaciones/xml/6/7256/AHualde.pdf
37 Kema Inc. (2009). Increasing Fuel Efficiency and Alternative Fuel Use in Freight Movement Across the California/Baja California Border. Prepared for the California Energy Commission.
38 See Carrillo and Lara (2005). “Mexican Maquiladoras: New Capabilities of Coordination and the Emergence of New Generation of Companies.” Innovation: Management, Policy & Practice, vol. 7/2 ‐ April 2005.
39 Hernández Moreno, María del Carmen, Alba Celina Soto and Miguel Ángel Vázquez Ruiz (2008). “Impacto Subregional del TLCAN: Sonora en el contexto de la frontera nort.” Frontera Norte, Vol. 20, núm. 40. July‐December 2008.

Goods Movement Border Crossing Study and Analysis
Page | 23
expected to slow down from the high levels it had been growing since 1994, leading to a reduction in the projected growth rate of goods movements across the border.
Table 4. Foreign Direct Investment in Mexico, by Economic Sector
Year Agriculture Mining and Extraction
Manufact‐uring
Electricity and Water
Construct‐ion
Trade
Transport‐ation and Communi‐cations
Financial Services
Other Services
Total
1994 0.1% 0.9% 58.2% 0.1% 2.4% 11.8% 6.8% 8.8% 10.9% 100.0%
1995 0.1% 0.9% 58.1% 0.0% 0.6% 12.1% 10.5% 12.8% 4.9% 100.0%
1996 0.4% 1.1% 61.4% 0.0% 0.3% 9.6% 5.5% 15.5% 6.2% 100.0%
1997 0.1% 1.1% 60.0% 0.0% 0.9% 15.4% 5.7% 9.2% 7.6% 100.0%
1998 0.3% 0.6% 59.8% 0.3% 1.6% 12.4% 5.2% 8.7% 10.9% 100.0%
1999 0.6% 1.8% 66.1% 1.1% 0.8% 10.4% 2.1% 5.6% 11.5% 100.0%
2000 0.5% 0.9% 55.2% 0.7% 0.9% 13.6% ‐10.7% 27.2% 11.6% 100.0%
2001 0.2% 0.0% 19.9% 1.1% 0.4% 7.9% 9.8% 55.2% 5.4% 100.0%
2002 0.4% 1.1% 36.5% 1.9% 1.5% 7.6% 16.6% 28.8% 5.5% 100.0%
2003 0.1% 0.9% 44.0% 2.1% 0.5% 9.6% 14.0% 18.6% 10.3% 100.0%
2004 0.1% 1.2% 55.9% 0.8% 1.6% 5.5% 6.8% 23.8% 4.2% 100.0%
2005 0.0% 0.8% 50.5% 0.9% 1.3% 12.8% 12.8% 7.5% 13.3% 100.0%
2006 0.1% 2.0% 50.3% ‐0.4% 2.0% 3.3% 3.2% 24.4% 15.2% 100.0%
2007 0.5% 5.7% 45.5% 0.4% 6.5% 5.3% 2.6% 24.8% 8.8% 100.0%
2008 0.1% 18.5% 30.4% 1.8% 3.5% 7.2% 5.8% 20.1% 12.5% 100.0%
2009 0.1% 4.8% 36.0% 0.7% 3.6% 9.3% 0.5% 21.8% 23.2% 100.0%
Source: INEGI, Banco de Información Económica (BIE)
A final topic worth mentioning is the future Punta Colonet multimodal project in Baja California (approximately 80 miles South of Ensenada) which is envisioned to capture a significant portion of the trade between U.S. and Asia (especially China). This project consists of a deep‐water port that will specialize in container handling and will feature a rail connection to the U.S. Class‐I railroad network. In 2008, the Mexican (SCT) published the Request for Proposals (RFP) for the construction and operating rights of the Punta Colonet port and railway; however, the conditions of the international financial markets combined with a weak transpacific freight market prompted SCT to put the process on hold. Press releases from SCT during 2010 reveal that it believes in order to make it a successful enterprise for private investors, the project will have to be scaled down to an initial capacity of approximately 1 million TEUs per year. Despite information from SCT that the tender process would resume in 2011, recent changes in the leadership of the Secretariat may delay this date even further. Based on interviews with SCT officials, the border‐crossing point for the rail connection from Punta Colonet has not been defined and several options (including the existing cross at Mexicali) are being evaluated for technical and operational feasibility.
2.6 RegulationsImpactingTradeFlows
During the last few years, several regulatory and legislative changes have had a significant impact on international trade along the U.S.‐Mexico border. In particular, Mexican legislation related to the export‐oriented manufacturing and maquiladora services, FTZs and border‐crossing trucking activities have increased the opportunities for integration.

Goods Movement Border Crossing Study and Analysis
Page | 24
One of the most important changes came in 2006, when Mexican Federal Government modified a series of previous decrees40 and created the Industria Manufacturera, Maquiladora y de Servicios de Exportación (IMMEX) program to foster economic activities related to manufacturing, maquiladora and export services. The IMMEX program allows Mexican companies to temporarily import goods used in their production processes without paying the general import tariff, the value added tax and any applicable compensatory quotas. The only IMMEX requisite is that the finished products are exported after their transformation in Mexico or that the resulting goods are used in export‐related services. The result has been a notable increase in cross‐border trade in materials and semi‐finished goods, as well as final products.
One notable research challenge was generated by the introduction of IMMEX. The program’s introduction generated a change in methodology for data recollection and therefore little disaggregated data for maquiladoras is available in comparable form across the entire for the 2007‐2010 period.41
Another important change was the modification of the Mexican Customs Law and the creation of the “Recinto Fiscalizado” (Foreign Trade Zone, FTZ) by the Federal Government in Mexico in December 2002. FTZs were created to facilitate, accelerate and simplify customs‐related activities and promote international trade. Under this regime, customs officers perform their duties of handling, storage, custody, loading and unloading of goods and taxation and custom clearance within a secluded facility operated by the private sector. This represented an important improvement over the previous customs model since it considerably increased the supply of FTZs (thus increasing the total capacity of goods that could be processed in them) compared to the previous case in which all these tasks had to be performed in a designated zone operated by the Federal Government, usually at the POEs.
Subsequent changes allowed FTZ users to temporarily import goods used as raw material in export‐oriented manufacturing activities (i.e. the IMMEX program), thus opening the possibility to develop FTZs in areas beyond the border region where export‐manufacturing activities have traditionally been concentrated (such as shoe manufacturing in Guanajuato). Over the last few years, several FTZs have been established in mainland Mexico (known as Interior Ports), creating a significant increase in the intermodal activity in the country.
Another important change came from the U.S., with the institution, and subsequent Congressional halt, a cross‐border border demonstration program to facilitate long‐haul transportation of goods between the U.S. and Mexico. The program was implemented in September 2007 by the U.S. Department of Transportation (USDOT) and SCT as a pilot program to test the long‐scale implementation of the trucking provisions included in NAFTA42. Under this pilot program, up to 100 trucks in each country were allowed (after registering and complying with administrative requirements) to perform long‐haul international operations beyond the border commercial zone. After almost a year of operation, on August 2008 FMCSA announced that the demonstration project was being extended from one year to the full three
40 The previous decrees established the Maquila de Exportación and PITEX programs. 41 INEGI. (2010a). Estadística del Programa de la Industria Manufacturera, Maquiladora y de Servicios de Exportación (IMMEX). December 2010. http://boletin‐infomail.typepad.com/DocumentosVarios/Estad%C3%ADstica_IMMEX‐Sept2010.pdf
42 The main NAFTA provision addressed by the demonstration program was the access of domestic trucks to the neighboring country and did not touch upon access of passenger buses to foreign markets or barriers to investment.

Goods Movement Border Crossing Study and Analysis
Page | 25
years allowed by statute. However, the Appropriations Act of 2009 included a specific provision prohibiting the use of any funds to support the pilot, and the effort ceased in March 2009.43 . Despite the fact that the number of trucks enrolled and the number of international crossings made under this program was significantly below expectations44, the Mexican Government retaliated by imposing tariffs on some U.S. products imported into Mexico. After a series of negotiations, USDOT and SCT recently agreed to work together to develop a new framework that will create an improved version of the demonstration project.
43 ‘‘[N]one of the funds appropriated or otherwise made available under this Act may be used, directly or indirectly, to establish, implement, continue, promote, or in any way permit a cross‐border motor carrier demonstration program to allow Mexican‐domiciled motor carriers to operate beyond the commercial zones along the international border between the U.S. and Mexico, including continuing, in whole or in part, any such program that was initiated prior to the date of the enactment of this Act.’’ (Federal Register, March 18, 2009).
44 Only 1,443 of the 12,516 total trips (11.5%) made by Mexican carriers into U.S. territory was identified by FMCSA to go beyond the commercial zone.

Goods Movement Border Crossing Study and Analysis
Page | 26
3 INTERNATIONALTRADE&GOODSMOVEMENTINIMPERIALCOUNTY
In this section, HDR presents estimates of existing freight flows through the Imperial County’s POEs which are transported by trucks and freight trains. A summary of total flows is provided first, followed by estimates disaggregated by mode, by commodity, and (where available) by origin and destination45. Finally, supply chain management characteristics present in the region are described and results from interviews with logistic experts are reported.
3.1 OverviewofU.S.TradewithMexicothroughImperialCountyPortsofEntry
The total value of of goods traded within and through Imperial County has grown rapidly since 1994, increasing from nearly $3 billion dollars to $12 billion dollars in 2011, as seen in Figure 8. The region’s trade also seems to be on the path to recover from the recent recession, as the total amount of goods traded grew 23.5 percent in 2010 and 15.3 percent in 2011 (compared to the corresponding previous year).
The Calexico East‐Mexicali II POE handled approximately 98 percent of the estimated trade flows in the region during 2011. Figure 8 shows that this POE has dominated the others in terms of trade activities in the region since 1997. This reflects the three POEs‘ different roles in the international trade market over time: operations at Calexico (downtown)‐Mexicali I have diminished and Andrade‐Los Algodones continues to be a busy gateway for pedestrian traffic.
Figure 8. Value of Trade (Nominal Dollar Amount)
Source: U.S. Department of Transportation, Bureau of Transportation Statistics, Transborder Surface Freight Data
45 Estimates are derived from the U.S. Department of Transportation, Bureau of Transportation Statistics, Transborder Surface Freight Data, which does not have any information of the origin and destination (O‐D) on imported goods. The O‐D survey conducted under Task 2 of this study and reported in Section 4 of this report was designed to provide such information as well as a better understanding of how and where goods are being shipped.
$0
$2
$4
$6
$8
$10
$12
1994 1995 1996 1997 1998 1999 2000 2001 2002 2003 2004 2005 2006 2007 2008 2009 2010 2011
Billions
Andrade Calexico (Downtown) Calexico East Total Trade Value
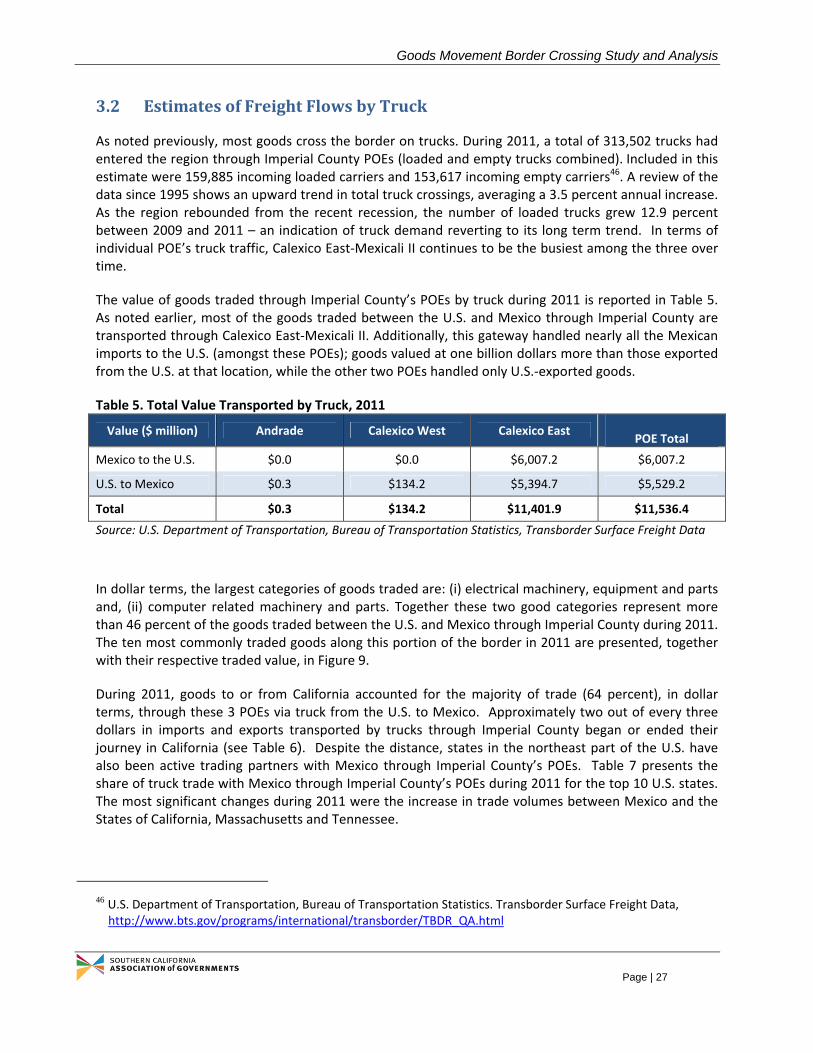
Goods Movement Border Crossing Study and Analysis
Page | 27
3.2 EstimatesofFreightFlowsbyTruck
As noted previously, most goods cross the border on trucks. During 2011, a total of 313,502 trucks had entered the region through Imperial County POEs (loaded and empty trucks combined). Included in this estimate were 159,885 incoming loaded carriers and 153,617 incoming empty carriers46. A review of the data since 1995 shows an upward trend in total truck crossings, averaging a 3.5 percent annual increase. As the region rebounded from the recent recession, the number of loaded trucks grew 12.9 percent between 2009 and 2011 – an indication of truck demand reverting to its long term trend. In terms of individual POE’s truck traffic, Calexico East‐Mexicali II continues to be the busiest among the three over time.
The value of goods traded through Imperial County’s POEs by truck during 2011 is reported in Table 5. As noted earlier, most of the goods traded between the U.S. and Mexico through Imperial County are transported through Calexico East‐Mexicali II. Additionally, this gateway handled nearly all the Mexican imports to the U.S. (amongst these POEs); goods valued at one billion dollars more than those exported from the U.S. at that location, while the other two POEs handled only U.S.‐exported goods.
Table 5. Total Value Transported by Truck, 2011
Value ($ million) Andrade Calexico West Calexico East POE Total
Mexico to the U.S. $0.0 $0.0 $6,007.2 $6,007.2
U.S. to Mexico $0.3 $134.2 $5,394.7 $5,529.2
Total $0.3 $134.2 $11,401.9 $11,536.4
Source: U.S. Department of Transportation, Bureau of Transportation Statistics, Transborder Surface Freight Data
In dollar terms, the largest categories of goods traded are: (i) electrical machinery, equipment and parts and, (ii) computer related machinery and parts. Together these two good categories represent more than 46 percent of the goods traded between the U.S. and Mexico through Imperial County during 2011. The ten most commonly traded goods along this portion of the border in 2011 are presented, together with their respective traded value, in Figure 9.
During 2011, goods to or from California accounted for the majority of trade (64 percent), in dollar terms, through these 3 POEs via truck from the U.S. to Mexico. Approximately two out of every three dollars in imports and exports transported by trucks through Imperial County began or ended their journey in California (see Table 6). Despite the distance, states in the northeast part of the U.S. have also been active trading partners with Mexico through Imperial County’s POEs. Table 7 presents the share of truck trade with Mexico through Imperial County’s POEs during 2011 for the top 10 U.S. states. The most significant changes during 2011 were the increase in trade volumes between Mexico and the States of California, Massachusetts and Tennessee.
46 U.S. Department of Transportation, Bureau of Transportation Statistics. Transborder Surface Freight Data, http://www.bts.gov/programs/international/transborder/TBDR_QA.html
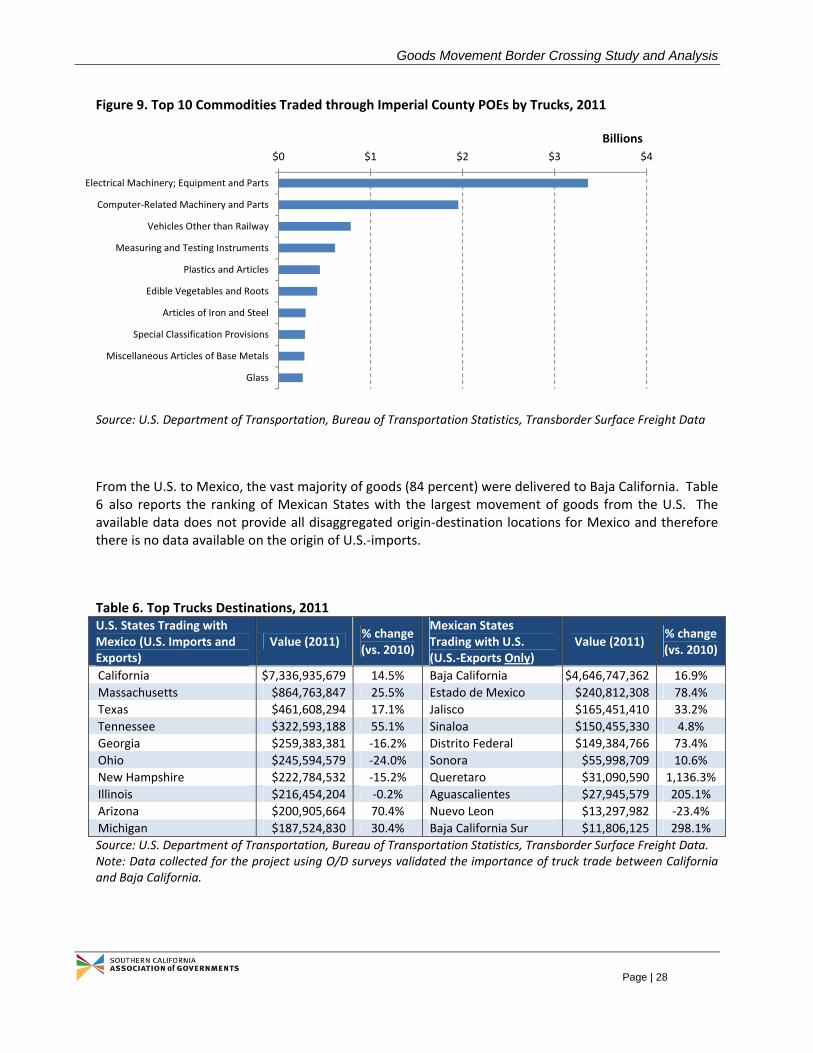
Goods Movement Border Crossing Study and Analysis
Page | 28
Figure 9. Top 10 Commodities Traded through Imperial County POEs by Trucks, 2011
Source: U.S. Department of Transportation, Bureau of Transportation Statistics, Transborder Surface Freight Data
From the U.S. to Mexico, the vast majority of goods (84 percent) were delivered to Baja California. Table 6 also reports the ranking of Mexican States with the largest movement of goods from the U.S. The available data does not provide all disaggregated origin‐destination locations for Mexico and therefore there is no data available on the origin of U.S.‐imports.
Table 6. Top Trucks Destinations, 2011 U.S. States Trading with Mexico (U.S. Imports and Exports)
Value (2011) % change (vs. 2010)
Mexican States Trading with U.S. (U.S.‐Exports Only)
Value (2011) % change (vs. 2010)
California $7,336,935,679 14.5% Baja California $4,646,747,362 16.9%
Massachusetts $864,763,847 25.5% Estado de Mexico $240,812,308 78.4%
Texas $461,608,294 17.1% Jalisco $165,451,410 33.2%
Tennessee $322,593,188 55.1% Sinaloa $150,455,330 4.8%
Georgia $259,383,381 ‐16.2% Distrito Federal $149,384,766 73.4%
Ohio $245,594,579 ‐24.0% Sonora $55,998,709 10.6%
New Hampshire $222,784,532 ‐15.2% Queretaro $31,090,590 1,136.3%
Illinois $216,454,204 ‐0.2% Aguascalientes $27,945,579 205.1%
Arizona $200,905,664 70.4% Nuevo Leon $13,297,982 ‐23.4%
Michigan $187,524,830 30.4% Baja California Sur $11,806,125 298.1%
Source: U.S. Department of Transportation, Bureau of Transportation Statistics, Transborder Surface Freight Data. Note: Data collected for the project using O/D surveys validated the importance of truck trade between California and Baja California.
$0 $1 $2 $3 $4
Electrical Machinery; Equipment and Parts
Computer‐Related Machinery and Parts
Vehicles Other than Railway
Measuring and Testing Instruments
Plastics and Articles
Edible Vegetables and Roots
Articles of Iron and Steel
Special Classification Provisions
Miscellaneous Articles of Base Metals
Glass
Billions
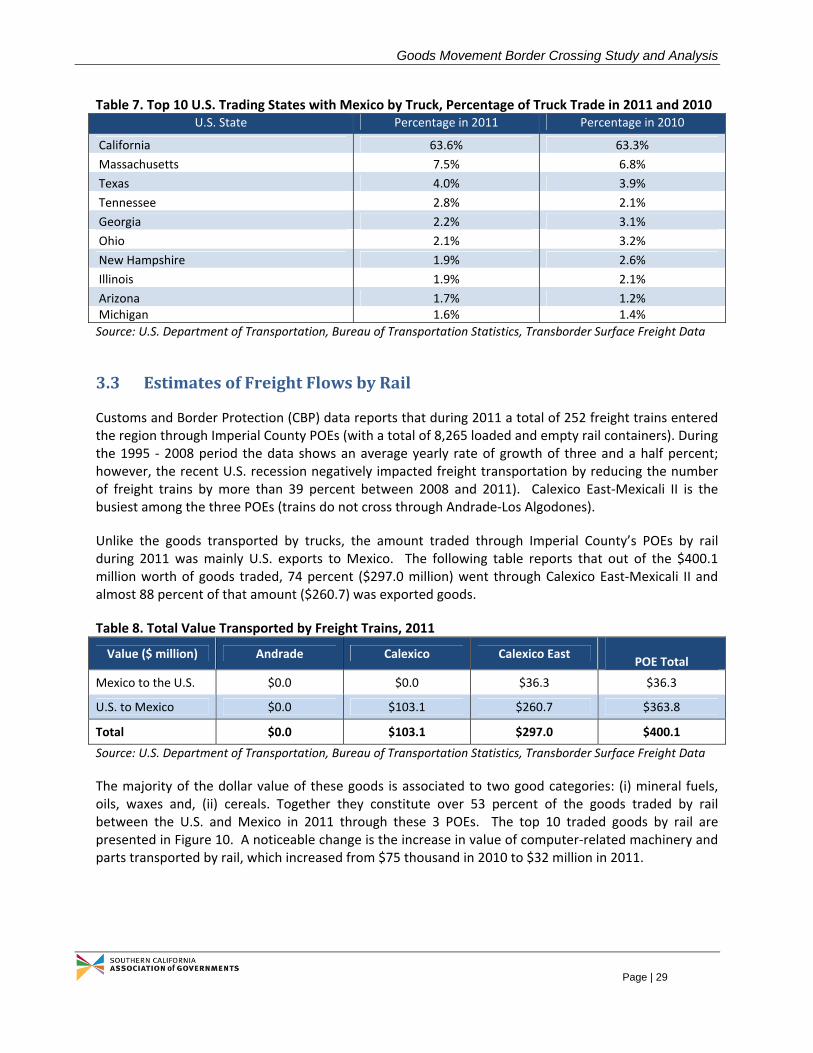
Goods Movement Border Crossing Study and Analysis
Page | 29
Table 7. Top 10 U.S. Trading States with Mexico by Truck, Percentage of Truck Trade in 2011 and 2010 U.S. State Percentage in 2011 Percentage in 2010
California 63.6% 63.3%
Massachusetts 7.5% 6.8%
Texas 4.0% 3.9%
Tennessee 2.8% 2.1%
Georgia 2.2% 3.1%
Ohio 2.1% 3.2%
New Hampshire 1.9% 2.6%
Illinois 1.9% 2.1%
Arizona 1.7% 1.2% Michigan 1.6% 1.4%
Source: U.S. Department of Transportation, Bureau of Transportation Statistics, Transborder Surface Freight Data
3.3 EstimatesofFreightFlowsbyRail
Customs and Border Protection (CBP) data reports that during 2011 a total of 252 freight trains entered the region through Imperial County POEs (with a total of 8,265 loaded and empty rail containers). During the 1995 ‐ 2008 period the data shows an average yearly rate of growth of three and a half percent; however, the recent U.S. recession negatively impacted freight transportation by reducing the number of freight trains by more than 39 percent between 2008 and 2011). Calexico East‐Mexicali II is the busiest among the three POEs (trains do not cross through Andrade‐Los Algodones).
Unlike the goods transported by trucks, the amount traded through Imperial County’s POEs by rail during 2011 was mainly U.S. exports to Mexico. The following table reports that out of the $400.1 million worth of goods traded, 74 percent ($297.0 million) went through Calexico East‐Mexicali II and almost 88 percent of that amount ($260.7) was exported goods.
Table 8. Total Value Transported by Freight Trains, 2011
Value ($ million) Andrade Calexico Calexico East POE Total
Mexico to the U.S. $0.0 $0.0 $36.3 $36.3
U.S. to Mexico $0.0 $103.1 $260.7 $363.8
Total $0.0 $103.1 $297.0 $400.1
Source: U.S. Department of Transportation, Bureau of Transportation Statistics, Transborder Surface Freight Data
The majority of the dollar value of these goods is associated to two good categories: (i) mineral fuels, oils, waxes and, (ii) cereals. Together they constitute over 53 percent of the goods traded by rail between the U.S. and Mexico in 2011 through these 3 POEs. The top 10 traded goods by rail are presented in Figure 10. A noticeable change is the increase in value of computer‐related machinery and parts transported by rail, which increased from $75 thousand in 2010 to $32 million in 2011.

Goods Movement Border Crossing Study and Analysis
Page | 30
Figure 10. Top 10 Commodities Traded through Imperial County POEs by Rail, 2011
Source: U.S. Department of Transportation, Bureau of Transportation Statistics, Transborder Surface Freight Data
In 2011, goods to or from California accounted for over 45 percent of the value traded by rail between the U.S and Mexico through the POEs in Imperial County. More than a third of the U.S.‐exported goods were transported to Baja California (approximately 35 percent) while another 31 percent were transported to the State of Estado de México. Table 9 presents the top 10 trading states in both Mexico and the U.S. that use Imperial County’s POEs while Table 10 shows the share of trade for the top‐10 U.S. States trading with Mexico via rail). This distribution, together with the data reported above, indicate that freight trains generally transport non‐time sensitive goods over long distances.
Table 9. Top Freight Trains Destinations, 2011 U.S. States Trading with Mexico (U.S. Imports and Exports)
Value (2011) % change (vs. 2010)
Mexican States Trading with U.S. (Export Only)
Value (2011) % change (vs. 2010)
California $163,647,057 56.0% Baja California $126,694,575 4.1%
Florida $36,877,940 NA Estado de Mexico $113,182,877 201.0%
Minnesota $33,578,837 196.2% Distrito Federal $48,425,664 179.2%
Illinois $30,860,107 37.1% Jalisco $47,519,121 141.4%
Idaho $19,505,715 166.0% Nuevo Leon $16,189,574 107.9%
Nebraska $15,679,702 44.3% Queretaro $4,563,032 NA
Louisiana $11,043,701 47.1% Guanajuato $2,636,526 29.3%
Iowa $7,529,931 ‐23.2% Baja California Sur $1,741,430 3956.8%
Texas $6,729,810 31.5% San Luis Potosi $1,034,962 NA
Oregon $5,848,526 7.5% Durango $871,877 15.7%
Source: U.S. Department of Transportation, Bureau of Transportation Statistics, Transborder Surface Freight Data.
$0 $20 $40 $60 $80 $100 $120
Mineral Fuels; Oils and Waxes
Cereals
Animal or Vegetable Fats and Oils
Computer‐Related Machinery and Parts
Paper and Paperboard
Iron and Steel
Malts; Starches and Inulin
Food Residues and Waste
Plastics and Articles
Electrical Machinery; Equipment and Parts
Millions

Goods Movement Border Crossing Study and Analysis
Page | 31
Table 10. Top 10 U.S. States Trading with Mexico by Rail, Percentage of Rail Trade in 2011 and 2010
U.S. State Percentage in 2011 Value in 2010
California 45.0% 50.2%
Florida 10.1% 0.0%
Minnesota 9.2% 5.4%
Illinois 8.5% 10.8%
Idaho 5.4% 3.5%
Nebraska 4.3% 5.2%
Louisiana 3.0% 3.6%
Iowa 2.1% 4.7%
Texas 1.9% 2.4%
Oregon 1.6% 2.6%
Source: U.S. Department of Transportation, Bureau of Transportation Statistics, Transborder Surface Freight Data
3.4 SupplyChainManagement
There are several factors that affect the creation and shape of supply chains across the border and in Imperial County. This section will explain the main characteristics of existing supply chains and will analyze factors that have an effect on them. Section 3.4.1 describes the main characteristics of supply chains that use truck as their main mode of transportation whereas section 3.4.2 analyzes supply chains that use other transportation modes.
3.4.1 BorderCrossingProcesses
Data from the USDOT shows 98 percent of the total value of goods traded with Mexico through POEs located in Imperial County is done by truck. As such, the most important supply chains in the study area rely heavily on this mode of transportation.
In general, goods movement by truck across the U.S.‐Mexico border can take one of four forms based on the country where the truck’s license plates are registered and the use or absence of a transfer service:
1. U.S. truck only
2. Mexican truck only
3. U.S. and Mexican trucks without transfer service
4. U.S. and Mexican trucks with transfer service
The distinction between U.S.‐registered and Mexico‐registered license plates is a key determinant in the shape of supply chains along the border, since national regulations in both countries establish that vehicles with foreign‐issued license plates must obtain special permits to operate in domestic territory (as described in section 2.2). For example, Table 11 shows the different possible forms in which goods can be moved across the border using truck given the specific permit or permits held by Mexican truckers.
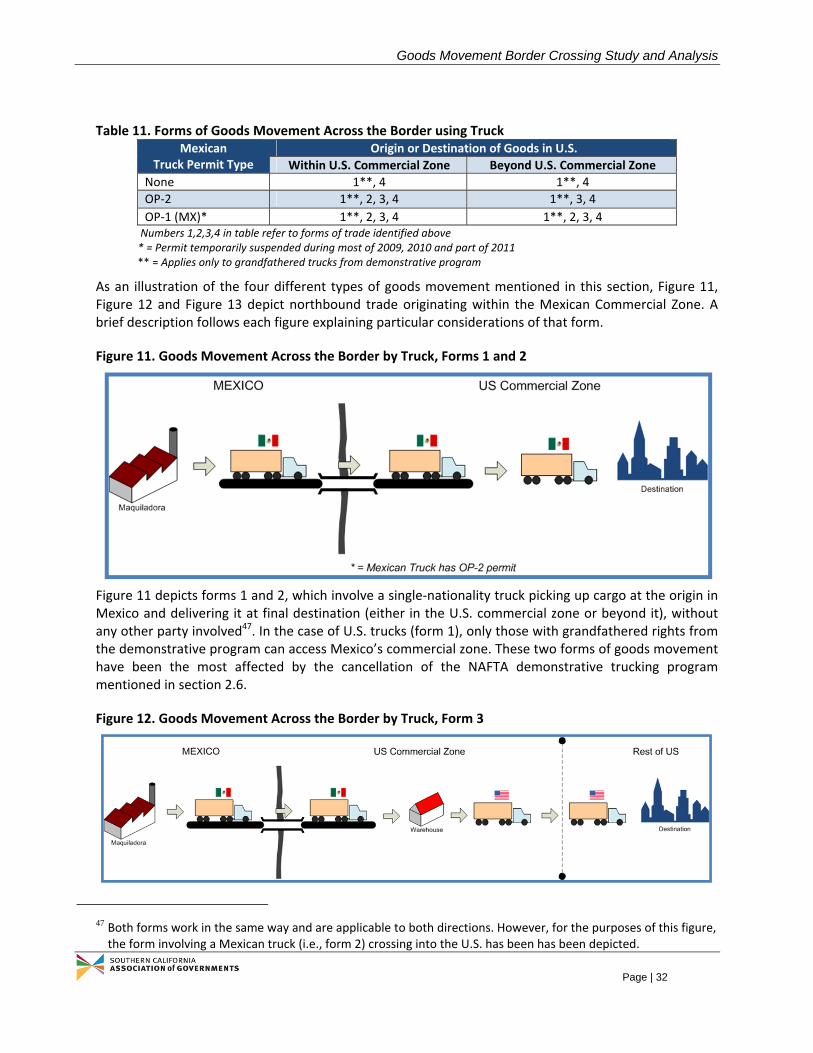
Goods Movement Border Crossing Study and Analysis
Page | 32
Table 11. Forms of Goods Movement Across the Border using Truck Mexican
Truck Permit Type Origin or Destination of Goods in U.S.
Within U.S. Commercial Zone Beyond U.S. Commercial Zone
None 1**, 4 1**, 4
OP‐2 1**, 2, 3, 4 1**, 3, 4
OP‐1 (MX)* 1**, 2, 3, 4 1**, 2, 3, 4 Numbers 1,2,3,4 in table refer to forms of trade identified above * = Permit temporarily suspended during most of 2009, 2010 and part of 2011 ** = Applies only to grandfathered trucks from demonstrative program
As an illustration of the four different types of goods movement mentioned in this section, Figure 11, Figure 12 and Figure 13 depict northbound trade originating within the Mexican Commercial Zone. A brief description follows each figure explaining particular considerations of that form.
Figure 11. Goods Movement Across the Border by Truck, Forms 1 and 2
Figure 11 depicts forms 1 and 2, which involve a single‐nationality truck picking up cargo at the origin in Mexico and delivering it at final destination (either in the U.S. commercial zone or beyond it), without any other party involved47. In the case of U.S. trucks (form 1), only those with grandfathered rights from the demonstrative program can access Mexico’s commercial zone. These two forms of goods movement have been the most affected by the cancellation of the NAFTA demonstrative trucking program mentioned in section 2.6.
Figure 12. Goods Movement Across the Border by Truck, Form 3
47 Both forms work in the same way and are applicable to both directions. However, for the purposes of this figure, the form involving a Mexican truck (i.e., form 2) crossing into the U.S. has been has been depicted.

Goods Movement Border Crossing Study and Analysis
Page | 33
Form 3 is shown in Figure 12. This form includes trucks from both sides of the border and typically involves a warehouse (or another similar facility) where cargo is transferred from the original carrier to a different one, that will then take it to final destination. It can also involve storage services48.
Figure 13. Goods Movement Across the Border by Truck, Form 4
Form 4 (depicted in Figure 13) also includes trucks from both sides of the border but requires contracting a “transfer service provider” who specializes in carrying cargo through the border‐crossing point. This form can also involve an external warehouse for the transfer of goods49.
Despite the well‐defined relationship between the forms of goods movement presented here and the nationality of the trucks involved in them, it is a well‐known fact that a significant number of trucks in the border region have license plates from both countries. This allows supply chain managers to be very flexible in terms of the logistic arrangements used in their supply chains.
However, cancellation of the NAFTA demonstrative trucking program50 led to temporary measures affecting cross‐border flows, since:
Mexican‐only trucks with northbound cargo cannot travel beyond U.S. commercial zones due to suspension of OP‐1 (MX) permits.
U.S.‐only truckers cannot enter Mexico (except those “grandfathered” from the demonstrative program).
As a result, some supply chain managers were forced to temporarily adjust their logistic arrangements to allow for these changes, at least while the issue of the suspension of the demonstrative program was resolved.
Another factor that affects the shape of supply chains along the U.S.‐Mexico border is the existence of programs aimed at facilitating cross‐border surface freight flows:
Customs‐Trade Partnership Against Terrorism (C‐TPAT): is a voluntary government‐private sector partnership in which companies involved in commerce destined for the U.S. demonstrate that they have implemented enhanced security measures within their facilities and day‐to‐day operations to prevent terrorists and weapons of mass effect from infiltrating the supply chain.
48 This figure applies to both directions of goods movements. For simplicity, the figure depicts northbound flows of
goods. 49 As in the previous cases, the figure applies to both directions of trade flows. 50 The demonstration program was reinstated in July 2011.

Goods Movement Border Crossing Study and Analysis
Page | 34
Free and Secure Trade (FAST): is a commercial clearance program for known low‐risk shipments entering the U.S. from Canada and Mexico. It allows for expedited processing for commercial carriers who have completed background checks and fulfill certain eligibility requirements.
FAST processing is available at 55 of 105 northern and southern land POEs that process commercial cargo and the majority of FAST processing occurs at dedicated FAST lanes51. However, participation in FAST requires that every link in the supply chain, from manufacturer to carrier to driver to importer is certified under C‐TPAT.
Finally, as it was described in section 2 of this document, there are two trends that may have important impacts on freight flows across the border:
Emergence of new classes of maquiladora firms less focused on assembly, with higher degrees of technology utilization, research and skill specialization along with coordination of global supply chains.
Shift in FDI from manufacturing (including maquiladoras) into services. This could represent a permanent shift away from manufacturing and into services (mainly financial).
It is not clear how the new classes of maquiladora will affect production in this industry and how will this impact the movement of freight across the border. It is clear, however, that if the shift in FDI were to continue, maquiladora output growth may slow down, leading to a reduction in the growth of cross‐border goods movement.
3.4.2 SurveyFindingsandOtherSupplyChainManagementProcessesintheBorderRegion
The data collection efforts for the project involved in‐depth interviews made to selected regional freight stakeholders, including customs brokers, freight forwarders and manufacturers on both sides of the border of the Imperial County / Mexicali area. The focus of the interviews was in the following twelve categories:
1 Recent Changes in Processes or Operations (for manufacturing firms) / Demand for services (for logistics firms)
2 Outlook on Import/Export Regions
3 Use of Local Companies
4 Border‐Crossing Logistics‐Chain Characteristics
5 Future Company Evolution (manufacturing firms) / Market Evolution (logistic firms)
6 Expected Impact of NAFTA Trucking Provisions
7 Perceptions on Existing Border‐Crossing Procedures
8 Use of Logistic/Freight Forwarding Services (for logistic companies only)
9 Freight Forwarding Process (for logistic companies only)
10 Storage as a Component of the Supply Chain (for logistic companies only)
51 FAST lanes are available at the Calexico East POE.

Goods Movement Border Crossing Study and Analysis
Page | 35
11 Size of Regional Logistics Subcontracting Market and Main O/D Pairs (for logistic companies only)
12 Challenges/Impediments for Logistics Companies (for logistic companies only)
Results from these interviews were divided into two groups given their distinct nature: (i) Manufacturing/Wholesale/Goods Consuming Firms (i.e., trip generators) and (ii) Logistics & Transportation Services Firms (i.e., trip operators).
The number of stakeholders interviewed was 18, as presented in Table 12, working for companies of all sizes.
Table 12. Characteristics of Stakeholders Interviewed
Company Name Classification
Asociación de Agentes Aduanales de Mexicali A.C.
Logistics / Transportation Service Provider
Ulloa Agencia Aduanal Logistics / Transportation Service Provider
COTO Technology Manufacturing Firm (electronics)
Furukawa Mexico Manufacturing Firm (automotive)
CANACINTRA Mexicali Manufacturing Firm (association)
Empresas Titan Manufacturing Firm (paper)
Delivamex/Fruvemex Mexicali
Manufacturing Firm (agriculture)
Acurride International Manufacturing Firm (furniture)
Qualitech de Mexico Manufacturing Firm (plastics)
Estrella Nueva S. de R. L. de C. V.
Manufacturing Firm (agriculture)
Data Products Imaging Solutions
Manufacturing Firm (recycling)
Tetra Pak plastic Mexico Manufacturing Firm (metal stamping)
Technicolor Home Entertainment
Manufacturing Firm (electronics)
Tecnologías Integrales de Manufactura S. A.
Manufacturing Firm (metal mechanic)
Alen del Norte Manufacturing Firm (chemicals)
R.L. Jones Logistics / Transportation Service Provider
Bill Polkinhorn, Inc. Logistics / Transportation Service Provider
Daniel Romero Customs Logistics / Transportation
Goods Movement Border Crossing Study and Analysis
Page | 36
Company Name Classification
Broker Service Provider
Recent Changes in Processes or Operations / Demand for Services
The majority of the manufacturing firms interviewed (75 percent) mentioned perceiving changes to their processes or types of operation. The main changes mentioned are:
Growth in demand for their production services (including new markets and maturation of existing markets); and
Technological advances of their productive processes
Despite the Great Recession experienced in 2008 and 2009 in the United States, only one company mentioned a reduction in demand for its products due to adverse economic conditions.
When asked to describe important variations observed in the demand for services over the last 5 to 10 years in the logistics market as a whole, the events identified by the logistic firms are those associated to a market that is constantly changing. The direction of the change is given mainly by national security concerns, and the changes are associated with the introduction of technology in the inspection process and the creation of the certification programs for companies.
Outlook on Import/Export Regions
Two thirds of the manufacturing companies mentioned they foresee changes on the regions they import from or export to over the next 3 to 5 years. Despite the fact that there is no consensus on the types of changes that will be experienced, some of the prospects include:
Growth in market size and demand;
Increased importance of certifications for transportation companies;
New logistic services such as site shipment and deliver;
Increased border crossing controls with a corresponding impact in crossing times; and
Innovative ways to reduce border crossing times
All logistic companies interviewed mentioned they foresee changes on the regions they import from or export to over the next 3 to 5 years. However, there is no consensus on the types of changes that will be experienced. Some of the prospects include:
Growth in market size and demand due to high productivity in Mexicali area;
No growth in production volumes due to economic crisis in the United States;
Innovative ways to reduce border crossing times, such as streamlining inspection processes into one.
As such, freight forwarders have a more optimistic perspective regarding border crossing times compared to manufacturing firms, for whom increased border crossing controls was mentioned as a concern.

Goods Movement Border Crossing Study and Analysis
Page | 37
Use of Local Companies
Approximately 47 percent of the interviewed manufacturing companies use local companies (i.e., from the Mexicali – Imperial County area) as part of their supply chain. The main activity supported by local companies is related to logistics (i.e., warehousing rental and transportation services).
All logistic companies interviewed mentioned that their customers do not use other local companies in the Mexicali‐Imperial County area. In their opinion, most local companies have either offices on both sides of the border or have their own warehouses along the border to store their inputs or production, thus making subcontracting of logistics companies their only interaction with local firms.
Border‐Crossing Logistics‐Chain Characteristics
For manufacturing firms, drayage52 is perceived as a common component of the logistics chain in the region: 75 percent of the companies mentioned it as an element in the process of goods movement53 (including those that say it is sometimes an element). This result is in line with the finding that half of the manufacturing companies interviewed use their own truck fleet to transport their shipments (in both northbound and southbound directions). However, when interviewees were asked if typically companies in their specific production sector owned or contracted out their transportation services, the results show that only a few manufacturing sectors typically own their transportation fleet (i.e., chemical, furniture and plastics). Finally, companies were asked about their participation on C‐TPAT program and the time savings generated by it. Of the companies surveyed, only 50 percent of them are certified under C‐TPAT, and their time savings are not homogeneous, showing a clear differentiation in the perception of the benefits provided by this program between different production sectors.
On the other hand, logistic companies perceive an improvement of border‐crossing times when using the C‐TPAT program; however, the benefits are not homogeneous among the respondents and in one occasion they were not quantified in terms of minutes but in comparison to crossing times without using the program. In a related question about the suggestions to improve the FAST and C‐TPAT border‐crossing programs, the interviewed firms validated their perceived usefulness of these expedited crossing procedures by recommending actions to make these programs more available: reduce requirements to enroll and increase the number of lanes and infrastructure where these procedures are used.
Future Company / Market Evolution
Manufacturing firms were asked to describe their outlook in 3 different areas: (i) volume; (ii) production processes; and, (iii) transportation processes. Two thirds of the respondents mentioned they foresee changes in at least one of the three areas:
Production volumes: The companies expecting changes to their future production volumes agree that their production will increase in the future.
Production processes: Of the companies that foresee changes in their production processes, half of them mentioned the change will come in the form of more
52 Drayage is the transport of goods over a short distance, often as part of a longer overall move. In the context of
this study, drayage is used to denote the transportation of goods from a location close to a POE on one side of the border to a location close to the POE on the other side of the border.
53 Including those that claim to use it only sometimes.

Goods Movement Border Crossing Study and Analysis
Page | 38
technification in the process. The other companies see changes related to certification standards for the production processes.
Transportation processes: There is no consensus on the future changes within the transportation processes. Answers ranged from legal concerns (e.g., enforcement of stricter laws) to technological ones (e.g., improvements on GPS). This suggests that transportation processes used in the region are non‐homogeneous and thus no clear, unique vision for their future can be established.
Similarly, logistic companies were asked to describe the outlook of the logistics/freight forwarding industry in two different areas: (i) volume; and, (ii) transportation processes. All of them mentioned they foresee changes in at least one of the three areas:
Production volumes: The experts that foresee changes in future cross‐border volumes agree that volumes will increase in the future mainly due to an increase in production levels in Mexicali and a resurgence of demand for these products in California.
Transportation processes: The two future changes in this area are identified as the introduction of vendor managed inventories (VMI) and the establishment of strategic alliances among companies to provide the logistic/freight forwarding services required by the clients.
These results suggest that the changes in the logistics market are expected to be driven by producers/manufacturers of the goods that are being transported and not by the transportation companies themselves.
Expected Impact of NAFTA Trucking Provisions
Manufacturing companies were asked about the possible impact(s) on their operations’ logistics management of allowing long‐haul shipments to be handled by Mexico‐based trucking firms. Only two firms did not see any significant impact; the remaining firms could identify at least one important impact. The majority of the expected impacts were described in terms of attributes of the goods movement process. Interviewees used phrases such as “cheaper goods movement,” “easier goods movement,” “better goods movement” and “faster goods movement” in more than half of their responses. The remaining responses were related to “improved competitiveness for Mexico,” “positive benefits for producers/manufacturers” and “improved tracking of shipments.”
In response to the same question, two‐thirds of the logistic experts did not see any significant impact. The remaining one‐third expected that an implementation of the NAFTA provision will force firms to increase their competitiveness by means of renewing their truck fleet and provide training to their drivers.
Perceptions on Existing Border‐Crossing Procedures
When asked to list the main issues with border‐crossing, manufacturing companies overwhelmingly mentioned the unreliability of the border crossing times. Another related topic that was highly mentioned was traffic congestion around the POEs. Finally, only a few companies considered that the overall wait time at the border is long, reflecting some degree of tolerance to the average crossing times in the region. Regarding the main causes for delays at the border, approximately 44 percent of the mentions went to the military checkpoints in Mexico. These checkpoints are located throughout the entire U.S. – Mexico border and are known to cause delays on northbound shipments of vegetables in states such as Sonora. The companies were also asked to provide transportation‐related suggestions to
Goods Movement Border Crossing Study and Analysis
Page | 39
benefit them. One third of the companies did not have any specific suggestion, while the rest mentioned a wide array of actions ranging from increased availability of certification programs to coordination issues between U.S. and Mexican authorities.
Similarly, when asked to list the main issues with border‐crossing, logistic companies mentioned exclusively the unreliability of the border crossing times. When asked to identify the reasons for the unpredictability in border‐crossing times, the companies identified four factors: infrastructure concerns (need for more lanes); dispatch management practices by logistic firms (wait until close‐of‐business to dispatch); staff requirements (more Aduanas and CBP personnel needed); and, operation of inspection facilities (compliance with hours of operation).
Use of Logistic/Freight Forwarding Services (for logistic companies only)
The main clients of the logistic companies interviewed were agricultural and manufacturing firms (including those in automotive, electronics and transportation equipment sectors). The main service provided by all interviewed companies is drayage services at the border, thus validating that this activity is of high relevance to the supply chains in the region. Regarding the primary characteristics of the service requested by clients, the range of responses is wide. This suggests that companies that use these logistics/freight forwarding services have different needs based on the goods they produce and the clients they sell them to.
Freight Forwarding Process (for logistic companies only)
When companies were asked to describe the processes involved in the transportation of goods across the border, the typical steps included the following:
Verification of merchandise requirements
Negotiation with client for price of service
Pick up goods from client’s warehouse
Contact custom broker (if needed)
Pay import cost (if needed)
Process re‐expedition permit (only if goods are being transported southbound beyond the border region)
Transportation of goods
Final delivery
Storage as a Component of the Supply Chain (for logistic companies only)
Interviewed firms concur that only small companies (defined either by the number of employees or the level of production) use storage as part of their supply chain. Based on their expert opinion, larger firms ship their goods directly to the final destination since their larger volumes allow it.
Size of Regional Logistics Subcontracting Market and Main O/D Pairs (for logistic companies only)
Interviewed companies concur that logistic companies in the region, as a whole, handle between 1,000 and 1,500 inbound truck shipments per day and between 1,500 and 2,000 outbound truck shipments per day, thus representing a considerable amount of the total traffic across the border.

Goods Movement Border Crossing Study and Analysis
Page | 40
Similarly, they mentioned the Origin‐Destination pairs shown in Table 13 as the most common ones.
Table 13. Main O/D Pairs Identified by Logistic Companies (listed in alphabetical order)
U.S. Mexico flows Mexico U.S. flows Calexico‐Mexicali Mexicali‐Calexico Long Beach‐Mexicali Mexicali‐Los Angeles Phoenix‐Mexicali Mexicali‐San Diego San Francisco‐Mexicali
Challenges/Impediments for Logistics Companies (for logistic companies only)
When asked about current challenges or impediments in the industry, two‐thirds of the logistics experts could not identify any. The other third only mentioned two issues: infrastructure bottlenecks when FAST and C‐TPAT lanes merge with other types of lanes and truck fleet renewal as a way of maintaining competitive advantage over other firms.
These two issues are very different in nature: whereas truck fleet renewal is a concern triggered by competition (i.e., internal market forces) that potentially affects a few companies, infrastructure bottlenecks are in the realm of governmental agencies (i.e., external factors) that affect all companies within the logistics industry.
Summary of Interviews
The summary of the interviews with manufacturing and logistic companies is presented in Table 14.
Table 14. Summary of Interviews with Selected Regional Freight Stakeholders
Topic Findings
Logistics & Supply Chain • Small degree of interaction between large companies and local firms
Private Sector Processes • Drayage is common component of border‐crossing goods transportation
Origin‐Destination • Import origin and export destination geographically concentrated, primarily in California‐Baja California area
Border‐crossing Travel Time • Border‐crossing time is perceived as unpredictable
Transportation Procedures • Benefits of FAST / C‐TPAT are heterogeneous
Strategic Infrastructure Development
• Unclear impact of NAFTA trucking provisions • Unclear future characteristics of transportation in region • No important challenges or impediments identified by transportation
experts
Goods Movement Border Crossing Study and Analysis
Page | 41
4 ORIGIN–DESTINATIONSURVEYS
Data on Origin‐Destination (O/D) pairs for the project was collected from two different sources: (i) shipment information provided by manufacturing companies and custom brokers and, (ii) truck information obtained via intercept surveys at the Calexico East POE. This section shows not only the main O/D pairs used by companies and truck drivers, but also provides information on additional characteristics of border‐crossing movements including the type of equipment used to transport goods across the border, use of drayage and trusted traveler programs and cargo transported. Finally, Section 4.3 reports the attitudes of users towards paying a fee to improve reliability at the POEs studied.
4.1 ShipmentData
4.1.1 CharacteristicsoftheSample
Shipment data was gathered as part of a larger effort to interview managers working at companies established in the region and engaged in international trade. A total of 63 companies were interviewed during April – November of 2011 and each company was asked to submit 40‐50 shipments that could be analyzed to obtain O/D and supply chain management information54. The list of companies is shown in Table 15.
Table 15. Name and Classification of Interviewed Companies
No. Company Name Logistics Intermediary (Custom Broker, 3PL
firm, etc.)
Manufacturer (Cargo/Product Source
or Destination)
Producer (Cargo/Product Source
or Destination)
1 AAPO ●
2 Acurride International ●
3 Agencia Aduanal Carrasco ●
4 Agencia Aduanal Mancilla ●
5 Agencia Aduanal Medrano
●
6 Agrivizion Integradora ●
7 Alen del Norte ●
8 AMCOR de Mexico ●
9 Andercraft de Mexico ●
10 Aqualung ●
11 Bio‐Technologies ●
12 Block Mex ●
13 Breg de Mexico ●
14 Cali Baja International ●
15 Care Fusion ●
16 CB Produce ●
17 CDI Electronics ●
18 Chromalloy ●
19 Comandos Shuttle S. de R.L. de C.V.
●
54 Companies responded differently to this request. On average they provided 13 shipments each, with the
maximum number provided being 30 shipments and the minimum number provided being 1 shipment.
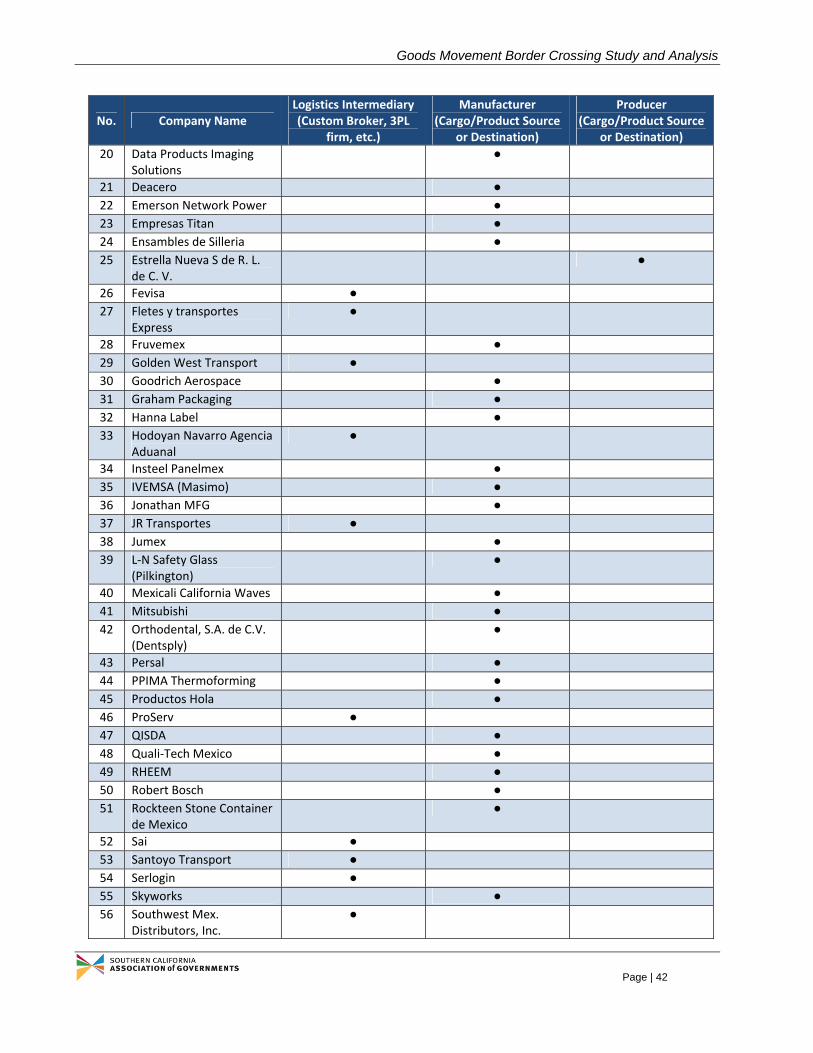
Goods Movement Border Crossing Study and Analysis
Page | 42
No. Company Name Logistics Intermediary (Custom Broker, 3PL
firm, etc.)
Manufacturer (Cargo/Product Source
or Destination)
Producer (Cargo/Product Source
or Destination)
20 Data Products Imaging Solutions
●
21 Deacero ●
22 Emerson Network Power ●
23 Empresas Titan ●
24 Ensambles de Silleria ●
25 Estrella Nueva S de R. L. de C. V.
●
26 Fevisa ●
27 Fletes y transportes Express
●
28 Fruvemex ●
29 Golden West Transport ●
30 Goodrich Aerospace ●
31 Graham Packaging ●
32 Hanna Label ●
33 Hodoyan Navarro Agencia Aduanal
●
34 Insteel Panelmex ●
35 IVEMSA (Masimo) ●
36 Jonathan MFG ●
37 JR Transportes ●
38 Jumex ●
39 L‐N Safety Glass (Pilkington)
●
40 Mexicali California Waves ●
41 Mitsubishi ●
42 Orthodental, S.A. de C.V. (Dentsply)
●
43 Persal ●
44 PPIMA Thermoforming ●
45 Productos Hola ●
46 ProServ ●
47 QISDA ●
48 Quali‐Tech Mexico ●
49 RHEEM ●
50 Robert Bosch ●
51 Rockteen Stone Container de Mexico
●
52 Sai ●
53 Santoyo Transport ●
54 Serlogin ●
55 Skyworks ●
56 Southwest Mex. Distributors, Inc.
●

Goods Movement Border Crossing Study and Analysis
Page | 43
No. Company Name Logistics Intermediary (Custom Broker, 3PL
firm, etc.)
Manufacturer (Cargo/Product Source
or Destination)
Producer (Cargo/Product Source
or Destination)
57 Stanley Black and Decker ●
58 Technologies Displays Mexicana
●
59 Timsa, General Dynamics ●
60 Transcafe Trucking ●
61 Transporte Gutierrez ●
62 Tri‐state de Mexico ●
63 Vanguard Electronics ●
The total sample collected consists on O/D information for 847 shipments55, including the origin’s zip code and type of facility, the destination’s zip code and type of facility and, where applicable, the location of intermediary facilities where the cargo stopped on its way to its final destination.
The sample collected corresponds to shipments dispatched during the February – October 2011 period, though a large majority concentrates on the months of May, June and July.
Based on the sample collected, the type of goods transported across the border is diverse, ranging from food and agricultural products to aerospace components. The two types of goods most commonly transported (representing more than a quarter of the total shipments) were electronics and metal products. A complete characterization of the sample by product type and direction of shipment is shown in Table 16.
Table 16. Goods Transported in Sampled Shipments, by Direction of Shipment Northbound Shipments Southbound Shipments
Metal Products 60 12% Electronics 59 16%
Electronics 59 12% Metal Products 57 15%
Plastics 41 8% Plastics 35 9%
Medical Devices and Products 37 7% Medical Devices & Products 28 7%
Paper 32 6% Food Products 20 5%
Agricultural products 29 6% Paper 20 5%
Electrical Products 21 4% Electrical Products 18 5%
Food Products 20 4% Cement Blocks 16 4%
Clothing/Textiles 18 4% Agricultural products 14 4%
Tridipanel 14 3% Clothing/Textiles 11 3%
Chemicals/Gas 13 3% Float Glass 10 3%
Furniture 12 2% Glass Bottles 10 3%
Dental Pieces 10 2% Automotive 8 2%
Aerospace components 8 2% Furniture 8 2%
Automotive 7 1% Dental Pieces 5 1%
Glass Bottles 5 1% Other 58 15%
Paint Rollers 5 1%
55 The total number of observations collected is 882. However, some of them were found to be incomplete during
the review process and therefore were not included in all of the analysis.

Goods Movement Border Crossing Study and Analysis
Page | 44
Northbound Shipments Southbound Shipments
Recycled Printer Cartridge 5 1%
Other 109 22%
TOTAL 505 100% TOTAL 377 100%
In terms of shipments, the two subsamples (northbound and southbound) show similar composition and relative importance of good categories. Most importantly, in both cases the main products shipped are metal products, electronics and plastics. These results, however, should not be extrapolated to the entire universe of goods moved across the border in the Imperial County‐Mexicali region. The reason is that, despite the fact that shipments were submitted randomly to the sample, the choice of companies may not be representative of the universe of companies engaged in transportation of border‐crossing goods.
4.1.2 Origin–DestinationResults
The O/D pairs of the data collected through the company interviews were analyzed by direction of trade. For northbound flows, 505 shipments provided an origin and a destination; for southbound shipments this number was 37556.
For northbound flows, the origin of the shipment was reported to be Mexicali in 99 percent of the cases57. In striking contrast, these shipments reported 98 different cities as their destination. Of those 98 destinations, 58 (59 percent) were reported to be in the State of California. Of those 58 cities in California, 35 (36 percent of the total) are located in the SCAG region. A map with a graphic representation of the main destinations in California for northbound flows is presented in Figure 14.
56 In the case of two shipments no origin or destination was reported. 57 The remaining 1 percent was reported as Calexico, CA. Despite the fact that this may be true, this was
considered a sampling error, since the sample was intended to capture only cross‐border flows.

Goods Movement Border Crossing Study and Analysis
Page | 45
Figure 14. Map of Main Destinations in California, Northbound Flows, Company Surveys
In terms of number of shipments transported, there is a high concentration in the State of California: 79 percent of the shipments were headed for a city in the State of California – with 61 percent of the total corresponding to cities in the SCAG region. The remaining 21 percent was bound for cities in other states of the United States. As it can be observed in Figure 15, all the major destinations (in terms of number of shipments of goods received) are inside California with the exception of the city of El Paso, TX. Furthermore, the Calexico area (comprised of Calexico, El Centro and Heber, CA) and Los Angeles capture approximately 35 percent of the total number of shipments transported across the border (the complete list of destinations is found in APPENDIX A: COMPLETE LIST OF DESTINATIONS IN U.S. FORNORTHBOUNDTRAFFIC,COMPANYSURVEYS).

Goods Movement Border Crossing Study and Analysis
Page | 46
Figure 15. Reported Destination for Northbound Shipments, Company Surveys
* = Calexico area includes Calexico, El Centro and Heber, CA
However, this apparent concentration of goods movement can be deceiving since the volume that is not bound for either the Calexico area or Los Angeles is evenly distributed among the other 96 destinations. Relevant destinations outside the State of California include El Paso, TX (3 percent of total shipments), New Bedford, MA (2 percent of total shipments) and Yuma, AZ (2 percent of total shipments). Furthermore, the final destination described here is that reported by the transportation company, which may not correspond to the true final destination of the goods (e.g., if goods are being transferred to a different logistic provider at an intermediate point).
Southbound shipments show a slightly less disperse pattern compared to northbound flows: the sample shows only 1 destination city (Mexicali) and 62 cities as origin. Of the 62 originating cities, 39 (63 percent) are in California. Of the cities in California, 22 (35 percent of total) are located in the SCAG region. This suggests a high level of integration between the Imperial County‐Mexicali area and the Sate of California. A map with a graphic representation of the main origins in California for southbound flows is presented in Figure 16.
The origin of shipments is concentrated primarily in the Calexico area, Los Angeles and Long Beach, representing 52 percent of the total number of origins. The remaining 48 percent is evenly distributed among the other 59 origins. As a sign of the high level of integration between the State of California and the study region, all the main shipment origins are located in California (see Figure 17). Relevant origins outside the State of California include Yuma, AZ (2 percent of total shipments), Guthrie Center, IA (1 percent of shipments), Charlotte, NC (1 percent of shipments) and Mt. Prospect, IL (1 percent of total shipments). The complete list of origins is found in APPENDIXB:COMPLETELISTOFORIGINS INU.S. FORSOUTHBOUNDTRAFFIC,COMPANYSURVEYS.
Calexico area*, 23%
Los Angeles, CA, 12%
San Diego, CA, 5%
Ontario, CA, 4%
Long Beach, CA, 3%
Fresno, CA, 3%El Paso, TX, 3%
Other, 48%

Goods Movement Border Crossing Study and Analysis
Page | 47
Figure 16. Map of Main Origins in California, Southbound Flows, Company Surveys
Figure 17. Reported Origin of Southbound Shipments, Company Surveys
* = Calexico area includes Calexico, El Centro and Heber, CA
Calexico area*, 22%
Los Angeles, CA, 20%
Long Beach, CA,
11%
San Diego, CA, 5%
Fresno, CA, 3%
Irvine, CA, 3%
Lathrop, CA, 3%
Other, 34%

Goods Movement Border Crossing Study and Analysis
Page | 48
Further analysis of shipment data collected shows more than 75 percent of the goods moved by third‐parties in the area occur between manufacturing facilities and warehouses. Moreover, the largest share is from manufacturing facilities to manufacturing facilities.
Table 17. Origin and Destination of Shipments by Type of Facility, Aggregate From (↓) / To (→) Manufacturing Firm Warehouse Other TOTAL
Manufacturing Firm 29% 27% 9% 65%
Warehouse 14% 6% 3% 23%
Other 7% 3% 2% 12%TOTAL 50% 36% 14% 100%
Disaggregation of this information by travel direction shows that, for northbound flows58, the primary origin of goods movement is manufacturing firms and maquiladoras. Similarly, it show that the main destination facility for these flows is warehouses and distribution centers (DC). Table 18 shows how northbound shipments flow between different types of facilities.
Table 18. Origin and Destination of Shipments by Type of Facility, Northbound Flows To (→)
/ From (↓)
Airport Custom Broker
House Manufacturing Firm
Retail Seaport Ware‐house/DC
Other TOTAL
Custom Broker
0% 0% 1% 0% 1% 0% 3% 1% 5%
Manufactur‐ing Firm
3% 0% 0% 24% 2% 3% 48% 4% 83%
Warehouse/ DC
0% 0% 0% 2% 1% 0% 6% 0% 9%
Other 0% 0% 0% 0% 0% 0% 2% 0% 3%
TOTAL 3% 0% 1% 26% 4% 3% 59% 5% 100%
Furthermore, analysis of different combinations of origin and destination facilities shows that goods movement directly between manufacturing firms is important, representing almost one in every fours northbound shipments.
In contrast with the previous case, southbound flows have more types of originating facilities and fewer types of destination facilities. The analysis shows59 that manufacturing firms and warehouses are the main types of originating facilities with 83 percent of the total share of shipments while manufacturing firms / maquiladoras are the primary destination also with 83 percent.
In this case, analysis of different combinations of origin and destination facilities shows that goods movement directly between manufacturing firms is the single most important type of movement, representing 37 percent of the total shipments in that direction.
58 The total number of shipments analyzed was 505.
59 The total number of shipments analyzed was 377.

Goods Movement Border Crossing Study and Analysis
Page | 49
Table 19. Origin and Destination of Shipments by Type of Facility, Southbound Flows
From (↓) / To (→) Custom Broker Mfg/ Maquiladora Warehouse/ DC Other TOTAL
Airport 0% 6% 0% 0% 6%
House 1% 0% 0% 0% 1%
Manufacturing Firm 0% 37% 2% 3% 43%
Retail 0% 0% 0% 0% 0%
Seaport 0% 9% 0% 0% 9%
Warehouse/DC 2% 29% 6% 2% 40%
Others 0% 1% 0% 0% 2%
TOTAL 3% 83% 8% 5% 100%
The patterns observed in the data collected using the company surveys suggests that goods traveling north generally stop at a warehouse in the United States, where they are later dispatched to their final location (possibly a retailer). On the contrary, goods traveling south are more likely to be shipped directly from a manufacturing firm in the United States to another manufacturing firm or maquiladora in Mexico.
Figure 18. Main Origins and Destinations in the City of Mexicali, Company Surveys

Goods Movement Border Crossing Study and Analysis
Page | 50
Finally, an important characteristic observed in the data is the significance of industrial parks in Mexicali as promoters of international trade. Figure 18 presents the location of the main origins and destinations in the city of Mexicali, based on their zip codes, as reported in the company surveys. It is clear that a majority of the locations correspond to industrial parks (parque industrial by its name in Spanish). A list of the main industrial parks in Mexicali and their zip codes is shown in Table 20.
Table 20. Industrial Parks in Mexicali and Corresponding Zip Codes
Industrial Park Zip Code
Parque Industrial Nelson 21395
21600
Parque Industrial PIMSA III 21000
21395
Desarrollo Industrial El Colorado 21229
21397
Parque Industrial PIMSA IV 21210
21229
Parque Industrial Calafia 2 21600
XXI Parque Industrial 21259
21600
Parque Industrial El Vigia 21397
Parque Industrial Maran 21270
El Palaco 21229
21397
Parque Industrial Alamos 21210
Parque Industrial Cucapa 21385
Parque Industrial Cosmo 21397
Centro Industrial MARGAR 21330
21360
Parque Industrial PIMSA I 21200
21210
Parque Industrial Las Californias 21394
Source: Company Surveys and information from the Secretaría de Desarrollo Económico of the State of Baja California on Industrial Park locations
Analysis of originating zip codes for northbound shipments shows 70 percent of them correspond to zip codes where an industrial park is located. Similarly, 85 percent of southbound shipments have their destination in one of the zip codes listed in Table 20.
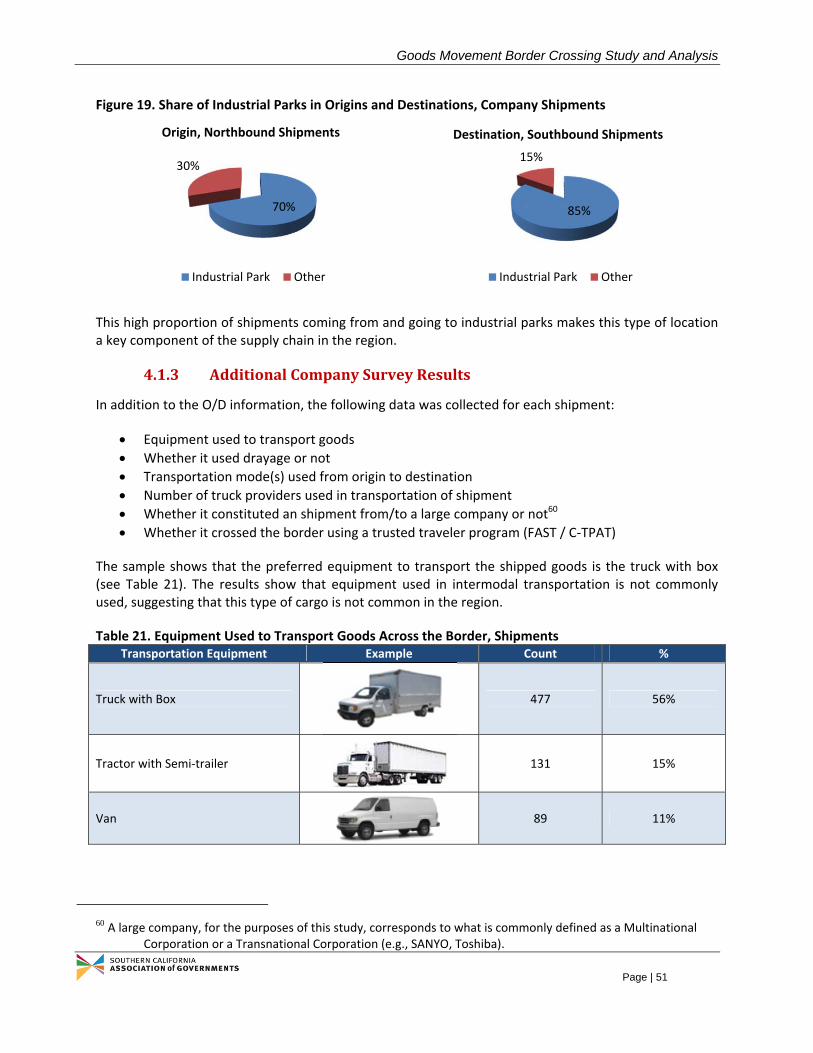
Goods Movement Border Crossing Study and Analysis
Page | 51
Figure 19. Share of Industrial Parks in Origins and Destinations, Company Shipments
This high proportion of shipments coming from and going to industrial parks makes this type of location a key component of the supply chain in the region.
4.1.3 AdditionalCompanySurveyResults
In addition to the O/D information, the following data was collected for each shipment:
Equipment used to transport goods
Whether it used drayage or not
Transportation mode(s) used from origin to destination
Number of truck providers used in transportation of shipment
Whether it constituted an shipment from/to a large company or not60
Whether it crossed the border using a trusted traveler program (FAST / C‐TPAT)
The sample shows that the preferred equipment to transport the shipped goods is the truck with box (see Table 21). The results show that equipment used in intermodal transportation is not commonly used, suggesting that this type of cargo is not common in the region.
Table 21. Equipment Used to Transport Goods Across the Border, Shipments Transportation Equipment Example Count %
Truck with Box 477 56%
Tractor with Semi‐trailer 131 15%
Van 89 11%
60 A large company, for the purposes of this study, corresponds to what is commonly defined as a Multinational
Corporation or a Transnational Corporation (e.g., SANYO, Toshiba).
70%
30%
Origin, Northbound Shipments
Industrial Park Other
85%
15%
Destination, Southbound Shipments
Industrial Park Other

Goods Movement Border Crossing Study and Analysis
Page | 52
Tractor with Flatbed 86 10%
Tractor with Intermodal container 50 6%
Pick Up Truck 8 1%
Tractor with Tanker/Gas 6 1%
TOTAL 847 100%
Drayage is a common element of the transportation procedures in the region. However, as it is shown in Table 22, it is more prominent on northbound trips (see Section 3.4.1 for a definition of drayage).
Table 22. Use of Drayage in Shipments, by Direction of Trade Flow Drayage Northbound % Southbound % TOTAL Aggregate %Yes 301 59.6% 183 48.5% 484 55.4%No 194 38.4% 194 51.5% 388 44.4%N/A 10 2.0% 0 0.0% 2 0.2%TOTAL 505 100% 377 100.0% 874 100.0%
An overwhelming majority of the goods moved across the Mexicali‐Calexico border travel using only one mode of transportation: truck (see Table 23). This is not surprising since in most cases the goods transported in the area are finished or semi‐finished products of high value that travel within a day’s day of driving, thus justifying the use of this transportation mode.
Table 23. Modes of Transportation Used in the Region, by Direction of Trade Flow Northbound Shipments Southbound Shipments
Modes Count % Modes Count %
Truck Only 453 90% Truck Only 317 84%
Truck‐Air 21 4% Truck‐Seaport 30 8%
Truck‐Rail 16 3% Truck‐Air 19 5%
Truck‐Seaport 15 3% Truck‐Rail 11 3%
Grand Total 505 100% Grand Total 377 100%
Not only were the goods moved primarily by truck, but the majority of the goods were moved using one truck provider61.
61 In the sample, entries where “none” was the answer provided by the interviewee as the number of truck
providers are interpreted as the cargo owner performing the goods movement using his/her own fleet.

Goods Movement Border Crossing Study and Analysis
Page | 53
Figure 20. Number of Truck Providers Used per Shipment, by Direction of Trade
The number of shipments classified as to/from large companies was remarkably low. Of the total amount of shipments analyzed (847), only 27 were identified as originating or finalizing in a large company (see Figure 21). This could be an indication that transportation of goods among these types of companies is vertically integrated and therefore no third‐party is involved in their movement.
Figure 21. Share of Shipments To/From Large Companies in the Sample
Of the 505 northbound shipments for which the use of trusted traveler program was recorded, only 24 reported using FAST (see Figure 22). There are two possible explanations for this observed behavior: (i) the time savings for the logistic companies may be small compared to the costs of enrolling in the program; and, (ii) the widespread use of drayage and the existence of several logistic providers (that make transportation services a commodity in the region) represent no incentive for logistic companies to enroll in the program.
8%
62%
27%
3% 1%
Southbound Shipments
None One Two Three Does not have information
3%
94%
3%
Inbound Not inbound N/A
10%
60%
26%
2% 2%
Northbound Shipments
None One Two Three Does not have information

Goods Movement Border Crossing Study and Analysis
Page | 54
Figure 22. Use of Trusted Traveler Program in Northbound Shipments
4.2 TruckInterceptData
4.2.1 CharacteristicsoftheSample
Truck intercepts were conducted at the Calexico East POE on both sides of the border, capturing northbound and southbound flows of goods transported by truck. A total of 427 truck drivers were interviewed during August 16, 17, 18 and 20 and September 20, 21, 22, 23, 26, 27, 28 and 2962. Each driver was asked a series of questions related to the type of cargo, origin – destination, frequency of crossing, perceived wait time at the border and use of trusted traveler program (FAST / C‐TPAT). Observations on northbound trips totaled 214 while the total number of surveys collected on southbound trips equaled 21363.
Intercept surveys for northbound trips were performed between 8:25 am and 5:48 pm, while surveys were collected between 7:45 am and 7:22 pm on southbound trips.
Of the nearly 430 trucks interviewed, only 146 were loaded with cargo. Of those, 46 were traveling in the northbound direction and the remaining 100 were traveling southbound. The different types of good categories reported by the truck drivers as being transported are shown in Table 24 by trip direction. Notice that, contrary to the case of the company surveys, the relative importance of the categories of goods transported vary by trip direction. For northbound trips, food products, automotive goods and metal products represent more than a third of the responses. On southbound trips metal products, machinery and electronics and electronic products are the main categories.
Table 24. Goods Transported in Sampled Trucks, by Trip Direction Northbound Trips Southbound Trips
Food Products 6 13% Metal Products 14 14%
Automotive 5 11% Machinery 9 9%
Metal Products 5 11% Electronics & Electronic Products
9 9%
62 Northbound surveys were conducted on August 16, 17, 18 and 20 and September 22, 26, 27, 28 and 29.
Southbound surveys were conducted on September 20, 21, 22, 23 and 26. 63 The number of actual responses recorded for each individual question varies significantly due to a lack of
responsiveness by the truck drivers. As such, sample sizes differ for each individual question.
5%
91%
4%
FAST No program N/A
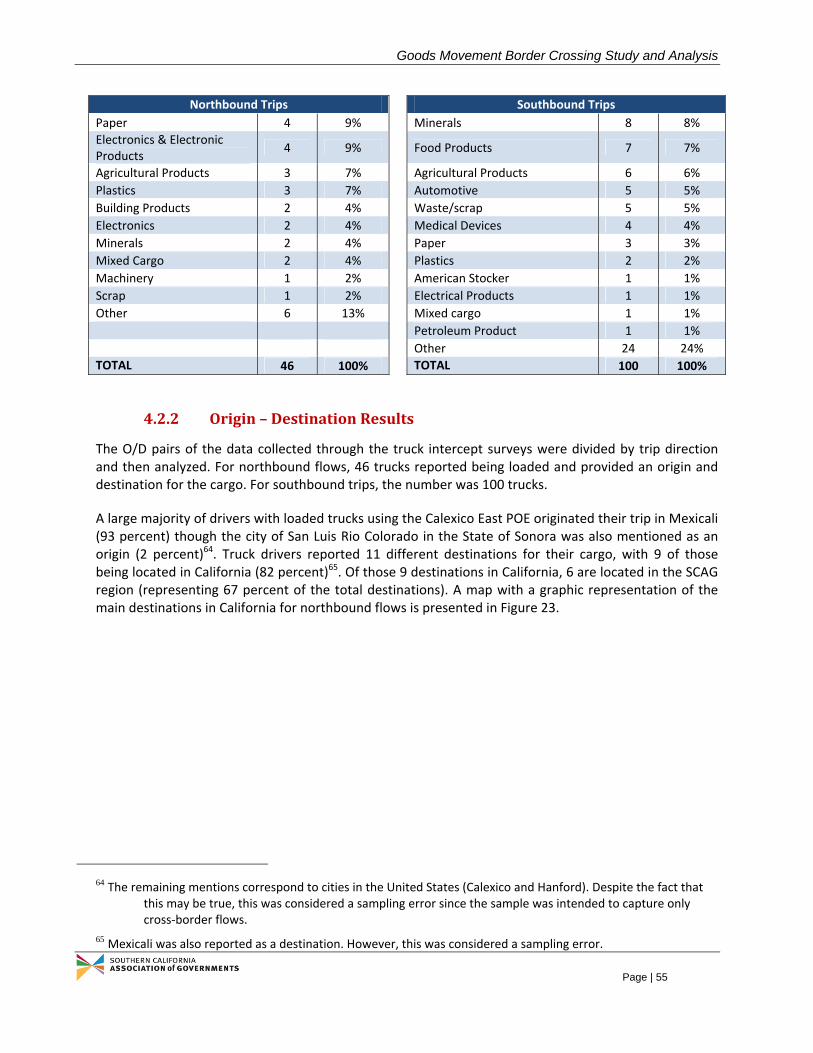
Goods Movement Border Crossing Study and Analysis
Page | 55
Northbound Trips Southbound Trips
Paper 4 9% Minerals 8 8%
Electronics & Electronic Products
4 9% Food Products 7 7%
Agricultural Products 3 7% Agricultural Products 6 6%
Plastics 3 7% Automotive 5 5%
Building Products 2 4% Waste/scrap 5 5%
Electronics 2 4% Medical Devices 4 4%
Minerals 2 4% Paper 3 3%
Mixed Cargo 2 4% Plastics 2 2%
Machinery 1 2% American Stocker 1 1%
Scrap 1 2% Electrical Products 1 1%
Other 6 13% Mixed cargo 1 1%
Petroleum Product 1 1%
Other 24 24%
TOTAL 46 100% TOTAL 100 100%
4.2.2 Origin–DestinationResults
The O/D pairs of the data collected through the truck intercept surveys were divided by trip direction and then analyzed. For northbound flows, 46 trucks reported being loaded and provided an origin and destination for the cargo. For southbound trips, the number was 100 trucks.
A large majority of drivers with loaded trucks using the Calexico East POE originated their trip in Mexicali (93 percent) though the city of San Luis Rio Colorado in the State of Sonora was also mentioned as an origin (2 percent)64. Truck drivers reported 11 different destinations for their cargo, with 9 of those being located in California (82 percent)65. Of those 9 destinations in California, 6 are located in the SCAG region (representing 67 percent of the total destinations). A map with a graphic representation of the main destinations in California for northbound flows is presented in Figure 23.
64 The remaining mentions correspond to cities in the United States (Calexico and Hanford). Despite the fact that
this may be true, this was considered a sampling error since the sample was intended to capture only cross‐border flows.
65 Mexicali was also reported as a destination. However, this was considered a sampling error.

Goods Movement Border Crossing Study and Analysis
Page | 56
Figure 23. Map of Main Destinations in California, Northbound Flows, Truck Intercept Surveys
In terms of number of trucks interviewed, there is an important concentration of trips within the State of California: 93 percent of the drivers were headed for a city in the State of California while the remaining 7 percent was bound for cities in other states of the United States. Figure 24 shows the major destinations (in terms of number of truckers headed to that city) for northbound trips, all of which are inside California. Furthermore, the Calexico area captures approximately 80 percent of the total volume of goods transported across the border. The two destinations outside the State of California mentioned by truckers were Gilabend, AZ and New York, NY (each one representing 2 percent of the total responses). The complete list of destinations is found in APPENDIXC:COMPLETELISTOFDESTINATIONSINU.S.FORNORTHBOUNDTRAFFIC,TRUCKINTERCEPTSURVEYS.

Goods Movement Border Crossing Study and Analysis
Page | 57
Figure 24. Reported Trip Destinations for Goods Moved by Truck, Northbound Trips
* = Calexico area includes Calexico, El Centro and Heber, CA
Truck intercept surveys for southbound trips show that truckers have 16 different origins (94 percent of them located in California) and 2 destinations. The main destination is Mexicali with 93 percent of the total trips and the other destination reported was the small community of Vicente Guerrero, located approximately 100 miles south of Tijuana66. Figure 25 presents a map of the main origins in California for southbound flows.
Regarding the importance of origin cities – measured as the number of trucks that originate from each location – the Calexico area is by far the most important one since it is the starting point for approximately three‐quarters of all trips going to Mexico. Similarly, cities in California represent the origin for 99 percent of the goods moved by truck into Mexico. Figure 26 shows the main cities of origin for trucks traveling southbound across the Calexico East POE. Only the city of Yuma, AZ was mentioned as an origin outside the State of California (representing 1 percent of the responses). The complete list of origins is found in APPENDIXD: COMPLETE LIST OFORIGINS IN U.S. FOR SOUTHBOUNDTRAFFIC, TRUCKINTERCEPTSURVEYS.
Finally, to get a better perspective on the range of the transportation operations connected to the study area, maps with a graphic representation of the domestic origins and destinations outside the State of California for goods moved by truck is presented in Figure 27and Figure 28. The maps are the result of combining the origins and destinations gathered from both company surveys and truck intercept surveys.
66 Other cities mentioned were Calexico, Corona and Imperial Valley. However, these were considered sampling
errors.
Calexico area*, 80%
Long Beach, CA, 4%
Other, 16%

Goods Movement Border Crossing Study and Analysis
Page | 58
Figure 25. Map of Main Origins in California, Southbound Flows, Truck Intercept Surveys
Figure 26. Reported Trip Origins for Goods Moved by Truck, Southbound Trips
Calexico area*, 75%
Los Angeles, CA, 10%
Other, 15%

Goods Movement Border Crossing Study and Analysis
Page | 59
* = Calexico area includes Calexico, El Centro and Heber, CA
Figure 27. Map of Selected Destinations outside California, Northbound Flows, Company and Truck Intercept Surveys
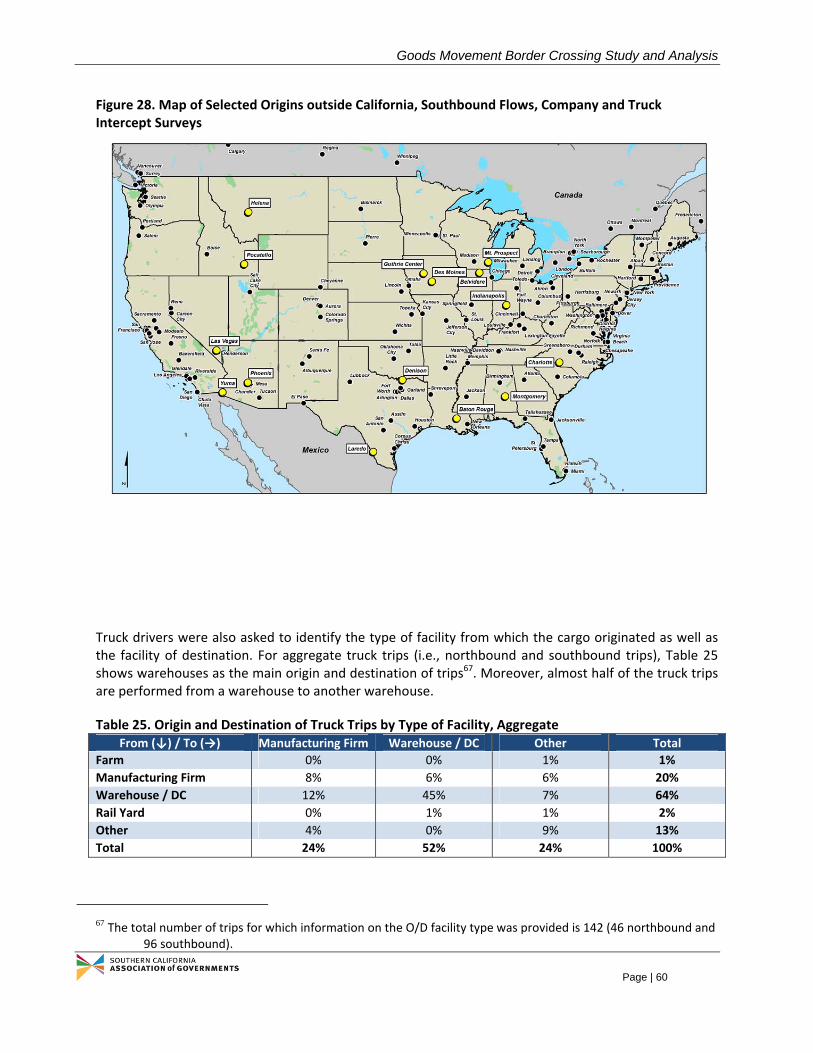
Goods Movement Border Crossing Study and Analysis
Page | 60
Figure 28. Map of Selected Origins outside California, Southbound Flows, Company and Truck Intercept Surveys
Truck drivers were also asked to identify the type of facility from which the cargo originated as well as the facility of destination. For aggregate truck trips (i.e., northbound and southbound trips), Table 25 shows warehouses as the main origin and destination of trips67. Moreover, almost half of the truck trips are performed from a warehouse to another warehouse.
Table 25. Origin and Destination of Truck Trips by Type of Facility, Aggregate From (↓) / To (→) Manufacturing Firm Warehouse / DC Other Total
Farm 0% 0% 1% 1%
Manufacturing Firm 8% 6% 6% 20%
Warehouse / DC 12% 45% 7% 64%
Rail Yard 0% 1% 1% 2%
Other 4% 0% 9% 13%
Total 24% 52% 24% 100%
67 The total number of trips for which information on the O/D facility type was provided is 142 (46 northbound and
96 southbound).
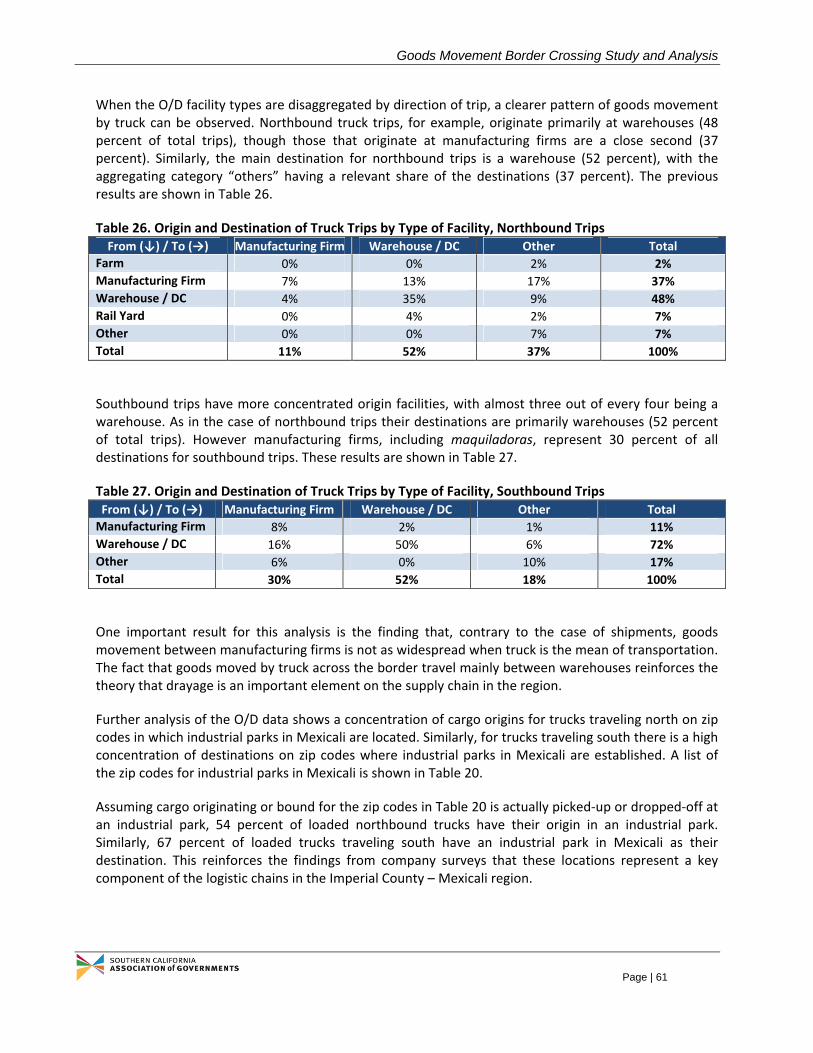
Goods Movement Border Crossing Study and Analysis
Page | 61
When the O/D facility types are disaggregated by direction of trip, a clearer pattern of goods movement by truck can be observed. Northbound truck trips, for example, originate primarily at warehouses (48 percent of total trips), though those that originate at manufacturing firms are a close second (37 percent). Similarly, the main destination for northbound trips is a warehouse (52 percent), with the aggregating category “others” having a relevant share of the destinations (37 percent). The previous results are shown in Table 26.
Table 26. Origin and Destination of Truck Trips by Type of Facility, Northbound Trips From (↓) / To (→) Manufacturing Firm Warehouse / DC Other Total
Farm 0% 0% 2% 2%
Manufacturing Firm 7% 13% 17% 37%
Warehouse / DC 4% 35% 9% 48%
Rail Yard 0% 4% 2% 7%
Other 0% 0% 7% 7%
Total 11% 52% 37% 100%
Southbound trips have more concentrated origin facilities, with almost three out of every four being a warehouse. As in the case of northbound trips their destinations are primarily warehouses (52 percent of total trips). However manufacturing firms, including maquiladoras, represent 30 percent of all destinations for southbound trips. These results are shown in Table 27.
Table 27. Origin and Destination of Truck Trips by Type of Facility, Southbound Trips From (↓) / To (→) Manufacturing Firm Warehouse / DC Other Total
Manufacturing Firm 8% 2% 1% 11%
Warehouse / DC 16% 50% 6% 72%
Other 6% 0% 10% 17%
Total 30% 52% 18% 100%
One important result for this analysis is the finding that, contrary to the case of shipments, goods movement between manufacturing firms is not as widespread when truck is the mean of transportation. The fact that goods moved by truck across the border travel mainly between warehouses reinforces the theory that drayage is an important element on the supply chain in the region.
Further analysis of the O/D data shows a concentration of cargo origins for trucks traveling north on zip codes in which industrial parks in Mexicali are located. Similarly, for trucks traveling south there is a high concentration of destinations on zip codes where industrial parks in Mexicali are established. A list of the zip codes for industrial parks in Mexicali is shown in Table 20.
Assuming cargo originating or bound for the zip codes in Table 20 is actually picked‐up or dropped‐off at an industrial park, 54 percent of loaded northbound trucks have their origin in an industrial park. Similarly, 67 percent of loaded trucks traveling south have an industrial park in Mexicali as their destination. This reinforces the findings from company surveys that these locations represent a key component of the logistic chains in the Imperial County – Mexicali region.
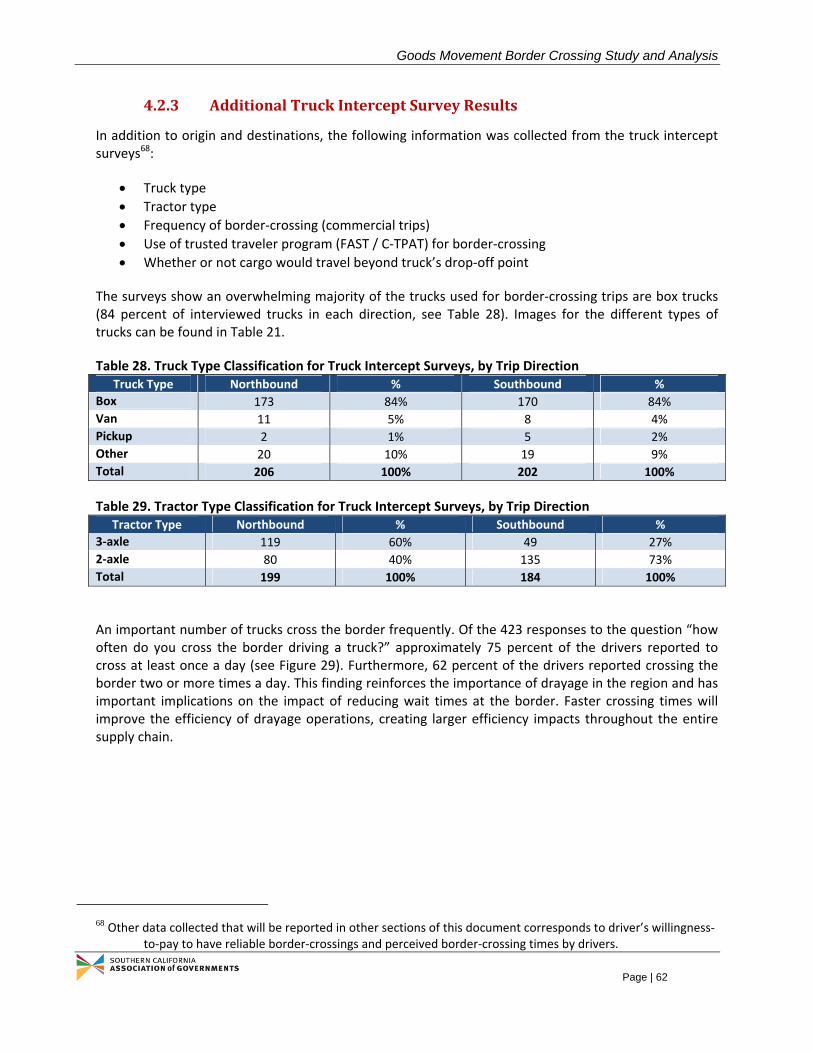
Goods Movement Border Crossing Study and Analysis
Page | 62
4.2.3 AdditionalTruckInterceptSurveyResults
In addition to origin and destinations, the following information was collected from the truck intercept surveys68:
Truck type
Tractor type
Frequency of border‐crossing (commercial trips)
Use of trusted traveler program (FAST / C‐TPAT) for border‐crossing
Whether or not cargo would travel beyond truck’s drop‐off point
The surveys show an overwhelming majority of the trucks used for border‐crossing trips are box trucks (84 percent of interviewed trucks in each direction, see Table 28). Images for the different types of trucks can be found in Table 21.
Table 28. Truck Type Classification for Truck Intercept Surveys, by Trip Direction Truck Type Northbound % Southbound %
Box 173 84% 170 84%
Van 11 5% 8 4%
Pickup 2 1% 5 2%
Other 20 10% 19 9%
Total 206 100% 202 100%
Table 29. Tractor Type Classification for Truck Intercept Surveys, by Trip Direction Tractor Type Northbound % Southbound %
3‐axle 119 60% 49 27%
2‐axle 80 40% 135 73%
Total 199 100% 184 100%
An important number of trucks cross the border frequently. Of the 423 responses to the question “how often do you cross the border driving a truck?” approximately 75 percent of the drivers reported to cross at least once a day (see Figure 29). Furthermore, 62 percent of the drivers reported crossing the border two or more times a day. This finding reinforces the importance of drayage in the region and has important implications on the impact of reducing wait times at the border. Faster crossing times will improve the efficiency of drayage operations, creating larger efficiency impacts throughout the entire supply chain.
68 Other data collected that will be reported in other sections of this document corresponds to driver’s willingness‐
to‐pay to have reliable border‐crossings and perceived border‐crossing times by drivers.

Goods Movement Border Crossing Study and Analysis
Page | 63
Figure 29. Frequency of Crossing Using a Truck, Aggregate Responses
Analysis of the survey responses reveals a majority of the drivers using the trusted traveler program to cross the border. Of the 424 truck drivers who answered this question69, 242 reported they had used the FAST program during their current trip to cross into the U.S. This result shows a striking contrast to the behavior reported by shipping companies, where only a small percentage (5 percent) of the shipments crossed using a trusted traveler program.
One possible explanation for this difference is that trucks surveyed at the border include trucking companies that work with a fixed base of clients (including manufacturing firms and/or warehouses), some of which meet the requirements for their cargo to be part of the C‐TPAT program. As a result, trucking companies are able to use the benefits of the FAST program when transporting goods from this type of clients.
Finally, truck drivers were asked about the final destination of the cargo they were transporting. If the cargo went to a different destination, then the current trip was considered to be drayage. Of the 146 truck drivers with a loaded truck, approximately one in four reported to be performing a drayage trip. However, when the sample was disaggregated by trip direction, almost half of the drivers on northbound trips were performing a drayage trip while this type of trip for southbound flows was reported to be only 16 percent (see Table 30).
69 Of the total, 212 were northbound trucks and the remaining 212 were southbound trucks.
Once/month or less, 0.5%
Once a week, 0.9%
2‐4 times/week, 22.9%
Once a day, 13.0%2+ times/day,
62.4%
N/A, 0.2%

Goods Movement Border Crossing Study and Analysis
Page | 64
Figure 30. Use of Trusted Traveler Programs by Interviewed Trucks
Table 30. Use of Drayage on Truck Trips, by Trip Direction Trip Type Northbound % Southbound % Aggregate %
Drayage 22 47.8% 16 16.0% 38 26.0% Not Drayage 10 21.8% 56 56.0% 66 45.2% N/A 14 30.4% 28 28.0% 42 28.8% Total 46 100.0% 100 100.0% 146 100.0%
Nevertheless, the overall percentage of drivers who did not know their cargo’s true final destination was considerable (close to 29 percent of the total number of drivers interviewed).
4.3 Willingness‐To‐Pay
Origin/Destination company surveys and truck intercept surveys included a stated preference section intended to capture the interviewee’s willingness‐to‐pay from hypothetical reductions in border‐crossing time and improved reliability at the border. Results of the surveys differ between the two different groups of interviewees and by direction of flows but in general show a higher disposition by POE users to pay a fee on northbound movement of goods compared to paying a fee on southbound flows.
Current border‐crossing wait times at the region’s POE were recorded as part of this project and are reported in detail in Section 5 of this document. However, application of surveys and measurement of border‐crossing times were performed separately. To be consistent with the source of information used to derive results, the willingness‐to‐pay responses are shown as part of the O/D surveys. Readers who are interested in learning about the current border‐crossing conditions of the POEs in Imperial County are encouraged to read Section 5 before proceeding.
57%
39%
4%
FAST No program N/A

Goods Movement Border Crossing Study and Analysis
Page | 65
4.3.1 AttitudeTowardsPayingaFee
Surveys show that an important share of both companies and truck drivers would be willing to pay to see reduced border crossing times on northbound trips. However, the same level of support does not exist for southbound trips.
Northbound Flows
Fifty one logistics managers engaged in northbound shipment of goods from an equal number of companies provided answers for the stated preference section of the survey. Of those, almost half of them stated their companies would be willing to pay a fee to reduce wait time for their shipments at the border. Moreover, less than a third opposed the payment of a fee and 1 in every 5 mentioned it was not their decision to make (see Figure 31).
Figure 31. Attitude Towards Paying a Fee to Reduce Wait Times at the Border, Northbound Shipments
49%
31%
20%
Willing to pay
Not willing to pay
Not my decision
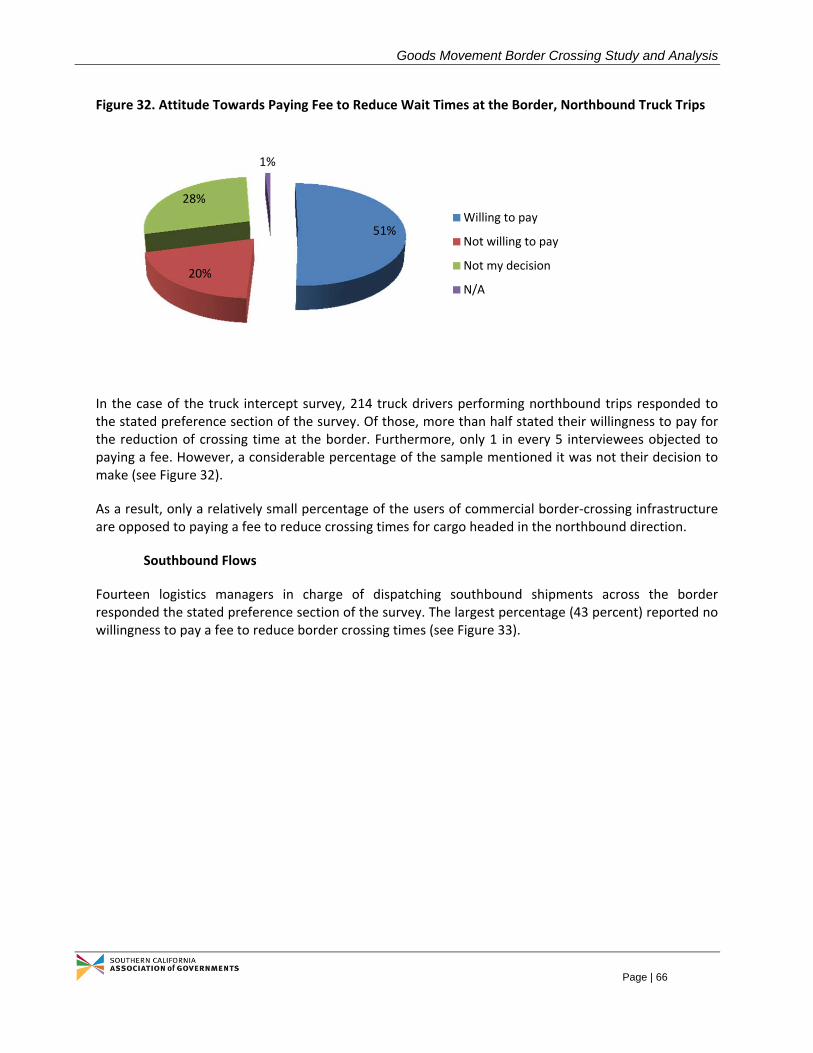
Goods Movement Border Crossing Study and Analysis
Page | 66
Figure 32. Attitude Towards Paying Fee to Reduce Wait Times at the Border, Northbound Truck Trips
In the case of the truck intercept survey, 214 truck drivers performing northbound trips responded to the stated preference section of the survey. Of those, more than half stated their willingness to pay for the reduction of crossing time at the border. Furthermore, only 1 in every 5 interviewees objected to paying a fee. However, a considerable percentage of the sample mentioned it was not their decision to make (see Figure 32).
As a result, only a relatively small percentage of the users of commercial border‐crossing infrastructure are opposed to paying a fee to reduce crossing times for cargo headed in the northbound direction.
Southbound Flows
Fourteen logistics managers in charge of dispatching southbound shipments across the border responded the stated preference section of the survey. The largest percentage (43 percent) reported no willingness to pay a fee to reduce border crossing times (see Figure 33).
51%
20%
28%
1%
Willing to pay
Not willing to pay
Not my decision
N/A

Goods Movement Border Crossing Study and Analysis
Page | 67
Figure 33. Attitude Towards Paying a Fee to Reduce Wait Times at the Border, Southbound Shipments
For southbound truck drivers, those willing to pay for reduced wait times at the border are more than those opposed to it. However, for the majority of them the decision to pay is not theirs to make: of the 100 drivers interviewed on loaded southbound trips, 46 percent reported that somebody else was in charge of deciding if a fee would be paid (see Figure 34).
Figure 34. Attitude Towards Paying Fee to Reduce Wait Times at the Border, Southbound Truck Trips
4.3.2 RequiredTimeSavingstoPayFee
Logistic managers and truck drivers were asked to provide the reduction in border‐crossing time required for them to be willing to pay a predetermined fee to cross the border. The collection of data was divided by direction of movement. For northbound flows the sample consisted of 51 logistics
36%
43%
14%7%
Willing to pay
Not willing to pay
Not my decision
N/A
30%
20%
46%
4%
Willing to pay
Not willing to pay
Not my decision
N/A

Goods Movement Border Crossing Study and Analysis
Page | 68
managers of companies and 214 truck drivers. For southbound flows the sample consisted of 14 logistics managers of companies and 213 truck drivers.
In general, required reductions were larger on southbound flows, confirming the finding that companies and drivers are less willing to pay for a fee on southbound trips. However, an important finding is that companies require larger time reductions to be willing to pay a toll compared to truck drivers.
Northbound Flows
When asked about the average time reduction in northbound border‐crossing time required for the users to be willing to pay a predetermined fee, the results show an important difference between companies and truck drivers. In general companies required larger border‐crossing time reductions though the difference was larger for the smallest fee considered (see Figure 35)70.
Southbound Flows
On southbound trips, the relative difference in reduction of border‐crossing times between companies and truck drivers is consistently larger than that found for northbound trips (see Figure 36). The only exception is the proposed fee of $10, where the difference in average required reduction times is similar, in percentage terms, between companies and trucks.
Figure 35. Required Average Time Savings for Northbound Flows of Goods, by Interviewee Type
70 The sample consisted of 51 logistics managers of companies and 214 truck drivers on northbound trips.
32
40
61
103
16
32
50
94
0
20
40
60
80
100
120
$2.50 $5.00 $10.00 $20.00
Required Reduction in
Crossing Time (in m
inutes)
Proposed Border Crossing Toll
Companies Trucks

Goods Movement Border Crossing Study and Analysis
Page | 69
Figure 36. Required Average Time Savings for Southbound Flows of Goods, by Interviewee Type
4.3.3 WillingnesstoPayfor2‐hourReductioninBorderCrossingTime
Logistic managers and truck drivers were also asked to provide the amount of toll they would be willing to pay for a two‐hour reduction in border‐crossing times under different traffic at the POE (i.e., night, off‐peak, semi‐congested and peak hours). The collection of data was divided by direction of movement. For northbound flows the sample consisted of 51 logistics managers of companies and 214 truck drivers. For southbound flows the sample consisted of 14 logistics managers of companies and 213 truck drivers.
Responses were tabulated and a weighted‐average toll was calculated for each POE condition (the weights correspond to the number of mentions for a specific toll). On northbound trips companies were consistently willing to pay more than truck drivers, whereas on southbound trips the opposite was true. Additionally, differences in estimated average tolls between companies and truck drivers were the smallest for semi‐congested and peak hours on northbound trips. However, on southbound trips, these differences were the largest.
Northbound Flows
The results show a relatively small difference between companies and trucks for semi‐congested and peak hours. However, that difference is large for night and off‐peak conditions, where companies seem to be willing to pay more to get the time reduction. The comparatively‐high willingness to pay by companies for off‐peak border crossings may reflect the fact that a two‐hour reduction implicitly represents no wait time at the border. If that is the case, then the estimated average fee should be interpreted as the fee that represents no wait time at the border.
6070
64
180
1826
52
103
0
20
40
60
80
100
120
140
160
180
200
$2.50 $5.00 $10.00 $20.00Required Reduction in
Crossing Time (in m
inutes)
Proposed Border Crossing Toll
Companies Trucks

Goods Movement Border Crossing Study and Analysis
Page | 70
Figure 37. Average Toll for 2‐Hour Reduction on Border‐Crossing Time, Northbound Flows
Based on these results, the standard Willingness‐to‐Pay curves (similar in nature to demand curves) can be created for each type of crossing identified in the surveys based on a hypothetical 2‐hour reduction in wait time at the border. For company shipments, the standard Willingness‐to‐Pay curves are shown in Figure 38. Similarly, the curves resulting from the truck intercept surveys are presented in Figure 39.
Figure 38. Willingness‐To‐Pay Curves for Northbound Company Shipments for a 2‐hour Wait Time Reduction at the Border
$0.24
$6.18 $5.93
$10.05
$0.02 $0.53
$5.42
$9.26
$‐
$2.00
$4.00
$6.00
$8.00
$10.00
$12.00
Night Off‐Peak Semi‐Congested PeakWTP
for 2‐hr reduction in
crossing time
Border‐Crossing Conditions
Companies Trucks
0.00%
5.00%
10.00%
15.00%
20.00%
25.00%
30.00%
35.00%
40.00%
45.00%
Percentage
of Interviewees Willing to Pay
Proposed Fee per Shipment
Night Off‐Peak Semi‐Congested Peak

Goods Movement Border Crossing Study and Analysis
Page | 71
Figure 39. Willingness‐To‐Pay Curves for Northbound Trucks for a 2‐hour Wait Reduction at the Border
Southbound Flows
Contrary to the findings for northbound flows, southbound trips show a relatively large difference between companies and trucks for off‐peak, semi‐congested and peak hours and a smaller difference for night hours. Additionally, truck drivers expressed their willingness to pay considerably more than companies for the 2‐hour reduction on border‐crossing times for all POE conditions except for night hours71.
71 Potential issues with the results presented are discussed in the final paragraphs of this Section.
0.00%
10.00%
20.00%
30.00%
40.00%
50.00%
60.00%
70.00%
80.00%
Percentage
of Interviewees Willing to Pay
Proposed Fee per Truck
Night Off‐Peak Semi‐congested Peak
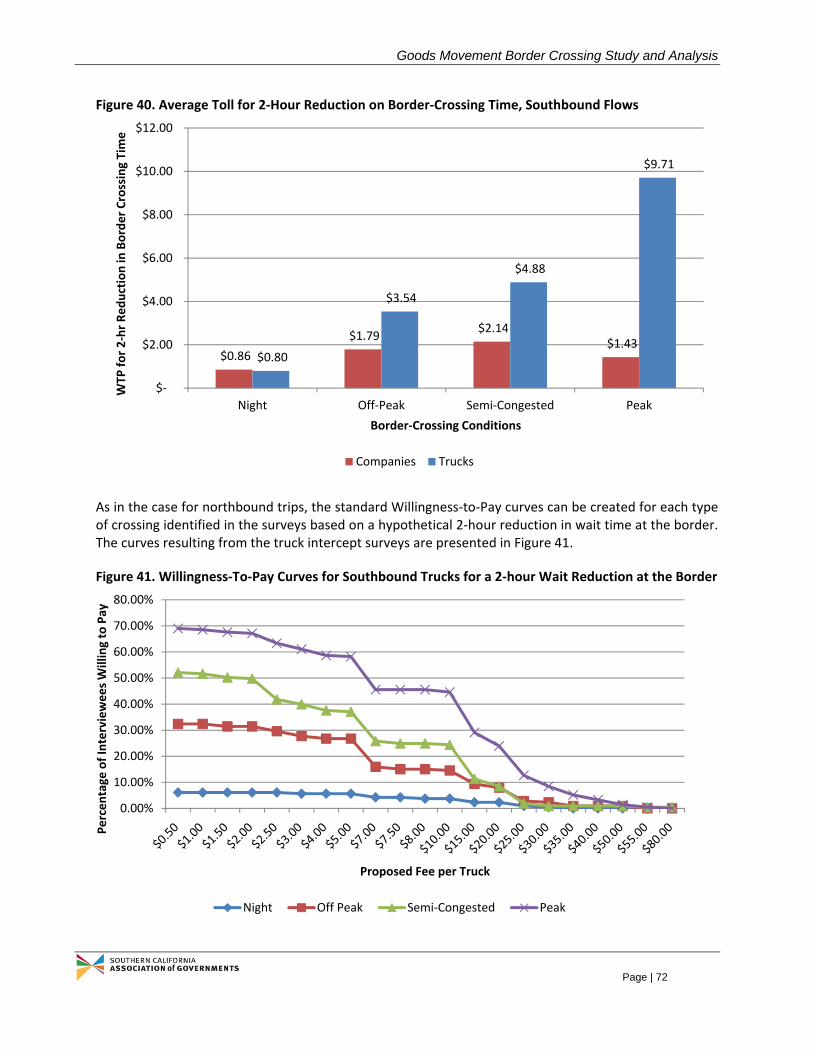
Goods Movement Border Crossing Study and Analysis
Page | 72
Figure 40. Average Toll for 2‐Hour Reduction on Border‐Crossing Time, Southbound Flows
As in the case for northbound trips, the standard Willingness‐to‐Pay curves can be created for each type of crossing identified in the surveys based on a hypothetical 2‐hour reduction in wait time at the border. The curves resulting from the truck intercept surveys are presented in Figure 41.
Figure 41. Willingness‐To‐Pay Curves for Southbound Trucks for a 2‐hour Wait Reduction at the Border
$0.86
$1.79 $2.14
$1.43 $0.80
$3.54
$4.88
$9.71
$‐
$2.00
$4.00
$6.00
$8.00
$10.00
$12.00
Night Off‐Peak Semi‐Congested Peak
WTP
for 2‐hr Reduction in
Border Crossing Time
Border‐Crossing Conditions
Companies Trucks
0.00%
10.00%
20.00%
30.00%
40.00%
50.00%
60.00%
70.00%
80.00%
Percentage
of Interviewees Willing to Pay
Proposed Fee per Truck
Night Off Peak Semi‐Congested Peak

Goods Movement Border Crossing Study and Analysis
Page | 73
Though not depicted here, southbound willingness‐to‐pay curves for company shipments exhibit uncharacteristic behavior. In particular, these curves constantly intersect each other, in a clear sign that company preferences are intransitive with respect to border‐crossing conditions72. This could be the result of a misinterpretation of the questions or a small sample size.
Finally, it is clear from the comparison between northbound and southbound willingness‐to‐pay curves that those corresponding to northbound goods movement are better‐behaved (i.e., show a smooth downward‐sloping pattern with few or no intersections between them) implying that users traveling north perceive a clear gain from the reduced wait times.
72 Preferences are said to be transitive if, for three bundles of goods A, B and C, if A is preferred to B and B is
preferred to C, then A is preferred to C.

Goods Movement Border Crossing Study and Analysis
Page | 74
5 BORDER‐CROSSINGTIMEMEASUREMENT
Data on border‐crossing times was collected for both passenger vehicles and commercial vehicles at the two main POEs in Imperial County, namely Calexico (downtown) and Calexico East. Of the two POEs where data was collected, only Calexico East allows commercial vehicles and therefore all information about commercial traffic border‐crossing times comes from it. On the other hand, passenger vehicles are allowed both at the Calexico (downtown) and Calexico East POEs and therefore results for this vehicle type include data from both locations.
This section describes the methodology used to collect border‐crossing times and reports the summary statistics for the different POEs and vehicle types. It also provides a comparison between observed and perceived crossing times for truck drivers. Finally, a high‐level economic model is used to assess the economic impact of delays for passenger and commercial vehicles in the two POEs analyzed.
5.1 DescriptionofDataCollectionSites
The data collection for this project occurred at two Ports of Entry along the U.S.‐Mexico border, dividing
Imperial County from Mexicali (see Figure 42). Calexico (downtown) POE is located directly adjacent to
the downtown area of the City of Calexico, California, and connects with the historic downtown of
Mexicali, Baja California. The Calexico POE is reached heading southbound via SR‐111, expanding from
two‐lanes to three on approach to the POE, then expanding to eight‐southbound inspection lanes
crossing into Mexico. Northbound traffic approaches the U.S. inspection via three regular and one
SENTRI lane, expanding to a total of ten primary inspection booths (including a dedicated SENTRI booth)
while crossing into the U.S. A diagram presenting the main characteristics of this POE is presented in
Figure 43.
Figure 42. Location of Data Collection Sites for Border‐Crossing Time Measurements
The Calexico East POE is located approximately 6.5 miles to the east of Calexico’s downtown POE, and
includes both passenger vehicle and commercial truck facilities. Southbound passenger vehicles
Mexicali, Baja California
Calexico (downtown) POE Passenger Vehicles
Imperial County, California
Calexico East POE Passenger Vehicles + Commercial
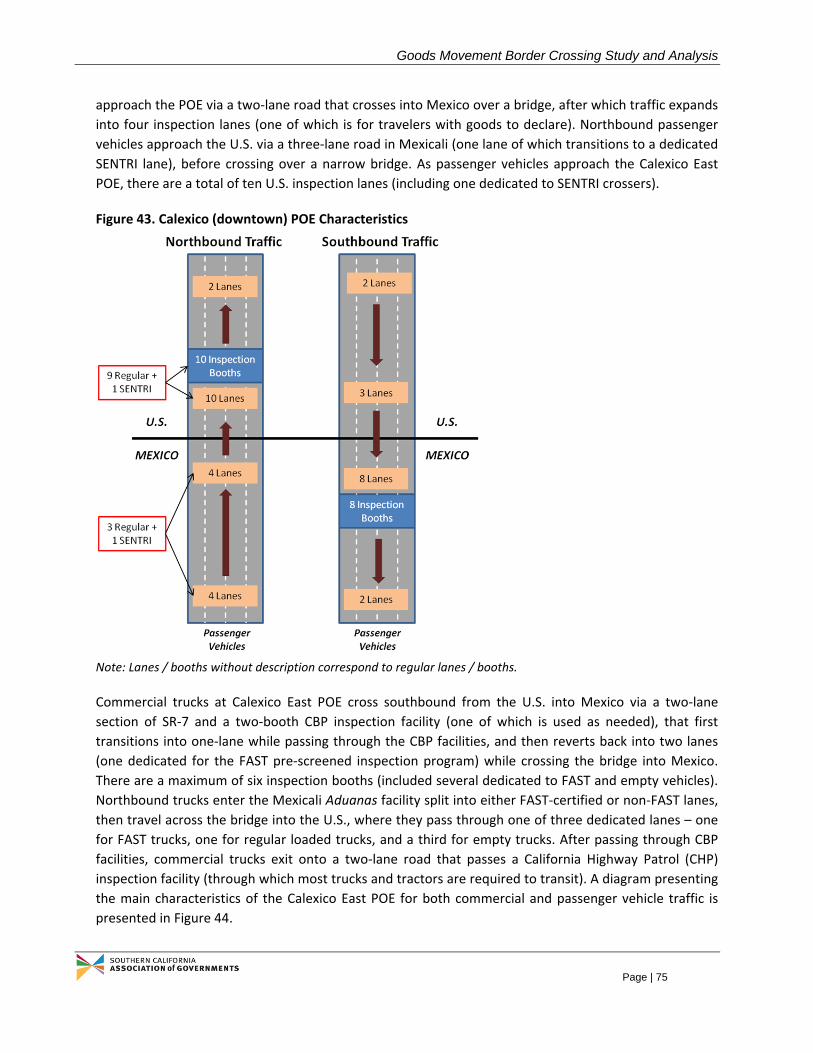
Goods Movement Border Crossing Study and Analysis
Page | 75
approach the POE via a two‐lane road that crosses into Mexico over a bridge, after which traffic expands
into four inspection lanes (one of which is for travelers with goods to declare). Northbound passenger
vehicles approach the U.S. via a three‐lane road in Mexicali (one lane of which transitions to a dedicated
SENTRI lane), before crossing over a narrow bridge. As passenger vehicles approach the Calexico East
POE, there are a total of ten U.S. inspection lanes (including one dedicated to SENTRI crossers).
Figure 43. Calexico (downtown) POE Characteristics
Note: Lanes / booths without description correspond to regular lanes / booths.
Commercial trucks at Calexico East POE cross southbound from the U.S. into Mexico via a two‐lane
section of SR‐7 and a two‐booth CBP inspection facility (one of which is used as needed), that first
transitions into one‐lane while passing through the CBP facilities, and then reverts back into two lanes
(one dedicated for the FAST pre‐screened inspection program) while crossing the bridge into Mexico.
There are a maximum of six inspection booths (included several dedicated to FAST and empty vehicles).
Northbound trucks enter the Mexicali Aduanas facility split into either FAST‐certified or non‐FAST lanes,
then travel across the bridge into the U.S., where they pass through one of three dedicated lanes – one
for FAST trucks, one for regular loaded trucks, and a third for empty trucks. After passing through CBP
facilities, commercial trucks exit onto a two‐lane road that passes a California Highway Patrol (CHP)
inspection facility (through which most trucks and tractors are required to transit). A diagram presenting
the main characteristics of the Calexico East POE for both commercial and passenger vehicle traffic is
presented in Figure 44.

Goods Movement Border Crossing Study and Analysis
Page | 76
Figure 44. Calexico East POE Characteristics
Note: Lanes / booths without description correspond to regular lanes / booths.
* = During Fall 2011, while this study was underway, CBP began dedicating some lanes to Ready Lane.
Each site – the Calexico POE and the Calexico East POE – is operated under significant security
requirements from not just standard Federal border agencies in the U.S. and Mexico (CBP and Aduanas,
respectively), but also have local and/or State security requirements as well. Mexicali local and State
police have jurisdiction adjacent to both POEs in Mexico, and Federal military inspections are frequent
for commercial trucks; in addition, project locations in the U.S. are under local and State CHP
jurisdiction, requiring coordination with additional agencies.
5.2 DataCollectionforCommercialVehicles
Collection of border crossing time for commercial vehicles was done exclusively at the Calexico East
POE. This section presents the characteristics of the truck population from which the sample was taken,
the protocol used to collect data and provides a description of the sample collected.

Goods Movement Border Crossing Study and Analysis
Page | 77
5.2.1 CommercialVehiclePopulationCharacteristics
The Calexico East POE commercial facilities operate Monday through Saturday, from 6:00 a.m. to 8:00
p.m. M‐F, and 10:00 a.m. to 6:00 p.m. on Saturdays73. On an average month in 2011, approximately
26,000 northbound crossings were made by commercial trucks, with a similar amount of southbound
trips.
As seen in Figure 45, winter months are typically a peak time for loaded commercial vehicles – not
unexpected, given the high amount of agricultural‐related goods that are imported into the U.S. at this
location. Summer months tend to be average or slightly above average, as manufactured goods are
being exported for fall and year‐end holiday seasons.
Figure 45. Northbound Commercial Vehicle Traffic at Calexico East POE, 2009‐2011
Source: USDOT, Bureau of Transportation Statistics
From a research perspective, all commercial vehicles traveling north‐ or south‐bound during daylight
hours was part of the potential population sample (with onsite sampling occurring typically between
8:00 am and 6:00 p.m., estimated to encompass more than 80 percent of all truck trips). It should be
noted that sampling also covered both regular loaded and empty vehicles, as well as FAST‐certified
trucks (which are estimated to make up at least 30 percent of all northbound crossings).
5.2.2 CommercialVehicleSurveyProtocol
In order to actually measure border travel times for commercial vehicles (both northbound and
southbound), the project’s team relied on a method used successfully at seven ports of entry along the
73 Source: CBP’s website, http://www.cbp.gov/xp/cgov/toolbox/contacts/ports/ca/2507.xml
‐
5,000
10,000
15,000
20,000
25,000
30,000
35,000
Loaded Trucks Empty Trucks
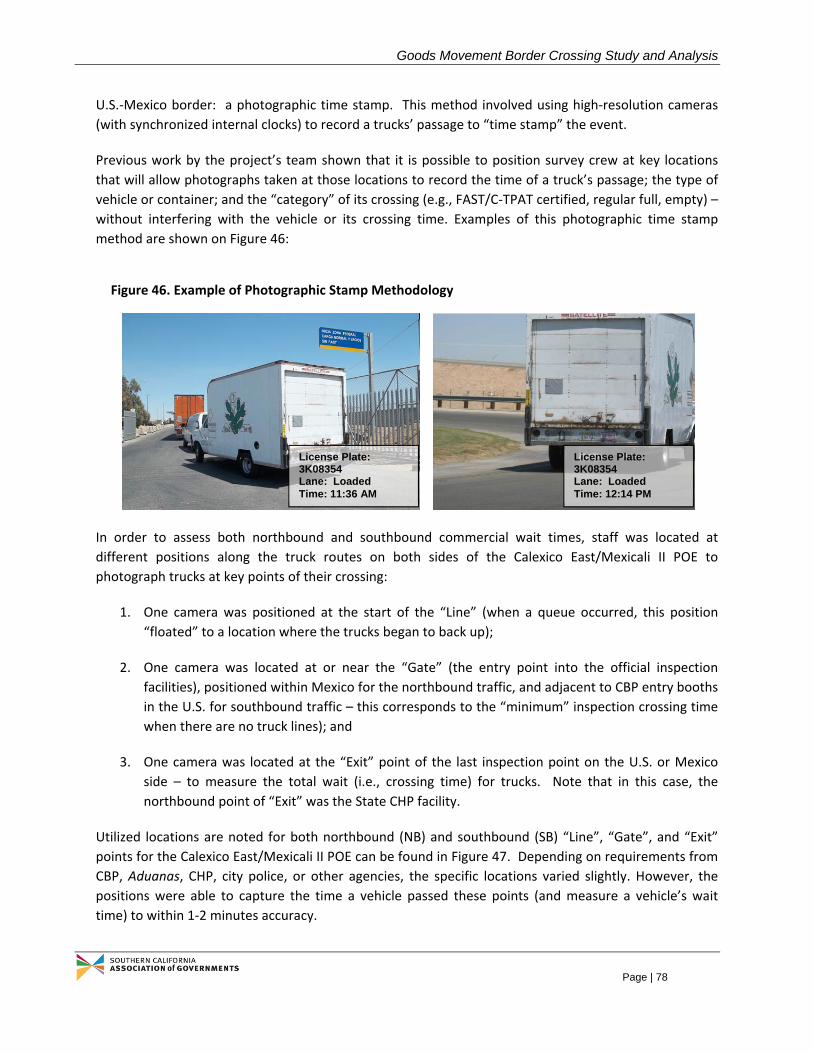
Goods Movement Border Crossing Study and Analysis
Page | 78
U.S.‐Mexico border: a photographic time stamp. This method involved using high‐resolution cameras
(with synchronized internal clocks) to record a trucks’ passage to “time stamp” the event.
Previous work by the project’s team shown that it is possible to position survey crew at key locations
that will allow photographs taken at those locations to record the time of a truck’s passage; the type of
vehicle or container; and the “category” of its crossing (e.g., FAST/C‐TPAT certified, regular full, empty) –
without interfering with the vehicle or its crossing time. Examples of this photographic time stamp
method are shown on Figure 46:
In order to assess both northbound and southbound commercial wait times, staff was located at
different positions along the truck routes on both sides of the Calexico East/Mexicali II POE to
photograph trucks at key points of their crossing:
1. One camera was positioned at the start of the “Line” (when a queue occurred, this position
“floated” to a location where the trucks began to back up);
2. One camera was located at or near the “Gate” (the entry point into the official inspection
facilities), positioned within Mexico for the northbound traffic, and adjacent to CBP entry booths
in the U.S. for southbound traffic – this corresponds to the “minimum” inspection crossing time
when there are no truck lines); and
3. One camera was located at the “Exit” point of the last inspection point on the U.S. or Mexico
side – to measure the total wait (i.e., crossing time) for trucks. Note that in this case, the
northbound point of “Exit” was the State CHP facility.
Utilized locations are noted for both northbound (NB) and southbound (SB) “Line”, “Gate”, and “Exit”
points for the Calexico East/Mexicali II POE can be found in Figure 47. Depending on requirements from
CBP, Aduanas, CHP, city police, or other agencies, the specific locations varied slightly. However, the
positions were able to capture the time a vehicle passed these points (and measure a vehicle’s wait
time) to within 1‐2 minutes accuracy.
Figure 46. Example of Photographic Stamp Methodology
License Plate: 3K08354 Lane: Loaded Time: 11:36 AM
License Plate: 3K08354 Lane: Loaded Time: 12:14 PM
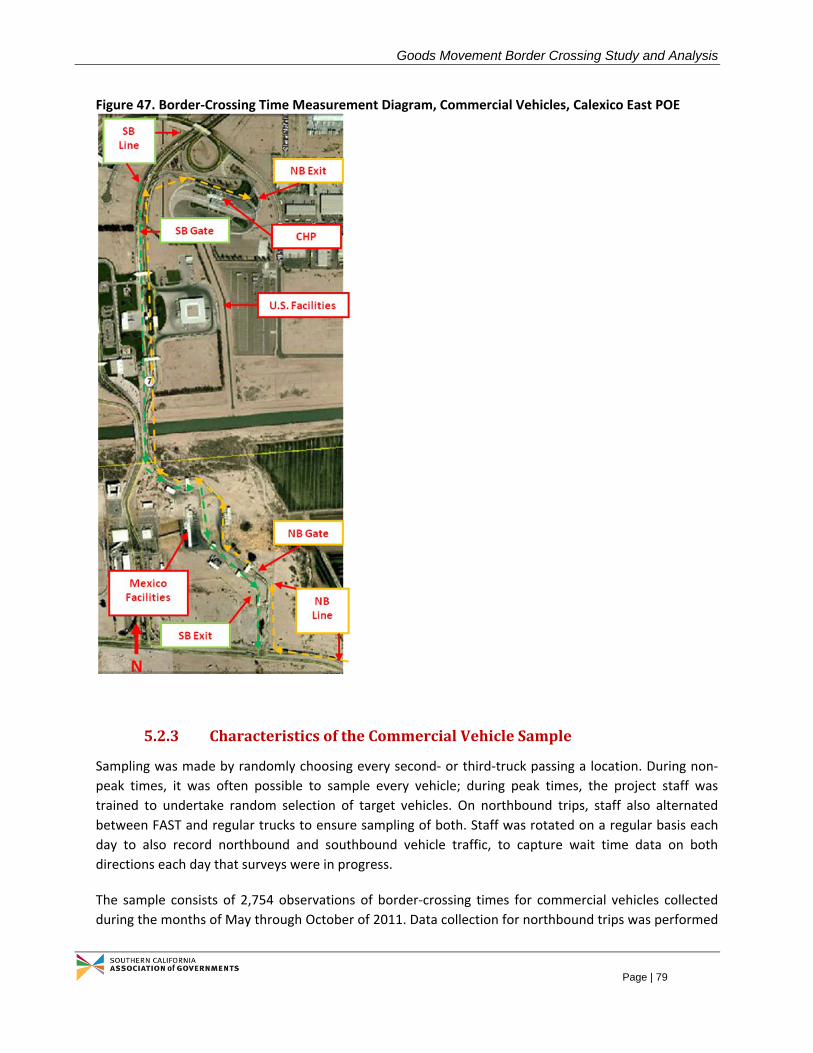
Goods Movement Border Crossing Study and Analysis
Page | 79
Figure 47. Border‐Crossing Time Measurement Diagram, Commercial Vehicles, Calexico East POE
5.2.3 CharacteristicsoftheCommercialVehicleSample
Sampling was made by randomly choosing every second‐ or third‐truck passing a location. During non‐
peak times, it was often possible to sample every vehicle; during peak times, the project staff was
trained to undertake random selection of target vehicles. On northbound trips, staff also alternated
between FAST and regular trucks to ensure sampling of both. Staff was rotated on a regular basis each
day to also record northbound and southbound vehicle traffic, to capture wait time data on both
directions each day that surveys were in progress.
The sample consists of 2,754 observations of border‐crossing times for commercial vehicles collected
during the months of May through October of 2011. Data collection for northbound trips was performed

Goods Movement Border Crossing Study and Analysis
Page | 80
uniformly throughout the entire data collection period, while data on southbound trips was
concentrated during the months of September and October.
Of the entire sample collected 1,597 observations correspond to northbound trips (58 percent) and the
remaining 1,157 are southbound trips (42 percent). For the northbound subsample, 587 observations
were collected during the AM hours (37 percent of the total subsample) and the remaining 1,010
observations correspond to the PM hours (63 percent of the total subsample). The southbound
subsample shows a more even distribution of collection times with 546 observations corresponding to
AM hours (47 percent of the total subsample) and the remaining 611 (53 percent of the total
subsample) corresponding to PM hours.
The subsamples also captured the lane used by trucks to cross the border, providing information on the
load type and border‐crossing procedure used. For northbound trips, the vast majority of observations
correspond to loaded trucks, with an important number corresponding to FAST crossings. On
southbound trips, the majority of the observations correspond to loaded trucks74 (see Figure 48).
Figure 48. Observations Collected by Cargo Type and Crossing Procedure, Commercial Vehicles
5.3 DataCollectionforPassengerVehicles
Collection of border crossing time for passenger vehicles was done at the Calexico (downtown) and the
Calexico East POEs. This section presents the characteristics of the population from which the sample
was taken, the protocol used to collect data and the characteristics of the sample collected.
74 On southbound trips the distinction between regular and FAST border‐crossing procedures does not apply.
81
305
677
849
817
22
0%
10%
20%
30%
40%
50%
60%
70%
80%
90%
100%
Northbound Trips Southbound Trips
Empty FAST
FAST
Loaded
Empty

Goods Movement Border Crossing Study and Analysis
Page | 81
5.3.1 PassengerVehiclePopulationCharacteristics
Calexico‐Mexicali has six separate flows of passenger vehicles that were assessed during this project:
Regular/non‐SENTRI vehicles crossing north and southbound at Calexico (downtown) POE;
SENTRI vehicles crossing north bound at Calexico (downtown) POE;
Regular/non‐SENTRI vehicles crossing north and southbound at Calexico East POE; and
SENTRI vehicles crossing northbound at Calexico East POE;
The Calexico (downtown) POE passenger vehicle facilities operate 24 hours a day, seven days a week75
while the Calexico East POE passenger vehicle facilities operate from 6:00 a.m. to 10:00 p.m. seven days
a week76. During an average month in 2011, there were a combined total of more than 570,000
northbound crossings made by passenger vehicles at the two POEs under study – with a similar number
of southbound crossings77. Based on previous at‐border surveys78, the majority of these vehicles (over
two‐thirds) are driven by Mexicali residents, with most of the remaining driven by residents of Imperial
County. Notably, also based on past research79, the majority of car crossings are made by frequent
crossers – that is, individuals that cross at least once per week.
For the purposes of this project, all cars that were crossing north‐ or southbound during daylight hours
(more than 70 percent of all crossings are done during this time of the day) were potentially subject to
being sampled.
As seen in Figure 49 and Figure 50, there are wide variations in vehicle crossings between 2009 and
2011. While the primary factors that have caused this variation in crossings are unknown, it is generally
understood that this variance is explained primarily by a combination of security concerns, perceived or
real border delays and economic impacts caused by the recession.
75 Source: CBP’s website, http://www.cbp.gov/xp/cgov/toolbox/contacts/ports/ca/2503.xml 76 Source: CBP’s website, http://www.cbp.gov/xp/cgov/toolbox/contacts/ports/ca/2507.xml 77 Source: USDOT, Bureau of Transportation Statistics, Border Crossing/Entry Data. 78 See, for example, survey work performed for SANDAG’s Comprehensive Freight Gateway Study and USDOC’s
Improving Economic Outcomes by Reducing Border Delays Study. 79 See, for example, the Comprehensive Freight Gateway Study and the Improving Economic Outcomes by
Reducing Border Delays Study.

Goods Movement Border Crossing Study and Analysis
Page | 82
Figure 49. Number of Northbound Passenger Vehicles per Month, Calexico (downtown) POE, 2009‐2011
Source: USDOT, Bureau of Transportation Statistics, Border Crossing/Entry Data
Figure 50. Number of Northbound Passenger Vehicles per Month, Calexico East POE, 2009‐2011
Source: USDOT, Bureau of Transportation Statistics, Border Crossing/Entry Data
‐
50,000
100,000
150,000
200,000
250,000
300,000
350,000
400,000
450,000
500,000
2009 2010 2011
‐
50,000
100,000
150,000
200,000
250,000
300,000
2009 2010 2011
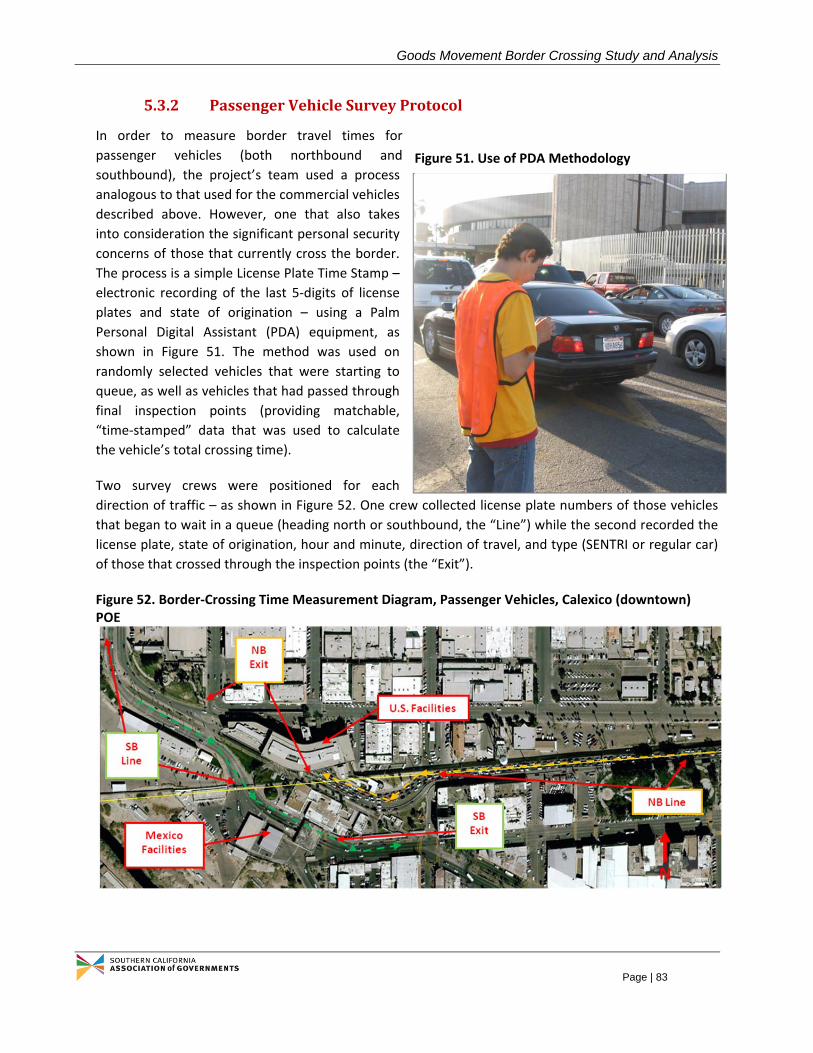
Goods Movement Border Crossing Study and Analysis
Page | 83
5.3.2 PassengerVehicleSurveyProtocol
In order to measure border travel times for
passenger vehicles (both northbound and
southbound), the project’s team used a process
analogous to that used for the commercial vehicles
described above. However, one that also takes
into consideration the significant personal security
concerns of those that currently cross the border.
The process is a simple License Plate Time Stamp –
electronic recording of the last 5‐digits of license
plates and state of origination – using a Palm
Personal Digital Assistant (PDA) equipment, as
shown in Figure 51. The method was used on
randomly selected vehicles that were starting to
queue, as well as vehicles that had passed through
final inspection points (providing matchable,
“time‐stamped” data that was used to calculate
the vehicle’s total crossing time).
Two survey crews were positioned for each
direction of traffic – as shown in Figure 52. One crew collected license plate numbers of those vehicles
that began to wait in a queue (heading north or southbound, the “Line”) while the second recorded the
license plate, state of origination, hour and minute, direction of travel, and type (SENTRI or regular car)
of those that crossed through the inspection points (the “Exit”).
Figure 52. Border‐Crossing Time Measurement Diagram, Passenger Vehicles, Calexico (downtown) POE
Figure 51. Use of PDA Methodology

Goods Movement Border Crossing Study and Analysis
Page | 84
It should be noted that in some cases, security protocols at POEs did not allow survey crew to be
adjacent to the final inspection point – leading to an “undercount” of the actual total crossing time or
loss of data if staff had to be too distant. As such, an alternative used was to locate the data collection
for the “Exit” just prior to the POE inspection booth – as well as to record an average time needed for
vehicles to cover the distance between the survey crew and the “exit” point. This “adjustment factor”
was added (or subtracted, depending on the final location of the survey crew) into traffic data to adjust
any potential undercount or overcount, to provide an accurate average wait time for vehicles that were
crossing at each POE.
Similar surveying locations and processes were also used at the Calexico East POE for passenger vehicles
(as shown on Figure 53, describing north‐ and south‐bound vehicle flows).
Figure 53. Border‐Crossing Time Measurement Diagram, Passenger Vehicles, Calexico East POE

Goods Movement Border Crossing Study and Analysis
Page | 85
5.3.3 CharacteristicsofthePassengerVehicleSample
Sampling was made randomly using an intercept survey approach targeting every third vehicle. Where
multiple lanes were present, staff rotated amongst lanes to ensure that data was captured from various
lanes of travel.
The total sample consists of 5,164 observations collected on both POEs during months of April through
September, 2011. In the case of the Calexico (downtown) POE, the sample was collected during April,
May, June and September. In the case of Calexico East POE, the majority of the data collection efforts
took place during the month of July and only a small portion of the sample was gathered during August
and October (see Figure 54).
Figure 54. Distribution of Data Collection Efforts Throughout Sampling Period, Passenger Vehicles
Of the total number of observations included in the sample 3,445 observations (67 percent) correspond
to northbound trips and the remaining 1,719 observations (33 percent) are associated to southbound
trips. Furthermore, the sample contains an important amount of SENTRI crossings on both POEs (see
Table 31).
Table 31. Observations Collected by Lane Type and POE, Passenger Vehicles
Calexico (downtown) Calexico East
Lane Type Northbound Southbound Northbound Southbound
General Lanes 795 848 813 871
SENTRI 1,364 ‐ 473 ‐
Total 2,159 848 1,286 871
0
50
100
150
200
250
300
350
400
450
4/1 5/21 7/10 8/29 10/18 12/7
Data Points Collected
Date
Calexico NB Calexico SB Calexico East NB Calexico East SB

Goods Movement Border Crossing Study and Analysis
Page | 86
If the sample is disaggregated by POE, the observations collected at Calexico (downtown) represents 58
percent of the total sample while the remaining 42 percent corresponds to the observations collected at
Calexico East. Of the subsample collected at the Calexico (downtown) POE, 72 percent of the
observations correspond to northbound trips and the remaining 28 percent corresponds to southbound
trips. Further disaggregating, of the 2,159 observations collected at the Calexico (downtown) POE on
northbound trips, 44 percent were gathered during AM hours; the remaining 56 percent were collected
during PM hours. Similarly, of the 848 observations collected at this POE on the southbound direction,
25 percent were gathered during the AM hours; the other 75 percent was collected during the PM
hours.
For the subsample collected at the Calexico East POE, 60 percent of the observations correspond to
northbound trips. The remaining 40 percent corresponds to southbound trips. Moreover, of the 1,286
observations collected at the Calexico (downtown) POE on northbound trips, 44 percent were gathered
during AM hours; the remaining 56 percent were collected during PM hours. Similarly, of the 871
observations collected at this POE for southbound trips, 48 percent correspond to the AM hours; the
other 52 percent were collected during the PM hours.
5.4 DataManagementandConsistencyChecks
Data collected at each POE both for commercial and passenger vehicles was subsequently tabulated into
an Excel format similar to the one in Table 32, to allow for analysis of border wait times.
Table 32. Example of Tabulated Data for Border‐Crossing Time Measurements
In the course of tabulating results, the project’s team randomly selected photos and PDA‐based data to
validate accuracy of data entry processes by survey workers.
Table 33. Distribution of Observations Classified as "Outliers"
Direction Passenger Vehicles Trucks
Total Calexico (downtown) Calexico East Calexico East
Northbound 25 2 30 57
Southbound 30 9 23 62
Total 55 11 53 119
Additionally, during this process observations considered to be “outliers” (i.e., observations above or
below three standard deviations from the mean of the total sample for a specific direction and for a
specific POE) were identified and removed from the sample. A total of 119 observations were classified
DAY-TYPE
(WK, WKE)
AM/PM
(INITIAL)
TRUCK
TYPE (F,
L, E) US PLATE LINE GATE EXIT
MIN. XING
TIME
LINE-GATE
TIME
GATE-EXIT
TIME
LINE-EXIT
TIME
WK AM L A986023 8:56:00 AM 8:59:00 AM 0:03:00
WK AM F 4JF1980 8:58:00 AM 9:01:00 AM 12:59:16 PM 04:01:16 0:03:00 3:58:16 4:01:16
WK AM F B137973 8:58:00 AM 9:01:00 AM 0:03:00
WK AM L 8H52032 8:58:00 AM 9:00:00 AM 0:02:00
WK AM F 4AD4450 8:59:00 AM 9:02:00 AM 0:03:00
WK AM F 4GZ6580 8:59:00 AM 9:02:00 AM 0:03:00

Goods Movement Border Crossing Study and Analysis
Page | 87
as “outliers” for both passenger vehicles and trucks in both POEs (see Table 33) and therefore were not
included in the calculation of results for border‐crossing travel time presented in the following sections.
5.5 Border‐CrossingTimeResults
Analysis of the border‐crossing time data collected at the Calexico (downtown) and Calexico East POEs
shows different results for performance and reliability statistics for different vehicle types. This section
presents the results disaggregated in a series of subsamples that share the same characteristics and
therefore can be directly compared. Additionally, the disaggregation of border‐crossing times between
queue and inspections is done for northbound commercial vehicle trips. A comparison between Calexico
East and five other POEs in terms of average border‐crossing times for northbound commercial flows is
also made. Finally, the economic impacts of delays at Calexico (downtown) and Calexico East are
calculated using a peer‐reviewed economic model.
5.5.1 Border‐CrossingTimeResultsforCommercialVehicles
The analysis of the data collected for commercial vehicle border‐crossing times was performed by
partitioning the sample into different sets of subsamples. The “grouping” into subsamples was done
ensuring that each subsample shared the same border‐crossing characteristics (such as direction of
travel and/or crossing procedure) and therefore estimation of summary statistics within those groups
was appropriate80.
For each subsample analyzed two sets of statistics were estimated: performance and reliability statistics.
Performance statistics are related to the crossing conditions that would be faced by the average user of
the POE. These statistics include average border‐crossing time, standard deviation of crossing times as
well as minimum and maximum crossing times. Reliability statistics, on the other hand, characterize the
entire set of possibilities observed in the sample. These statistics include the border‐crossing time for
the 10th and 90th percentile of the sample as well as the median (50th percentile) crossing time.
The fist set of subsamples consisted on dividing the sample by direction of flow (i.e., northbound and
southbound) regardless of the type of load and border‐crossing procedure used.
Figure 55 and Figure 56 show the plot of border‐crossing times for each direction as a function of the
time of day.
80 It would be ill‐advised to average border‐crossing times across northbound and southbound trucks since their
border‐crossing procedures are inherently different.

Goods Movement Border Crossing Study and Analysis
Page | 88
Figure 55. Border Crossing Time for Northbound Trips, Commercial Vehicles
Figure 56. Border‐Crossing Time for Southbound Trips, Commercial Vehicles
For this set of subsamples, the performance and reliability statistics are displayed in Table 34 in terms of
hours. Notice the mean and standard deviation of the border‐crossing times in the southbound direction
are higher than those in the northbound direction, implying a better performance by the POE on
0:00
0:28
0:57
1:26
1:55
2:24
2:52
3:21
3:507:10
8:53
9:21
9:40
9:55
10:08
10:22
10:32
10:46
11:05
11:20
11:41
12:03
12:25
12:46
13:11
13:30
13:55
14:19
14:37
15:00
15:25
15:49
16:16
16:33
16:57
17:21
17:40
17:56
18:12
18:34
18:50
Border Crossing Time (in hours)
Time of Day
0:00
0:28
0:57
1:26
1:55
2:24
2:52
3:21
3:50
4:19
4:48
7:43
8:22
8:32
8:52
9:08
9:20
9:36
9:50
10:04
10:21
10:34
10:50
11:06
11:22
11:38
12:04
12:48
13:28
13:49
14:07
14:20
14:40
14:58
15:12
15:29
15:48
16:00
16:10
16:27
16:54
17:22
17:58
Border Crossing Time (in hours)
Time of Day

Goods Movement Border Crossing Study and Analysis
Page | 89
servicing northbound flows. Similarly, the 90th percentile for southbound flows is considerably higher
than that of northbound flows, suggesting a better reliability by the POE on northbound trips.
Table 34. Summary Statistics for Commercial Vehicles, by Trip Direction
Statistic Northbound Southbound
Mean 0:54 1:02
Standard deviation 0:38 0:56
Minimum 0:06 0:02
Maximum 3:24 4:34
10th percentile 0:17 0:11
90th percentile 1:48 2:24
50th percentile 0:42 0:43
Sample size 1,567 1,134
These statistics, however, may be inaccurate since northbound flows aggregate four different
combinations of cargo types and border‐crossing procedures that may not be sampled according to their
proportion in the population: loaded cargo in general lanes, loaded cargo in FAST lanes, empty cargo in
general lanes and empty cargo in FAST lanes. Similarly, statistics for southbound flows aggregate
observations of loaded and empty trucks that may not necessarily feature the correct proportion that is
observed in the population.
Therefore, further refinement of the original sample is required. For this subsequent refinement, the
northbound subsample was partitioned into four groups that represented the different combinations of
cargo types and border‐crossing procedures existed in Calexico East POE. The northbound subsample
was partitioned according to the cargo type present at the time of crossing81. The results of this new set
of subsamples are shown in Table 35 measured in hours82.
Table 35. Summary Statistics for Commercial Vehicles, by Trip Direction and Crossing Procedure
Statistic Northbound Southbound
Empty GL Empty FAST Loaded FAST Loaded GL Empty Loaded
Mean 0:37 0:41 0:50 1:02 0:39 1:10
Standard deviation 0:29 0:36 0:37 0:39 0:48 0:56
Minimum 0:09 0:11 0:06 0:07 0:02 0:02
Maximum 2:36 2:37 3:22 3:24 4:14 4:34
10th percentile 0:13 0:16 0:17 0:19 0:05 0:16
90th percentile 1:14 1:25 1:40 1:56 1:49 2:31
50th percentile 0:29 0:29 0:38 0:54 0:18 0:53
Sample size 79 21 807 660 300 831
81 Notice that for southbound trips there is no distinction between FAST and general lanes. 82 The southbound subsample shown in Table 34 included 3 observations that did not have a classification of cargo
type. Therefore, these observations were eliminated from the calculations presented in Table 35.

Goods Movement Border Crossing Study and Analysis
Page | 90
Table 35 shows how disproportionate both northbound and southbound subsamples are towards
observations from groups that have high border‐crossing statistics (i.e., loaded FAST and loaded general
lanes for northbound trips and loaded for southbound trips). This unbalance does not affect statistics
such as the minimum and maximum since those statistics are not based on aggregation of observations.
However, it does affect statistics such as the mean, standard deviation and percentiles.
To correct this situation, expansion factors may be applied to statistics from the refined subsamples.
Expansion factors correspond to the true proportion of the refined subsample in the population and
therefore can be found in section 5.2.1 of this report. For example, during the years 2009 and 2010 the
average percentage of loaded trucks traveling northbound was 51.8 percent and it is considered that
approximately 30 percent of all truck trips through Calexico East POE in that direction are classified as
FAST trips. Assuming the same proportion of loaded and empty trucks for southbound trips, the
“adjusted” statistics, measured in hours, are shown in Table 3683.
Table 36. Adjusted Summary Statistics for Commercial Vehicles, by Trip Direction84
Adjusted Statistic Northbound Southbound
Mean 0:48 0:55
Standard deviation 0:35 0:52
Minimum 0:06 0:02
Maximum 3:24 4:34
10th percentile 0:16 0:11
90th percentile 1:35 2:10
50th percentile 0:39 0:36
Comparison between the statistics reported in Table 34 and Table 36 show that, despite the adjustments in the magnitude made to the summary statistics for border‐crossing times by using the
expansion factors, the Calexico East POE still exhibits better performance and reliability on northbound
traffic.
5.5.2 MeasurementofQueue&InspectionTimesforNorthboundCommercialVehicles
The location of the survey crews allowed the project’s team to measure the actual time trucks waited in
queue before reaching the first inspection booth and the total border‐crossing time for a fraction of the
commercial vehicle sample. In particular, queue time and total border‐crossing time were measured for
1,478 northbound trucks. The summary statistics of the two measurements show that the average wait
time in queue for a northbound truck is 16 minutes while the average inspection time for the same
northbound trucks is 38 minutes. Based on this information, for northbound trucks the average wait
83 The expansion factors used in the calculation of the adjusted results for northbound trips are: 0.3374 for empty
general lanes, 0.1446 for empty FAST, 0.1554 for loaded FAST and 0.3626 loaded general lanes. For southbound trips the factors are: 0.482 for empty trucks and 0.518 for loaded trucks.
84 The adjusted standard deviation presented in this table corresponds to a linear approximation to the true value of the adjusted standard deviation.

Goods Movement Border Crossing Study and Analysis
Page | 91
time in queue represents 30 percent of the total border‐crossing time; the remaining 70 percent
corresponds to binational inspections.
5.5.3 ComparisonwithPerceivedBorder‐CrossingTimesforTruckDrivers
A section of the truck intercept O/D surveys elicited information from truck drivers regarding their
perceived wait time before reaching the first inspection booth in the border‐crossing direction at which
they were interviewed. A total of 212 drivers traveling north and 199 performing southbound trips
responded to this question and the results are shown in Figure 57.
Figure 57. Perceived Queue Time for Truck Drivers, by Trip Direction
On average, both northbound truck drivers reported perceiving a queue time of 30 minutes while
southbound truck drivers perceived a 29‐minute queue time. In general, truck drivers perceived almost
twice as long queue times on northbound trips compared to what was found in the sample. Table 37
shows that the summary statistics for the perceived queue times are consistently higher compared to
the ones found in the actual measurement of queue times for northbound trips85.
A possible explanation for at least part of the differences observed in Table 37 is that the responses to
perceived queue times by truck drivers were mainly provided in multiples of 5 minutes, possibly causing
an upward bias. However, this is expected to explain just a minor portion of the difference between
actual and perceived queue times.
85 This same exercise could not be performed for southbound traffic since the location of survey crews for
southbound trips did not allow measurement of the actual time trucks waited in queue before reaching the first inspection booth.
0%
2%
4%
6%
8%
10%
12%
14%
16%
18%
20%
0 50 100 150 200 250 300
Percentage
Perceived Minutes in Queue
Northbound Southbound
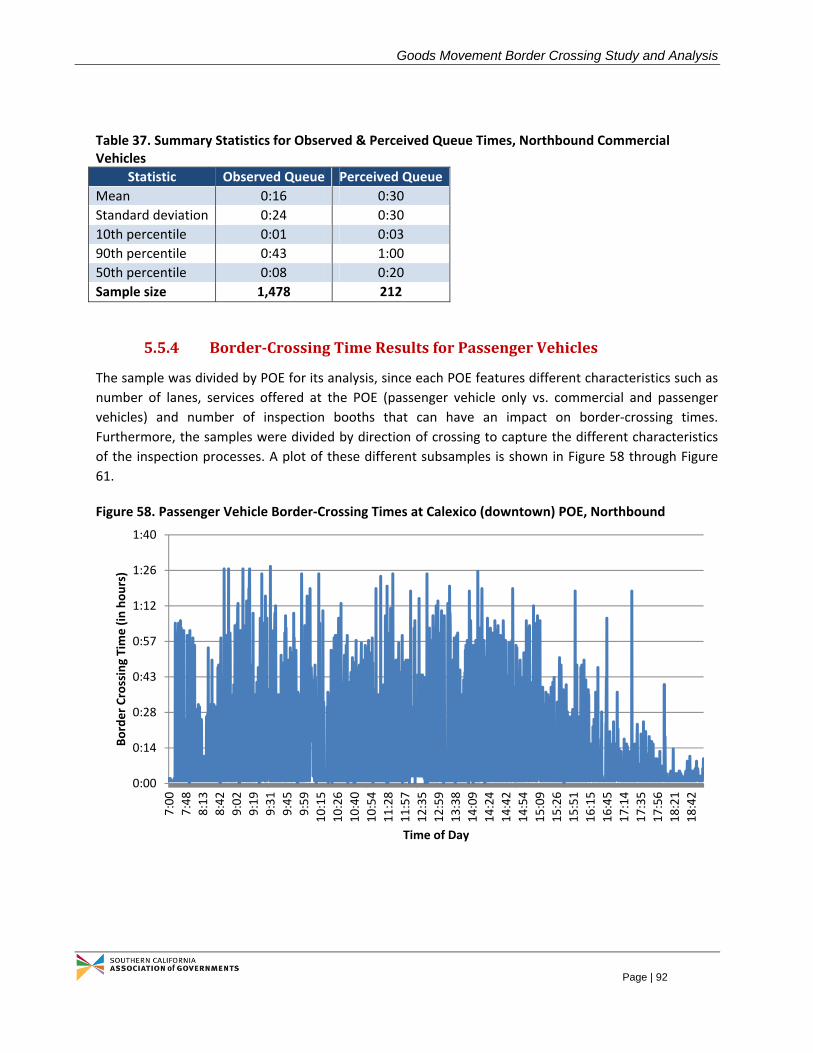
Goods Movement Border Crossing Study and Analysis
Page | 92
Table 37. Summary Statistics for Observed & Perceived Queue Times, Northbound Commercial Vehicles
Statistic Observed Queue Perceived Queue
Mean 0:16 0:30
Standard deviation 0:24 0:30
10th percentile 0:01 0:03
90th percentile 0:43 1:00
50th percentile 0:08 0:20
Sample size 1,478 212
5.5.4 Border‐CrossingTimeResultsforPassengerVehicles
The sample was divided by POE for its analysis, since each POE features different characteristics such as
number of lanes, services offered at the POE (passenger vehicle only vs. commercial and passenger
vehicles) and number of inspection booths that can have an impact on border‐crossing times.
Furthermore, the samples were divided by direction of crossing to capture the different characteristics
of the inspection processes. A plot of these different subsamples is shown in Figure 58 through Figure
61.
Figure 58. Passenger Vehicle Border‐Crossing Times at Calexico (downtown) POE, Northbound
0:00
0:14
0:28
0:43
0:57
1:12
1:26
1:40
7:00
7:48
8:13
8:42
9:02
9:19
9:31
9:45
9:59
10:15
10:26
10:40
10:54
11:28
11:57
12:35
12:59
13:38
14:09
14:24
14:42
14:54
15:09
15:26
15:51
16:15
16:45
17:14
17:35
17:56
18:21
18:42
Border Crossing Time (in hours)
Time of Day

Goods Movement Border Crossing Study and Analysis
Page | 93
Figure 59. Passenger Vehicle Border‐Crossing Times at Calexico (downtown) POE, Southbound
Figure 60. Passenger Vehicle Border‐Crossing Times at Calexico East POE, Northbound
0:00
0:07
0:14
0:21
0:28
0:36
7:49
8:59
9:26
9:58
10:29
10:38
10:53
11:25
12:09
12:41
13:29
14:20
14:32
14:45
14:59
15:18
15:32
15:50
16:01
16:20
16:31
16:48
17:01
17:15
17:27
17:39
17:52
18:18
18:30
18:41
18:55
19:16
Border Crossing Time (in hours)
Time of Day
0:00
0:14
0:28
0:43
0:57
1:12
1:26
1:40
1:55
7:11
7:43
8:00
8:17
8:33
8:47
9:01
9:18
9:28
9:35
9:50
10:07
10:26
10:49
11:04
11:16
11:30
11:41
12:04
14:10
14:55
15:17
15:33
15:52
16:16
16:27
16:41
17:03
17:22
17:36
17:54
18:29
Border Crossing Time (in hours)
Time of Day

Goods Movement Border Crossing Study and Analysis
Page | 94
Figure 61. Passenger Vehicle Border‐Crossing Times at Calexico East POE, Southbound
For northbound trips, each subsample was further refined to differentiate between SENTRI crossings
and general lane crossings since the border‐crossing times are significantly different due to the expedite
nature of the trusted traveler program. The summary statistics for each one of the subsamples analyzed
(i.e., northbound general lanes, northbound SENTRI and southbound for each POE) once the outlier
observations are removed are shown in Table 38, expressed in hours.
Table 38. Summary Statistics for Border‐Crossing Times, Passenger Vehicles
Statistic Calexico (downtown) Calexico East
NB GL NB SENTRI SB NB GL NB SENTRI SB
Mean 0:39 0:01 0:02 0:40 0:05 0:03
Standard deviation 0:20 0:01 0:03 0:24 0:04 0:03
Minimum 0:00 0:01 0:01 0:01 0:00 0:01
Maximum 2:01 0:17 0:34 1:55 0:30 0:32
10th percentile 0:10 0:01 0:01 0:09 0:01 0:01
90th percentile 1:05 0:04 0:05 1:10 0:10 0:05
50th percentile 0:38 0:01 0:02 0:42 0:04 0:03
Sample size 783 1,353 818 812 464 862
These summary statistics reveal that on northbound crossings made through general lanes, both POEs
shown similar performance and reliability. The same is true for southbound trips, where differences
between performance and reliability statistics between the two POEs are not significant. On northbound
SENTRI trips, however, the Calexico (downtown) POE displays a clear advantage over the Calexico East
POE in terms of performance and reliability of border‐crossing times.
0:00
0:07
0:14
0:21
0:28
0:36
7:04
7:27
7:43
7:58
8:10
8:22
8:41
9:01
9:23
9:41
10:02
10:20
10:47
11:14
11:27
14:12
14:40
15:07
15:16
15:37
16:03
16:14
16:25
16:36
17:00
17:08
17:19
17:31
17:42
18:12
18:26
18:43
Border Crossing Time (in hours)
Time of Day

Goods Movement Border Crossing Study and Analysis
Page | 95
In order to estimate the aggregate border‐crossing time for each POE, it is necessary to use the
appropriate expansion factors for the different subsamples of northbound trips. The share of SENTRI
crossings in the region is reported to be approximately 17 percent86 and therefore this expansion factor
was used for both POEs to estimate the adjusted border‐crossing time statistics shown in Table 39,
measured in hours.
Table 39. Adjusted Summary Statistics for Passenger Vehicles, by POE and Trip Direction87
Adjusted Statistic Calexico (downtown) Calexico East
Northbound Southbound Northbound Southbound
Mean 0:33 0:02 0:34 0:03
Standard deviation 0:17 0:03 0:21 0:03
Minimum 0:00 0:01 0:00 0:01
Maximum 1:28 0:34 1:47 0:32
10th percentile 0:08 0:01 0:07 0:01
90th percentile 0:54 0:05 1:00 0:05
50th percentile 0:31 0:02 0:35 0:03
Sample size 2,134 818 1,284 862
As it is expected, the results in Table 39 show that aggregate southbound trips have faster average
border‐crossing times as well as less dispersion of values (i.e., better reliability) than aggregate
northbound trips for each POE. Similarly, aggregate results show that both POEs show very similar
performance and reliability when comparing trips on the same direction even though Calexico
(downtown) shows a slight advantage over Calexico East on northbound trips.
5.5.5 InterpretationofResults
This study found that border‐crossing times for northbound commercial vehicles are, on average, faster
and more reliable compared to southbound trips. This is not a common conclusion among border‐
crossing studies, which usually predict that southbound trips have minimal wait times at the border and
are done in a “seamless” way. A possible explanation for this finding is related to the time period when
the observations were collected, especially for the southbound flows (the entirety of the southbound
sample was collected between September 20 and October 24, 2011). During this period, important
administrative and staff changes took place at Aduanas on the Mexican side. In particular, a new
administrator was named for this POE and an important number of inspectors were removed from the
location, leading to more strict security protocols and longer inspections for trucks traveling into Mexico
from the U.S.
When comparing aggregate border‐crossing times for passenger vehicles, neither POEs has a clear
advantage over the other that could potentially provide an incentive to drivers to “switch” their current
86 Corresponds to the average of SENTI crossings during 2010. 87 The adjusted standard deviation presented in this table corresponds to a linear approximation to the true value
of the adjusted standard deviation.
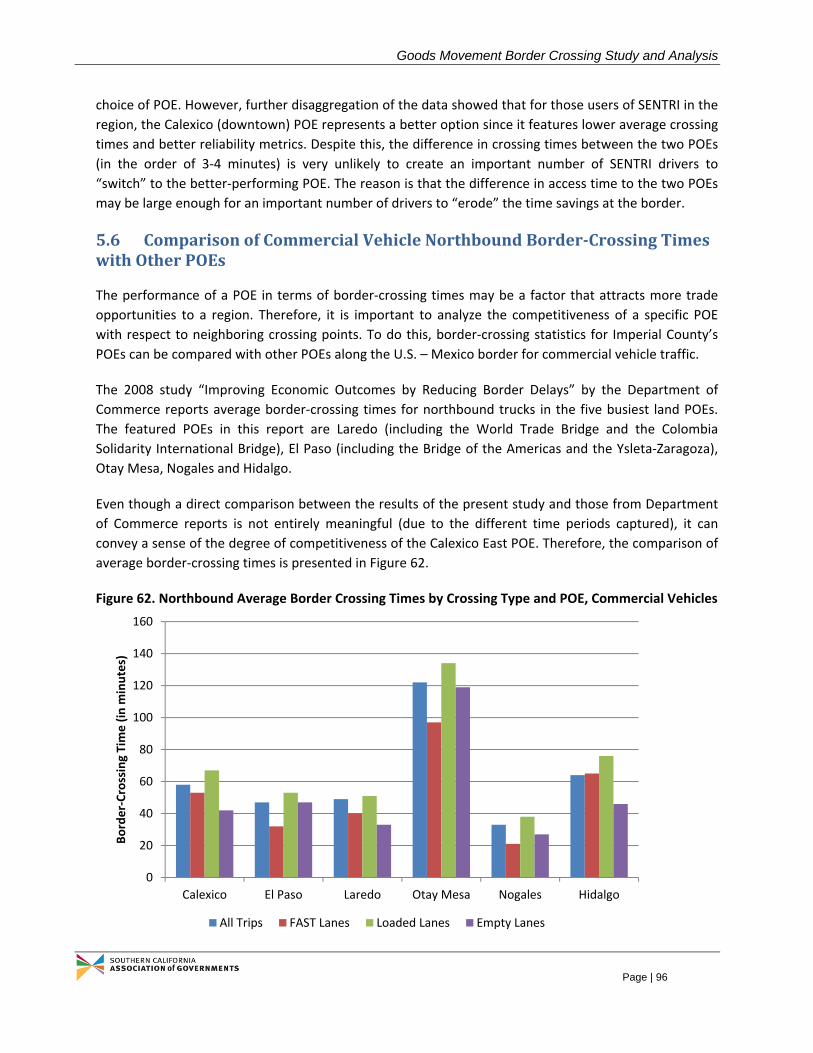
Goods Movement Border Crossing Study and Analysis
Page | 96
choice of POE. However, further disaggregation of the data showed that for those users of SENTRI in the
region, the Calexico (downtown) POE represents a better option since it features lower average crossing
times and better reliability metrics. Despite this, the difference in crossing times between the two POEs
(in the order of 3‐4 minutes) is very unlikely to create an important number of SENTRI drivers to
“switch” to the better‐performing POE. The reason is that the difference in access time to the two POEs
may be large enough for an important number of drivers to “erode” the time savings at the border.
5.6 ComparisonofCommercialVehicleNorthboundBorder‐CrossingTimeswithOtherPOEs
The performance of a POE in terms of border‐crossing times may be a factor that attracts more trade
opportunities to a region. Therefore, it is important to analyze the competitiveness of a specific POE
with respect to neighboring crossing points. To do this, border‐crossing statistics for Imperial County’s
POEs can be compared with other POEs along the U.S. – Mexico border for commercial vehicle traffic.
The 2008 study “Improving Economic Outcomes by Reducing Border Delays” by the Department of
Commerce reports average border‐crossing times for northbound trucks in the five busiest land POEs.
The featured POEs in this report are Laredo (including the World Trade Bridge and the Colombia
Solidarity International Bridge), El Paso (including the Bridge of the Americas and the Ysleta‐Zaragoza),
Otay Mesa, Nogales and Hidalgo.
Even though a direct comparison between the results of the present study and those from Department
of Commerce reports is not entirely meaningful (due to the different time periods captured), it can
convey a sense of the degree of competitiveness of the Calexico East POE. Therefore, the comparison of
average border‐crossing times is presented in Figure 62.
Figure 62. Northbound Average Border Crossing Times by Crossing Type and POE, Commercial Vehicles
0
20
40
60
80
100
120
140
160
Calexico El Paso Laredo Otay Mesa Nogales Hidalgo
Border‐Crossing Time (in m
inutes)
All Trips FAST Lanes Loaded Lanes Empty Lanes

Goods Movement Border Crossing Study and Analysis
Page | 97
Using this unconventional comparison, Calexico East would rank fourth (out of six) below Nogales, El
Paso and Laredo in average border‐crossing time for aggregate trips, FAST lane crossing and loaded
general lane crossings. However, it would rank third below Nogales and Laredo in average crossing time
for empty lanes88.
Considering that the five POEs used in this comparison are the busiest ports in the southern border and
therefore process larger volumes of trucks than Calexico East, it can be said that the border‐crossing times observed in Calexico are comparatively high and do not represent a comparative advantage for
the border region in comparison to other locations.
5.7 EconomicImpactofBorderDelays
The observed border‐crossing times at Calexico (downtown) and Calexico East POEs were used to
estimate the economic implications of border delays. In particular, the California Border Impact Model
(CALBIM) developed by HDR for SANDAG and IVAG was used in this estimation (see APPENDIX E:ESTIMATION OF ECONOMIC IMPACT OF BORDER DELAYS for a brief description). The model and its
parameters were peer‐reviewed by a panel of academics and subject matter experts in 2007, and more
recently in 2009. It provides planners and policy makers with a means for conducting border‐wide
analyses of delays and simulating their cumulative impacts on the economies of Imperial County,
California, Baja California and Mexico. The simulation tool was calibrated with the data collected in this
project (e.g., estimates of total crossing time) and estimates of economic impacts were obtained.
Analyses were conducted by port of entry and then aggregated by vehicle type.
The economic impacts of passenger vehicle delays at Calexico (downtown) and Calexico East POEs are
provided in Table 40. The observed border‐crossing times cause significant revenue and output losses in
the region, though the majority of those are recorded in the Mexican side of the border due to a lack of
diversification and a high degree of dependence from the Imperial Valley economy. However, the
majority of the employment losses are felt on the U.S. side of the border, since the large number of
person‐trips originating in Mexico that are forgone due to delays translates into less spending by
Mexican nationals in retail stores located in Imperial Valley89.
Table 40. Economic Impacts of Passenger Vehicle Delays at Calexico (downtown) and Calexico East
Impact Metric California Imperial County
Mexico Baja
California
Foregone Person Trips ‐1,287,237 ‐1,052,721 ‐775,332 ‐775,332
Net Revenue Losses, $million ‐$228 ‐$216 ‐$343 ‐$346
Total Output Losses, $million ‐$427 ‐$314 ‐$529 ‐$485
Total Employment Losses, jobs ‐3,843 ‐4,145 ‐3,491 ‐3,205
88 The comparison, however, is not without merit, since the same methodology was used in all the POEs compared
to determine border‐crossing wait times. 89 Delays at the border constitute part of the generalized costs for Mexican nationals who shop in retail stores in
the U.S. Therefore, longer delays represent higher generalized costs, and as a result a portion of Mexican nationals may decide to shop in local retail stores (i.e., in Mexicali) instead of crossing the border.

Goods Movement Border Crossing Study and Analysis
Page | 98
Total Tax Revenue Losses, $million ‐$65 ‐$60 n/a n/a
The delays in commercial vehicle border‐crossings also generate negative economic impacts in the
regional economy. Table 41 provides the estimated output, employment, income and tax revenue
impacts associated to the border‐crossing times observed in the sample. As it is evident, the majority of
the impacts are larger in the Mexican side of the border, with the exception of labor income losses. This
can be attributed to the difference in average wage rates between the two countries.
Table 41. Economic Impacts of Commercial Vehicle Delays at Calexico East
Impact Metric California Imperial
County Mexico
Baja
California
Direct Output Losses, $million ‐$97.5 ‐$48.8 ‐$138.5 ‐$96.9
Total Output Losses, $million ‐$192.9 ‐$70.1 ‐$226.9 ‐$144.4
Total Employment Losses, jobs ‐1,000 ‐334 ‐1,061 ‐675
Total Labor Income Losses, $million ‐$53.9 ‐$17.4 ‐$25.2 ‐$16.0
Total Tax Revenue Losses, $million ‐$23.7 ‐$6.1 n/a n/a
Finally, the impacts for both passenger and commercial vehicles can be aggregated for certain
categories such as output, employment and tax revenues. This is shown in Table 42. In aggregate, delays
at Calexico (downtown) and Calexico East cost Imperial County $384 millions in lost output and $66
million in lost tax revenues. Similarly, almost 4,500 jobs are not created due to the delays. For the State
of California the impacts are slightly larger than those observed in Imperial Valley, with the exception of
the category of output losses that increases significantly to $620 million.
Table 42. Economic Impacts of Commercial and Passenger Vehicle Delays at Calexico (downtown) and Calexico East
Impact Metric California Imperial County
Mexico Baja
California
Total Output Losses, $million ‐$620 ‐$384 ‐$755 ‐$629
Total Employment Losses, jobs ‐4,844 ‐4,479 ‐4,552 ‐3,880
Total Tax Revenue Losses, $million ‐$88 ‐$66 n/a n/a

Goods Movement Border Crossing Study and Analysis
Page | 99
6 ECONOMICDEVELOPMENTOPPORTUNITIES
The California‐Baja California Border Master Plan projects that population and employment in Imperial County to growth at annual rates of 2.0 percent and 2.3 percent, respectively, in the next twenty years.90 These estimates are approximately one percent higher than those of San Diego County and California in general, and they translate into greater local demand for goods and services. Additionally, local government believes that there is relatively more development potential in Imperial County than in comparison to nearby coastal communities where development is constrained by policy and community opposition.91 This chapter describes the economic development opportunities in Imperial County. In particular, the discussion focuses on current activities and how development potential can be better realized through enhancement in goods movement in the region.
6.1 IncentivesandConstraints
6.1.1 Incentives
There are several state and federal incentive zones in Imperial County. The promotion and development of these zones is coordinated at the local level by the Imperial County Planning and Development Services Department and the Imperial Valley Economic Development Corporation.
Enterprise Zones
The California Enterprise Zone Program is administered by the Department of Housing and Community Development (HCD). An Enterprise Zone is an economically distressed area that is targeted for economic revitalization. There are 42 such zones throughout the state, each administered locally. The program provides special incentives, including state tax incentives, designed to encourage business investment and to promote the creation of new jobs in these designated areas:
Hiring Credits ‐ Firms can earn $37,440 or more in state tax credits for each qualified employee hired;
Up to 100 percent Net Operating Loss (NOL) carry‐forward;
Corporations can earn sales tax credits on purchases of $20 million per year on qualified machinery and machinery parts;
Up‐front expensing of certain depreciable property;
Unused tax credits can be applied to future tax years, stretching out the benefit of the initial investment;
Enterprise Zone companies can earn preference points on state contracts.
Imperial County currently has two Enterprise Zones:
90 California Department of Transportation (2008), California‐Baja California Border Master Plan. September 2008.
91 Imperial County, Renewable Energy Feasibility Study, 2008.

Goods Movement Border Crossing Study and Analysis
Page | 100
The Calexico‐County Enterprise Zone (CCEZ), which includes the City of Calexico and unincorporated areas of Imperial County along the border, including two POEs (Calexico East‐Mexicali II and Calexico West‐Mexicali I); and
The Imperial Valley Enterprise Zone (IVEZ), which is located within parts of the City of Brawley and unincorporated areas of Imperial County.
Manufacturing Enhancement Areas
Manufacturing Enhancement Areas (MEAs) were created by the State of California in 1997 to stimulate job creation in areas experiencing very high unemployment rates. The benefits include:
Streamlined local regulatory controls;
Reduced local permitting fees; and
Eligibility to earn $29,234 or more in state tax credits for each qualified employee hired, over a five‐year period.
Currently there are two MEAs, Calexico and Brawley, both of which are located in Imperial County. These MEAs are scheduled to expire at the end of 2012.
Foreign Trade Zones
In the U.S., FTZs were created by the Foreign‐Trade Zones Act of 1934 to provide special customs procedures to U.S. plants engaged in international trade‐related activities. FTZs are considered to be outside of U.S. Customs Territory for the purpose of customs duty payment. Goods entering FTZs are not subject to customs tariffs until they leave the zone and are formally entered into U.S. Customs Territory. In the same way, merchandise that is shipped to foreign countries from FTZs is exempt from duty payments. FTZs are particularly appealing to firms that import components in order to manufacture finished products for export. Also, there is no time limit on goods stored inside a FTZ and certain foreign and domestic merchandise held in FTZs may be exempted from state and local inventory taxes. This allows firms to minimize their costs while their products are waiting to be shipped.
FTZs are divided into general‐purpose zones and subzones. General‐purpose zones involve public facilities that can be used by more than one firm, and are most commonly ports or industrial parks used by small to medium sized businesses for warehousing/distribution and some processing/assembly. Subzones, on the other hand, typically involve a single firm's site which is used for more extensive warehousing/distribution or manufacturing/processing that cannot easily be accomplished in a general‐purpose zone.
The Imperial Valley Foreign Trade Zone (IVFTZ) consists of seven areas covering more than 2,000 acres. It is located within the City of Brawley, the City of Calexico, the City of Calipatria, the City of El Centro and unincorporated areas of Imperial County along the border.
EDA Funding
The U.S. Department of Commerce’s Economic Development Administration (EDA) provides investment assistance to communities for projects that contribute to the creation or retention of private sector jobs and to alleviate unemployment. Grant applications must be supported by a five‐year Comprehensive

Goods Movement Border Crossing Study and Analysis
Page | 101
Economic Development Strategy (CEDS). The Overall Economic Development Commission (OEDC) is responsible for preparing and maintaining the CEDS for Imperial County. The most recent CEDS was released in January 2012.92
The last round of grants applications (November 2009) resulted in three projects being awarded EDA funds. Those projects are: i) “El Centro Town Center Street Improvement” ($3.2 million); ii) “Town Center / Portico / Kloke Infrastructure Improvements” in Calexico ($3 million); and, iii) “Imperial Center Infrastructure Improvements” ($2.5 million).
For the next round of applications (2012) there are four projects requesting federal Economic Development Assistance. The cities of Brawley, Calipatria, Imperial and Holtville submitted one project each, for a total funding request of $14.7 million.
6.1.2 Constraints
OEDC also identified a number of weaknesses that could constrain economic development in Imperial County in the future. One issue receiving much attention lately is the lack of adequate transportation infrastructure, especially at the border. According to the 2007 Transportation Plan Highway Element some of the most noticeable gaps in the county’s truck network include:93
1. The lack of direct freeway connections to rail yards and intermodal facilities;
2. The lack of dedicated truck lanes, passing lanes and truck bypass routes;
3. High truck traffic through urban areas including Brawley and Westmorland; and
4. Empty trucks returning to Mexico after unloading their cargo in Calexico.
Many businesses have also complained about the lack of a regional airport. The Imperial County Airport has only two runways and cannot handle large volumes of freight. Currently it is mostly used for general aviation.
The lack of qualified labor (and its corollary, the lack of educational and career opportunities) is also viewed as a major impediment to growth in the region.
6.2 Transportation/Warehousing/DistributionOpportunities
Imperial County is an international gateway that facilitates trade between the U.S. and Mexico. It is situated within a network of transportation routes and given its proximity to maquiladora operations in Mexicali; the region has a natural advantage in providing value‐added services in the goods that are transported through it.
92 Imperial County (2012), Planning and Development Services Department, Imperial County CEDS 2012‐2017, Comprehensive Economic Development Strategy, January 2012.
93 Imperial Valley Association of Governments (2008), Imperial County 2007 Transportation Plan Highway Element. Prepared by KOA Corporation, March 2008.
Goods Movement Border Crossing Study and Analysis
Page | 102
6.2.1 ExistingOpportunities
According to the Imperial Valley Economic Development Corporation (IVEDC)94, one of the potential drivers of Imperial County’s economic growth is its transportation infrastructure, since it can promote trade and globalization. In particular, the region’s advantages include:
Three POEs with Mexico;
Railway access to Los Angeles, San Diego, Arizona and mainland Mexico;
Access to I‐8 and I‐10;
Specific planned areas for international logistics;
Mesquite Lake Specific Plan 5,100 acres devoted to heavy industrial development; and
Gateway to the Americas ‐ 1,700 acres of commercial and industrial complex95.
6.2.2 OpportunitiesArisingFromInfrastructureEnhancement
IVEDC recommends that Imperial County support the maquiladora operations in Mexicali, by investing in trucking‐related operations and maintenance, warehousing, professional and financial services. Given Imperial County’s proximity to the region’s trade and transportation network as described above, additional roadway and rail investment will improve access for labor and to other production inputs, as well as facilitate goods movement in the County.
6.3 AgriculturalandFoodProcessingOpportunities
Imperial County’s agricultural industry plays a key role in the region’s economy, grossing at $1.5 billion96, employing 46 percent of the County’s workforce97 and using 88 percent of the 565,207 acres of developed land98. According to the 2007 Census, Imperial County outputs in cattle and calves, sheep and goats and their products were ranked first in California and second within the U.S.99
6.3.1 ExistingOpportunities
IVEDC identifies the following as Imperial County’s advantages in the agricultural and food processing market:
Central location to major southwest markets;
Publicly owned water and energy at an affordable cost;
94 IVEDC is a public‐private enterprise that promotes regional economic growth. 95 Imperial County (2007c), Gateway of Americas Benefit Analysis Report Update. 2007. 96 2009 estimates from Imperial County Agricultural Crop and Livestock Report.
97 2008 estimates from SCAG’s Imperial County Local Profile, May 2009.
98 2005 land use data reported by CALTRANS in the California‐Baja California Border Master Plan 2008.
99 U.S. Department of Agriculture (2007), Census of Agriculture 2007.

Goods Movement Border Crossing Study and Analysis
Page | 103
Availability of a young workforce;
Wide variety of available commodities;
Available land zoned for agricultural and commercial use; and
Access to three international ports.
6.3.2 OpportunitiesArisingFromInfrastructureEnhancement
The study area has the opportunity to bring additional food processing facilities to Imperial County, specifically food processing involving crops/products grown and raised in the binational region. Transportation infrastructure enhancements (e.g., increased number and reliability of roads) that reduce congestion and delay would effectively lower transportation costs and allow agricultural products from the region to reach a larger number of markets (by reducing the time required to access them).
In addition to food processing, there is an opportunity to collaborate with San Diego who has long hosted the biotechnology industry. Transportation improvements would allow these companies to create applied biotechnology facilities that can be reached quickly and reliably by laboratory personnel living in San Diego.
6.4 TourismOpportunities
According to the Economic Strategic Plan of 2007, Imperial County is identified as an underutilized tourist destination with vast development potential. The IVEDC recommends that entertainment, arts, and cultural projects should be initiated and integrated with other tourism development in the region to enhance residents’ quality of life as well as to attract visitors from neighboring counties (e.g., Los Angeles, Orange, Riverside, San Bernardino and San Diego Counties).
6.4.1 ExistingOpportunities
The Southern‐California desert climate attracts visitors from colder, northern regions for outdoor activities. The existing opportunities in the region include:
Tourist attractions such as the Salton Sea, Imperial Valley, Mexicali/ San Felipe region, and Imperial Sand Dunes; and
Activities include camping, hiking, golfing, off‐road ventures, and bird watching.
6.4.2 OpportunitiesArisingFromInfrastructureEnhancement
Roadway improvements are fundamental in providing residents access to recreational activities and attracting visitors from surrounding areas. Since residents and visitors are expected to travel through the regions via automobiles, highway expansion and maintenance projects would necessitate connectivity between entertainment facilities and tourist attractions, and utilization of roadways that are primarily dominated by trucks for goods movement.

Goods Movement Border Crossing Study and Analysis
Page | 104
6.5 EnergyOpportunities
Imperial County has the resource potential to produce various types of renewable energy to accommodate some of the growing demand in the southwestern region of the U.S. According to IVEDC, Imperial County is the county with the second highest amount of geothermal energy production in the nation. In addition, untapped areas surrounding the Salton Sea have the capacity to produce more than 2,000 megawatts of energy.
6.5.1 ExistingOpportunities
Imperial County is geographically well‐suited for energy production. IVEDC identifies in its 2008 Renewable Energy Feasibility Study Final Report that the region’s opportunities include:
Over 143,000 acres of land with less than one percent in slope (ideal for solar power generation);
Almost 500,000 acres of land for wind energy generation; and
Abundance of undisturbed land and agricultural resources for bio‐fuel production.
6.5.2 OpportunitiesArisingFromInfrastructureEnhancement
Investment in highway and railroad infrastructure could facilitate energy production. In particular, improvements in region’s transportation network would enable construction of solar and wind energy production plants as they require large‐scale equipment (such as solar panels and wind turbines) to be transported. In addition, they will provide workers with enhanced accessibility for operation and maintenance purposes. When these improvements align with a well‐designed transportation network, they could also improve energy transmission efficiency by eliminating barriers as well as increasing capacity.

Goods Movement Border Crossing Study and Analysis
Page | 105
7 SUMMARYOFFINDINGSANDCONCLUSIONS
This study conducted a thorough analysis of the current situation of the Calexico (downtown) and
Calexico East POEs and their contribution to the efficiency of goods movement in the region. This
section presents the main findings as well as policy recommendations to tackle the congestion and
comparatively high border‐crossing wait times observed in the data. Additionally, a comparison
between the different border‐crossing methodologies used is discussed in order to identify best
practices in travel time measurements. Finally, next steps are recommended to identify the best course
of action among possible alternatives proposed.
7.1 StudyFindings
The study uses several sources of information to validate and cross‐check its findings. In particular,
discussions with logistic experts (during the early stages of this study) and survey responses from logistic
companies / producers (as part of the O/D identification process) covered a series of overlapping topics
that in most cases featured coinciding opinions. Also, information from truck drivers (through responses
to the truck intercept questionnaire) and border‐crossing time measurements is used to derive
conclusions about wait times at the border.
The findings were classified into themes for easy identification. Each theme is associated to a specific
category considered important in the movement of goods across the border. The summary of findings is
presented in Table 43.
Table 43. Summary of Study Findings, by Theme
Theme Finding & Source Logistics & Supply Chain
Small degree of interaction between large companies and local firms (logistics experts)
Wide array of logistic configurations provided in region (logistic companies / producers)
Private Sector Processes
Drayage is common and important component of local supply chain (logistics experts)
Drayage occurs primarily in Northbound goods movement provided by logistic companies (logistic companies / producers)
Shipments between large companies do not use third parties for their transportation (logistic companies / producers)
Three out of every four trucks in the region cross the border at least once a day (logistic companies / producers)
Origin‐Destination Import origin and export destination geographically concentrated (logistics experts)
Goods flow mainly between binational region and the rest of California (logistic companies / producers)
Vast majority of trucks using Calexico East POE travel locally – i.e., between Mexicali and Calexico (logistic companies / producers)
Goods movement in the area occurs primarily between manufacturing facilities and warehouses (logistic companies / producers)

Goods Movement Border Crossing Study and Analysis
Page | 106
Theme Finding & Source
Industrial parks in Mexicali represent important generators of truck trips across the border (logistic companies / producers)
Transportation Procedures
Limited benefits of FAST / C‐TPAT (logistics experts)
Logistic companies rarely use FAST program to cross the border (logistic companies / producers)
Border‐Crossing Time, Passenger Vehicles
Passenger vehicle border‐crossing times and reliability are similar in Calexico Downtown and Calexico East for Northbound General Lanes and Southbound traffic (wait time measurement)
Calexico Downtown displays better performance indicators for SENTRI lanes compared to Calexico East (wait time measurement)
Border‐Crossing Time, Commercial Vehicles
Border‐crossing time is perceived as unpredictable (logistics experts)
Truck crossings show similar performance and reliability indicators for aggregate Northbound and Southbound trips (wait time measurement)
Breakdown of truck trips by type of cargo shows clear differences in border‐crossing performance and reliability for empties, FAST and loaded (wait time measurement)
Day‐of‐the‐week and time‐of‐day of crossing affect border‐crossing wait time for trucks (wait time measurement)
Border‐crossing wait times in Calexico are high compared to busier Border‐Crossing Points (wait time measurement)
Willingness to Pay for Faster Crossings
Users not opposed to idea of tolled border crossing lanes for predictable travel time (logistic companies / producers)
Attitude towards tolling differs between companies and truck drivers (logistic companies / producers)
Economic Impact of Delays
Delays at the border cause Imperial County to lose $384 million in output, $66 million in taxes and more than 4,400 jobs (economic analysis)
Expected Market Changes
Unclear impact of NAFTA trucking provisions on demand for border crosses (logistics experts)
Unclear future characteristics and demand for transportation in region (logistics experts)
No important challenges or impediments were identified by transportation experts regarding current border‐crossing activities (logistics experts)
The main findings of the study can be summarized as follows:
(i) drayage is an important component of the logistics chain in the region;
(ii) an overwhelming majority of the trade conducted through Imperial County’s land POEs
corresponds to goods moved between California and Baja California;
(iii) industrial parks in Mexicali are important in the generation of border‐crossing truck trips;
(iv) border‐crossing times in Calexico East POE are high compared to other POEs along the U.S. –
Mexico border;
(v) southbound commercial border‐crossing times are higher than anticipated, attaining levels
comparable to those of northbound commercial trips;
(vi) POE users are willing to pay to improve border‐crossing times and reliability on northbound
trips;
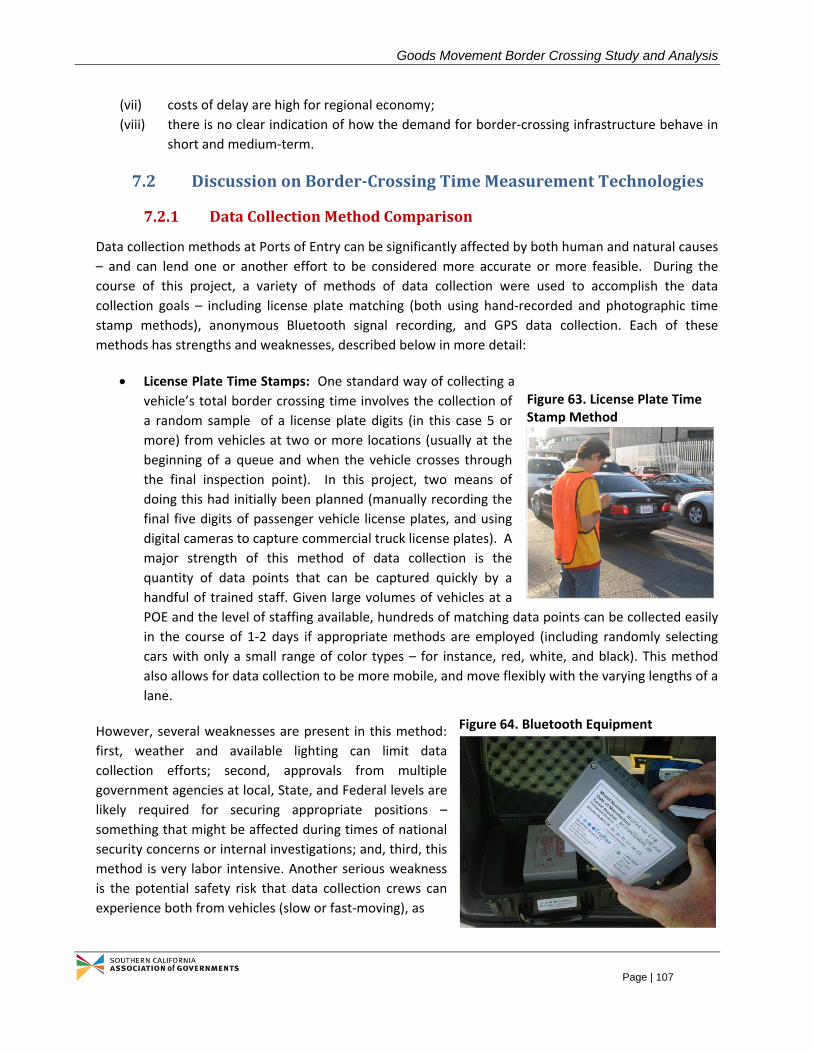
Goods Movement Border Crossing Study and Analysis
Page | 107
(vii) costs of delay are high for regional economy;
(viii) there is no clear indication of how the demand for border‐crossing infrastructure behave in
short and medium‐term.
7.2 DiscussiononBorder‐CrossingTimeMeasurementTechnologies
7.2.1 DataCollectionMethodComparison
Data collection methods at Ports of Entry can be significantly affected by both human and natural causes
– and can lend one or another effort to be considered more accurate or more feasible. During the
course of this project, a variety of methods of data collection were used to accomplish the data
collection goals – including license plate matching (both using hand‐recorded and photographic time
stamp methods), anonymous Bluetooth signal recording, and GPS data collection. Each of these
methods has strengths and weaknesses, described below in more detail:
License Plate Time Stamps: One standard way of collecting a
vehicle’s total border crossing time involves the collection of
a random sample of a license plate digits (in this case 5 or
more) from vehicles at two or more locations (usually at the
beginning of a queue and when the vehicle crosses through
the final inspection point). In this project, two means of
doing this had initially been planned (manually recording the
final five digits of passenger vehicle license plates, and using
digital cameras to capture commercial truck license plates). A
major strength of this method of data collection is the
quantity of data points that can be captured quickly by a
handful of trained staff. Given large volumes of vehicles at a
POE and the level of staffing available, hundreds of matching data points can be collected easily
in the course of 1‐2 days if appropriate methods are employed (including randomly selecting
cars with only a small range of color types – for instance, red, white, and black). This method
also allows for data collection to be more mobile, and move flexibly with the varying lengths of a
lane.
However, several weaknesses are present in this method:
first, weather and available lighting can limit data
collection efforts; second, approvals from multiple
government agencies at local, State, and Federal levels are
likely required for securing appropriate positions –
something that might be affected during times of national
security concerns or internal investigations; and, third, this
method is very labor intensive. Another serious weakness
is the potential safety risk that data collection crews can
experience both from vehicles (slow or fast‐moving), as
Figure 63. License Plate Time Stamp Method
Figure 64. Bluetooth Equipment

Goods Movement Border Crossing Study and Analysis
Page | 108
well as occupants of vehicles at border crossings that may consider this method to be a threat to their
privacy.
Bluetooth Data Collection: During a week‐long test of this method, BlueFax equipment was
used to collect anonymous Bluetooth signals broadcast by equipment commonly utilized by
drivers in the public (such as cell phones, wireless headsets, etc). Matching MAC addresses
collected at least two different points along a North‐ and/or Southbound border crossing points
can potentially allow for a highly accurate assessment of the time it takes for a vehicle to move
past fixed points where Bluetooth sensing/recording equipment is installed. There are several
strengths to his method of data collection, including:
o As seen in the graphs below, a significant number of samples can be collected
throughout the course of a day, autonomously and without concern for weather or
daylight; and
o Data can also be collected without the need for onsite labor (saving data collection
costs), and in a non‐obtrusive manner (reducing privacy concerns of drivers, and
potential agency concerns for non‐border staff operating in a security intensive POE
location).
However, some weaknesses do exist and have to be balanced against the benefits:
Given that data may be collected from equipment at fixed points, Bluetooth equipment
does not have the ability to be mobile and measure border delays from the ever‐
changing end‐point of a border queue’s true length. Also, in order to accurately assess
crossing times, multiple units may have to be set up along lengthy corridors;
Bluetooth equipment also has some limitations on discerning between various “types”
of border crossing vehicles that may be in immediate proximity to each other. For
instance, in the above graphics, it is not possible to identify which vehicles might have
been crossing in SENTRI, Regular, or (in the future) Ready‐lane vehicles that might be in
close proximity to each other; and
Calexico North-bound:
Bluetooth Matches per Hour (n=1171)
0
50
100
150
200
7 A
.M.
8 A
.M
9 A
.M
10
A.M
11
A.M
12
P.M
1 P
.M
2 P
.M
3 P
.M
4 P
.M
5 P
.M
Calexico North-bound:
Bluetooth Av Estimated Crossing Time
(n=1171)
0:00
0:28
0:57
1:26
1:55
2:24
2:52
7:0
0
8:0
0
9:0
0
10
:00
11
:00
12
:00
13
:00
14
:00
15
:00
16
:00
17
:00
Figure 65. Example of Sample Sizes Collected Through Bluetooth

Goods Movement Border Crossing Study and Analysis
Page | 109
Several site‐related issues can also potentially detract from Bluetooth sensing
equipment at a POE. Long‐term, multi‐agency cooperation across a border is required to
initially site equipment in appropriate locations; equipment at such locations are also
potentially subject to theft; electrical cabling or battery use is required to power the
equipment; and regular downloading of data is required (something that can be
overcome by installing equipment that has built‐in data downloading capabilities).
Periodic site maintenance may also be required.
GPS Data Collection: A final major method for collecting data at POEs was tested during the
course of this project, utilizing extremely accurate, GPS‐based equipment installed temporarily
in commercial and passenger vehicles. While only a small sample of passenger vehicle GPS data
was ultimately collected, nearly 600 GPS tracks of commercial vehicles crossing the border were
secured with the support of local trucking industry representatives. Upon their analysis, the
strengths of this method were identified to be the following:
GPS‐based data is not only
extremely accurate (allowing
for vehicle locations to be
tracked down to 5‐10 meters
of a vehicle’s actual location),
but continuous – allowing
policy planners to assess
each individual track’s
location, time, and speed –
as well as the specific
moment (within +/‐30
seconds) that a vehicle
slowed for a queue, or
accelerated after an
inspection;
GPS data can also be mapped
in great detail, allowing
analysts to not only
differentiate which types of
vehicles (i.e.: SENTRI, FAST,
etc) had crossed the border, but also if they were subject to an inspection or scan
(potentially adding to their total crossing time); and
GPS data can also be collected at any time of day, during any type of weather, with little
involvement of the vehicle’s driver and without labor cost (at the specific moment GPS
data is being recorded).
However, there are also significant weaknesses to some types of GPS data collection (particularly using
GPS data loggers):
Figure 66. GPS Output After Processing
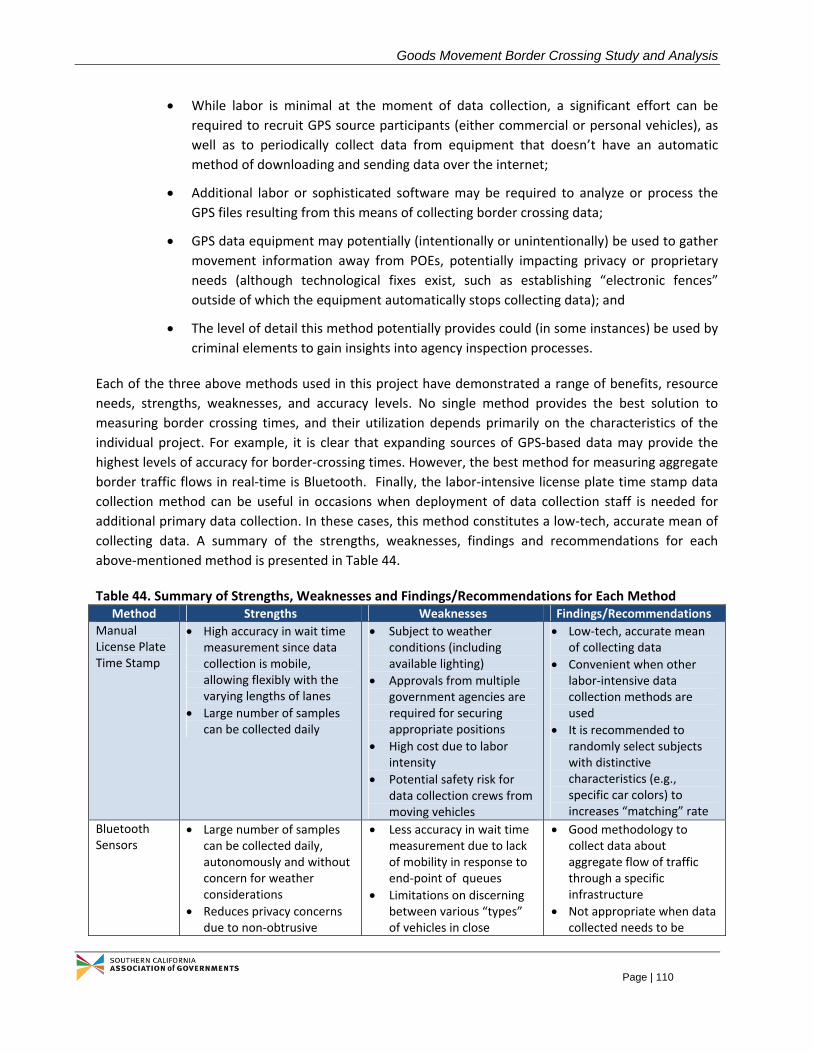
Goods Movement Border Crossing Study and Analysis
Page | 110
While labor is minimal at the moment of data collection, a significant effort can be
required to recruit GPS source participants (either commercial or personal vehicles), as
well as to periodically collect data from equipment that doesn’t have an automatic
method of downloading and sending data over the internet;
Additional labor or sophisticated software may be required to analyze or process the
GPS files resulting from this means of collecting border crossing data;
GPS data equipment may potentially (intentionally or unintentionally) be used to gather
movement information away from POEs, potentially impacting privacy or proprietary
needs (although technological fixes exist, such as establishing “electronic fences”
outside of which the equipment automatically stops collecting data); and
The level of detail this method potentially provides could (in some instances) be used by
criminal elements to gain insights into agency inspection processes.
Each of the three above methods used in this project have demonstrated a range of benefits, resource
needs, strengths, weaknesses, and accuracy levels. No single method provides the best solution to
measuring border crossing times, and their utilization depends primarily on the characteristics of the
individual project. For example, it is clear that expanding sources of GPS‐based data may provide the
highest levels of accuracy for border‐crossing times. However, the best method for measuring aggregate
border traffic flows in real‐time is Bluetooth. Finally, the labor‐intensive license plate time stamp data
collection method can be useful in occasions when deployment of data collection staff is needed for
additional primary data collection. In these cases, this method constitutes a low‐tech, accurate mean of
collecting data. A summary of the strengths, weaknesses, findings and recommendations for each
above‐mentioned method is presented in Table 44.
Table 44. Summary of Strengths, Weaknesses and Findings/Recommendations for Each Method Method Strengths Weaknesses Findings/Recommendations
Manual License Plate Time Stamp
High accuracy in wait time measurement since data collection is mobile, allowing flexibly with the varying lengths of lanes
Large number of samples can be collected daily
Subject to weather conditions (including available lighting)
Approvals from multiple government agencies are required for securing appropriate positions
High cost due to labor intensity
Potential safety risk for data collection crews from moving vehicles
Low‐tech, accurate mean of collecting data
Convenient when other labor‐intensive data collection methods are used
It is recommended to randomly select subjects with distinctive characteristics (e.g., specific car colors) to increases “matching” rate
Bluetooth Sensors
Large number of samples can be collected daily, autonomously and without concern for weather considerations
Reduces privacy concerns due to non‐obtrusive
Less accuracy in wait time measurement due to lack of mobility in response to end‐point of queues
Limitations on discerning between various “types” of vehicles in close
Good methodology to collect data about aggregate flow of traffic through a specific infrastructure
Not appropriate when data collected needs to be

Goods Movement Border Crossing Study and Analysis
Page | 111
Method Strengths Weaknesses Findings/Recommendations
collection of data
Low labor cost due to minimum human involvement
proximity to each other
Variety of site‐related issues may hinder data collection efforts (e.g., equipment theft, battery use, data download requirements, periodic maintenance)
High purchasing cost for equipment and software (can also be rented)
divided for its analysis into subsamples based on vehicle’s characteristics
GPS Data Loggers
High accuracy in wait time measurement
Great detail in data collected allows differentiation of border‐crossing type and components of wait time (e.g., queue, inspection)
Data can be collected daily, autonomously and without concern for weather considerations
Low purchasing cost for GPS units (can also be rented)
Lower number of samples collected daily (depends on number of data loggers used simultaneously)
Specialized labor and/or sophisticated software is required to analyze and process GPS files
May require periodical collection (or “download” of data) from equipment
Participants may experience privacy concerns
Security concerns by government agencies related to use of data collected
Best accuracy for border‐crossing times
Methodology requires significant effort to recruit data‐source participants
Skilled labor and specialized software must be available to process data collected
Privacy and security concerns must be addressed before method is deployed
7.2.2 ComparisonofResults
For passenger vehicles, a robust sample size for both the license plate method and the Bluetooth in Calexico (Downtown) POE shows that both procedures produce similar performance and reliability results (see Table 45). In the case of northbound flows, Bluetooth cannot distinguish between General and SENTRI lanes and therefore the results for this method are comprised of a combination of these two types of crossings.
Table 45. Comparison of Time Measurement Results for License Plate and Bluetooth Methods, Passenger Vehicles (Calexico Downtown)
Statistic License Plate Method Bluetooth
NB GL NB SENTRI SB NB SB
Mean 0:39 0:01 0:02 0:41 0:02 Standard deviation 0:20 0:01 0:03 0:32 0:02 Minimum 0:00 0:01 0:01 0:02 0:00 Maximum 2:01 0:17 0:34 2:26 0:22 10th percentile 0:10 0:01 0:01 0:04 0:01

Goods Movement Border Crossing Study and Analysis
Page | 112
90th percentile 1:05 0:04 0:05 1:28 0:04 50th percentile 0:38 0:01 0:02 0:35 0:02 Sample size 783 1,353 818 1,171 369
For commercial vehicles, however, the difference in sample sizes collected at Calexico East is such that it does not allow the results to be compared with a reasonable degree of significance (see Table 46).
Table 46. Comparison of Time Measurement Results from Photographic Time Stamp and Bluetooth Methods, Commercial Vehicles (Calexico East)
Statistic Photographic Stamp Bluetooth
NB (aggregate) NB
Mean 0:54 0:18 Standard deviation 0:38 0:06 Minimum 0:06 0:06 Maximum 3:24 0:29 10th percentile 0:17 0:10 90th percentile 1:48 0:26 50th percentile 0:42 0:18 Sample size 1,567 32
7.3 Conclusions
The study validated that local markets are the main driver for border‐crossing goods movement. This is
attributable to the high degree of economic integration between California and Baja California.
However, a relevant finding was that industrial parks in Mexicali are closely linked to the demand of
truck trips across the border. This is particularly relevant since the 2008‐2013 State Development Plan
for Baja California lists as one of the priorities in the logistics area is the promotion of industrial parks
throughout the state. The success of this strategy by the state could lead to an increased demand for
commercial crossings through Imperial County’s POEs.
Local experts and logistic companies agree that private sector processes in the area are complex and in
most cases designed to meet the producer’s needs. This requires logistic and transportation firms to
have enough flexibility in their supply of services, making drayage an important component of the
movement of goods across the border. Similarly, the study found that shipments to/from large
companies are generally not transported using local transportation companies, suggesting that large
manufacturing firms have integrated their transportation services into their operations.
Through the use of an economic model to estimate impacts, the study found that economic delays at
the Calexico (downtown) and Calexico East POEs are costly to the local and regional economy in terms of
output and jobs as well as taxes forgone. The importance of reducing border‐crossing times in the area
is of high significance to stimulate the local economy, since an important number of crossings are local
in nature (i.e., related to international commute and shopping or drayage). In particular, it was found
that for northbound trips approximately one third of the border‐crossing wait time can be reduced since
it corresponds to queue time on the Mexican side. However, it was also found that southbound

Goods Movement Border Crossing Study and Analysis
Page | 113
commercial border‐crossing times require action since they are comparable (in magnitude) to the ones
observed in northbound trips.
Defining the best course of action to reduce delays in the area requires further studies and
consultations. However, an initial assessment of the current configuration of the Calexico (downtown)
and Calexico East POEs suggests that, on northbound flows, actions can be oriented to reduce queue
time before inspections. Possible courses of action consist of increasing the number of lanes leading to
the POEs in Mexicali and improving their distribution both before and inside the grounds of the POEs.
Another potential improvement consists of improving the signaling on the Mexican streets and avenues
that are close to the POEs. However, the amount of border‐crossing time reductions potentially
attainable with these changes is limited by the time spent by users during inspections.
On southbound flows, no breakdown of border crossing times between queuing and inspection was
recorded. However, during the time this study was conducted a change in the management and a large‐
scale re‐staffing of the POEs on the Mexican side did occur, possibly contributing to higher‐than‐
expected border‐crossing times. As a result, improvements on inspection logistics on Mexican side
could constitute an option to reduce southbound trip times.
Another option worth exploring consists of implementing tolling schemes on existing POEs in Imperial
County that guarantee faster and more reliable crossing times. Support for southbound tolling is not
widespread since companies do not see any value to it. Conversely, the study found a positive attitude
towards paying a toll to reduce northbound trip times. In particular, data collected suggests good
prospects to implement northbound tolling during peak hours. A detailed study is required to determine
which specific tolling scheme may be best suited for this situation, since its choice may have an impact
on the demand for POE use in the region.
Faced with similar challenges of congestion and increasing border‐crossing times, neighboring binational
regions are implementing initiatives to minimize the negative impact of delays in the future. For
example, significant developments at the San Ysidro POE are currently taking place, where a complete
reconfiguration to expand the facility and improve access for passenger vehicles, pedestrians and buses
is expected to be completed by 2016. Similarly, U.S. Rep. Raul Grijalva proposed an appropriations bill
for the expansion of the San Luis POE. In Otay Mesa, feasibility studies for the construction of the Otay
Mesa East POE and SR 11 are underway and the infrastructure is scheduled to open in 2015. This
represents a potential for diversion for Imperial County’s POEs. Finally, the Mexican Government is
analyzing to launch a Request for Proposals (RFP) to hire the Project Manager for Punta Colonet, a
seaport that could potentially increase the demand for border‐crossing trips across the California – Baja
California border.
It is unclear how the transportation market in the region will evolve in the near future. In particular, the
implementation of the NAFTA trucking agreement could introduce important changes to the
composition of logistic chains in the area. For example, this policy may have an important effect on long‐
haul services originating at the binational region, since more competition from Mexican truckers is
expected to reduce transportation costs and lead to the development of new logistic services to

Goods Movement Border Crossing Study and Analysis
Page | 114
facilitate differentiation from competitors100. Similarly, the impact of this policy on supply chains for
goods traditionally moved through drayage is expected to be small, though some integration of
transportation services may be observed, leading companies to offer both drayage and long‐haul
services originating in Mexican soil.
Regarding long‐term development of logistic activities in the region, manufacturers and transportation
experts anticipate sustained increases in production levels. In particular, technification of production
processes and a larger number of companies participating in “trusted company” certifications are
thought to be the main contributors to that increase. Similarly, Vendor Managed Inventory (VMI)
systems are expected to grow, generating more trips across the border. If these expectations are indeed
correct, the future for Imperial County’s POEs involves more congestion at the border and longer
border‐crossing times for both passenger vehicles and trucks.
Based on this outlook, the following section recommends a series of policies to address the issue of
strategic infrastructure development in Imperial County.
7.4 PolicyRecommendations
To minimize the negative economic effects of delays at the border, a set of policy options can be
explored on both sides of the border to reduce border‐crossing times. The options have been derived
based on the specific characteristics of the Imperial Valley POEs. In most cases, the options require
cooperation among Federal, state and local agencies to be successfully implemented. The options focus
on freight traffic (i.e., trucks) and can be divided into three broad categories: (i) optimize use of existing
capacity, (ii) improve throughput, and, (iii) expand capacity. Each option is described separately.
7.4.1 OptimizeUseofExistingCapacity
This option is equivalent to the proactive management of demand for commercial use of the POEs in
Imperial Valley. The objective is to reduce border‐crossing times by providing incentives for decision‐
makers (e.g., brokers and logistic managers) to use capacity in an efficient way and therefore allocating
demand across all available capacity defined not only as physical infrastructure but also as the available
hours of operation. A typical barrier to successfully implementing these options is the flexibility of
business practices.
Institute an Appointment System
Any commercial user of Calexico East POE can electronically schedule border crossings, free of charge,
and receive a window of time within which trucks may cross. Non‐scheduled crossings would wait in the
standard queue, which would normally require longer wait times to cross. In this way, CBP and Aduanas
can best allocate available capacity and inspection resources. However, in order to implement this
alternative, adequate infrastructure is needed to allow trucks with appointments to access dedicated
lanes and booths.
100 This could include the reconfiguration of local logistic chains, substituting drayage‐to‐long‐haul structures with
international long‐haul configurations.
Goods Movement Border Crossing Study and Analysis
Page | 115
Implement Permits for POE Use
If legally possible, Calexico East POE could distribute “licenses” or “user permits” to trucking companies
that authorize its use. Licenses could act as all day appointments and licensed trucks would be granted a
defined percentage of daily border crossing capacity. However, in order for this scheme not to deter
international trade and economic integration in the region, it would have to be combined with capacity
expansion alternatives such as increasing operating hours or construction of new POEs.
Explore Variable Pricing
Pricing is a common tool to manage demand on congestible infrastructure and the surveys conducted
during this study show that majority of the users are not opposed to it. Two forms of variable pricing
mechanisms can be explored at Calexico East: (i) congestion pricing, or, (ii) value pricing. Real‐time
congestion pricing is a strategy that varies the total cost associated with border crossings depending on
traffic levels. With appropriate adjustments to tolls and fees, traffic congestion can be dissipated over
time and/or available physical capacity. Value pricing, on the other hand, adjusts the cost associated
with border crossing depending on the urgency, or other measure of importance, of each shipment.
Many shipments are time sensitive due to just‐in‐time inventory practices or perishability. Importers
may determine that it is in their best interest to expedite shipping and may choose to pay additional
tolls or fees based on their demand for time‐sensitive crossings. An example is agriculture shippers who
place a premium on rapid access to the U.S. market. In both pricing cases the adequate infrastructure
(e.g., dedicated lanes and variable informational signage) must be present for the alternative to be
successful.
Provide Relevant Information to Decision‐Makers
This alternative consists of expanding the current web‐based system used by CBP to report open lanes
and current wait times at each POE. Additional services such as congestion could be provided to users of
the crossing infrastructure, such as brokers and shippers, to help make efficient decisions about when to
cross the border. Information could be provided by methods that enable selection of dispatch time prior
to loading the trucks. Users can then vary the timing of their dispatches to avoid long wait times at the
POE. This information may be provided through several channels, including websites, mobile phones or
the radio.
Explore Implementing “Windows” of Priority
Border crossing capacity can be optimized by limiting or prioritizing access to loaded trucks during peak
hours or predetermined hours of the day. Processing of empty trucks can be minimized during those
hours and encouraged throughout the rest of the day. However, given the importance of drayage in the
region, this option must be carefully considered and input from the commercial users of the POE must
be elicited to guarantee a successful implementation.

Goods Movement Border Crossing Study and Analysis
Page | 116
7.4.2 ImproveThroughput
Throughput increase can be achieved by raising the rate of movement and pace of inspections at the
POEs. However, this does not equal faster inspections or compromising the security of the inspection
process. The options considered here are related to the logistic and intelligence processes performed
before the actual inspection.
Segment Trucking Population
Mingled and diverse traffic types at the border produce traffic conflict and congestion that impedes
efficient crossings. With proper segmentation of commercial trucks, CBP and other agencies can
efficiently deploy differentiated services to increase throughput for specialized shipments. One example
worth exploring is exclusive lines for agricultural products during agricultural season. However, this
option must be considered in the context of physical limitations of the POE, since Calexico East already
has a dedicated FAST lane. One further consideration is that U.S. border authorities should be able to
quickly transition lane types and processing modes to accommodate the highest demand segments at
any given time. In other words, each lane and inspection booth should be able to process all segments of
anticipated demand.
Expand Trusted Traveler Programs
FAST has proven to reduce border‐crossing times in Calexico East POE but due to the nature of the
transportation processes in the region (i.e., drayage is commonly used) it cannot be implemented by all
trucking companies. Special trusted programs could be designed for trucks carrying low‐risk agriculture
products on a seasonal basis or maquiladora products that perform several crossings during a single day.
Explore Streamlined Processing Centers
Implementation of an enhanced processing center that integrates Mexican export inspections, U.S.
security, trade, and safety, and state inspections could be explored. Shared inspection and parallel
processing practices could improve throughput. Physical limitations of the Calexico POE should be
explored to determine the degree of “streamlining” possible. However, improvements to Mexican
export processing, including closing security vulnerabilities and improving personnel skill sets may be
required to ensure security while facilitating trade.
7.4.3 ExpandCapacity
This category of alternatives represents increasing in the supply of border‐crossing capacity by either
enlarging physical infrastructure or increasing staff and operating hours. This, in turn, improves the
ability to process growing traffic volumes in the region.

Goods Movement Border Crossing Study and Analysis
Page | 117
Expand Physical Infrastructure
Options for expanding physical infrastructure include, improvements to existing infrastructure (e.g.,
improving access roads to the POE, increasing the number of approaching lanes and inspection booths
and redesigning secondary inspection facilities to accommodate more trucks) or construction of new
infrastructure (i.e., a new POE). In either case, bilateral effort is required to improve infrastructure on
both sides of the border. As it was found in this study, several infrastructure expansion projects are
planned and underway in the vicinity of the Imperial Valley – Mexicali region. As a result, a detailed
analysis of the demand and capacity must be conducted to determine the best expansion option.
Furthermore, budget restrictions must be taken into consideration, since expanding physical
infrastructure usually represents the most costly alternative to reduce border‐crossing time.
Increase Staffing and Operating Hours
Currently Calexico East POE handles commercial traffic from 6 am to 8 pm on weekdays and from 10 am
to 6 pm on Saturdays (Sunday the POE is closed to commercial traffic)101. Therefore, adding operating
hours is an option. Widened operating hours would allow more opportunities throughout the day for
trucks to cross the border and to potentially “spread” the demand for the use of the POE throughout
different hours of the day. Positive results from the provision of widened operating hours will only occur
if all stakeholders better align their schedules (especially brokers, transporters, and warehousing
companies). However, availability of trained staffing personnel and budget to cover the enlarged payroll
may be an issue when evaluating this alternative. Therefore, another option consists of fully staffing of
the POE during non‐peak hours (maintaining current operating hours) to provide incentives for users to
cross during non‐peak hours.
7.5 NextSteps
The choice of a specific course of action depends not only on the set of alternatives at hand but also on
how will the local community react to each one of them. Therefore, the following next steps are
recommended for the adoption of a course of action to reduce delays at Imperial County’s POEs:
1. Analyze preliminary alternatives to reduce congestion and delay: Determine, at a high level, the
feasibility of implementing each one of the proposed alternatives. The level of analysis can vary
but must include, at a minimum, determining the ease of implementation for each solution and
the potential reaction(s) of users of the POEs to the proposed alternative.
2. Determine a set of criteria to evaluate options worth pursuing: Identify decisive factors that will
be used to evaluate in more detail each one of the alternatives. To promote transparency, these
decisive factors should be analyzed using standardized methodologies and should be aligned to
other policies in the region. Example of criterion that can be used include:
a. Project Cost
b. Social Return on Investment
101 Taken from CBP’s webpage, http://www.cbp.gov/xp/cgov/toolbox/contacts/ports/ca/2507.xml
Goods Movement Border Crossing Study and Analysis
Page | 118
c. Contribution to Local Economy
d. Implementation Time
3. Study in detail options seen as “plausible”: Develop individual, in‐depth studies that address the
criteria set forth on step 2. A comprehensive analysis of the alternatives should lead to those
that best meet the local needs and have higher opportunities of success. Analytical tools that
can be used in this step include:
a. Cost‐Benefit Analysis
b. Economic Impact Analysis
c. Risk Analysis

Goods Movement Border Crossing Study and Analysis
Page | 119
APPENDICES

Goods Movement Border Crossing Study and Analysis
Page | 120
APPENDIXA:COMPLETELISTOFDESTINATIONSINU.S.FORNORTHBOUNDTRAFFIC,COMPANYSURVEYS
Destination Mentions % Destination Mentions % Destination Mentions % Calexico, CA area* 114 22.6% Mira Loma, CA 3 0.6% Coachella, CA 1 0.2%
Los Angeles, CA 62 12.3% Montgomery, AL 3 0.6% El Cajon, CA 1 0.2%
San Diego, CA 23 4.6% Orange, CA 3 0.6% Ensenada 1 0.2%
Ontario, CA 19 3.8% Phoenix, AZ 3 0.6% Farr West, UT 1 0.2%
Long Beach, CA 17 3.4% San Bernardino, CA 3 0.6% Florida, NY 1 0.2%
Fresno, CA 16 3.2% Alamosa, CO 2 0.4% Harleysville, PA 1 0.2%
El Paso, TX 13 2.6% Atlanta, GA 2 0.4% Hemet, CA 1 0.2%
Anaheim, CA 12 2.4% Belvidere, IL 2 0.4% Houston, TX 1 0.2%
Fullerton, CA 12 2.4% Cerritos, CA 2 0.4% Indio, CA 1 0.2%
Van Nuys, CA 11 2.2% Chicago, IL 2 0.4% Irwindale, CA 1 0.2%
Vista, CA 10 2.0% Chula Vista, CA 2 0.4% La Jolla, CA 1 0.2%
New Bedford, Mass 8 1.6% Denver, CO 2 0.4% La Puente, CA 1 0.2%
Yuma, AZ 8 1.6% Fontana, CA 2 0.4% Las Vegas, NV 1 0.2%
Commerce, CA 7 1.4% Fort Mill, SC 2 0.4% Loma Linda, CA 1 0.2%
Corona, CA 7 1.4% Huntington Beach, CA 2 0.4% Mannford, OK 1 0.2%
Urban Crest, OH 7 1.4% Newberry Springs, CA 2 0.4% Mecca, CA 1 0.2%
Irvine, CA 6 1.2% Nogales, AZ 2 0.4% Moreno Valley 1 0.2%
Riverside, CA 6 1.2% Rancho Santa Fe, CA 2 0.4% New York, CA 1 0.2%
Santa Clarita, CA 6 1.2% Sacramento, CA 2 0.4% North Canton, OH 1 0.2%
Montebello 5 1.0% Santa Maria, CA 2 0.4% Ocotillo, CA 1 0.2%
New York, NY 5 1.0% Thousand Oaks, CA 2 0.4% Oglesby, IL 1 0.2%
Reno, NV 5 1.0% West Memphis, AR 2 0.4% Ottawa, IL 1 0.2%
Denison, TX 4 0.8% Alison 1 0.2% Oxnard, CA 1 0.2%
Howell, MI 4 0.8% Arlington, TX 1 0.2% Pittsburgh, PA 1 0.2%
Redlands, CA 4 0.8% Austin, TX 1 0.2% Plano, TX 1 0.2%
Salinas, CA 4 0.8% Bakersfield, CA 1 0.2% San Isidro, CA 1 0.2%
Torrance, CA 4 0.8% Bronx, NY 1 0.2% San Jose, CA 1 0.2%
Arvin, CA 3 0.6% Brooklyn, CA 1 0.2% San Luis Rey, CA 1 0.2%
Chino, CA 3 0.6% Buckeye, AZ 1 0.2% Santa Ana, CA 1 0.2%
Industry, CA 3 0.6% Buena Park, CA 1 0.2% Temecula, CA 1 0.2%
Laredo, TX 3 0.6% Carrollton, TX 1 0.2% Tracy, CA 1 0.2%
Louisville, KY 3 0.6% Carson, CA 1 0.2% Vernon, CA 1 0.2%
* = includes Calexico, El Centro and Heber, CA

Goods Movement Border Crossing Study and Analysis
Page | 121
APPENDIXB:COMPLETELISTOFORIGINSINU.S.FORSOUTHBOUNDTRAFFIC,COMPANYSURVEYS
Destination Mentions % Destination Mentions % Destination Mentions %
Calexico, CA area* 79 21.1% Industry, CA 3 0.8% Des Moines, IO 1 0.3%
Los Angeles, CA 75 20.0% Mira Loma, CA 3 0.8% El Dorado, CA 1 0.3%
Long Beach, CA 40 10.7% Montebello 3 0.8% Helena, MT 1 0.3%
San Diego, CA 18 4.8% Mt Prospect, IL 3 0.8% Hollywood, CA 1 0.3%
Fresno, CA 12 3.2% Vista, CA 3 0.8% Howell, MI 1 0.3%
Irvine, CA 10 2.7% Alison 2 0.5% Indianapolis, IN 1 0.3%
Lathrop, CA 10 2.7% Belvidere, IL 2 0.5% Morgan Hill, CA 1 0.3%
Yuma, AZ 9 2.4% Campillo, CA 2 0.5% Oakland, CA 1 0.3%
Riverside, CA 8 2.1% Corona, CA 2 0.5% Ontario, CA 1 0.3%
Orange, CA 7 1.9% Denison, TX 2 0.5% Phoenix, AZ 1 0.3%
Anaheim, CA 5 1.3% Gardena, CA 2 0.5% Pocatello, ID 1 0.3%
Compton, CA 5 1.3% Laredo, TX 2 0.5% Prewitt, NM 1 0.3%
Guthrie Center, IA 5 1.3% Montgomery, AL 2 0.5% Rancho Santa Fe, CA 1 0.3%
Las Vegas, NV 5 1.3% San Jose, CA 2 0.5% Sacramento, CA 1 0.3%
Lucerna, CA 5 1.3% Santa Fe Springs, CA 2 0.5% Salinas, CA 1 0.3%
Simi Valley, CA 5 1.3% Advance, NC 1 0.3% San Francisco, CA 1 0.3%
Glendora, CA 4 1.1% Altonah, UT 1 0.3% Tracy, CA 1 0.3%
Pomona, CA 4 1.1% Baton Rouge, LA 1 0.3% Villa Park, CA 1 0.3%
Charlotte, NC 3 0.8% Brownsville, CA 1 0.3% Whittier, CA 1 0.3%
El Segundo, CA 3 0.8% Burdett, KS 1 0.3%
Fullerton, CA 3 0.8% Cedar Bluffs, NE 1 0.3%
* = includes Calexico, El Centro and Heber, CA
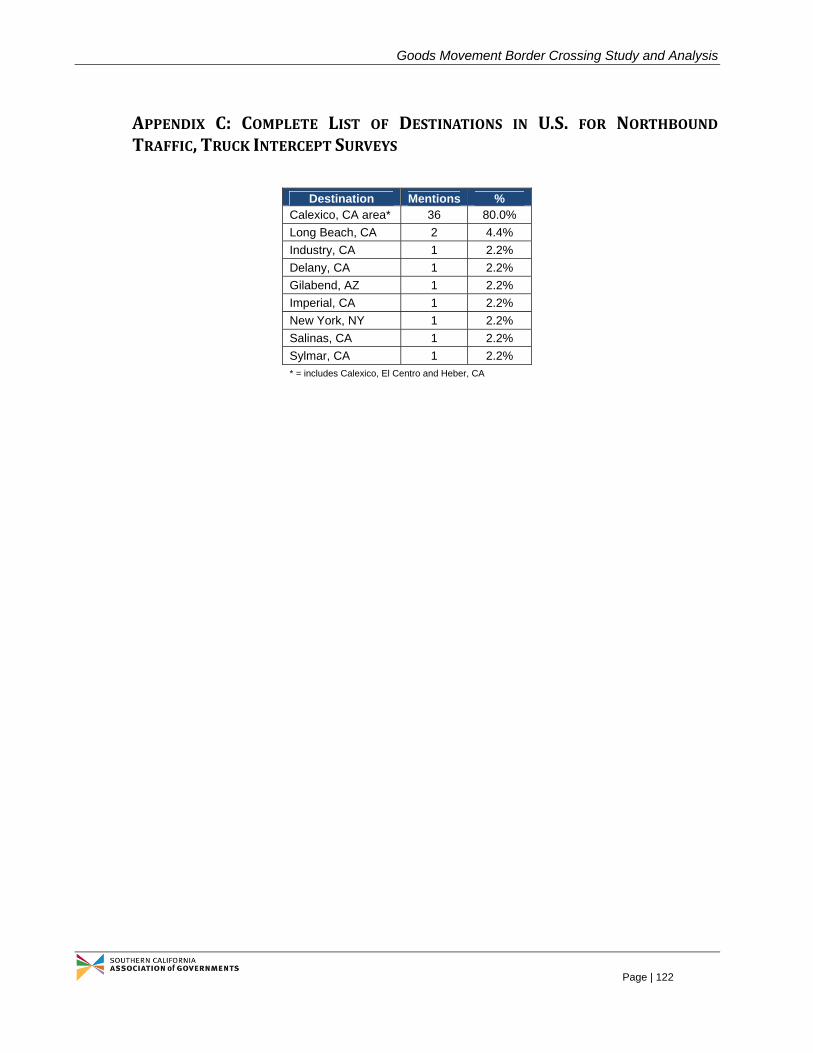
Goods Movement Border Crossing Study and Analysis
Page | 122
APPENDIX C: COMPLETE LIST OF DESTINATIONS IN U.S. FOR NORTHBOUNDTRAFFIC,TRUCKINTERCEPTSURVEYS
Destination Mentions %
Calexico, CA area* 36 80.0%
Long Beach, CA 2 4.4%
Industry, CA 1 2.2%
Delany, CA 1 2.2%
Gilabend, AZ 1 2.2%
Imperial, CA 1 2.2%
New York, NY 1 2.2%
Salinas, CA 1 2.2%
Sylmar, CA 1 2.2% * = includes Calexico, El Centro and Heber, CA

Goods Movement Border Crossing Study and Analysis
Page | 123
APPENDIXD: COMPLETE LIST OF ORIGINS IN U.S. FOR SOUTHBOUND TRAFFIC,TRUCKINTERCEPTSURVEYS
Destination Mentions %
Calexico, CA 71 75.5%
Los Angeles, CA 9 9.6%
Lucerne, CA 2 2.1%
Paramount 2 2.1%
Adelanto, CA 1 1.1%
Chino, CA 1 1.1%
Columbia, CA 1 1.1%
Corona, CA 1 1.1%
Long Beach, CA 1 1.1%
Mendota 1 1.1%
Riverside 1 1.1%
San Bernardino 1 1.1%
San Diego 1 1.1%
Yuma 1 1.1%
* = includes Calexico, El Centro and Heber, CA
Goods Movement Border Crossing Study and Analysis
Page | 124
APPENDIXE:ESTIMATIONOFECONOMICIMPACTOFBORDERDELAYS
Input‐output (IO) models102 are used to estimate the direct, indirect and induced effects of border delays on both personal crossings and freight movements. IO models are often used to simulate the impact of a demand shock on the economy. In general, shock refers to any departure from the status quo, commonly interpreted as any change in the demand for goods and services.
The California Border Impact Model (CALBIM) uses IMPLAN® Professional software, which is an input‐output based economic impact assessment model originally developed by the U.S. Forest Service – and now maintained by the Minnesota IMPLAN Group, Inc. The model data files include transaction information (intra‐regional and import/export) for 440 industrial sectors (corresponding to four and five digit North American Industry Classification System (NAICS) codes), and data on 21 economic variables, including employment, output, and employee compensation. When performing estimations, the model is populated with the most recent data available for Imperial County and the State of California.
In the course of the analysis, several adjustments are made to help ensure that all impact estimates are truly incremental and specific to the study area:
When necessary, the original IMPLAN data is adjusted for inflation to express the results in current dollars;103
Social Accounting Matrix (SAM)104 multipliers used for estimating indirect and induced effects are modified with Regional Purchase Coefficients (RPC)105 to ensure that imports to the study area are not accounted for; and
Households are the only institutions considered when building type SAM multipliers. As a result, induced effects are based on the income of residents of the study area solely.
To estimate the economic impact on the Mexican side the CALBIM model uses an input‐output matrix for the State of Baja California developed by the Autonomous University of Baja California (UABC) and the Ministry of Economic Development of Baja California State (SEDECO) with 2000 data.106
102 An input-output approach was followed in the development of the California Border Impact Model (CALBIM) tool,
drawing on an extensive body of research and experience with successful applications to transportation project analysis. An IO model calculates impact multipliers, which are then used to compute direct, indirect, and induced effects – output, employment, income, and local tax revenue generated per dollar of direct spending for labor, goods, and services.
103 Deflators derived from the most current Bureau of Labor Statistics (BLS) Growth Model are used to convert the cash flows to current dollars. These deflators are applied at the commodity level and vary for different goods and services.
104 Type SAM multipliers are the direct, indirect and induced effects where the induced effect is based on social accounting matrix information. Type SAM multipliers capture inter-institutional transfers (in addition to all commodity flows).
105 RPCs are ratios indicating what fraction of total demand for goods and services within a region (both by business and household) is satisfied from within the region; all remaining demand is satisfied by imports, which provide no direct economic benefit to the region. In other words, they filter-out economic leakages from the region.
106 More recent multipliers for Baja California are not available.

Goods Movement Border Crossing Study and Analysis
Page | 125
The figure below provides an overview of the economic impact estimation process. The key input to the model is the incremental change in spending or trade (i.e., direct effect) resulting from border delays. Multipliers are applied to this initial change to calculate the direct, indirect and induced effects, in terms of output, employment, and earnings. The model then uses the local and state tax rates to estimate the impact on local and state tax revenues.
Figure E‐1: Input‐Output Analysis Overview
Direct, indirect and induced impact
multipliers (output, employment, etc.)
Output, value added and
employment by industry
Regional purchase coefficients by
industry
Price deflators by industry
Direct, indirect and induced impacts
(output, employment, etc.)
Federal, state and local tax revenues
($)
Federal, state and local tax flows ($)
Input-output model Input-output modelInput-output model
Input-output model
Incremental Change in
Spending/Trade as a Result of Border
Delays
Input Variable
Output
LEGEND

Goods Movement Border Crossing Study and Analysis
Page | 126
APPENDIXF:DATASOURCESANDREFERENCES
Baja California State Government. (2008). State Development Plan, Section 4: Competitive Economy. http://www.bajacalifornia.gob.mx/portal/gobierno/ped/ped.htm
California Department of Finance, Demographic Research Unit. Reports and Research Papers. http://www.dof.ca.gov/research/demographic/reports/view.php
California Department of Transportation. (2008). California‐Baja California Border Master Plan. September 2008.
California Department of Transportation. (2010a). Truck Networks on California State Highways. District 11, June 2010.
California Department of Transportation. (2010b). California County‐Level Economic Forecast 2010‐2035. prepared for the Office of Transportation Economics by California Economic Forecast. March 2010.
California Employment Development Department. Labor Market Information. http://www.labormarketinfo.edd.ca.gov/
Cañas, Jesus and Robert Gilmer. (2009). The Maquiladora’s Changing Geography. Federal Reserve Bank of Dallas. Second Quarter 2009.
Carrillo, Jorge and Arturo Lara. (2005). “Mexican Maquiladoras: New Capabilities of Coordination and the Emergence of New Generation of Companies.” Innovation: Management, Policy & Practice, vol. 7/2 ‐ April 2005.
Clement, Norris, Sergio J. Rey, Noé Aarón Fuentes and Alejandro Brugués. (2000). The U.S.‐Mexican
Border Economy in the NAFTA Era: Implications for the Environment. published in the webpage of the
Southwest Consortium for Environmental Research and Policy, http://www.scerp.org/pubs/m3c3.pdf
Díaz Bautista, Alejandro. (2003). “El TLCAN y el crecimiento económico de la frontera norte de México.”
Comercio Exterior, vol. 53, num. 12. December 2003.
Fuentes, Noé Arón. (2003). Encadenamientos Intersectoriales e Interregionales de la Industria Maquiladora en Baja California. Working Document, EGAP‐ITESM, www.itesm.mx/egap/que_es_egap/inv_pub/egap_ec_04_03.pdf
Gruben, William C. and Sherry L. Kisser. (2001). NAFTA and maquiladoras: Is the Growth Connected?.
Federal Reserve Bank of Dallas. June 2001.
Guillén, Raúl. (2010). ¿Qué son los Recintos Fiscalizados Estratégicos?. http://www.buenastareas.com/ensayos/Recinto‐Fiscalizado‐Estrategico/512898.html

Goods Movement Border Crossing Study and Analysis
Page | 127
Hernández Moreno, María del Carmen, Alba Celina Soto and Miguel Ángel Vázquez Ruiz. (2008).
“Impacto Subregional del TLCAN: Sonora en el contexto de la frontera norte.” Frontera Norte. Vol. 20,
núm. 40. July‐December 2008.
Hualde, Alfredo. (2001). Formación educativa y formación en la empresa: un balance sobre las
maquiladoras de la frontera mexicana, published in ECLAC’s homepage.
http://www.eclac.org/publicaciones/xml/6/7256/AHualde.pdf
Imperial County. (2006). Mesquite Lake Specific Plan. 2006.
Imperial County. (2007a). Airport Feasibility/Site Analysis for Imperial County. prepared by Coffman Associates. 2007.
Imperial County. (2007b). Economic Development Strategic Plan. 2007.
Imperial County. (2007c). Gateway of Americas Benefit Analysis Report Update. 2007.
Imperial County. (2008). Renewable Energy Feasibility Study. 2008.
Imperial County. (2009). Planning and Development Services Department. Comprehensive Economic Development Strategy 2008–2009. September 2009.
Imperial County (2012), Planning and Development Services Department, Imperial County CEDS 2012‐2017, Comprehensive Economic Development Strategy, January 2011.
Imperial Valley Association of Governments. (2008). Imperial County 2007 Transportation Plan Highway Element. prepared by KOA Corporation, March 2008.
INEGI. Estadísticas de la Industria Manufacturera, Maquiladora y de Servicios de Exportación (IMMEX),
Banco de Información Económica – Online Database, http://dgcnesyp.inegi.gob.mx/cgi‐
win/bdieintsi.exe
INEGI. Estadísticas del Sector Externo – Inversión Extranjera Directa. Banco de Información Económica –
Online Database, http://dgcnesyp.inegi.gob.mx/cgi‐win/bdieintsi.exe
INEGI. Series que ya no se Actualizan – Industria Maquiladora de Exportación. Banco de Información
Económica – Online Database, http://dgcnesyp.inegi.gob.mx/cgi‐win/bdieintsi.exe
INEGI. (2010a). Estadística del Programa de la Industria Manufacturera, Maquiladora y de Servicios de Exportación (IMMEX). December 2010. http://boletin‐infomail.typepad.com/DocumentosVarios/Estad%C3%ADstica_IMMEX‐Sept2010.pdf
INEGI. (2010b). Estadística Mensual del Programa de la Industria Manufacturera, Maquiladora y de Servicios de Exportación (IMMEX): Cuadros y Gráficas con Cifras Nacionales (Julio 2007‐Septiembre 2010). http://www.maquilaportal.com/news/data/files/statistics/2010‐12%20INEGI's%20IMMEX%20Report.pdf
Goods Movement Border Crossing Study and Analysis
Page | 128
Intermodal México. (2010). Recintos Fiscalizados Interiores: Beneficios en el Servicio de Transporte Intermodal. Presentation at Expologística 2010. amti.org.mx/biblioteca/expologistica/Recintos‐Fiscalizados‐Interiores.pdf
Kema, Inc. (2009). Increasing Fuel Efficiency and Alternative Fuel Use in Freight Movement Across the California/Baja California Border. Prepared for the California Energy Commission.
Panta, Silvio J. (2010). Summit Shows How Mexicali and Imperial Valley are Economically Dependent on
Each Other, Officials Say, media posting on Imperial Valley Economic Development Corporation. May 1,
2010. http://www.ivedc.com/index.php?build=view&idr=1495&page2=1&pid=1
Peach, James T., and Richard V. Adkisson. (2000). “NAFTA and economic activity along the U.S.–Mexico
border.” Journal of Economic Issues 34(2): 481–89.
Presidencia de la República. (2010). Decreto para el fomento de la industria manufacturera, maquiladora y de servicios de exportación. Diario Oficial de la Federación. December 24, 2010.
Ruiz Duran, Clemente and Jorge Carrillo. (2007). MNCs Strategies and their linkages with SMEs, http://www.colef.mx/jorgecarrillo/multinacionales/reportes/archivos/Ruiz%20y%20Carrillo%20MNCs%202007.pdf
San Diego Association of Governments. (2002). Map – California‐Baja California Border Area. July 2002.
San Diego Association of Governments. (2010). Comprehensive Freight Gateway Study, prepared by HDR Decision Economics, February 2010.
Secretariat of Communications and Transportations. (2001). Análisis de Mecanismos Alternos de Coordinación de la Operación en los Puertos Fronterizos entre México y Estados Unidos: Informe Final. 2001. Prepared by FOA for the Unidad de Autopistas de Cuota, www.borderplanning.fhwa.dot.gov/TTIstudy/FOA‐espanol.ppt
Southern California Association of Governments. (2008). 2008 Regional Transportation Plan: Making the Connections. May 2008.
Southern California Association of Governments. (2012). Regional Transportation Plan 2012‐2035. April 2012.
Taborek, Nicolas. (2009). Mexicali business good for Valley, online article in Imperial Valley Press.
January 25, 2009. http://articles.ivpressonline.com/2009‐01‐25/maquiladora‐industry_24165631
U.S. Census Bureau. American Community Survey. 2006‐2010 American Community Survey 5‐Year Estimates, http://www.census.gov/acs/www/
U.S. Department of Agriculture. (2007). Census of Agriculture 2007.
U.S. Department of Commerce, Bureau of Economic Analysis, Regional Economic Accounts. Local Area Personal Income, http://www.bea.gov/regional/reis/default.cfm?selTable=CA1‐3§ion=2

Goods Movement Border Crossing Study and Analysis
Page | 129
U.S. Department of Commerce. (2008). Improving Economic Outcomes by Reducing Border Delays, 2008.
U.S. Department of Transportation, Bureau of Transportation Statistics. Transborder Surface Freight Data, http://www.bts.gov/programs/international/transborder/TBDR_QA.html
U.S. Department of Transportation, Bureau of Transportation Statistics. Border Crossing/Entry Data, http://www.bts.gov/programs/international/transborder/TBDR_BC/TBDR_BCQ.html
U.S. Department of Transportation. (2009). Demonstration Project on NAFTA Trucking Provisions, by the Federal Motor Carrier Safety Administration. Federal Register, Vol. 74, No. 51, p. 11628. March 18, 2009.
Vargas, Lucinda. (2001). Maquiladoras: Impact on Texas Border Cities, Federal Reserve Bank of Dallas. June 2001.
Zamora Canizales, Federico (2008). Complementareidad e Interdependencia Comercial en la Frontera México‐Estados Unidos, CESUN Universidad – Escuela de Negocios, vol. 1, num. 2. October 2008.

REGIONAL OFFICESImperial County1405 North Imperial Avenue, Suite 1 El Centro, CA 92243 Phone: (760) 353-7800 Fax: (760) 353-1877
Orange CountyOCTA Building 600 South Main Street, 9th Floor Orange, CA 92863 Phone: (714) 542-3687 Fax: (714) 560-5089
Riverside County3403 10th Street, Suite 805 Riverside, CA 92501 Phone: (951) 784-1513 Fax: (951) 784-3925
San Bernardino CountySanta Fe Depot 1170 West 3rd Street, Suite 140 San Bernardino, CA 92418 Phone: (909) 806-3556 Fax: (909) 806-3572
Ventura County950 County Square Drive, Suite 101 Ventura, CA 93003 Phone: (805) 642-2800 Fax: (805) 642-2260
818 West 7th Street, 12th Floor Los Angeles, CA 90017 Phone: (213) 236-1800 Fax: (213) 236-1825www.scag.ca.gov
please recycle 2500 2012.11.26