final report for wwf - pandaawsassets.panda.org/downloads/itcmphandankuwareportjuly2004.pdf · wwf...
TRANSCRIPT
Intermediate Technology Consultants Ltd
Final Report for WWF
The Mphanda Nkuwa Dam project: Is it the best option for Mozambique’s energy needs?
June 2004
WWF Mphanda Nkuwa Dam Final Report ITC
1
Table of Contents
1 General Background............................................................................................................................. 6
1.1 Mozambique ................................................................................................................................. 6
1.2 Energy and Poverty Statistics ..................................................................................................... 8
1.3 Poverty context in Mozambique ................................................................................................. 8
1.4 Energy and cross-sectoral linkages to poverty ........................................................................ 11
1.5 Mozambique Electricity Sector................................................................................................. 12
2 Regional Electricity Market ................................................................................................................ 16
2.1 Southern Africa Power Pool...................................................................................................... 16
3 Energy Needs....................................................................................................................................... 19
3.1 Load Forecasts............................................................................................................................ 19
3.2 Planned Generation ................................................................................................................... 20
3.3 The Market for Power in SAPP................................................................................................ 23
3.4 Market Options for the Export of Power from Mphanda Nkuwa......................................... 27
4 Economic Option Assessment of Mphanda Nkuwa........................................................................... 28
4.1 The Dollar – Euro Exchange Rate............................................................................................ 28
4.2 The Economics of Combined Cycle Gas Turbine Plant ......................................................... 28
4.3 The Economics of Coal Fired Power Plant .............................................................................. 29
4.4 The Economics of Mphanda Nkuwa ........................................................................................ 30
4.5 The South Africa National Integrated Resource Plan ............................................................ 34
4.6 Economic Analysis Summary.................................................................................................... 34
5 Environmental and Social Options Assessment................................................................................. 37
6 Option Selection .................................................................................................................................. 41
6.1 Factors......................................................................................................................................... 41
7 Key Issues to be addressed on Mphanda Nkuwa ............................................................................... 43

WWF Mphanda Nkuwa Dam Final Report ITC
2
7.1 Technical Issues.......................................................................................................................... 43
7.2 Social Issues ................................................................................................................................ 43
7.3 Environmental Issues................................................................................................................. 47
7.4 Political issues............................................................................................................................. 54
7.5 Economic Issues.......................................................................................................................... 54
7.6 Net Benefit Analysis ................................................................................................................... 55
8 Mphanda Nkuwa and the World Commission on Dams Guidelines................................................. 57
8.1 Needs Assessment ....................................................................................................................... 57
8.2 Comprehensive Options assessment ......................................................................................... 59
8.3 Gaining Public Acceptance........................................................................................................ 60
8.4 Address Existing Dams.............................................................................................................. 61
8.5 Sustaining Rivers and Livelihoods ........................................................................................... 62
9 Recommendations for better decision making on Mphanda Nkuwa ................................................ 64
WWF Mphanda Nkuwa Dam Final Report ITC
3
Executive Summary The proposed Mphanda Nkuwa hydropower scheme, 70 km down stream of the Cahora Bassa
Dam in Mozambique is billed by the Government of Mozambique as one of the most competitive
regional power projects in Southern Africa and a priority project for New Partnership for Africa's
Development (NEPAD) . The Government of Mozambique is currently in the promotion phase of
the project to attract potential investors from around the world.
Mphanda Nkuwa, selected from a range of several possible sites along the Zambezi is projected
to generate 1300MW at a total cost of approximately $2.0 billion. The project was also selected
on the basis of its low unit generation cost and its additional function to provide re-regulation for
the Hydro Cahora Bassa (HCB). Development of Mphanda Nkuwa is supposed to enable Hydro
Cahora Bassa to increase the value of the energy it produces by producing more during peak
hours and less during low tariff periods. This is currently not possible due to the requirement to
maintain a river level variation below a certain level.
The purpose of this report is to analyse the proposed Mphanda Nkuwa dam in terms of its
technical, social, economic and environmental impacts and also in relation to alternative options
for meeting Mozambique’s energy and development priorities.
Mozambique has very low per capita and absolute consumption of electricity with 78kWh per
capita per year and national demand of 350MW excluding the consumption by the aluminium
smelter Mozal (which consumes 900 MW). It is a net exporter of electricity with the bulk of the
surplus being consumed by South Africa and to a lesser extent Zimbabwe. Yet, only 4.7% of the
population in Mozambique has access to electricity with 50% of these households in Maputo.
The government with assistance from major donors are involved in extensive investment in
improving access to electricity and other energy forms.
The government's decision to promote Mphanda Nkuwa has been premised on hydropower
generation as an export industry on the available potential in the country, projected electricity
demand in the Southern African region and infrastructure investment to support an economic
plan based on primary resource extraction in minerals and other natural resources. Current
excess capacity on the Southern African Power Pool (SAPP) is projected to run out by 2007.
South Africa alone will require an additional 3000MW by 2010 after re-commissioning its
mothballed thermal power plants. In Mozambique, several mega projects in mineral extraction
WWF Mphanda Nkuwa Dam Final Report ITC
4
and processing are planned with a projected total demand of approximately 2000MW by the
same time horizon. It is this future market that Mphanda Nkuwa is poised to serve.
Mphanda Nkuwa is promoted as a private sector investment with minimal (5%) government
shareholding to mitigate political risk. Attracting foreign direct investment into the electricity
sector is also viewed as aiding the image of Mozambique as a competitive destination for foreign
direct investment in resource extraction industries. Uncertainty however, persists over the net
benefit to fiscal revenues and national development of such mega investment which have up to
now been negotiated on the basis of wide tax breaks and very light handed regulation. Current
experiences with Hydro Cahora Bassa and Mozal cast doubt over the real contribution of such
mega projects and whether this is indeed the best development path for Mozambique.
Specific to the project, several socio-economic considerations are still to be addressed. The
feasibility study was conducted shortly before the publication of the World Commission on Dams
(WCD) Report and does not conform to some of the best practice recommendations. There is no
evidence of a wide national or even local consultation to gain public acceptance as
recommended by the WCD report. The government on its part is wary of a high visibility
programme to discuss the project due to the political pressure that may result due to raised
expectations. The only respite lies in that any developer who would consider investing $2.0
billion dollars would want to undertake a thorough and more detailed feasibility study of their own
which would include gaining public acceptance. In reality however, developers may invest in
curtailing public rejection rather than gaining its acceptance.
The project is proposed in a context with regulatory institutions whose capacity to enforce
compliance against the larger multinational energy companies who have the resources to invest
in such projects puts to doubt the extent to which negative impacts will be mitigated. The
following considerations in particular still need clarification:
• The impact of hydropower operation on the shrimp industry in the Zambezi delta- Mphanda
Nkuwa will perpetuate high base river flows and low seasonal variation which reduces
shrimp populations and subsequent catch. The loss of income from Mphanda Nkuwa is
estimated at $10 million per year.
• The project also has a recommendation for river levels to be allowed to vary by 1.5 metres
threatening many flood fields (and hence floodplain agriculture) that have been the source
of livelihood for thousands for families in the lower reaches of the Zambezi in the districts of
Mutarara, Caia, Marromeu, Chemba and Tete.
WWF Mphanda Nkuwa Dam Final Report ITC
5
• A framework for compensation for the 1400 people projected to be displaced by the project
still remains hazy. The level of participation of the affected households given their low
bargaining power needs the facilitation of external agencies especially civil society
organizations and a strong regulator. Both are currently missing.
• The project falls into the Zambezi Valley Authority and is eligible for wide ranging
investment incentives. The level of local industry stimulation and the downstream benefits
are still to be clearly spelt out.
• Greater public discussion and debate on the project in view of the current high information
asymmetries especially between a keen civil society and an over cautious government.
• In view of the low prices being fetched on HCB exports to South Africa (US$) compared
against a unit generation cost of $0.027/kWh, energy pricing levels within the SAPP are
likely to be the eventual determinant on whether Mphanda Nkuwa goes ahead or not.
On the whole, Mphanda Nkuwa will not directly benefit most of the Mozambican people in the
short term, but has the potential to do so in the medium to long term contingent on the above
mentioned issues being addressed. However, if these issues are not addressed then the project
could result in an unequal distribution of costs and benefits alongside heavy social and
environmental impacts.

WWF Mphanda Nkuwa Dam Final Report ITC
6
1 General Background
1.1 Mozambique
Mozambique is a vast country with a diverse natural resource base. The country is enjoying
relative peace and a nascent democracy is firmly taking root. This stability has given rise to
above regional average economic performance with the national economic growth rate one of
the highest in Sub-Saharan Africa.
Mozambique still has very poor infrastructure to support value adding economic activities. As
such the country has focused its economic development policy around the exploitation of primary
raw materials such as agricultural produce, mining and hydropower development.
Considerable international resources have been focused on Mozambique to support her
economic rejuvenation. The energy sector has been one of the biggest recipients of international
support, mainly from the Nordic Donors but also other multilaterals. The major donors are the
Norwegian, Swedish and Danish Government Aid Agencies (NORAD, SIDA and DANIDA), the
French Agency for Development, World Bank and African Development Bank (ADB). With the
exception of DANIDA and the World Bank who have a broader energy sector investment which
includes renewable and off grid energy solutions, all the donors have focused their investment in
supporting rehabilitation and expansion of the electricity network in Mozambique after years of
sabotage during the war, and on institutional capacity building. Substantial resources have been
channelled into extending the reach of the centrally operated grid networks within the country.
Mozambique does not have a central grid but rather three networks to cover the central region,
northern and southern regions. It still is far from national coverage and there are wide regional
disparities in access levels. The table below shows the percentage access by province for the
whole of Mozambique.
WWF Mphanda Nkuwa Dam Final Report ITC
7
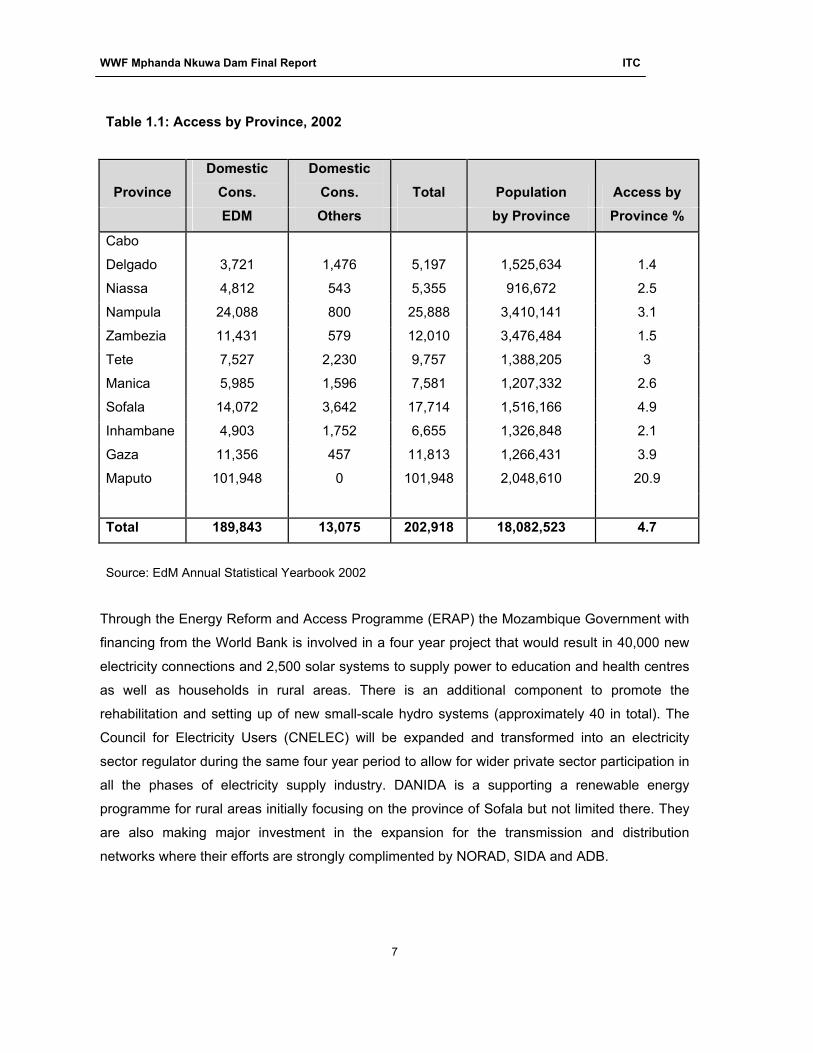
Table 1.1: Access by Province, 2002
Province Domestic
Cons. Domestic
Cons. Total Population Access by EDM Others by Province Province %
Cabo
Delgado 3,721 1,476 5,197 1,525,634 1.4
Niassa 4,812 543 5,355 916,672 2.5
Nampula 24,088 800 25,888 3,410,141 3.1
Zambezia 11,431 579 12,010 3,476,484 1.5
Tete 7,527 2,230 9,757 1,388,205 3
Manica 5,985 1,596 7,581 1,207,332 2.6
Sofala 14,072 3,642 17,714 1,516,166 4.9
Inhambane 4,903 1,752 6,655 1,326,848 2.1
Gaza 11,356 457 11,813 1,266,431 3.9
Maputo 101,948 0 101,948 2,048,610 20.9
Total 189,843 13,075 202,918 18,082,523 4.7
Source: EdM Annual Statistical Yearbook 2002
Through the Energy Reform and Access Programme (ERAP) the Mozambique Government with
financing from the World Bank is involved in a four year project that would result in 40,000 new
electricity connections and 2,500 solar systems to supply power to education and health centres
as well as households in rural areas. There is an additional component to promote the
rehabilitation and setting up of new small-scale hydro systems (approximately 40 in total). The
Council for Electricity Users (CNELEC) will be expanded and transformed into an electricity
sector regulator during the same four year period to allow for wider private sector participation in
all the phases of electricity supply industry. DANIDA is a supporting a renewable energy
programme for rural areas initially focusing on the province of Sofala but not limited there. They
are also making major investment in the expansion for the transmission and distribution
networks where their efforts are strongly complimented by NORAD, SIDA and ADB.
WWF Mphanda Nkuwa Dam Final Report ITC
8
1.2 Energy and Poverty Statistics
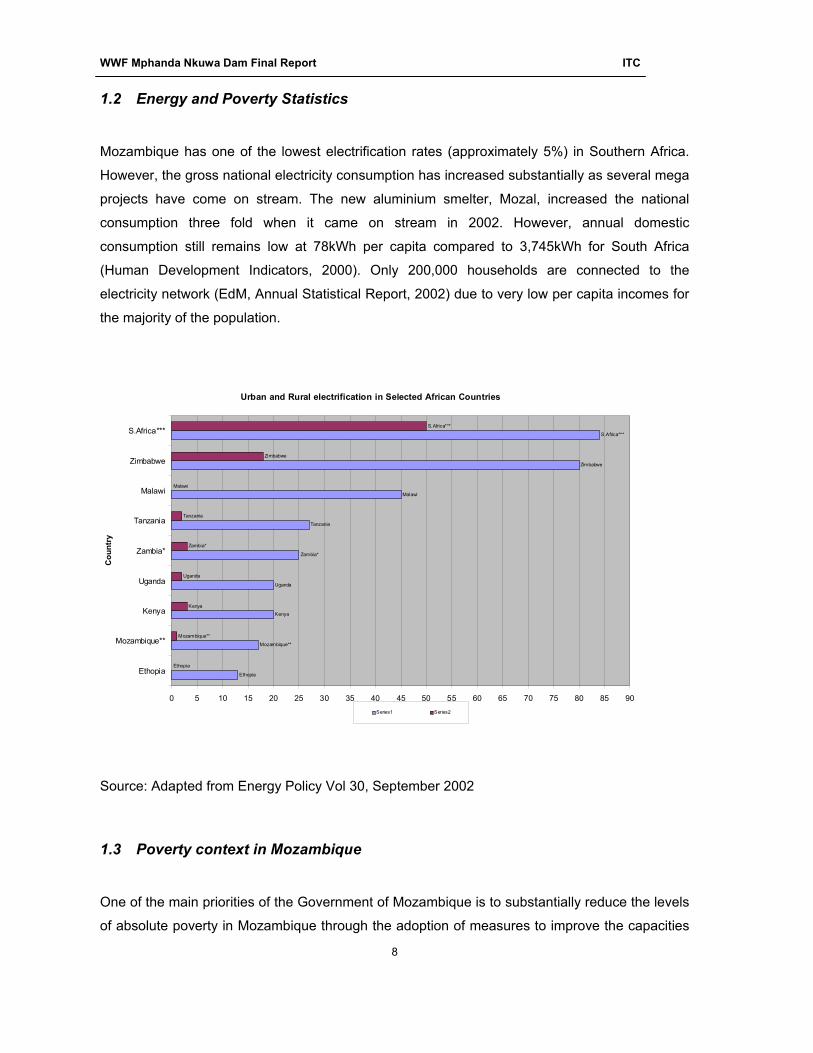
Mozambique has one of the lowest electrification rates (approximately 5%) in Southern Africa.
However, the gross national electricity consumption has increased substantially as several mega
projects have come on stream. The new aluminium smelter, Mozal, increased the national
consumption three fold when it came on stream in 2002. However, annual domestic
consumption still remains low at 78kWh per capita compared to 3,745kWh for South Africa
(Human Development Indicators, 2000). Only 200,000 households are connected to the
electricity network (EdM, Annual Statistical Report, 2002) due to very low per capita incomes for
the majority of the population.
Source: Adapted from Energy Policy Vol 30, September 2002
1.3 Poverty context in Mozambique
One of the main priorities of the Government of Mozambique is to substantially reduce the levels
of absolute poverty in Mozambique through the adoption of measures to improve the capacities
Urban and Rural electrification in Selected African Countries
Ethopia
Mozambique**
Kenya
Uganda
Tanzania
Malawi
Zimbabwe
S.Africa***
Ethopia
Mozambique**
Kenya
Uganda
Zambia*
Tanzania
Malawi
Zimbabwe
S.Africa***
Zambia*
0 5 10 15 20 25 30 35 40 45 50 55 60 65 70 75 80 85 90
Ethopia
Mozambique**
Kenya
Uganda
Zambia*
Tanzania
Malawi
Zimbabwe
S.Africa***
Cou
ntry
% ElectrificationSeries1 Series2
WWF Mphanda Nkuwa Dam Final Report ITC
9
of, and the opportunities available to all Mozambicans, especially the poor. The specific objective
is to reduce the incidence of absolute poverty from 70% in 1997 to less than 60% by 2005 and
less than 50% by the end of this decade.
The reduction and elimination of poverty is the principal objective of development policies in the
medium and long term. However, in discussing poverty, it is essential to look at the different
interpretations of its meaning. Poverty is a complex, multi-dimensional phenomenon with diverse
characteristics. Poverty has usually been synonymous with the failure to secure a certain level of
income. However, a broader definition of poverty could be based on the consumption per capita
(the total consumption of the family household divided by the number of members) as the basic
measure of individual well-being for the following reasons:
• Consumption is the most appropriate indicator or measure of actual well being (while
income is a measure of potential well being given that it may or may not be used for
consumption)
• Consumption is a more precise and stable indicator since it is less subject to fluctuations
over time
Therefore, individuals are classified as poor or not poor in terms of a poverty line defined in
terms of per capita consumption. (PARPA1 2001-5).
The Mozambican government has targeted poverty alleviation as its major priority with the
highest concern being expenditure on health and education in order to improve human
development. Significant investments were also made in rehabilitating basic infrastructure. Since
1987, the Government has adopted a stabilization and structural adjustment programme with the
objective of re-establishing production and improving incomes through deep reforms aimed at
creating an economy based on private initiatives and market forces.
Analysis of data from the Household Survey (IAF) of 1996/97 provided a detailed profile of
poverty in Mozambique. Nearly 70% of the population lives in absolute poverty, and there are
notable urban-rural and regional imbalances. The IAF data identified the main determinants of
poverty in Mozambique:
• Slow growth of the economy until the beginning of the 1990s;
1 PARPA is the action Plan for the Eradication of Poverty. It is the same as the Poverty Reduction Strategy Paper for English speaking countries.

WWF Mphanda Nkuwa Dam Final Report ITC
10
• Low levels of education of working age household members, particularly women;
• High dependency rates in households;
• Low productivity in the family agriculture sector;
• Lack of employment opportunities within and outside of the agricultural sector; and
• Poor infrastructure, especially in rural areas.
The new PARPA (2001-2005) places emphasis on social investment to directly tackle poverty
and on medium and long-term measures to fight poverty through policies to sustain rapid and
broad-based economic growth.
Without growth, the objective of increasing the capacities and expanding the opportunities for the
poor will continue to be severely constrained by the lack of public and private resources.
Therefore, the strategy contains policies aimed at creating a favourable climate for stimulating
investment and productivity, and achieving an average annual GDP growth rate of 8%.
The strategy is geared to ensure that growth is inclusive, so that the poor will benefit integrally.
This should occur through greater access to assets (including improvements in human capacity)
and the more efficient use of such assets by individuals, families and other institutions,
especially in rural areas. The provision and access to sustainable energy services is central in
stimulating economic activity. Energy is a key factor of production and its availability has a
WWF Mphanda Nkuwa Dam Final Report ITC
11
bearing on the pace of economic growth. Access to electricity stimulates the private sector to
increase job creation and income generating opportunities.
In addition, the geographical distribution of poverty in Mozambique is a very politically sensitive
issue. To that end the PARPA highlights the need to dissipate existing poverty asymmetries and
strive for a better regional balance, with special attention given to regions with the greatest
concentration of poor people.
In concrete terms, the poverty reduction strategy in Mozambique is based on six priorities aimed at promoting human development and creating a favourable environment for rapid,
inclusive and broad-based growth. The fundamental areas of action are:
• Education,
• Health;
• Agriculture and rural development;
• Basic infrastructure;
• Good governance;
• Macro-economic and financial management.
1.4 Energy and cross-sectoral linkages to poverty
As stated above the Mozambican government has targeted the development of basic
infrastructure as a priority area in reducing and eradicating poverty. Roads, electricity and water
are some of the infrastructure services considered vital for improving the lives of people in
Mozambique. Improvements in the road network will permit better access to markets and a
reduction in costs, and will facilitate communication and mobility, especially for those who live in
rural areas and depend on agriculture. In parallel, the provision of water and energy is
fundamental to the development of human capital and the expansion of national output. Priority
in the rehabilitation and construction of basic infrastructure will be given to those areas of the
country with the largest populations and highest levels of poverty.
Education is a basic human right and has a fundamental role in poverty reduction. Access to
education contributes directly to human development by improving the capacity and
opportunities for the poor, promoting greater social, regional and gender equity. Education is
also essential for rapid growth, as it expands the quantity and quality of human capital available
for productive activities, and the ability of the nation to absorb new technologies. The main
WWF Mphanda Nkuwa Dam Final Report ITC
12
objectives, in Mozambique, in the area of education include achieving universal primary
education, while rapidly expanding secondary education, informal education, and technical-
vocational training. Access to electricity helps in improving adult education as well as technical
and vocational training by enabling adults to learn during the evenings when they are free from
their daily livelihood activities. The quality of education depends on access to current and up to
date technologies such as information communication technologies, all of which operate on
electricity.
The health sector also plays a fundamental role in directly improving the well being of the poor,
while at the same time contributing to rapid economic growth by improving the quality of human
capital. The main objectives in the field of health include an expansion of, and improvement in,
the coverage of primary health care through special programmes geared towards target groups
such as women and children, a campaign to reverse the current growth of the HIV/AIDS
epidemic, and greater efforts in the fight against diseases such as malaria, diarrhea, tuberculosis
and leprosy.
Energy (electricity) is vital as a factor of production as well as for human development. The
social sectors of education and health are a top priority for the Mozambique government. From
the foregoing description of the poverty and energy sector priorities for the government, it is clear
that the proposed Mphanda Nkuwa project does very little to directly address these areas. There
is a proposal to provide infrastructure for the 260 families that will be displaced by the
development but in terms of increasing access to electricity directly to the poor, or the institutions
that serve them, Mphanda Nkuwa will not have a direct impact.
1.5 Mozambique Electricity Sector
Three service providers dominate the electricity sector in Mozambique:
• Electricidade de Mozambique (EdM) which is the national power utility (wholly owned by
the government of Mozambique) is involved in all stages of the electricity supply chain
from generation through transmission and distribution to final supply and billing of
consumers,
• Hidroelectrica de Cahora Bassa, is the company that manages and operates Cahora
Bassa Hydro Electric Power Stations and associated transmission network to the
Southern Africa Power Pool,
• MoTraCo is a joint venture between the power utilities of Mozambique, South Africa and
Swaziland formulated to transport power from South Africa to the Mozal Plant in Maputo.
WWF Mphanda Nkuwa Dam Final Report ITC
13
EdM has approximately 250,000 customers connected to its grid with 50% of the customers in
Maputo. The electricity distribution is distorted with the bulk of the connections in urban areas
and only a very small proportion of the consumers in rural areas. It is estimated that between 4
and 6% of Mozambicans have access to electricity, and most of these are in the urban areas.
The main objectives of the PARPA in the energy sector are to:
• Expand the population's access to energy sources;
• Reduce the environmental impact of using non-renewable sources;
• Contribute to the supply of sustainable energy in the main regions of the country,
strengthening their economic growth and reducing regional imbalances;
• Promote the use of new and renewable energy sources in the electrification of remote
areas;
• Electrification of districts with economic potential;
• Promote the participation of the private sector in the field of energy.
Other measures include supplying electricity to 60,000 new domestic consumers.
The Mphanda Nkuwa project does not directly address any of the energy sector objectives
contained in the Action Plan for the Eradication of Absolute Poverty. As stated in other sections
of this document, the current line of argument by the promoters is that this project supports
poverty eradication through the promotion of private initiative and investment based on market
imperatives. The problem is in determining the appropriate level of fiscal support to be given to
such private initiatives that do not directly benefit the poor and whose activities may actually
threaten the livelihood of the most vulnerable communities. The conundrum of how much public
support and concessions should be given to private developers versus the assistance needed
and socio-economic measures required to protect the interests of the poor with such a
development is at the centre of the decision that the Government of Mozambique must make on
Mphanda Nkuwa. It is essentially a choice of the development paradigm to be adopted between
attraction of foreign direct investment into resource extraction and socio-economic development
investment in basic infrastructure such as appropriate energy supplies to enable communities to
improve their livelihoods. It would make sense for the government to concern itself primarily with
the socio-economic investment to provide its people with a basic quality of life rather than the
promotion of private investment per se. The converse is also valid in that there is need to
WWF Mphanda Nkuwa Dam Final Report ITC
14
promote private investment as a way of creating jobs and wealth in the country for long term
sustainable poverty reduction. The issue then becomes one of balancing the short to medium
term priorities and the long term development needs of the country. Mphanda Nkuwa may be
evaluated to be a useful long term investment project to enable investors to tap the vast mineral
and other natural resources available in Mozambique but only if its long term impacts on the
livelihoods of communities in the lower Zambezi are also properly managed. This is discussed in
greater detail in the following sections.
Of the current energy production in Mozambique 80% comes from the Cahora Bassa
hydropower plant (HCB) with an installed capacity of 2075MW and the balance from small hydro
and gas power stations. EdM expects to cover demand growth from additional power allocation
from the HCB in the coming years with surplus still exported to South Africa, Zimbabwe and
Malawi.
The major source of concern for private developers is linked to the price and security of payment
for electricity from the project. Some of the regional utilities such as ZESA from Zimbabwe have
been in arrears for prolonged periods under the current supply arrangements from Hydro Cahora
Bassa and wheeling charges through EdM. An adverse power purchase agreement and
ownership of the Hydro Cahora Bassa also raises fears from potential developers who are
closely following the ongoing negotiations between the Governments of Mozambique, South
Africa and Portugal.
The capacity of EdM still remains low with electrical energy distribution being contracted through
third party control (Eskom of South Africa) even when the generation is Mozambican based and
the power is to supply mega projects in Mozambique, as has happened with Mozal which
requires that its electricity supply comes from Eskom.
Demand growth is expected mainly from a number of energy intensive primary extraction
industrial projects which are at different stages of development. The table below summarizes
these projects and their projected electricity demand.
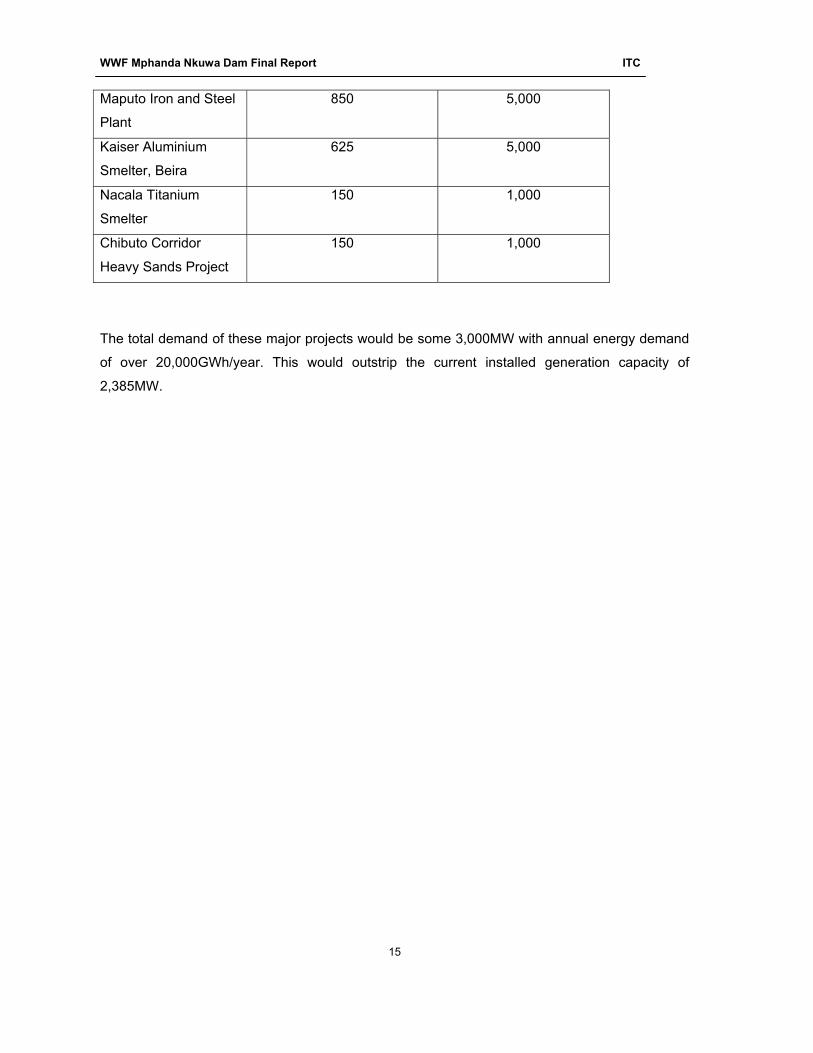
Table 1.2: Proposed Projects in Mozambique and their Energy Requirements
Project Maximum Demand (MW) Annual Energy (GWh/y)
Mozal Phase 1 460 4,000
Mozal Phase 1 and 2 895 7,500
WWF Mphanda Nkuwa Dam Final Report ITC
15
Maputo Iron and Steel
Plant
850 5,000
Kaiser Aluminium
Smelter, Beira
625 5,000
Nacala Titanium
Smelter
150 1,000
Chibuto Corridor
Heavy Sands Project
150 1,000
The total demand of these major projects would be some 3,000MW with annual energy demand
of over 20,000GWh/year. This would outstrip the current installed generation capacity of
2,385MW.
WWF Mphanda Nkuwa Dam Final Report ITC
16
2 Regional Electricity Market
This section provides a review of the regional electricity market into which the output of the
Mphanda Nkuwa could be sold. In particular, it focuses on the market for power in South Africa
which would represent the best opportunity for any exports from Mozambique.
2.1 Southern Africa Power Pool
The Southern African Power Pool (SAPP) was established in 1995 through an Inter-Utility
Memorandum of Understanding signed by representatives of the governments of the Southern
African Development Community (SADC).
In terms of its constitution only utilities (and not individual power stations) are allowed to join the
SAPP. At present its members are the utilities and Ministries involved in energy usage in Angola,
Botswana, Lesotho, Malawi, Mozambique, Namibia, Swaziland, Tanzania, Zaire, Zimbabwe and
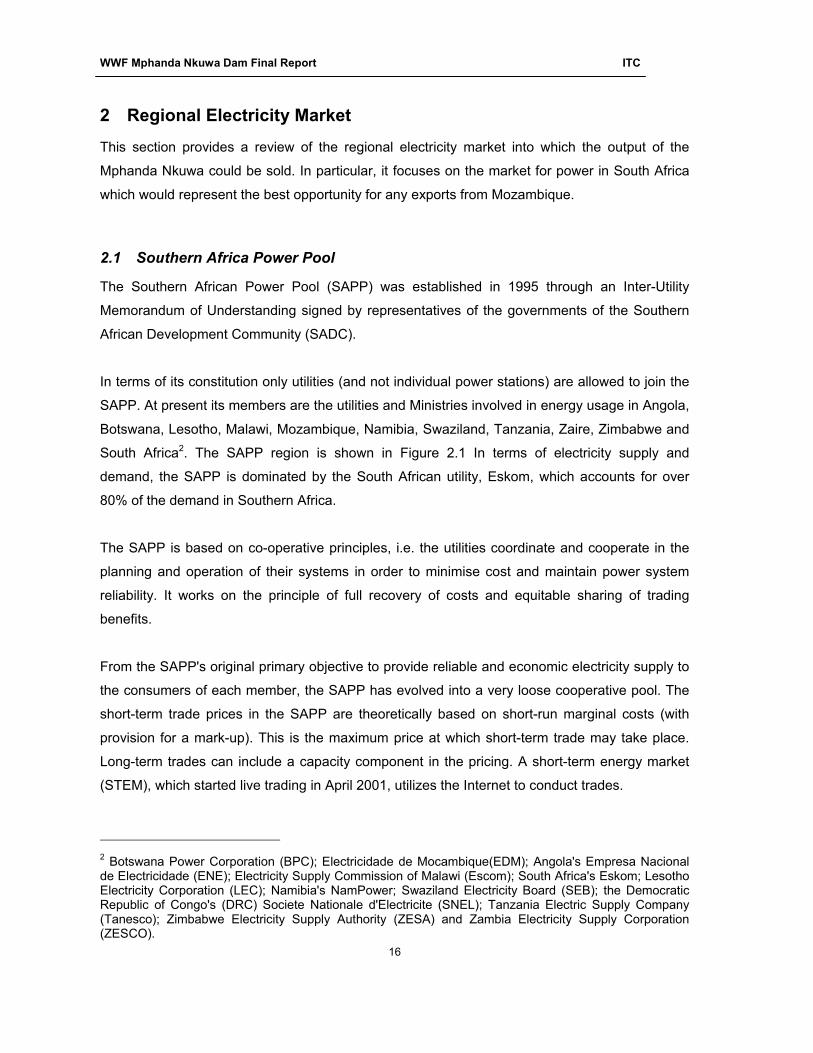
South Africa2. The SAPP region is shown in Figure 2.1 In terms of electricity supply and
demand, the SAPP is dominated by the South African utility, Eskom, which accounts for over
80% of the demand in Southern Africa.
The SAPP is based on co-operative principles, i.e. the utilities coordinate and cooperate in the
planning and operation of their systems in order to minimise cost and maintain power system
reliability. It works on the principle of full recovery of costs and equitable sharing of trading
benefits.
From the SAPP's original primary objective to provide reliable and economic electricity supply to
the consumers of each member, the SAPP has evolved into a very loose cooperative pool. The
short-term trade prices in the SAPP are theoretically based on short-run marginal costs (with
provision for a mark-up). This is the maximum price at which short-term trade may take place.
Long-term trades can include a capacity component in the pricing. A short-term energy market
(STEM), which started live trading in April 2001, utilizes the Internet to conduct trades.
2 Botswana Power Corporation (BPC); Electricidade de Mocambique(EDM); Angola's Empresa Nacional de Electricidade (ENE); Electricity Supply Commission of Malawi (Escom); South Africa's Eskom; Lesotho Electricity Corporation (LEC); Namibia's NamPower; Swaziland Electricity Board (SEB); the Democratic Republic of Congo's (DRC) Societe Nationale d'Electricite (SNEL); Tanzania Electric Supply Company (Tanesco); Zimbabwe Electricity Supply Authority (ZESA) and Zambia Electricity Supply Corporation (ZESCO).
WWF Mphanda Nkuwa Dam Final Report ITC
17
The SAPP sets out certain rights and obligations to member utilities covering aspects of quality,
capacity, operations and access.
Figure 2.1: The Southern African Power Pool (Source: www.sapp.co.zw)
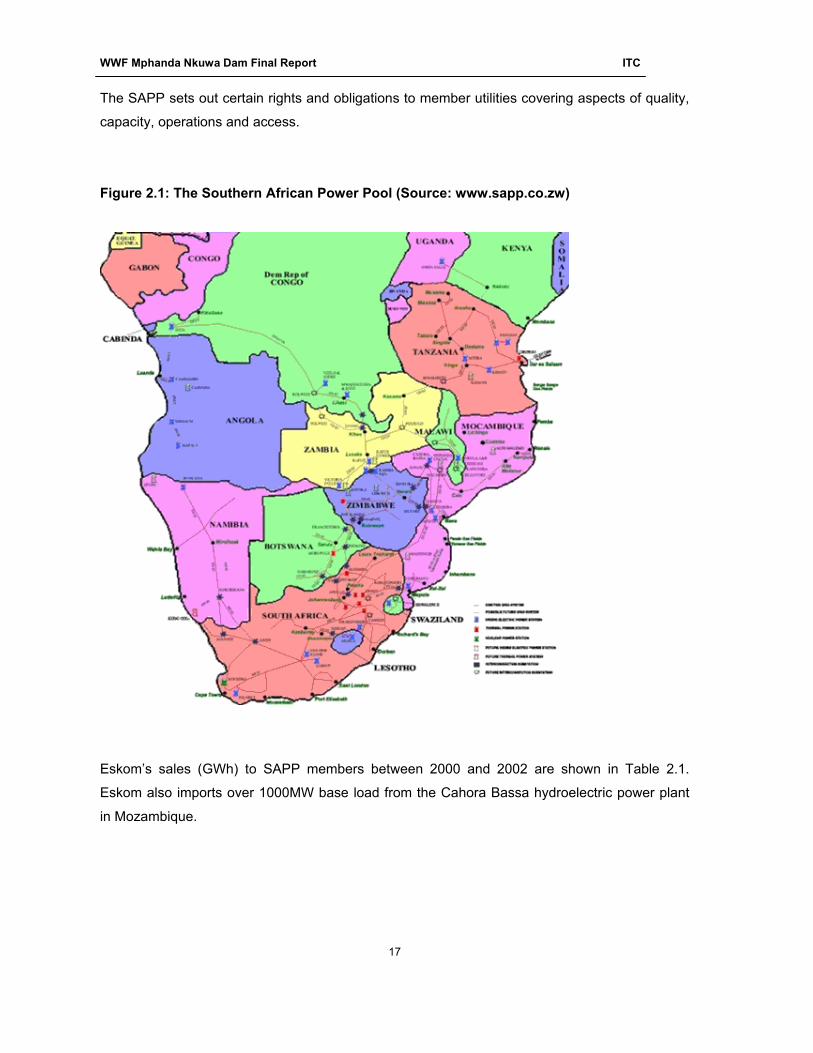
Eskom’s sales (GWh) to SAPP members between 2000 and 2002 are shown in Table 2.1.
Eskom also imports over 1000MW base load from the Cahora Bassa hydroelectric power plant
in Mozambique.
WWF Mphanda Nkuwa Dam Final Report ITC
18
Table 2.1 Eskom’s sales to countries in Southern Africa
Eskom’s sales to countries in Southern Africa (GWh)
2002 2001 2000
Botswana 1,124 1,183 986
Mozambique 3,907 3,899 1,331
Namibia 598 578 640
Zimbabwe 298 371 788
Lesotho 16 40 12
Swaziland 799 639 115
Zambia 103 - -
WWF Mphanda Nkuwa Dam Final Report ITC
19
3 Energy Needs
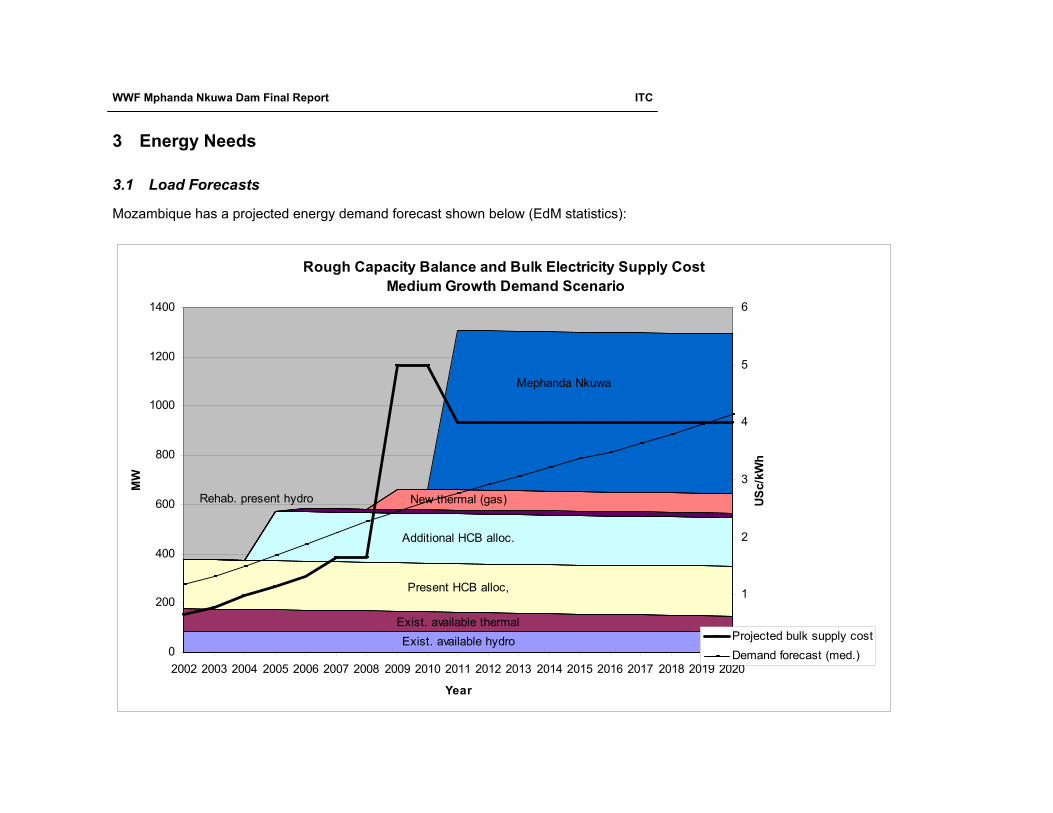
3.1 Load Forecasts
Mozambique has a projected energy demand forecast shown below (EdM statistics):
Rough Capacity Balance and Bulk Electricity Supply Cost Medium Growth Demand Scenario
Exist. available hydroExist. available thermal
Present HCB alloc,
Additional HCB alloc.
Rehab. present hydro New thermal (gas)
Mephanda Nkuwa
0
200
400
600
800
1000
1200
1400
2002 2003 2004 2005 2006 2007 2008 2009 2010 2011 2012 2013 2014 2015 2016 2017 2018 2019 2020
Year
MW
0
1
2
3
4
5
6
USc/
kWh
Projected bulk supply costDemand forecast (med.)
WWF Mphanda Nkuwa Dam Final Report ITC
20
3.2 Planned Generation
Mozambique has several options for hydropower generation on the Zambezi River and on
several other smaller rivers. A study by the Technical Unit for the Implementation of Hydropower
(UTIP) has identified 60 potential hydro sites in the country excluding the micro hydro sites
(<500kW). The total combined generation potential is estimated at some 12GW.
Mphanda Nkuwa was selected among the various options along the Zambezi. It is not the
biggest scheme. There is larger capacity at Boroma and Cambewe Foz (the other potential sites)
but one of the reasons it was selected was because it can be combined with the construction of
Cahora Bassa North. Mphanda Nkuwa is therefore currently proposed together with Cahora
Bassa North. Besides hydro generation there are plans for gas turbines to utilize gas from the
Temane and Pande gas fields for electricity generation. The third generation option is dependent
on the re-commissioning of the Moatize Coal Fields in Tete where a coal fired thermal power
station has been planned since colonial times.
Regionally, South Africa has three major coal power stations that are in storage or "mothballed"
status with a combined capacity of 3,556MW. It is foreseen that as demand on the South African
and SAPP rises, these power stations will come back on stream. South Africa has no significant
untapped hydropower potential and future energy demand will have to be met from thermal and
or nuclear generation. The country has limited potential for offshore wind generation as well as
abundant solar radiation. The country is also developing portable and smaller nuclear Pebble-
Bed Modular Reactor (PBMR) which can generate 110MW for electricity production.
Zimbabwe is already experiencing a deficit on its domestic demand with imports from the SAPP
supplying up to 60% of peak demand. The country has no immediate generation projects
planned but the potential is in additional generation at Kariba hydro plant and the suspended
Gokwe North Thermal Power Stations.
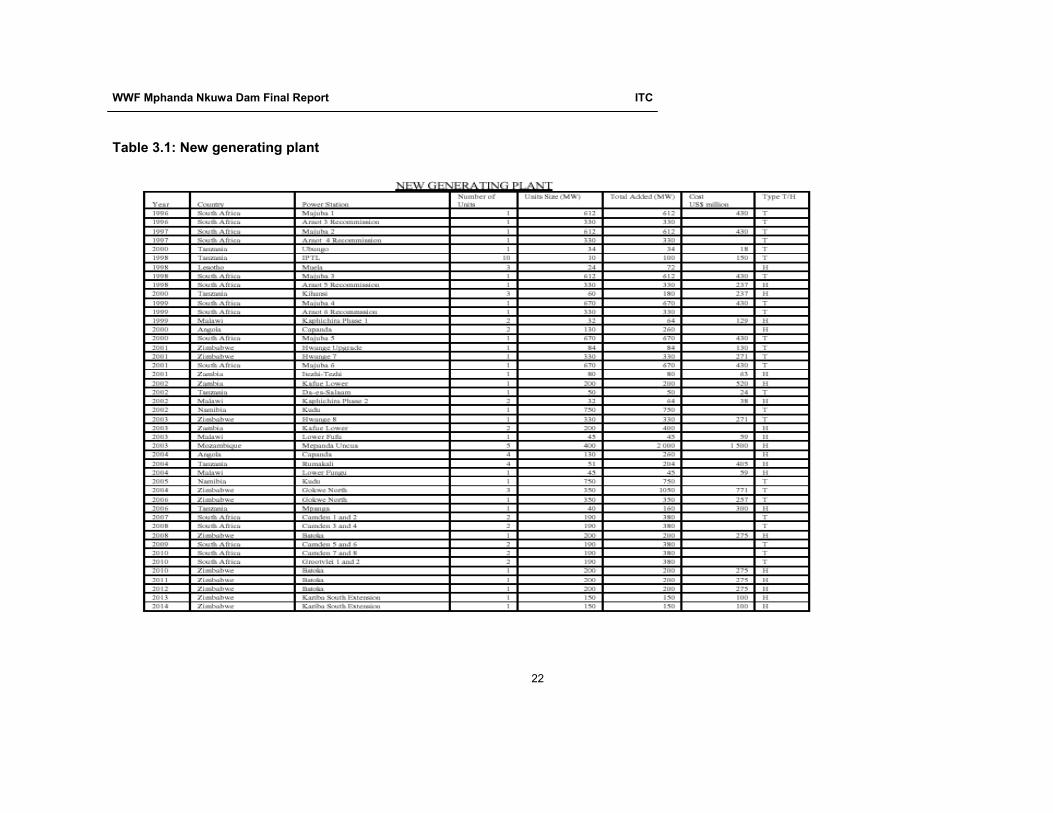
There are other planned hydropower stations in the region at various levels of planning. Judging
from the fact that many of the commissioning dates are now in the past, it is difficult to determine
what capacity will come on stream. Demand growth however can be more reliably projected.
Table 3.1 shows the planned generation plants within the region.

WWF Mphanda Nkuwa Dam Final Report ITC
21
The 1775 megawatts (MW) Inga hydroelectric facility in the Democratic Republic of Congo
(DRC) currently comprises a 351MW plant (Inga 1), commissioned in 1972, and a 1424MW plant
(Inga 2) which has been in operation since 1982. Inga provides power to the Republic of Congo
and also exports power to Southern Africa countries including Zambia, Zimbabwe and South
Africa. There are plans for a significant expansion of the capacity at Inga - the proposed Inga 3
development would add 3500MW while the Grand Inga scheme would increase the capacity at
Inga to 39,000MW. The Grand Inga scheme would require very significant investment and for a
new transmission infrastructure to be in place to enable the output to be delivered to load
centres. It is unlikely to proceed in the near future.
In April 2000, Angola and Namibia signed a bilateral cooperation energy agreement. The two
countries are considering the development of a hydroelectric facility on the Kunene (Cunene)
River that would provide electricity to both countries. The proposed facility would have a
generating capacity of 360MW and provide power to the Angolan, Namibian and South African
grids. There are also various Angolan power plants that have fallen into disrepair after the war
but could be rehabilitated.
In April 2002, the Maguga Dam in Swaziland was inaugurated. The dam will provide power from
a 19MW hydroelectric plant which could meet 50% of Swaziland's electricity needs. This would
lessen Swaziland's dependency on South Africa, where 90% of the country's electricity is
imported from Eskom. The Maguga is the first of four projected dams intended to harness the
Komati River, which flows into Swaziland's northwest sector from South Africa.
The Kafue Gorge Lower (KGL) hydroelectric station, south of the Zambian capital Lusaka, is
expected to have a capacity of 660MW. The Zambian government plans to export the vast
majority of the power produced to Zimbabwe, Botswana and DRC. Kafue Gorge Lower will be
the second-largest generating facility in Zambia. The existing Kafue Gorge Upper power plant
currently has a generation capacity of 900MW. There are also plans for a 120MW peaking plant
at the Itezhi-tezhi reservoir upstream on the Kafue River.
There are thus a variety of hydroelectric projects under consideration within the SAPP region
including Mphanda Nkuwa. The viability of any given project will be contingent upon there being
sufficient demand for its output and the majority of demand in the SAPP region is in South Africa.
WWF Mphanda Nkuwa Dam Final Report ITC
22
Table 3.1: New generating plant
WWF Mphanda Nkuwa Dam Final Report ITC
23
The Mphanda Nkuwa project has been framed to support any demand increases on the
Mozambique grid due to the foreseen mega projects as well as the projected deficit on the SAPP
by 2007. The economic option assessment for this report therefore will be based on those that
would meet the same objective and cover the same market.
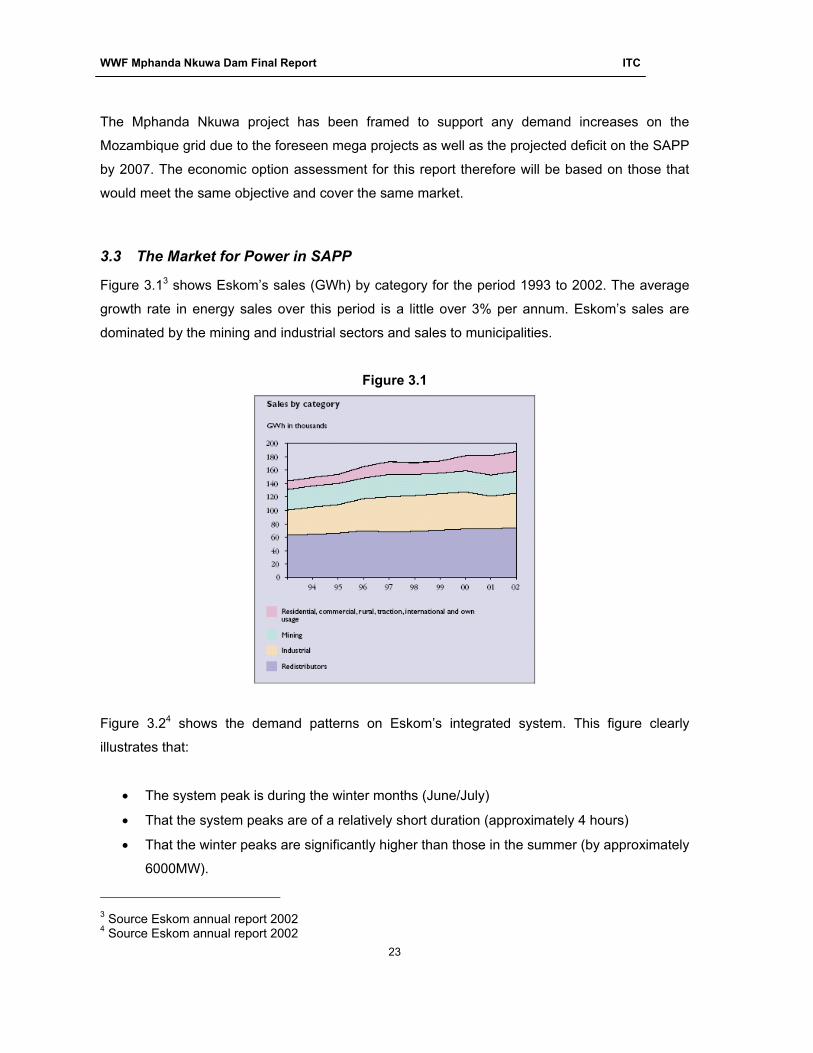
3.3 The Market for Power in SAPP
Figure 3.13 shows Eskom’s sales (GWh) by category for the period 1993 to 2002. The average
growth rate in energy sales over this period is a little over 3% per annum. Eskom’s sales are
dominated by the mining and industrial sectors and sales to municipalities.
Figure 3.1
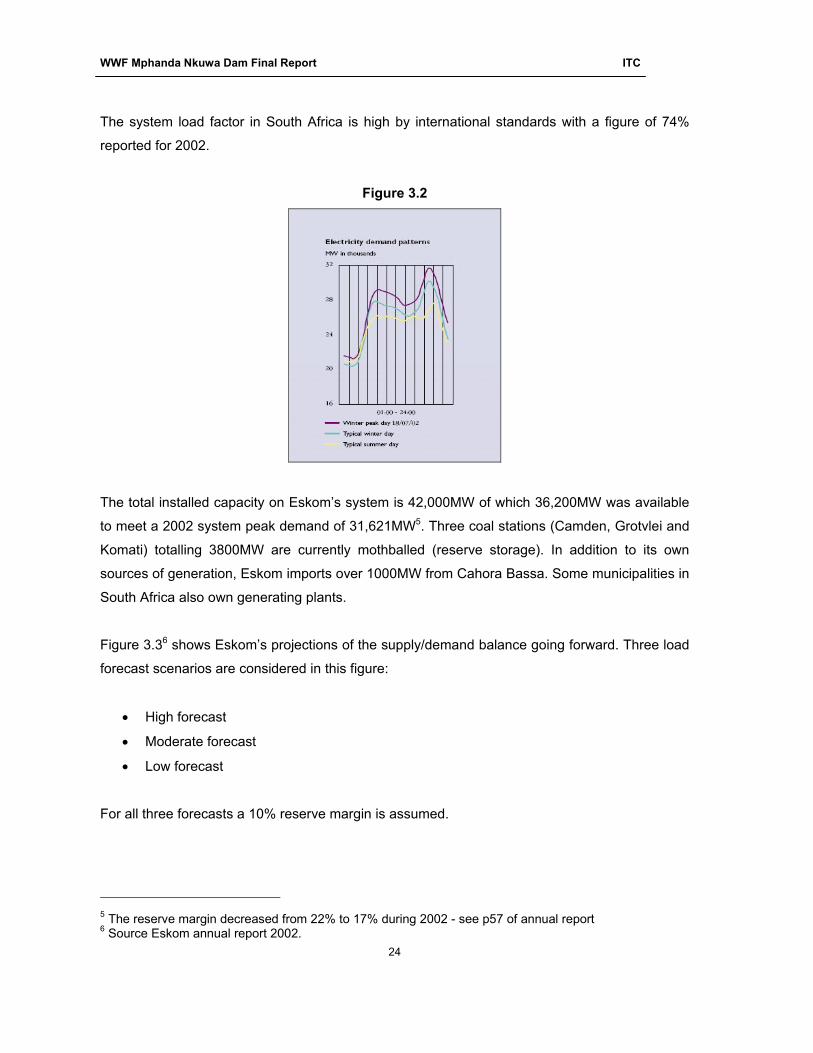
Figure 3.24 shows the demand patterns on Eskom’s integrated system. This figure clearly
illustrates that:
• The system peak is during the winter months (June/July)
• That the system peaks are of a relatively short duration (approximately 4 hours)
• That the winter peaks are significantly higher than those in the summer (by approximately
6000MW).
3 Source Eskom annual report 2002 4 Source Eskom annual report 2002
WWF Mphanda Nkuwa Dam Final Report ITC
24
The system load factor in South Africa is high by international standards with a figure of 74%
reported for 2002.
Figure 3.2
The total installed capacity on Eskom’s system is 42,000MW of which 36,200MW was available
to meet a 2002 system peak demand of 31,621MW5. Three coal stations (Camden, Grotvlei and
Komati) totalling 3800MW are currently mothballed (reserve storage). In addition to its own
sources of generation, Eskom imports over 1000MW from Cahora Bassa. Some municipalities in
South Africa also own generating plants.
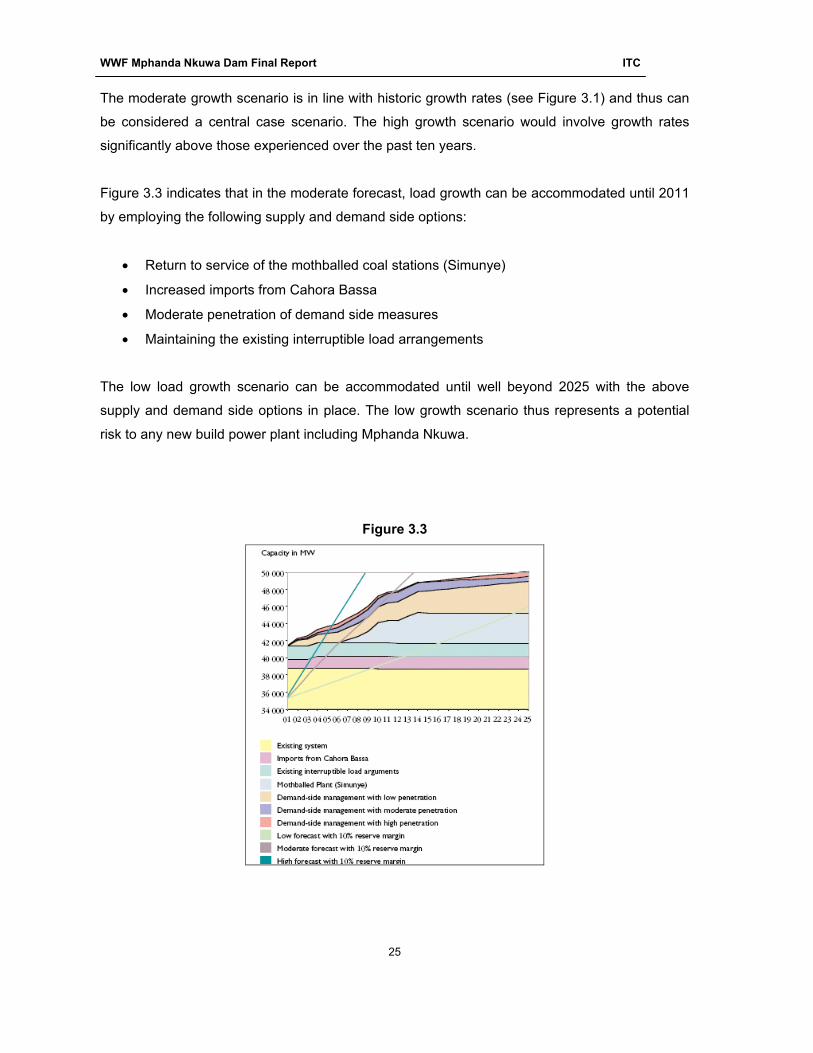
Figure 3.36 shows Eskom’s projections of the supply/demand balance going forward. Three load
forecast scenarios are considered in this figure:
• High forecast
• Moderate forecast
• Low forecast
For all three forecasts a 10% reserve margin is assumed.
5 The reserve margin decreased from 22% to 17% during 2002 - see p57 of annual report 6 Source Eskom annual report 2002.
WWF Mphanda Nkuwa Dam Final Report ITC
25
The moderate growth scenario is in line with historic growth rates (see Figure 3.1) and thus can
be considered a central case scenario. The high growth scenario would involve growth rates
significantly above those experienced over the past ten years.
Figure 3.3 indicates that in the moderate forecast, load growth can be accommodated until 2011
by employing the following supply and demand side options:
• Return to service of the mothballed coal stations (Simunye)
• Increased imports from Cahora Bassa
• Moderate penetration of demand side measures
• Maintaining the existing interruptible load arrangements
The low load growth scenario can be accommodated until well beyond 2025 with the above
supply and demand side options in place. The low growth scenario thus represents a potential
risk to any new build power plant including Mphanda Nkuwa.
Figure 3.3
WWF Mphanda Nkuwa Dam Final Report ITC
26
For the period beyond 2010, Eskom are investigating a number of supply side options7 including:
• Conventional pulverised coal stations
• Pumped storage schemes
• Pebble bed modular reactors (PBMR nuclear option)
• Fluidised bed combustion coal plant
• Renewable energy technologies.
Of these options, the PBMR nuclear option is at the research and development stage. Some
wind generators are currently operational but renewable generation is not expected to make a
significant contribution to South Africa’s energy requirements in the medium term. Feasibility
studies have been undertaken for two pumped storage stations (Braamhoek and Steelport) with
commissioning of Braamhoek planned for 2012. The addition of these two pumped storage
plants is likely to defer the need for further new capacity until 2013.
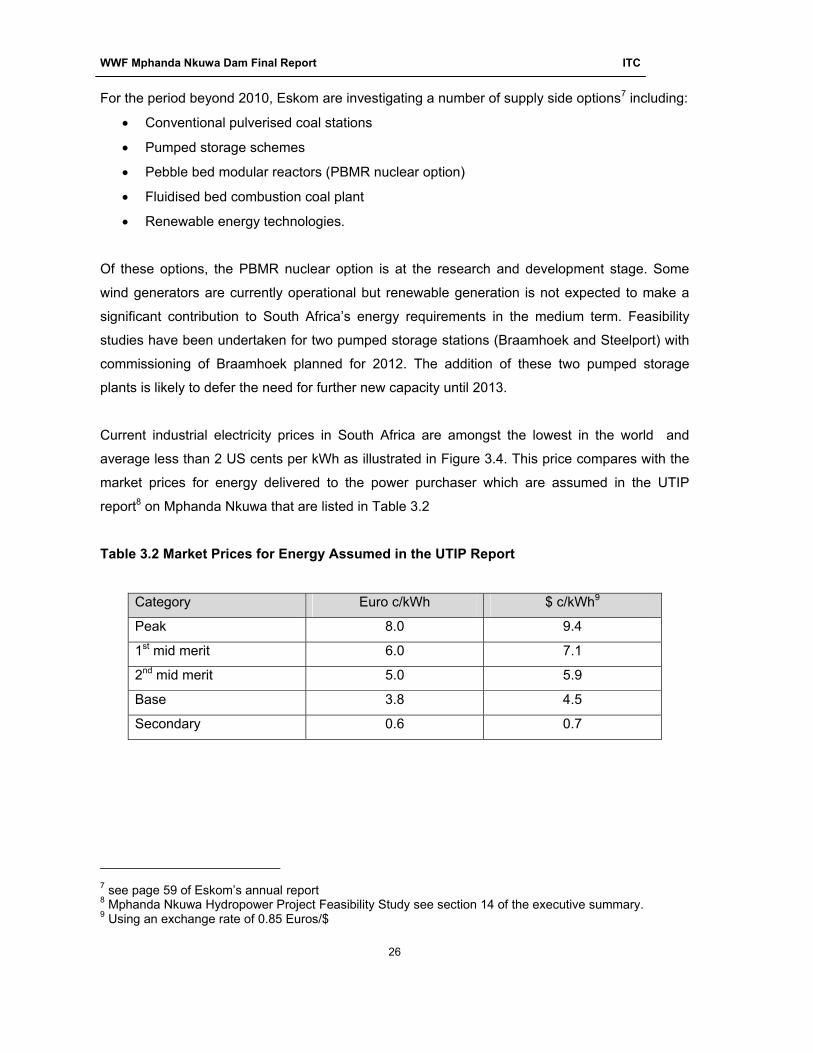
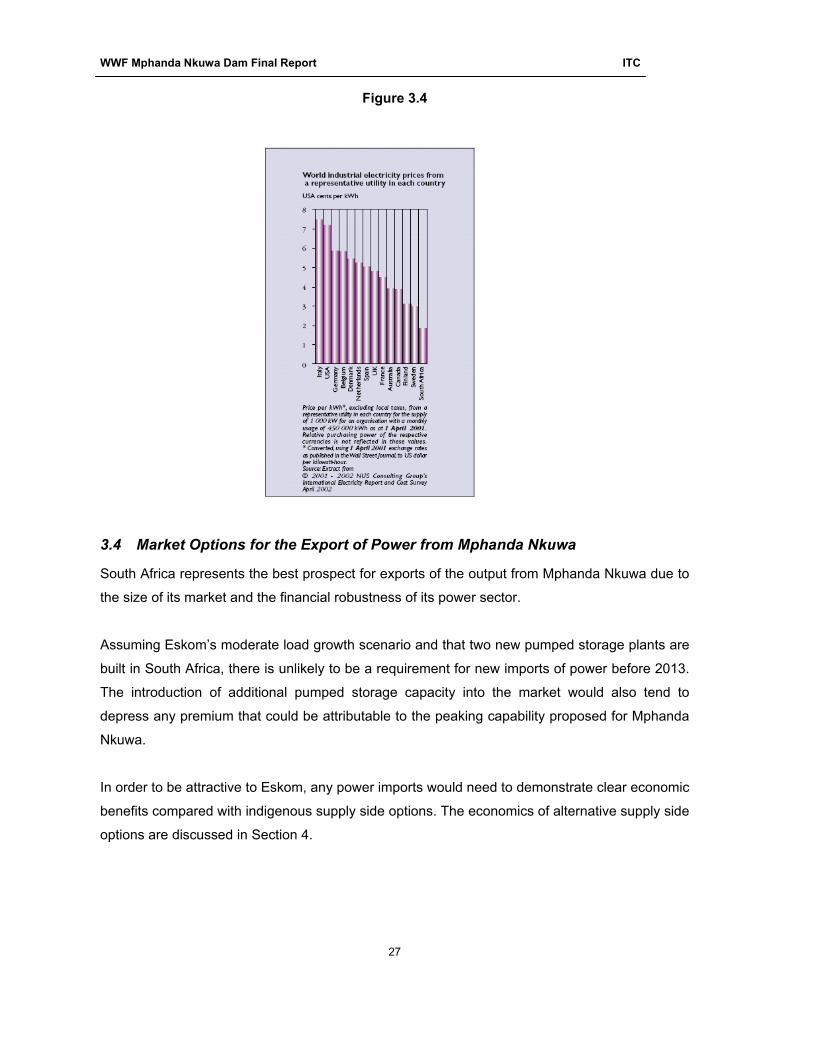
Current industrial electricity prices in South Africa are amongst the lowest in the world and
average less than 2 US cents per kWh as illustrated in Figure 3.4. This price compares with the
market prices for energy delivered to the power purchaser which are assumed in the UTIP
report8 on Mphanda Nkuwa that are listed in Table 3.2
Table 3.2 Market Prices for Energy Assumed in the UTIP Report
Category Euro c/kWh $ c/kWh9
Peak 8.0 9.4
1st mid merit 6.0 7.1
2nd mid merit 5.0 5.9
Base 3.8 4.5
Secondary 0.6 0.7
7 see page 59 of Eskom’s annual report 8 Mphanda Nkuwa Hydropower Project Feasibility Study see section 14 of the executive summary. 9 Using an exchange rate of 0.85 Euros/$
WWF Mphanda Nkuwa Dam Final Report ITC
27
Figure 3.4
3.4 Market Options for the Export of Power from Mphanda Nkuwa
South Africa represents the best prospect for exports of the output from Mphanda Nkuwa due to
the size of its market and the financial robustness of its power sector.
Assuming Eskom’s moderate load growth scenario and that two new pumped storage plants are
built in South Africa, there is unlikely to be a requirement for new imports of power before 2013.
The introduction of additional pumped storage capacity into the market would also tend to
depress any premium that could be attributable to the peaking capability proposed for Mphanda
Nkuwa.
In order to be attractive to Eskom, any power imports would need to demonstrate clear economic
benefits compared with indigenous supply side options. The economics of alternative supply side
options are discussed in Section 4.
WWF Mphanda Nkuwa Dam Final Report ITC
28
4 Economic Option Assessment of Mphanda Nkuwa
In this section, the economic costs of generating and transmitting power from the proposed
Mphanda Nkuwa project are compared with the alternatives of generating power from either gas
or coal fired thermal plants, in the region.
In addition, the cost of new generation sources is compared with the market prices which were
assumed in the UTIP feasibility study of the Mphanda Nkuwa project.
4.1 The Dollar – Euro Exchange Rate
The financial analysis in the UTIP report (released in February 2003) is undertaken in euros.
Since the middle of 2001, there has been a dramatic change in the euro/dollar exchange rate
from a peak of 1.16 Euro/Dollar in mid 2001 to a low of 0.81 Euro/Dollar at the end of 2003. This
represents a fall in the value of the dollar relative to the euro of over 40% over this period. A less
dramatic adjustment in the dollar/sterling rate has also been experienced with the rate moving
from a high of 1.4 dollar/pound a low of 1.77 dollar/pound over the same period.
Most internationally traded fuels are priced in US dollars and thus the analysis in this report,
which assesses the economics of thermal power plant to compare with those of Mphanda
Nkuwa, is undertaken in dollars. The change in exchange rates has pushed up the dollar price of
oil and is also increasing the dollar prices for gas and coal. The recent changes in the exchange
rates will have a significant effect on any comparison of prices denominated in dollars and euros.
Footnotes to the tables used in this report indicate the exchange rates that have been used in
the economic analysis.
4.2 The Economics of Combined Cycle Gas Turbine Plant
The Pande and Temane gas fields, located near the coast in central Mozambique are currently
being developed. We understand that the proven10 gas reserves at these two fields are a little
over 2 trillion cubic feet (TCF). In February 2004, Sasol commenced gas exports to South Africa
over a new dedicated gas pipeline.
10 If probable and possible reserves are included this figure rises to a little over 5 TCF
WWF Mphanda Nkuwa Dam Final Report ITC
29
An alternative generation option to Mphanda Nkuwa would be to build combined cycle gas
turbine plant (CCGT). A 750MW CCGT running at a 90% load factor on gas with a calorific value
of 41GJ per cubic metre will consume around 0.04 TCF per annum and thus 1 TCF over a 25-
year lifetime. This would account for 50% of the current proven gas reserves in Mozambique.
Such a power plant could either be built in Mozambique with a proportion of the power generated
being exported to South Africa. Alternatively, or the station could be built in South Africa with the
gas being exported from Mozambique.
The following assumptions have been made regarding a typical CCGT plant:
• A capital cost including a transmission connection of $600/kW
• An operating life of 25 years
• A thermal efficiency 50%
• A delivered gas price of $2.5/GJ
• Operating and maintenance costs of $4.2/MWh for base load operation
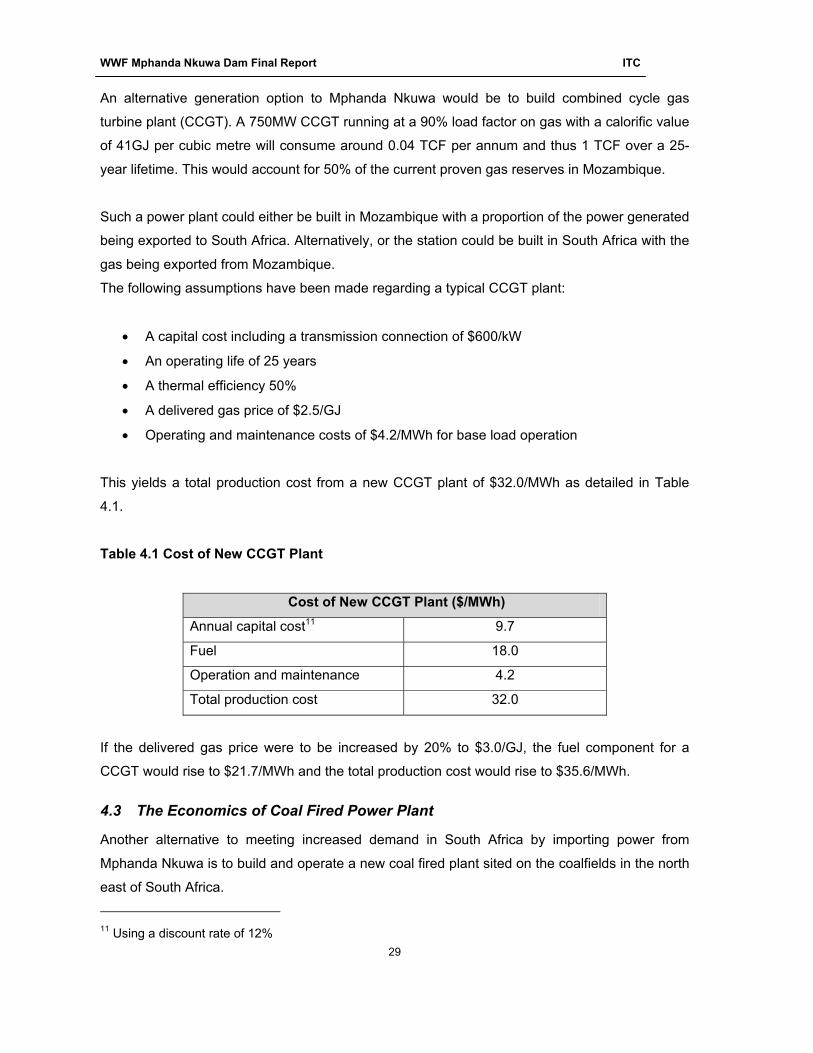
This yields a total production cost from a new CCGT plant of $32.0/MWh as detailed in Table
4.1.
Table 4.1 Cost of New CCGT Plant
Cost of New CCGT Plant ($/MWh)
Annual capital cost11 9.7
Fuel 18.0
Operation and maintenance 4.2
Total production cost 32.0
If the delivered gas price were to be increased by 20% to $3.0/GJ, the fuel component for a
CCGT would rise to $21.7/MWh and the total production cost would rise to $35.6/MWh.
4.3 The Economics of Coal Fired Power Plant
Another alternative to meeting increased demand in South Africa by importing power from
Mphanda Nkuwa is to build and operate a new coal fired plant sited on the coalfields in the north
east of South Africa.
11 Using a discount rate of 12%

WWF Mphanda Nkuwa Dam Final Report ITC
30
Making the following assumptions regarding a conventional coal fired power plant:
• A capital cost including a transmission connection of $1,500/kW
• An operating life of 35 years
• A thermal efficiency of 37.5%
• A mine head coal price of $0.5/GJ12.
• Operating and maintenance costs of $5.9/MWh for base load operation
This yields a total production cost from a new coal plant of $34.3/MWh as detailed in Table 4.2
Table 4.2 Cost of New Coal Fired Plant
Cost of New Coal Fired Plant ($/MWh)
Annual capital cost13 25.3
Fuel 4.8
Operation and maintenance 5.9
Total production cost 34.3
If coal prices were increased by 40% to 0.7$/GJ, the fuel component would rise to $6.7/MWh
and the total production cost of a coal power station would rise to $36.2/MWh.
4.4 The Economics of Mphanda Nkuwa
The proposed Mphanda Nkuwa hydroelectric project would comprise a powerhouse with an
installed capacity of 1300MW (four 325MW units) 61km downstream of the existing Cahora
Bassa dam. Power would be transmitted to Maputo over a 1600km transmission system
comprising two 400kV circuits on separate towers.
The economic justification of the Mphanda Nkuwa project presented in the UTIP report14 is
based upon the assumptions of market prices for the energy delivered to the power purchaser
12 Eskom burns low-grade coal in power plants located on the coalfields. Coal for export is currently traded at around $1.34/GJ at Richard’s Bay. Traded coal is significantly better quality than that burnt at the power plants and it requires transportation from the coal mine to Richard’s Bay. Eskom’s annual report indicates that the operating costs for primary energy are 6,199mRand for 193,642GWh of thermal production (coal plus nuclear) yielding an operating cost of 32Rand/MWh. 13 Using a discount rate of 12% 14 Mphanda Nkuwa Hydropower Project Feasibility Study
WWF Mphanda Nkuwa Dam Final Report ITC
31
that are listed in Table 4.3. However, at present no freely traded long-term power market exists
in the region. The Southern African Power Pool enables national power utilities to optimise their
regional energy resources with the trading arrangements based upon intergovernmental
agreements. Utilities in the region enter into long term bilateral agreements for buying and selling
electrical power. In 2001, a day ahead short-term energy market (STEM) was created within
SAPP but, to be viable, the output of Mphanda Nkuwa would need to be sold under the terms of
a long term Power Purchase Agreement. Without such an agreement in place, it would not be
possible to attract investors in the project.
As the only likely buyer of the output from Mphanda Nkuwa, Eskom will be in a powerful position
in any negotiations over the price of its output. It is well known, for example, that Eskom
currently purchases the output of Cahora Bassa at very favourable prices due, in part, to the lack
of any alternative markets. In the absence of any other potential buyers it may well be optimistic
to assume that Mphanda Nkuwa could achieve a “fair” market price for its output.
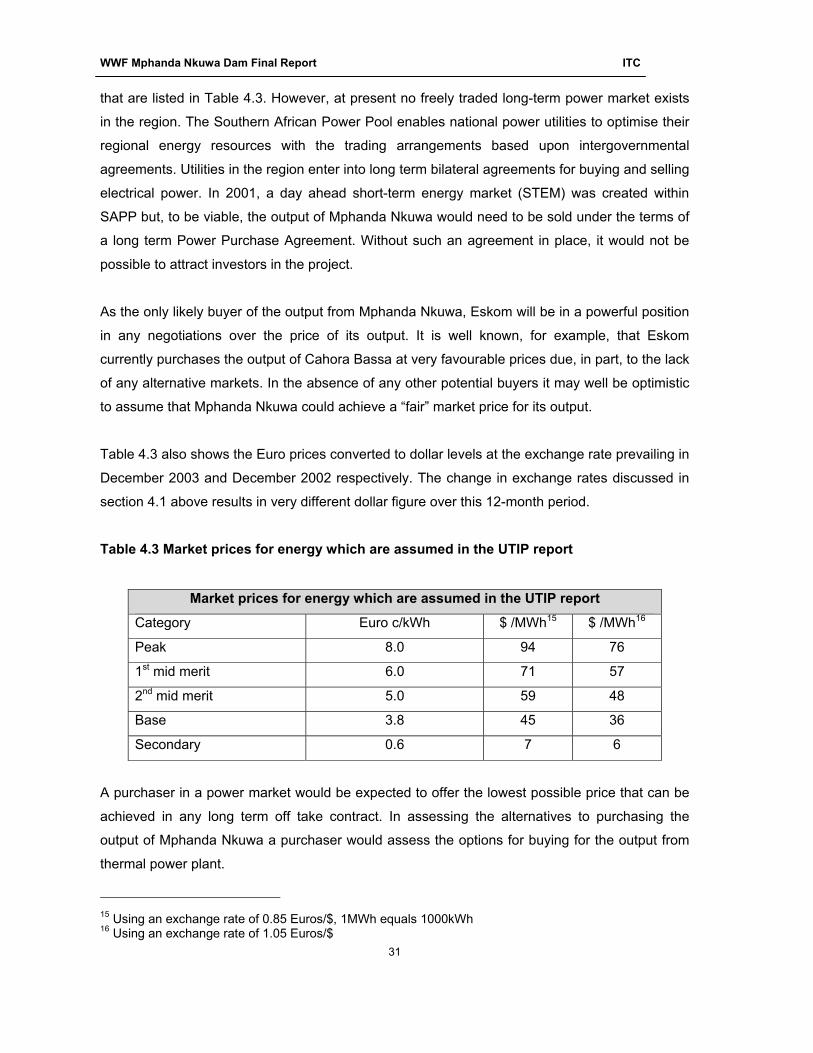
Table 4.3 also shows the Euro prices converted to dollar levels at the exchange rate prevailing in
December 2003 and December 2002 respectively. The change in exchange rates discussed in
section 4.1 above results in very different dollar figure over this 12-month period.
Table 4.3 Market prices for energy which are assumed in the UTIP report
Market prices for energy which are assumed in the UTIP report
Category Euro c/kWh $ /MWh15 $ /MWh16
Peak 8.0 94 76
1st mid merit 6.0 71 57
2nd mid merit 5.0 59 48
Base 3.8 45 36
Secondary 0.6 7 6
A purchaser in a power market would be expected to offer the lowest possible price that can be
achieved in any long term off take contract. In assessing the alternatives to purchasing the
output of Mphanda Nkuwa a purchaser would assess the options for buying for the output from
thermal power plant.
15 Using an exchange rate of 0.85 Euros/$, 1MWh equals 1000kWh 16 Using an exchange rate of 1.05 Euros/$

WWF Mphanda Nkuwa Dam Final Report ITC
32
In a market, peaking capability will command some premium over base load energy, with the
premium being dependant upon the alternatives available. There are currently three pumped
storage stations17, two conventional hydroelectric plants and two open cycle gas turbines in
South Africa all with a capability to deliver energy at times of peak demand. In addition, Eskom
has undertaken feasibility studies for building a further two pumped storage stations.
The ability of Mphanda Nkuwa to operate in a mid merit or peaking mode would offer greater
flexibility to the system than the competing thermal options providing that sufficient transmission
capability is available for operating in this manner.
The estimated capital costs comprising both the generation and transmission components for the
Mphanda Nkuwa project are given in Table 4.418 and these have been adjusted to 2003 price
levels and converted to a cost per kW in Table 4.5. In table 2.5 two different dollar-to-Euro
conversion rates have been used, the first (0.85 Euros/$) reflects exchange rate subsequent to
the fall in the value of the dollar in the course of 2003 while the second (1.11 Euros/$) reflects
exchange rates prevailing at the time the UTIP report was written. In subsequent tables an
exchange rate of 0.85 Euros/$ has been used in the analysis. It is noted that while the capital
cost per kW installed of the power plant is low; the cost of the transmission facilities from
Mphanda Nkuwa to Maputo exceeds the cost of the power plant.
The projections of firm energy and annual average energy for the project together with estimates
of the delivered energy to a purchaser once transmission losses have been taken into account
are given in Table 4.6. Table 4.5 provides an estimate of the total cost of production ($/MWh).
This total includes an estimate of the operating costs for the power plant and the associated
1,400km of transmission facilities. In table 4.5 the euro/dollar exchange rates at both December
2002 and December 2003 levels have been used. These figures demonstrate the difficulty in
converting the costs assumed for Mphanda Nkuwa to dollars given the dramatic change in the
value of the euro relative to the dollar since the UTIP report was written.
17 Two of these are owned by Eskom and one by the Municipality of Cape town 18 Source UTIP Mphanda Nkuwa Hydropower Project Feasibility Study
WWF Mphanda Nkuwa Dam Final Report ITC
33
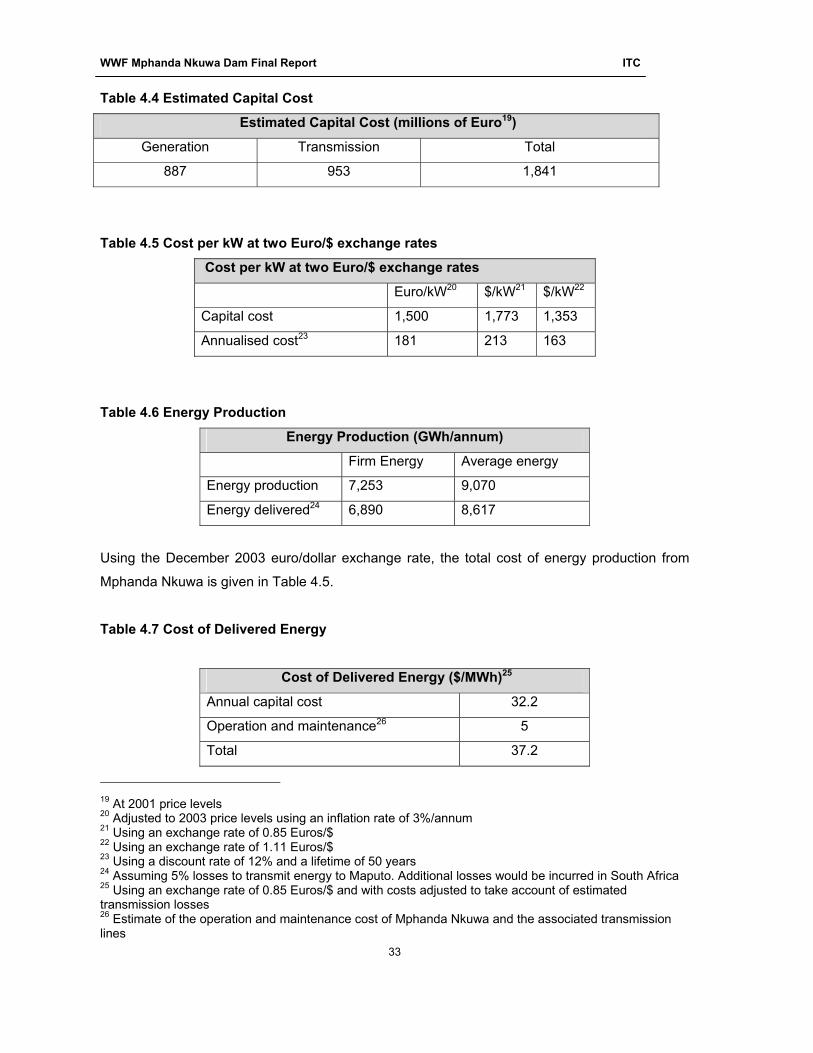
Table 4.4 Estimated Capital Cost
Estimated Capital Cost (millions of Euro19)
Generation Transmission Total
887 953 1,841
Table 4.5 Cost per kW at two Euro/$ exchange rates
Cost per kW at two Euro/$ exchange rates
Euro/kW20 $/kW21 $/kW22
Capital cost 1,500 1,773 1,353
Annualised cost23 181 213 163
Table 4.6 Energy Production
Energy Production (GWh/annum)
Firm Energy Average energy
Energy production 7,253 9,070
Energy delivered24 6,890 8,617
Using the December 2003 euro/dollar exchange rate, the total cost of energy production from
Mphanda Nkuwa is given in Table 4.5.
Table 4.7 Cost of Delivered Energy
Cost of Delivered Energy ($/MWh)25
Annual capital cost 32.2
Operation and maintenance26 5
Total 37.2
19 At 2001 price levels 20 Adjusted to 2003 price levels using an inflation rate of 3%/annum 21 Using an exchange rate of 0.85 Euros/$ 22 Using an exchange rate of 1.11 Euros/$ 23 Using a discount rate of 12% and a lifetime of 50 years 24 Assuming 5% losses to transmit energy to Maputo. Additional losses would be incurred in South Africa 25 Using an exchange rate of 0.85 Euros/$ and with costs adjusted to take account of estimated transmission losses 26 Estimate of the operation and maintenance cost of Mphanda Nkuwa and the associated transmission lines

WWF Mphanda Nkuwa Dam Final Report ITC
34
If the capital costs were to be 10% above those estimated in the UTIP report, the cost of
delivered power would rise to $40.3/MWh.
If the euro/dollar exchange rate that prevailed in December 2002 is used to convert capital costs
for the project to dollars, the total cost falls to $34.2/MWh.
4.5 The South Africa National Integrated Resource Plan
At the end of February 2004, the National Electricity Regulator (NER) published its National
Integrated Resource Plan (NIRP) for South Africa. This document is an independent source of
information for stakeholders and decision makers for the purposes of ensuring security of supply
in South Africa. In early 2003, NER established an IRP advisory and review committee to
provide wide stakeholders’ contribution to the NIRP process. The most recent NIRP has been
generated under the review of this committee which comprises Eskom’s Resource and Strategy
Group, the Energy Research Institute of University of Cape Town (UCT) and the NER.
The conclusions of the NIRP included the following:
• New base load generation is required for commercial operation from 2010
• Pulverised fuel coal fired, fluidised bed combustion coal plant and CCGT are the
available options for this role
• Fluidised bed combustion coal plant is the most economic option followed by
conventional coal fired plant and CCGT plant fuelled on LNG
• It would be difficult to justify fuel diversification on economic grounds
Imports from the Southern African region were not considered as supply options for the
purposes of the NIRP.
4.6 Economic Analysis Summary
New generating capacity is expected to be required for the South African system from 2010
onwards. There are limited realistic options available for the provision of base load and mid merit
generating capacity for South Africa. These options include:
• New coal fired capacity
• New CCGT capacity
WWF Mphanda Nkuwa Dam Final Report ITC
35
• Increased imports from hydro electric capacity
While CCGT capacity may be attractive on economic and environmental grounds, at present
proven gas reserves in Mozambique and South Africa are limited and thus natural gas may not
be available in sufficient quantities as a fuel for large-scale power generation. An alternative
option is to import LNG to fuel CCGT plants located at the coast. While LNG will tend to be more
expensive than natural gas, this option has the attraction of enabling power plant to be located in
the Cape region where there is a current deficit of generating capability
As South Africa has abundant supplies of low cost coal, new coal-fired capacity is an
economically viable option for new base load capacity. Because of the costs associated with
transporting low grade coal, new coal stations are likely to be located in the north east of the
country.
There are a number of major hydroelectric projects that are under active discussion across
Southern Africa including the Mphanda Nkuwa scheme. The most likely market for the majority
of the output of such projects is in South Africa. However, there are a number of risks associated
to South Africa with these including:
• The country risk and potential for Government interference.
• Delays in project completion
• Delays in completion of transmission facilities from the new projects to the load centres in
South Africa.
Based upon the above analysis in sections 4.2 to 4.4, Table 4.8 shows the comparison of the
economic costs of:
• The proposed hydroelectric development at Mphanda Nkuwa;
• A new combined cycle gas turbine plant; and
• A new coal fired generating plant.

WWF Mphanda Nkuwa Dam Final Report ITC
36
Table 4.8 Comparative Costs of New Generation Options
Comparative Costs of New Generation Options ($/MWh)
Mphanda Nkuwa27 28.4 -34.2
CCGT 32.0 – 35.6
Coal Fired Plant 34.3 – 36.2
Using the current $/Euro exchange rate the economics of the Mphanda Nkuwa project are
broadly comparable to coal or gas fired plant as a supply option for South Africa. If the exchange
rate that prevailed when the UTIP report was written, the Mphanda Nkuwa project would be a
lower cost option than either gas or coal fired plant, In addition, Mphanda Nkuwa would offer
diversity of fuel supply and may offer operational benefits due to its flexibility. Careful
consideration would, however, be required of the transmission costs of transporting the imported
power to the load centres within South Africa.
The estimated project construction phase for the Mphanda Nkuwa project is 6.5 years28.
Construction would only commence after the chosen developer had achieved financial closure.
The longer the lead time for the project, the more significant the associated risks become. An
additional risk for Mphanda Nkuwa is that its output will be dependent upon the flows in the
Zambezi River which have reduced significantly during drought years. Given these risk factors,
the Mphanda Nkuwa project would need to demonstrate real benefits relative to thermal
generation options to make it attractive to a developer.
The existing wholesale power prices in South Africa are well below those required to finance a
new power plant. As new capacity is required over the next few years some rises in wholesale
prices will be inevitable. The extent of such price rises will be contingent upon the evolution of
the power market in South Africa.
27 The range in cost for Mphanda Nkuwa is wide because of the uncertainty resulting from the significant change in the dollar/euro exchange rate since the UTIP report was issued 28 See section 17 of the executive summary of UTIP report.
WWF Mphanda Nkuwa Dam Final Report ITC
37
5 Environmental and Social Options Assessment
Mphanda Nkuwa has been proposed as an energy source for the SAPP as well as augment
national supplies in Mozambique. The previous section looked at the economic justification of
different scenarios to meet the additional demand for power and energy. This section looks at
the environmental, technical and social issues of the different options.
Mphanda Nkuwa is part of the hydroelectricity export industry for Mozambique. It is also planned
as a private sector investment and therefore has to be of an attractive scale and mode. The
development aspects of Mphanda Nkuwa therefore are analysed for a private sector investment
angle as opposed to socio-economic investment by government to meet broad development
objectives. Its contribution to development is envisaged through tax contribution, employment
creation as well as availability of cheap and reliable power supply for resource extraction
industries especially in minerals such as heavy metals (titanium at Chibuto) and aluminium
through Mozal.
This approach to development has raised more questions than answers in Mozambique based
on experience with similar mega projects that have often been developed on the basis of wide
ranging tax and fiscal concessions and a very light handed regulatory environment.
The options assessment was carried out on the following range of available generating sources
that were selected as being able to supply the same market as Mphanda Nkuwa:
.
1) Mphanda Nkuwa
2) Kudu Gas fired CC power station (750MW)
3) Decentralized local generation using different energy sources
4) Intensive Demand Side Management coupled with lower additional generation capacity
5) Coal based generation in South Africa
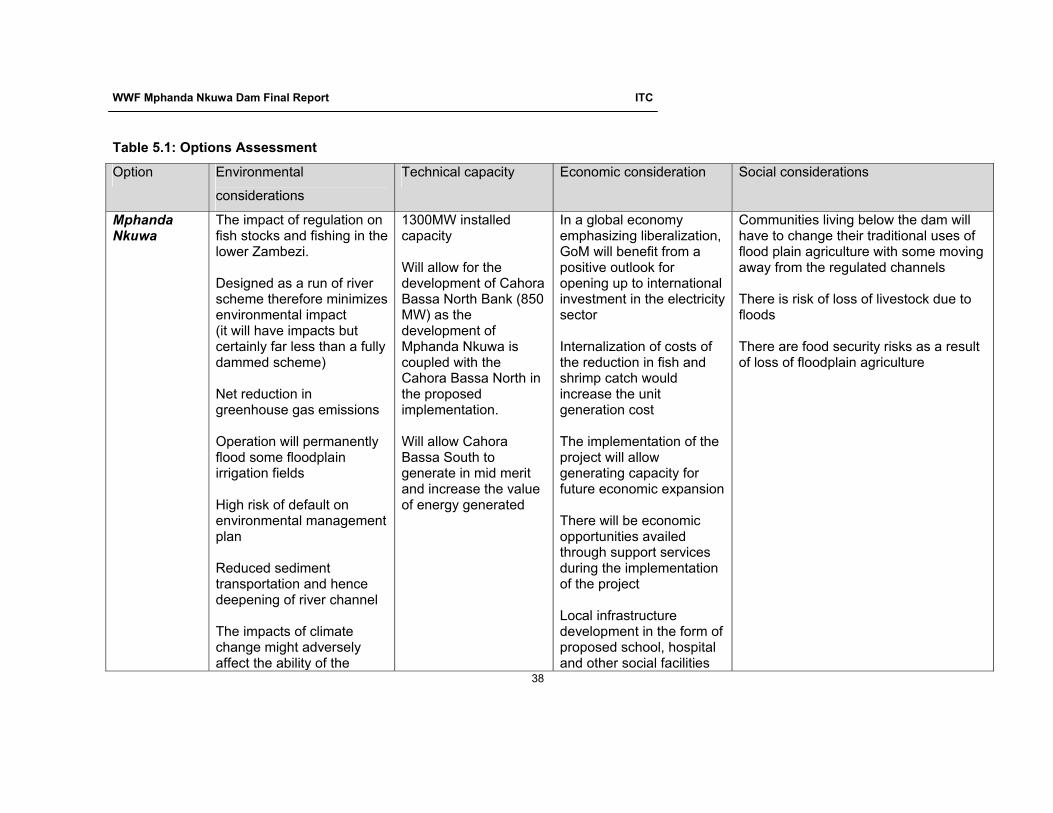
A summary table of this analysis is shown in Table 5.1
WWF Mphanda Nkuwa Dam Final Report ITC
38
Table 5.1: Options Assessment
Option Environmental
considerations
Technical capacity Economic consideration Social considerations
Mphanda Nkuwa
The impact of regulation on fish stocks and fishing in the lower Zambezi. Designed as a run of river scheme therefore minimizes environmental impact (it will have impacts but certainly far less than a fully dammed scheme) Net reduction in greenhouse gas emissions Operation will permanently flood some floodplain irrigation fields High risk of default on environmental management plan Reduced sediment transportation and hence deepening of river channel The impacts of climate change might adversely affect the ability of the
1300MW installed capacity Will allow for the development of Cahora Bassa North Bank (850 MW) as the development of Mphanda Nkuwa is coupled with the Cahora Bassa North in the proposed implementation. Will allow Cahora Bassa South to generate in mid merit and increase the value of energy generated
In a global economy emphasizing liberalization, GoM will benefit from a positive outlook for opening up to international investment in the electricity sector Internalization of costs of the reduction in fish and shrimp catch would increase the unit generation cost The implementation of the project will allow generating capacity for future economic expansion There will be economic opportunities availed through support services during the implementation of the project Local infrastructure development in the form of proposed school, hospital and other social facilities
Communities living below the dam will have to change their traditional uses of flood plain agriculture with some moving away from the regulated channels There is risk of loss of livestock due to floods There are food security risks as a result of loss of floodplain agriculture
WWF Mphanda Nkuwa Dam Final Report ITC
39
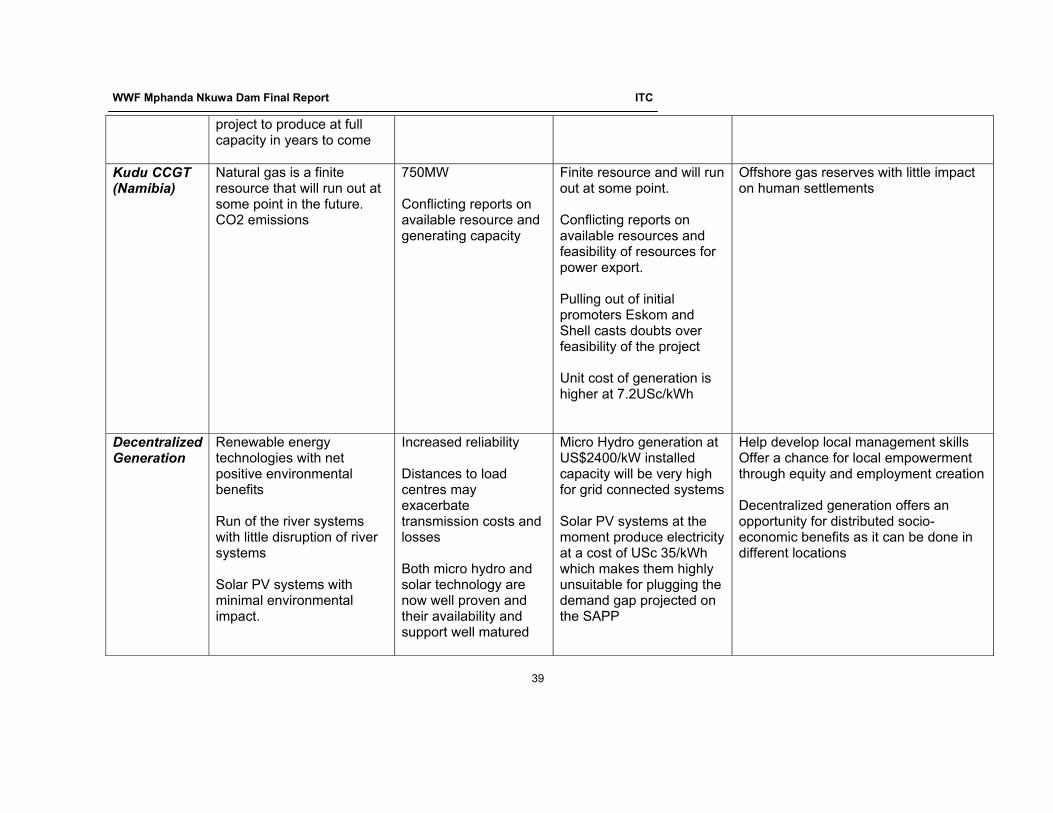
project to produce at full capacity in years to come
Kudu CCGT (Namibia)
Natural gas is a finite resource that will run out at some point in the future. CO2 emissions
750MW Conflicting reports on available resource and generating capacity
Finite resource and will run out at some point. Conflicting reports on available resources and feasibility of resources for power export. Pulling out of initial promoters Eskom and Shell casts doubts over feasibility of the project Unit cost of generation is higher at 7.2USc/kWh
Offshore gas reserves with little impact on human settlements
Decentralized Generation
Renewable energy technologies with net positive environmental benefits Run of the river systems with little disruption of river systems Solar PV systems with minimal environmental impact.
Increased reliability Distances to load centres may exacerbate transmission costs and losses Both micro hydro and solar technology are now well proven and their availability and support well matured
Micro Hydro generation at US$2400/kW installed capacity will be very high for grid connected systems Solar PV systems at the moment produce electricity at a cost of USc 35/kWh which makes them highly unsuitable for plugging the demand gap projected on the SAPP
Help develop local management skills Offer a chance for local empowerment through equity and employment creation Decentralized generation offers an opportunity for distributed socio-economic benefits as it can be done in different locations
WWF Mphanda Nkuwa Dam Final Report ITC
40
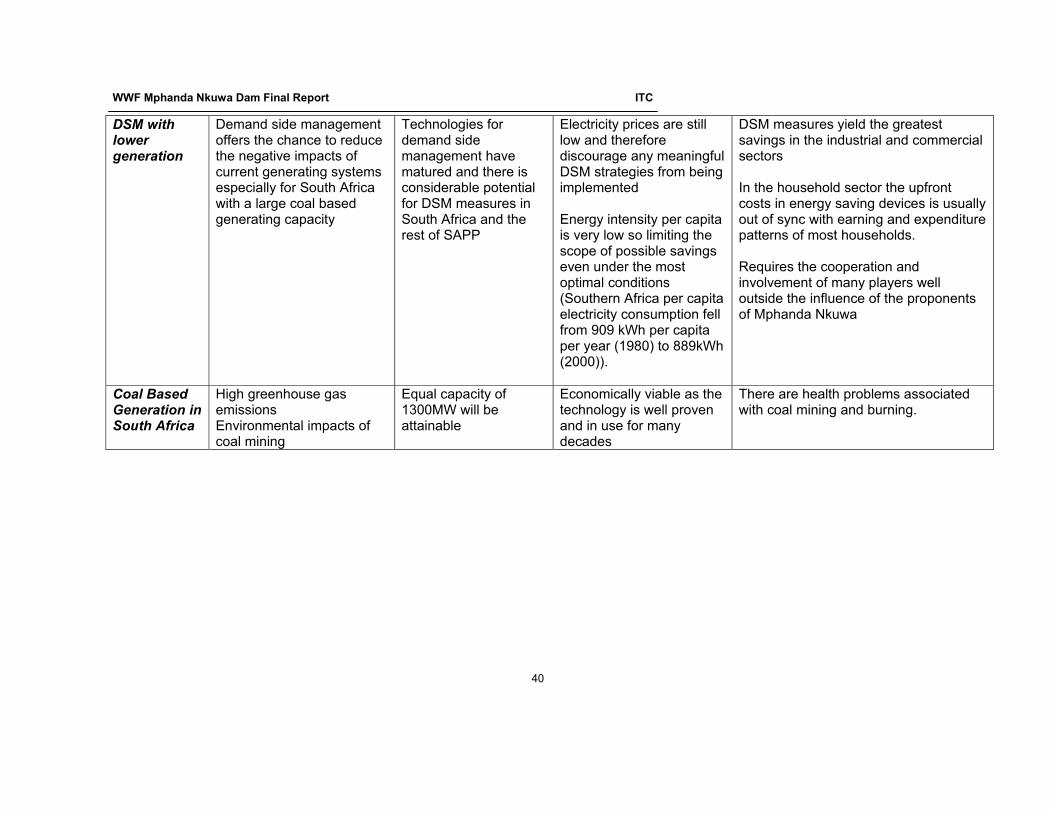
DSM with lower generation
Demand side management offers the chance to reduce the negative impacts of current generating systems especially for South Africa with a large coal based generating capacity
Technologies for demand side management have matured and there is considerable potential for DSM measures in South Africa and the rest of SAPP
Electricity prices are still low and therefore discourage any meaningful DSM strategies from being implemented Energy intensity per capita is very low so limiting the scope of possible savings even under the most optimal conditions (Southern Africa per capita electricity consumption fell from 909 kWh per capita per year (1980) to 889kWh (2000)).
DSM measures yield the greatest savings in the industrial and commercial sectors In the household sector the upfront costs in energy saving devices is usually out of sync with earning and expenditure patterns of most households. Requires the cooperation and involvement of many players well outside the influence of the proponents of Mphanda Nkuwa
Coal Based Generation in South Africa
High greenhouse gas emissions Environmental impacts of coal mining
Equal capacity of 1300MW will be attainable
Economically viable as the technology is well proven and in use for many decades
There are health problems associated with coal mining and burning.
WWF Mphanda Nkuwa Dam Final Report ITC
41
6 Option Selection
6.1 Factors
The feasibility study for Mphanda Nkuwa shows that in Mozambique the project is the most
economically viable among the currently available options along the Zambezi River. Coal based
generation at Moatize and possible gas fired generation using gas from the Temane and Pande
fields were not analysed as the amount of reserves and their lifespan were not fully known at the
time of this study.
On a regional scale, the parameters for comparison and recommending of one option over the
other become more complex as political and other non-conventional factors affect the
assessment. Although countries jointly subscribe to supplying power to each other at reasonable
price and reliability, recent political events in Zimbabwe and their impact on national and
international relations point to security of supply being guaranteed only when the source of
power is physically within a government's control.
Some of the alternative electricity options on a regional scale will have differences in appeal to
electricity users and power producers. Demand side management is highly unlikely to be
attained in Zimbabwe where electricity prices are still very low and price adjustments carry a
heavy political penalty. Generally across the region, per capita consumption of electricity at
approximately 900kWh per year is very low to provide meaningful savings from demand side
management.
Decentralized generation while a very attractive proposal will be severely limited by the differing
government policies and absence of a mature regulatory capacity for such options in the country.
This is in view of the short horizon between now and when power deficits are projected to set in.
After considering all the above factors, Mphanda Nkuwa is viewed as a technically viable
proposition. That is not to suggest that it is without serious problems. The scheme, despite
100km2 of inundated area29, will be managed as a run of river scheme, as there will be
insufficient storage in the reservoir to alter seasonal flow patterns, so daily outflow should equal 29 The existing river channel of the Zambezi between Mphanda Nkuwa and Cahora Bassa, and on the Luia river from its confluence for about 18 km upstream would be inundated by impoundment. These sections constitute almost all the remaining bedrock gorge sections of the middle Zambezi river and its perennial tributaries. (MN EIA, Impacts of Impoundment)
WWF Mphanda Nkuwa Dam Final Report ITC
42
daily inflow. Normally a run of river scheme means that environmental impacts are limited, but in
this case there is the potential for environmental problems, given the size of the inundated area
and the existing streamflow problems created by Cahora Bassa.
A major problem is that the project is proposed in a context where large hydro is generally
perceived to have delivered national benefits, whilst communities and some industries have paid
the price of adverse environmental impacts, such as the fishing and shrimp industry in the
Zambezi Delta. To that end the key concerns are not around its technical feasibility but rather
how its socio-economic and environmental implications fit in the described national context as
well as a global context where major funders and civil society are generally sceptical of its
impacts and their management.

WWF Mphanda Nkuwa Dam Final Report ITC
43
7 Key Issues to be addressed on Mphanda Nkuwa
7.1 Technical Issues
Cahora Bassa is currently operating in base load only and therefore not providing optimal returns
for the investors. This is a requirement induced by the need to control water level fluctuations
and daily floods downstream of the scheme. The implementation of Mphanda Nkuwa should
allow for greater regulation of river flow between Cahora Bassa and Mphanda Nkuwa enabling
HCB to operate in mid merit and peak mode. This will enhance the value of the energy
generated from Cahora Bassa South. It is estimated that about 20% of the benefits from the
development of Mphanda Nkuwa derive from uplift in the value of energy generated at Cahora
Bassa South rather than generation at Mphanda Nkuwa itself, as shown in Table 7.1. It will then
also allow the development of Cahora Bassa North at an additional capacity of 850MW.
Table 7.1: Financial Parameters for Mphanda Nkuwa
Item Mphanda Nkuwa [1300MW]
Cahora Bassa North [850MW]
NPV of Benefits (Euro Million) 212 -45
NPV of Benefits arising at Cahora Bassa South
due to changed flow regime( Euro Million)
55
NPV Total Benefits Euro Million 263 -45
Cost Euro Million (2001 projection) 1841 829
Source: Mphanda Nkuwa and Cahora Bassa North Project Feasibility Study, LI-EDF-KP, 2002
7.2 Social Issues
The project has the following implications in terms of social impacts:
• The proposed project will displace 260 households comprising of about 1400 people in the
area to be impounded. The relocation and fair compensation of these groups is still a
controversial issue. With the differences in bargaining power and resource leverage it is
unlikely that those relocated will have a strong voice in demanding their rights and
entitlements. It is important that the resettlement is the outcome of a process of negotiated
agreements and commitments but the feasibility report does not indicate any attempt to
have informed and negotiated settlements. The logic seems to be that detailed studies will
WWF Mphanda Nkuwa Dam Final Report ITC
44
be made once the government gives its approval and identified a potential investor who will
then undertake their own assessment and consultation process. The issue of fair
compensation for the displaced communities will be a determinant on public opinion. It will
be a lot easier to gain investor confidence if the project has widespread public good will and
acceptance. This requires a wide consultation process through which the pros and cons of
the project are publicly debated, social mitigation measures devised and a monitoring
framework developed. The government is wary of the high expectations such a process
might generate and the ensuing political pressure. It is highly unlikely that this would be
done in the immediate future or until after the elections in the last quarter of 2004. The lack
of such a wide consultation process may induce potential developers to invest in abetting
public rejection rather than gaining genuine acceptance.
• For decades the livelihood security for the people in the lower Zambezi has consisted of a
dual agricultural system in which the highland area is utilized for rain fed agriculture and the
lower flood plains are cultivated in the dry season to supplement the summer produce
especially in drought years when the highland crop has failed. Recent events in 2000
showed that the people in the lower Zambezi valley are vulnerable to large floods that are
not helped by dams. River regulation since the construction of the Cahora Bassa has
apparently encouraged settlement on floodplains, and has also reduced the productivity of
these areas. Flood recession farming was especially important in drought years when
upland crops failed. With regulation, high land on the floodplain is now rarely flooded and
soil fertility has declined, while low-lying areas are permanently inundated and can no
longer be farmed. In addition, fish stocks are no longer concentrated by low base flows at
the end of the dry season so that fishing at certain times is less productive. The chronic
food insecurity that now afflicts tens of thousands of people living in the riparian districts of
Morrumbala, Mopeia, Mutarara, Caia and Chinde may be the outcome. Mphanda Nkuwa
will further complicate this, as the communities that are within a 70km radius downstream of
the dam, will be subject to increased river levels of up to half a metre which will
permanently flood some of the currently cultivated flood plain plots.
• The process followed so far in the feasibility study has been criticised for lack of
meaningful engagement with the groups affected. Although in general many organizations
that have interacted with the people have indicated that an overwhelming majority supports
the project, no sufficient effort has been made to incorporate the lessons from the
implementation of Cahora Bassa and its associated social problems. This is more pertinent
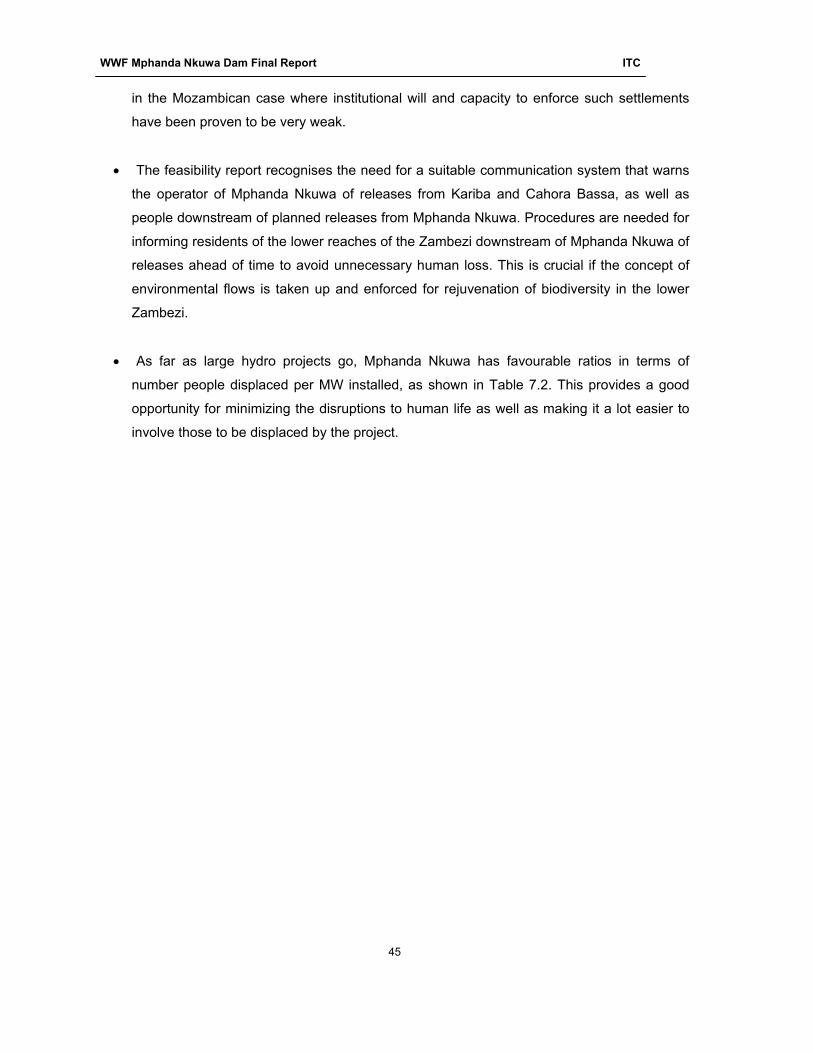
WWF Mphanda Nkuwa Dam Final Report ITC
45
in the Mozambican case where institutional will and capacity to enforce such settlements
have been proven to be very weak.
• The feasibility report recognises the need for a suitable communication system that warns
the operator of Mphanda Nkuwa of releases from Kariba and Cahora Bassa, as well as
people downstream of planned releases from Mphanda Nkuwa. Procedures are needed for
informing residents of the lower reaches of the Zambezi downstream of Mphanda Nkuwa of
releases ahead of time to avoid unnecessary human loss. This is crucial if the concept of
environmental flows is taken up and enforced for rejuvenation of biodiversity in the lower
Zambezi.
• As far as large hydro projects go, Mphanda Nkuwa has favourable ratios in terms of
number people displaced per MW installed, as shown in Table 7.2. This provides a good
opportunity for minimizing the disruptions to human life as well as making it a lot easier to
involve those to be displaced by the project.
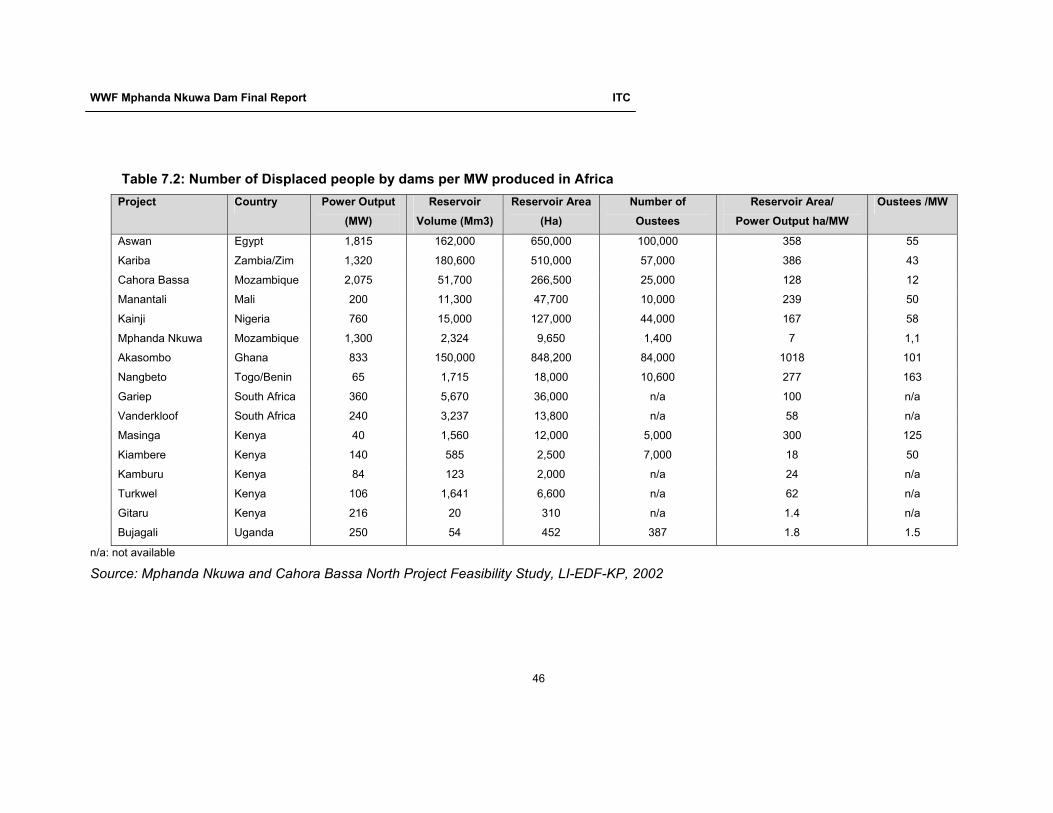
WWF Mphanda Nkuwa Dam Final Report ITC
46
Table 7.2: Number of Displaced people by dams per MW produced in Africa Project Country Power Output
(MW) Reservoir
Volume (Mm3) Reservoir Area
(Ha) Number of Oustees
Reservoir Area/ Power Output ha/MW
Oustees /MW
Aswan Egypt 1,815 162,000 650,000 100,000 358 55
Kariba Zambia/Zim 1,320 180,600 510,000 57,000 386 43
Cahora Bassa Mozambique 2,075 51,700 266,500 25,000 128 12
Manantali Mali 200 11,300 47,700 10,000 239 50
Kainji Nigeria 760 15,000 127,000 44,000 167 58
Mphanda Nkuwa Mozambique 1,300 2,324 9,650 1,400 7 1,1
Akasombo Ghana 833 150,000 848,200 84,000 1018 101
Nangbeto Togo/Benin 65 1,715 18,000 10,600 277 163
Gariep South Africa 360 5,670 36,000 n/a 100 n/a
Vanderkloof South Africa 240 3,237 13,800 n/a 58 n/a
Masinga Kenya 40 1,560 12,000 5,000 300 125
Kiambere Kenya 140 585 2,500 7,000 18 50
Kamburu Kenya 84 123 2,000 n/a 24 n/a
Turkwel Kenya 106 1,641 6,600 n/a 62 n/a
Gitaru Kenya 216 20 310 n/a 1.4 n/a
Bujagali Uganda 250 54 452 387 1.8 1.5
n/a: not available
Source: Mphanda Nkuwa and Cahora Bassa North Project Feasibility Study, LI-EDF-KP, 2002
WWF Mphanda Nkuwa Dam Final Report ITC
47
7.3 Environmental Issues
Mphanda Nkuwa is projected as a run of the river scheme with little retention of
water. Key environmental issues to be addressed on the project include:
• Mphanda Nkuwa is currently proposed to generate with an allowance for a
0.5m daily river level fluctuation. This has the effect of flooding some
floodplain "paddies" currently used for small scale subsistence agriculture
during the dry season.
• There is overwhelming evidence that the absence of environmental flow
releases from the Cahora Bassa Dam has seriously affected the biodiversity
and productivity of the Zambezi Delta. The effect of river regulation on fish
and shrimp production and catches on the lower Zambezi has been adverse.
The implementation of the project will see even lower peak floods and higher
base flows in the lower Zambezi seriously affecting the habitat patterns for
riverine production systems especially fish and shrimp.
The impact of regulation on fish stocks and fishing in the lower Zambezi valley is unknown.
Floodplain fisheries comprise some of the most productive available but are dependent upon
the annual flood and drawdown for their maintenance. There can be little doubt that, with
reduced flooding and higher base flows, the fisheries of the lower Zambezi river would have
declined.
Similarly, the shrimp catch on the Sofala Bank, off the Zambezi river mouth, is related to river
discharge. The number caught per hour is positively correlated with monthly discharge at
Tete, as is annual catch with annual runoff. Catches declined from 10,000 – 12,000 tons in
1974-76 to 8000 tons in 1983 and 7900 tons in 1998. By redistributing discharge from Cahora
Bassa to increase flows in the period December – March, Gammelsrød (1992) estimated that
the catch per unit effort could be increased by about 20%, or 1 500 tonnes per year. The
catch is mainly comprised of three species – Penaeus indicus (48 %), Metapenaeus
monocerus (42 %) and Penaeus monodon (10 %). Present market values in Mozambique
range from 5.1 – 8.7, 2.5 – 4.8, and 8.7 – 12.7 USD/kg respectively, depending on the size of
shrimp (pers. com. Entroposto Frigorifico de Pesca de Mozambique Lda.). Assuming mid-
price values for each species and an overall value based on the proportion of species in the
total catch, shrimp is worth about 6 USD/kg, or 6.7 EUR/kg. The annual benefit from
improving river flows could therefore be in the order of 9 million USD (10 million EUR).
Source: Mphanda Nkuwa and Cahora Bassa North Project Feasibility Study, LI-EDF-KP,
2002

WWF Mphanda Nkuwa Dam Final Report ITC
48
The contradiction in the excerpt above shows perhaps the reluctance by the
proponents to admit the impacts of the proposed project. The report starts by
stating that " the impacts of river regulation are unknown.." and then immediately
afterwards details the evidence of reduction in fish and shrimp catch as being
directly affected by levels of river discharge.
• Implementation of Mphanda Nkuwa offers an opportunity for greater regulation
to mimic natural flow patterns and rejuvenate the delta. However this is only true
if the current environmental enforcement rules begin to function fully with clear
penalties for default. The excerpt above shows the need for stronger
environmental enforcement and compliance.
• Reduced sediment transport is responsible for decline in mangrove growth in
the delta.
• Construction of Mphanda Nkuwa will retain more sediment and dam
management will need to take this into consideration.
It is important to note that the majority of the environmental impacts raised above
are reversible or avoidable in the long term if a strict dam management regime is
followed. To that end it is difficult to determine beforehand what the true
environmental cost of this intervention will be as it depends mostly on the will of the
developer to implement mitigation measures as well as the government capacity to
apply and enforce the necessary regulations.
Hydropower sales from Cahora Bassa South are currently valued at about 200 million USD
per year (215 million EUR) (EIA Working Document 7). The cost of an 8 % loss in hydropower
sales due to an environmental flow release would be in the order of 16 million USD per year
(17 million EUR). The benefit to poverty alleviation through improved food security in the
lower Zambezi valley, and from increased export sales of shrimp, could well exceed this
figure. Investment in either Mphanda Nkuwa or Cahora Bassa North would increase the costs
and reduce the likelihood of environmental flow releases in future.
Source: Mphanda Nkuwa and Cahora Bassa North Project Feasibility Study, LI-EDF-KP,
2002
The above excerpt is key for all the environmental arguments for more caution and
control if the project is to be implemented. For environmental concerns to be
assuaged, the developers of Mphanda Nkuwa have to forego 17 million Euros per
year in possible income! This is the core of why it is perhaps unlikely that investors
WWF Mphanda Nkuwa Dam Final Report ITC
49
would do this. What will be the penalty for not abiding with this requirement? It will
certainly not be in the same order of magnitude. It is therefore within reason to
expect that the operator will do a cost benefit analysis and if the direct cost of
compliance is higher than non-compliance then the chances get even slimmer for the
environmental concerns to be addressed.
Although the feasibility report concedes that these costs may very well be
outweighed by the economic benefits of poverty alleviation that would accrue if the
proper practice is followed, there is no firm commitment towards enforcing this
particular requirement. This is the weakest point in the project design. It requires a
strong and functional regulatory function to be able to enforce the desired results on
poverty alleviation. The failure to enforce many of the agreed environmental
management measures for Cahora Bassa throws into doubt any suggestions that the
government will be able to enforce rules on the developers for the Mphanda Nkuwa
project.
To illustrate this point the report mentions a short survey to gauge the attitudes of the
local population to these river flow conditions which indicated " broad approval
amongst the population of river conditions". The survey was limited to a 60 km
stretch between Mphanda Nkuwa and Tete City despite the fact that the effects of
diurnal river level variation are estimated to have an impact for as long as 300km.
The report does accept that there is need for a more detailed survey of attitudes for
the whole stretch of the river, and on the impacts the river variations will have on river
based and river bank activities. Although positive in its outlook, the recommendation
is likely to be overlooked by the fact that the consultants have already recommended
to the government an operation regime based on the 0.5m river fluctuation at Tete
and all economic calculation is based on this. Any consultation at any stage after this
is unlikely to be objective as the main motive would be to "authenticate" a proposed
position rather than seek the best solution. This is because the chances are very slim
that the decision or recommendation of a 0.5m river ripple would be reversed after a
survey of attitudes. The idea that the government of Mozambique equity will be
financed from part of the benefits accruing from allowing a new river regulation
regime (0.5m fluctuation at Tete) looks more like an attempt to ensure that this
condition is adopted without much consideration.

WWF Mphanda Nkuwa Dam Final Report ITC
50
In summary, with no major changes to the regulatory environment in Mozambique, it
is unlikely that the environmental management measures would be adhered to, as
there is no precedent to support that. Negotiation of environmental management
requirements as part of the licensing and financing package may help but it still
requires a strong, competent regulator to be able to challenge bad practice and
enforce performance. It is likely that Mphanda Nkuwa will be developed by large
multinational energy companies whose annual budget may equal or even dwarf the
national budget for Mozambique. This power imbalance may militate against impartial
regulation of the operation of the scheme.
7.3.1 Greenhouse Gas Emissions
The carbon emissions that would occur as a result of implementing the Mphanda
Nkuwa hydropower project are a key factor in determining its environmental impact
and benefit, compared to the energy alternatives.
Below is an extract from the Mphanda Nkuwa EIA.
The World Bank recommends adopting a stock- rather than a flow approach when annual
carbon flux data are not available and the timing of CO2 impacts is not important. The stock
approach assumes that any change in terrestrial carbon stocks represents an equal and
opposite change in atmospheric carbon, in the form of CO2.
Carbon stocks in the reservoir area are likely to change with or without the project. By
measuring the difference between the with- and without project options at the end of the
accounting period, the project’s total CO2 impact can be measured. At present, about 80 % of the land outside the river channel in the reservoir area (i.e. 56 km2)
is woodland and 20 % (i.e. 14 km2) is cultivated or recent fallow land. The river channel
extends to about 30 km2. Total system carbon in miombo woodland in Zimbabwe and dry
thorn savanna in South Africa is estimated to be in the range 7.6 - 9.7 kg m-2 (Woomer and
Swift, 1994). Most is found in the soil. The conversion of woodland to dryland farming reduces
the amount of carbon in the system by perhaps half. A value of 8 kg C /m2 is therefore
assumed for the woodland, and 4 kg C /m2 for cropped and fallow areas. Total carbon in the
reservoir area at present is therefore estimated to be about 504,000 t.
In the absence of the project, the reservoir area would continue to be subject to a regime of
shifting cultivation. Trends in carbon stocks are unknown and as no data exists it is assumed
that stocks would remain constant over the next 100 years with the no-project option.
With the project, it is assumed that carbon sequestration would end with inundation of the
reservoir area and that by the end of the accounting period no carbon stock would remain. As
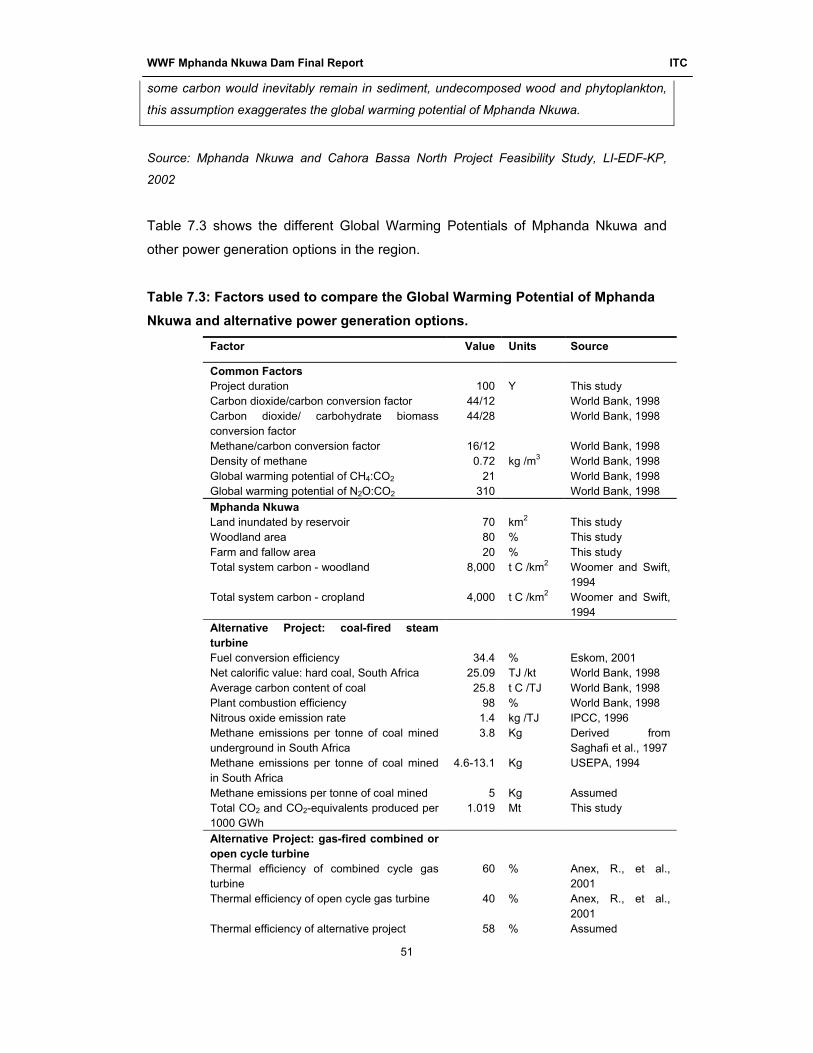
WWF Mphanda Nkuwa Dam Final Report ITC
51
some carbon would inevitably remain in sediment, undecomposed wood and phytoplankton,
this assumption exaggerates the global warming potential of Mphanda Nkuwa.
Source: Mphanda Nkuwa and Cahora Bassa North Project Feasibility Study, LI-EDF-KP,
2002
Table 7.3 shows the different Global Warming Potentials of Mphanda Nkuwa and
other power generation options in the region.
Table 7.3: Factors used to compare the Global Warming Potential of Mphanda Nkuwa and alternative power generation options.
Factor Value Units Source
Common Factors Project duration 100 Y This study Carbon dioxide/carbon conversion factor 44/12 World Bank, 1998 Carbon dioxide/ carbohydrate biomass conversion factor
44/28 World Bank, 1998
Methane/carbon conversion factor 16/12 World Bank, 1998 Density of methane 0.72 kg /m3 World Bank, 1998 Global warming potential of CH4:CO2 21 World Bank, 1998 Global warming potential of N2O:CO2 310 World Bank, 1998 Mphanda Nkuwa Land inundated by reservoir 70 km2 This study Woodland area 80 % This study Farm and fallow area 20 % This study Total system carbon - woodland 8,000 t C /km2 Woomer and Swift,
1994 Total system carbon - cropland 4,000 t C /km2 Woomer and Swift,
1994 Alternative Project: coal-fired steam turbine Fuel conversion efficiency 34.4 % Eskom, 2001 Net calorific value: hard coal, South Africa 25.09 TJ /kt World Bank, 1998 Average carbon content of coal 25.8 t C /TJ World Bank, 1998 Plant combustion efficiency 98 % World Bank, 1998 Nitrous oxide emission rate 1.4 kg /TJ IPCC, 1996 Methane emissions per tonne of coal mined underground in South Africa
3.8 Kg Derived from Saghafi et al., 1997
Methane emissions per tonne of coal mined in South Africa
4.6-13.1 Kg USEPA, 1994
Methane emissions per tonne of coal mined 5 Kg Assumed Total CO2 and CO2-equivalents produced per 1000 GWh
1.019 Mt This study
Alternative Project: gas-fired combined or open cycle turbine Thermal efficiency of combined cycle gas turbine
60 % Anex, R., et al., 2001
Thermal efficiency of open cycle gas turbine 40 % Anex, R., et al., 2001
Thermal efficiency of alternative project 58 % Assumed
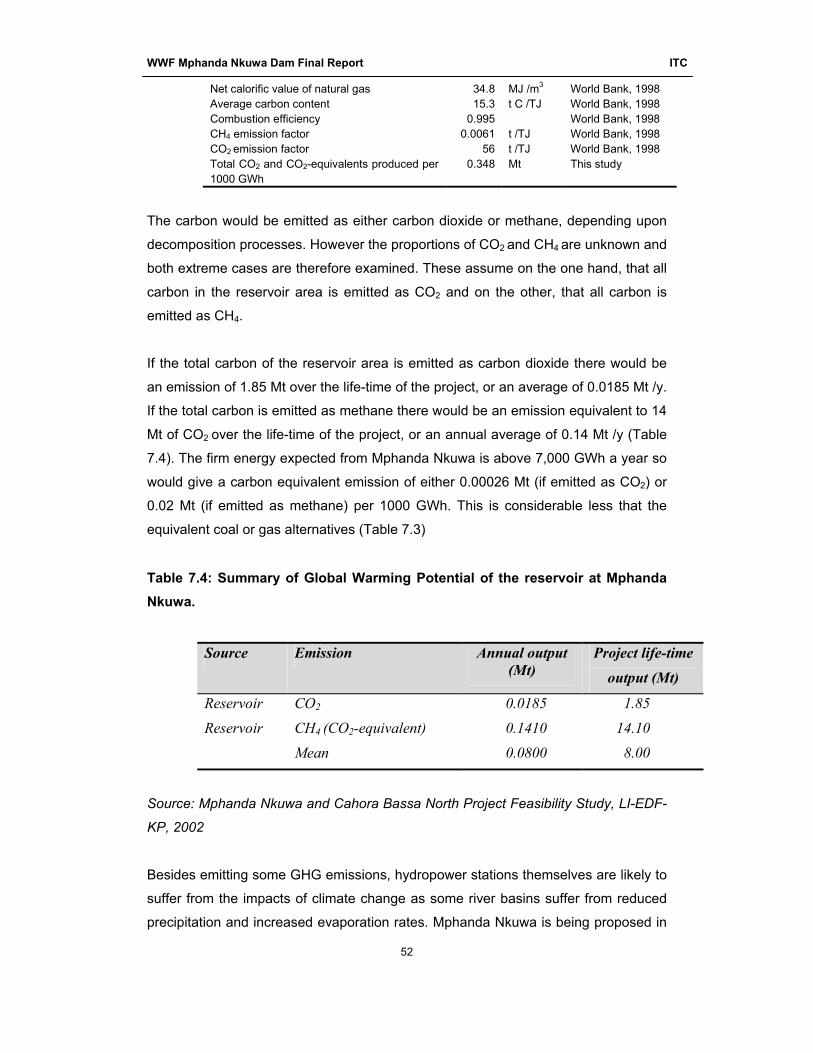
WWF Mphanda Nkuwa Dam Final Report ITC
52
Net calorific value of natural gas 34.8 MJ /m3 World Bank, 1998 Average carbon content 15.3 t C /TJ World Bank, 1998 Combustion efficiency 0.995 World Bank, 1998 CH4 emission factor 0.0061 t /TJ World Bank, 1998 CO2 emission factor 56 t /TJ World Bank, 1998 Total CO2 and CO2-equivalents produced per 1000 GWh
0.348 Mt This study
The carbon would be emitted as either carbon dioxide or methane, depending upon
decomposition processes. However the proportions of CO2 and CH4 are unknown and
both extreme cases are therefore examined. These assume on the one hand, that all
carbon in the reservoir area is emitted as CO2 and on the other, that all carbon is
emitted as CH4.
If the total carbon of the reservoir area is emitted as carbon dioxide there would be
an emission of 1.85 Mt over the life-time of the project, or an average of 0.0185 Mt /y.
If the total carbon is emitted as methane there would be an emission equivalent to 14
Mt of CO2 over the life-time of the project, or an annual average of 0.14 Mt /y (Table
7.4). The firm energy expected from Mphanda Nkuwa is above 7,000 GWh a year so
would give a carbon equivalent emission of either 0.00026 Mt (if emitted as CO2) or
0.02 Mt (if emitted as methane) per 1000 GWh. This is considerable less that the
equivalent coal or gas alternatives (Table 7.3)
Table 7.4: Summary of Global Warming Potential of the reservoir at Mphanda Nkuwa.
Source Emission Annual output (Mt)
Project life-time output (Mt)
Reservoir CO2 0.0185 1.85
Reservoir CH4 (CO2-equivalent) 0.1410 14.10
Mean 0.0800 8.00
Source: Mphanda Nkuwa and Cahora Bassa North Project Feasibility Study, LI-EDF-
KP, 2002
Besides emitting some GHG emissions, hydropower stations themselves are likely to
suffer from the impacts of climate change as some river basins suffer from reduced
precipitation and increased evaporation rates. Mphanda Nkuwa is being proposed in
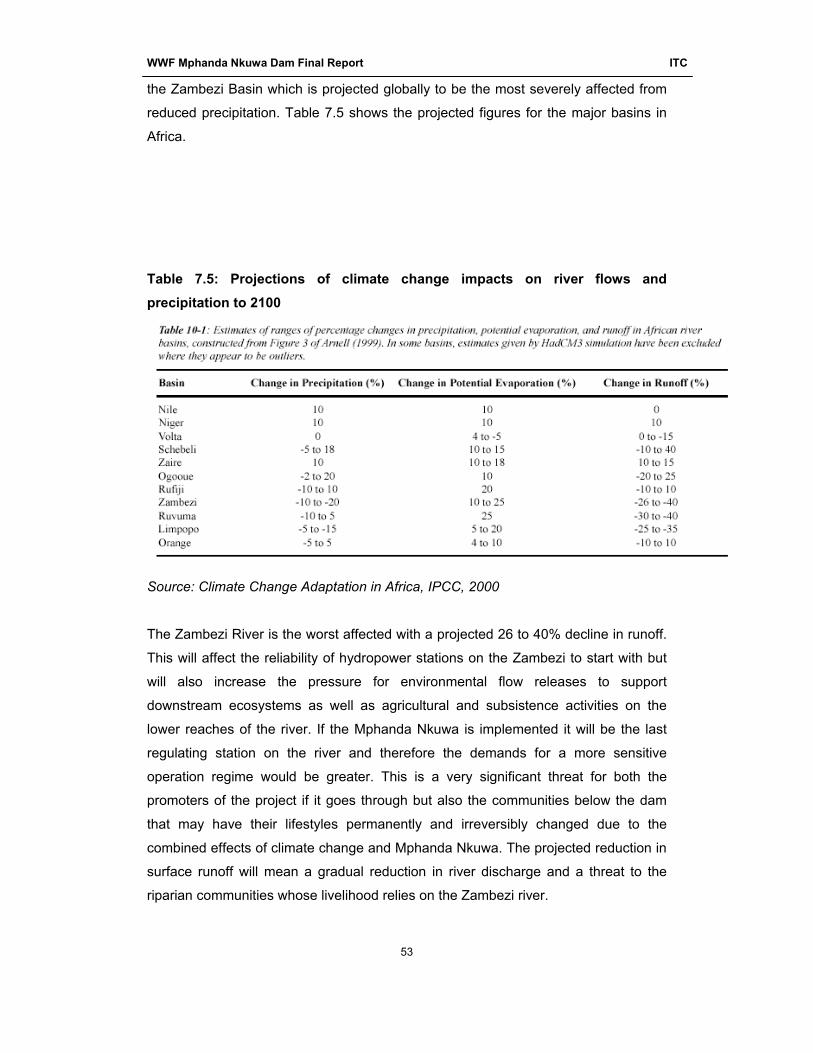
WWF Mphanda Nkuwa Dam Final Report ITC
53
the Zambezi Basin which is projected globally to be the most severely affected from
reduced precipitation. Table 7.5 shows the projected figures for the major basins in
Africa.
Table 7.5: Projections of climate change impacts on river flows and precipitation to 2100
Source: Climate Change Adaptation in Africa, IPCC, 2000
The Zambezi River is the worst affected with a projected 26 to 40% decline in runoff.
This will affect the reliability of hydropower stations on the Zambezi to start with but
will also increase the pressure for environmental flow releases to support
downstream ecosystems as well as agricultural and subsistence activities on the
lower reaches of the river. If the Mphanda Nkuwa is implemented it will be the last
regulating station on the river and therefore the demands for a more sensitive
operation regime would be greater. This is a very significant threat for both the
promoters of the project if it goes through but also the communities below the dam
that may have their lifestyles permanently and irreversibly changed due to the
combined effects of climate change and Mphanda Nkuwa. The projected reduction in
surface runoff will mean a gradual reduction in river discharge and a threat to the
riparian communities whose livelihood relies on the Zambezi river.
WWF Mphanda Nkuwa Dam Final Report ITC
54
7.4 Political issues
Mphanda Nkuwa is promoted as a private sector development with government
offering fiscal incentives and light handed regulation to promote investment. Specific
project development companies are envisaged for the implementation of the project.
Separate entities are proposed for the generation and transmission components of
the project.
The Government of Mozambique will retain nominal shareholding to mitigate political
risk.
There is little room envisaged for local community involvement but the feasibility
report recognises the need for compensation to be based on four principles:
• Recognition of rights of affected parties
• Entitlements of affected parties should be mutually agreed
• Standard of living of resettled must improve
• Livelihood options should be available and sustainable
There is need for an explicit role for civil society involvement in negotiating the
compensation packages for the displaced communities. While the principles sound
plausible experience suggests that there is need for a stronger representation if
these principles are to be applied.
7.5 Economic Issues
A financial analysis has already been discussed in previous sections but there are
some other economic issues that have a bearing on this project. The project comes
under the Zambezi Valley Authority which offers an incentive package for investing in
the valley as an economic corridor (as outlined in the Government Decree No 16/98).
The decree gives exemption and reduction of import duties and taxation for specific
sectors of economic activity, which include production, transportation and distribution
of electric power. The decree establishes a special fiscal and customs regime until
2025 and, for projects that are established while the special regime is in force will
benefit for at least 10 years after this. It also exempts import duties, circulation taxes
and provides for a five year corporate tax exemption from start of operations and an
WWF Mphanda Nkuwa Dam Final Report ITC
55
80% reduction in corporate profit tax starting from the sixth year of operation.
Flexibility in foreign dividend repatriation is also guaranteed.
The Government of Mozambique therefore will get its revenues from the proposed
development through corporate income tax and water rights.
The total project cost estimated at about $2 billion is a very significant investment
that will send a message about the competitiveness of Mozambique as an
investment destination. In this perceived strength lies the weak point for the
government. Previous experience with such mega investments indicates that they
have done little to improve the fiscal resources. It is the structuring of the agreements
at inception that requires careful scrutiny, and for which the capacity to do this in
Mozambique is still in its infancy.
With these incentives and past experience (especially with the Hydro Cahora Bassa),
the main economic issue to be addressed is what will be the net benefit to
Mozambique of this intervention. There is no doubt that it will stimulate economic
activity especially during its construction phase through services and products from
support industries and labour demands. However this must be considered alongside
the current discussion on HCB that shows that Mozambique is not benefiting at all in
real terms from electricity exports to South Africa mainly due to an unfavourable
power purchase agreement.
7.6 Net Benefit Analysis
Several studies have been conducted on the loss of revenue due to declining fish
and shrimp catches on the lower Zambezi. Some current arguments are that these
are the effects of HCB and therefore external to the analysis of the impact of
Mphanda Nkuwa. If the current flow release patterns continue, the loss of income
from shrimp industry is estimated at 250 million euro over the next 30 years
(Hoguane, The role of Zambezi runoff in the shrimp abundance in Sofala Bank).
There is no information currently available about the economic value lost due to loss
of flood plain irrigation.
The net benefit of the project to Mozambique is a complicated parameter to
determine but there are some indicators that are useful. Cases in Mozambique such
WWF Mphanda Nkuwa Dam Final Report ITC
56
as Mozal and Hydro Cahora Bassa are showing that such mega projects give little
overall economic contribution to Mozambique. In a meeting on the Poverty Reduction
Strategy Paper (PRSP) review the government decided to develop a framework for
future mega projects to increase social and economic benefits. The agreed position
by major donors including the World Bank is that the mega projects have had low
positive net benefit to the country.
Clearly the implementation of this project is as much a statement of the government's
commitment to attract foreign direct investment as it is about meeting the regional
energy demands. This further complicates the analysis. As part of the support to
Mozambican government, the World Bank will provide funds for the development of
an analytical framework for the assessment of the net benefits of mega projects.
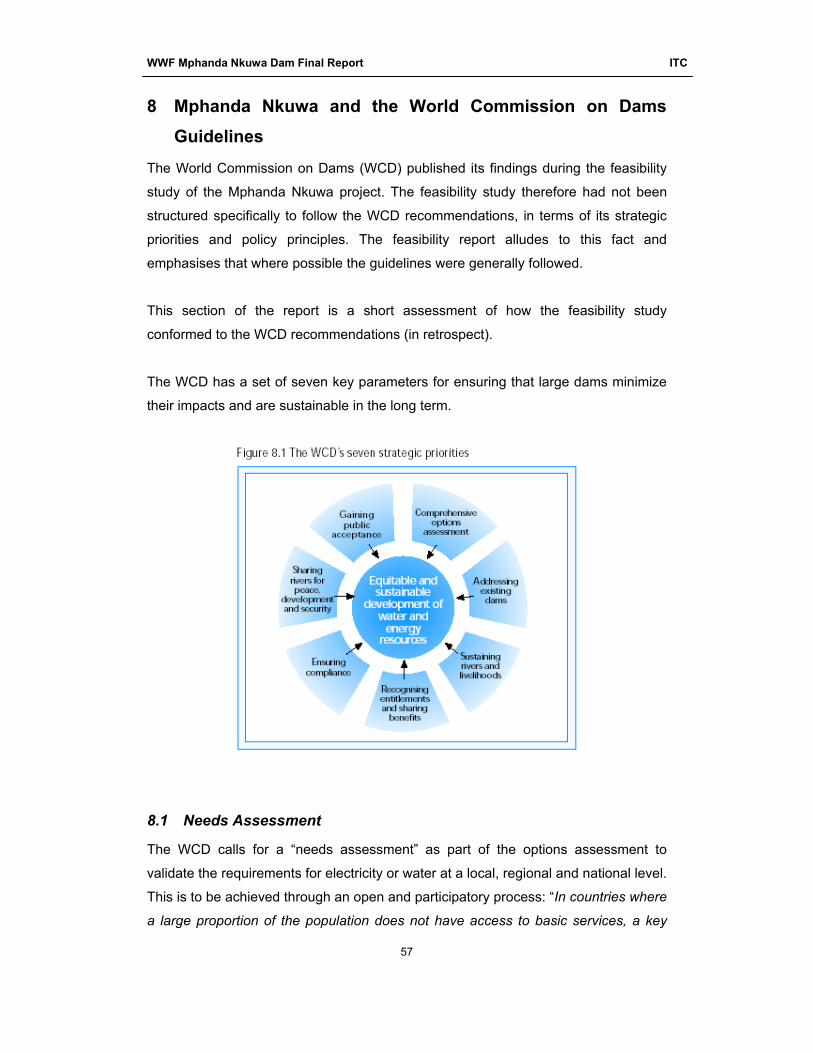
WWF Mphanda Nkuwa Dam Final Report ITC
57
8 Mphanda Nkuwa and the World Commission on Dams Guidelines
The World Commission on Dams (WCD) published its findings during the feasibility
study of the Mphanda Nkuwa project. The feasibility study therefore had not been
structured specifically to follow the WCD recommendations, in terms of its strategic
priorities and policy principles. The feasibility report alludes to this fact and
emphasises that where possible the guidelines were generally followed.
This section of the report is a short assessment of how the feasibility study
conformed to the WCD recommendations (in retrospect).
The WCD has a set of seven key parameters for ensuring that large dams minimize
their impacts and are sustainable in the long term.
8.1 Needs Assessment
The WCD calls for a “needs assessment” as part of the options assessment to
validate the requirements for electricity or water at a local, regional and national level.
This is to be achieved through an open and participatory process: “In countries where
a large proportion of the population does not have access to basic services, a key
WWF Mphanda Nkuwa Dam Final Report ITC
58
parameter in the validation process should be the extent to which basic human needs
will be met.”
In the case of Mphanda Nkuwa, public verification of the needs for energy services at
the national or local level is not known to have taken place. Currently there is no
national need for so much grid-based power (the dam is expected to produce
1300MW). The Mphanda Nkuwa Feasibility Study touches on the needs for electricity
at the local level through its description of the area’s economic and social situation.
The situation in Mozambique is that less than 5% of the population has access to
electricity, and most of those without access are rural people far from the national
grid. It is clear the Mozambique needs to prioritise decentralized rural electrification
rather than large-scale grid-based power.
Various organizations and sector specialists (Dr Hoguane, Professor Cuamba,
Livaningo personal communication during interviews) in Mozambique agree that the
project will not address the basic needs of people in the short term. Unrelated to the
specific project, several studies have shown that food security is the primary need of
many poor households in Mozambique, not electricity. What energy projects can do
is to help establish a firm base for supporting future economic growth. There is
however no pretence on the part of the promoters that the project will address basic
needs. It is clearly a project with an export orientation designed to take advantage of
the country's natural resources, the regions projected energy scenarios in the near
future and as part of a process of regional economic cooperation.
WWF Mphanda Nkuwa Dam Final Report ITC
59
8.2 Comprehensive Options assessment
Options assessment for the proposed Mphanda Nkuwa Project did not necessarily
follow the WCD recommendations as these were only published after the feasibility
study had already commenced. An analysis of the available literature on the project
provided the following insights regarding options assessment.
“Development needs objectives are clearly formulated through an open and
participatory process before the identification and assessment of options for water
and energy resource development.” (WCD 6.1.1)
In the Mozambican case development needs at a national and provincial scale are
well documented. These have been arrived at through research, surveys and
consultations. The government of Mozambique believes that the hydropower
potential on the Zambezi river is a vital resource for meeting future national energy
needs as well as export to regional markets.

WWF Mphanda Nkuwa Dam Final Report ITC
60
“Planning approaches that take into account the full range of development objectives
are used to assess all policy, institutional, management and technical options before
the decision is made to proceed with any programme or project.” (WCD 6.1.2)
The WCD states, “a multi-criteria assessment should be used to screen and select
preferred options from the full range of identified alternatives”. The project should
also “ensure that available alternatives, their relevant consequences and
uncertainties are given full consideration” and that the “rejection of any options was
explained in an open and timely manner”. The WCD also recommends inclusion of
demand-side management within the options assessed and the possible effects of
flawed demand forecast for the sector. Cumulative impacts and the application of the
precautionary approach are also considered vital.
Although there are strong views to the contrary, for the scale and target market
concerned, alternatives had to be evaluated on both a national and regional scale. A
key fact of this assessment therefore is that decentralized energy solutions were
therefore not competitive.
Given that the project is being promoted as a private sector investment with the
government retaining a minimal shareholding to mitigate political and market risk, the
range of options to supply the same scale of energy was also significantly reduced.
There are wide ranging criticisms of the project formulation process and its outcomes
so far. These have emerged from environmental NGOs and other sector specialists.
Below is a summary of the key concerns and our analysis of the substance of each.
“Even the operational options assessment is controversial with the selection of mid-
merit energy production, which causes daily mini floods and underplays the
cumulative impacts. The options assessments were not conducted in a multi-
stakeholder manner and options chosen were done solely by the project proponents”.
(Livaningo, local environmental NGO)
8.3 Gaining Public Acceptance
The project feasibility has been largely restricted to the technical fraternity. For those
outside the technical circles, there is a high degree of misinformation that exists
WWF Mphanda Nkuwa Dam Final Report ITC
61
which results in limited knowledge being passed onto the wider public. An inundated
area of 100km2 is very conservative for hydropower generation of the scale proposed
for Mphanda Nkuwa. There are several documents in circulation stating that this will
be one of the largest dams in Africa, whereas the Kariba scheme is of similar
capacity, a slightly bigger dam height but actually has a reservoir area that is about
58 times bigger. There are several other cases which point to a lack of understanding
of the technical issues surrounding the proposed plant that are being used to
campaign against the implementation of the project. It is this lack of factual
information that weakens lobbying on genuine issues pertaining to mega projects in
Mozambique.
The lack of public engagement on the proposed project may result in low public
opinion and acceptance. WCD guidelines were published after the feasibility study
had commenced but there is an opportunity to retrace some of the important
consultation steps to gain public acceptance of the project.
8.4 Address Existing Dams
The WCD states that problems with existing dams must be addressed: “Outstanding
social issues associated with existing large dams are identified and assessed;
processes and mechanisms are developed with affected communities to remedy
them”. Furthermore, WCD states “opportunities to improve the efficiency,
environmental and social performances of existing dams and optimise their benefits
must be taken.”
Addressing existing dams in Mozambique necessarily means a long discussion
around Cahora Bassa Dam and its effect on the Zambezi river. The impacts of
Cahora Bassa are now well documented but little seems to be changing in the
operation regime of the dam. Mphanda Nkuwa is closely linked to Cahora Bassa to
the extent that 20% of the benefits of the project will come from a change in
operation mode for Cahora Bassa South. There will be greater river level variation
between Cahora Bassa and Mphanda Nkuwa as the former switches to mid merit
operation.
The effects of current river regulation will entail HCB foregoing approximately US$16
million in income with the figure projected to rise for the two combined. The feasibility

WWF Mphanda Nkuwa Dam Final Report ITC
62
report states that implementation of Mphanda Nkuwa will make addressing of the
current river regulation regime more unlikely as it will entail heavier financial
opportunity cost for the operators.
The excerpt below shows the summary of projected impacts that will affect the
inhabitants of the lower Zambezi and the eco-system as a whole. While some might
argue that these impacts are external to the decision to build Mphanda Nkuwa, it is
important to note that Mphanda Nkuwa will actually reduce the chances of redressing
these effects.
Before the dam was completed in 1975, South African river ecologist Dr. Bryan Davies
warned of the dam's severe consequences in a pre-project assessment: "Reduced artisanal
fisheries and shrimp industry productivity, reduced silt deposition and nutrient availability,
severe coastal erosion, soil salinisation, salt water intrusion, replacement of wetland
vegetation by invasive upland species, reduction in coastal mangroves, failure of vegetation
to recover from grazing, and disrupted or mistimed reproductive patterns for wildlife species."
Just ten years later, deleterious changes to the Zambezi's riverine, wetland, deltaic and
coastal ecosystems were already apparent.
Source: Can this river be saved?, International Rivers Network Website
In the context of addressing existing dams therefore it is true to say that Mphanda
Nkuwa is currently being promoted as an independent plant with little connection to
the existing Cahora Bassa scheme. This approach heightens fears among
environmentalists and civil society generally on the apparent lack of commitment to
right the negative effects of HCB before promoting Mphanda Nkuwa.
8.5 Sustaining Rivers and Livelihoods
The project does have a direct and primary effect on the livelihoods of approximately
a million people who live in the Zambezi Valley below Mphanda Nkuwa. Hydro
Cahora Bassa has significantly changed the lifestyles of peasants along the lower
Zambezi. It has disrupted a way of life that had evolved over many years to meet
basic needs. In a survey, Belfuiss et al state that:
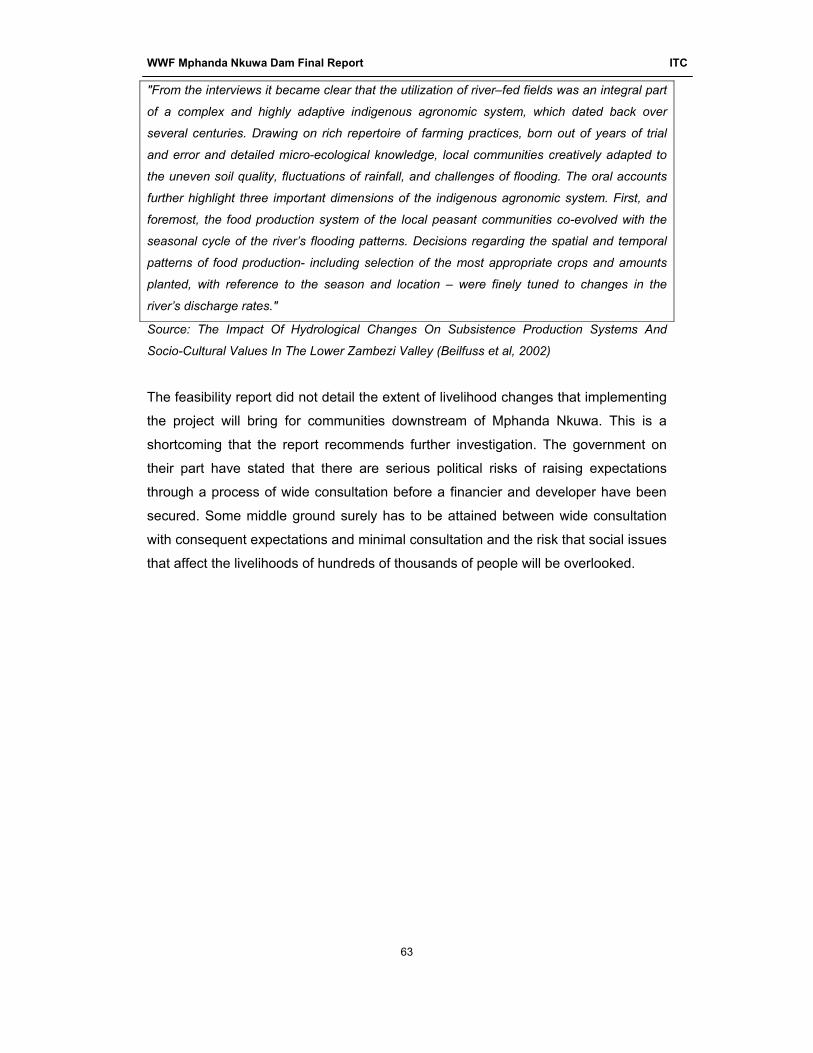
WWF Mphanda Nkuwa Dam Final Report ITC
63
"From the interviews it became clear that the utilization of river–fed fields was an integral part
of a complex and highly adaptive indigenous agronomic system, which dated back over
several centuries. Drawing on rich repertoire of farming practices, born out of years of trial
and error and detailed micro-ecological knowledge, local communities creatively adapted to
the uneven soil quality, fluctuations of rainfall, and challenges of flooding. The oral accounts
further highlight three important dimensions of the indigenous agronomic system. First, and
foremost, the food production system of the local peasant communities co-evolved with the
seasonal cycle of the river’s flooding patterns. Decisions regarding the spatial and temporal patterns of food production- including selection of the most appropriate crops and amounts
planted, with reference to the season and location – were finely tuned to changes in the
river’s discharge rates." Source: The Impact Of Hydrological Changes On Subsistence Production Systems And
Socio-Cultural Values In The Lower Zambezi Valley (Beilfuss et al, 2002)
The feasibility report did not detail the extent of livelihood changes that implementing
the project will bring for communities downstream of Mphanda Nkuwa. This is a
shortcoming that the report recommends further investigation. The government on
their part have stated that there are serious political risks of raising expectations
through a process of wide consultation before a financier and developer have been
secured. Some middle ground surely has to be attained between wide consultation
with consequent expectations and minimal consultation and the risk that social issues
that affect the livelihoods of hundreds of thousands of people will be overlooked.
WWF Mphanda Nkuwa Dam Final Report ITC
64
9 Recommendations for better decision making on Mphanda Nkuwa
The current debate on Mphanda Nkuwa has been characterised by fears emanating
from the effects and failures of Cahora Bassa. Information asymmetry between
project proponents and civic organizations has polarized relations around the project.
Some local NGOs have had to petition parliament to have access to some of the
feasibility reports and working papers on the project. On the part of civil society there
are varying levels of information and knowledge on the project so it is difficult to
arrive at a coherent and consistent civil society position.
There is a role to enhance public and civil society participation in the different stages
of the project.
• Current fear by the government of Mozambique is that such an extensive
process will raise expectation unnecessarily and the consequent political
pressure.
• There is no doubt that although the broad empowering framework exists for the
management of water resources, especially on the Zambezi, detailed
instruments and institutional capacity to ensure compliance at the operational
level has been glaringly absent. This may not have much to do with the efficacy
of Mphanda Nkuwa as a project but is a problem to do with the effects and
management of Cahora Bassa.
These are the factors generally driving the various opinions held by the different key
stakeholders. There is a need for an intermediary to create and foster dialogue over
both Mphanda Nkuwa and Cahora Bassa, as the two are generally synonymous in
the view of many institutions.
Consultative meetings have been held but not as broad as to reflect the range and
spectrum of contending interests on the project.
The need for wider public and stakeholder engagement is crucial. The findings of this
study have shown that the Mphanda Nkuwa hydropower scheme does have potential
WWF Mphanda Nkuwa Dam Final Report ITC
65
to be a successful export commodity for Mozambique and to send out signals to the
investment sector that could see a boost in Mozambique’s economy in the future.
However what it will not do is increase access to electricity for the rural communities,
although there are other government initiatives such as the Energy Rural Access
Programme that is promoting and funding de-centralised energy options. The
technical and economic impacts of Mphanda Nkuwa depend on a good regulatory
and fiscal regime which is not apparent in Mozambique at the moment. The social
and environmental impacts of Mphanda Nkuwa depend on a transparent process of
consultation and dialogue with a wide range of stakeholders. Evidence of such
stakeholder dialogue happening in Mozambique does not seem to be very high.
In conclusion, Mphanda Nkuwa will not directly benefit the Mozambican people in the
short term. It may do so in the medium to long term if the above issues are
addressed, through an improved macro economy. However, if the social and
environmental issues are not addressed then the result could be heavy social,
economic and environmental costs for the Mozambique rural population.