final report for project 11-167-160 submitted 13 jan 2014 project · pdf file ·...
TRANSCRIPT

Page 1 of 39
Final Report for Project 11-167-160
Submitted 13 Jan 2014
Project Title: Bacteria in Streams of the eastern Sierra
(6/01/2012 – 3/31/2014; $40,000)
Primary Investigators:
Drs. Craig E. Nelson and Roland A. Knapp
Center for Eastern Sierra Aquatic Microbial Ecology (CESAME)
Sierra Nevada Aquatic Research Laboratory (SNARL)
Marine Science Institute
University of California
Santa Barbara, CA, 93106
[email protected] and [email protected]
Contract Manager:
Dr. Bruce Warden, Environmental Scientist
California Regional Water Quality Control Board, Lahontan Region
2501 Lake Tahoe Blvd.
South Lake Tahoe, CA 96150
Contents of this Document:
Executive Summary Page 1 (below)
Background and Task Summary with Delivery Status Pages 2-3
Results, Analyses and Recommendations Pages 4-9
Appendix A – Quality Assurance and Quality Control Plan Pages 10-28
Appendix B – Sampling Locations and Dates Pages 29-32
Appendix C – qPCR Standard Operating Procedure Pages 33-37
Appendix D – Raw Data Pages 38-39
Executive Summary -
Project Scope: This study examined the relative concentrations of various bacterial indicators at streams
in California’s Eastern Sierra Nevada (Lahontan Region) using modern (qPCR-based assays for
Enterococcus and Escherichia) and traditional methods (membrane filtration for fecal coliform and
Escherichia coli). This project also conducted intercalibration studies to ensure that assay
measurements were consistent between Lahontan and CESAME/SNARL labs. The stated goals of
analyzing 25 samples and developing one qPCR assay (Enterococcus) were exceeded: the final
project yielded analyses of 67 samples and developed one additional qPCR assay (Escherichia).
Findings and Interpretations: Results demonstrate wide ranges in fecal coliform and Escherichia coli
concentrations among the waters of the Lahontan Region (spanning three orders of magnitude for all
assays; Figs. 1-2). Data from the membrane filtration assays employed (fecal coliform and
Escherichia coli) are highly correlated (Fig. 3), suggesting they are measuring similar contamination
sources. The two new qPCR assays developed (Enterococcus and Escherichia) are less tightly
coupled (Fig. 4), indicating measurement of two different types of bacterial contamination. Finally,
the membrane filtration and qPCR assays for Escherichia are highly correlated (Fig. 5), suggesting
they are measuring the same underlying microbial communities and can provide continuity in the
shift from membrane filtration to newer molecular assays such as qPCR.

Page 2 of 39
Background and Task Summary with Delivery Status The State Water Board and the Lahontan Regional Water Quality Control Board regulate the quality of California’s surface waters in part via the adoption and enforcement of water quality standards for bacterial indicators. The Water Boards’ current bacterial indicators and standards are decades old. The Water Boards need modern tools and information regarding bacterial indicators in order to amend and update existing water quality standards for bacteria, to adopt new or complementary water quality standards for bacterial indicators, and to develop appropriate Total Maximum Daily Loads (TMDLs) for bacteria and pathogens. This study examined the relative concentrations of various bacterial indicators at streams in California’s Eastern Sierra Nevada (Lahontan Region), using modern as well as traditional methods. Task 1. Project Administration and Management 1.1 Provide all technical and administrative services as needed for Agreement completion; monitor,
supervise, and review all work performed; coordinate budget, and schedule, to assure that the Agreement is completed within budget, on schedule, and in accordance with approved procedures, applicable laws and regulations.
1.2 Ensure that contract requirements are being met through completion of quarterly progress
reports submitted to the State Water Board’s Contract Manager by the tenth (10th) of the month following the end of the calendar quarter (March, June, September, and December) and through regular communication with the State Water Board’s Contract Manager.
Task Deliverables:
This work was completed ahead of schedule, within budget, and in full accordance with all approved procedures, applicable laws and regulations. Quarterly reports were filed on time for the duration of the contract with the State Water Board's Contract Manager (Dr. Bruce Warden of the Lahontan Regional Office), including filings on or before the following dates: Quarter 3 2012 (filed 10 Oct 2012) Quarter 4 2012 (filed 10 Jan 2013) Quarter 1 2013 (filed 10 Apr 2013) Quarter 2 2013 (filed 01 Jul 2013)
Task 2. Prepare a Quality Assurance Plan 2.1 Prepare a quality assurance plan that specifies the quality assurance and quality control (QA/QC)
methods and processes to be used for the field and laboratory elements of the project.
Task Deliverables:
Page 3 of 39
A quality assurance and quality control plan was filed with the State’s Contract Contact (Thomas Suk) on 5 Oct 2012 and signed 24 Oct 2012. This QA/QC document is attached as Appendix A.
Task 3. Conduct Field Sampling & Laboratory Analysis of Water Samples 3.1 At 25 sample locations, to be determined based upon mutual agreement between the
Contractor’s Project Director and the State Water Board’s Contract Manager, collect water samples according to the methods specified in the quality assurance plan, and transport or ship samples to the appropriate laboratory for analysis. For all sample locations, record the site name, date and time of sampling, and GPS coordinates for latitude and longitude.
3.2 At the laboratory, following the procedures specified in the quality assurance plan, analyze all
water samples collected under Task 3.1 for fecal coliform bacteria (membrane filter method), Escherichia coli (membrane filter method) and Enterococci (qPCR method).
Task Deliverables
A total of 63 water samples were collected, documented for site name, date and time of sampling and GPS coordinates, transported to the CESAME/SNARL laboratory for analysis, and analyzed for fecal coliform bacteria (membrane filter method), Escherichia coli (membrane filter method) and Enterococci (qPCR method) using USEPA-approved methods (9222D, 9222G, and EPA-821-R-10-004, respectively). A new Escherichia qPCR assay was tested and implemented to analyze all samples.
Details of sample collection and membrane filtration are listed in Appendix A.
Study Sites are listed in Appendix B.
Methods for qPCR assays for Enterococcus & Escherichia are in Appendix C.
Complete raw data tables are listed in Appendix D.
All membrane filtration data have been accessioned in the California Environmental Data Exchange Network (CEDEN) database for public access.
Task 4. Draft and Final Project Report 4.1 Prepare and submit to the State Water Board’s Contract Manager a Draft Project Report that
details the findings of Task 3. The Draft Project Report shall compare and contrast the results for the various bacterial indicators, and shall include recommendations for further studies deemed necessary to support modern standards and TMDL numeric targets for bacterial indicators.
4.2 Prepare a Final Project Report that addresses, to the extent feasible, comments from the State
Water Board’s Contract Manager. Submit one (1) electronic, one (1) reproducible master and two (2) copies of the Final Project Report to the State Water Board’s Contract Manager for review and acceptance.
Task Deliverables: A Draft project report (this report) has been submitted 1 July 2013.

Page 4 of 39
Results, Analyses and Recommendations Comparison and contrasts among the results for the various bacterial indicators: Here we summarize our measurements of bacterial concentrations among waterways of the Lahontan Region from July through September of 2012; raw data are reported in Appendix D). First we present distributions of the four parameters measured: membrane filtration assays for fecal coliform (FC) and Escherichia coli (EC) and qPCR assays for Enterococcus (Entero1a) and Escherichia (EC23S857). We provide both raw quantile data distributions (Figure 1) and log-transformed normal distributions with summary statistics on the latter (Figure 2). We then compare the results of the assays across samples, including comparisons of the values obtained from the two membrane filtration methods (Figure 3), comparisons between the two qPCR methods (Figure 4) and a comparison across methods comparing qPCR and membrane filtration measurement of Escherichia (Figure 5). We found median membrane filtration cell counts of roughly 5 cells per 100 mL sample, with only the upper quartile of data exceeding 40 cells per 100 mL sample (Fig 1). Geometric (lognormal) means were less than 20 CFU per 100 mL (Fig 2). We found similar trends in the qPCR data (Figs. 1-2), but gene copies per 100 mL are uniformly roughly 100 times the concentration of CFU detected via membrane filtration and comparison is difficult (but see Fig 5). Overall, we find that the two membrane filtration methods give very similar cell concentrations across multiple scales, from low (< 30 CFU / 100 mL) to moderate (< 250 CFU / 100 mL) to log-scale measurements across three orders of magnitude (Fig 3).
Figure 1: Raw distributions of bacterial measurements across all samples collected in this study. Distributions of measured values of (left to right) fecal coliform (FC) and Escherichia coli (EC) via membrane filtration and Enterococcus (Entero1a) and Escherichia (EC23S857) via qPCR assay across all dates and sites. Note that a single sample with very high values is not visible in the histograms but is included in the Quantile calculations, for which n = 63 in all cases.

Page 5 of 39
Figure 2. Log-scale normalized distributions for concentrations of bacteria across all samples. From left to right data are fecal coliform (membrane filtration), Escherichia coli (membrane filtration), Enterococcus (qPCR) and Escherichia (qPCR). Logarithmic (base 10) scale distributions and normal quantile plots, with summary statistics of normal distributions for each of the measured parameters across all dates and sites. Note that membrane filtration values of 0 or undetectable qPCR assays are not included in these analyses because they are undefined on a logarithmic scale, reducing the N for each statistical calculation accordingly.

Page 6 of 39
Figure 4. Relationship between Enterococcus and Escherichia qPCR assay measurements. Results were significantly correlated (r = 0.696, p < 0.001, n = 51) but regression modeling did not yield an interpretable predictive result , suggesting that the two measurements are relatively independent and should be measured in tandem as they target different organisms.
Figure 5. Relationship between membrane filtration and qPCR assays for Escherichia coli. The MF assay is a strong predictor (R2 = 0.80, p < 0.0001, F = 291, n = 63) of qPCR gene copy abundance using the equation [Escherichia qPCR copies /100mL] = 109.3*[Escherichia CFU/100mL]. This suggests that the assay is detecting the same targets as the membrane filtration assay and can serve as a reliable indicator of the accuracy of the qPCR assay.
Figure 3. Relationship between fecal coliform and Escherichia coli membrane filtration results across all dates and sampling sites. Both linear and logarithmic axes are shown at multiple scales to emphasize the loglinear distribution of the data across multiple scales. The least-squares linear regression model [EC cells/100mL] = 0.93*[FC cells/100mL] describes the data with high accuracy (R2 = 0.997, p < 0.0001, F = 11650, n = 63), indicating that the two methods yield virtually identical values in most samples.

Page 7 of 39
Interlaboratory Comparison between Lahontan/SWAMP and CESAME/SNARL: In order to establish consistency in calibration between the two primary labs now associated with sample processing of fecal coliform membrane filtration assays we conducted a laboratory intercalibration study. On a single day Lahontan/SWAMP (Kelly Huck) and CESAME/SNARL (Roland Knapp) collected one 1000 mL sample in an autoclaved polypropylene Nalgene bottle from nine separate sites in and around the Bridgeport Valley (BUC.04, BUC.05, EWK.06, RBS.07, RBS.08, SWA.05, SWA.06, VIR.04, VIR.05 - See Appendix B). From each 1000 mL sample the collection team subsampled 100 mL by pouring into a whirlpak bag for analysis at the Lahontan lab while the remaining sample was brought to the CESAME lab for fecal coliform membrane filtration assays plus additional filtration for Escherichia coli and qPCR assays. Both fecal coliform assays were filtered and incubation initiated within 6 hours of collection as mandated by the method. Across eight of the sites the two labs yielded identical results (Figure 6); one sample (RBS.07) was consistently offset by more than threefold in the Lahontan analyses and was excluded from further comparison. Of the eight sites compared, five were run by both labs at multiple pre-determined dilutions, allowing direct intercomparison of dilution slopes between the two labs. ANCOVA linear models were used to test if dilution slopes differed between labs: In a full ANCOVA there was no significant effect of Site on the relationship between the two labs' fecal coliform measurements (interaction term p = 0.85), and a model within interactions included showed no significant effect of Site on the slope of dilution curves between the two labs (Site p = 0.35, all individual sites p > 0.1). In all models (for each Site, across all sites, and including sites where dilution series were not done) the two laboratories were in high agreement (r2 > 0.9, p < 0.0001) with intercept values not significantly different from zero (p < 0.001) and slopes not significantly different from unity (p < 0.001). In addition, for one site (SWA.06) both laboratories ran two 50 mL replicates: within-lab colony counts were quite similar: 46/65 (Lahontan/SWAMP) and 53/60 (CESAME/SNARL).
Figure 6. Laboratory intercalibration of fecal coliform membrane filtration bacterial counts. Linear
regression model is not significantly different from unity: [CESAME] = 1.05[Lahontan] (p < 0.0001, r2 =
0.93, 95% confidence range of slope 0.94 to 1.15). Axes are in identical units (colony forming units per
100 mL sample). Each point is a single dilution, with sampling sites color-coded. In grey open circles are
the dilution series from a single excluded sample (RBS.07).

Page 8 of 39
Recommendations for further studies to support TMDL numeric targets for bacterial indicators: The results presented here suggest that the suite of measurements used in this study (Membrane Filtration assays for fecal coliform and Escherichia coli and quantitative PCR assays for Enterococcus and Escherichia) may serve as a solid baseline for bacterial monitoring in waters of the Lahontan Region for the foreseeable future. Culture-based membrane filtration assays anchor future measurements in the context of past measurements, providing continuity in the datasets and widely-understood numerical targets for water quality impairment criteria. The additional use of qPCR-based assays provides a link to more modern methods for which standards are actively being developed and allows the development of a regional context for the relationships between the two assays moving forward. Finally, using both membrane filtration and qPCR-based assays for Escherichia allows for understanding of the methodological links between the two types of measurements, an invaluable resource for quality control and development of standardized numeric targets in the future. We recommend the following future priority areas of investigation in the development and application of qPCR assays:
1. The development of standards in collaboration with USEPA and SWRCB laboratories to allow inter-laboratory calibration and eventual determination of numerical targets for qPCR assays. This would provide meaningful and defensible thresholds using modern quantitative techniques.
2. Additional monitoring throughout the Lahontan Region to develop seasonal and spatial baseline data calibrated between both the membrane filtration (i.e., traditional fecal indicator bacteria) and more modern qPCR assays presented here. This would inform the Regional Water Board about existing bacteria concentrations as it proceeds to refine/update its existing standards for fecal indicator bacteria, and it would allow the Regional Water Board to develop standards for rapid indicators using modern technology.
3. The development and application of Bacteroidales-qPCR-based microbial source tracking (MST) methods for the Lahontan Region to be coupled with the broad-spectrum qPCR assays presented here. This would allow the Regional Water Board to identify the sources of bacteria in impaired water bodies.

Page 9 of 39
APPENDIX A
Quality Assurance Project Plan
Sierra Nevada Aquatic Research Laboratory
Center for Eastern Sierra Aquatic Microbial Ecology
(SNARL – CESAME)
Version 1.0
October 2012

Appendix A : Quality Assurance Project Plan
CESAME Final Project Report – Contract 11-167-160
Page 10 of 39
A GROUP A: PROJECT MANAGEMENT
A.1 Approval Page
Document Title: Quality Assurance Project Plan for Lahontan Region Bacteria Monitoring
Revision History
Version # Effective Date Changes made
1.0 1 October 2012 First version of document
Approvals:
________________________________________________ Date ______________
Roland A. Knapp, Project Director
________________________________________________ Date ______________
Craig E. Nelson, Project Microbiologist
________________________________________________ Date ______________
Thomas J. Suk, Lahontan Regional Water Board

Appendix A : Quality Assurance Project Plan
CESAME Final Project Report – Contract 11-167-160
Page 11 of 39
A.2 Table of Contents
A Group A: Project Management ........................................................................... 10 A.1 Approval Page .................................................................................................. 10 A.2 Table of Contents ............................................................................................. 11 A.3 Distribution List ................................................................................................. 12 A.4 Project/Task Organization ................................................................................ 12 A.5 Problem Definition/Background ........................................................................ 14 A.6 Quality Objectives and Criteria for Measurement Data .................................... 16 A.7 Special Training Needs/Certification ................................................................ 17 A.8 Documents and Records .................................................................................. 18
B Group B: Data Generation and Acquisition ....................................................... 18 B.1 Sampling Process Design ................................................................................ 18 B.2 Sampling Methods ........................................................................................... 19 B.3 Sample Handling and Custody ......................................................................... 19 B.4 Analytical Methods ........................................................................................... 20 B.5 Quality Control ................................................................................................. 20 B.6 Instrument/Equipment Testing, Inspection, and Maintenance .......................... 21 B.7 Instrument/Equipment Calibration and Frequency ........................................... 21 B.8 Inspection/Acceptance of supplies and Consumables ..................................... 22 B.9 Non-Direct Measurements (Existing Data) ....................................................... 22 B.10 Data Management ........................................................................................ 22
C GROUP C: Assessment and Oversight ............................................................... 23 C.1 Assessments & Response Actions ................................................................... 23 C.2 Reports to Management ................................................................................... 23
D Group D: Data Review and Usability ................................................................... 23 D.1 Data Review ..................................................................................................... 23 D.2 Verification and Validation Methods ................................................................. 24 D.3 Reconciliation with User Requirements ............................................................ 24
E Group E: SNARL-CESAME Microbiology Standard Operating Procedure…. .25

Appendix A : Quality Assurance Project Plan
CESAME Final Project Report – Contract 11-167-160
Page 12 of 39
A.3 Distribution List
Copies of this Quality Assurance Project Plan (QAPP) will be distributed to the following individuals
Table 1 QAPP distribution list
Title: Name
SNARL-CESAME Project Director, Research
Biologist, Marine Science Institute, UC Santa
Barbara
Roland A. Knapp
SNARL-CESAME Project Microbiologist, Associate
Specialist, Marine Science Institute, UC Santa
Barbara
Craig E. Nelson
Senior Environmental Scientist, California
Regional Water Quality Control Board, Lahontan
Region
Thomas J. Suk
A.4 Project/Task Organization
A bacteria monitoring program is being implemented by staff of the Sierra Nevada Aquatic Research
Laboratory – Center for Eastern Sierra Aquatic Microbial Ecology (SNARL-CESAME). The CESAME staff
listed in Table 1 will be involved with oversight and implementation of this QAPP in conjunction with the
Lahontan Regional Office of the California State Water Resources Control Board and will be responsible
for all review and assessment with the provisions of this QAPP. In addition to the staff listed in Table 1,
other CESAME staff, interns, and SNARL-CESAME contractors will conduct sample collection, handling,
analysis, and data review and management.
A.4.1 Involved Parties and Roles
The Project Director will have the following responsibilities:

Appendix A : Quality Assurance Project Plan
CESAME Final Project Report – Contract 11-167-160
Page 13 of 39
Oversee work of the staff and interns associated with SNARL-CESAME
Review project needs, requests, and problems
Provide training to personnel working in the SNARL-CESAME Lab
Manage and oversee work of personnel performing bacteria analyses
Ensure all lab equipment is maintained and operating properly
Work closely with staff, interns, and SWAMP contractors to ensure proper implementation of the QAPP
Assist with scheduling and coordination of sample collection and transport
Manage contracting with contractor laboratories
Receive and review deliverables from contractor laboratories
Update QAPP as needed
Manage filing and record keeping for project
The Project Microbiologist will have the following responsibilities:
Provide technical expertise and training in bacteria analyses
Review and assess performance against established procedures and the provisions of this QAPP for bacteria analyses
Provide assistance with corrective action implementation
Provide information and training about quality assurance and quality control concepts and practices
Provide review of QAPP to assure adherence the State Water Resources Control Board (State Water Board) Quality Management Plan
Oversee production of annual summary report
A.4.2 Persons Responsible for QAPP Update and Maintenance
The Project Director shall be the custodian of the current and any prior versions of this QAPP. Plan
modifications, revisions or updates may be suggested by the any personnel involved with the project.
SNARL-CESAME staff may call for the revision of this QAPP in order for it to meet changes in procedures
or permit conditions. The Project Director will convene meetings and solicit professional opinions when
revising this QAPP and shall be responsible for the drafting and finalizing the revised QAPP.
Appendix A : Quality Assurance Project Plan
CESAME Final Project Report – Contract 11-167-160
Page 14 of 39
A.5 Problem Definition/Background
A.5.1 Problem statement
Bacterial contamination can occur from many types of land uses and can cause significant public health
threats. The Water Quality Control Plan for the Lahontan Region (Basin Plan) contains water quality
objectives for bacteria that apply to surface waters in the region.
A.5.2 Decisions or outcomes
The main goal of the study is to assess surface waters for compliance with the bacteria objectives
contained in the Basin Plan. Fecal coliform bacteria will be the primary constituent analyzed in the study
because the Basin Plan contains numeric criteria for it. Further, because the State Water Board is
considering the adoption of new (statewide) bacteria objectives for Escherichia coli (E. coli), an
additional goal of this study is to also (where feasible, given resource constraints) collect synoptic E. coli
data, in order to assess attainment of current non-regulatory thresholds for E. coli, and compliance with
any future regulatory standards for E. coli.
The specific monitoring questions are as follows: 1. Do fecal coliform concentrations at selected sites
comply with the Basin Plan's objectives? 2. Where feasible given resource constraints, do E. coli
concentrations at selected sites meet USEPA recommendations, and other relevant non-regulatory
assessment thresholds? 3. Where data from duplicate samples are available, how do fecal coliform
concentrations at selected surface water sites compare to E. coli concentrations?
A.5.3 Water quality or regulatory criteria
This project will yield bacterial count data. These data may be used by the SNARL-CESAME for status
reporting (305b), comparison to Basin Plan water quality objectives (and 303d listing or de-listing), and
watershed assessments.

Appendix A : Quality Assurance Project Plan
CESAME Final Project Report – Contract 11-167-160
Page 15 of 39
A.5.4 Work statement and produced products
The project will include monitoring of individual analytes in water. Station types sampled will include:
rivers, streams, and/or creeks. Sampling and measurements will be made during either wet or dry
weather.
Sample locations will be distributed throughout the southern portion of the Lahontan Region, from
Bridgeport Valley south to the vicinity of Lone Pine. At a minimum, sample locations will be
documented with a station code, latitude and longitude coordinates and photographs.
Analytical data will be entered into the California Environmental Data Exchange Network (CEDEN)
database. The project will provide an annual summary report. The annual report will include maps,
photographs, and a written description of each sample location. Maps and photographs showing sample
locations will be included in the annual report. At a minimum, photographs will be labeled with water
body name and orientation. At a minimum, maps will include the sample location, water body, nearby
roads, towns, and orientation.
A.5.5 Constituents to be monitored and measurement techniques
Monitoring consists of field sampling and laboratory analyses for fecal coliform (at all locations) and
E.coli (where resources permit). Bacteria samples will be collected according to the procedures detailed
in Appendix A, Standard Operating Procedures for Bacteria Sample Collection. Sampling techniques will
include direct filling of containers.
Field parameters are not required for this project. If field parameters are collected, they will meet the
requirements of the SWAMP Quality Assurance Program Plan (SWAMP QAPrP, 2008).
A.5.6 Monitoring schedule
Initial sample locations will be determined during summer 2012, with additional locations added as
needed in future years. Samples will be collected at varying frequencies depending on the location. The
goal will be to collect multiple samples per month, however this may not be possible at all locations
given the large geographic range of the Lahontan Region, limited access to laboratories, and a short
holding time for bacteria samples.

Appendix A : Quality Assurance Project Plan
CESAME Final Project Report – Contract 11-167-160
Page 16 of 39
A.5.7 Geographical setting
Sample locations will be distributed throughout the southern portion of the Lahontan Region. The
Lahontan Region is over 600 miles long, stretching along the crest of the Cascade and Sierra Nevada
mountain ranges from the California/Oregon border at the north to the Mojave Desert in the south and
includes most surface waters draining to the east.
A.5.8 Constraints
Extreme wet weather could affect sampling because of significant dilution or mobilization of the
constituents being measured. Extreme dry weather could also limit or prevent representative sampling
due to low flow or no flow at a location. Freezing weather could cause conditions that adversely affect
the parameters being measured. It also could prevent access to some of the areas where sampling is
needed.
If some areas that are planned to be monitored are not accessible because of legal restrictions then
there will be some gaps that could affect some of the conclusions drawn from the data. If there are
some unexpected topographical features that make it impractical to monitor some planned areas then
other sampling locations will be located, if possible.
Budget constraints, availability of qualified laboratories, or unanticipated analytical difficulties (such as
interferences requiring selection of other methods, accepting higher detection levels, or requiring
additional clean up of samples prior to their analysis) could result in fewer locations or samples.
A.6 Quality Objectives and Criteria for Measurement Data
This project will include laboratory measurement of fecal coliform and E. coli by multiple methods.
Laboratory quality control samples will adhere to those specified by the method being used. There are
no field quality control samples collected for this project.

Appendix A : Quality Assurance Project Plan
CESAME Final Project Report – Contract 11-167-160
Page 17 of 39
Table 2 Test Methods and Minimum Values for Fecal Coliform and E.coli
Parameter Test Method Reporting Limit* Units
Fecal
Coliform
SM 9222D (membrane
filtration)
1 CFU/100mL
E. coli SM9222G (two-step
membrane filtration)
1 CFU/100mL
* Reporting Limit may vary depending on sample dilution.
A.7 Special Training Needs/Certification
Personnel involved with this project will receive training in the collection of samples for fecal coliform
and E. coli. Personnel collecting samples will be familiar with the contents of this QAPP prior to
conducting sampling. Training will be conducted by the SNARL-CESAME Project Director, Project
Microbiologist, or other qualified staff persons. Training shall be in the following areas.
Equipment (GPS unit) operation, calibration, and maintenance
Sample collection and handling procedures
Basic quality assurance/quality control
Personnel working in the SNARL-CESAME lab will be trained by the SNARL-CESAME Project Director,
Project Microbiologist, or other qualified staff persons. Training shall be in the following areas:
General laboratory safety
Analytical methods for fecal coliform and e.coli analyses
Sample handling procedures
Basic quality assurance/quality control

Appendix A : Quality Assurance Project Plan
CESAME Final Project Report – Contract 11-167-160
Page 18 of 39
A.8 Documents and Records
The Project Director will be responsible for final records management as described in this QAPP.
Records to be retained include field notes and observations, the results of laboratory or water quality
sample analyses, laboratory reports, chain of custody forms, this QAPP and any revisions, and annual
reports. Records will be housed at the SNARL-CESAME office.
Sample collection activities will be documented in bound field books and chain of custody (COC) forms.
Any errors in field book entries or COC forms will be corrected by a single line through the text being
revised, and all such corrections initialed and dated. The following information will be recorded in the
bound field books:
Initials or names of samplers
Sample date and time of collection
Station location code (referenced to GIS database)
Sample ID number
Any unusual weather events
Visual observations
COC forms will be filled out by personnel collecting samples and delivered to the laboratory with the
samples.
B GROUP B: DATA GENERATION AND ACQUISITION
B.1 Sampling Process Design
Sample locations and frequency of collection will vary throughout the region. Sample locations may be
selected to assess potential impacts from different land uses.

Appendix A : Quality Assurance Project Plan
CESAME Final Project Report – Contract 11-167-160
Page 19 of 39
B.2 Sampling Methods
Sampling methods for bacteria samples consist of grab samples collected at each locations. Bacteria
samples will typically be collected in disposable sterile containers. Sample collection procedures are
described in Appendix A, Standard Operating Procedures for Bacteria Sample Collection.
B.3 Sample Handling and Custody
Samples collected are to be handled as in Table 9. Additional sample handling procedures are described
in Appendix A, Standard Operating Procedures for Bacteria Sample Collection.
Sample locations will each have a unique location code. If the station is an existing SWAMP station, the
SWAMP station code will be used. For newly identified non-SWAMP locations, the location code will
consist of the following: a 3 letter creek code and a 2 digit location code (generally beginning with 01 for
the most upstream location).
Each sample collected will also have a unique sample identification number. Samples collected at
SWAMP sites may have a SWAMP specific sample ID (per SWAMP QAPrP, 2008). Other sites will use a
SNARL-CESAME sample ID which consists of the following:
Unique Sample Identifiers: ABC.##.ddmmmyy.hhmm
ABC is 3-letter catchment/stream code
## is two digit site numeric code (generally increasing downslope)
Date is in form 25JUL12
Time is rounded to nearest 10 minute interval and is optional in unique ID

Appendix A : Quality Assurance Project Plan
CESAME Final Project Report – Contract 11-167-160
Page 20 of 39
Table 3 Container, preservation and holding times
Parameter Container Preservation Minimum Sample
Volume
Holding
Time
Fecal
coliform
Autoclaved polypropylene
or glass containers or
Whirlpak bags
Cool < 10oC 100mL 8 hours
E. coli
Autoclaved polypropylene
or glass containers or
Whirlpak bags
Cool < 10oC 100mL 8 hours
B.4 Analytical Methods
The analytical methods listed in Table 10 will be used for analysis. Additional methods, such as those
listed in the Code of Federal Regulations 40 CFR 136.3, may also be used.
Table 4 Analytical methods
Parameter Method reference
Fecal Coliform SM 9222D (Membrane Filtration)
E.coli SM9222G (two-step Membrane Filtration)
B.5 Quality Control
Quality control processes will follow those described in the method being used by the laboratory. There
are no field quality control samples collected for this project.
B.5.1 Corrective Actions

Appendix A : Quality Assurance Project Plan
CESAME Final Project Report – Contract 11-167-160
Page 21 of 39
If there are failures to meet the above Quality Control criteria then SNARL-CESAME staff will initiate
Corrective Action procedures, or direct the organization responsible for failures to do so. The Project
Director will document the effort and effectiveness of any actions taken. The basic plan for Corrective
Actions is as follows.
Investigate and determine if a cause can be discerned. Examine the actual procedures, equipment performance, equipment maintenance records, condition of solutions and standards, interview staff conducting tests, and any other actions that are deemed appropriate to gain an understanding of the cause(s).
Take action and correct the discerned problem. Amend written procedures, purchase repair and replacement materials, retrain staff, alter maintenance or restocking schedules, and any other change(s) deemed necessary that will prevent a repetition of the problem.
Follow up and be sure changes were made and actions effective. Take additional actions as necessary.
B.6 Instrument/Equipment Testing, Inspection, and Maintenance
No meters or equipment are needed for bacteria sample collection.
If field parameters are added to the monitoring program all meters and devices used to measure pH,
temperature, or other parameters will be tested, inspected, and serviced in accordance within all of the
manufacturer’s specifications.
Laboratory equipment will be tested, inspected, and serviced in accordance within all of the
manufacturer’s specifications and with laboratory SOPs or QA manuals.
B.7 Instrument/Equipment Calibration and Frequency

Appendix A : Quality Assurance Project Plan
CESAME Final Project Report – Contract 11-167-160
Page 22 of 39
No meters or equipment are needed for bacteria sample collection. Laboratory equipment will be
calibrated in accordance within all of the manufacturer’s specifications, method required specifications,
or laboratory SOPs or QA manuals.
B.8 Inspection/Acceptance of supplies and Consumables
We will inspect upon receipt, all shipments of supplies and consumables used for bacteria monitoring
and analysis for obvious physical damage or loss. Any damage or other issue with the supplies and
consumables will be reported to the supplier and the affected material set aside and not used.
Supplies and consumables received in good order will be stored as directed by the manufacturer.
B.9 Non-Direct Measurements (Existing Data)
Non-direct measurements are either those that are generated by another agency or organization
outside of our monitoring program; or those created by calculation from values generated by direct
measurement. No data generated outside of our monitoring program will be used for this project.
B.10 Data Management
Data collected for this project will be entered into the CEDEN database which was designed to facilitate
integration and sharing of data collected by many different participants. CEDEN’s mission is to simplify
and improve access to California’s water resource monitoring data by providing services that integrate,
standardize, and display data from a diverse array of monitoring and data management efforts. Data for
SWAMP sites will be entered into the SWAMP database using SWAMP protocols. CEDEN serves as the
venue through which SWAMP data are made available to the public. CEDEN can be accessed at
http://ceden.org/ .

Appendix A : Quality Assurance Project Plan
CESAME Final Project Report – Contract 11-167-160
Page 23 of 39
C GROUP C: ASSESSMENT AND OVERSIGHT
C.1 Assessments & Response Actions
The Project Director or SNARL-CESAME Project Microbiologist will review and assess compliance with all
sample collection and analytical procedures for bacteria monitoring at least twice each calendar year.
Any failures to follow the written sampling and analytical procedures of this QAPP are to be followed up
with all appropriate responses including refresher training.
The Project Director or SNARL-CESAME Project Microbiologist will review all reports generated by the
contract laboratories and call for responses and corrective action if they are needed.
C.2 Reports to Management
The Project Director will send periodic reports to the SNARL-CESAME office management regarding
compliance with the provisions of this QAPP and any issues and resolutions arising from review and
assessment by SNARL-CESAME staff.
D GROUP D: DATA REVIEW AND USABILITY
D.1 Data Review
Data review is the in-house examination to ensure that the data have been recorded, transmitted, and
processed correctly. Data will be reviewed for data entry errors, transcription errors, transformation
errors, calculation errors, and errors of data omission. Entries in field books and COC forms will be
checked against laboratory data reports for consistency.

Appendix A : Quality Assurance Project Plan
CESAME Final Project Report – Contract 11-167-160
Page 24 of 39
D.2 Verification and Validation Methods
Data from the SNARL-CESAME facility and contractor laboratories will be obtained in electronic format
or hand entered into electronic spreadsheets. These spreadsheets will be verified and checked for entry
errors, transcription errors, transformation errors, calculation errors, and errors of data omission by a
second person. The person conducting the verification will compare the entries in the spreadsheets to
the field book, COCs, and lab repots or lab data sheets.
D.3 Reconciliation with User Requirements
The Project Director will be responsible for reporting project reconciliation, including how well the
project objectives were met. The data will be compared with bacteria objectives contained in the Basin
Plan. Explanations will be provided for any data determined to be unacceptable for use or flagged for
quality concerns.

Appendix A : Quality Assurance Project Plan
CESAME Final Project Report – Contract 11-167-160
Page 25 of 39
SECTION E
SNARL-CESAME Microbiology Standard Operating Procedure
(Version 1.0, updated 26 Jul 2012)
Data Management:
Sampling Chain of Custody: Time of collection, Sampler, Sampling Site, Unique Sample ID,
Date/Timestamp, Livestock present/absent, Recommended Dilution, Addtl Notes
Laboratory Chain of Custody: Unique Sample ID, Time of arrival at lab, Volume of sample
filtered, time of placement on m-FC media, Fecal coliform colonies, E. coli colonies
Unique Sample Identifiers: ABC.##.ddmmmyy.hhmm
ABC is 3-letter catchment/stream code
## is two digit site numeric code (generally increasing downslope)
Date is in form 25JUL12
Time is rounded to nearest 10 minute interval and is optional in unique ID
Lab Organization:
Autoclave Instructions:
Ensure sufficient water in top-loading reservoir (above top of coil, below release valve)
Switch on autoclave (front power and/or rear-emergency power red switch)
With door open, turn control knob to “Fill Water” until water reaches front groove
Load autoclave, ensuring liquid goods are either in solid-bottom metal tray or PP autoclave pan
Tighten door, and turn control knob to “Sterilize”. Set Temperature to 121degC.
Activate timer to 30 minutes, which will provide 15m to pressurize and 15m to sterilize
When timer rings, allow 10 minutes for pressure to decrease to absolute zero
Turn knob to “Exhaust/Dry” and carefully open door a crack
Dry goods (filter towers, sample bottles, tweezers/needles, sterivex caps, beakers, etc.)
o Turn timer to 15 minutes to dry goods completely
o When timer rings, turn control knob to “0” and remove goods
Liquid goods (agar media, squirt bottles with water, other liquids to be sterilized)
o Turn control knob to “0” and remove goods; do not set timer on Exhaust/Dry cycle
If autoclave is to be decommissioned (>1 wk), turn off, drain reservoir and chamber, close
Before sample collection: Ensure that adequate stocks of all items exist; all culturing materials are
either sterile packed and disposable or autoclaved before use:
o Disposable:
Petri dishes with pads (47mm; Fisher PD20047S5)
Petri dishes without pads (47mm; Fisher PD2004705)

Appendix A : Quality Assurance Project Plan
CESAME Final Project Report – Contract 11-167-160
Page 26 of 39
m-FC media ampules with Rosolic Acid (2ml; Fisher MHA000P2F)
Serological Pipets (50ml; Fisher 1367610R)
Filters (47mm 0.45um; Fisher HAWG047S6)
qPCR bead tubes (MoBio Powerwater, VWR 101449-430)
Sterivex cartridges (0.22um, Fisher SVGP01050)
Cryovials (1ml; Fisher 2912710)
o Autoclaved:
Rinse water (DI) and squirt bottles (PP; Fisher 0340914A) – autoclave liq. cycle
Sample collection bottles (PP; Fisher 033112E)
Filter towers & support discs (o-rings (PSF; Fisher 0974023D) – autoclave in foil
Agar media (NA-MUG; Fisher DF0023156) – autoclave liquid cycle
tweezers and needles (Fisher XX6200006P) – autoclave pouches (Fisher 181254)
Sterivex caps (Nylon; Value Plastics LP34-3) – autoclave in pouches
Syringes (60ml; Fisher 136898) – after rinsing/drying, autoclave in pouches
o Other prep:
Ensure adequate stocks of PFA aliquots in fridge (10% paraformaldehyde)
Reorder from Electron Microscopy Sciences (Cat. 157-8)
Pour NA-MUG plates
Weigh powder in front room with our scoopula and weigh-boats
Add DI water to mix - 23.1g/L, 5ml agar per plate (100ml/2.31g is good)
Add stirbar (1-2cm) and stir with vortex and heat (level 3) 5-10 min
Autoclave on liquid cycle in polypropylene autoclave tray
Let cool until neck is hot but tolerable
Pour approx 5ml per plate (fill plate 2/3 then swirl to distribute)
Let cool on benchtop until solidified, 2-24h
Store in refrigerator in tupperwater or ziplock up to 2 weeks
Freeze ice blocks (Fisher 353154)
Print chain-of-custody and filtration record forms
Organize Field Cooler
Trash bags (used ziplocks are ideal)
Gloves (Fisher 19048134)
Field notebook
Chain-of-Custody forms on clipboard
Ballpoint Pen and/or pencil
Label Tape
Sharpies
GPS
Camera
Sterivex
Sterivex Caps
60ml Syringes
Sample Bottles (Autoclaved)
Ice Blocks (Frozen)

Appendix A : Quality Assurance Project Plan
CESAME Final Project Report – Contract 11-167-160
Page 27 of 39
Sample Collection
1) Wrap label tape around sample bottle completely to meet on far side
2) Label sample bottle with Site Code and Timestamp (Unique ID as described above)
3) Photograph site and record GPS coordinates if a new site
4) Record Ancillary sample collection Data: weather, cattle/human impacts, sampler name, notes
5) Don fresh gloves, rinsed 3X in streamwater before opening sample bottle
6) Submerge sample bottle 3cm beneath water surface facing upstream of investigator
7) Ensure 1cm neck headspace in sample bottle – collection volume should be >1L
8) Using sample bottle pour 4 X 65ml into sterile syringe and push through Sterivex filter
9) Cap Sterivex with sterile caps, leaving capsule full of water
10) Transport samples with icepacks in small collapsible cooler to larger cooler in auto
Sample Processing
All samples must arrive at lab facility within 6h of collection
All sample processing must be completed within 8h of collection
If more than 30 minutes lapses between sample administration to filter towers, re-autoclave
All samples should be stored in cooler or refrigerators during processing
Ethanol-wash all benchtops in preparation for sample handling
1) Sterivex Freezing: remove caps and dry-flush each sterivex (used syringe), replace caps, frz -40C
2) Culturing Membrane Filtration:
a. Organize Filtration plan (sample order, volumes, and blanks) and record in logbook
b. Place sterile support disks on receiving reservoirs and connect reservoirs to vacpump
c. Place sterile membrane on support disk, squirt sterile rinsewater to saturate membrane
d. Seat filter tower on membrane, tighten collar (a quick reverse spin to avoid misthreads)
e. Shake sample bottle vigorously 25X to mix
f. Using a new sterile serological administer 100ml and/or 30ml of sample to towers
g. Place sample bottle in front of respective towers to avoid confusion
h. Label petri dishes with pads with unique ID on bottom (Millipore etching is bottom)
i. Add complete ampule m-FC/Rosolic media to each plate with pad and cover to absorb
j. Run pump until filters are dry (recommend lowest vacuum pressure of <10 cm Hg
k. While pump is running, squirt-rinse each tower with 20-50ml autoclaved DI water (20s)
l. Turn off pump and lift-remove filter funnels vertically and invert on benchtop
m. Using sterile tweezers place each filter face-up on m-FC-soaked pad, close & invert dish
n. NOTE: avoid bubbles between filter and pad/agar by rolling filter onto surface
o. NOTE: Run 100ml autoclaved DI Blank at start, end, and after every ten filters
p. NOTE: after 3-4 filters per tower empty reservoirs into sink (after Blank 2 is a good time)
q. Place stacks of 5-6 plates inverted into snack packs + water bath 44.5C 22-26h
r. After 22-26 hour incubation, transfer filter face-up to NA-MUG plate, incubate 35C 4h
3) qPCR Membrane Filtration
a. As above steps a-g, but filter 2 rounds of 400ml per filter, emptying reservoir between
b. Rinse after second round of 400ml as above step k
c. NOTE: Blanks continuous with previous filters through this filter set (ie every 10 filters)
d. NOTE: Measure volumes using scale on filter tower, not serological pipettes

Appendix A : Quality Assurance Project Plan
CESAME Final Project Report – Contract 11-167-160
Page 28 of 39
e. NOTE: Vacuum may need to be increased on second round – 25 cm Hg maximum
f. NOTE: if one sample is slow, hook directly to pump and remove others (process filters)
g. Roll filter (tweezers/needle), sample inside, and freeze -40C labeled bead tube (MoBio)
4) Flow cytometry cryovial sampling
a. AFTER all sample filtration, aliquot 1ml each sample into labeled cryovials
b. In fume hood, add 50 μL paraformaldehyde (PFA, in 1ml aliquots in fridge)
c. Invert tube 5-10 times to mix, freeze -40C in tube storage box
5) Count plates and record counts for all plates (use long-wavelength UV for NA-MUG agar plates)
a. Select the highest volume dilution
b. When colonies adjoin, they are counted separately when clear “pinching” is evident
c. Fluorescence of E. coli on MUG agar is best differentiated from the plate bottom
6) Cleanup and reset
a. Wash all sample bottles in sink (rinse - no soap or scrub) – autoclave before next use
b. Wash all syringes and leave on benchtop to dry – autoclave in pouches before use
c. Glassware should be washed with soap (VersaClean 1:50) and scrubbed (brush)
d. Rinse used freezer ziplocks and dry and label for use as field trash bags
e. Dry and ethanol-wash all benchtops (ethanol and bleach are in hazardous cabinets)
f. Check inventory of all consumables
g. Autoclave Petri waste (autoclave bags S503971)
h. Autoclave tweezers/needles, filter towers and support disks, squirt bottles with DI
i. Clean and check water baths
j. Decommission Water baths and Autoclave if not planning work for > 1 week

Appendix B : Sampling Locations and Dates
CESAME Final Project Report – Contract 11-167-160
Page 29 of 39
site_id stream drainage county owner elev(m) utm_east utm_north
BUC.02 Buckeye_Ck Walker Mono HT_NF 2181 294248 4234669
BUC.03 Buckeye_Ck Walker Mono HT_NF 2130 295869 4234797
BUC.04 Buckeye_Ck Walker Mono H_ROW 1985 300760 4237528
BUC.05 Buckeye_Ck Walker Mono H_ROW 1985 300880 4237355
CON.10 Convict_Ck Owens Mono Inyo_NF 2324 336589 4162506
CON.20 Convict_Ck Owens Mono LADWP 2154 338699 4164644
CON.30 Convict_Ck Owens Mono LADWP 2141 339358 4165099
CON.40 Convict_Ck Owens Mono LADWP 2128 340036 4165575
EWK.06 East_Walker_Rvr Walker Mono H_ROW 1976 305423 4236483
HIL.20 Hilton_Ck Owens Mono Private 2186 345386 4158802
LEE.10 Lee_Vining_Ck Mono Mono Inyo_NF 2379 305420 4201992
LEE.15 Lee_Vining_Ck Mono Mono LADWP 2197 312457 4200897
LEE.17 Lee_Vining_Ck Mono Mono H_ROW 2179 313453 4201214
LEE.20 Lee_Vining_Ck Mono Mono H_ROW 2074 314098 4202439
LEE.30 Lee_Vining_Ck Mono Mono LADWP 1963 314651 4204978
MAM.10 Mammoth_Ck Owens Mono Inyo_NF 2615 322994 4165968
MAM.20 Mammoth_Ck Owens Mono UCSB 2459 323989 4166728
MAM.30 Mammoth_Ck Owens Mono Inyo_NF 2393 326636 4167152
MAM.40 Mammoth_Ck Owens Mono LADWP 2200 332261 4167612
MAM.50 Mammoth_Ck Owens Mono Inyo_NF 2154 336521 4167842
MCG.15 McGee_Ck Owens Mono Inyo_NF 2406 340687 4157429
MCG.17 McGee_Ck Owens Mono Inyo_NF 2344 341807 4158307
MCG.20 McGee_Ck Owens Mono Private 2111 342500 4161381
MCG.30 McGee_Ck Owens Mono LADWP 2075 342247 4163202
MIL.20 Mill_Ck Mono Mono Inyo_NF 2623 299993 4209698
MIL.30 Mill_Ck Mono Mono Inyo_NF 2559 300640 4210391
MIL.40 Mill_Ck Mono Mono Inyo_NF 2440 302759 4211120
MIL.60 Mill_Ck Mono Mono Inyo_NF 2101 310520 4212428
MIL.80 Mill_Ck Mono Mono LADWP 1975 312738 4210533
OWE.10 Owens_Rvr Owens Mono Inyo_NF 2501 321740 4179699
OWE.15 Owens_Rvr Owens Mono Inyo_NF 2289 325371 4179686
OWE.20 Owens_Rvr Owens Mono Inyo_NF 2212 329236 4179843
PAR.20 Parker_Ck Mono Mono Inyo_NF 2405 311809 4191444
PAR.30 Parker_Ck Mono Mono H_ROW 2091 315903 4196667
RBS.02 Robinson_Ck Walker Mono HT_NF 2181 290949 4224686
RBS.04 Robinson_Ck Walker Mono HT_NF 2088 296799 4231608
RBS.07 Robinson_Ck Walker Mono H_ROW 1986 301081 4237075
RBS.08 Robinson_Ck Walker Mono H_ROW 1987 301182 4236934
ROC.10 Rock_Ck Owens Inyo Inyo_NF 3125 345404 4144508
ROC.20 Rock_Ck Owens Mono Inyo_NF 2704 348154 4151099

Appendix B : Sampling Locations and Dates
CESAME Final Project Report – Contract 11-167-160
Page 30 of 39
site_id stream drainage county owner elev(m) utm_east utm_north
ROC.30 Rock_Ck Owens Mono Inyo_NF 2298 350729 4156879
RUS.10 Rush_Ck Mono Mono Inyo_NF 2363 314169 4181028
RUS.20 Rush_Ck Mono Mono Private 2221 313787 4181639
RUS.30 Rush_Ck Mono Mono Private 2208 313060 4182057
RUS.50 Rush_Ck Mono Mono Inyo_NF 2193 314187 4186304
RUS.70 Rush_Ck Mono Mono H_ROW 2093 315877 4195461
RUS.80 Rush_Ck Mono Mono Inyo_NF 1962 319159 4201967
SWA.02 Swauger_Ck Walker Mono Private 2368 295095 4248964
SWA.05 Swauger_Ck Walker Mono HT_NF? 2059 298022 4241166
SWA.06 Swauger_Ck Walker Mono HT_NF? 2208 296978 4246408
VIR.04 Virginia_Ck Walker Mono H_ROW 2045 306544 4229369
VIR.05 Virginia_Ck Walker Mono HT_NF 2078 307622 4227978
WAL.05 Walker_Ck Mono Mono Inyo_NF 2436 309013 4193687
WAL.10 Walker_Ck Mono Mono H_ROW 2075 315780 4197649
Table 1. Site ID Codes, waterways, drainages, counties, landowners, elevations, and UTM coordinates of
CESAME 2012 Sampling Locations.

Appendix B : Sampling Locations and Dates
CESAME Final Project Report – Contract 11-167-160
Page 31 of 39
site_id location
BUC.02 Immediately above bridge that crosses Buckeye Creek in Lower Buckeye Meadow, just above campground
BUC.03 On Road 017 bridge over Buckeye Creek, 75 m upstream of bridge.
BUC.04 North branch of Buckeye Creek, 860 m N of Centennial Ranch driveway, immediately upstream of Hwy 395 bridge
BUC.05 South branch of Buckeye Creek, 630 m N of Centennial Ranch driveway, immediately upstream of Hwy 395 bridge
CON.10 80 m downstream from Convict Lake
CON.20 Immediately downstream of confluence of Channels 3 and 4
CON.30 120 m below Highway 395 crossing
CON.40 Dirt road that leaves Benton Crossing Road on E just before Whitmore ball fields, follow for 500 m, park at gate
EWK.06 200 m upstream of Hwy 395 bridge, at E end of Kingsley Street
HIL.20 Just below culvert under Juniper Drive
LEE.10 Last pullout on Poole Plant Road, on R before reaching Poole Plant (150 m upstream)
LEE.15 30 m below LADWP diversion dam
LEE.17 Immediately above culvert under Hwy 120
LEE.20 10 m above culvert under Hwy 395
LEE.30 Immediately above Test Station Road ford of creek
MAM.10 Outlet of lowermost Twin Lake, immediately downstream of Lake Mary Road bridge
MAM.20 Valentine Reserve, immediately upstream of easternmost trail bridge
MAM.30 S of Mammoth Creek Road, 185 m E of Old Mammoth Road, 75 m W of pedestrian bridge
MAM.40 Immediately upstream of bridge on Old Highway 395
MAM.50 30 m upstream of confluence with Hot Creek
MCG.15 110 m up trail from trailhead parking lot
MCG.17 760 m (on road) below McGee Creek Pack Station, pullout on S side of road below meadow
MCG.20 Immediately upstream of Crowley Lake Drive bridge
MCG.30 500 m upstream (straight-line distance) from Convict Creek junction, at fence corner
MIL.20 1.8 km upstream (straight-line distance) of Lundy Canyon trailhead
MIL.30 Tributary from Burro Lakes, immediately above trail crossing tributary
MIL.40 Immediately below first beaver pond complex above Lundy Reservoir
MIL.60 Immediately upstream of Hwy 395 culvert
MIL.80 Immediately upstream of Cemetery Road culvert

Appendix B : Sampling Locations and Dates
CESAME Final Project Report – Contract 11-167-160
Page 32 of 39
site_id location
OWE.10 Glass Ck at trailhead S of Obsidian Dome
OWE.15 Deadman Ck immediately above Hwy 395 culvert
OWE.20 Owens R immediately upstream of Forest Road 2S04
PAR.20 430 m (straight-line distance) WSW of Parker Lake trailhead
PAR.30 Immediately above Hwy 395 culvert
RBS.02 At west end of meadow that is west of Mono Village
RBS.04 On Road 017 bridge over Robinson Creek, 100 m upstream of bridge. Upstream of of Doc and Al's Resort
RBS.07 N.branch of Robinson Creek, 290 m N of Cent.Ranch driveway on Hwy 395, upstream of Hwy 395 bridge
RBS.08 S.branch of Robinson Creek, 120 m N of Cent.Ranch driveway on Hwy 395, upstream of Hwy 395 bridge
ROC.10 At Mosquito Flat trailhead, 30 m upstream of pedestrian bridge to walk-in campground
ROC.20 Immediately upstream of culvert NE of Palisade Campground
ROC.30 Dwnstr. first culvert on Rock Creek Road when driving uphill from Hwy 395, upstream of French Campground
RUS.10 Yost Ck at end of Venice St, just above June Lake PUD diversion structure
RUS.20 Reverse Ck at first culvert upstream of Double Eagle Resort
RUS.30 Immediately above Hwy 158, below SCE hydro plant
RUS.50 Above gauging station, upstream of Grant Reservoir
RUS.70 20 m upstream of old Hwy 395 bridge
RUS.80 Immediately upstream of Test Station Rd culvert over Rush Creek
SWA.02 Immediately downstream of culvert on Swauger Creek Road, first creek crossing, 2 km N of Hwy 395
SWA.05 Below Huntoon Valley, 2.9 km N of Buckeye Road/Forest Service compound on Hwy 395
SWA.06 Above Huntoon Valley, 2 km S of Swauger Creek Road on Hwy 395, dirt road leaves Hwy 395 and crosses creek
VIR.04 450 m N of Willow Springs Resort on Hwy 395, at USGS stream gage
VIR.05 430 m N of Bodie Road (Hwy 270) junction
WAL.05 Immediately above trail crossing of creek, 145 m (straight-line distance) upstream of Walker Lake
WAL.10 Immediately upstream of Hwy 395 culvert
Table 2. Descriptions of Locations of CESAME 2012 Sampling Locations from Table 1.

Appendix C : qPCR Standard Operating Procedures
CESAME Final Project Report – Contract 11-167-160
Page 33 of 39
APPENDIX C
CESAME Enterococci and Escherichia qPCR Assay Standard Operating Procedure Dr. Craig E. Nelson, June 2013
Standardized to EPA document EPA-821-R-10-004: “Method A: Enterococci in Water by TaqMan®
Quantitative Polymerase Chain Reaction (qPCR) Assay” (April 2010)
Laboratory Details and Sample Handling:
Sample collection and handling are described in the CESAME QA/QC Section E: Appendix. All
equipment guidelines in EPA-821-R-10-004 are met. Reagent preparation is done in a bleach-
and UV-sterilized laminar flow hood. Sample preparation (membrane filtration and subsequent
DNA extraction) is done in separate laboratories, with DNA extraction done in benchtop area
separated from reagent preparation that is bleach- and ethanol- cleaned after each use.
Handling of amplified DNA is isolated to a separate room to avoid contamination of samples and
reagents. All materials are disposed of according to institutional guidelines for biohazardous
waste. Quantitative PCR is done on an Applied Biosystems StepOnePlus or ABI7300 or
Eppendorf Mastercycler® ep realplex. All recommended safety guidelines are followed in
accordance with EPA-821-R-10-004 and institutional recommendations.
Reagents and Standards:
1) DNA Extraction Kits: MoBio PowerSoil® DNA Isolation Kit (12888)
2) qPCR Master Mix: Thermo ABsolute Blue qPCR ROX Mix (AB4139)
3) Primer and Probe Sets: We employ Integrated DNA Technologies PrimeTime® Assays
a. Entero1a: (Ludwig & Schleifer 2000, Haugland et al. 2005, USEPA “Method A” 2010)
i. Forward Primer - AGAAATTCCAAACGAACTTG
ii. Reverse Primer - CAGTGCTCTACCTCCATCATT
iii. Probe – 6-FAM™/TGGTTCTCT/ZEN™/CCGAAATAGCTTTAGGGCTA/IB®FQ/
b. EC23S857: (Chern et al. 2011)
i. Forward Primer - GGTAGAGCACTGTTTTGGCA
ii. Reverse Primer - TGTCTCCCGTGATAACTTTCTC
iii. Probe - 6-FAM™/TCATCCCGA/ZEN™/CTTACCAACCCG/IB®FQ/
4) Standards: Genomic DNA from the American Type Culture Collection for each assay:
a. Entero1a: Enterococcus faecalis strain V583 (ATCC® 700802D-5™)
b. EC23S857: Escherichia coli strain Crooks (ATCC® 8739D-5™)
5) Control Cultures: Freeze-dried cultures (Microbiologics E-Power Pellets) are hydrated, checked
for viable cell concentrations via membrane filtration according to CESAME protocols (EPA
9222D and 9222G), and filtered for at known densities as Control Culture Standards:
a. Entero1a: 0366E3 Enterococcus faecalis ATCC® 29212
b. EC23S857: 0791E4 Escherichia coli ATCC® 5181

Appendix C : qPCR Standard Operating Procedures
CESAME Final Project Report – Contract 11-167-160
Page 34 of 39
Quality Control:
1) Method Blanks: A volume of 800 mL autoclaved deionized (Milli-Q) sterile water is filtered
on every sampling date (4-8 samples) & filter and DNA extraction proceeds as for samples.
2) Positive and Negative Controls: Every day that samples are analyzed, or when reagents are
changed,both control cultures are run for each assay (20,000 copies) to check for both
positive and negative results for the target and non-target assay respectively.
3) No Template Controls (NTCs): Every day that samples are analyzed, on every plate, three
wells are devoted to NTCs consisting of DNA elution buffer (Tris-EDTA).
4) DNA Standards and Standard Curves: Extracted genomic DNA (see above) is quantitated
using the Invitrogen QuBit system via PicoGreen fluorescence. Calculations are used to
estimate copy number of 23S ribosomal subunit genes (lsrRNA) and understanding of the
genome size of the organism from which the Standards are extracted – detailed below. A
composite standard dilution series is run in triplicate on each assay plate (see below) and
analyzed using least squares log-linear regressions predicting Ct from Standard Quantity
(Copies per Well). These regressions are standard curve equations within the StepOnePlus
software system to calculate Quantity from Ct for Samples and Controls.
Sample Analysis:
1) DNA Extractions – Follow the MoBio Kit Directions with filter in bead tube: Elute 100 uL
2) Standard Dilution Series – See Below
3) qPCR Assays:
a. Dilute working stocks of Standards and Control Samples to target correct copies per
well in 5 uL volumes.
b. Dilute Samples 1:5 to reduce inhibition; thus 5uL of Diluted = 1 uL sample per well
c. Prepare qPCR Master Mix as follows for each sample (plus 10% extra for pipet error)
i. 12.5uL of ABSolute Blue mix, 0.25uL BSA 100X stock for 0.1 mg/mL final, 1uL
Probe/Primer 5uM/10uM Stock for 200/400 nM final, 6.25uL Water
d. Prepare assay plate 20 uL Master Mix per well for the following 96 well layout:
i. Triplicate wells for each of 20 samples (including method blanks) – 60 wells
ii. Triplicate wells for each 8-position standard dilution series – 24 wells
iii. Triplicate wells for NTCs, Positive Controls, Negative Controls – 12 wells
e. Aliquot Samples, Standards, and Controls 5 uL each to wells
f. Cap and centrifuge plate 1000 RPM for 1 min, check for bubbles
g. Set up Run Details with FAM Detection, ROX Background, Auto Baseline, Ct
Threshold = 0.03
h. Run Reactions 15 min 95C followed by 45 cycles of 15s 95C and 30s 60C, hold at 4C
4) Data analysis and calculation of sample copy numbers from standards.
a. Standard curves yield 23S gene copies per 1 uL of sample analyzed
b. 1 uL sample analyzed is 1% of total sample collected if using a 100 uL elution.
c. sample volume filtered (800 mL) = 8 mL sample per 1 uL DNA analyzed
d. Data are reported and calculated as Copies/100 mL = Quantity/8 mL

Appendix C : qPCR Standard Operating Procedures
CESAME Final Project Report – Contract 11-167-160
Page 35 of 39
Standard Dilution and Preparation
1) Standards are purchased at a nominal amount of 5000 ng (typically more)
2) Standards are converted to gene copies using the following conversion factors:
6.02E23 bp mol-1 / 660 g mol-1 = 9.12E11 bp ng-1 * ng purchased = total bp
bp / bp genome-1 = genomes * 23S genes genome-1 = total 23S genes purchased
Enterococcus faecalis V583: 3,359,974 bp genome with 4 copies of 23S gene
Escherichia coli 8739: 4,746,218 bp genome with 7 copies of 23S gene
3) Standards are diluted with Tris-EDTA (TE) 750 uL – Primary Stock
4) Primary Stock is quantitated with PicoGree on Invitrogen Qubit system
a. Final concentrations typically 5-20 ng/uL, 10-20 million copies/uL
5) Standard Stock Solutions are aliquotted from the Primary Stock as follows:
a. Master Stock is prepped at 1 million copies/uL (~5-10%) (1m storage)
b. Working Stock is prepped at 10,000 copies/uL (1:100) (destroy after thaw)
c. Dilution series are prepped by serial dilution planning for 15 uL per well. This is then
aliquotted across three wells of the plate for a final of 5 uL per well in triplicate.
i. 50,000 copies (15uL Working Stock - WS)
ii. 10,000 copies (3uL WS + 12uL water)
iii. 5,000 copies (1:10 of row A)
iv. 1,000 copies (1:10 of row B)
v. 500 copies (1:10 of row C)
vi. 100 copies (1:10 of row D)
vii. 50 copies (1:10 of row E)
viii. 10 copies (1:10 of row F)
ix. This series is best accomplished as follows according to Rows
A. 17 uL of WS, remove 1.7uL for Row C
B. 3.4 uL of WS, add 13.6 water, remove 1.7ul for Row D
C. 15.3uL of water, add 1.7uL Row A, remove 1.7uL for Row E
D. 15.3uL of water, add 1.7uL Row B, remove 1.7uL for Row F
E. 15.3uL of water, add 1.7uL Row C, remove 1.7uL for Row G
F. 15.3uL of water, add 1.7uL Row D, remove 1.7uL for Row H
G. 15.3uL of water, add 1.7uL Row E
H. 15.3uL of water, add 1.7uL Row F

Appendix C : qPCR Standard Operating Procedures
CESAME Final Project Report – Contract 11-167-160
Page 36 of 39
Control Cultures qPCR Calibration SOP Products in use (Please Note CFU concentration and Lot # of each pellet batch): Microbiologics Epower lyophilized pellets: 0791E4 Escherichia coli ATCC® 51813 (as a replacement for previously ordered EZFPC 0795) Should culture on m-FC, should fluoresce on NA-MUG after m-FC, should culture well on NA-MUG direct 0366E3 Enterococcus faecalis ATCC® 29212 (as a replacement for previously ordered EZFPC 0497) Should culture only on NA-MUG direct 0306E3 Enterobacter aerogenes ATCC® 13048 (as a replacement for previously ordered EZFPC 0306) Should not culture on any of our protocols Microbiologics Lyfo-Disks (have not arrived, won’t be used) 0320V Bacteroides fragilis ATCC® 25285 0319L Bacteroides thetaiotaomicron ATCC® 29741 Protocols: Day 1
1) Record Product Code, Species, ATCC Code, CFU concentration and Lot # of each Pellet.
a. Depending on CFU concentration per pellet, plan the next day’s filtering volumes
2) Store Pellets at 4°C in refrigerator
3) Mix up Phosphate Buffered Saline (PBS) according to package directions
4) Autoclave PBS in polypropylene bottles for each pellet resuspension (500ml per pellet in
separate bottle, plus additional sterile water for dilutions, for blanks and for squirt-cleaning) and
allow to cool at room temp for a few hours
5) Pour plates for nutrient agar incubations (4 plates per pellet, two for E. coli subset, two for total)
6) Once cool, place water bottles at 35°C as prep for following day
Day 2
1) First thing in the morning remove pellets (still in containers) from refrigerator and place on
countertop to warm to room temp (1-4 hours)
2) Drop each pellet in 500ml sterilized water warmed to 35°C – remainder return to 4°C
3) Incubate pellet in water 30 mins at 35°C
4) Vigorously Shake pellet suspension
5) Make filters as follows within 30 minutes
a. For each incubation method, plan for 2 alternate dilutions of 100mL targeting a high but
countable density: a reasonable target is 200 CFU…if the pellets yield less than 10% of
their expected CFU then the count will be as low as 20 CFU which is still measurable.
b. Thus - if the expected concentration in the suspension is 10 CFU/mL then recommend:
i. 20ml suspension and 80ml water (expect 20-200 CFU)

Appendix C : qPCR Standard Operating Procedures
CESAME Final Project Report – Contract 11-167-160
Page 37 of 39
ii. 10ml suspension and 90ml water (expect 10-100 CFU)
c. The dilutions can be mixed directly in the filter funnel with the filter in place by first
adding the correct volume of sterile water and next adding the volume of suspension
and pipetting 3X to mix thoroughly
6) Filter the 100ml volumes and culture as previously described and modified below:
a. Culture two dilution/filters on m-FC pads followed by NA-MUG plates (standard assay)
b. Culture two dilution/filters directly on NA-MUG plates, 35-37°C, 36+ hours
7) Filter remaining volume for qPCR and immediately store filter in bead tubes at -20°C standard.
8) Notes on sterility in this procedure:
a. All serologicals must be disposed of in autoclave waste
b. Use a new pair of tweezers/needles for each species of bacteria
c. Rinse towers thoroughly
d. Return all filtrate to original sample bottle – add water to 750ml and autoclave
e. Bleach (10%, 15min) filter funnels, support disks, and tygon tubing; rinse thoroughly
f. Autoclave filter funnels, support disks, tygon tubing, and reservoirs
g. Sterilize all benchtops with 5% bleach followed by 70% ethanol wipes
h. Change gloves frequently and place in autoclaved waste
i. Autoclave waste all incubation plates and anything else that contacts the cultures
References:
Chern, E. C., S. Siefring, J. Paar, M. Doolittle, and R. A. Haugland. 2011. Comparison of quantitative PCR assays for Escherichia coli targeting ribosomal RNA and single copy genes. Letters in Applied Microbiology 52:298–306.
Haugland, R. A., S. C. Siefring, L. J. Wymer, K. P. Brenner, and A. P. Dufour. 2005. Comparison of Enterococcus measurements in freshwater at two recreational beaches by quantitative polymerase chain reaction and membrane filter culture analysis. Water Research 39:559–568.
Ludwig, W., and K. H. Schleifer. 2000. How quantitative is quantitative PCR with respect to cell counts? Systematic and applied microbiology 23:556–562.
USEPA. 2010. Method A: Enterococci in Water by TaqMan® Quantitative Polymerase Chain Reaction (qPCR) Assay. EPA-821-R-10-004
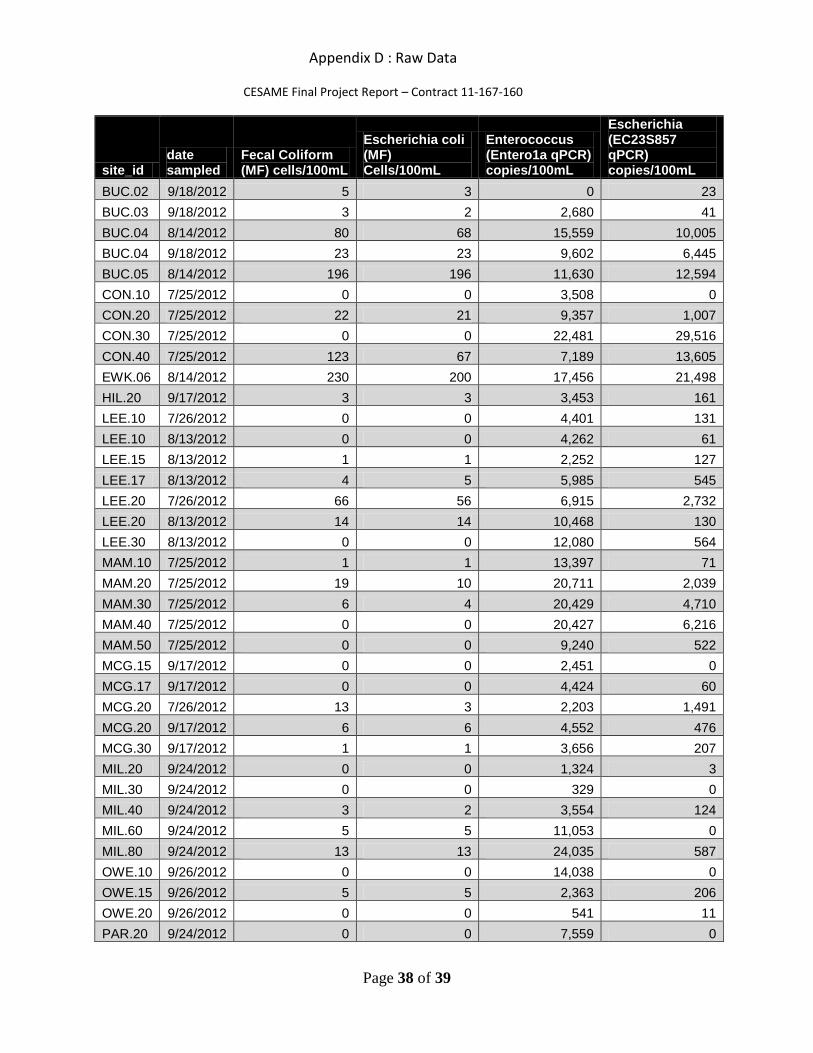
Appendix D : Raw Data
CESAME Final Project Report – Contract 11-167-160
Page 38 of 39
site_id date sampled
Fecal Coliform (MF) cells/100mL
Escherichia coli (MF) Cells/100mL
Enterococcus (Entero1a qPCR) copies/100mL
Escherichia (EC23S857 qPCR) copies/100mL
BUC.02 9/18/2012 5 3 0 23
BUC.03 9/18/2012 3 2 2,680 41
BUC.04 8/14/2012 80 68 15,559 10,005
BUC.04 9/18/2012 23 23 9,602 6,445
BUC.05 8/14/2012 196 196 11,630 12,594
CON.10 7/25/2012 0 0 3,508 0
CON.20 7/25/2012 22 21 9,357 1,007
CON.30 7/25/2012 0 0 22,481 29,516
CON.40 7/25/2012 123 67 7,189 13,605
EWK.06 8/14/2012 230 200 17,456 21,498
HIL.20 9/17/2012 3 3 3,453 161
LEE.10 7/26/2012 0 0 4,401 131
LEE.10 8/13/2012 0 0 4,262 61
LEE.15 8/13/2012 1 1 2,252 127
LEE.17 8/13/2012 4 5 5,985 545
LEE.20 7/26/2012 66 56 6,915 2,732
LEE.20 8/13/2012 14 14 10,468 130
LEE.30 8/13/2012 0 0 12,080 564
MAM.10 7/25/2012 1 1 13,397 71
MAM.20 7/25/2012 19 10 20,711 2,039
MAM.30 7/25/2012 6 4 20,429 4,710
MAM.40 7/25/2012 0 0 20,427 6,216
MAM.50 7/25/2012 0 0 9,240 522
MCG.15 9/17/2012 0 0 2,451 0
MCG.17 9/17/2012 0 0 4,424 60
MCG.20 7/26/2012 13 3 2,203 1,491
MCG.20 9/17/2012 6 6 4,552 476
MCG.30 9/17/2012 1 1 3,656 207
MIL.20 9/24/2012 0 0 1,324 3
MIL.30 9/24/2012 0 0 329 0
MIL.40 9/24/2012 3 2 3,554 124
MIL.60 9/24/2012 5 5 11,053 0
MIL.80 9/24/2012 13 13 24,035 587
OWE.10 9/26/2012 0 0 14,038 0
OWE.15 9/26/2012 5 5 2,363 206
OWE.20 9/26/2012 0 0 541 11
PAR.20 9/24/2012 0 0 7,559 0

Appendix D : Raw Data
CESAME Final Project Report – Contract 11-167-160
Page 39 of 39
site_id date sampled
Fecal Coliform (MF) cells/100mL
Escherichia coli (MF) Cells/100mL
Enterococcus (Entero1a qPCR) copies/100mL
Escherichia (EC23S857 qPCR) copies/100mL
PAR.30 9/24/2012 5 4 6,834 0
RBS.02 9/18/2012 3 3 9,365 48
RBS.04 9/18/2012 15 13 16,488 474
RBS.07 8/14/2012 164 156 28,450 56,868
RBS.07 9/18/2012 57 57 13,835 8,846
RBS.08 8/14/2012 1,000 940 31,972 99,210
ROC.10 7/26/2012 2 2 5,158 0
ROC.20 7/26/2012 1 1 6,478 84
ROC.30 7/26/2012 3 3 13,119 965
RUS.10 9/26/2012 0 0 638 0
RUS.20 9/26/2012 90 80 12,017 1,379
RUS.30 9/26/2012 0 0 529 44
RUS.50 9/26/2012 0 0 6,228 0
RUS.70 9/26/2012 37 9 18,897 47
RUS.80 9/26/2012 7 7 9,524 93
SWA.02 9/18/2012 5 5 8,783 287
SWA.05 8/14/2012 95 105 31,698 12,396
SWA.05 9/18/2012 157 110 18,532 10,969
SWA.06 8/14/2012 120 108 26,060 13,011
SWA.06 8/14/2012 106 100 SWA.06 9/18/2012 197 190 11,222 15,100
VIR.04 8/14/2012 34 31 22,333 3,587
VIR.05 8/14/2012 94 96 25,404 7,041
WAL.05 9/24/2012 0 0 31 0
WAL.10 7/26/2012 6 3 17,677 190
WAL.10 9/24/2012 65 40 7,549 4,064
Table 3. Raw concentrations of viable fecal coliform and E. coli colony forming units per 100 mL from
membrane filtration methods (EPA 9222D and 9222G, respectively) and estimated gene copies per 100
mL from qPCR-based methods for each site and date sampled. Site locations are detailed in Appendix B.