final report: fire department staffing study
TRANSCRIPT

Town of Amherst, MA
October 2, 2017
FINAL REPORT: FIRE DEPARTMENT STAFFING STUDY
• Review 5 years of operations.
• Evaluate approaches to staffing.
• Career vs. other approaches.
• Call / Student staffing.
• Paramedic mix / Shift staffing
• Contracts for EMS
• Operational Improvements
Our Understanding of the Project

• Current system is predicated on several key factors:
– In-town and outside-of-town service delivery.
– Seasonal and day of week impacts due to colleges
– Extended transport times to the hospital due to distance and road network.
– Availability of Call and Student force personnel.
• Analysis of data shows that while there are response time differences, they are not significant.
• Analysis also shows that response times in the Town when the first call is outside the Town are not significantly increased due to staffing and deployment.
Service Delivery
• Myth: growth in workload is due to the contract EMS towns.
• Myth: university students generate disproportionate levels of workload.
• Myth: overtime can be used to address staffing issues forever.
• Myth: the current system is sustainable without changes.
Service Delivery Myths

Growth in Call Volume Comes from Amherst Itself
-
0.50
1.00
1.50
2.00
2.50
3.00
3.50
4.00
4.50
5.00
July
Sep
tem
ber
No
vem
ber
Jan
uar
y
Mar
ch
May
July
Sep
tem
ber
No
vem
ber
Jan
uar
y
Mar
ch
May
July
Sep
tem
ber
No
vem
ber
Jan
uar
y
Mar
ch
May
July
Sep
tem
ber
No
vem
ber
Jan
uar
y
Mar
ch
May
July
Sep
tem
ber
No
vem
ber
Jan
uar
y
Mar
ch
May
Ave
rage
Cal
ls p
er
Day
Month
Average AFD Calls Per Day FY12-FY16 Calls Outside Amherst
-
2.00
4.00
6.00
8.00
10.00
12.00
14.00
16.00
18.00
20.00
July
Sep
tem
ber
No
vem
ber
Jan
uar
y
Mar
ch
May
July
Sep
tem
ber
No
vem
ber
Jan
uar
y
Mar
ch
May
July
Sep
tem
ber
No
vem
ber
Jan
uar
y
Mar
ch
May
July
Sep
tem
ber
No
vem
ber
Jan
uar
y
Mar
ch
May
July
Sep
tem
ber
No
vem
ber
Jan
uar
y
Mar
ch
May
Average AFD Calls Per Day / FY12-FY16 Calls Inside Amherst
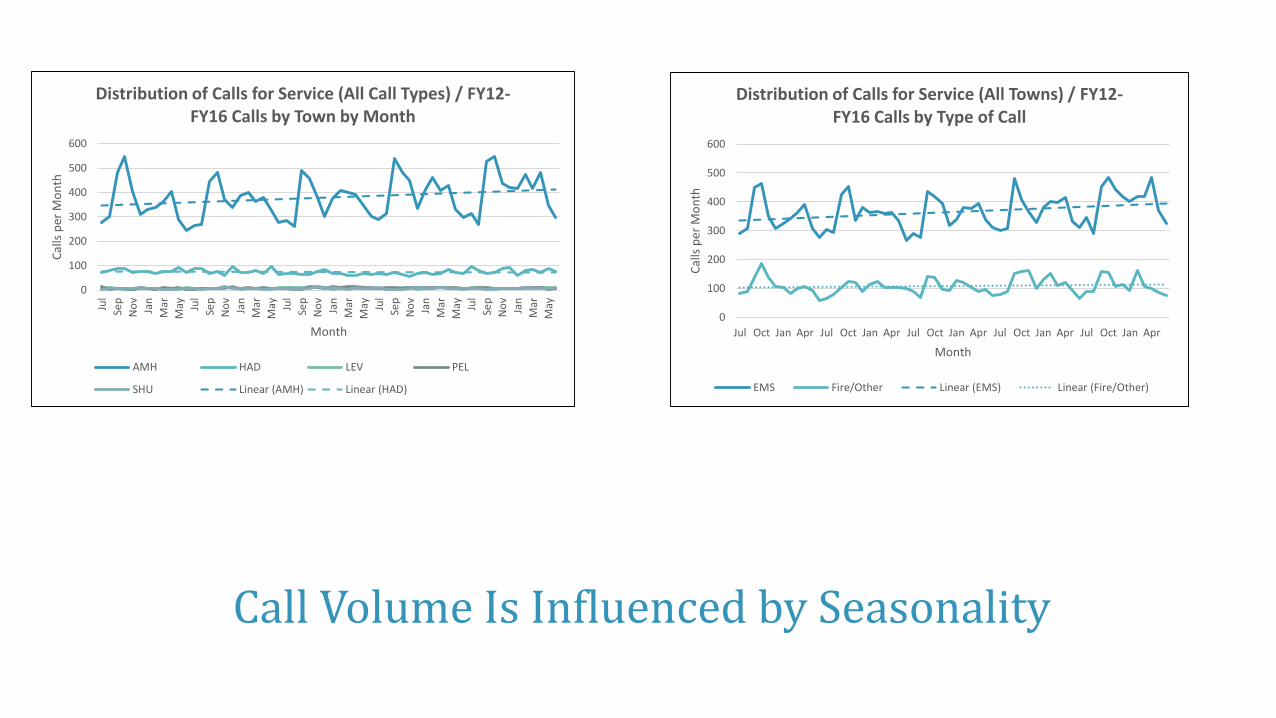
Call Volume Is Influenced by Seasonality
0
100
200
300
400
500
600
Jul
Sep
No
v
Jan
Mar
May Ju
l
Sep
No
v
Jan
Mar
May Ju
l
Sep
No
v
Jan
Mar
May Ju
l
Sep
No
v
Jan
Mar
May Ju
l
Sep
No
v
Jan
Mar
May
Cal
ls p
er M
on
th
Month
Distribution of Calls for Service (All Call Types) / FY12-FY16 Calls by Town by Month
AMH HAD LEV PEL
SHU Linear (AMH) Linear (HAD)
0
100
200
300
400
500
600
Jul Oct Jan Apr Jul Oct Jan Apr Jul Oct Jan Apr Jul Oct Jan Apr Jul Oct Jan Apr
Cal
ls p
er M
on
th
Month
Distribution of Calls for Service (All Towns) / FY12-FY16 Calls by Type of Call
EMS Fire/Other Linear (EMS) Linear (Fire/Other)
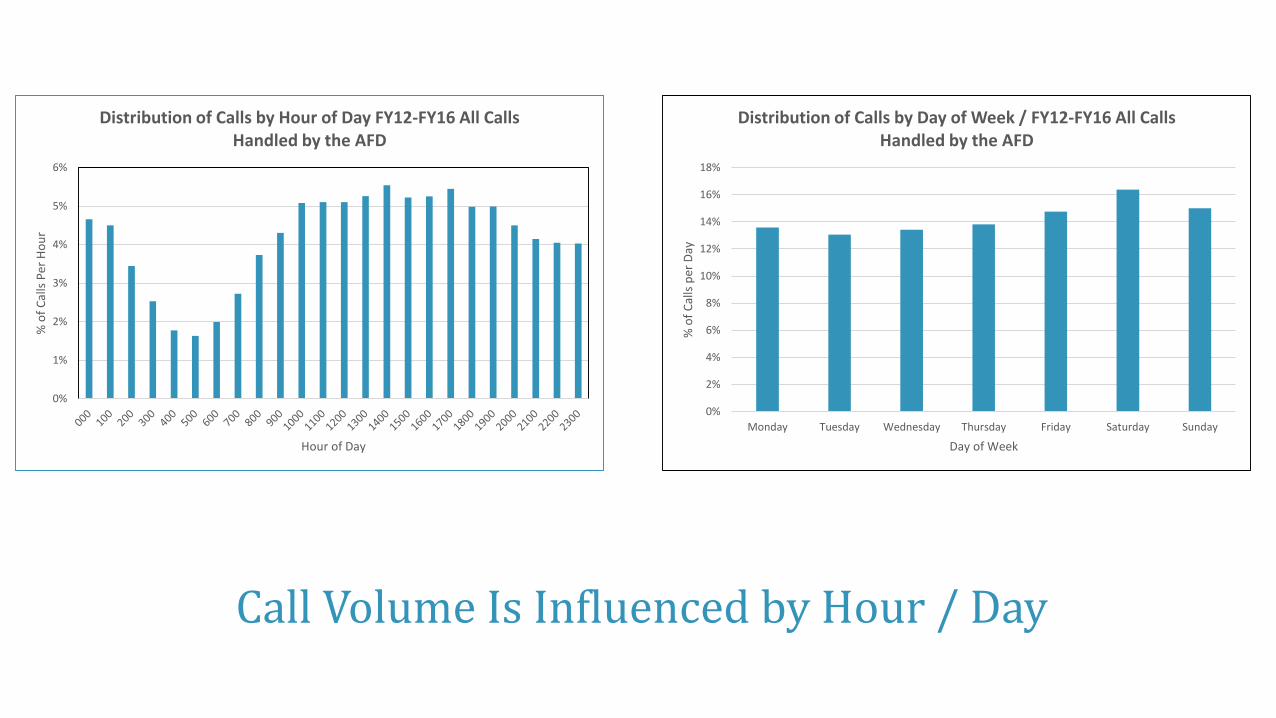
Call Volume Is Influenced by Hour / Day
0%
1%
2%
3%
4%
5%
6%
% o
f C
alls
Per
Ho
ur
Hour of Day
Distribution of Calls by Hour of Day FY12-FY16 All Calls Handled by the AFD
0%
2%
4%
6%
8%
10%
12%
14%
16%
18%
Monday Tuesday Wednesday Thursday Friday Saturday Sunday
% o
f C
alls
per
Day
Day of Week
Distribution of Calls by Day of Week / FY12-FY16 All Calls Handled by the AFD
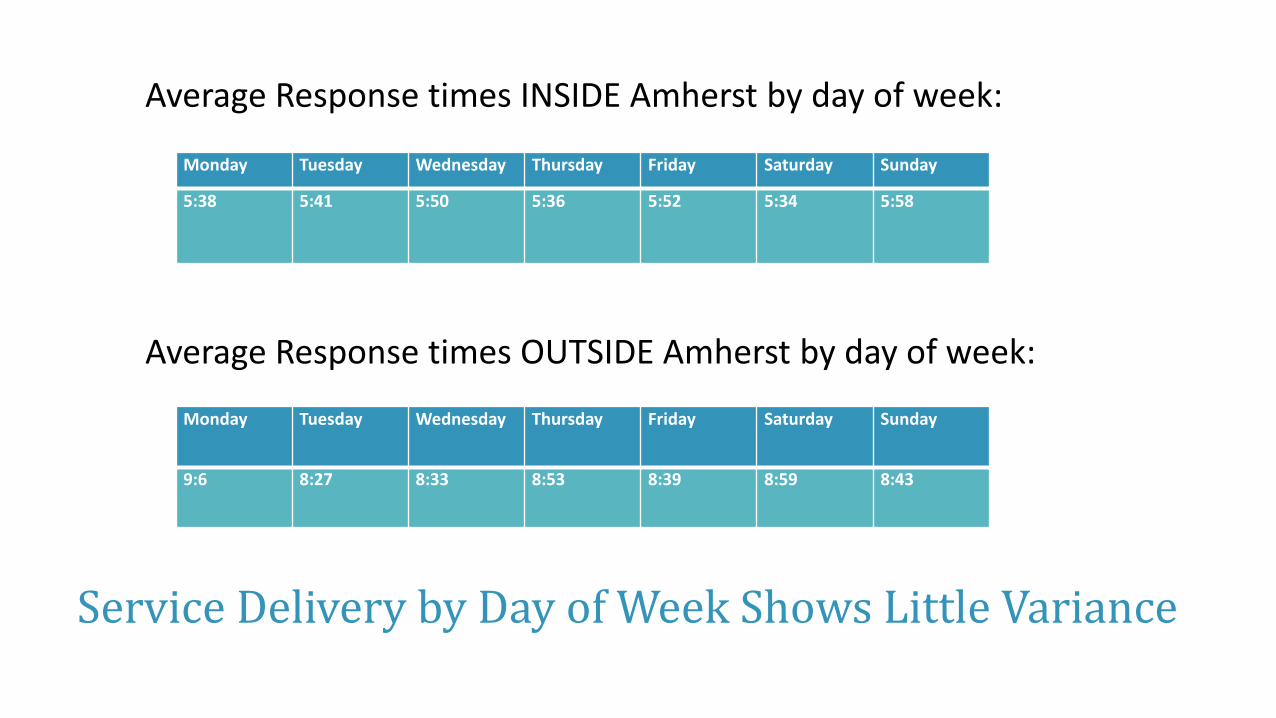
Average Response times INSIDE Amherst by day of week:
Average Response times OUTSIDE Amherst by day of week:
Service Delivery by Day of Week Shows Little Variance
Monday Tuesday Wednesday Thursday Friday Saturday Sunday
5:38 5:41 5:50 5:36 5:52 5:34 5:58
Monday Tuesday Wednesday Thursday Friday Saturday Sunday
9:6 8:27 8:33 8:53 8:39 8:59 8:43

Average Response times INSIDE Amherst by month:
Average Response times OUTSIDE Amherst by month:
Service Delivery by Month Shows Little Variance
July Aug. Sep. Oct. Nov. Dec. Jan. Feb. Mar. Apr. May June
5:48 5:38 5:56 5:34 6:06 5:24 5:32 6:10 5:33 5:36 5:30 5:55
July Aug. Sep. Oct. Nov. Dec. Jan. Feb. Mar. Apr. May June
8:39 9:20 8:57 8:48 8:15 8:08 8:58 8:38 8:15 9:16 8:42 9:32

While Response Times Are Good There Are Challenges
10
12
14
16
18
20
22
24
26
28
30
FY12 FY13 FY14 FY15 FY16
Min
ute
s
Fiscal Year
Average Drive Times to and From Hospital (by Fiscal Year) for all EMS Calls + Transport
Travel to Hospital Travel From Hospital
Linear (Travel to Hospital) Linear (Travel From Hospital)
-
1,000
2,000
3,000
4,000
5,000
6,000
7,000
8,000
9,000
2005 2006 2007 2008 2009 2010 2011 2012 2013 2014 2015
Ho
urs
per
Yea
r
Year
Call Force Annual Hours (2005-2015)
Call Force Annual Hours Linear (Call Force Annual Hours)
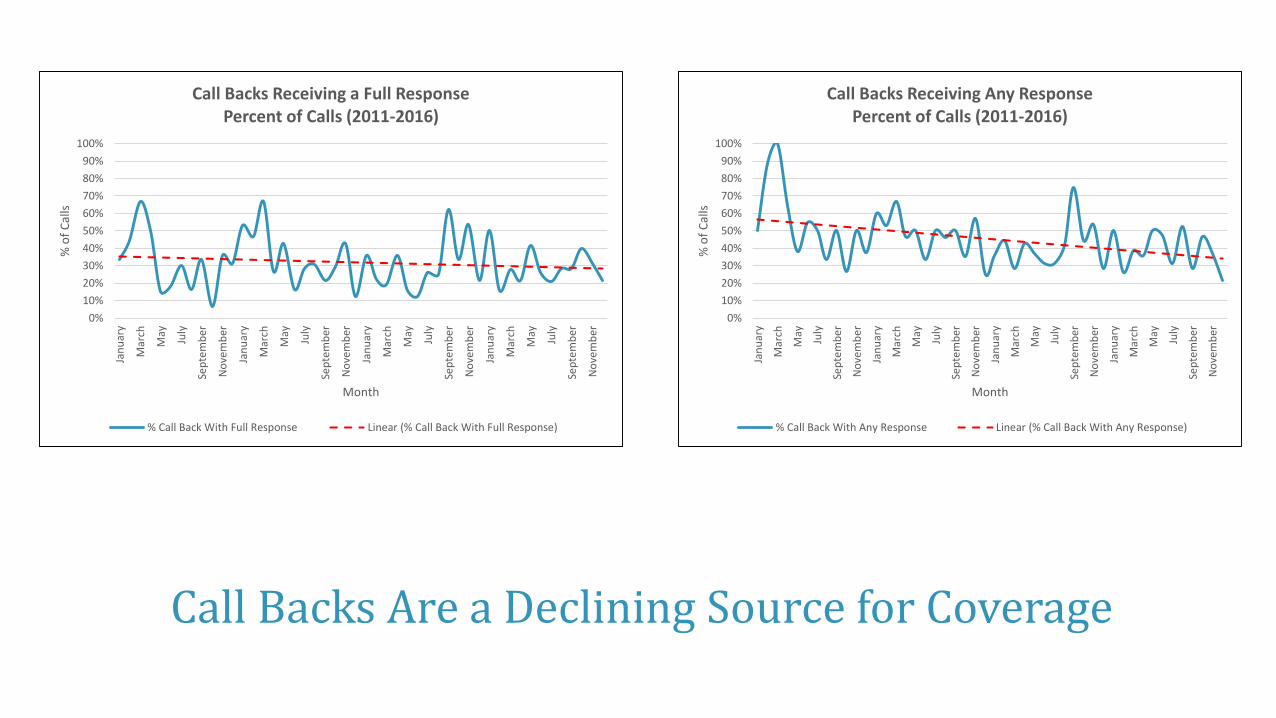
Call Backs Are a Declining Source for Coverage
0%
10%
20%
30%
40%
50%
60%
70%
80%
90%
100%
Jan
uar
y
Mar
ch
May
July
Sep
tem
ber
No
vem
ber
Jan
uar
y
Mar
ch
May
July
Sep
tem
ber
No
vem
ber
Jan
uar
y
Mar
ch
May
July
Sep
tem
ber
No
vem
ber
Jan
uar
y
Mar
ch
May
July
Sep
tem
ber
No
vem
ber
% o
f C
alls
Month
Call Backs Receiving a Full Response Percent of Calls (2011-2016)
% Call Back With Full Response Linear (% Call Back With Full Response)
0%
10%
20%
30%
40%
50%
60%
70%
80%
90%
100%
Jan
uar
y
Mar
ch
May
July
Sep
tem
ber
No
vem
ber
Jan
uar
y
Mar
ch
May
July
Sep
tem
ber
No
vem
ber
Jan
uar
y
Mar
ch
May
July
Sep
tem
ber
No
vem
ber
Jan
uar
y
Mar
ch
May
July
Sep
tem
ber
No
vem
ber
% o
f C
alls
Month
Call Backs Receiving Any Response Percent of Calls (2011-2016)
% Call Back With Any Response Linear (% Call Back With Any Response)

Concurrency Is Driven by Calls and by Drive Times
0.0%
5.0%
10.0%
15.0%
20.0%
25.0%
30.0%
35.0%
40.0%
45.0%0
00
0
01
00
02
00
03
00
04
00
05
00
06
00
07
00
08
00
09
00
10
00
11
00
12
00
13
00
14
00
15
00
16
00
17
00
18
00
19
00
20
00
21
00
22
00
23
00
% o
f C
alls
-C
on
curr
ent
Hour of Day
Concurrent Calls (All Types) 2011-2016 Dispatch vs. Cleared By Time of Day

• Town of Amherst has several existing contracts to provide EMS services to neighboring towns.
• Contracts for service include an annual payment to Amherst.
• This year will generate more than $230,000. Changes in Hadley could impact the Town of Amherst at least in the short term.
• Does not specify who keeps ambulance fees recovered – this should be clarified.
• Trade off to be considered – extra revenue vs. staffing (is the Town staffing extra units). Amherst needs the staff to handle its workload – so the contract EMS program makes sense.
Contracts for Service With Other Towns

• The Student and Call Forces augment the full-time staff. Cannot provide the breadth of service delivered by career personnel.
• Increase expectations for call-back response.
• Implement pilot program for peak staffing of an additional ambulance.– Year One: Start with 2 firefighter / paramedics on 5-day, 8-hour shift.– Alternate Year One: 4 firefighter / paramedics on a 7-day, 12-hour shift.– Year Two: Expand to 4 firefighter / paramedics on a 7-day, 12-hour shift.– Tests: Have call backs been reduced? Have call back response improved?
• Changes in any of the key elements, and / or continued growth will impact ultimate staffing solutions and will require reexamination.
Recommendations