final report def - trade websitestrade.ec.europa.eu/doclib/docs/2010/may/tradoc_146174.pdffinal...
TRANSCRIPT

1
The Economic Impact of the Free Trade Agreement (FTA)
between the European Union and Korea
Report for the European Commission1
DG Trade (framework contract TRADE/07/A2: Korea II)
CEPII/ATLASS
Contributors:
Yvan Decreux (CEPII, Paris)
Chris Milner (GEP, University of Nottingham)
Nicolas Péridy (LEAD, Université du Sud Toulon-Var)
Final Report
May 2010
1 The views expressed herein are those of the authors and therefore in no way reflect the official opinion of the
European Commission. The authors are grateful to Lionel Fontagné (CEPII and Université Paris 1) for useful comments
and suggestions. Thanks also to Thomas Chappuis for research assistance concerning MIRAGE, Danny McGowan and
Tobias Ketterer (GEP, Nottingham) for invaluable research support.

2
Table of Contents:
Executive summary…………………………………………………………………………… 4
Introduction………………………………………………………………………………….... 7
Chapter 1: The EU-Korea Free Trade Area: General features…………………………….11
Section 1: Overview of EU-Korea trade in goods, services and FDI…………………... 11
Section 2: The EU-Korea Free Trade Agreement……………………………………..… 21
Chapter 2: An estimation of EU-Korea trade costs in goods, services and FDI………….. 35
Section 1: The EU and Korean recent trade policies and trade costs………………….…35
Section 2: The measurement of trade costs: A methodological note………………….… 39
Section 3: Trade costs and AVEs in the EU and Korea: The empirical results……….… 43
Chapter 3: The effects EU-Korea FTA: An application of the MIRAGE CGE model…….48
Section 1: An overview of the MIRAGE model and its theoretical underpinning……… 48
Section 2: Scenarios and baselines………………………………………………………. 51
Section 3: Simulation results and comparison with alternative studies ………………… 53
Chapter 4: The case of the automotive sector……………………………………………...... 74
Section 1: The Korean automotive Sector………………………………………………...74
Section 2: Non-Tariff Barriers (NTB) in the Korean car market……………………....…80
Section 3: Qualitative assessment of NTBs in the Korean automotive market………..…86
Section 4: Nature and implications of EU-Korea FTA for Automotive Sector………….91

3
Section 5: Alternative empirical methods for quantifying tariff equivalence of NTBs…... 92
Section 6: Empirical methodology of present study………………………………………..93
Section 7: Estimates of tariff equivalents of current NTBs in Korean automotive sector….97
Section 8: Summary and conclusions…………………………………………………….... 99
Conclusion…………………………………………………………….………………………… 100
References……………………………………………………………………………………… 102
Appendices……………………………………………………………………………….…… 109
Appendix 3.1: Derivation of the AVEs……………………………………………….…….. 109
Appendix 3.2: Values of the elasticities of substitution…………………………..……… 110
Appendix 3.3: Sensitivity analyses………………………………………………….……..111
Appendix 4.1: Data and data sources for empirical modeling on auto sector.…..……….. 125
Appendix 4.2: Econometric results for auto sector……………………………………...… 130

4
Executive summary
This study presents an updated and extended quantitative assessment of the EU-Korea FTA for goods, services and FDI. It also complements the trade sustainability impact assessment (SIA) of the EU-Korea FTA which was launched in October 2007 and finalized in October 2008.
Its first contribution relates to the new and novel calculations of ad valorem tariff equivalents (AVEs) of non tariff protection. Whenever possible, these calculations are based on the use of observed information about trade costs. As a second contribution, the simulations have been implemented with the new version of the Computable General Equilibrium MIRAGE model, which considers differentiation of products according to quality, the explicit introduction of Foreign Direct Investments as well as dynamic effects. Third, the simulations are very close to the official schedule of the agreement concerning tariff elimination, reductions in NTBs and in service restrictions. Finally, this report presents a separate analysis for the automotive industry, which is based on a specific analysis (both qualitative and econometric) concerning especially trade costs.
As a first result, the calculation of AVEs shows that protection due to non tariff barriers (NTBs) exceeds tariff protection to a large extent, especially in Korea. Moreover, the majority of manufactured industries shows higher NTB levels in Korea than in the EU, especially textiles, leather-clothing, metals, machinery and above all cars and trucks as well as other transport equipment. This is mainly due to Korean standards as well as long and costly certification processes.
Protection concerning services is also much higher in Korea. This mainly concerns banking, finance and insurance but also wholesale and retailing trade services as well as “other services” (construction and energy). This can be explained for example by special registration practices which are not open to foreigners (construction), costly standards, “black list” on public projects as well as specific constraints in banking and financial services (non recognition of the “global equity concept”, restrictions of foreign bank operations on the local currency, etc.) However, this gap is less significant for communications and business services, whereas transport services are a bit less protected in Korea.
Results of the simulations show that the effects of the EU-Korea FTA on GDP are positive for both the EU (0.08%) and Korea (up to 0.84%). Welfare gains are also positive and significant for Korea (up to 1.12%). These gains are mainly due to terms of trade improvement, capital accumulation (through increased investment) as well as variety gains (increase in the number of varieties available to the consumer due to the FTA). On the other hand, the EU welfare gain is smaller (+0.02%). The higher welfare gains expected for Korea are essentially due to its initial higher level of protection as well as to its smaller economic size relative to the EU.
Both the EU and Korea show positive and significant effects on bilateral exports and imports. As a matter of fact, the rise in Korean bilateral exports to the EU amounts to up to 38.4%, whereas EU bilateral exports to Korea increase even more (up to 82.6%), as a result of the initial high protection in Korea.

5
With regard to effects on aggregate bilateral trade in value, the increase in EU exports to Korea amounts to a minimum of 33 billion euros and a maximum of 41 billion euros depending on the baseline considered. In addition, EU imports from Korea increase by up to 34 billion euros. This makes it possible to improve the EU trade balance with regard to Korea by up to 10.1 billion euros. This improvement is significant, given that in 2008, the EU faced a 13.8 billion euros trade deficit vis-à-vis Korea. Sectoral bilateral trade effects are generally significant:
- The most important export increase from the EU to Korea concerns cars and trucks (about 400%, i.e. 8 billion euros). This expected result is due to the high level of NTBs in the Korean car industry.
- Similarly, a significant increase in EU meat and dairy product exports and more generally other agricultural and food products is also due to the liberalization of the Korean market in the FTA.
- The EU is also in a position to significantly increase its exports of other industrial products (up to 84%) as a result of Korean reduction in NTBs. In particular, machinery and electronic equipment exports which currently account for one-third of EU overall exports to Korea, are expected to grow by more than 65% in the most favorable scenario. However, if the EU and Korea implement FTAs with other countries, this bilateral increase will be smaller. In any case, as a result of this export increase, intra-industry trade may also develop, since EU producers will enjoy a better market access in Korea, especially in consumer electronics.
- Korea also increases its bilateral exports of manufactured products, especially textiles, leather/clothing as well as cars, other transport equipment, chemicals and other manufactured products. For these latter products, an increase in intra-industry trade is also expected. However, Korean exports of services to the EU are expected to decline slightly.
- The analysis of sectoral bilateral trade in value provides the following results: EU exports to Korea significantly exceed imports regarding chemicals, machinery and other manufactured products. This leads to an improvement of the EU bilateral trade balance by about 15 billion euros for these industries taken together. The other sectors with positive effects on the EU bilateral trade balance include agriculture and food products (meat, dairy and other food product for about 5 billion euros) as well as services (up to 2 billion euros). On the other hand, the rise in EU bilateral imports of cars exceeds that of exports. Consequently, the EU trade balance regarding the car industry deteriorates by 5 billion euros (up to 13 billion euros depending on the baseline considered). Other EU trade balance deterioration concerns textiles (3 billion euros). It should be noted that the increase of Korean exports of textiles and cars may be overestimated since the model cannot take in account of the impact of rules of origins or the recent increase of the Korean car production in Europe or in third countries for exports to the EU.
The EU-Korea FTA generally has small production effects in the EU. Small positive effects may be found in some animal and food products (meat, dairy products, beverage and tobacco and other food

6
products), chemicals, machinery as well as other manufactured products. Transport services (sea and air transports) also exhibit a small production expansion. Conversely, a reduction in production occurs in textiles, leather and clothing as well as cars and other transport equipment. However, it is worth mentioning that this reduction is calculated compared to the baseline. Consequently, considering observed growth trends in the EU, production may not be reduced in absolute terms compared to today, but rather it will not expand as much as it would do without the agreement. The same reasoning is valid for other variables, such as employment.
Korea shows to some extent a reverse picture, although the magnitude of the production effects is more significant. In this regard, significant increases can be observed for textiles, cars/trucks, leather/clothing as well as other transport equipment to a lesser extent. Conversely, negative production effects are recorded for dairy products and meat as well as metals, machinery, electronic equipment, other manufactured products and transport services to a lesser extent.
Finally, the study shows very small employment effects for the EU. With regard to Korea, sectoral employment effects are more significant, with positive effects for textiles, leather/clothing as well as for cars. Conversely, negative effects are expected for specific manufactured products (machinery, electronic equipment and other manufactured products), specific services (business, transport and insurance) as well as dairy products and meat. However, overall employment effects are also very small in Korea.
The sensitivity analysis shows that NTBs play a crucial role in the effects of the EU-Korea FTA. The higher the initial NTBs, the higher the impact of the FTA, especially in terms of sectoral trade. Finally, the consideration of trade facilitation slightly increases the trade growth due to the implementation of the agreement.
As compared with the Copenhagen study, the basic macroeconomic results are similar in terms of GDP changes. However, the bilateral trade growth is slightly higher in the present study. These differences can be mainly explained by the inclusion of NTB cuts which lead to additional trade effects but few GDP effects. The other explanations of the differences across the two studies are related to differences in the baseline and scenarios and to differences in the calculation of protection in services. Sectoral results are more different, as expected. In particular, the Copenhagen study expects a decrease in the EU production of manufactured goods (and a corresponding rise in Korea). In the present study, this is generally not expected given that the EU is in a position to take advantage of the significant reduction in the high initial NTBs in Korea. In particular, the production of chemicals, machinery and other manufactured products is generally expected to increase and the EU is in a position to increase the exports of these products.
The general conclusion of the present study is that the EU may improve its position in several industries (chemicals, machinery, other manufactured and food products) as well as in specific services to a lesser extent (business, insurance and transport services ). On the other hand, Korea takes advantage of the agreement for specific manufactured products (textiles, leather/clothing, cars and other transport equipment).

7
Introduction
Since the initiation of the “Global Europe”, the European Union (EU) has launched a new generation of Free Trade Agreements (FTAs) as a means of extending the trade liberalization process in the WTO context. In this regard, the FTA between the EU and the Republic of Korea is the first agreement of this new type (European Commission, 2009a and 2009b)2.
On the Korean side, the regional trade policy has been recently intensified: in addition to the renewal of the FTA with Asian and Pacific partners (APTA), some new FTAs have been concluded with Chile, EFTA, Singapore as well as ASEAN, the USA and India (WTO, 2010). Other FTAs are under negotiation, especially with Japan, Canada, Mexico and the EU (Table I.1). These agreements, which the WTO has been notified, cover inter alias, goods, services and investment, as a means of reforming the Korean economy and raising competitiveness through further liberalization in key industries (WTO, 2009).
Table I.1 Regional trade agreements between Korea and its partners
(1) Asia Pacific Trade Agreement, formerly known as "Bangkok Agreement"; Entry into force of the amended Agreement: 01-Sept-06 ; current members: Bangladesh; China; India; Korea; Lao People's Democratic Republic; Sri Lanka.
(2) Several agreements have been signed with ASEAN. These concern trade liberalization (2005), services (2007) as well as FDI (2009).
Source: European Commission (DG Trade) and WTO (2010)
2 The other agreements under negotiation involve India, Singapore and Canada. In addition, a EU- Vietnam FTA is
currently in scoping phase.
In force Signed or initialled Under negotiation
APTA (1) 1976
Chile 2004
EFTA 2006
Singapore 2006
ASEAN (2) 2005-2009
India 2010
USA 2007
EU 2009
Japan *
Canada *
Mexico *
Australia *
New-Zealand *

8
The benefits expected from such a regional integration process are numerous. First, since the initiation of the Doha round in 2001, multilateral negotiations have tended to stall. Consequently, the development of regional integration may be considered as a means to achieve additional trade liberalization, and thus to increase trade between the regional partners. The other benefits have been identified by the new trade theory (Helpman and Krugman, 1989), including the new theory of regional integration (Baldwin and Venables, 1995). These include gains due to the removal of NTBs, terms of trade effects, gains related to imperfect competition, such as scale economies and product varieties as well as dynamic gains, brought by capital accumulation, FDI, productivity spillover effects and other efficiency effects.
An emerging literature has developed some quantitative assessments of these agreements. These studies generally highlight significant trade and welfare effects for the partners involved. For example, the EU-Korea FTA was first assessed by Heungchong (2005), followed by Jong (2006) as well as the Copenhagen study (2007). These studies point out significant gains for the two partners. For example, the Copenhagen study (2007) shows that the EU may significantly increase its exports of services to Korea, because of its comparative advantage and the high level of protection in Korea. On the other hand, Korea is expected to increase its exports of goods, especially motor vehicles and electronic machinery. This study also stresses significant production effects for goods and services as well as GDP growth effects for Korea, estimated to be about 1.6%.
This quantitative literature has been supplemented by qualitative or sectoral studies. For instance, CEPS (2007) provides a detailed analysis of the FTA implications, especially for sensitive industries. Deardorff (2007) and Lee et al. (2008) address the various policy options for Korea, especially its new involvement in the regional integration process. They point out some key issues related to rules of origin, sensitive industries, the extension of FTAs to new members as well as the fears of trade diversion. Similarly, Nicolas (2009) dedicates her article to the main problems related to the implementation of the EU-Korea FTA. These involve divergences in highly sensitive sectors (agriculture, automotive industry), problems due to the asymmetry of the two partners in terms of size and economic development as well as problems related to the transfer of the same concessions granted by Korea to the USA into the EU-Korea FTA. Lee and Song (2008) focus on the FTA qualitative implications for agriculture. They expect an increase in the EU share of Korean imports but stress the role of potential trade diversion which may be detrimental to the EU if Korea implements a FTA with the USA. Relying on the calculation of various complementarity indexes, Andreosso (2009) underlines the likely gains of the EU-Korea FTA provided that these two economies are on the whole structurally complementary3.
3 For a detailed analysis of these studies’ results and their comparison with the present study, refer to Chapter 3.

9
Similar quantitative or qualitative studies have also been dedicated to the FTAs between Korea and other partners4. In particular, the US-Korea FTA was assessed by Lee (2008). This article shows that Korea may gain up to 6% in terms of GDP growth. Much of this gain accrues from productivity improvement due to increased competition with US producers. Another important source of gain is due to increased efficiency from the reduction of NTBs. Zhuang et al. (2007) as well as Kiyota and Stern (2007) provide a comparable quantitative assessment, although the GDP gain for Korea may not be as significant as in the previous study. Clark (2009) focuses on changes in intra-industry trade indicators as a means of assessing factor adjustment pressures that may arise in Korea from the US-Korea FTA. Results indicate that few industries are concerned with these adjustment problems. This suggests that the great bulk of trade between the USA and Korea is of inter-industry type.
The present study proposes an updated and extended quantitative assessment of the EU-Korea FTA. It also complements the trade sustainability impact assessment (SIA) of the EU-Korea FTA which was launched in October 2007 and finalized in October 20085. Several contributions are proposed in the present study. Firstly, the quantitative assessment is implemented for trade liberalization of goods, services as well as FDI (establishment). A second contribution is that simulations are very close to the actual contents of the agreement. For example, the simulations concerning the tariff removal rigorously respect the official schedule described in the agreement (at HS6 level). In addition, the scenarios considered for NTB reductions are industry-specific and also closely related to the official agreement. The same remark also applies to services, including Mode 3, for which the precise schedule for each service category has been introduced in the model.
A third contribution relies on novel calculations of AVEs. In this regard, we used as much as possible the observed information about trade costs (both qualitative and quantitative) to build up the calculations of AVEs. As a result, the computation technique does not rely on the residuals of gravity estimates, but on the appropriate transformation of actual trade costs into tariff-equivalents.
In addition, the CGE model is based on the new version of MIRAGE, developed by CEPII and updated in Decreux and Valin (2007). This new version includes key characteristics in imperfect competition. These involve the consideration of both horizontal and vertical product differentiation for intra-industry trade, the specific modeling of trade costs and their components, the inclusion of FDI as well as the consideration of dynamics (non constant labor and productivity, variation of the
4 These mainly concern the USA-Korea FTA. In addition, Park et al. (2008) propose a quantitative appraisal of the
ASEAN-Korea FTA. Results of the CGE shows significant trade effects within this area. However, welfare and growth
effects are insignificant for Korea. 5 This Assessment was carried out by the consortium led by IBM Business Consulting in cooperation with DMI
Associates, TAC Financial and TICON Development Consulting. The Trade SIA of the EU-Korea FTA used different
indicators to assess potential impacts, covering the three pillars of sustainable development – economic, social and
environmental. The results are mainly based on quantitative tools, but incorporated also input from stakeholders and
experts to enable adequate analysis of the complex social and environmental impacts.
The Trade SIA process engaged Civil Society and was built on open consultation. The Consultant also benefited from the
valuable written input submitted by various stakeholders. In addition to several meetings with Civil Society in Brussels,
including representatives of member states, industry associations, a special dedicated local workshop was organized in
Seoul in December 2007, involving local stakeholders.

10
capital stock due to investment, etc.). These contributions are intended to provide some new and more precise insights about the potential effects of the EU-Korea FTA.
This report is organized as follows: chapter one presents an overview of the EU-Korean trade relationships concerning goods and services (including Mode 3). It also provides an extensive analysis of the contents of the EU-Korea FTA, especially with regard to the detailed schedules concerning the elimination of protection for goods and services.
Chapter 2 is dedicated to the measurement of trade restrictions in goods and services. It first briefly provides an overview of the Korean and the EU trade policy and trade costs. This makes it possible to get a first picture of the protection in the two partners, and thus a better understanding of the consequences of the EU-Korea FTA. The second section is devoted to the presentation of the methodology used to measure AVEs for non tariff protection in goods, services and FDI. The analysis of the results derived from the AVE calculations is finally presented.
In chapter three, the new version of the MIRAGE model is implemented to calculate the effects of the EU-Korea FTA. The theoretical underpinning of the model is first presented, as well as its basic characteristics. Then, the scenarios and baselines are described before the implementation of the simulations and the analysis of the results. Finally, a comparison with the other existing studies is presented. The sensitivity analysis is detailed in the appendix.
The last chapter is devoted to a case study related to the automotive industry. It provides a specific appraisal of the impact of the EU-Korea FTA in this industry through a partial equilibrium model.

11
Chapter 1: The UE-Korea Free Trade Area: General features.
This chapter aims at analyzing and discussing the contents of the EU-Korea FTA. The first section presents an overview of trade in goods and services between the EU and Korea as well as an analysis of FDI. The second section summarizes and discusses the contents of the EU-Korea FTA. It particularly focuses on the schedules of trade, services and FDI liberalization. In addition, the FTAs signed or under negotiation between Korea and its main partners (the USA, ASEAN, Japan, etc.) are also described and compared to the EU-Korea FTA. This analysis, especially the tariff schedules, will serve as the baseline for the simulations implemented in Chapter 3.
Section 1: Overview of EU-Korea trade in goods, services and FDI
A general overview of EU-Korea trade relationships is presented in Table 1.16. It clearly shows the EU trade deficit with Korea for goods on the one hand and the EU surplus in terms of services and FDI stocks on the other.
Table 1.1: EU trade and FDI with South Korea (billions of Euros, 2008)
Source: European Commission (2009c), based on Eurostat and ITC.
These general figures can be supplemented by additional information for the main categories of the balance of payments. Starting with trade in goods, Figure 1.1 shows the trend in imports, exports and trade balance since 2004. From 2004 to 2006, EU imports from Korea grew at a faster rate than exports. This increased the EU bilateral trade deficit, from 12.7 to 17.9 billion Euros. Subsequently, EU imports stabilized in 2007 and slightly declined in 2008, due to the slowdown of economic growth in the EU. However, exports continued to increase during this period. This contributed to the reduction of the EU trade deficit to 13.8 billion Euros in 2008.
6 2008 has been chosen as the last year available whenever possible. However, sectoral data with GTAP6 aggregation
are not available in 2008.
Imports Exports Balance
Trade in goods 39.4 25.6 -13.8
Trade in services 8.0 14.0 6.0
FDI stocks (2007) 7.9 30.8 23.0

12
Figure 1.1: EU trade in goods with Korea (billions of Euros)
Source: European Commission (2009c), based on Eurostat
A geographical breakdown is presented in Table 1.2. Korea is the 8th import partner of the EU, just after large import markets such as China, the USA, Russia and Japan as well as some EU neighbors (Norway, Switzerland and Turkey). On the export side, Korea is ranked in the 12th position. On the other hand, the EU corresponds to the 3rd import partner of Korea (after China and Japan) and the 2nd export partner after China.
Table 1.2 Geographical breakdown of trade in goods of the EU and Korea (% of total trade, 2008)
Source: European Commission (2009c), based on Eurostat
-30000
-20000
-10000
0
10000
20000
30000
40000
50000
2004 2005 2006 2007 2008
Imports
Exports
Balance
EU import Partners EU export Partners Korea import partners Korea export partners
China 16.0% USA 19.1% China 19.7% China 26.6%
USA 12.0% Russia 8.0% Japan 15.5% EU 13.1%
Russia 11.2% Switzerland 7.5% EU 9.9% USA 11.3%
Norway 5.9% China 6.0% USA 9.1% Japan 6.7%
Switzerland 5.2% Turkey 4.1% Saudi Arabia 6.3% Singapore 4.1%
Japan 4.8% Norway 3.3% Australia 4.0% Hong Kong 3.4%
Turkey 3.0% Japan 3.2% UAE 3.7% Russia 2.6%
South Korea 2.5% UAE 2.4% Singapore 3.2% Mexico 2.1%
Brazil 2.3% India 2.4% Koweit 2.6% India 1.9%
Libya 2.2% Brazil 2.0% Qatar 2.5% Brazil 1.6%
India 1.9% Canada 2.0% Indonesia 2.4% Bvietnam 1.6%
Algeria 1.8% South Korea 2.0% Malaysia 2.2% Malaysia 1.6%
Other 31.2% Other 38.0% Other 18.9% Other 23.4%

13
Overall, Korean trade is more geographically concentrated that EU trade. As a matter of fact, the four main Korean partners (China and the Triad7) account for more than 55% of Korean trade (imports and exports), whereas the four main EU partners barely reach 45% of EU trade.
Additional information is provided by a breakdown according to product category for goods and services (Table 1.3, 1.4 and 1.5). Basically, services account for almost ¼ of total EU exports to Korea, whereas they amount to less than 8% of Korean exports to the EU. Another difference in the trade structure between the two partners is that Korean exports to the EU are much more concentrated. As a matter of fact, the top 3 export sectors account for almost 70% of Korean exports to the EU, whereas they only represent 46% of EU exports to Korea.
Table 1.3: Main EU exports to Korea: breakdown by category
Source: own calculations from GTAP
The main products exported by Korea to the EU concern electronic equipment (36% of total exports). It is followed by cars and trucks (17.5%) and machinery (15%). The other key exports include transport equipment (7.5%), chemicals, rubber and plastics (5.8%) as well as textiles (3.8%). The first service category which is exported, namely business services, only accounts for 2.8% of Korean exports to the EU, whereas air transport, trade and finance barely amount each to 1% of exports. Finally, the other exported commodities include metals (2.7%), other manufactured products (1.9%) as well as leather and clothing (1.2%). Agriculture and food product exports are insignificant (0.3%).
7 The USA, Japan and the EU.
Machinery 26,1%
Chemicals, rubber, plastics 12,6%
Electronic equipment 7,0%
Business services 6,8%
Metals 6,3%
Cars Trucks 6,2%
Sea transport 6,0%
Other Man. Products 5,1%
Air transport 4,5%
Leather, clothing 2,5%
Trade 2,4%
Other food products 2,2%
Transport equipment 2,2%
Textile 1,8%
Other 8,3%

14
Table 1.4: EU-Korea trade in goods and services: breakdown by category
Source: own calculations from GTAP 6 (base year 2004); Note: the shaded figures correspond to the most significant flows.
EU exports to Korea Korean exports to the EU
mn USD % mn USD %
GOODS: 24 903 75,5% 43 312 92,4%
1. Animal, of which:
Meat: cattle.sheep.goats.horse 15 0,0% 0 0,0%
Meat products nec 346 1,0% 1 0,0%
Animal products nec 58 0,2% 0 0,0%
2. Dairy products, of which:
Raw milk 1 0,0% 0 0,0%
Dairy products 120 0,4% 0 0,0%
3. Oth Agr. Prod, of which:
Paddy rice 0 0,0% 0 0,0%
Wheat 0 0,0% 0 0,0%
Cereal grains nec 0 0,0% 0 0,0%
Vegetables. fruit. nuts 5 0,0% 2 0,0%
Oil seeds 0 0,0% 0 0,0%
Sugar cane. sugar beet 0 0,0% 0 0,0%
Plant-based fibers 8 0,0% 0 0,0%
Crops nec 56 0,2% 18 0,0%
Cattle.sheep.goats.horses 5 0,0% 0 0,0%
Wool. silk-worm cocoons 1 0,0% 0 0,0%
Forestry 6 0,0% 0 0,0%
Fishing 4 0,0% 3 0,0%
Vegetable oils and fats 80 0,2% 0 0,0%
Processed rice 0 0,0% 1 0,0%
Sugar 4 0,0% 0 0,0%
4. Other food products 737 2,2% 140 0,3%
5. Beverages and tobacco 387 1,2% 8 0,0%
6. Primary, of which:
Coal 1 0,0% 0 0,0%
Oil 3 0,0% 0 0,0%
Gas 3 0,0% 0 0,0%
Minerals nec 42 0,1% 3 0,0%
7. Metals, of which:
Ferrous metals 825 2,5% 539 1,1%
Metals nec 730 2,2% 141 0,3%
Metal products 536 1,6% 657 1,4%
8. Chemicals, rubber, plastics 4 150 12,6% 2 729 5,8%
9. Textile 597 1,8% 1 791 3,8%
10. Leather, clothing, of which:
Wearing apparel 387 1,2% 394 0,8%
Leather products 439 1,3% 170 0,4%
11. Other Man. Products, of which:
Wood products 300 0,9% 41 0,1%
Paper products. publishing 402 1,2% 118 0,3%
Petroleum. coal products 131 0,4% 43 0,1%
Mineral products nec 535 1,6% 198 0,4%
Manufactures nec 303 0,9% 491 1,0%
12. Machinery 8 613 26,1% 7 119 15,2%
13. Cars Trucks 2 031 6,2% 8 213 17,5%
14. Transport equipment 721 2,2% 3 550 7,6%
15. Electronic equipment 2 319 7,0% 16 939 36,1%
SERVICES: 8 084 24,5% 3 582 7,6%
16. Trade 778 2,4% 383 0,8%
17. Sea transport 1 991 6,0% 359 0,8%
18. Air transport 1 476 4,5% 608 1,3%
19. Other transports 437 1,3% 169 0,4%
20. Communication 143 0,4% 89 0,2%
21. Finance 180 0,5% 373 0,8%
22. insurance 174 0,5% 34 0,1%
23. Business services 2 252 6,8% 1 358 2,9%
24. Tourism 412 1,2% 102 0,2%
25. Public services 209 0,6% 77 0,2%
26. Other services, of which:
Electricity 0 0,0% 0 0,0%
Gas manufacture. distribution 4 0,0% 0 0,0%
Water 5 0,0% 1 0,0%
Construction 23 0,1% 30 0,1%
TOTAL 32 987 100,0% 46 894 100,0%

15
On the EU side, machinery corresponds to the main export category (26% of total exports to Korea). It is followed by chemicals, rubber and plastics (13%) and electronic equipment (7%). The fourth exporting category involves business services (6.8%). Metals, cars/trucks and sea transport services account each for about 6% of EU exports, followed by other manufactured products (5.0%), essentially wood and paper products, as well as air transport (4.5%). In this regard, it is worth mentioning that all transport services aggregated together amount to almost 12% of EU exports.
The other significant export categories include textiles, leather and clothing (4.3%) as well as agriculture and food products (5.4%). The latter involve sensitive commodities and mainly concern beverages, meat and dairy products.
Table 1.5: Main Korean exports to the EU: breakdown by category
Source: own calculations from GTAP6
Tables 1.6 and 1.7 provide detailed information about trade in goods at HS6 level in 2008. Concerning Korean exports to the EU, Table 1.6 confirms the predominance of three main export products, i.e. electronic equipment, transport vehicles as well as mechanical equipment. The electronic commodities mainly include telephones for cellular networks (13%), televisions and monitors (4% of total exports) as well as electronic integrated circuits (2%). Exports of transport vehicles primarily involve tankers and cargo vessels (17%) and motor cars (12%). Finally, Korean exports of machinery equipment mainly include data processing machines (3% including parts). Optical devices must also be added separately to this list (7%).
Electronic equipment 36,1%
Cars Trucks 17,5%
Machinery 15,2%
Transport equipment 7,6%
Chemicals, rubber, plastics 5,8%
Textile 3,8%
Business services 2,9%
Metals 2,9%
Other Man. Products 1,9%
Air transport 1,3%
Leather, clothing 1,2%
Trade 0,8%
Finance 0,8%
Sea transport 0,8%
Other 1,4%
16
On the EU export side as previously mentioned, machinery corresponds to the main export category. It involves a diversified set of products, namely machines for the manufacture of semiconductor devices (3.6%), parts for diesel engines (1.6%), other machines and mechanical appliances (1.6%), valves and other appliances (1.1%) as well as compressors, pumps, etc… Motor cars and other transports account for the second export category (6%). The third export category is made up of chemicals, essentially medicines (2%) and chemical preparations (2%). The other key exports include diversified products, such as whisky, cobalt oxides, products of iron and steel as well as measuring and checking instruments.
These tables also point out that EU exports to Korea are more diversified than Korean exports to the EU. As a matter of fact, the top-25 EU products exported to Korea only amount to 30% of total exports. On the other hand, this ratio is equal to 67% for the top-20 products exported by Korea to the EU.
With regards to intra-industry trade, the calculation of the Grubel and Lloyd indicator (Nicolas, 2009) indicates that inter-industry trade is predominant for the majority of the products traded between the EU and Korea, especially chemicals, machinery as well as the car industry (with the exception of parts and accessories)8.
8 However, this result concerning the car industry is somehow misleading, since it is due to the fact that the Korean
market for motor car has been extremely closed until very recently. As a matter of fact, in 2006, imports were accounting for less than 5% of the total market, with only 56,000 units imported for a total of more than one million units sent into Korea. This share was even lower for passenger cars (4.2%). Interestingly, EU car makers are in a leading position in Korea, with 60% of all imported cars in Korea, much ahead Japan (30%) and the USA (5%). Lastly, it must be pointed out that the Korean car market is currently opening rapidly. As a matter of fact, the share of imports has risen from 0.4% in 2000 to 5% in 2006 (Nicolas, 2009, p.28). Consequently, intra-industry trade is likely to increase rapidly in the coming years between the EU and Korea. In this regard, the EU-Korea FTA is a real opportunity for EU car makers to reinforce their position in Korea, in a context of increased openness and competition in this industry (refer to Chapter 4 for additional analysis on the automotive industry).

17
Table 1.6: Main Korean products exported to the EU (2008)
Source: ITC (2010)
HS6 Designation 1000 euros %
851712Telephones for cellular networks mobile telephones or for
other wirele 5092344 12,8%
890120 Tankers 3988402 10,0%
890190Cargo vessels nes&oth vessels for the transport of both
persons&goods 2893261 7,3%
901380Optical devices, appliances and instruments, nes, of this
Chapter 2661393 6,7%
271019 Light petroleum distillates nes 2461151 6,2%
870332Automobiles with diesel engine displacing more than 1500 cc
to 2500 cc 1936819 4,9%
870899 Motor vehicle parts nes 1334458 3,4%
852990Parts suitable f use solely/princ w the app of headings 85.25 to
85.28 1058453 2,7%
901390Parts and accessories of optical appliances and instruments,
nes 739013 1,9%
847330Parts&accessories of automatic data processg machines&units
thereof 648199 1,6%
870322Automobiles w reciprocatg piston engine displacg > 1000 cc to
1500 cc 599513 1,5%
870323Automobiles w reciprocatg piston engine displacg > 1500 cc to
3000 cc 582032 1,5%
854232 Electronic integrated circuits as memories 430875 1,1%
842952 Shovels and excavators with a 360 revolving superstructure 418208 1,1%
852851Monitors of a kind solely or principally used in an automatic
data-pro 379157 1,0%
847170 Computer data storage units 360685 0,9%
401110Pneumatic tire new of rubber f motor car incl station
wagons&racg cars 338081 0,8%
851770Parts of telephone sets, telephones for cellular networks or for
other 299319 0,8%
854231Electronic integrated circuits as processors and controllers,
whether 281250 0,7%
870321Automobiles w reciprocatg piston engine displacg not more
than 1000 cc 280090 0,7%
Sub-total 26782704 67,3%
Other 13033892 32,7%TOTAL 39816596 100,0%

18
Table 1.7 Main EU products exported to Korea (2008)
The last set of figures concerns FDI patterns (Tables 1.8 and 1.9). Basically, FDI stocks in Korea originating from the EU amount to more than 27 billion USD. This is four times FDI stocks in the
HS6 Designation 1000 euros %
848620Machines and apparatus for the manufacture of
semiconductor devices or 971461 3,6%
854231Electronic integrated circuits as processors and controllers,
whether 670174 2,5%
300490 Medicaments nes, in dosage 541840 2,0%
382490 Chemical/allied industry preparations/prods nes 511868 1,9%
870324Automobiles with reciprocating piston engine displacing >
3000 cc 460409 1,7%
840999 Parts for diesel and semi-diesel engines 434466 1,6%
847989Machines & mechanical appliances nes having individual
functions 425627 1,6%
870323Automobiles w reciprocatg piston engine displacg > 1500 cc to
3000 cc 406664 1,5%
271011 Aviation spirit 316444 1,2%
848180 Taps, cocks, valves and similar appliances, nes 306968 1,1%
870899 Motor vehicle parts nes 274946 1,0%
20329 Swine cuts, frozen nes 255889 0,9%
282200 Cobalt oxides and hydroxides; commercial cobalt oxides 241772 0,9%
890190Cargo vessels nes&oth vessels for the transport of both
persons&goods 239859 0,9%
870840 Tansmissions for motor vehicles 214980 0,8%
732690 Articles, iron or steel, nes 202845 0,7%
848340Gears&gearing,ball screws,gear boxes,speed changers/torque
converters 202601 0,7%
851770Parts of telephone sets, telephones for cellular networks or for
other 194672 0,7%
710813Gold in oth semi-manufactd form n-monetary(inc gold platd w
platinum) 178987 0,7%
220830 Whiskies 172246 0,6%
841480 Air or gas compressors, hoods 166579 0,6%
841330Fuel, lubricating or cooling medium pumps for int comb piston
engines 159031 0,6%
903180Measuring or checking instruments, appliances and machines,
nes 153648 0,6%
740400 Waste and scrap, copper or copper alloy 151647 0,6%
840991 Parts for spark-ignition type engines nes 149208 0,5%
720712Semi-fin prod,iron/n-al steel,rect/sq cross sect,cntg by
wgt<.25% carb 149008 0,5%
Sub-total 8153839 30,0%
Other 19034354 70,0%
TOTAL 27188193 100,0%

19
EU originating from Korea. However, this difference is lower for FDI flows which are only twice into Korea (from the EU) than into the EU (originating from Korea)
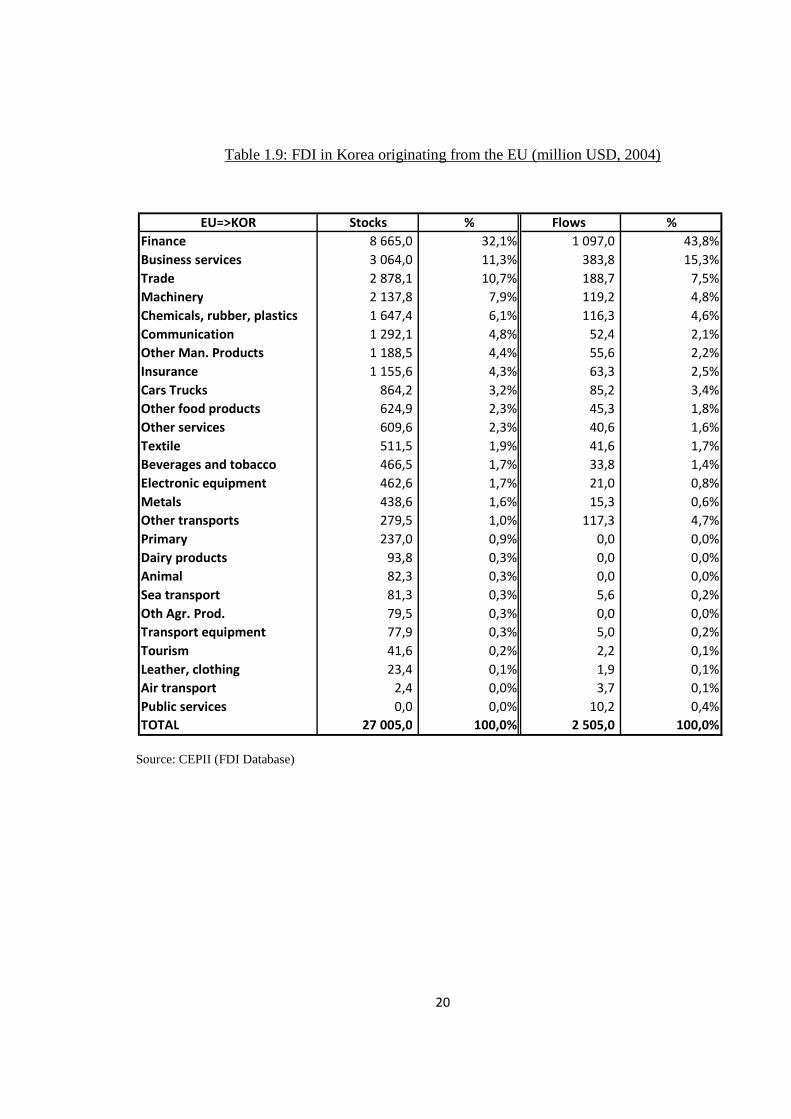
Looking at industry categories, it may be observed than services account for about 2/3 of total FDI for both the EU stocks into Korea and Korean stocks into the EU. However, there are major differences within the service category (Figure 1.2). As a matter of fact, Finance (including banking) represents the great bulk of EU FDI into Korea (1/3 of total FDI into Korea in terms of stocks and 44% in terms of flows), whereas the finance sector account for 8% only of Korean FDI stocks in the EU. Conversely, as a percentage of total FDI, the share of business services and trade is higher for Korea than for the EU.
Table 1.8: FDI in the EU originating from Korea (million USD, 2004)
Source: CEPII (FDI Database)
KOR=>EU Stocks % Flows %
Business services 1 693,1 25,1% 421,9 35,7%
Trade 1 509,2 22,4% 395,9 33,5%
Finance 565,6 8,4% 0,9 0,1%
Chemicals, rubber, plastics 548,3 8,1% 46,7 4,0%
Machinery 402,5 6,0% 63,2 5,4%
Insurance 394,3 5,8% 24,3 2,1%
Primary 231,5 3,4% 47,9 4,1%
Cars Trucks 211,9 3,1% 36,1 3,1%
Electronic equipment 209,7 3,1% 12,7 1,1%
Other Man. Products 171,3 2,5% 34,1 2,9%
Communication 162,8 2,4% 9,1 0,8%
Public services 109,3 1,6% 5,2 0,4%
Metals 103,1 1,5% 7,7 0,7%
Other food products 87,2 1,3% 20,0 1,7%
Other services 65,4 1,0% 19,3 1,6%
Textile 62,8 0,9% 5,0 0,4%
Tourism 56,1 0,8% 3,3 0,3%
Other transports 37,7 0,6% 6,6 0,6%
Dairy products 28,1 0,4% 6,2 0,5%
Beverages and tobacco 21,5 0,3% 5,0 0,4%
Transport equipment 20,2 0,3% 0,9 0,1%
Leather, clothing 14,7 0,2% 1,7 0,1%
Sea transport 14,5 0,2% 1,3 0,1%
Animal 14,2 0,2% 3,3 0,3%
Oth Agr. Prod. 12,2 0,2% 2,0 0,2%
Air transport 2,6 0,0% 0,6 0,0%
TOTAL 6 749,7 100,0% 1 180,9 100,0%
20
Table 1.9: FDI in Korea originating from the EU (million USD, 2004)
Source: CEPII (FDI Database)
EU=>KOR Stocks % Flows %
Finance 8 665,0 32,1% 1 097,0 43,8%
Business services 3 064,0 11,3% 383,8 15,3%
Trade 2 878,1 10,7% 188,7 7,5%
Machinery 2 137,8 7,9% 119,2 4,8%
Chemicals, rubber, plastics 1 647,4 6,1% 116,3 4,6%
Communication 1 292,1 4,8% 52,4 2,1%
Other Man. Products 1 188,5 4,4% 55,6 2,2%
Insurance 1 155,6 4,3% 63,3 2,5%
Cars Trucks 864,2 3,2% 85,2 3,4%
Other food products 624,9 2,3% 45,3 1,8%
Other services 609,6 2,3% 40,6 1,6%
Textile 511,5 1,9% 41,6 1,7%
Beverages and tobacco 466,5 1,7% 33,8 1,4%
Electronic equipment 462,6 1,7% 21,0 0,8%
Metals 438,6 1,6% 15,3 0,6%
Other transports 279,5 1,0% 117,3 4,7%
Primary 237,0 0,9% 0,0 0,0%
Dairy products 93,8 0,3% 0,0 0,0%
Animal 82,3 0,3% 0,0 0,0%
Sea transport 81,3 0,3% 5,6 0,2%
Oth Agr. Prod. 79,5 0,3% 0,0 0,0%
Transport equipment 77,9 0,3% 5,0 0,2%
Tourism 41,6 0,2% 2,2 0,1%
Leather, clothing 23,4 0,1% 1,9 0,1%
Air transport 2,4 0,0% 3,7 0,1%
Public services 0,0 0,0% 10,2 0,4%
TOTAL 27 005,0 100,0% 2 505,0 100,0%

21
Figure 1.2: Bilateral FDI stocks as a percentage of total bilateral FDI (2004).
Source: CEPII (FDI Database)
The other main FDI sectors cover machinery and chemicals (for both the EU and Korea), followed by communication and other manufactured products (with a higher share for the EU), insurance and electronic equipment (higher Korean share) as well as cars and trucks.
To conclude, this section shows the importance of key commodities, services and FDI traded between the EU and Korea. These mainly include machinery, electronic equipment, cars and trucks, some chemical products (including medicines and cosmetics) as well as business, transport finance and trade services (including mode 3). Particular attention will be given to these categories when examining the provisions of the EU-Korea FTA.
Section 2: The EU-Korea Free Trade Agreement
The EU-Korea FTA aims to establish a free trade area for goods, services, establishment as well as the corresponding associated rules. Basically, the main objective is to liberalize and facilitate trade in goods and services, in conformity with Article XXIV of the GATT and Article V of the GATS respectively. The agreement also provides for further liberalization of the government procurement markets as well as protection of intellectual property rights. In addition, trade liberalization is also expected to promote competition in both the EU and Korea while contributing to the achievement of sustainable development. Finally, the agreement states that the promotion of FDI must be achieved
0%
5%
10%
15%
20%
25%
30%
35%
EU=>KOR
KOR=>EU

22
without lowering environmental, labor or occupational health and safety standards existing in the countries involved in the agreement (European Commission, 2009a).
This section is dedicated to the description and the analysis of the contents of this agreement. In particular, it presents the detailed schedules for customs duties elimination (trade of goods). This presentation is complemented by a summary of the provisions concerning NTBs and TBTs9. Moreover, the liberalization of services (including mode 3) is also described. Finally, the provisions included in the main FTAs currently negotiated with Korea (especially with the USA, ASEAN and Japan) are presented and compared to those included in the EU-Korea agreement.
a) Trade provisions for goods: customs duties, NTBs and others.
The schedule concerning the removal of customs duties is spread over a maximum of 20 years starting at the time the agreement enters into force. More precisely, goods are classified into 20 categories, each corresponding basically to annual stages for trade liberalization. Overall, the EU removes its customs duty for almost 80% of total imports from Korea at the time the agreement enters into force. Similarly, Korea immediately eliminates its tariffs for about 2/3 of its imports originating from the EU (see Figure 1.3). Moreover, the EU-Korea FTA is expected to remove almost all tariffs on industrial goods within 5 years. By year 7, both sides are expected to have achieved 98% duty elimination in terms of tariff lines. A limited number of highly sensitive agricultural and fisheries products will have a transitional period longer than 7 years. Rice is excluded from the agreement as well as a few other agricultural products.
Figure 1.3: Tariff schedule of the EU-Korea agreement (% of total imports fully liberalized)
Source: own calculations from data in European Commission (2009a)
9 Although the agreement provides a separate analysis of NTBs and TBTs, we will consider TBTs as additional NTBs in
the subsequent chapters.
50%
55%
60%
65%
70%
75%
80%
85%
90%
95%
100%
0 1 2 3 4 5 6 7 8 9 10 11 12 13 14 15 16 17 18 19 20
Year
Korea EU

23
More precisely, on the EU side, the majority of products are fully liberalized once the agreement enters into force (category “0”). The main sectors which do not fully eliminate customs duties are agriculture and food products. For instance, bovine meat is expected to be free of tariffs after 5 years. Some seafood products are liberalized after 3 or 5 years depending on the product considered. The other products liberalized after 3 to 5 years are mainly milk, honey, some fruit and vegetables, prepared fish and crustaceans, sugar, some prepared cereals as well as tobacco. Some particular products, like clementines, grapes and some other fruits are liberalized after 10 years (up to 17 years) whereas the customs duties corresponding to the most sensitive products, such as fresh tomatoes, oranges and rice are not reduced (see annex 2A of the agreement).
Concerning manufactured products, most duties are expected to be removed immediately after the agreement enters into force, except pneumatic tires, some leather, wood and wool products (up to 5 years), car trucks and small aeroplanes (up to 5 years) as well as some electrical machinery equipment (monitors and projectors)10.
Table 1.10 summarizes the EU tariff liberalization schedule for the top-20 products imported from Korea. It can be observed that the highest base rates concern monitors and projectors (12.3%), motor cars (10%) as well as pneumatics (4.5%). For these products, tariff removal is expected within 5 years at the latest. The other key products, essentially mechanical and electrical machinery as well as ships, face zero or very small tariffs which are expected to be removed at the time the agreement enters into force.
On the Korean side, tariff liberalization also covers almost all EU imports. Even for agricultural products, this agreement will eventually liberalize almost all imports, compared to only 2% before its implementation. However, the tariff schedule can take up to 20 years for some fruit (apple, pears) with safeguard clauses; up to 18 years for some oil seeds and oleagineous, green tea, sesame oil; up to 15 years for some vegetables, meat, products of animal origin or the milling industry, preparation of vegetables, beverages; up to 10 years for some dairy products, live trees and other plants, cereals and sugar. In addition, some agricultural products are excluded from the agreement, like rice and rice products, whereas tariffs rates are expected to remain unchanged for specific products (some fish products, pepper, barley, soya beans, onion, Korean citrus fruit, garlic, etc…). Finally, special schedule or special treatment for the removal of tariff rate quotas are granted to some fish products, grapes, dairy products, honey, oranges, malt, etc.. (for additional details, refer to the tariff schedules of the EU and Korea in Annex 2-A-1 of the agreement).
10
with the exception of TV, video recording.

24
Table 1.10: EU tariff schedule for the main import products
originating from Korea
Source: own computation from European Commission (2009a)
Table 1.11 shows that the highest Korean base rates apply to EU imports of food, such as pork meat (27%) and Whisky (20%). For these products, the complete tariff liberalization is expected after 10 and 5 years respectively. Intermediate base rates (about 6 to 8%) can be found for motor cars (including parts and accessories), cosmetics, medicines, chemical products, measuring instruments as well as some machinery and mechanical appliances. For these products, tariff liberalization ranges between 3 and 7 years. The main other products (apparatus, electronics) are already free of tariff.
Import rank Designation Base rate Staging category
1 Television, sound recording, camera 0,0% 0
2 Parts suitable for television, radio, radars… 2,3% 0
3 Other vehicles (1500<cylinder<2500 cm3) 10,0% 3
4 Other vessels 1,1% 0
5 Tankers 0,9% 0
6 Monitors ans projectors 12,3% 5
7 Electronic integrated circuits 0,0% 0
8 Motor car (1500<cylinder<3000 cm3) 10,0% 3
9 Part of data processing machines 0,0% 0
10 Motor car (1000<cylinder<1500cm3) 10,0% 5
11 Other devices, appliances and instruments 1,6% 0
12 Machinery with 360 degrees Revolving 0,0% 0
13 Data processing machines (other) 0,0% 0
14 Pneumatics used on motor cars 4,5% 3
15 Electronic integrated circuits 0,0% 0
16 Other vehicles (cylinder>2500 cm3) 10,0% 3
17 Parts and accessories of the motor vehicles 3,5% 0
18 Motor car (cylinder<1000cm3) 10,0% 5
19 Data processing machines (other) 0,0% 0
20 Discs, tapes, solid-state non-volatile storage devices 3,5% 0

25
Table 1.11: Korean tariff schedule for the main import products originating from the EU
Source: own computation based on European Commission (2009a)
With regards to NTBs, the agreement includes the fundamental WTO rules, such as national treatment, prohibition of import and export restrictions, disciplines on state trading, etc. (European Commission, 2009b). In addition, the EU-Korea FTA includes specific disciplines on NTBs for four sectors: consumer electronics (sector 1), motor vehicles (sector 2), pharmaceutical products and medical devices (sector 3) as well as chemicals (sector 4). Concerning consumer electronics, the agreement stresses the need for international standardization and simplification of certification as a means of reducing trade costs. Motor vehicle NTBs are also expected to be reduced, notably because the FTA provides for a wide-ranging recognition of international standards by Korea. With regard to sector 3, the FTA addresses the need to strengthen the transparency in pricing decision. Finally, the FTA introduces a bilateral cooperation in order to ensure more transparency in the laws, the regulations and their implementation in sector 4.
Moreover, a specific chapter is introduced to tackle the problem of technical barriers to trade (TBTs), as a means of reinforcing the cooperation on standards and regulatory issues (transparency in making rules, the use of international standards, etc…) Similarly, a chapter on Sanitary and Phytosanitary
Import rank Designation Base rate Staging category
1 Air-coolers, Air Purifiers of Other Machines and Mechanical Appliances5,7% 7
2 Electronic integrated circuits 0,0% 0
3 Medicaments 7,8% 3
4 Motor car (Cylinder>3 000 cm³) 8,0% 5
5 Motor car (1500<cylinder<3000 cm3) 8,0% 3
6 Ferrous waste and scrap 0,0% 0
7 Part of combustion piston engines 7,6% 3
8 Pork (Meat) 27,4% 10
9 Parts and accessories of the motor vehicles 8,0% 0
10 Valves, taps, cocks and traps 8,0% 7
11 Other chemical products 6,5% 3
12 Turbo-compressors 8,0% 3
13 Aeroplanes 0,0% 0
14 Whisky 20,0% 5
15 Uranium enriched 0,0% 0
16 Gear boxes and parts thereof 8,0% 0
17 Switch boards 8,0% 0
18 Measuring or checking instruments 7,3% 0
19 Internal combustion engines 5,9% 3
20 Cobalt oxides 5,5% 0
21 Semi-finished products of iron or steel 0,0% 0
22 Parts of compressors 8,0% 0
23 Beauty or make-up preparations 8,0% 5
24 Electronic integrated circuits 0,0% 0
25 Pumps for piston engines 8,0% 5

26
(SPS) measures is included in the FTA as a means of facilitating trade in animals and animal products, plants and plant products while maintaining a high level of human, animal and plant health. Finally, trade facilitation provisions are incorporated into the FTA (customs cooperation, simplification of border procedures, etc.) For that purpose, a customs committee has been established (European Commission, 2009b).
Finally, it should be noted that the FTA does not alter duty drawback (DDB) provisions on EU-Korea trade. Duty drawback on duties paid on imported intermediates or raw materials is already allowed on trade between the EU and Korea. Although Korean DDB is of apparently minor significance in trade with the EU (European Commission, 2010b), a prohibition of DDB would tend to lower the trade-enhancing effects of tariff and non-tariff liberalization associated with the FTA. The estimated trade effects of tariff elimination of the FTA reported later in this study are based on retained DDB provisions.
b) Trade provisions for services, including Mode 3.
A crucial aspect of the EU-Korea FTA is the liberalization of trade of services. Basically, the agreement generally goes beyond WTO commitments, especially concerning Korea11. As a matter of fact, the FTA includes specific provisions for telecommunications (removal of foreign ownership requirements in Korea, direct operation of EU satellite broadcasters into Korea, etc.), environmental services (cooperation on non-industrial waste waters) shipping (full market access and non discriminatory treatment in the use of port services and infrastructure in Korea), financial services (improvement of market access), express delivery services, air transport services (improved market access for EU services into Korea, etc). EU law firms are also being allowed to open offices in Korea to advise foreign investors or Korean customers on non-Korean law (European Commission, 2009b). However, it must be observed that Korea already applies a more liberal regime vis-a-vis the EU than what is expected from GATS commitments. Still, some sectors are excluded from the agreement. With regard to mode 1, these mainly concern audio-visual services, national maritime cabotage as well as some aircraft services on the EU side (repair and maintenance, selling and marketing of air transport services, handling services, rental services, etc…).
Tables 1.12 and 1.13 provide more details about the liberalization of services included in the agreement. For each partner, these tables show the restriction level (no restriction, small, medium, high) for each service category and for each service mode12.
11
Consult the WTO Database table on commitments, available at: http://tsdb.wto.org/simplesearch.aspx. Refer also to
European Commission (2009b), p.7. 12
For the EU, restrictions are considered to be limited provided that they concern less than 4 EU Member States;
Medium restrictions apply when the number of EU Member States implementing restrictions ranges from 4 to 8; the
high restriction level corresponds to the situation when the number of EU Member States applying restrictions is

27
Table 1.12: Restrictions applying into the EU for Korean services
Remarks: n: no restriction; *: limited restrictions; **: medium restriction level, ***: high restriction level (0) except manufacture of refined petroleum products (1) excluding legal advisory and legal documentations and certification services provided by legal professionals entrusted with public functions, such as notaries, "huissiers de justice" and other "officiers publics et ministériels" Source: own calculations from Annex 7-A-2 and 7-A-3 of the agreement
greater than 8. With regard to Korea, the classification has been made qualitatively depending on the number and the
type of restrictions (number of services excluded, number of restrictions applied, importance of the restrictions, etc…).
Mode 1 Mode 2 Mode 3 Remarks
Agriculture, forestry ***
Fishing and aquaculture ***
Mining and Quarrying ***
Manufacturing n (0)
Production, transmission and distribution of energy ***
Business services, of which:
Professional services, of which:
Legal services *** *** ** (1)
Accounting services ** n *
Auditing services *** n ***
Architectural services ** n *
engineering services ** n ***
medical services including retail sales) *** n ***
veterinary *** n **
Computer and related services n n n
R and D services * n n
Real Estate services *** n *
Rental/Leasing services, of which:
Ships ** n ***
Aircraft ** *** ***
Other transport equipment ** n n
Other machinery and equipment ** n n
personal and household goods *** *** *
Telecom equipment rental n n n
Other Business services, of which:
Advertising n n n
market research n n n
management consulting n n n
technical testing ** ** n
consulting * n n
placement and supply services of personne *** *** ***
maintenance anr repair *** *** *
investigation and security *** *** ***
building cleaning services *** n n
photographic services * n n
packaging services n n n
printing and publishing n n **
convention services n n n
translation services * n **
telecom consulting n n n
telephone answering services n n n

28
Table 1.12: Restrictions applying into the EU for Korean services (cont’)
Remarks: n: no restriction; *: limited restrictions; **: medium restriction level, ***: high restriction level (2) with some restrictions for handling and express delivery services (3) excluding the selling of television programme package as well as domestic links (4) excepting arms and munitions (5) excluding public-funded services (6) excluding audio-visual services (7) other than fuel (8) for mode 1, no restriction for consulting services (9) except national cabotage transports Source: own calculations from Annex 7-A-2 and 7-A-3 of the agreement
Mode 1 Mode 2 Mode 3 Remarks
Communication services, of which:
Postal and courier services n n n (2)
Telecom services, of which:
transmission and reception of signals n n n
satellite broadcast transmission services * * * (3)
Construction services n n n
Distribution services, of which: (4)
Commission agents' services ** * n
Wholesale trade services *** *** **
Retail service *** *** ***
Franchising n n n
Educational services, of which: (5)
Primary education ** ** ***
Secondary education ** ** **
Higher ediucation services ** ** **
Adult education services ** * ***
Other education services *** *** **
Environmental services, of which: *** n n
Financial services, of which:
insurance *** *** ** (8)
Banking and other financial services *** * **
Health and social services, of which: *** * *** (5)
Tourism and travel *** n *
Recreational, cultural and sporting services *** *** *** (6)
Transport services, of which:
Maritime transport n n ***
Internal Waterways transport ** ** ***
rail transport *** n ***
Road transport *** n ***
Pipeline transport *** *** * (7)
Services auxiliary to transport, of which:
maritime transport *** n *** (9)
Internal Waterways transport *** n *** (9)
rail transport ** n **
road transport *** n **
Pipeline transport *** n n
Energy services *** n ***

29
The services which are fully liberalized or which show few restrictions generally involve some business services, such as computer and related services, R&D (except restriction for services in natural sciences), telecommunication (equipment rental, etc…), advertising, market research and consulting, packaging, printing and convention services, as well as – for Korea only - technical testing and translation services. Communication services also show a high liberalization level (postal and telecom services), as well as construction services and environmental services (except mode 3).
On the other hand, some service sectors still remain more protected despite some improvement in market access. These are: some professional services (legal accounting, auditing services), distribution services, education, health and social services, tourism and travel, recreational, cultural and sporting activities as well as transport (except a favorable market access for the EU concerning shipping and aircraft services into Korea) and energy services (for additional details, refer to Annexes 7-A-1 to 7-A-4 of the agreement).
Financial services also remain protected in spite of some liberalization for specific activities. For Mode 1, these activities concern insurance services for maritime shipping and goods in international transit13 as well as specific banking services, such as transfer of financial information and data processing.
With regard to Mode 3, there is a medium level of liberalization of insurance services, with still some restrictions in terms of authorization, registration, etc… Banking services remain protected in Korea, especially with regard to credit unions, mutual saving banks, specialized capital finance companies, etc… despite an improvement in market access for the other banking services. Into the EU, banking establishment is also restricted to a certain extent in a large number of Member States.
13
In Korea, reinsurance and insurance intermediation are also liberalized.

30
Table 1.13: Restrictions applying into Korea for EU services
Remarks: n: no restriction; *: limited restrictions; **: medium restriction level, ***: high restriction level (1) except nuclear energy Source: own calculations from Annex 7-A-4 of the agreement
Mode 1 Mode 2 Mode 3 Remarks
Agriculture, forestry
Fishing and aquaculture ***
Mining and Quarrying **
Manufacturing n
Production, transmission and distribution of energy ** (1)
Business services, of which:
Professional services, of which:
Legal services ** ** **
Accounting services ** ** **
Auditing services ** ** **
Architectural services n n n
engineering services n n n
veterinary n n n
Computer and related services n n n
R and D services n n *
Real Estate services n n n
Rental/Leasing services, of which:
Ships n n **
Aircraft n n **
Other transport equipment n n n
Other machinery and equipment n n n
personal and household goods n n n
Telecom equipment rental n n n
Other Business services, of which:
Advertising n n n
market research n n n
management consulting n n n
technical testing n n n
consulting n n n
placement and supply services of personne n n ***
maintenance and repair *** ** n
investigation and security *** n ***
building cleaning services *** n n
photographic services *** *** n
packaging services n n n
printing and publishing n n n
convention services n n n
translation services n n n
telecom consulting
telephone answering services

31
Table 1.13: Restrictions applying into Korea for EU services (cont’)
Remarks: n: no restriction; *: limited restrictions; **: medium restriction level, ***: high restriction level (1) except nuclear energy (2) excluding public-funded services (3) free access except Hotel restaurants (4) excluding cabotage (5) excluding services for agriculture, fishery, and livestock products Source: own calculations from Annex 7-A-4 of the agreement
The other provisions of the agreement cover free capital movement (Chapter 8), Government procurement (chapter 9), intellectual property (Chapter 10), competition and transparency (chapters 11 and 12), dispute settlement (chapter 14) as well as specific provisions concerning sustainable development (chapter 13). In addition, specific protocols cover the problems of rules of origin, especially in the car sector, mutual administrative assistance in customs matters as well as cultural cooperation
Mode 1 Mode 2 Mode 3 Remarks
Communication services
Postal and courier services h (1) n **
Telecom services * n *
Construction services *** n n
Distribution services, of which:
Commission agents' services *** n n
Wholesale trade servicesal *** n *
Retail service *** n *
Franchising n n n
Educational services, of which: (2)
Primary education *** *** ***
Secondary education *** *** ***
Higher ediucation services *** n ***
Adult education services ** n **
Other education services *** n ***
Environmental services ** n n
Financial services, of which:
insurance ** ** **
Banking and other financial services ** ** ***
Health and social services *** *** ***
Tourism and travel ** (3) n n
Recreational, cultural and sporting services, of which: *** n **
Transport services, of which:
Maritime transport * n * (4)
rail transport *** n ***
Road transport *** n **
Air transport n n n
Pipeline transport *** *** n
Services auxiliary to transport, of which: *** n n (5)
Energy services ** ** **

32
c) A comparison with the main other FTA under negotiation with Korea.
As already mentioned in the introduction, Korea has also recently signed a FTA with the USA (also not yet ratified) as well as ASEAN and India. Negotiations have also started with several major trading partners, namely Canada, Mexico and Japan. This section provides the major features of these agreements14. These features will then be incorporated in the scenarios of the CGE model implemented in chapter 3.
The US-Korea FTA is comparable to the EU-Korea one. As a matter of fact, nearly 95 percent of bilateral trade in consumer and industrial products will become duty free within three years from the implementation of the FTA. Similarly, most remaining tariffs will be eliminated within 10 years (up to 20 years for highly sensitive products). With regard to agricultural products, the FTA will immediately eliminate or phase out tariffs and quotas on a broad range of products, with almost two-thirds (by value) of Korea's agriculture imports from the United States becoming duty free upon entry into force (USTR, 2009).
A breakdown by industry makes it possible to provide the following details (see USTR, 2009 as well as Zhuang et al., 2007). Concerning the agricultural and food sectors, the US imports from Korea are small in value and mainly concern fruit and vegetables, which will be fully liberalized after the agreement enters into force. Korean imports from the USA are more significant. They mainly concern cereal, meat and dairy products. Rice is excluded from the US-Korea agreement (like from the EU-Korea agreement). However, Korean tariffs on corn and wheat for feed as well as soybeans for crushing will be eliminated immediately. Moreover, tariffs on frozen and fresh pork are expected to be liberalized by year 7 and 10 respectively. For dairy products, Korea will use tariff rate quotas (TRQs) that provide duty free access for the double of current shipment volume of US dairy exports.
Turning to natural resource-based industries, most tariffs will be immediately eliminated, except some US wood products imported to Korea (full liberalization by 3 to 5 years). The textile and mid-technology sector (chemicals, paper, ferrous and non ferrous metals, iron and steel) are also expected to be fully liberalized.
As far as high-tech sectors are concerned, full tariff liberalization is either immediate or expected to be implemented within 3 years (for some products of the motor car industry) and up to 10 years for certain products (medical, etc…) (see detailed tariff schedule in the final text of the agreement).
The agreement also provides for improved WTO commitments, with better market access to almost all services (express delivery services, legal services, R&D as well as health and education).
14 This section excludes the presentation of the agreements implemented previously, especially with Chile (2004), EFTA
(2006) and Singapore (2006).

33
Turning to the ASEAN-Korea Free Trade Area (AKFTA), several framework agreements have been signed since 2005. The trade agreement expects the elimination of 95% of tariffs by year 5 for the goods placed on the “normal track”. A list of sensitive and highly sensitive products has also been established. Sensitive products must account for at least 10% of all tariff lines and 10% of the total value of imports of Korea and ASEAN. For these products, the tariff schedule includes a reduction of tariffs to 20% after 5 years and to 5% at most after 10 years. They mainly include agriculture and food products, some natural resource-based products, textiles as well as high-tech sectors (car industry, electronic and mechanical equipment). Highly sensitive products must represent a maximum of 200 tariff lines at digit-6 level. For these products, the AKFTA states a reduction of tariffs to 20% after 10 years. It concerns agricultural and food products (meat, fish, dairy products, cereals, etc…) as well as wood articles (ASEAN Secretariat, 2005a and 2005b).
The framework agreement on services was signed in 2007 (ASEAN Secretariat, 2007). It includes a progressive liberalization of services, with the exclusion of national cabotage, services related to air traffic rights as well as services supplied in the exercise of governmental authority. Finally, a special framework was also signed in 2009 for investment (ASEAN Secretariat, 2009), which aims at progressively liberalizing FDI within the FTA.
With regard to Canada, negotiations were initiated in July 2005. Overall, the contents of the agreement are similar to that negotiated with the USA, with an objective of liberalizing trade in goods and services, despite usual exception for sensitive products as well as the existence of a transition period for liberalization (FAIT, 2007). However, the conclusion of this FTA has been delayed as well as that with Mexico.
Finally, the negotiations for a FTA between Korea and India have been concluded in 2010. This agreement provides for a reduction (not a removal) in tariffs within ten years. It also opens up the two countries' services and investment markets to a certain extent. However, this agreement is limited in its scope compared with those with the EU, the USA and Canada.
Concerning the Japan-Korea FTA , negotiations have not yet been completed. As a result, there is neither final text nor tariff schedule. However, the Ministry of Foreign Affairs of Japan (MFAJ) has published a joint study group report which provides some recommendations about the Japan-Korea FTA (MFAJ, 2003). The negotiations started in 2003 (first round). After six rounds, the main issues concern (MFAJ, 2008):
- Trade in goods (tariff elimination)
- Investment (improvement of the Japan-Korea Investment Agreement)
- Trade in services (high level liberalization as developed countries)
- Other issues (non-tariff measures, mutual recognition, cooperation, etc.)
Basically, the working group recommends liberalizing all sectors in the FTA, including sensitive sectors, especially agriculture. However, negotiations were stopped in November 2004. The two

34
countries were calling for the resumption of the negotiations in order to complete the agreement soon (MFAJ, 2008), but it seems that negotiations have been stopped again recently.
To sum up, it seems that the USA-Korea and the Canada-Korea FTAs are comparable to the EU-Korea one in their contents, whereas the other agreements seem to be a bit more limited, especially because of smaller trade liberalization concerning sensitive products (especially with India) and also in some cases because of the absence of precise schedules for services and investment (especially detailed by item).
Since the implementation of the FTAs with Japan and Mexico has been very often delayed, the simulations in the present study will consider only the FTAs currently in force as well as the Korea-USA and Korea-Canada FTAs (Chapter 3).

35
Chapter 2: An estimation of EU-Korea trade costs in goods, services and FDI
This chapter is dedicated to the measurement of trade restrictions for goods and services, including mode 3. These measures will be included in the CGE model for the simulations implemented in Chapter 3. The main objective of the present chapter is to rely on recent and novel methods which avoid calculating trade costs from gravity equation residuals. Indeed, although calculations of AVEs are easy to obtain from the residuals of the gravity equation, this method can provide biased results, especially due to omitted variables and the poor quality of the underlying data15. In addition, the estimations are also extremely sensitive to the choice of the value of the consumer Constant Elasticity of Substitution (CES)16 and cannot take into account foreign establishment (Mode 3), which is the main type of services supplied abroad. Therefore, it seems preferable using observed sector-specific barriers to build up appropriate measures of tariff equivalents.
Alternatively, when observed information is not available, non residual gravity models can also be used. For example, NTBs for goods will mainly be calculated with the border-effect approach. Since this approach may overestimate NTBs because it also accounts for home preferences, a more specific approach will also be implemented in Chapter 4 for the car industry using the KNO (Kee et al., 2009) methodology. This last approach will finally be used in the CGE simulations (Chapter 3).
This chapter is organized as follows. Section 1 briefly provides an overview of the Korean and EU trade policy and trade costs. This will make it possible to get a first picture of protection in the two partners, and thus a better understanding of the consequences of the EU-Korea FTA. Section 2 is dedicated to the presentation of the methodology selected in this report to measure trade costs in goods, services and FDI. Finally, the last section shows the main results concerning trade costs and AVEs.
Section 1: An overview of the EU and Korean recent trade policies and trade costs.
Table 2.1 provides a broad comparison of tariff structures in the EU and Korea. Several features emerge from this table. First, Korea has bound only 90.8% of its tariff lines (100% for the EU). Second, average tariffs remain higher in Korea (12.8%) than in the EU (6.7%). In particular, tariffs for agricultural imports are about 3 times higher in Korea (53.5%) than in the EU (17.9%). Maximum tariffs go up to 887.4% in Korea against 604.3 for the EU. Concerning non agricultural products, it can reach up to 754.3% in Korea for a few items (cosmetics). However, most maximum tariffs do not exceed 50%, which is close to the EU maximum rate.
15
See for instance Anderson and van Wincoop (2004) for an extensive discussion about trade costs. 16
For example, refer to Olper and Raimondi (2009).

36
In terms of duty-free tariffs, the EU is also less protected, since it account for more than 25% of all EU tariff lines (against 15.9% in Korea). Nuisance rates (tariffs lower than 2%) also show a greater proportion in the EU (9.6%) than in Korea (1.9%).
However, the Korean protection essentially relies on ad-valorem tariffs. This implies that the share of non ad-valorem tariffs is lower in Korea (0.7%) than in the EU17. Moreover, the share of tariff quotas is also lower in Korea (1.7%) than in the EU (4.8%)18.
Table 2.1: Basic indicators of tariff protection in the EU and Korea (2008)
Source: WTO (2009a and 2009b)
With regard to NTBs applying to the imports of goods, rice is the only item subject to import quota in Korea. Moreover, import licensing requirement and prohibitions are maintained mostly for the protection of public morals, human health, hygiene and sanitation, animal and plant life, environmental conservation or essential security interest (WTO, 2009a). Finally, Korea has used anti-dumping provisions involving mainly chemicals, machinery, wood articles imports and paper.
On the EU side, import licenses and prohibitions apply for similar reasons as in Korea (security, technical, sanitary, phytosanitary and environmental grounds, especially in agriculture). Quantitative restrictions have been applied since 2005, especially to textile products but only for a small number of non-WTO members. Finally, the EU has used a significant number of trade remedy measures, although the WTO has noticed a reduction in this number since 2005.
In addition to these import restrictive schemes, both Korea and the EU use export subsidies as well as domestic support regulations, essentially concerning agricultural products. In addition, export
17
In Korea, these non ad-valorem tariffs mainly concern honey, some fruit and vegetables, barley, soya beans,
cinematographic films, diagnostic or laboratory reagents as well as silk. 18
In the EU, tariff quotas are mainly applied to agricultural products
EU Korea
Bound tariff lines 100,0 90,8
Simple average tariff rates 6,7 12,8
Agriculture products 17,9 53,5
Industrial products 4,1 6,5
Max tariffs in agriculture 604,3 887,4
Max tariffs in non agric. Products 63,3 754,3
Duty-free tariff lines (% of all lines) 25,3 15,9
Nuisance tariffs (0%<tariffs<2%) 9,6 1,9
Overall standard deviation of tariffs 14,1 52,1
International tariff peaks 8,4 8,9
Tariff quotas (% of all lines) 4,8 1,7
Non ad-valorem tariffs with no AVEs (% of all lines) 2,7 0,7

37
subsidies are also applied to manufacturing products which use highly protected agricultural inputs. Finally, domestic support to the shipbuilding industry in Korea19, which was to be phased out at end 2006 has been extended to the end 2009 (for additional details about WTO notifications concerning SPS, TBTs, trade remedies, and other BNTs, refer to the technical annexes of the Trade Policy Reviews of Korea and the EU)20.
Protection in services (including mode 3) is due to several type of barriers, including:
- Quotas and licenses
- The persistence of monopolies that prevent the establishment of service providers from other countries
- Foreign ownership ceilings
- Differences in regulation across countries
- The small size of many service firms which can barely afford the extra-cost of engaging in cross-border activities.
-
Broadly speaking, it seems that services in Korea are currently less liberalized than in the EU. This is mainly due to the predominance of state-owned enterprises or even monopolies, especially in financial, telecommunication, as well as transport services. Foreign ownership ceilings also apply to telecommunications, air transports as well as coastal maritime services. Foreign ownership is also prohibited in radio and television broadcasting. In addition, the Korean service sector is characterized by burdensome regulation. This high protection in services has led to a lack of competition which results in low labor productivity, which is half the level in manufacturing (WTO, 2009a, p.xi).
However, the Korean authorities have recently started significant reforms, which are dedicated to the reduction in the protection level in services. These include the adaptation to the existing GATS commitments, a liberalization of telecommunications beyond GATS commitments, increased competition in banking (as a result of significant levels of FDIs) as well as the adoption of a reform in the banking service. This reform especially consists in the improvement of bank’s balance sheets as well as restructuring and consolidating as a means of increasing productivity and profitability.
On the EU side, the EU is the world's leading exporter and importer of commercial services, accounting for about one quarter of world exports and imports (excluding intra-EC transactions) in 2007. Competition has been reinforced within the EU by several key measures related to the
19
The shipbuilding support relies on the “Local Tax Reduction for Building and Acquisition of International Line Vessels and Deep Sea Fishing Vessels”. It is aimed at promoting the shipping industry by relieving the tax burden on international line vessels, deep-sea fishing vessels and coastal line vessels (WTO, 2009a). 20 WTO (2009a and 2009b).

38
completion of a genuine internal market21, through the progressive removal of the remaining administrative and regulatory barriers between member states. These mainly involve telecommunications, postal services, financial services as well as transports. In these sectors, state ownership has been significantly reduced in the EU member states, especially in telecommunication and postal services22. However, some other services are not subject to a comprehensive single market policy (tourism, distribution, construction, engineering, consultancy, testing services and employment agencies). Moreover, health and education are mainly regulated by EU member states and remain highly protected. Finally, the EU regime on trade in services with third countries is based on existing GATS commitments, as well as on regional and bilateral agreements (WTO 2009b, p.134).
There is currently a lack of studies which quantify protection in services in Korea with a comparison with other countries. One exception is Findley and Warren (2000). It is based on the calculation of restrictiveness index scores from qualitative data. These indexes rely on several indicators including restriction on establishment (form of establishment, nationality requirement, ownership requirement, etc.) and on ongoing operations (licensing requirement on management, composition of boards of directors, etc.). The scores range from 0 (low restrictions) to 1 (high restrictions).Table 2.2 summarizes protection in services with a comparison between Korea and selected EU countries.
Table 2.2 Restrictiveness index scores for various services
Source: Findley and Warren (2000)
Differences in restriction levels between Korea and the EU countries selected are particularly significant for banking/finance services, telecoms, as well as maritime transports, accountancy and distribution. However, these differences are less stringent for some business services, such as legal, architectural and engineering services. In this regard, it may be observed that there are significant differences across EU countries, since these services remain under national regulation and not under a common (EU) regulation.
Although this study is currently out of date, it provides a first indication about differences in the protection level between the EU and Korea with regard to services. The Copenhagen Study (2007) presents more recent figures on protection in services (without any breakdown by service categories). It relies on calculations from gravity estimates, which show that the AVEs in Korea amount to 46%
21 Refer to « Services Directive » No. 2006/123/EC 22
For a list of the main state-owned enterprises in the EC, refer to WTO (2009b)
Korea France Germany UK Italy Netherlands Sweden Denmark Belgium
Accountancy 0.48 0.31 0.39 0.19 0.43 0.22 0.44 0.41 0.40
Architectural 0.18 0.14 0.15 0.06 0.30 0.03 0.17 0.02 0.29
Banking/finance 0.43 0.07 0.07 0.07 0.07 0.07 0.07 0.07 0.07
Distribution 0.33 0.33 0.24 0.19 0.29 0.24 0.21 0.27 0.32
Engineering 0.01 0.03 0.27 0.06 0.17 0.10 0.17 0.04 0.01
Legal 0.44 0.58 0.48 0.31 0.53 0.25 0.27 0.43 0.31
Maritime 0.58 0.33 0.39 0.24 0.37 0.35 0.41 0.28 0.35
Telecoms 0.68 0.21 0.05 0.00 0.14 0.03 0.10 0.03 0.20

39
for services, whereas they are only 17.3% in the EU. This result correlates with those found in Findley and Warren (2000). Additional information will be provided in section 3 with new and updated AVE estimates for a wide range of service categories and a large number of countries.
However, the previous general analysis of protection must be updated and extended with a refined methodology. In this regard, the following sections present appropriate methodologies and applications for the measurement restriction in trade, services and establishment.
Section 2: The measurement of trade costs in good, services and FDI: A methodological note
This section intends to propose appropriate methodologies for calculating NTBs and tariff equivalents for trade of goods, services as well as establishment.
a) The calculation of tariff equivalents for NTBs (trade in goods)
Basically, the methodology selected in this report primarily relies on Kee et al. (2009). This study is carried out in two stages. The first includes an estimation of the quantity impact of NTBs on imports. Then, this impact is transformed into price effects, using import demand elasticities calculated in Kee et al. (2008).
In the first stage, the basic equation to be estimated is the following:
( ) cncncncnDS
cnk
cnntb
cnkcknncn tDSntbCm ,,,,,,,,, 1loglog)log( µεββαα ++++++= ∑ (2.1)
Where mn,c is the import value of good n in country c, Ckc denotes a vector of country characteristics
variables. They include relative factor endowment and GDP which capture economic size as well as other gravity variables (average distance to world market and a dummy for islands). ntbn,c is a dummy variable which reflects the existence of a core NTB. DSn,c denotes agricultural domestic
support, tn,c is the tariff on good n in country c and εn,c corresponds to the import demand elasticity.
Equation (2.1) is then modified as follows. First, import-demand elasticities estimated in Kee et al. (2008) are substituted into (2.1). Second, the tariff term is moved to the left-hand side to address the endogeneity of tariffs. This introduces a new error term kn,c. Third, a White correction is introduced in order to tackle heterosckedasticity of the error term. Fourth, product specific effects are also introduced so as to capture the variation of βs across tariff lines. Fifth, appropriate instrumental variables are included to address the endogeneity problem related to NTBs23. Indeed, as shown in Lee and Swagel (1997), such endogeneity may lead to a downward bias on the estimated impact of
23
These instrumental variables are exports, past changes in imports as well as GDP weighted average of the NTBs and
domestic support at product level.

40
NTBs on imports, which would result in underestimating AVEs. Sixth, a two-step estimation procedure is implemented to estimate the β coefficients, following a Heckman two-stage
procedure24, while constraining βs not to be positive.
After these transformations, the final estimated equation becomes:
( ) ∑
∑−++=+−
+
kcn
Ckcknncncncn ntbeCtm k
kc
ntbcn
ntbcn
,,,,,
,,
1log)log(ββ
ααε
+ cncn
C
DSe k
kc
DScn
DScn
,,log,,
κββ
+
∑−
+
(2.2)
The left hand side of this equation reflects the value of imports once tariffs have been taken into account. This value of imports depends on country characteristics as well as on the remaining barriers to trade, i.e. NTBs and domestic support.
The last step consists in calculating the AVEs after transformation of the quantity impact derived from equation 2.2 into price-equivalents. This leads to:
NTB
PAVE
d
∂∂= log
(2.3)
where Pd denotes the domestic price. This equation defines AVEs as the effects of NTBs on prices. The introduction of the price variable is necessary since, like ad-valorem tariffs, NTB effects must be calculated on prices and not on quantities.
After differentiation of equation (2.1), it is easy to obtain (see detailed derivation in Appendix 3.1):
cn
ntbcn
ntbcne
AVE,
,
1,
ε
β −= (2.4)
cn
DScnDS
cnAVE,
,, ε
β= (2.5)
24
For additional details, refer to Kee et al (2009) p.177.

41
Finally, AVEs can be calculated in each country at the tariff line level or for various sectors.
Since calculated AVEs are not available for all countries, the KNO methodology has been supplemented by a border-effect gravity approach, such as that presented in Fontagné et al. (2005). The starting point is the estimation of a gravity equation with border effects, which measure the specific cost of crossing a frontier, as a measure of market access. This methodology is close to that developed by Anderson and van Wincoop (2004). The key point is the precise definition of the trade cost function, which includes distance, tariffs, NTBs, as well as import prices (multilateral trade resistance). In the final estimation, the trade cost equation makes it possible to isolate each component (distance, prices and tariffs) whereas dummy variables for the border effect capture the influence of NTBs (as well as the home bias preference).
The calculation of the border effects coefficient by sector and country makes it possible to derive the tariff equivalent, as:
11 −= −σγ
eAVE (2.6)
where ϕ and σ correspond respectively to the estimated parameter for border effects and the consumer CES. Although this method differs from Kee et. Al (2009), it proved to provide similar magnitudes of AVEs for similar countries. The two approaches can thus be reconciled in the present study. For that purpose, the KNO figures are first used when available. The border effect approach is simultaneously implemented for these figures. This makes it possible to derive a scale which can be applied to both methods for achieving similar figures. Then, this scale is applied to the border effect approach for the figures which are not available in the KNO approach. In other words, our results include the KNO figures supplemented by the border effect method after having applied the appropriate scaling method.
b) Measuring restrictions for cross-border services (Mode 1)
Concerning the measurement of restrictions for Mode 1, the methodology selected for this study is based on Fontagné et al. (2009) following the initial development in Park (2002). Basically, it relies on the estimation of the fixed effects coefficient in gravity models. The advantage of this method is not to depend on the residuals of the model, which are likely to capture unobserved effects having nothing to do with protection. This method is also preferred to that based on import demand macroeconomic functions, which often show instability in long run parameter estimates and which

42
do not correctly explain recent changes in imports. In addition, the standard macroeconomic import determinants barely fit the exchange of services25.
The basic equation to be estimated is the following:
∑∑ ∑∑ ++++++++= ijijijj t
ttjji
iiijjtitijt DIIIDISTYYX εαγγγαααα )log()log()log(ln 3210 (2.7)
Where Xijt denotes the exports of services under Mode 1 from country i to country j; Yit and Yjt correspond to the GDP in country i and j respectively; DISTij reflects the distance between i and j and Dij is a vector of bilateral control variables (dummies), which account for common languages and RTAs. Finally, I i and I j are country-specific effects, which control for the remaining country characteristics. Concerning the import country, I j is supposed to reflect essentially protection provided that the other variables have been properly included in the vector Dij. This equation is very close to that proposed in the new gravity theoretical approach (Anderson and van Wincoop, 2003) which introduces multilateral trade resistance in countries’ specific effects.
The estimation of this equation can be made in cross-section or panel data depending on the dataset selected for our study. Basically, there are two main international datasets for trade in services (Mode 1). The first is derived from GTAP: version 7.4 includes 82 countries and 14 services sectors for the year 2004. The second is extracted from OECD trade in services, which includes time series data from 2002 to 2006 but for a lower number of services for each year.
In order to cover a high number of services, we have estimated the equation in cross-section. Since the parameters corresponding to the GDP cannot be estimated, we proceeded as follows. First, country i’s GDP has been dropped from the equation. Its impact is therefore captured in the fixed effects Ii. Second, country j’s GDP has not been dropped since I j is expected to capture the impact of
protection only. Consequently, parameter α2 has been constrained to unity or 0.8 as a sensitivity analysis. The choice of this parameter value is guided theoretically by Anderson and van Wincoop (2003), which states that GDP parameter estimates must be equal to unity26.
The last step consists in calculating tariff equivalents from the difference between the fixed effects calculated for a given importing country j and that of a benchmark country, chosen as the country with the highest fixed effect (i.e. the lowest protection)27.
25 For additional discussion, see for example Blot and Cochard (2008).
26 The underlying assumption is that all goods are tradable. However, Péridy (2005) shows that if we consider that
countries i and j spend a fraction ϕ of their revenues on tradable goods and the remaining fraction (1- ϕ) on non
tradable, then the trade-GDP elasticity will differ from unity. 27
This requires an estimation of the consumer CES in each sector. As in Park (2002), this value has been chosen to be
equal to 5.6

43
c) The restrictions and the corresponding tariff equivalents for establishment (Mode 3)
We suggest starting from a novel methodology initially developed by Fontagné and Mitaritonna (2009). It starts with qualitative information on the restrictions applied by each country in each service. In the next step, a multivariate statistical approach is used to transform this qualitative data into a trade restrictiveness synthetic index (TRI). This makes it possible to estimate the average impact of TRIs on price cost margins, which is used in turn to calculate ad valorem equivalents (AVEs).
More precisely, this methodology starts with the collection of qualitative data (based on inquiries) on three service sectors, namely distribution, fixed and mobile telecommunications in the mid-2000s. These data are collected from Queen Mary University (2009). The answers of the inquiry are subsequently coded, with the code varying from zero (no restriction) to one (full restrictions). Finally, the scores are synthesized in a unique trade restrictive index (TRI), weighting together all the restrictions. In order to avoid using subjective weights, a principal component analysis (PCA) is applied in order to reduce the numerous observed variables into a smaller number of synthetic variables (principal components).
Once TRIs are calculated, the method consists in transforming them into tariff equivalents. For that purpose, the TRIs are first regressed on the price-cost margin for each firm of each service sector in each country. The key assumption is that regulatory measures create a wedge between prices and costs. If this difference is positive (prices exceed costs), this means that trade restrictions are rent-creating, whereas if it is negative, this suggests that restrictions are cost-increasing. In any case, the price-cost margin is a proxy of the magnitude of trade restrictions, provided that other determinants of the price-cost margin are properly taken into account. This is why the regression also includes control variables, such as the firm’s productivity, its market share, its sales growth rate as well as the capital intensity of production. A sensitivity analysis is also carried out by using alternative measures of TRIs according to the number and the weight of the principal components used for the calculation of TRIs. Finally, the regression also controls for the existence of regional trade agreements (RTA) in the service sector considered. These RTAs provide a margin of preference (i.e. a rent corresponding to a reduction in restrictions) to the countries which have signed the PTA with the reference country. In the same way, MFN exemptions are taken into consideration, since they increase the price cost margin in favor of domestic firms.
Finally, tariff equivalents for sector i in country c can be computed by the use of the TRIs and their
impact on the price cost margin (captured by the corresponding parameter β estimate of the regression):
( )1100 * −≡ cTRIic et β
(2.8)

44
Since this methodology provides TRIs and tariff equivalents for a limited number of countries and sectors, it has been extended for the missing countries. In addition, it has also been complemented by a very similar study (Findley and Warren, 2000) which provides TRIs for a wider range of services, especially within the business service category (see Table 2.2). In this study, the calculation of TRIs also relies on a qualitative inquiry with a coding ranging between 0 and 1. One methodological difference is due to the choice of the variables’ weights. This choice has been made according to a judgment about their relative economic cost. The weights have also been chosen so that the total restrictiveness index score for an economy ranges from 0 to 1. In spite of these differences, the values of the TRIs calculated in Findley and Warren (2000) is close to those obtained in Fontagné and Mitaritonna (2009) for the common sectors and countries concerned. As a result, they have been used in the business sector as a complement of our results.
Section 3: Trade costs and AVEs in the EU and Korea: The empirical results.
Following the methodology developed in the previous section, Table 2.3 exhibits the AVEs calculated for the EU imports originating from Korea and for Korean imports originating from the EU. These AVEs have been calculated for the year 2004, following the GTAP7 aggregation scheme.
Two sets of AVEs are presented concerning goods. The first are initial AVEs calculated with the methodology developed previously. However, the direct calculations of NTBs using the KNO methodology applied to the car industry (presented in Chapter 4) lead to lower estimates than the initial ones. This can be explained by the fact that the initial estimates are partly derived from the border effect gravity approach which may overestimate AVEs, because it also accounts for home preferences. Therefore, the second set of AVEs presented here includes NTBs scaled down by the factor which matches NTB estimates in Chapter 4. This factor is equal to 0.4. When multiplied by initial estimates, it gives the new AVE scaled down values. With regard to services, only one set of AVEs is presented given that calculations did not rely on the same methodology as for goods (fixed effects versus border effects). As a result, suspicion of an upward bias did not concern services.
Several features emerge from this table. First, the agriculture and food sector shows much higher AVEs in the EU than in Korea. The main reason is that as already observed in section 1, the Korean protection essentially relies on ad-valorem tariffs. This implies that the level of non ad-valorem tariffs and tariff quotas is lower in Korea than in the EU. As a result, the average tariff protection is three times higher in Korea (as observed from Table 2.1) but NTBs are lower (including tariff quotas and non ad-valorem tariffs, i.e. specific or variable levies). In addition, domestic support, like market price support and direct payments are not considered in the NTB variable since it is included in a specific variable (see equations 2.1 to 2.5). As a result, the highly protective Korean domestic regulations are not included here. A final explanation can be found in the fact that the data used for the calculations mainly involve agro-good products and thus few agricultural products, for which protection is generally higher.

45
On the other hand, the majority of manufactured industries show much higher AVE levels in Korea than in the EU, especially textile, leather-clothing, metals, machinery and above all cars and trucks as well as other transport equipment. This is mainly due to Korean standards and certification processes28. In particular, Korean standards in the automotive industry are very specific, often non-transparent and subject to revisions. As a result, certification procedures are particularly long and costly. The other NTBs in the car industry mainly include numerous taxes (other than tariffs) and anti-imports sentiments in the local population29. This result correlates some general figures highlighted in Chapter 1, when it is observed that the Korean car industry is, by and large, closed to foreign competition. Since the average tariffs in the automotive industry generally do not exceed 8% in Korea, this implies that NTBs must be very high in order to explain that foreign imports amount to less than 5% of the whole car market in Korea. However, chapter 4 will provide an estimation of AVEs specific to the automotive industry. These estimations will be taken into account when running the simulations in Chapter 3.
The remaining industries, i.e. chemicals and electronics generally show high and similar AVEs in both the EU and Korea.
With regard to the EU-Korea FTA, the implications of the results mentioned above are twofold: first, since tariffs are much higher than AVEs in Korea for agricultural products, the progressive removal of customs duties in Korea will correspond to a key improvement for EU exporters for accessing the Korea market. However, tariff removal in manufactured products will not significantly improve the EU market access into Korea, given the very high level of NTBs in sensitive sectors, especially in the car industry. Therefore, for these products, the reduction of NTBs becomes the key issue in the implementation of this agreement.
The estimations of AVEs for services are shown in Tables 2.4a for Mode 1 and 2.4b for Mode 3. With regard to Mode 1, it is striking to observe that there is a significant gap between protection in Korea (for services originating from the EU) and protection in the EU (for Korean services). As a matter of fact, AVEs amount to 78% for “Other services” in Korea30 (28% in the EU). In the same way, it represents 67% for insurance and 52% for finance (33% and 16% only in the EU, respectively). A significant gap is also recorded for trade (39% instead of 19%).
This gap can be explained for example by special registration practices which are not opened to foreigners (construction), costly standards, “black list” on public projects31 as well as specific constraints in banking and financial services (non recognition of the “global equity concept”, restrictions of foreign bank operations on the local currency, etc.)
28
Standard and certification processes in the EU can also explain the significant AVEs found in textiles, although some other explanation may be found for example in rules of origin. 29
The undervaluation of the Korean currency, especially with regard to the euro is also often cited in the literature although it cannot be strictly considered as an NTB. 30
These mainly involve energy (electricity, gas) as well as construction. 31 This concerns in particular construction and engineering for which public projects require import substitution for all items that can be manufactured in Korea. Consequently, foreign items cannot be promoted (CEPS, 2007, p.63).

46
However, this gap is less significant for communication and business services. With regard to communication, this is due to the liberalization of cross-border services carried out in Korea in the past few years. On the other hand, transport services are a little bit less protected in Korea than in the EU. Finally, public services remain protected both in Korea and in the EU (AVEs greater than 10%).
With regard to Mode 3, the gap is even more acute for communications (101% in Korea against 21.5% in the EU). It is also very significant for finance and insurance, with small AVE values in the EU and significant values in Korea. Trade is also much more protected in Korea (39%) than in the EU (19%), whereas business services show similar protection in both countries.
Overall, these results confirm that protection is generally higher in Korea than in the EU. This concerns both agricultural products (low NTBs but very high tariffs), industry (low tariffs but very significant NTBs). This is not to say that protection is low in the EU, which exhibits AVEs greater than 10% for all goods, except metals, cars/trucks and machinery. Still, protection in Korea is generally much greater. This general result also concerns services (Mode 1), with the exception of transports and business services which show moderate protection levels. It finally also concerns FDI, although AVEs are also moderate in business services. Once again, the application of the EU-Korea FTA is expected to provide significant gains, especially because of reductions in NTBs in goods and restrictions in services. This will be checked on in the next chapter.
Table 2.3 Estimation of AVEs for NTBs applying to trade in goods
Source: own calculations (refer to section 2 for the detailed methodology).
Initial Scaled down
EU Korea EU Korea
OthAgr 0.252 0.133 0.101 0.053
Animal 0.460 0.168 0.184 0.067
Dairy 0.806 0.144 0.322 0.057
Primary 0.650 0.418 0.260 0.167
Food 0.624 0.265 0.250 0.106
BevTob 0.463 0.172 0.185 0.068
Textile 0.478 1.269 0.191 0.507
LeathCloth 0.431 0.838 0.172 0.335
OthManuf 0.352 0.756 0.140 0.302
Chemicals 1.065 0.833 0.426 0.333
Metals 0.099 0.940 0.039 0.376
CarsTrucks 0.184 1.480 0.073 0.592
TransEquip 0.301 0.838 0.120 0.335
Electronic 0.661 0.713 0.264 0.285
Machinery 0.021 0.590 0.008 0.236

47
Table 2.4a Estimation of AVEs for services: Mode 1
Source: own calculations (refer to section 2 for the detailed methodology).
Table 2.4b Estimation of AVEs for services: Mode 3
Source: own calculations (refer to section 2 for the detailed methodology).
EU27 Korea
Other services 0.278 0.779
Trade 0.188 0.387
OthTransp 0.155 0.106
SeaTransp 0.228 0.187
AirTransp 0.127 0.106
Communication 0.195 0.235
Finance 0.161 0.525
Insurance 0.331 0.672
Business 0.179 0.205
Public Serv 0.270 0.289
EU27 KOREA
Trade 0.192 0.394
Communication 0.215 1.012
Finance 0.030 0.517
Insurance 0.057 0.285
Business 0.289 0.278

48
Chapter 3: The effects of the EU-Korea FTA: An application of the MIRAGE CGE model.
Based on the description of the EU-Korea FTA (Chapter 1) and the calculation of trade costs and the corresponding AVEs in goods, services and FDI (Chapter 2), this chapter provides a quantitative appraisal of the effects of the EU-Korea FTA. Its main contributions are the following. First, it is based on the new version of the MIRAGE model, developed by CEPII (Decreux and Valin, 2007) which includes key characteristics in imperfect competition. These involve the consideration of both horizontal and vertical product differentiation for intra-industry trade, the specific modeling of trade costs and their components, the inclusion of FDI as well as the consideration of dynamics (non-constant labor and productivity, etc.).
A second contribution of this chapter is related to the fact that simulations are very close to the actual contents of the agreement. For example, the simulations corresponding to the tariff removal rigorously respect the official schedule described in Chapter 1. In addition, the scenarios considered for NTB reductions are industry-specific and also closely related to the official agreement. The same remark also applies to services, including Mode 3, for which the schedule for each service category has been extensively described in Chapter 1.
A third contribution relies on the use of novel calculations of AVEs, as shown in chapter 2. In this regard, we used as much as possible the observed information about trade costs (both qualitative and quantitative) to base the calculations of AVEs. As a result, the computation technique does not use the residuals of gravity estimates, but instead uses an appropriate transformation of actual trade costs into tariff-equivalents (refer to Chapter 2 for additional details).
This chapter includes three sections. The first describes the theoretical framework which the model is based on. It also provides a general description of the main characteristics of the model. Section 2 shows the scenarios and baselines used for the simulations. Section 3 is dedicated to the results of the simulations as well as a comparison with the other quantitative studies. Finally, the appendix includes technical details concerning the derivation of the AVEs, the value of the elasticities of substitution used in the simulations as well as the sensitivity analysis.
Simulations are implemented over 15 years (from 2010 to 2025) from GTAP6 database (base year 2004). Results are generally presented as the percentage change of a given variable in 2025 due to the EU-Korea FTA.
Section 1: An overview of the MIRAGE model and its theoretical underpinning.
Since the beginning of the 80s, the new trade theory has provided fresh insights for the understanding of international trade. For example, the pioneer work developed by Krugman (1979)

49
as well as Helpman and Krugman (1989) has shown the role of product differentiation (and therefore the “love for variety” hypothesis) as well as scale economies as new gains from trade. The theory of regional integration, initiated by Viner, has also been renewed to a large extent over the past 20 years (Robson, 1998, Pomfret 2003). These extensions include notably:
- The consideration of terms of trade effects of FTAs
- The gains due to the NTB removal (trade cost effects)
- Imperfect competition gains (production, variety and scale effects)
- Dynamic effects (growth, investment)
- Distortion effects (role of subsidies and distorted wages)
This renewal has been theoretically founded in a single and comprehensive framework, initiated by Baldwin and Venables (1995). Table 3.1 summarizes the main welfare effects of a PTA through a version of this model extended to dynamic effects and distortions (Péridy, 2009).
Table 3.1: Welfare effects of the creation of a PTA
Source: Péridy (2009)
The applied literature using CGE has progressively incorporated part of this renewal, such as imperfect competition and horizontal product differentiation (Smith and Venables, 1988; Harrisson et al., 1997), some dynamic features (Baldwin, 1989), etc. In addition, some specific research has been devoted to technical aspects, such as the choice of appropriate elasticities in imperfect competition (Rosen, 2006).
The model used in this research follows these recent developments and extends some of them. The main characteristics and contributions of the new version of MIRAGE are the following (Decreux and Valin, 2007). First, although horizontal product differentiation is introduced in a standard
welfare effects CommentsPerfect competition effectstrade volume effect +/- positive in case of net trade creation; negative otherwisetrade cost effect + positive effects of reduction in NTBsterms of trade effects +/- positive effects in case of reduction in prices; negative effects otherwise
Imperfect competition effectsproduction effect + positive if prices are greater than average costseconomies of scale +product varieties + positive effects because of the rise in the number of product varieties available
Dynamic effectsinvestment +/- positive in the long run; can be negative in the short rungrowth + positive effects in case of technical progress and production efficiencyFDI +
Distortion effectshigh wages +/- negative in the domestic country; positive in the partner countrytaxes 0/- negative only if the PTA leads to an increase in taxes. No effect otherwise

50
fashion, the corresponding calibration procedure is novel, in that it allows the available information to be used more efficiently32. Second, the modeling is done in a sequential set-up, where installed capital is assumed to be immobile, even across sectors. Consequently, capital reallocation only results from the combined effect of depreciation and investment. This assumption gives investment a crucial role in terms of capital stock adjustment. In addition, cross-border investment (FDI) is introduced explicitly in a novel way. Indeed, standard CGE models generally assume that FDI results from international capital flows due to capital mobility. A major drawback is that it induces implausibly high cross-border capital flows (compared with observed flows). On the other hand, MIRAGE attempts to induce more plausible capital flows by linking empirical evidence to theoretical consistency. This can be achieved by modeling domestic and foreign investment in a single framework where saving allocation is a function of initial savings, the current capital stock, the sectoral rate of return to capital as well as the adjustment speed of capital (for more details, refer to Decreux and Valin, 2007, pp.15-16). However, the model does not take into account FDI spillover effects on productivity, although an increasing empirical literature shows the existence of such effects (Péridy and Uttama, 2010).
A third interesting innovation is the consideration of vertical product differentiation through the introduction of two quality ranges. This has been implemented by adding a specific CES nesting level in the utility function. The quality ranges are defined on a geographical basis, in such a way that goods produced in a developing country are assumed to belong to a different quality range than those produced in developed countries33.
Trade policy modeling is also a key characteristic in MIRAGE. In this regard, trade barriers include ad-valorem tariffs, specific tariffs, tariff quotas and anti-dumping duties which can be calculated in tariff equivalents. Preferential agreements are also taken into account in a quasi-exhaustive way. The information is generally available at HS6 level, but it can also be aggregated in several product categories. In addition, specific features of the agricultural sector are introduced. These include export subsidies, price support, production quotas, land allocation across crops as well as capital and land subsidies.
The model also includes a dynamic set-up. It is solved in a sequential way, for up to 20 years. The dynamics includes exogenous variables, such as the growth rate of production factors as well as technical progress. In addition, labor, land and the number of varieties adjust instantaneously to
32
More precisely, modeling imperfect competition requires three types of parameters, i.e. product substitutability,
scale economies as well as competition intensity. Since these parameters are linked to the zero-profit condition in each
sector, only two of them are usually derived from external sources, the third one is calibrated. This method is not fully
satisfactory, either in terms of consistency or robustness. This is why a novel method is used in MIRAGE in order to take
advantage of all the information of these three parameters, in terms of value and variance. This is achieved through a
joint calibration procedure which makes it possible to minimize their distance from external estimates (for additional
details, refer to Decreux and Valin, 2009, p.14). 33
The corresponding CES is assumed to be lower than the Armington one. This implies that goods which belong to the
same quality range are more substitutable than those which belong to different quality ranges. This implies for example
that goods from a developing country compete more directly with goods from any other developing country than with
goods from any developed country.

51
match the objectives and constraints of the model. Some other variables are endogenous, especially capital stocks which adjust depending on domestic and foreign investment. This implies that the rates of returns for capital vary across sectors after the base year. Adjustment costs also arise from these changes in capital allocation in case of a significant shock (which may render the allocation sub-optimal).
As a last characteristic, MIRAGE makes it possible to distinguish a dual labor market observed in some developing economies, with a modern (urban) labor market which pays an efficiency wage to unskilled labor and a traditional (rural) market which pays labor at its marginal productivity. This implies specific migration from rural to urban areas, hidden unemployment in these countries as well as underemployment in the rural areas.
The other features and assumptions are standard. On the supply side, they include the production with 5 factors (capital, skilled labor, unskilled labor, land and natural resources) with exogenous growth rates. On the demand side, final consumption is modeled in each region through a representative agent characterized with an intra-temporal utility function. A fixed share of the regional income is allocated to savings, the remaining share to consumption, with a first CES. The four-stage CES are modeled in order to consider the consumer choice within each sector, across countries, across varieties and across qualities (for additional information and the complete model setup, refer to Decreux and Valin, 2007).
Section 2: Scenarios and baselines
Table 3.2 summarizes the baselines and scenarios which have been selected for the simulations. The main characteristic is that they as close as possible to the official schedule described in the EU-Korea agreement (refer to Chapter 1 for a complete description).
Basically, the baseline refers to the multilateral, regional, or service-specific agreements which are likely to affect the impact of the EU-Korea FTA. It includes two options. The first option possibility assumes that the Doha round will not be concluded and therefore its contents not implemented. Similarly, it only considers the existing FTAs in force with the EU and Korea34, assuming that the FTAs under negotiations will not be carried out. Finally, it also includes the possibility of a 50% increase in the estimated rate of Korean protection for services (subject to the limit of the GATS commitment). As explained previously, this assumption is due to the fact that the current regime in Korea is more liberal than its GATS commitments. This suggests a significant liberalization has already been achieved between Korea and its partners. Consequently, there is a possibility that Korea will increase its protection level up to the GATS commitments, except with regards to the partners which have implemented a FTA with Korea (especially the EU).
34
FTA in force with Korea: ASEAN, Chile, EFTA, Singapore and India; FTA under negotiation with Korea: the USA and
Canada (the FTA under negotiation with Japan and Mexico are disregarded given the delays in the negotiations). FTA
under negotiation with the EU: India, Singapore and Canada.

52
On the other hand, the second option expects the Doha round to be concluded. Consequently, this option includes a standard multilateral liberalization, including services and trade facilitation. In addition, it takes into account the FTAs under negotiation with Korea, which involve the USA and Canada. Similarly, it includes the FTAs under negotiation with the EU. Finally, it assumes a 25% increase in the Korean service protection (using the GATS commitments as an upper bound).
Table 3.2: Baseline and scenarios used for the EU-FTA simulations
(1) Including services and trade facilitation
(2) Korea-US: Tariff: 95% of liberalization in 3 years and the rest in 10 years. Around 2% is excluded (agriculture); Services: binding of actual openness (similar to EU but without additional liberalization in 3 sectors); Korea with Canada: 95% cut for goods. FTAs with the EU: same bilateral tariff cuts as for the EU-Korea agreement. The EU-Vietnam FTA under negotiation is excluded from this baseline as its timing and conclusion are still too uncertain. The same remark also applies to the Korea-Japan and Korea-Mexico FTAs.
With regard to the scenario selected in this study, it includes a unique option, which is as close as possible to the official contents of the agreement. In particular, the scenario concerning the phasing out of tariffs respects rigorously the official schedule. It is spread over 20 years depending on the product considered35. Turning to NTBs in goods, the scenario is also close to the provisions of the agreement, by distinguishing several industries. Concerning imports into Korea, the automotive industry is expected to enjoy a 60% cut in NTBs when the agreement is in force. This cut is assumed to be essentially applied on a bilateral basis (only 10% on MFN basis). In addition, a remaining 20%
35 The only simplification concerns the final year of tariff removal, expected 15 years after the agreement is in force. Since very few products are officially expected to be liberalized after 15 years (see Chapter 1), the bias introduced by this simplification is insignificant.
BASELINE:Baseline 1 Baseline 2
Doha: No agreement Doha: standard liberalisation (1)
FTAs: only those currently in force FTAs: including also Korea-USA, Korea-Canada,
EU-India, EU-Singapore, EU-Canada (2)
Services: increase in Korean protection by 50% Services: increase in Korean protection by 25%
SCENARIO:TARIFFS Official schedule
NTBs:
- Automotive 60% cut at t=0 (Korea, out of which 10% at MFN basis); another 20% cut at t=5 (Korea)
- Consumer electronics 80% cut over 5 years (Korea)
- Pharmaceuticals 50% cut at t=0 (Korea, MFN basis)
- Other industries 20% cut (EU and Korea)
SERVICES (Mode 1 and Mode 3):
- telecom and financial 10% cut at t=2 (Korea)
- business services 10% cut at t=10 (Korea)
- Other services current level of protection unchanged
TRADE FACILITATION No

53
cut is also expected after 5 years. NTBs for consumer electronics are expected to be cut 80% over 5 years. Pharmaceuticals are assumed to have NTBs in Korea immediately reduced by 50% (on MFN basis). The other industries will be applied a 20% bilateral cut for both the EU and Korea.
Concerning services, the scenario is also based on the contents of the agreement described in Chapter one. As already said, the current regime in Korea is more liberal than its GATS commitments. Therefore, only a limited additional liberalization is assumed with the EU. Therefore, the EU-Korea FTA will give rise to a consolidation of this liberalization process, with no more cuts for most services, except telecommunications, financial services as well business services which are expected to enjoy an additional 10% cut.
Finally, trade facilitation is not considered at this stage. In the sensitivity analysis presented in Appendix 3.1, it is taken into account by considering that the time which is necessary to accomplish import procedures (customs procedure and time for processing goods at the port) will be reduced by 2 days for Korean and EU products (Decreux and Fontagné, 2009).
Section 3: Simulation results and comparison with alternative studies.
This section shows the main simulation results, which are presented for each baseline and each scenario as explained in Table 3.2. The detailed values of the elasticities of substitution used for the simulations are presented in Appendix 3.2. In the baselines, each variable has been extrapolated from year 2004. The exogenous variables that are used for the extrapolation are: total population, active population (employment) and expected GDP growth. The other variables are all endogenous. Finally, production structure and preferences are calibrated and described by structural parameters, which are unchanged from 2004 to 2025.
The results presented below refer to the “central” simulation based on the baselines and scenario described above. Moreover, given the high value of NTBs calculated in section 2, the central simulation includes NTB values which have been scaled down. This can be justified because NTBs have initially been calculated with the border-effect approach which may over-estimate NTBs, since it also accounts for home preferences. As explained in Chapter 2, this approach has been reconciled with the KNO methodology through the application of an appropriate scale. However, the direct calculations of NTBs using KNO for the car industry (presented in Chapter 4) leads to lower estimates than the initial ones. Therefore, the central simulation presented here includes NTBs scaled down by the factor which matches NTB estimated in Chapter 436.
In fact, the question is how to get NTB estimates as close to reality as possible. Since both the border effects and the KNO approaches present their own advantages and drawback, a sensitivity analysis will be implemented in order to assess to what extent the results are affected by the way NTBs are calculated.
36 This factor is equal to 0.4. It has been multiplied by the initial AVEs in order to get the scaled down values (see also Tables 2.3 and 2.4).

54
This section is organized as follows. General results on GDP and welfare are presented first. Then, the aggregate trade effects are discussed, including global and bilateral exports and imports as well as trade balances. Next, sectoral results are detailed. These include production and trade effects (including bilateral). Then, employment effects are discussed at sectoral level. In addition, other macroeconomic results are analyzed, including factor returns, exchange rates and tariff revenue. To conclude, a comparison with the other existing studies, especially the Copenhagen study (2007), is provided whereas Appendix 3.3 presents various sensitivity analyses.
a) GDP and welfare
Table 3.3 unsurprisingly indicates that the GDP effect of the EU-Korea FTA is generally more significant for Korea (up to 0.84% GDP growth) than for the EU (less than 0.1%). This result is not surprising because of the higher initial protection in Korea than in the EU.
Table 3.3: GDP changes due to the EU-FTA FTA (%).
It must also be observed that baseline 2 leads to reduced GDP effects for Korea but not for the EU. This is due to the fact that baseline 2 includes three components which may have opposite effects on GDP. The first includes Doha, which reduces the bilateral preference margin created by the EU-Korea FTA (negative effect). The second component relates to FTAs under negotiation, which have ambiguous effects. Although these FTAs also reduce the preference margin for EU and Korea, they can also improve efficiency effects, since overall discrimination is reduced. Finally, the last component involves a less significant rise in Korean service protection (25% instead of 50%) which will not be implemented vis-à-vis the EU if the FTA is concluded. This provides a lower increase in the preference margin and leads to less GDP gains.
Baseline 1 Baseline 2
r01 European Union 0,07 0,08
r02 Korea 0,84 0,46
r03 Japan -0,07 -0,06
r04 USA -0,03 -0,03
r05 China & Taiwan -0,01 -0,02
r06 ASEAN -0,01 -0,01
r07 India -0,00 -0,00
r08 Oceania -0,05 -0,04
r09 Canada -0,05 -0,04
r10 EFTA 0,01 0,01
r11 Brazil -0,01 -0,01
r12 Chile -0,01 -0,01
r13 Russia 0,00 -0,00
r14 Rest of World -0,01 -0,01

55
It is also worth mentioning that the other countries generally face GDP losses. These losses essentially result from trade diversion due to the implementation of the EU-Korea FTA. However, their magnitude is generally insignificant, except for Japan which is likely to lose more significant market shares with Korea.
The welfare gains are presented in Table 3.4. These gains are made up of five components: factor accumulation (capital and land), allocation efficiency gains, specific gains due to trade cost reduction, variety gains as well as terms of trade gains37. A last gain (called “other gains”) corresponds to residuals which generally include additional allocation efficiency gains.
Korea unsurprisingly gains more than the EU (up to 1.12% for Korea compared to 0.02% for the EU). The higher welfare gains expected for Korea are essentially due to its initial higher level of protection as well as to its smaller economic size relative to the EU. For the same reasons as previously explained, welfare gains may be reduced in baseline 2 relative to baseline 1 due to the reduced preference margin when implementing the FTA (25% instead of 50%) and possibly the extension of preferences to other partners, both multilaterally and regionally.
Table 3.4: Decomposition of the Welfare gain (%)
The global welfare gain for Korea is mainly due to terms of trade improvement, which results from the lower import prices due to NTB reductions. The other significant gains include capital accumulation (through increased investment) as well as variety gains (increase in the number of varieties available to the consumer due to the FTA). On the other hand, the EU gain is essentially explained by trade costs gains whereas the EU experiences a slight deterioration of its terms of trade.
37
Terms of trade gains include the effects of the reduction in import prices due to NTB reductions. Trade cost gains
include the reduction in production costs afforded by the reduction of NTBs, for a given export price.
European Union Korea
Baseline 1 Baseline 2 Baseline 1 Baseline 2
Allocation efficiency gains 0,00 -0,00 0,00 0,00
Capital accumulation gains 0,01 0,01 0,36 0,25
Land supply gains 0,00 0,00 -0,00 -0,00
Other gains -0,00 -0,00 0,09 0,03
Terms of trade gains -0,02 -0,01 0,54 0,39
Trade cost gains 0,03 0,03 0,04 0,04
Variety gains -0,01 -0,00 0,10 0,04
Welfare 0,01 0,02 1,12 0,75

56
b) Overall trade effects
Both the EU and Korea show a positive effect on exports and imports. Concerning Korea, this effect leads to an overall increase of (up to) 5.5% of its overall exports and 5.9% of its imports (Table 3.5). The rise in the Korean trade is of course very significant with the EU (up to 38.4%), as shown in Table 3.638.
Table 3.5: Effects on overall exports and imports (% change in value, no EU-intra trade)
Turning to the EU, export and import growth are respectively (up to) 1.4% and 1.3%. EU bilateral trade with Korea increases very significantly (up to 82.6%), as a result of the initial high protection in Korea39.
38
Korean export figures may be slightly inflated because the outsourcing of Korea production to Asian countries since
the base year 2004 is not captured in the estimates. 39
There is some evidence of trade diversion on the EU side, since the bilateral exports of the EU vis-à-vis third-countries is reduced (Table 3.6), especially with Japan. Similarly, the rise in EU imports from Korea is partly explained by the
EXPORTS
Baseline 1 Baseline 2
r01 European Union 1,40 0,96
r02 Korea 5,50 4,01
r03 Japan -0,19 -0,17
r04 USA -0,07 -0,08
r05 China & Taiwan -0,07 -0,04
r06 ASEAN -0,02 -0,03
r07 India -0,00 -0,03
r08 Oceania -0,17 -0,12
r09 Canada -0,15 -0,12
r10 EFTA -0,03 -0,03
r11 Brazil -0,03 -0,03
r12 Chile -0,05 -0,04
r13 Russia -0,00 -0,01
r14 Rest of World -0,04 -0,04
IMPORTS
Baseline 1 Baseline 2
r01 European Union 1,27 0,88
r02 Korea 5,87 4,25
r03 Japan -0,20 -0,18
r04 USA -0,04 -0,04
r05 China & Taiwan -0,07 -0,04
r06 ASEAN -0,01 -0,02
r07 India 0,00 -0,02
r08 Oceania -0,14 -0,10
r09 Canada -0,14 -0,11
r10 EFTA -0,01 -0,01
r11 Brazil -0,04 -0,04
r12 Chile -0,04 -0,03
r13 Russia -0,00 -0,01
r14 Rest of World -0,03 -0,03

57
Table 3.6: Effects on bilateral exports and imports (no EU-intra trade)
With regard to bilateral trade effects in value (Table 3.7), the increase in EU exports to Korea amounts to a minimum of 33 billion euros and a maximum of 41 billion euros depending on the baseline considered. This is more than the expected gain of 19 billion euros in the Copenhagen study. This difference is mainly due to the fact that the Copenhagen study disregards the trade effects of NTB reductions. For the same reason, EU imports from Korea increase by up to 34 billion euros.
replacement of EU imports from third countries. The evidence of trade diversion is less stringent for Korea. As a matter of fact, Korean bilateral exports increase not only with the EU, but also with most of its partners. This can be explained by the rise in competitiveness and efficiency of the Korean economy due to the reduction of the initial significant protection (especially NTBs). This export rise is particularly significant with countries which already enjoy an FTA with Korea (USA, Chile, EFTA, etc…). In other words, the rise in Korean efficiency due to the implementation of the FTA with the EU also benefits Korea with regards to exports markets which have already implemented such an FTA.
BILATERAL EXPORTS: EU
Baseline 1 Baseline 2
% billion euros % billion euros
r02 Korea 82,58 41,08 62,08 33,02
r03 Japan -0,43 -0,35 -0,46 -0,40
r04 USA -0,34 -1,72 -0,37 -1,90
r05 China & Taiwan -0,16 -0,39 -0,29 -0,72
r06 ASEAN -0,17 -0,29 -0,26 -0,44
r07 India -0,20 -0,19 -0,20 -0,40
r08 Oceania -0,36 -0,22 -0,38 -0,24
r09 Canada -0,39 -0,20 -0,43 -0,26
r10 EFTA -0,13 -0,24 -0,13 -0,24
r11 Brazil -0,19 -0,07 -0,24 -0,09
r12 Chile -0,25 -0,03 -0,23 -0,03
r13 Russia -0,13 -0,24 -0,16 -0,31
r14 Rest of World -0,25 -2,04 -0,29 -2,37
BILATERAL EXPORTS: KOREA
Baseline 1 Baseline 2
% billion euros % billion euros
r01 European Union 38,39 34,41 23,06 22,95
r03 Japan -1,84 -0,61 -0,93 -0,31
r04 USA 2,99 2,57 2,63 2,50
r05 China & Taiwan -1,57 -3,29 -0,53 -1,09
r06 ASEAN -0,54 -0,38 0,08 0,09
r07 India 0,14 0,03 0,82 0,11
r08 Oceania 0,49 0,05 1,18 0,14
r09 Canada 5,51 0,39 4,71 0,44
r10 EFTA 2,50 0,07 2,45 0,07
r11 Brazil -1,37 -0,05 -0,26 -0,01
r12 Chile 4,56 0,08 3,01 0,05
r13 Russia 1,99 0,16 1,88 0,15
r14 Rest of World 1,68 1,31 2,10 1,67

58
This makes it possible to improve the EU trade balance with regard to Korea by up to 10.1 billion euros. This improvement is significant, given that in 2008, the EU faced a 13.8 billion euros trade deficit vis-à-vis Korea.
Table 3.7: Effects on bilateral exports and imports (billion euros)
The final overall trade results relate to the analysis of terms of trade (Table 3.8). It is striking to observe that Korea significantly improves its terms of trade. This can be mainly explained by the high initial protection level, especially NTBs. The reduction of these NTBs like any other unnecessary trade cost, leads to a reduction in before-tariff import price, and thus to a terms of trade improvement. However, the EU does not enjoy such an improvement, essentially because of lower initial NTB levels40.
Table 3.8: Effects on terms of trade
40
It must also be observed that there is a relationship between terms of trade and real effective exchange rates. However, this relationship is not straightforward. In fact, the real effective exchange rate reflects relative production prices in a region as compared to a weighted average of production prices of its trade partners. An increase in this indicator means that prices in a region increase relative to other regions (appreciation). The concept of terms of trade also relates to import prices. In the case of Korea, the improvement of terms of trade is essentially due to an import price decrease due to the reduction in protection.
Baseline 1 Baseline 2
EU Exports to Korea 41,08 33,02
EU Imports from Korea 34,41 22,95
EU Trade balance with Korea 6,68 10,08
High Low
r01 European Union -0,06 -0,03
r02 Korea 1,16 0,81
r03 Japan -0,08 -0,08
r04 USA -0,03 -0,03
r05 China & Taiwan -0,03 -0,02
r06 ASEAN -0,03 -0,02
r07 India -0,01 -0,01
r08 Oceania -0,05 -0,04
r09 Canada -0,02 -0,01
r10 EFTA -0,01 -0,02
r11 Brazil -0,02 -0,01
r12 Chile -0,01 -0,01
r13 Russia -0,01 -0,01
r14 Rest of World -0,01 -0,01

59
c) Breakdown by sector
The EU-FTA generally has small production effects in the EU (Table 3.9). Small positive effects may be found in some animal and food products (meat, dairy products, beverage and tobacco and other food products), chemicals, machinery as well as other manufactured products. Transport services (sea and air transports) also exhibit a small production expansion in baseline 1. Conversely, a reduction in production occurs in textiles, leather and clothing as well as cars and other transport equipment. However, it is worth mentioning that this reduction is calculated compared to the baseline. Consequently, considering observed growth trends in the EU, production may not be reduced in absolute terms compared to today, but rather it will not expand as much as it would do without the agreement. This remark also applies to employment.
Korea shows to some extent a reverse picture, although the magnitude of the production effects is more significant. As a matter of fact, significant increases can be observed for textiles, cars/trucks, leather/clothing as well as other transport equipment to a lesser extent. The main reasons which underlie this result may be found not only in the high initial NTBs applied by Korea (especially for cars and truck 59%, textiles 51%)41, but also in the strong comparative advantage in these industries with regard to the EU. As a matter of fact, Korean exports of textiles to the EU are three times higher than the EU exports to Korea. This figure amounts to five times higher for transport equipment. Negative production effects are recorded for dairy products and meat as well as metals, machinery, electronic equipment, other manufactured products and transport services to a lesser extent.
Looking at overall trade effects in the EU, a significant increase is recorded for especially cars and trucks (more than a 5% rise in exports and more than a 7% rise in imports). This expected result is due to the high level of NTBs in the Korean car industry. Similarly, a significant increase in meat and dairy product exports (more than 10%) is also due to the liberalization of the Korean market in the FTA. Metal, electronic equipment, machinery as well as leather/clothing also exhibit a significant export increase because of Korean NTB cuts. However, exports are expected to be reduced in textiles.
41
NTB reductions from a high initial level lead to factor reallocation and increased efficiency which makes it possible to
increase the production of the concerned industries.

60
Table 3.9: Production effects: Sectoral breakdown
On the import side, the main import growth concern cars and trucks, textiles as well as other transport equipment to a lesser extent. Finally, for both imports and exports, changes are very small for EU trade in services
With regard to Korean trade, significant increases are found for leather/clothing (exports), textiles (mainly exports), cars, other transport equipment and chemicals (exports and imports), meat, food and dairy products (mainly imports), machinery, metals, other manufactured products as well as most services, especially finance, insurance and business services (imports).
With regard to textiles, it must be observed that the expansion of Korean exports to the EU will however be limited by the fact that the rules of origins negotiated in the agreement are more stringent
EUROPEAN UNION KOREA
Baseline 1 Baseline 2 Baseline 1 Baseline 2
a1 Agriculture and primary products 0,05 0,03 -0,45 -0,07
s01 Meat & Animal products 0,89 0,54 -7,89 -3,94
s02 Dairy 0,63 0,50 -21,20 -16,98
s03 Other Agriculture 0,10 0,06 -0,93 -0,66
s04 Food 0,15 0,12 -2,85 -2,21
s05 Beverage & Tobacco 0,13 0,13 -0,38 -0,54
s06 Primary -0,01 -0,01 -0,09 -0,07
a2 Manufactured products -0,01 0,02 0,90 0,41
s07 Textile -2,22 -2,06 34,25 24,33
s08 Leather & Clothing -0,04 -0,14 9,48 8,77
s09 Chemicals 0,17 0,09 -1,01 -0,88
s10 Metals 0,02 0,08 -1,98 -1,70
s11 Cars & Trucks -1,38 -0,40 19,34 8,08
s12 Planes Ships Bikes Trains -0,39 -0,65 1,75 4,72
s13 Electronic equipment 0,05 0,04 -1,56 -0,77
s14 Machinery 0,27 0,19 -2,94 -1,96
s15 Other Manufactured products 0,16 0,13 -1,35 -1,23
a3 Services 0,00 -0,00 -0,23 -0,13
s16 Trade -0,00 0,01 0,42 0,27
s17 Sea Transport 0,69 -0,07 -2,75 -0,07
s18 Air Transport 0,12 -0,07 -1,58 -0,09
s19 Other Transport 0,03 -0,00 -0,12 0,02
s20 Communication 0,00 -0,01 -0,08 -0,03
s21 Finance -0,01 -0,01 -0,07 -0,06
s22 Insurance 0,02 -0,00 -0,82 -0,53
s23 Business services 0,01 0,01 -0,96 -0,59
s24 Recreation & related Services -0,02 -0,02 0,47 0,33
s25 Admin Defence Health Education -0,01 -0,01 -0,05 -0,04
s26 Other Services 0,01 0,02 0,94 0,65
TOTAL (GDP change) 0,07 0,08 0,84 0,46

61
than those currently applied. Since this is not taken into account in the CGE model, the figures concerning textiles may be overestimated. Moreover, the Korean exports performance in the car sector is likely to be overestimated. The study is based on a dataset benchmarked to the year 2004 and does therefore not take into account the most recent creation of new Korean car production capacity in the EU and in third countries. This trend, that is likely to continue also in the coming years, implies an increase of shipment of Korean-branded cars from other countries than Korea.
Table 3.10: Trade effects: European Union (% change, sectoral breakdown)
Baseline 1 Baseline 2 Baseline 1 Baseline 2
a1 Agriculture and primary products 1,87 1,15 0,62 0,49
s01 Meat & Animal products 12,33 6,06 0,72 0,59
s02 Dairy 13,10 8,35 1,87 1,17
s03 Other Agriculture 1,66 1,31 0,50 0,45
s04 Food 2,71 2,12 0,61 0,48
s05 Beverage & Tobacco 1,07 0,97 0,22 0,22
s06 Primary 0,01 -0,02 0,20 0,14
a2 Manufactured products 1,61 1,17 1,95 1,29
s07 Textile -0,54 -1,36 4,60 3,45
s08 Leather & Clothing 5,44 2,72 0,76 0,56
s09 Chemicals 1,60 0,99 0,91 0,85
s10 Metals 1,99 1,52 0,36 0,37
s11 Cars & Trucks 5,56 5,67 14,75 7,14
s12 Planes Ships Bikes Trains 0,61 -0,02 1,35 1,46
s13 Electronic equipment 1,89 1,34 0,62 0,47
s14 Machinery 1,94 1,33 0,61 0,62
s15 Other Manufactured products 0,79 0,58 0,41 0,42
a3 Services 0,27 0,00 0,18 0,23
s16 Trade 0,74 0,24 0,16 0,21
s17 Sea Transport 0,93 -0,12 0,27 0,17
s18 Air Transport 0,28 -0,15 0,14 0,17
s19 Other Transport 0,10 -0,18 0,20 0,21
s20 Communication 0,19 -0,11 0,15 0,20
s21 Finance 0,18 -0,00 0,17 0,23
s22 Insurance 0,27 0,06 0,22 0,25
s23 Business services 0,41 0,14 0,15 0,21
s24 Recreation & related Services -0,18 -0,22 0,22 0,27
s25 Admin Defence Health Education 0,07 -0,26 0,24 0,30
s26 Other Services -0,08 -0,15 0,23 0,26
TOTAL 1,40 0,96 1,27 0,88

62
Table 3.11: Trade effects: Korea (% change, sectoral breakdown)
Table 3.12 on the bilateral trade effects makes it possible to go further in the analysis and draw some tentative conclusions. First, the most important export increase from the EU to Korea concerns cars and truck (about 400%). As expected, this means that the EU-Korea FTA will provide significant gains for EU car exporters in terms of market access into Korea42.
It must also be observed that Korea will also increase its car exports to the EU, though to a lesser extent (131%). However, if Korea implements a FTA with the USA and Canada (baseline 2), the
42
However, this sector shows significant trade diversion, since EU exports to the other countries (especially, Chile, Asian countries and intra-EU) are reduced by up to 4.9% (Table 3.13). Consequently, the overall rise in EU exports of cars is still significant, but limited to 5.5% (i.e. 7.6 billion euros).
EXPORTS: KOREA IMPORTS: KOREA
Baseline 1 Baseline 2 Baseline 1 Baseline 2
a1 Agriculture and primary products 4,87 4,52 2,73 1,86
s01 Meat & Animal products 10,98 6,80 37,38 11,64
s02 Dairy 65,81 46,91 223,00 138,33
s03 Other Agriculture 2,59 1,80 2,47 2,33
s04 Food 4,72 3,03 10,80 8,25
s05 Beverage & Tobacco 0,38 0,42 26,36 23,59
s06 Primary 0,64 0,55 -1,00 -0,93
a2 Manufactured products 6,04 4,16 7,92 5,91
s07 Textile 42,87 27,67 13,30 9,53
s08 Leather & Clothing 70,88 37,11 5,12 2,28
s09 Chemicals 5,40 4,80 8,85 6,02
s10 Metals -2,95 -2,12 4,90 3,30
s11 Cars & Trucks 51,41 23,84 94,86 82,41
s12 Planes Ships Bikes Trains 2,96 6,14 6,19 3,89
s13 Electronic equipment -0,92 -0,38 1,59 1,10
s14 Machinery -2,65 -1,35 9,85 6,50
s15 Other Manufactured products 0,62 0,72 5,81 4,29
a3 Services -2,72 -1,70 5,62 2,92
s16 Trade -1,78 -1,07 5,96 2,90
s17 Sea Transport 1,56 -0,37 0,53 0,16
s18 Air Transport -0,45 -0,38 1,43 0,38
s19 Other Transport -1,22 -0,66 1,98 0,68
s20 Communication -2,55 -1,58 4,75 1,89
s21 Finance -2,93 -1,83 13,96 7,11
s22 Insurance -3,88 -2,51 20,22 9,86
s23 Business services -3,43 -2,13 7,78 4,18
s24 Recreation & related Services -0,89 -0,46 1,52 0,87
s25 Admin Defence Health Education -4,18 -2,69 5,87 2,73
s26 Other Services -1,76 -0,96 10,50 4,38
TOTAL 5,50 4,01 5,87 4,25

63
increase in Korean car exports to the EU will be smaller (50.4%)43. In this regard, intra-industry trade will strongly increase in the car industry with significant gains in terms of product variety and efficiency. Finally, it must be noted that the rise in EU car imports from Korea is partly balanced by the reduction in imports from third countries.
A second result shows that the EU is also in a position to significantly increase its exports of other industrial products (up to 84%) as a result of Korean reduction in NTBs. In particular, machinery and electronic equipment exports which currently account for one-third of EU overall exports to Korea, are expected to grow by more than 65% in the most favorable scenario. Again, if the EU and Korea implement FTAs with other countries (ambitious baseline), this bilateral increase will be smaller. As a result of this export increase, intra-industry trade may also develop, since EU producers will enjoy a better market access in Korea, especially in consumer electronics. It must also be observed that the EU is expected to increase its exports of textiles and leather-clothing to Korea. This would increase intra-industry trade for these products (vertical product differentiation). However, as for the car industry, there is significant trade diversion for EU exports, which decrease with the other partners. This explains why the EU production in this industry slightly declines.
Third, the EU is expected to significantly increase its exports of agricultural products, especially meat and dairy products. Although Korean export increases are also high in the simulation for these products, it must be reminded that Korean exports are close to zero in the baseline (this mainly explains these extremely high figures).
Results concerning chemicals, other transport equipment, other manufactured products (and textiles/leather/clothing) exhibit a significant rise in bilateral exports for both the EU and Korea. This can lead to increasing competition and intra-industry trade for these sectors.
Finally, trade in services shows important differences between the EU and Korea. As a matter of fact, EU exports to Korea are expected to increase of more than 30% for almost all services, especially finance, insurance, communication as well as business and other services. On the other hand, Korea shows mainly a decrease in its service exports to the EU, with the exception of sea transport. This result reflects the comparative advantage in EU services with regard to Korea.
43
In any case, the increase in Korean exports of cars to the EU as well as trade diversion explain that overall production effects in the car industry in the EU are slightly negative (-1.38% in baseline 1 and -0.40% in baseline 2).

64
Table 3.12: Bilateral trade effects (% change, sectoral breakdown)
EXPORTS: EU EXPORTS: KOREA
Baseline 1 Baseline 2 Baseline 1 Baseline 2
a1 Agriculture 163,49 129,22 76,23 51,22
a2 NAMA 83,97 64,90 37,51 21,82
a3 Services 24,82 10,10 -2,45 -1,43
s01 Meat & Animal products 331,56 267,98 185,43 97,57
s02 Dairy 1114,24 928,06 4221,63 611,64
s03 Other Agriculture 259,96 215,87 82,98 50,98
s04 Food 170,93 146,12 80,91 40,87
s05 Beverage & Tobacco 68,19 65,48 47,98 34,28
s06 Primary 84,76 82,65 60,84 60,11
s07 Textile 175,01 111,36 182,95 96,07
s08 Leather & Clothing 148,96 77,60 210,70 93,73
s09 Chemicals 89,70 61,22 65,54 50,22
s10 Metals 77,64 60,75 9,52 6,62
s11 Cars & Trucks 481,01 447,40 131,57 50,38
s12 Planes Ships Bikes Trains 55,62 46,35 18,32 21,91
s13 Electronic equipment 65,77 59,65 6,76 3,40
s14 Machinery 84,71 59,78 9,09 7,46
s15 Other Manufactured products 50,62 42,37 31,65 26,78
s16 Trade 44,93 18,90 -1,58 -0,81
s17 Sea Transport 10,74 -0,58 1,82 -0,24
s18 Air Transport 10,06 -0,28 -0,31 -0,23
s19 Other Transport 14,67 -0,26 -0,98 -0,40
s20 Communication 35,54 5,09 -2,41 -1,38
s21 Finance 62,49 31,96 -2,80 -1,66
s22 Insurance 79,14 39,87 -3,67 -2,26
s23 Business services 31,90 16,62 -3,28 -1,93
s24 Recreation & related Services 1,32 0,62 -0,63 -0,16
s25 Admin Defence Health Education 42,19 0,54 -3,96 -2,39
s26 Other Services 99,78 39,26 -1,56 -0,72
TOTAL 82,58 62,08 38,39 23,06

65
Table 3.13: Bilateral trade effects : the car industry (% change, Exporter: EU)
Additional results may be provided by analyzing bilateral trade effects in value (including trade balances). In this regard, EU exports to Korea significantly exceed imports regarding chemicals, machinery and other manufactured products (Table 3.14). This leads to an improvement of the EU bilateral trade balance by about 15 billion euros for these industries taken together. The other sectors with positive effects on the EU bilateral trade balance include agriculture and food products (meat, dairy and other food product for about 5 billion euros) as well as services (up to 2 billion euros).
On the other hand, the rise in EU bilateral imports of cars exceeds that of exports. Consequently, the EU trade balance regarding the car industry deteriorates by 5 billion euros or 13 billion euros depending on the baseline considered. Other EU trade balance deterioration concerns textiles (3 billion euros).
Overall, as already shown, the EU bilateral trade balance with Korea is expected to improve by about 6.7 billion euros in baseline 1 and 10.1 billion euros in baseline 2. This would contribute to reducing the current bilateral trade deficit that the EU faces vis-à-vis Korea (13.8 billion euros in 2008).
EXPORTS of cars: EU
Baseline 1 Baseline 2
% billion euros % billion euros
r02 Korea 481,01 8,19 447,40 7,96
r03 Japan -1,03 -0,07 -0,58 -0,04
r04 USA -1,52 -0,54 -0,86 -0,33
r05 China & Taiwan -2,33 -0,10 -1,38 -0,08
r06 ASEAN -3,16 -0,06 -1,78 -0,03
r07 India -4,92 -0,01 -1,11 -0,02
r08 Oceania -1,26 -0,05 -0,60 -0,03
r09 Canada -1,49 -0,04 -0,92 -0,03
r10 EFTA -0,88 -0,10 -0,48 -0,05
r11 Brazil -0,62 -0,01 -0,24 -0,01
r12 Chile -4,72 -0,02 -2,73 -0,01
r13 Russia -2,03 -0,11 -1,11 -0,06
r14 Rest of World -1,84 -0,71 -1,04 -0,40

66
Table 3.14: Bilateral trade effects (billion euros, sectoral breakdown)
d) Effects on employment
Table 3.15 shows that the effects on EU employment are very small44. The only effects which are greater than 1.5% concern textile (down to -2.3%). As already discussed earlier, employment effects concerning textiles may be overestimated since MIRAGE does not take into account the effects of the stricter rules of origin negotiated in the agreement. Moreover, this industry accounts for less than 0.5% of the skilled and unskilled labour force in the EU. In addition, the negative effects in the shrinking industries (especially textile) are balanced by positive employment effects in expanding sectors (machinery, chemicals, other manufactured products and transport services). This leaves overall employment unchanged. It must also be stressed that employment effects in the car industry are small but slightly negative whatever the baseline.
44 Employment effects are presented in % change, as MIRAGE does not directly include employment figures. In addition, these effects are not strictly comparable across sectors. This explains that Table 3.15 does not provide summarized effects across sectors.
EU exports to Korea EU imports from Korea Bilateral EU trade balance
Baseline 1 Baseline 2 Baseline 1 Baseline 2 Baseline 1 Baseline 2
a1 Agriculture 8,48 6,82 4,74 3,87 3,74 2,95
a2 NAMA 30,71 25,36 29,75 19,12 0,96 6,24
a3 Services 1,89 0,84 -0,09 -0,05 1,97 0,89
s01 Meat & Animal products 2,02 1,32 0,00 0,00 2,02 1,32
s02 Dairy 1,63 1,39 0,01 0,01 1,62 1,38
s03 Other Agriculture 0,58 0,53 0,02 0,01 0,57 0,52
s04 Food 1,16 1,02 0,09 0,06 1,08 0,96
s05 Beverage & Tobacco 0,32 0,31 0,00 0,00 0,32 0,31
s06 Primary 0,39 0,30 0,01 0,01 0,38 0,29
s07 Textile 0,64 0,48 4,25 3,54 -3,61 -3,05
s08 Leather & Clothing 1,43 0,87 1,21 0,84 0,23 0,03
s09 Chemicals 6,38 4,72 1,27 1,08 5,11 3,64
s10 Metals 1,72 1,47 0,36 0,24 1,37 1,23
s11 Cars & Trucks 8,53 8,29 21,93 13,27 -13,39 -4,98
s12 Planes Ships Bikes Trains 0,45 0,40 1,38 1,43 -0,93 -1,04
s13 Electronic equipment 1,61 1,54 2,21 1,11 -0,61 0,43
s14 Machinery 5,88 4,76 1,67 1,31 4,21 3,45
s15 Other Manufactured products 5,47 4,60 0,09 0,08 5,38 4,52
s16 Trade 0,38 0,19 -0,01 -0,00 0,39 0,19
s17 Sea Transport 0,41 -0,02 0,01 -0,00 0,41 -0,02
s18 Air Transport 0,28 -0,01 -0,00 -0,00 0,29 -0,01
s19 Other Transport 0,15 -0,00 -0,00 -0,00 0,15 -0,00
s20 Communication 0,04 0,01 -0,01 -0,00 0,04 0,01
s21 Finance 0,10 0,06 -0,02 -0,01 0,12 0,07
s22 Insurance 0,28 0,17 -0,00 -0,00 0,28 0,17
s23 Business services 1,05 0,61 -0,05 -0,03 1,10 0,64
s24 Recreation & related Services 0,01 0,00 -0,00 -0,00 0,01 0,00
s25 Admin Defence Health Education 0,14 0,00 -0,00 -0,00 0,14 0,00
s26 Other Services 0,02 0,01 -0,00 -0,00 0,02 0,01
TOTAL 41,08 33,02 34,41 22,95 6,68 10,08

67
Employment effects for Korea are a bit more significant (Table 3.16). In particular, employment in textile and leather/clothing increases significantly. However, these industries amount to a very small part of total employment in Korea. Significant positive effects are also recorded for cars (and other transport equipment to a lesser extent). The most significant decrease in Korean employment is recorded for dairy products and meat (whose share of total employment is very small). Smaller decreases are found in some manufactured products as well as some services (business services, transport services and insurance). However, overall employment effects are very small. As a result, the EU-Korea FTA is unlikely to produce significant shifts in the employment market which could lead to a disruption of labor markets, both in the EU and in Korea. This conclusion correlates with that corresponding to the Trade SIA study (IBM, 2008), which shows that employment effects are insignificant for the EU whatever the industry considered. Effects on Korean employment are slightly higher but generally below 1% for each industry, except textiles, cars and trucks as well as other transport equipment.
Table 3.15: Effects on sectoral employment: European Union ( %)
EU skilled EU unskilled
Baseline Baseline share in Baseline Baseline share in
1 2 total empl. 1 2 total empl.
s01 Meat & Animal products 0,93 0,56 0,2% 0,99 0,60 0,7%
s02 Dairy 0,66 0,52 0,3% 0,74 0,58 0,9%
s03 Other Agriculture 0,11 0,07 0,3% 0,12 0,07 2,8%
s04 Food 0,16 0,13 0,8% 0,17 0,13 1,8%
s05 Beverage & Tobacco 0,13 0,12 0,1% 0,14 0,12 0,3%
s06 Primary -0,02 -0,03 0,3% -0,02 -0,04 0,4%
s07 Textile -2,25 -2,10 0,2% -2,30 -2,17 0,5%
s08 Leather & Clothing 0,02 -0,11 0,2% 0,06 -0,09 0,7%
s09 Chemicals 0,19 0,09 2,6% 0,20 0,09 3,2%
s10 Metals 0,04 0,09 1,5% 0,03 0,08 3,1%
s11 Cars & Trucks -1,42 -0,42 1,3% -1,50 -0,47 2,4%
s12 Planes Ships Bikes Trains -0,38 -0,65 0,4% -0,38 -0,66 0,7%
s13 Electronic equipment 0,06 0,04 0,7% 0,07 0,05 0,9%
s14 Machinery 0,30 0,20 3,6% 0,30 0,19 4,4%
s15 Other Manufactured products 0,18 0,13 2,7% 0,18 0,13 5,4%
s16 Trade -0,00 -0,00 8,3% -0,01 -0,01 15,8%
s17 Sea Transport 0,33 0,07 0,3% 0,32 0,05 0,6%
s18 Air Transport 0,12 -0,05 0,2% 0,12 -0,07 0,5%
s19 Other Transport 0,08 0,03 2,6% 0,07 0,02 5,0%
s20 Communication -0,00 -0,02 2,5% -0,01 -0,03 1,6%
s21 Finance -0,01 -0,02 4,1% -0,01 -0,03 2,7%
s22 Insurance 0,03 -0,01 1,7% 0,02 -0,01 1,1%
s23 Business services 0,00 -0,01 15,4% -0,00 -0,02 9,0%
s24 Recreation & related Services -0,03 -0,02 4,5% -0,03 -0,03 2,8%
s25 Admin Defence Health Education -0,01 -0,01 40,1% -0,01 -0,01 24,7%
s26 Other Services 0,01 0,01 5,0% 0,00 -0,00 8,2%

68
Table 3.16: Effects on sectoral employment: Korea (%)
e) Other results
Results concerning factor rewards show an increase in wages in Korea (for skilled and unskilled workers) as well as a smaller rise in the return of capital (Table 3.17). Changes in factor rewards are very small in the EU (only a slight increase).
Changes in the real effective exchange rate are also small, although Korea shows an appreciation of its currency in real terms. This appreciation is due to the fact that the reduction in Korean NTBs makes it possible to increase competitiveness and consequently exports, not only to the EU but also to other countries, as already shown. This leads to an improvement of the overall trade balance45. This is not allowed in MIRAGE, which expects overall trade balance equilibrium. Consequently, an appreciation of the won is necessary in order to match the equilibrium assumption.
45
Except with the EU, as mentioned previously.
Korea skilled Korea unskilled
Baseline Baseline share in Baseline Baseline share in
1 2 total empl. 1 2 total empl.
s01 Meat & Animal products -9,41 -4,70 0,1% -10,19 -5,24 0,2%
s02 Dairy -22,74 -18,23 0,1% -24,80 -20,06 0,2%
s03 Other Agriculture -1,26 -0,86 0,1% -1,93 -1,33 2,2%
s04 Food -3,05 -2,33 0,4% -3,53 -2,68 0,4%
s05 Beverage & Tobacco -0,84 -0,85 0,1% -1,35 -1,22 0,2%
s06 Primary -0,80 -0,54 0,1% -1,38 -0,94 0,2%
s07 Textile 34,85 24,35 0,3% 35,13 24,26 0,7%
s08 Leather & Clothing 11,52 9,99 0,2% 10,87 9,61 0,4%
s09 Chemicals -0,79 -0,57 1,4% -1,19 -0,87 1,4%
s10 Metals -2,43 -1,99 2,9% -2,86 -2,29 4,2%
s11 Cars & Trucks 22,40 9,80 2,4% 22,42 9,76 3,3%
s12 Planes Ships Bikes Trains 0,87 3,99 1,0% 0,38 3,64 1,4%
s13 Electronic equipment -2,01 -1,08 3,2% -2,58 -1,50 3,4%
s14 Machinery -3,33 -2,19 7,7% -3,74 -2,48 8,7%
s15 Other Manufactured products -1,61 -1,40 1,2% -2,06 -1,73 1,6%
s16 Trade 0,15 0,10 6,3% -0,26 -0,20 10,1%
s17 Sea Transport -0,06 -0,19 0,1% -0,52 -0,52 0,2%
s18 Air Transport -1,12 -0,24 0,2% -1,56 -0,56 0,3%
s19 Other Transport -0,22 -0,03 2,4% -0,59 -0,30 4,0%
s20 Communication -0,56 -0,36 2,5% -1,02 -0,69 1,8%
s21 Finance -0,50 -0,35 4,4% -0,91 -0,65 3,4%
s22 Insurance -0,97 -0,62 2,8% -1,15 -0,76 2,6%
s23 Business services -1,31 -0,83 9,9% -1,68 -1,10 7,9%
s24 Recreation & related Services 0,27 0,19 3,4% 0,02 0,01 3,0%
s25 Admin Defence Health Education -0,17 -0,11 40,4% -0,23 -0,17 25,5%
s26 Other Services 0,51 0,36 6,4% 0,01 -0,00 0,0%

69
As a last result, Korea is expected to lose some tariff revenue. However, this loss is limited to 0.03% point of GDP. Conversely, the loss of EU tariff revenue is insignificant given the small share of Korean imports in total EU imports and given the low EU tariffs applied to Korean imports.
Table 3.17: Other results
f) A comparison with the Copenhagen study
The present study differs from the Copenhagen study (2007) in several respects. These include: i) differences in the measure and consideration of protection, especially NTBs; ii) the definition of the baselines and scenarios; iii) the structure and the assumptions of the models.
The main difference is due to the measure of protection. In fact, the Copenhagen study takes into account only tariffs as the trade protection for goods. As a result, the AVEs corresponding to NTBs are not considered in the calculation of protection and simulations only include tariff cuts, not NTB cuts. This difference is really crucial, since we showed in Chapter 2 that protection is mainly due to NTBs. It depends very little on tariffs, especially for sensitive sectors such as cars, consumer electronics, chemicals, metal products, textile and clothing. This crucial difference leads the Copenhagen study to underestimate the trade effects of trade liberalization for goods and overestimate those on services through the channels of factor allocation and comparative advantages.
In other words, the initial protection of goods relative to services is low in the Copenhagen study (see Table 3.18). This explains why the reduction in the protection of goods has a much less significant impact whereas the reduction in protection of services has a more significant impact (through the channel of factor reallocation and comparative advantages). Conversely, since the present study includes NTBs in goods, the initial protection of goods relative to services is much higher. This explains why the reduction in protection in goods has a much higher impact through factor reallocation.
EUROPEAN UNION KOREA
Baseline 1 Baseline 2 Baseline 1 Baseline 2
Real effective exchange rate 0,05 0,07 0,46 0,24
Real return to capital 0,10 0,09 0,22 0,15
Skilled real wages 0,04 0,05 1,79 1,23
Tariff revenue (points of GDP) -0,00 -0,00 -0,03 -0,02
Unskilled real wages 0,03 0,04 1,66 1,15

70
Another difference is due to the calculation of protection in services. The Copenhagen study relies on gravity estimates which provide an average protection across services. As already discussed in detail in Chapter 2, the present study relies on more recent methods for the calculation of protection in services. In addition, AVEs are calculated for each service. Again, this will lead to different results, especially because our study makes it possible to differentiate the services with high protection levels and thus high AVEs (for example finance and insurance in Korea) from those with lower protection levels (business services and air transport). It also makes it possible to include in the scenarios specific protection cuts for each service category.
Table 3.18: Bilateral import protection in the EU and Korea: A comparison with the Copenhagen study (in tariff equivalents)
Note: CEPII/ATLASS figures include scaled down AVE for goods (see Chapter 2)
Other differences rely on the choice of the baselines and scenarios. The main difference concerns services. In the present study, it is assumed that in case of no FTA with the EU, Korea increases its
EU KOREA
CEPII/ATLASS Copenhag. CEPII/ATLASS Copenhag.
OthAgr 0.101 0.069 0.053 0.1
Animal 0.184 0.001 0.067 0.07
Dairy 0.322 0.124 0.057 0.42
Primary 0.260 0.01 0.167 0.05
Food 0.250 0.124 0.106 0.35
BevTob 0.185 0.243 0.068 0.25
Textile 0.191 0.086 0.507 0.1
LeathCloth 0.172 0.11 0.335 0.12
OthManuf 0.140 0.034 0.302 0.08
Chemicals 0.426 0.047 0.333 0.07
Metals 0.039 0.03-0.074 0.376 0.03-0.08
CarsTrucks 0.073 0.1 0.592 0.08
TransEquip 0.120 0.1 0.335 0.08
Electronic 0.264 0.017 0.285 0.01
Machinery 0.008 0.018 0.236 0.06
Services, of which: 0.173 0.46
Other services 0.278 0.779
Trade 0.188 0.387
OthTransp 0.155 0.106
SeaTransp 0.228 0.187
AirTransp 0.127 0.106
Communication 0.195 0.235
Finance 0.161 0.525
Insurance 0.331 0.672
Business 0.179 0.205
Public Serv 0.270 0.289

71
protection by 50% (baseline 1) or 25% (baseline 2). This increases the bilateral trade impact of implementing the FTA in services, especially for baseline 1. As a matter of fact, Tables 3.12 and 3.14 show a significant positive impact on EU exports of services to Korea. This positive impact is disregarded in the Copenhagen study which does not assume any rise in Korean protection on services if the FTA is not implemented with the EU. But on the other hand, the Copenhagen study assumes a very significant decrease in Korean protection on services (immediate 25%, 50% and 100% for all services in each scenario) in case the FTA is implemented whereas the present study generally assumes no protection cuts (except a limited 10% decrease for telecom and financial services after 2 years as well as an additional 10% decrease in business services after 10 years). This difference significantly lessens the trade impact of services in the present study.
Another difference in the baseline concerns the ways FTAs other than EU-Korea are considered in the two studies. For example, with regard to the first baseline, the Copenhagen study considers that all FTAs with Korea are implemented at the same time (EU, USA, Canada, China, EFTA, India, Japan and ASEAN). These FTAs are assumed to have similar contents, including limited trade liberalization in agriculture, full liberalization in manufacturing and 25% reduction in services. The other baseline does not take into account these FTAs. Consequently, the baselines in the Copenhagen study are quite different from those in the present study, which makes a difference between the FTAs already implemented and those under negotiation as well as a difference in the contents and the year of implementation of these agreements.
Finally, the scenario in the present study includes a tariff schedule which matches exactly the contents of the agreement. Conversely, the Copenhagen study assumes a likely scenario with about 96% liberalization in tariff lines, which is less than in the present study.
A last set of differences is due to the CGE models applied for the simulation, which slightly differ in the assumptions and aggregation schemes. As shown in section 2, MIRAGE exhibits some specificities, related for example to the calibration procedure for horizontal product differentiation, the consideration of vertical product differentiation and FDI, etc.
Table 3.19 provides a comparison of the main results derived in the two studies. As compared with the Copenhagen study, the basic macroeconomic results are similar in terms of GDP changes46. However, bilateral trade growth is slightly higher. As a matter of fact, bilateral changes in EU exports (33 billion euros in the present study) are greater than in the Copenhagen study (19.1 billion euros)47. The same remark also applies for imports (23 billion euros and 16 billion euros repectively). The larger trade effects in this study can be explained to a large extent by NTB reductions, which are disregarded in the Copenhagen study.
46
The Copenhagen study expects a maximum GDP growth of 1.6% for Korea and 0.3% for the EU in case of full
liberalization (including services; see Table 4.16 and 4.17 of the Copenhagen study). This is greater than our results
because of the difference in the scenario. However, in case of partial liberalization, the Copenhagen study expects a
maximum GDP growth of 0.8% for Korea and 0.1% for the EU. These results are similar to those of the present study. 47
This corresponds to minimum values in Table 3.7.

72
Moreover, the fact that this study presents similar GDP effects but slightly higher trade effects can mainly be explained by the inclusion of NTBs in the present study. Indeed, the reduction in NTBs leads to significant trade and welfare effects (due especially to the rise in consumption in imported products) but low gains in GDP, because the rise in exports is offset to a large extent by the rise in imports, so that the overall trade effects due to NTB reduction has a limited impact on GDP. In addition, NTB reductions imply a significant terms-of-trade gain for the importing countries, as consumers can consume cheaper imported products without any tariff revenue loss. However, this has little effect on the volume of GDP itself. In other words, purchasing power increases without any necessary production increase. The other explanations of the differences across the two studies are related to differences in the baseline and scenarios and to differences in the calculation of protection in services.
Sectoral results are also different, as expected. In particular, the Copenhagen study expects a decrease in the EU production of manufactured goods (and a corresponding rise in Korea). In the present study, this is generally not expected given that the EU is in a position to take advantage of the significant reduction in the high initial NTBs in Korea. In particular, the production of chemicals, machinery and other manufactured products are generally expected to increase and the EU is in a position to increase the exports of these products, as shown previously.
Consequently, the general conclusion of the present study is that the EU may improve its position in several industries (chemicals, machinery, other manufactured and food products) as well as in specific services to a lesser extent (business, insurance and transport services )48. On the other hand, Korea takes advantage of the agreement for some manufactured products (textile, leather/clothing, cars and other transport equipment). This is different from the Copenhagen conclusion where the EU improves its position in services to a much larger extent but suffers a deterioration in manufactured products (with the reverse conclusion for Korea).)
48
For services, the EU takes advantage of an increase in bilateral exports to Korea, but there are small overall trade and
production effects.

73
Table 3.19: The effects of the EU-Korea FTA on GDP, exports and sectoral production: A comparison with the Copenhagen study (% changes)
Finally, as compared with the Pukyong study (2006) and the KIEP study (2005), conceptual differences are more significant than with the Copenhagen study for several reasons. First, these two studies do not include imperfect competition. Second, the derivation of NTBs in services uses a different method. Third, the baselines are also very different (the Pukyong study concentrates more on manufactured products than on services, the tariff schedules are different, Doha is disregarded as well as the other FTAs under negotiation with Korea). Given these significant differences, the results are hardly comparable to those found in the present study.
Interestingly, our results can also be compared with those of Baughman and François (2009), which quantify the cost for the USA of the failure to implement the US-Korea FTA, assuming that the EU-Korea FTA and the Canada-Korea FTA are implemented. Results show that the USA would lose 35.1 billion dollars in terms of exports, 40.1 billion dollars in terms of GDP as well as 345,000 jobs.
EU KOREA
CEPII/ATLASS Copenhag. CEPII/ATLASS Copenhag.
min max min max min max min max
GDP 0.07 0.08 0.1 0.3 0.46 0.84 0.6 1.6
Overall exports (%) 0.96 1.40 0.3 0.9 4.01 5.50 6.4 20.8
Bilateral Exports (billion euros) 33.0 41.1 19.1 30.8 23.0 34.41 16.4 n.a.
Production:
Cars -1.38 -0.40 -1.74 -0.9 8.08 19.34 16.35 28.80
Textile -2.22 -2.06 -0.61 -0.27 24.33 34.25 0.93 1.45
Leather-Clothing -0.14 -0.04 -0.25 0.06 8.77 9.48 0.55 2.87
chemicals 0.09 0.17 -0.48 -0.03 -1.01 0.88 -0.78 2.73
metals 0.02 0.08 -0.96 -0.06 -1.98 -1.70 -0.27 -18.12
machinery 0.19 0.27 -1.68 0.06 -2.94 -1.96 6.26 27.06
consumer electronics 0.04 0.05 -1.68 -0.41 -1.56 0.77 0.22 27.07
transport services -0.05 0.28 0.10 0.15 -1,48 -0.05 -0.03 4.07
communication -0.01 0.00 0.07 0.33 -0.08 -0.03 -6.65 -1.64
financial -0.01 -0.01 0.02 0.18 -0.07 -0.06 -2.17 -0.23
insurance 0.00 0.02 -0.21 -0.05 -0.82 -0.53 -0.28 -0.19
business 0.01 0.01 0.13 0.66 -0.96 -0.59 -23.08 -4.88

74
Chapter 4: Non-Tariff Barriers: A Case Study of the Korean Automotive Sector
The EU-Korea FTA is distinctive in including specific sectoral disciplines as Non –Tariff Barriers
(NTBs) to trade. The sector specific annexes to the FTA cover consumer electronics,
pharmaceuticals, chemicals and automotive products. We concentrate here on the nature and
implications of the NTBs in the Korean market on automotive products, and the corresponding
implications of the agreement for lowering trade barriers and stimulating trade.
NTBs cover all the barriers to trade other than tariffs, which may arise for a number of reasons both
deliberately and unintentionally to protect domestic producers. For whatever the reason, the
outcome has been a tendency for the cost of supplying the protected market to rise. The price of
imports in the domestic market is driven up in similar fashion to the way in which a tariff raises the
price of imported goods on the domestic market. Indeed this equivalent price raising effect of a NTB
to a tariff gives rise to the concept of the tariff equivalent of a NTB. It is the aim of this chapter to
explain and identify the price-raising effects of NTBs against automobile products imported into
Korea, and to summarize their effects as tariff-equivalents that can be used in the study’s wider
simulations of the trade and welfare effects of removing these NTBs.
The remainder of the chapter is organized as follows. The following two sections review the
characteristics of the Korean automotive sector and the potential NTBs (in particular barriers induced
by technical standards) against automobile imports into Korea. We then turn to the measurement of
the tariff-equivalents of their NTBs. In section 5 we review the possible methodologies, and in
section 6 set out our preferred methodology. The results of applying this methodology are reported
in section 7, and the implications of the EU-Korean FTA for lowering trade barriers are considered
in section 8. The overall summary conclusions of the chapter are provided in section 9.
Section 1: The Korean Automotive Sector
The purpose of this section is to give some background information on the characteristics of EU-
Korean trade regarding motor vehicles and regarding the competitiveness of the European car sector

75
relative to its Korean counterpart. The aim of this ‘pre-analysis’ is to see on which product categories
NTBs might have the most severe impact.
In 2005, the European automobile industry contributed 40% to the global motor vehicle production.
South Korea produced in the same period 7.4% of the global motor vehicle supply and ranked,
hence, fourth among all global automobile producers (CEPS, 2007). These figures already give us an
idea of the importance and relative strength of Korea’s automotive industry. To assess the role of the
motor vehicle sector in the proposed EU-Korea FTA in more detail it is worthwhile to illustrate the
pattern of Korea’s and the EU’s specialization in international trade.
UN-export data shows the relative importance of the machinery and transport equipment sector for
the European economy, amounting to 44-46% of the overall value of its exports between 1999 and
2005 (CEPS, 2007). Within this category auto vehicles were the largest group. Comparing the
relative net trade performances of road vehicles and passenger cars (SITC 78 and 781 respectively)
by using a normalized trade balance index,49 we can illustrate that Korea’s automobile industry has
been predominately focused on exports between 2000 and 2008 (all index values are above or equal
to 0.75 – table 4.1)50.
49
The normalized trade balance index is used by the OECD and others and is calculated as: Z = (X – M) / (X + M); – 1 ≤ Z
≥ 1, where: X = exports M = imports. 50
Compare with table 4.1.

76
Table 4.1: EU and Korean Normalised Trade Balance Indexes (2000-2008)
Source: WITS-UN Comtrade database, author’s own calculations
In order to examine more closely the EU’s and Korea’s trade in the automotive industry it is worth
examining the comparative advantage of both countries. A study conducted by CEPS (2007) on the
impact of the EU-Korea FTA uses the ‘symmetric revealed comparative advantage‘ index (srca) to
measure trade intensity and export specialization.51 In table 4.2 we report the same index for 2008.
51
c.f. CEPS (2007) p. 138; Calculation of the symmetric revealed comparative advantage:
SRCAik = (RCAik – 1) / (RCAik + 1); where: RCAik = (xik / Σk xik) / (xwk / Σk xwk) and xik = country i’s exports of product
k; xwk = world exports of product k
Korea
2000 0.01 0.25 0.26 0.82 0.97 0.02
2001 -0.02 0.23 0.29 0.80 0.96 0.00
2002 -0.01 0.17 0.30 0.75 0.91 -0.12
2003 0.01 0.15 0.32 0.77 0.92 -0.15
2004 0.06 0.09 0.36 0.81 0.93 -0.15
2005 0.06 0.07 0.36 0.81 0.90 -0.07
2006 0.07 0.05 0.35 0.79 0.88 0.00
2007 0.07 0.00 0.34 0.77 0.87 0.08
2008 0.08 -0.04 0.34 0.75 0.85 0.13
EU25
2000 0.24 0.04 0.03 0.32 0.42 -0.16
2001 0.24 0.05 0.08 0.37 0.47 -0.14
2002 0.26 0.09 0.11 0.40 0.49 -0.13
2003 0.26 0.09 0.10 0.37 0.43 -0.14
2004 0.25 0.07 0.09 0.35 0.38 -0.14
2005 0.25 0.07 0.10 0.36 0.40 -0.16
2006 0.24 0.01 0.11 0.34 0.36 -0.17
2007 0.23 -0.03 0.12 0.33 0.36 -0.19
2008 0.22 0.00 0.15 0.37 0.40 -0.18
Chemicals (SITC 5)
Manufactured goods
classified by materials
(SITC 6)
Machinery and
transport equipment
(SITC 7)
Road vehicles (SITC 78)Vehicles for passengers
transport (SITC 781)
Miscellaneous
manufactured goods
(SITC 8)

77
Table 4.2: Korean and European Union Symmetric Revealed Comparative Advantage, 2008
Source: UN Comtrade database, author’s own calculations Note: srca indexes range from -1 to 1, and is positive in case of comparative advantage, and negative in case of comparative disadvantage. Source: CEPS, 2007, p. 138
The symmetric revealed comparative advantage index indicates that both countries have a revealed
comparative advantage in producing road and passenger transport vehicles. The index however
identifies stronger advantage for Korea, reflecting in the higher Korean product specialization.
Regarding the subgroup of passenger vehicles it is worth noticing that Korea is significantly more
competitive than European Union (0.25 for Korea compared to 0.09 index units for the EU).
Moreover, it can be shown that EU-Korea trade is characterized by an important trade deficit in the
machinery and transport equipment sector. KAMA (2007) reports that motor vehicle exports from
the EU to Korea came to 29,404 in 2006, while Korean exports to the EU reached 734,710 units. It
should be noted that exports dropped substantially in 2008 (down to 446.500 units according to
Eurostat data) and this coincided with the increase of the production of Korean-branded cars in
Europe and other third countries. This trade imbalance can, in large part, be explained by the trading
patterns in the road- and passenger vehicle categories. CEPS (2007) also finds that the trade balances
in the subgroups for motor vehicles’ bodies, parts and accessories (HS 8707 and HS 8708
respectively) do not show a clear trend and are therefore unlikely to be the underlying source of the
trade imbalances in the road- and passenger vehicle sector. This suggests that complete passenger
cars rather than vehicle parts and accessories are the main driver of the EU-Korea trade deficit in the
motor vehicles sector. Figure 4.1 reports the evolution of import and export volumes from 2000 to
2008 for EU – Korea trade in the motor vehicles sector. The EU’s deficit with Korea grows up 2007,
and although still large in 2008 falls with the opening up of production capacity of Korean
manufacturers within the EU (which presumably displaces some imports from Korea) – see also
Automative World (2009). There is also some albeit limited growth of EU exports to Korea of road
vehicles.
Korea EU
-0.05 0.13
0.00 -0.03
0.20 0.08
of which
0.16 0.06
0.25 0.09
-0.09 -0.02Miscellaneous manufactured articles (SITC 8)
Chemicals (SITC 5)
Manufactured goods classified by materials (SITC 6)
Machinery and transport equipment (SITC 7)
Sectors
Road vehicles (SITC 78)
Vehicles for passenger transport (SITC 781)

78
Figure 4.1: EU-Korean trade balance 2000-2008: machinery and transport equipment sector
Source: WITS-UN Comtrade
Analyzing the structure of Korean global car exports it is interesting to notice that more than 50% of
its exports are mini, small and medium sized cars (CEPS, 2007). This indicates a high degree of
specialization and competitiveness of Korean cars in the latter mentioned segment.
However, the EU mainly imports cars with larger engine displacements. In 2008 over 70% of Korean
car exports to the EU had an engine size between 1,500-3,000 ccm, and were, hence, part of the
medium to large size car segment of the European car market (see table 4.3). Korea’s economy-size
(<1,000ccm) and small (1,000-1,500 ccm) car exports to the EU account for a relative small share of
its global car exports. An FTA with the EU might therefore create the possibility to expand Korea’s
market share in its traditionally strong segment of small to medium sized cars.52 By contrast,
European passenger car exports to Korea are more concentrated on vehicles with engine sizes above
1500 (see table 4.4).
52
It is also interesting to notice that Korean diesel engine car exports to the EU have risen considerably.
0
5
10
15
20
25
30
35
40
45
50
2000 2001 2002 2003 2004 2005 2006 2007 2008
Tra
de
vo
lum
e in
bil
lion
s $
Machinery and Transport Equipment (SITC 7) Imports Road Vehicles (SITC 78) Imports
Passenger car (SITC 781) Imports Machinery and Transport Equipment (SITC 7) Exports
Road Vehicles (SITC 78) Exports Passenger car (SITC 781) Exports
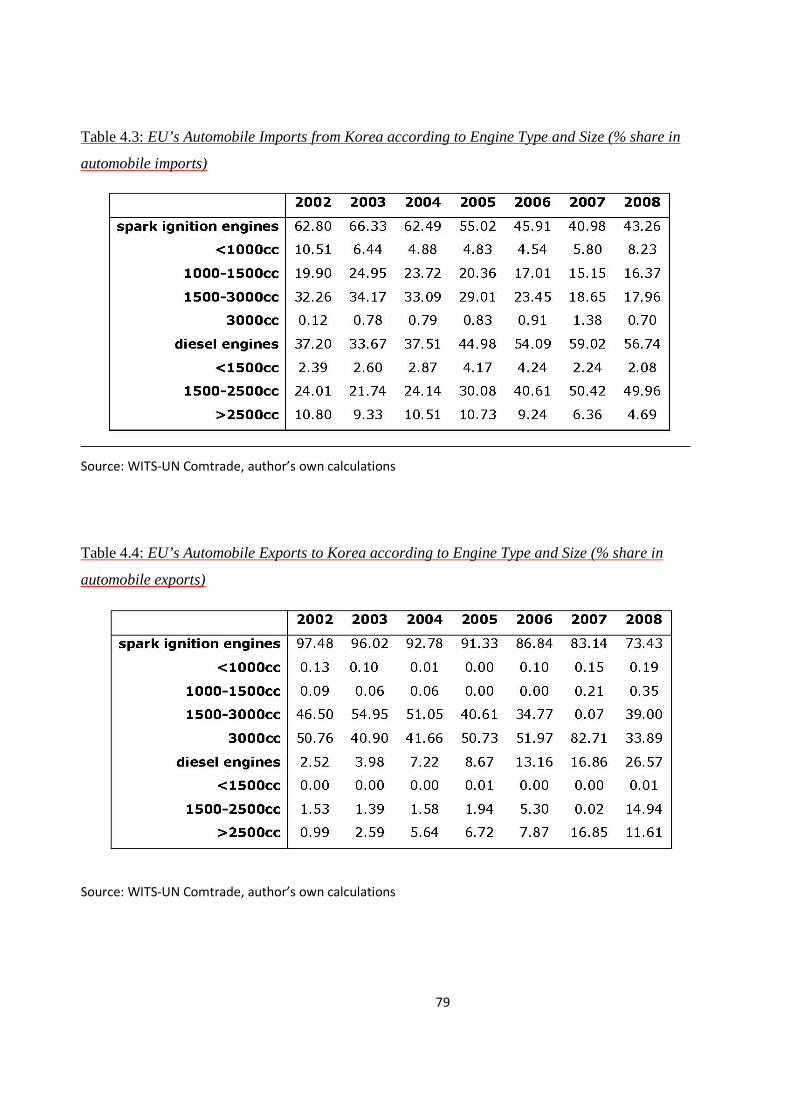
79
Table 4.3: EU’s Automobile Imports from Korea according to Engine Type and Size (% share in
automobile imports)
Source: WITS-UN Comtrade, author’s own calculations
Table 4.4: EU’s Automobile Exports to Korea according to Engine Type and Size (% share in
automobile exports)
Source: WITS-UN Comtrade, author’s own calculations

80
The high concentration on passenger vehicle exports revealed by the comparative advantage analysis
above and Korea’s export specialization on small and medium sized cars, as well as Europe’s low
import penetration rate in the same market segment in particular and in the whole automotive sector
in general, indicates the important difficulties European car manufacturers are confronted with when
exporting to Korea.53 The relatively high restrictiveness of imports in the Korean market is also
underlined by a report of the U.S. International Trade Commission (USITC). USITC (2007) finds
that the Korean market for passenger vehicles is mainly dominated by domestic manufacturers and
that during the period 2002-06 Korean producers captured around 95% of the market for passenger
vehicles, while foreign producers accounted for only 4.2% of the same market in 2006.
Section 2: Non-Tariff Barriers in the Korean Car Market – Qualitative Overview
Given the general low import penetration rate (identified in the previous section), it is evident that
the Korean automotive market is not only protected by import duties (currently 8% for passenger and
10% for commercial vehicles) but also by less overt and technical non-tariff barriers. Against this
background, there are four broad areas of non-tariff market restrictions that limit the scope of vehicle
imports to Korea: Safety and environmental standards, Korea’s vehicle taxation system, social or
market based issues and other potential non-tariff barrier.
Safety and environmental standards
The influence of safety and environmental standards and the associated necessary product
modifications for exporting car manufacturers are likely to be among the most costly technical
barriers. With respect to Korean standards, official U.S. and industry sources describe them to be
“unique to any other standards in the world, […], often non-transparent and out of sync with
international standards”.54 Even though these standards apply to foreign produced as well as to
locally produced vehicles, Korean automotive manufacturers are able to amortize those costs much
better due to a larger sales base on the domestic car market. Moreover, some sources also report that
the Korean safety and environmental standards are often subject to revisions (often when new
53
According to KAMA (2006) the EU has the largest market share among foreign car manufacturers in the Korea
automotive market. German cars are reported to have the highest degree of market penetration (41%), Japanese cars
account for 29% and the U.S., Sweden and France respectively for 16, 6 and 3% (KAMA 2006). 54
USTR – United States Trade Representative (2007b); Biegun, testimony before the USITC, June 20, 2007, p. 240.

81
models are introduced) and might therefore to some degree reflect a certain planning-uncertainty.55
Certification procedures that are often long and costly as well as regulatory developments that do not
allow for an adequate input from the industry are also important.56 As a result, safety and
environmental standards might cause significant quantitative restrictions on imported cars and are
likely to be the underlying reason for significant price increases. The most important standards in the
Korean automotive market are the following:
(i) On-Board Diagnostic (OBO) System: The Republic of Korea has, since 2005, gradually
introduced the US standards on OBO systems (US OBO II). The EU OBO standards are however not
accepted (CEPS, 2007). European car manufacturers’ associations consider this as discrimination
against European car-makers. According to the latter Korean car-makers face much lower costs for
changing the engines to EU OBO standards than European car producers when complying with US
OBO II standards since Korean producers can better amortize the compliance cost through a larger
sales base.
(ii) Average Fuel Efficiency: The AFE regulations applied since January 2006 to local manufacturers
set mileage limits at 8.1 litre/100km for vehicles with engine displacements below 1,500 ccm and at
10.4 litre/100km for vehicles above 1,500 ccm. Imported cars were exempted from this provision
until 1 January 2010 (CEPS, 2007). Moreover, the AFE regulation also specifies that producers
which perform better than the 8.1 litre/ 100km limit for vehicles below 1,500 ccm obtain a credit to
compensate for any exceeding of the corresponding limit for vehicles with engine displacements
above 1,500 ccm. European car-maker associations (ACEA and EUCCK57) consider these provisions
as discriminating since there are almost no cars exported to Korea with engine displacements below
1,500 ccm. As a result, there is no potential compensation if the limit of 10.4 litre/100km for larger
vehicles cannot be reached (CEPS, 2007).
(iii) Korea Ultra-Low Emission Vehicle (KULEV) Regulations: The KULEV provisions are
compulsory reductions of CO2 emissions similar to the EURO 4 standards. The regulations were
introduced for light duty diesel vehicles and for gasoline fuelled vehicles in 2006 and 2009
55
USITC’s report on KORUS, 2007. 56
Collins S., Automotive Trade Policy Council, 2006; ACEA, 2006. 57
ACEA = European Automotive Manufacturers’ Association; EUCCK = European Union Chamber of Commerce in Korea

82
respectively (WTO-TP review, 2008).58 European car manufactures judge these CO2 regulations as
stricter than EURO 4 standards, resulting in the imposition of additional costs on car-imports due to
product modifications (CEPS, 2007). With respect to the Korea-US trade agreement Korea has
assured that the applied CO2 emission standards will not be more stringent than those applied in
California. In addition, the US was granted a low-volume seller exemption (< 4,500 vehicles) and
Korean authorities accepted to use the Californian Fleet Average System methodology to determine
whether US cars meet the CO2 standards (USITC, 2007).59
(iv) Special Act on Capital Region Air Quality Improvement: The Korean government implemented
the provision that importers that have sold on average more than 3,000 vehicles in the urban area of
Seoul, Incheon and Gyeonggi over the past three years have to market a certain number of ‘low
emission vehicles (LEV)’ (CEPS, 2007).
(v) Self-certification: In 2003 Korea established a so-called self certification system for motor
vehicle safety standards. To address differences in the execution of certain tests (European vs. U.S.
standards) Korea has released a list of “Equivalent Standards for Manufacturer’s test report” (CEPS,
2007, p. 142). If the respective safety standards were part of this list, car manufactures were eligible
to test either according to US-FMVSS or EU/ECE testing requirements in order to show compliance
to Korean safety requirements. The European motor vehicle industry has substantial experience with
this system.60 However, according to respondents of a CEPS questionnaire among European car
manufacturers in 2007, the Korean government tried to withdraw this Equivalent Standards list.
Complying with different kinds of testing procedures could increase the costs for foreign car
suppliers considerably without any tangible effects on vehicle safety. In addition, the USITC
reported in 2007 that car producers selling less or equal than 6,500 vehicles per year were considered
to be in compliance if U.S. federal motor vehicle safety standards were met.61
Korean Vehicle Taxation System
58
For gas fuelled vehicles a phase-in period from 2006 to 2009 was implemented (WTO-TP review, 2008);
source:http://docsonline.wto.org/GEN_highLightParent.asp?qu=%28+%40meta%5FTitle+Korea+and+not+Democratic+
Republic%29+and+%28+%28+%40meta%5FSymbol+WT%FCTPR%FCS%FC%2A+%29%29&doc=D%3A%2FDDFDOCUMEN
TS%2FT%2FWT%2FTPR%2FS204R1%2D00%2EDOC%2EHTM&curdoc=3&popTitle=WT%2FTPR%2FS%2F204%2FRev%2E1 59
USTR, “Final - United States - Korea FTA Texts,” 2007. 60
CEPS, 2007 61
USITC, 2007

83
Apart from the currently applied import duty of 8%, seven other different taxes are applied on
domestic and imported vehicles (CEPS, 2007).62 The tariff and tax structure is considered to be
especially burdensome since those measures are applied in a cascading manner.63 In addition, the tax
base of imported vehicles is the c.i.f. price (inclusive insurance and freight costs price) which is
logically higher than the price for domestically produced cars. European and American car industry
associations judge this ‘tax on tax’ system and the higher tax base for imported vehicles as unfair and
competition distorting.64
Moreover, the Korean tax system for automobiles has historically been based on engine
displacements, allocating higher taxes to vehicles with larger engines.65 An important threshold of
engine displacements with respect to vehicle taxation is 2,000 ccm. It is interesting to notice that
most of the foreign producers (77%) sell cars on the market segment of vehicles with engine
displacements above 2,000 ccm, compared to only 24% of all domestic Korean producers that sell in
the same market segment.66 Table 4.5 below illustrates (alongside an overall dominance of Korean
car manufactures in the Korean automotive market) that the market segment in which imported cars
are represented the most compared to domestic cars is the segment of vehicles with engine
displacements above 2,000ccm. The Korean taxation system, therefore, represents a significant
disadvantage for larger cars and hence mostly foreign produced cars, leading to a cumulative
prohibitive tax on imported vehicles of 67% compared to a corresponding burden for home-produced
vehicles of 55% (CEPS, 2007). The result is a difference in the effective rate of protection of 12%
between locally produced and imported vehicles (WTO-TP review, 2008).
62
“The rates of the special excise tax (5%, 10%) and the local automobile taxes depend on engine capacity with the
highest rate applied to cars with engines exceeding 2,000 cc; reportedly, the effect of the customs tariff, compounded
by the effect of multiple automotive taxes, raises the effective rate of protection to around 12%.” (WTO trade policy
review – Korea, 2008) 63
The USITC report (2007) specifies that, import duties aside, purchase taxes including a special consumption tax
(pertaining to engine size), an educational tax (which is a percentage of the special excise tax), value-added tax (VAT),
registration tax, a acquisition tax, and a subway bond (also based on engine displacement) play an important role in
determining the final vehicle price. Furthermore ownership taxes comprise an annual motor vehicle tax that is
staggered according to engine displacements and an annual educational tax for which the annual motor vehicle tax is
the basis. 64
CEPS (2007) and Collins S. (2006) 65
WTO-TP review, 2008 66
USITC staff calculations for the Korean automotive market in 2005, in USITC, 2007, p. 376

84
Table 4.5: (a) Korean passenger vehicle market by engine size, 2005
(b) Korean passenger vehicle market by engine size, 2005
Source: USITC, 2007, p.3-76
Source: CEPS, 2007 p. 30
Engine category
No. of vehiclesMarket share of domestic
producersNo. of vehicles
Market share of foreign
producers
1,000 ccm and under 45,678 100% 0 0%
1,001 ccm –1,600 ccm 155,303 99.60% 618 0.40%
1,601 cc–2,000 ccm 493,317 98.70% 6,489 1.30%
Total below 2,000ccm 694,298 99% 7,107 1%
Over 2,000 ccm 219,252 90.20% 23,794 9.80%
Total 913,550 30,901
Korean passenger vehicle market by engine size, 2005
Domestic Import
Source: Author's own calculations based on values obtained from the USITC report on KORUS, 2007
(c)

85
Social or market related issues
Korea completely banned motor vehicle imports until 1987. Until 1994 a very high tariff on
passenger cars was applied which was successively lowered to 10% and in 1995 to 8%.67 In 1998 the
U.S. and Korea reached a memorandum of understanding (MOU) containing commitments to
improve the perception of foreign-produced cars and to address anti-import activities against foreign
automobiles. Since then the Korean government has stopped actively promoting anti-import
perception policies and tax investigations in order to discourage the purchase of foreign brands.68
According to CEPS (2007) and other industry observers it is, however, still possible to detect certain
anti-import sentiments in the local population. These anti-import sentiments may continue therefore
to play a role in explaining the low import penetration rate in the Korean automotive sector.69
Other potential non-tariff barriers
(i) Currency manipulation: U.S. car industry reports advance the view that Korea manipulates its
currency in order to promote its exports in weakening the won relative to the dollar (Collins S.-U.S.
car industry, 2006).
(ii) Motorcycles: Motorcycles might represent a special case. The U.S.Trade Representative (2007)
reported that special Korean provisions for motorcycles like their ban from high- and expressways,
despite their designation for safe highway use, could be factors that restrict import demand in this
area (USTR, 2007b).
In light of the NTBs enumerated above and the low import penetration rate in general and for small
to medium engine sized vehicles in particular, it is evident that non-tariff barriers are likely to play
an important role in the Korean automotive market. Given these findings it is questionable whether
the simple elimination of the current import duty on imported automobiles would necessarily allow
67
European as well as the American automotive industry, however, have the opinion that Korea contiuned to thwart
imports by non-tariff measures since then (Collins S., Automotive Trade Policy Council, 2006; ACEA, 2006). 68
U.S. indusry sources, however, consider this MOU as failed since the Korean government did not succeed in
“substantially increase market access for foreign passenger vehicles” (Collins S., Automotive Trade Policy Council,
2006). 69
USCIB, “USCIB Comments,” p. 4; Levin, “Statement of Senator Carl Levin”; Levin, testimony before the USITC, June
20, 2007, pp. 160-61; ATPC, “Statement of Stephen J. Collins”; Schott, “Autos and the KORUS FTA,” 2006; Schott,
Bradford, and Moll, “Negotiating the Korea-United States Free Trade Agreement,” p. 9.

86
for a substantial increase in foreign import competition in the Korean automotive market, given
significant protection of domestic producers by a variety of technical trade barriers.
Section 3: Qualitative Assessment of NTBs in the Korean Automotive Market
In order to provide a contextual reference point for the current empirical study, we provide some
contextual information about the extent of NTBs in the automobile sector identified by other studies
in general and for the Korean car market in particular.
The Word Bank Database provides estimates for example of the ad valorem tariff equivalent (AVE)
of NTBs at the detailed product level for various years between 2000 and 2004 for a fairly broad
coverage of countries. Although Korea is not included in this database, the global average and
distribution gives a useful reference point against which to place Korea which is viewed (see below)
to be relatively highly protected by NTBs. The global average AVE in the automobile sector is 24%,
with a range of 2.8% to 86%, according to the product category involved. The highest average AVE
identified for an individual country in the data base is 79.8% (Tanzania).
Review of Evidence on NTBs against Korean Automobile Imports
Korea’s automotive sector was in the past characterized by a strong industrial policy actively
supporting Korea’s key industries. Yasheng Huang (1997) assessed in this context the Korean
automotive industry and compared it with its Chinese counterpart. The author underlines the success
of the Korean automotive industrial policy (AIP) which he puts down to two crucial components,
namely to the promotion of a social optimal level of firms’ investment and the restriction of entry in
the automotive market. Since the early 1970s, the Korean authorities actively used entry and exit
policies to coordinate its automotive sector. In 1974, the Korean government stipulated, in this
sense, three primary car manufacturers in its automotive sector – Hyunday, Kia and GM-Korea (later
Saehan, then overtaken by Daewoo). With the aim to further enhance scale economies in its car
industry, Korea also promoted increasing exports of its domestic car producer and, by competing in
more mature and developed markets, making them more efficient and competitive. (Yasheng Huang,
1997 and Doner, Noble, Ravenhill, 2006).

87
An overview of Korean Commercial Policies between 1953 and 1989 can be found in Kim
Dong June (1994). Analyzing past Korean trade policy stances might give an idea of the
underlying reasons of a still present anti-import perception in the Korean population which is
reported by many industry observers of the Korean automotive sector. Kim Dong June (1994)
also finds econometric evidence (by estimating a so-called incidence parameter) for the
contention that, during the mid-80s and early 90s, Korea finally adopted a policy package that
consisted of two major elements: subsidies for the export sector and protection for key import
industries. Beside import duties, technical trade barriers and other non-tariff measures
seemed to have played an important part in Korea’s protection for the automotive sector - one
of its key industries (CEPS, 2007; USITC, 2007; Copenhagen study, 2007 Stephenson,1997;
Green, 1992).
With the objective of measuring and comparing Korean NTBs, the Korean Institute of
International Economic Policy (KIEP) conducted, in collaboration with its Chinese and
Japanese counterparts, an interview survey among 133 Chinese, 236 Japanese, and 311
Korean firms in 2001 (KIEP, 2001 cited in Kim, Yang-Hee, 2003). Dividing the NTBs in 15
different categories the survey findings showed that China was perceived to have the highest
barriers in general. However, for the categories of technical barriers to trade - TBTs
(standards, etc.), and cultural differences, Korea was perceived to have the highest barriers of
all (Kim, Yang-Hee, 2003).
Focusing again on Korea as a whole, Fukao et al. (2003), emphasize that restrictive market
access policies are still widely used and that, in light of a potential Korea-Japan FTA, non-
tariff barriers play an important role (see also JETRO, 2000; KIEP, 2000; Kim et. al., 2003).
Kim (1996) calculated, the difference between import prices and domestic prices for several
commodities in Korea. By subtracting the respective tariff rates he obtained an estimation
result of the size of Korea’s NTBs, in general, for the year 1994. Kim (1996) estimated the
Korean trade barrier at 36% for all tradable goods (whereby tariffs accounted for 7.6%).70
Adopting a more sectoral perspective, Francois and his team (Copenhagen study, 2007)
focused on NTBs in the Korean services sector. In light of the looming EU-Korea FTA
Francois et al. (2007) used an industry-specific-gravity model to estimate regulatory trade
70
Regarding agricultural goods the barrier was 160% with tariffs accounting for 17% (Kim,1996).

88
barriers in the Korean services sector. The principal aim was to estimate their impact on trade
and welfare variables. The findings suggested important welfare gains due to the elimination
of non-tariff barriers in the respective market. However, Francois and his team (Copenhagen
study, 2007) did not simulate the effect of non-tariff barriers in the automotive sector.
Nevertheless they underlined that, in the Korean automobile sector, non-tariff barriers might
be far more important than tariffs.
Regarding the South Korean automotive industry Green observed in 1992 that 99.9 % of the
cars on Korean roads were Korean made (Green, 1992). He also posits that, despite the import
liberalisation policy adopted in 1988 import restrictions still allowed many car manufactures
to subsidize their exports through higher domestic prices. Green (1992) also emphasized
Korea’s strict control of foreign equity investment during the 80s which lead to an almost
complete local control and ownership structure of the Korean automotive sector (Green,
1992).
IBM Belgium et al. (2008) found in their sustainability study that “the market share of
imported cars in Korea exceeded 5% in 2007 for the first time.” (IBM, 2008, p.123), and that
imported vehicles tend to be concentrated in market segments of cars with 2,000 ccm or
higher (75% of all imports). The DG Trade commissioned IBM study further concludes that
in order to partly offset import competition and to boost exports common international
standards regarding safety and environment, and common conformity assessments are key
factors for the European automobile industry.
In the context of acceptance of foreign standards in Korea, the Australian Trade Commission
(2009) informed its car suppliers in a statement regarding the Korean automotive market that
Australian suppliers could expect to be subjected to intensive compliance testing which might
take up to two or three years (see also Stephenson, 1997).
The Centre for European Policy Studies (CEPS, 2007)71 conducted an industry survey in
order to detect potential non-tariff barriers in the Korean automotive market. The responses
71 CEPS (2007) also conducted and econometric analysis of regulatory protection in EU-Korean trade in several
sectors by using a gravity model approach.71 Once country size and distance were taken into account, the so-
89
indicated that regulations regarding standards and certifications, car taxation schemes and a
general perceived anti-import sentiment in the population are the main import obstacles.
CEPS (2007), therefore, concluded that unless these non tariff obstacles were not properly
addressed in the looming EU-Korea FTA it would be difficult to speak of a level-playing field
for the European automotive industry (see also EUCCK, 2006).
Real quantitative studies about NTBs in the Korean automotive market are rare. The U.S.
International Trade Commission (USITC, 2007), however, tried to quantify these barriers via
the comparison of prices and import quantities. The USITC (2007) detected that the Korean
import quantity of passenger vehicles with engine displacements of 1,500-3,000 cc, is
considerably lower than imports of the same product into other economies. Calculations show
that between 2002-05 Korean imports of (1,500– 3,000 cc engines) passenger cars amounted
to 0.02 vehicles per million $ GDP whereas the median of 56 similar countries was 0.45
vehicles per million $ GDP. According to this measurement Korea ranked 55th out of 56
comparable countries only beaten by India.
Furthermore, the import unit value for small passenger cars was detemined to be substantally
higher than the import unit value for most other countries. Between 2004-06 the Korean
import average price of cars with engines between 1,500-3,000ccm from the world was
$27,160 per vehicle. This represents an import price that was 96.9 percent higher than the
average world import price of the same product (= $13,794). The average US import price in
the same category of passenger cars to South Korea amounted to $19,754 (20 percent higher
than the average world export price from the US to the world of $16,842). USITC came
therefore to the conclusion that the existing ad valorem tariff of 8 per cent seems to be too low
to be the single source of the above mentioned differences. Possible explanations for the
above findings are on the one hand non-tariff barriers or factors such as consumer
preferences, product differenciation or market structure (USITC, 2007).
In preparation for its own FTA with Korea, the European Commission (2010a) have also
simulated the FTA effects on the automotive sector in more detail (GSIM simulations) by
called “border effect” or “home bias” dummy shows that the costs on EU export to Korea are relatively small compared to other countries.

90
taking NTBs into account. The main goal of this analysis was to determine the impact of non-
tariff barriers on trade flows and welfare. The first ’base scenario’ simulation (no NTBs)
showed (for all HS 8703 tariff lines) a 23% export increase of EU cars to Korea (and a
corresponding export decrease of 14% from RoW). Accounting, in a second scenario, for
NTBs in the form of advalorem tariff equivalents the estimated increase in Korean car imports
from EU amounts to 62% (reduction of RoW car imports of 37%).
The calculation of the NTB impact, used to run the above described simulations, is based on
value-estimates of the NTBs in the Korean motor vehicles sector. A total value of €200
million is reported for the effects of on-board diagnostic (OBO) systems and one of between
€200 million and €500 million for emission standards. As a result, the overall total costs of
the Korean NTB provisions are assumed to lie in the range between €400 million and €900
million. These additional charges seem to be quite high, given that the size of the Korean
automotive market is slightly above €1billion (measured in total value of motor car sales).
The study therefore takes an overall NTB value of €400 million (the lower bound) in order
not to overestimate the NTB effect. Using an import demand elasticity of -2.20 for the Korean
automobile market and by substracting the NTB value (€400m) from the initial total import
value (of HS 8703) the Korean NTB provisions resulted in an equivalent additional advalorem
tariff of 16%. Considering the official tariff rate of 8%, total protection of motor vehicle
sector was, hence, estimated to be equal to a 24 % tariff rate.
USITC (2007) compare the quantity of imports of passenger vehicles in the 1500 to 3000 cc
range relative to GDP for a large number of countries. They show Korea to be a very
restricted market. On this criteria Korea had the least penetrated market by imports out of 56
countries; India being ranked 56th. According to the World Bank data base, discussed above,
India has an average (unweighted) AVE across all automobile sector products of 37%. This
provides a reference point for the estimated AVE in the present study.

91
Section 4: Nature and Implications of EU-Korea FTA for Automotive Sector
The FTA has substantive provisions to address NTBs in the automotive sector, which are
perceived by the EU industry as major obstacles to exporting to Korea. These provisions seek
to address the regulatory and technical obstacles to access to the Korean markets facing the
EU care industry. Specifically:
• UN-ECE safety standards will be considered as equivalent to Korean domestic standards.
• Further, Korea will align an additional 29 standards or regulations with UN-ECE regulations
during a transitional period (5 years).
• For any standards not accepted as equivalent or harmonized, Korea has committed to apply
them in a manner that avoids market access difficulties.
• Korea will recognize the future norm (EWO-6) for EU on-board diagnostic devices ((OBDs)
as equivalent to Korean standards. (Those cars fitted with the current EU norm-Euro5- will
be able to access the Korean market under a transitional quota arrangement).
• EU car exporters will be given flexibility to comply with Korean emission standards, Korea
having agreed not to apply the KULEV (Ultra Lowe Emissions Vehicle) standard to vehicles
produced by a manufacturer 4500 or fewer units in Korea. (To those selling 4501 to 10,000
units a special ULEV rate can be applied, and above 10,000 units a fleet average methodology
will apply).
• A number of mechanisms have been put in place to avoid new barriers being created in future.
This last feature of the FTA does as a result raise issues about the construction of the anti-
monde for the simulation of the effects of FTA. The later empirical analysis in section (7) of
the sector wide average AVE applying under against (pre-FTA conditions) EU car exports
reports estimates in the range of 27% to 59% (depending on the price import elasticity of
demand). Defining the FTA effect as the elimination of this AVE (plus the tariff
liberalization effect) would imply that:
• The Agreement on NTBs will fully remove the NTBs against EU automobile exports to
Korea.
• In the absence of the Agreement there would not be any increase in the extent of non-tariff
barrier against EU exports.

92
The first of the implications above draws attention to the depth of the liberalization implied by
the Agreement and to the need for effective implementation of the agreement. Given the
possibility of both incomplete NTB liberalisation and FTA implementation, then it may well
be appropriate to tend to the lower end of the range of the AVE estimates in simulating the
FTA effect. On the other hand if the incidence and significance of NTBs may have been
greater without an FTA than in the actual pre-FTA condition, then it may be appropriate to
see the FTA effect as being understated by the present analysis. In which case, it may be
more appropriate to prefer the upper estimate of the AVE of the NTBs for the purposes of
simulating the trade and other effects of the FTA.
Section 5: Alternative Empirical Methods for Quantifying Tariff-Equivalence of NTBs
Price comparison
This method estimates the degree to which NTBs raise domestic prices above international
prices in the countries imposing the NTB. The “price gap” between domestic prices and
international prices is estimated by comparing the price of a good affected by an NTB with
one unaffected by it. This is a natural and direct method. However, price data is not always
readily available for all products and certainly not necessarily for an identical product if
product differentiation and quality differences are present. It may also be difficult to identify
a ‘free trade’ reference market. One cannot be confident that the identified price difference
fully reflects the effects of an NTB. Adjustments need to be made for currency differences,
transport costs and wholesale and retail margins. The method is costly as a consequence and
the results may lack precision and full sectoral coverage.
Price-based econometric methods
These methods seek to extend the price-gap method to many countries and products in a
comprehensive manner. They seek to take advantage of systematic differences in prices across
countries of relatively aggregated product groups. They offer the possibility of comparing the
effects of NTBs more broadly, again expressed as ad valorem tariff equivalents and used in
simulation models. However, price data is not always readily available for all products and
aggregation means that considerable product- and policy-specific detail is lost.

93
Quantity-based econometric methods
These methods seek to infer price effects of NTBs from their estimated impact on the volume
of trade having controlled for national endowment and gravity (distance etc) effects on trade
volumes. Trade data on quantities (and with fine disaggregation) are much more available and
more internationally standardized than price data, so that there is greater scope for
comprehensive coverage and cross country comparability. Evidence from quantity-based
methods can only be expressed as tariff equivalents or price gaps by use of additional
assumptions or information about for instance the elasticity of import demand with respect to
prices. The quality of this additional information and of the econometrically-determined
quantity effects fashion the robustness and reliability of the obtained tariff-equivalent
estimates.
For the present study it was judged that time and resource constraints, plus the added benefits
of comprehensiveness across the automobile sector (allowing the generation of sector-level
estimates which could be fed into the wider CGE modelling) gave a clear advantage to the use
of a quantity-based econometric methodology.
Section 6: Empirical Methodology of Present Study
The quantity-based econometric methodology used here is in line with that used in the wider
study and described in chapter 2 (section 2). Here we apply the Kee et al. (2009)
methodology in a bilateral trade rather than multilateral trade context. In the first stage we
estimate the effect of the impacts of NTBs in Korea on particular product groups in the
automobile sector (at the HS digit 6 level of product disaggregation) on, alternatively, Korea’s
automobile imports from different country sources and then as a check on the EU’s car
exports to Korea (in contrast to other country destinations). These estimated quantity effects,
allowing for other influences on trade volumes besides NTBs, are then transformed into price
effects using price import demand elasticities. To evaluate the sensitivity of the estimated ad-
valorem (tariff) equivalents (AVEs) of NTBs we consider alternative import demand
elasticities; one (a value of approximately unity) adopted from import demand elasticities
calculated by Kee et al. (2008) and another (a value of 2.2) indicated by recent EU internal

94
work (EU, 2010a) on the Korean automobile sector. A given estimated quantity effect of an
NTB will be transformed into a larger (smaller) AVE in the case of the absolutely smaller
(higher) elasticity value; a larger (smaller) price increase being required to bring about the
given reduction in import quantity, the lesser (greater) the responsiveness of import demand
to price increases. For the present purpose, we view the estimate based on the lower import
elasticity value as providing an upper bound and the higher elasticity value as providing a
lower bound on the AVE estimate.
The identification of the NTB effect on bilateral trade volumes was based by necessity on an
incidence or dummy variable approach. There was no data available from existing data sets
or studies on the share of Korea’s imports in particular automobile product categories subject
to some form of NTB. This would have allowed for variation across products and in turn
allowed for econometric identification of the quantity effects. In the case of an incidence or
dummy (D) variable methodology (D=0 for non-incidence and D=1 for incidence) it was
necessary for econometric identification purposes to make a judgment as to the product
groups where the incidence of NTBs was clearly greater and more likely to be binding or
constraining of imports. From the analysis earlier in section 2 of this chapter, it was evident
that there is greater restriction of imports in the small and medium car sector. This provided a
rationale for setting D=1 for those HS categories covering small and medium cars, and D=0
for the other categories. (Details of the coverage of product categories and the setting of the
incidence of NTBs are provided in Appendix A1 at the end of this chapter).
Table 4.6 presents the import weight of each 6-digit HS 2007 commodity in the Korean
automobile sector. Details of whether a commodity is deemed to face non-tariff barriers are
also provided through the binary NTB dummy variable. A value of zero indicates that a
binding NTB is assumed to be not present. A value of one implies that a binding non-tariff
barrier is restricting imports of that commodity.

95
Table 4.6: Commodity Import Weight
HS 2007 Commodity Import Weight NTB Dummy
870310 .054683 0870321 .0748429 1870322 .1335103 1870323 .2896473 1870324 .1705175 0870331 .0283614 1870332 .1222309 1870333 .0933485 0870390 .0328581 0
Total 8703 1
Figure 4.2 illustrates, for the data set used for the estimation, Korea’s most important trading
partners in the automobile sector in terms of the volume of imports. Overall the EU is the
largest import source, followed by Japan and the USA. As shown in the figure, nine European
Union countries are represented in the top twenty.
Figure 1: Most Important Trading Partners
0
50
100
150
200
250
300
Japa
n
German
y
United
Sta
tes
Franc
eChin
a
United
King
dom
Italy
Canad
a
Austria
Mexico
Slovak
ia
Sweden
Russia
Austra
liaInd
ia
Viet N
am
Belgium
Thaila
nd
Turke
y
Spain
Country
Ave
rag
e Im
po
rts
(Mill
ion
s o
f US
$)
Figure 4.2: Korean Import Sources for Automobile Sector (sample data)

96
We estimate a bilateral trade model (as in Kee et al., 2009) for a single country.
( ) ∑ +++=+−c
cijcjcijcijcijcji CNTBteM εββα 211lnln (1)
where Mcij are imports from country c to j in industry i, tcij is the tariff rate levied on imports
in that sector, NTBs is the requisite non-tariff barrier dummy, Ccj is a vector of relative
endowment variables, ecij is the price elasticity of import demand (for which alternative values
are adopted, unity or 2.2).
If the NTBs in the product sector where D=1 are binding on import volumes, then the
econometric model of import volumes (having controlled for the tariff and other effects on
trade) should estimate the NTB to have reduced the volume of imports and then the price
effect will be positive (AVE >0). By contrast for product categories where no NTB incidence
is modeled (D=0), there can be no price effect (AVE=0). We can report therefore an average
AVE for all those product categories where NTBs are set to be present, and a (trade) weighted
average AVE for the automobile sector as a whole (the share of automobile imports in total
Korean automobile imports defined to be subject to NTBs).
The data definitions, sources and sample of countries are described in Appendix A1. The
estimated trade functions are also set out in Appendix A2; tables A2.2A and A2.2B report the
model for Korean bilateral automobile imports and tables A2.3A and A.2.3B the model for
EU bilateral automobile exports. (There are two models estimated in each case, i.e. for
Korean bilateral imports and EU bilateral exports, because we are using a constrained
estimation methodology with the dependent variable being imports post the tariff effect - see
eq.1. The dependent variable is different therefore for alternative elasticity values.) The
former model is the natural focus of a model seeking to capture the effects of NTBs on
Korean imports, but assumes that imports in a particular product category are homogenous
from alternative sources. The latter model therefore allowed for concentration on EU
automobile export products to alternative importing countries, and controls therefore for
product heterogeneity effects. In both cases the dependent variable is constrained to
incorporate the tariff effect on imports, and on the right hand side we control for country
endowment effects on trade and for other trade costs proxied by distance between trading
partners. Recognising the potential for omitted influences, however, we also allow for fixed

97
time effects (with year dummies) and in some regressions for these time effects, plus product
specific effects (with commodity dummies) and trade pattern specific effects (with partner
dummies). Our preferred specification is that incorporating full fixed (time, product and
partner) effects, and this is the specification used as a result to derive the NTB quantity effect
which is used to calculate the price effect (AVE).
Section 7: Tariff Equivalent Estimates of Current NTBs in Korean Automobile Sector
The detailed estimated models are reported in the econometric results in Appendix A2. These
are generally in line with expectations in terms of the signs on control variables, albeit
without significance in some instances. In some instances the relative physical endowment
was co-linear with the partner dummy variable and was therefore dropped in the regression.
In general, however, Korean imports of automobile products (from alternative sources) and
EU exports (to alternative country destinations) are shown to be negatively related to distance
from the trading partner and to lower relative endowments. The sign on the NTB incidence
dummy is also consistently negative (in line with expectations) and significant; NTBs are
constraining the volume of Korean imports or of EU exports.
As explained in the previous section our preferred model in each case is that which includes
the full set of fixed or specific effects (time, commodity and trade partner). In the case of the
Korean import model the relative quantity effect is identified by the coefficient on the NTB
dummy in regression 2 in each of tables A2.2A and A2.2B (having tested for the uniformity
of this effect across different country sources of Korea’s imports of automobile products). By
contrast for the EU export model we can identify the Korea specific NTB restriction effect
from the summation of the signs of the coefficients on the NTB Dummy and the interaction
term (NTB Dummy x Korea Dummy) in regression 2 in each of tables A2.3A and A2.3B.

98
Table 4.7: Estimated Ad Valorem Tariff Equivalent (AVE) of NTBs in Korean Market
against EU Automobile Exports
Inferred from Estimated
Quantity Effect of NTB on:
Based on Alternative Adopted Price Elasticities (e)
Of Import Demand
e = 1 e = 2.2
Korean Imports
(i) Protected Products1
(ii) Weighted Average for
Sector2
91%
59%
41%
27%
EU Exports
(i) Protected Products1
(ii) Weighted Average for
Sector2
94%
49%
43%
22% 1Small and medium range vehicles at HS six digit level as identified in Appendix A1 2AVE for protected products weighted by the share of these products in overall automobile Korean imports or EU exports to Korea.
The transformation of the estimated quantity effects from the relevant regressions identified
above were transformed into price equivalents as explained in chapter 2 and using the
expressions (2.3) and (2.4). The resulting estimated AVEs are reported in Table 4.7, for each
of the models (Korean imports and EU exports) and for alternative import demand elasticity
values. For each model and elasticity value we report the AVE on NTB protected products
only and for the sector as a whole (weighting the NTB protected products by their share of
sector trade). For the NTB protected products only our methodology identifies the AVE to
range from 41% to 94% depending on the model and elasticity value adopted. By contrast the
corresponding sector-wide AVE is estimated to be in the range from 22% to 59%. These
estimates are credible in terms of the earlier (section 4) qualitative analysis of NTBs in
Korea’s automotive sector. As compared with Chapter 2, the AVEs provided here are a bit
lower as those calculated with the border-effect approach. Since the methodology proposed in
this chapter is specific to the automotive industry and includes a more detailed product
classification, these estimates have been used in Chapter 3 for the simulations.
99
Section 8: Summary Conclusions
This chapter has reviewed the nature and extent of the non-tariff barriers (NTBs) applied
against Korean car imports from the EU, and by implication the scope for lowering these
barriers through implementation of the EU-Korea FTA. All of the qualitative and quantitative
evidence reviewed points to the NTBs being substantive and having significant trade-
restricting effects. The low level of import penetration of the Korean market, the views of
producers’ associations, and the estimated height of the non-tariff barriers in a range of
studies and reports all support this assessment. The EU-Korea FTA is distinctive in seeking
to liberalise both tariff and NTBs, giving particular attention to those applying in the
automobile sector. Effective implementation of the Agreement offers therefore considerable
scope for stimulating automobile trade between the two trading partners, in particular
increasing EU car exports to Korea.
In order to provide a quantitative basis for simulating the trade potential associated with the
effective implementation of the FTA, this chapter reported also on the econometric estimation
of the advalorem (tariff) equivalent (AVE) on Korea’s NTBs against car imports from the EU.
Based on alternative models of the trade volume effects of NTB and alternative import
demand elasticities, the average AVE (having controlled for the tariff effect) for the
automobile sector is estimated to range from 22% to 59%, and to be considerably in excess of
the prevailing tariff barrier. This implies that trade potential from NTB liberalization is
substantially greater than that from tariff liberalization.

100
Overall Conclusion
This study provides new insights into the quantitative assessment of the effects of the EU-Korea FTA. The originality and contributions of this research are related to:
- The consideration of simulations which are very close to the official agreement, especially concerning tariff cuts in goods and reduction in protection for services.
- The consideration of NTBs, through original calculation of AVEs relying on non residual gravity approaches (gravity border of KNO method).
- The use of a new version of the MIRAGE CGE model, which includes key characteristics in imperfect competition (vertical product differentiation, the specific modeling of trade costs and their components, the inclusion of FDI as well as the consideration of dynamics).
The overall results show that the effects of the EU-Korea FTA on GDP are positive for both the EU (0.08%) and Korea (up to 0.84%). Welfare gains are also positive and significant, especially for Korea (up to 1.12%).
With regard to trade, both the EU and Korea show a positive effect on exports and imports. The EU bilateral trade with Korea increases very significantly (up to 82.6%), as a result of the initial high protection in Korea. Consequently, the EU bilateral trade balance with Korea is expected to improve by up to 10.1 billion euros. However, there is evidence of partial trade diversion for the EU, which replaces parts of its exports to the rest of the world by exports to Korea.
Sectoral results show that the EU may improve its position (especially with regard to its trade balance) in several industries (chemicals, machinery, other manufactured products and specific agricultural/food products) as well as in specific services to a lesser extent (business, insurance and transport services). On the other hand, Korea takes advantage of the agreement by improving its trade position for specific manufactured products (textile, leather/clothing, cars and other transport equipment). The analysis of the car industry provides interesting results with a sharp increase in both Korea and EU exports (intra-industry trade). The rise in intra-industry trade is also expected for some other industries (textiles, chemicals other transport equipment as well as other manufactured products). Effects on production and employment are small, especially for the EU. At sectoral level, employment effects for Korea are more significant, with a positive impact for textiles, leather/clothing as well as for cars. Conversely, negative effects are expected for specific manufactured products (machinery, electronic equipment and other manufactured products), specific services (business, transport and insurance) as well as dairy products and meat. However, overall employment effects are also very small in Korea.

101
The sensitivity analysis shows that NTBs play a crucial role in the effects of the EU-Korea FTA. The higher the initial NTBs, the higher the impact of the FTA, especially in terms of sectoral trade. Finally, the consideration of trade facilitation slightly increases the trade growth due to the implementation of the agreement.

102
References
American Chamber of Commerce in Korea (2006), “US-Korea Free Trade Agreement Position Paper”, US-Korea Business Council and AMCHAM in Korea. Anderson J. and E. van Wincoop (2003) “Gravity with Gravitas: A Solution to the Border Puzzle”, American Economic Review, 69(1):170-192
Anderson J. and E. van Wincoop (2004) “Trade Costs”, Journal of Economic Literature, 42(3): 691-751.
Andreosso-O’Callaghan, B. (2009) “Economic Structural Complementarity: How Viable is the Korea-EU FTA?” Journal of Economic Studies, 36(2): 147-167
Andriamananjara, S., et al. (2004), “The Effects of Non-Tariff Measures on Prices, Trade, and Welfare: CGE Implementation of Policy-Based Price Comparisons,” U.S. International Trade Commission Office of Economics Working Paper EC2004-04-A, Washington, DC: USITC ASEAN Secretariat (2005a) “Framework Agreement on Comprehensive Economic Cooperation among the Governments of the Member Countries of the Association of Southeast Asian Nations and the Republic of Korea”, December 2005, available on: http://www.aseansec.org/18063.htm
ASEAN Secretariat (2005b) “Agreement on Trade in Goods under the Framework Agreement of Comprehensive Economic Cooperation among the Governments of the Member Countries of ASEAN and the Republic of Korea”, available on: http://www.aseansec.org/akfta.htm.
ASEAN Secretariat (2007) “Agreement on Trade in Services under the Framework Agreement on Comprehensive Economic Cooperation among the Governments of the Member Countries of the Association of Southeast Asian Nations and the Republic of Korea”, Singapore, 21 November 2007, available on: http://www.aseansec.org/21111.pdf
ASEAN Secretariat (2009) “Agreement on Investment Under the Framework Agreement on Comprehensive Economic Cooperation among the Governments of the Member Countries of the Association of Southeast Asian Nations and the Republic of Korea, Jeju-Do, Republic of Korea, 2 June 2009”, available on: http://www.aseansec.org/22973.pdf
Australian Trade Commission, (2009), “Automotive to Korea“, online source: http://www.austrade.gov.au/Automotive-to-Korea/default.aspx, Last updated: 31 Aug 2009, accessed on 30 Jan 2010. Automotive World (2009), The World’s Car Manufacturers.
Baldwin, R. (1989) “The Growth Effcets of 1992”, Economic Policy, 9(2): 247-281.
Baldwin, R. and A. Venables (1995) “Regional Economic Integration”, in: G. Grossman and K. Rogoff, Handbook of International Economics, North Holland.
Baughman, L. And J. Francois (2009) “Failure to Implement the US-Korea Free Trade Agreement: The Cost for American Workers and Compagnies”, US-Korea Business Council,

103
http://www.uschamber.com/NR/rdonlyres/ejyp7lxtnmxyjbsbmymhens5oi35ay2wnr77sevx6tt4q3sfrsk7dijx6excatatit22erv6c6xo63drezuvonjskog/0911_fta_korea.pdf. Biegun, Stephen E. Vice President, International Government Affairs. Ford Motor Company. Testimony before the House Committee on Ways and Means, Subcommittee on Trade in connection with the United States-Korea Free Trade Agreement, March 20, 2007. Biegun, Stephen E. Vice President, International Government Affairs. Ford Motor Company. “Responses to Commissioners' Questions to Mr. Stephen Biegun.” Written submission to the USITC, June 27, 2007. Biegun, Stephen E. Vice President, International Government Affairs. Ford Motor Company. “United States International Trade Commission's Hearing, U.S.-Korea Free Trade Agreement: Potential Economy Wide and Sectoral Effects.” Testimony before the USITC, June 20, 2007. Hearing transcript. Blot, C. and M. Cochar (2008), “L'énigme des exportations revisitée: Que faut-il retenir des données de panel? ”, Revue de L’OFCE, 106 :67-100
CEPS (2007) “A Qualitative Analysis of a Potential Free Trade Area between the European Union and South Korea”, Centre for European Policy Studies and Korean Institute for International and Economic Policy, Report for the European Commission, DG Trade.
Clark, D. (2009) “Intraindustry Specialization and the Proposed Korea-United States Free Trade Agreement”, International Economic Journal, 23(2): 181-95.
Collins, Stephen J. Automotive Trade Policy Council. Testimony before the House Committee on Ways and Means, Subcommittee on Trade in connection with the United States-Korea Free Trade Agreement, March 20, 2007. Copenhagen Economics (2006), Economic Impact of a Potential Free Trade Agreement (FTA) between the European Union and South Korea, Copenhagen. Copenhagen Economics and Joe Francois, (2007), “A quantitative analysis of a potential Free Trade Agreement between the EU and South Korea”, study prepared for the European Commission, DG Trade, Brussels Deardorff, A. (2007) “Trade Policy Options for Korea outside the Doha Round”, University of Michigan, Research Seminar in International Economics, Discussion Paper no.58.
Deardorff, A.V. and R. M. Stern, (1997). Measurement of Non-Tariff Barriers. Economics Department Working Paper No. 179, Organisation for Economic Co-operation and Development, Paris.
Decreux, Y. and L. Fontagné (2009) “Economic Impact of Potential Outcome of the DDA”, Rapport d’Etude CEPII no.29-01.
Decreux, Y. and H. Valin (2007) “MIRAGE, Updated Version of the Model for Trade Policy Analysis: Focus on Agriculture and Dynamics”, CEPII Working Paper 2007/15.

104
Doner R.F., Noble G.W., Ravenhill J., 2006, “Industrial Competitiveness of the Auto Parts Industries in Four Large Asian Countries: The Role of Government Policy in a Challenging International Environment”, World Bank Policy Research Working Paper 4106 EUCCK – European Chamber of Commerce Korea (2006), Trade Issues Recommendations 2006 (retrieved from http://trade.eucck.org/site/2006/en). European Commission (2009a) “EU-Korea FTA online”, DG Trade, 20 October 2009
http://trade.ec.europa.eu/doclib/press/index.cfm?id=443&serie=273&langId=en
European Commission (2009b) “EU-Korea FTA: a quick reading guide”, DG trade, 20 October 2009, http://trade.ec.europa.eu/doclib/docs/2009/october/tradoc_145203.pdf
European Commission (2009c) “South Korea: EU Bilateral Trade and Trade with the World””, DG trade, 22 September 2009, available at: http://trade.ec.europa.eu/doclib/docs/2009/september/tradoc_113448.pdf
European Commission (2010a) ‘Economic Impact of the Korea FTA on the Automobile Sector’, DG Trade, mimeo.
European Commission (2010b) ‘The Economic Significance of Duty Drawbacks in the Context of the EU-Korea FTA’, DG Trade, mimeo.
Findlay, C. and T. Warren (2000), Impediments to Trade in Services: Measurement and Policy Implications, Routledge, London and New York,
FAIT (2007) “Canadia-Korean Free Trade Agreement: Initial Environment Assessement Report”, Foreign Affairs and International Trade, available online at: http://www.international.gc.ca/consultations/assets/pdfs/ea-cankorea-en.pdf.
Ferrantino, M. (2006), “Quantifying the trade and economic effects of non-tariff measures”OECD Trade Policy Working Paper No. 28 Fontagné, L., T. Mayer and S. Zignago (2005) « Trade in the Triad : How easy is the Access to Large Markets ? », Canadian Journal of Economics, 38(4): 1401-30.
Fontagné, L., A. Guillin and C. Mitaritonna (2009), “Estimations of Tariff Equivalents for the Service Sector”, DG Trade Report, ATLASS.
Fontagné, L. and C. Mitaritonna (2009) “Assessing Barriers to Trade in the Distribution and Telecom Sectors in Emerging Countries”, CEPII Working Paper 2009-37.
Fukao K. Kataoka G., Kuno A., (2003), “How to Measure Non-tariff Barriers? A Critical Examination of the Price-Differential Approach”, Paper prepared for the TCER Conference, Economic Analysis of the Japan-Korea FTA, September 21-22, 2003, Sapporo Gaulier, G. and S. Zignago (2009) “BACI: International Trade Database at the Product-level: The 1994-
2007 Version”, CEPII documents de travail 2009-xx, available on:
http://www.cepii.fr/anglaisgraph/bdd/baci/baciwp.pdf.

105
Green A.E., (1992), “South Korea's Automobile Industry: Development and Prospects” Asian Survey, Vol. 32, No. 5 (May, 1992), pp. 411-428 Published by: University of California Press
Harrison, G., T. Rutherford and D. Tarr (1997) “Quantifying the Uruguay Round”, Economic Journal, 197(444): 1405-1430
Helman, E. and P. Krugman (1989) Trade Policy and Market Structure, Cambridge, MA: MIT Press
Heungchong, K. (2005) “An Analysis of the Economic Effects of the Korea-EU FTA, KIEP study, Korea Institute for International Economic Policy.
IBM Belgium in association with DMI, TAC & TICON, (2008), “Trade Sustainability Impact Assessment of the Free Trade Agreement to be negotiated between the European Community and the Republic of Korea Final Report – (Phase 3)”, Framework Contract Commission 2007 Lot n°5 – project N°2007/139648, http://trade.ec.europa.eu/doclib/docs/2008/december/tradoc_141662.pdf Japan External Trade Organization (JETRO), (2000), “How Should the Japan-Korea Economic Relationship in the 21st century be?”, Japan External Trade Organization, Tokyo. Jong, Huan Ko (2006), “Economic Relations Between Korea and the EU”, powerpoint presentation at Seoul National University (the ‘Pukyong study’).
Kee, H. L., A. Nicita and M. Olarreaga (2005a), “Import Demand Elasticities and Trade Distortions,” Washington, D.C.: World Bank. Kee, H. L., A. Nicita and M. Olarreaga, (2005b), “Ad Valorem Equivalents of Non-Tariff Barriers, Washington, D.C.: World Bank. Kee, H. L., A. Nicita and M. Olarrega (2005c), “Estimating Trade Restrictiveness Indices,” Washington,D.C.: World Bank. Kee, H., A. Nicita and M.Olarreaga (2009) “Estimating Trade Restrictiveness Indices”, Economic Journal, 119(534): 172-199.
Kee, H., A. Nicita and M.Olarreaga (2008) "Import Demand Elasticities and Trade Distortions", The Review of Economics and Statistics, 90(4): 666-682.
Kim, Heungchong et al. (2005), An Analysis on the Economic Effects of a Korea-EU FTA and Policy Implications, Policy Analyses 05-09, Seoul. Kim, Yang-Hee, (2003),”Korea-Japan FTA and Japan’s Distribution Barriers”, Korean Institute for International Economic Policy, Seoul Kim, Dong, (1994), ”Incidence of Protection-The Case of Korea”, Economic Development and Cultural Change, Vol. 42, No. 3 (Apr., 1994), pp. 617-629, Published by: The University of Chicago Press Kim, Namdoo, (1996), “Measuring the Costs of Protection in Korea“, Institute for International Economics, Washington DC.

106
Kim, Yang-Hee, (2003), “Korea-Japan FTA and Japan’s distribution Barriers“, Korean Institute for International Economic Policy, Seoul. Kiyota, K. and R. Stern (2007) “Economic Effects of a Korea-US Free Trade Agreement”, University of Michigan, Research Seminar in International Economics, Discussion Paper no.557.
Korea Institute for International Economic Policy (KIEP), (2000), “Economic Effects of and Policy Directions for a Korea-Japan FTA”, Korean Institute for International Economic Policy, Seoul. Korea Institute for International Economic Policy (KIEP), (2001),”Current Status of Non-Tariff Barriers among Three countries and Measures to Facilitate Trilateral Trade: The Korean Perspective”, Paper presented to the Trilateral Joint Research between Korea, China and Japan Krugman, P. (1979) “Increasing Returns, Monopolistic Competition and International Trade”, Journal of International Economics, 9:469-479.
Lee, J. and P. Swagel (1997) “Trade Barriers and Trade Flows across Countries and Industries”, Review of Economics and Statistics, 79(3): 337-68.
Lee, Y. and J. Song (2008) “In Search of a Breakthrough for the Korea-EU Negotiations”, 12th EAAE congress, Gent (Belgium), August.
Lee, H. (2008) “Quantitative Estimates of the Economic Impacts of a Korea-United States Free Trade Agreement”, Asian Economic Papers, 7(2): 52-73.
Lee, H., C. Koo and E. Park (2008) “Are Exports of China, Japan and Korea diverted in the major Regional Trading Blocs?”, World Economy, 31(7),: 841:860.
Levin, Sander. U.S. Congressman (D-MI); and Chair of the House Committee on Ways and Means, Subcommittee on Trade United States Senator. "Statement of Senator Carl Levin at the DPC Oversight Hearing on Trade Policy and the U.S. Automobile Industry," February 17, 2006. http://www.senate.gov/~levin/newsroom/release.cfm?id=251708. Manifold, D. and W. Donnelly (2005), “A Compilation from Multiple Sources of Reported Measures Which May Affect Trade,” in P. Dee and M. Ferrantino (eds.), Quantitative Measures for Assessing the Effect of Non-Tariff Measures and Trade Facilitation, Singapore: World Scientific Ltd. For APEC, pp. 41-50. Maskus, K.E. and J.S. Wilson (eds) (2001), Quantifying the Impact of Technical Barriers to Trade, Ann Arbor, MI: Michigan University Press. MFAJ (2003) “Japan-Korea Free Trade Area”, Joint Study Group report, Ministry of Foreign Affairs of Japan, October 2003, available on: http://www.mofa.go.jp/region/asia-paci/korea/fta/index.html

107
MFAJ (2008) “Japan-Republic of Korea Economic Partnership Agreement: Overview”, Ministry of Foreign Affairs of Japan, April 2008, available on: http://www.mofa.go.jp/policy/economy/fta/rok/overview.html
Nicolas, F. (2009) “Negotiating a Korea-EU FTA: Easier Said than Done”, Asia Europe Journal, 7: 23-42
Olper, A. and V. Raimondi (2009) “Patterns and Determinants of International Trade Costs in the Food Industry”, Journal of Agricultural Economics, 60(2): 2009, 273–297
Park, D., I. Park and G. Estrada (2008) “Is the ASEAN-Korea Free Trade Area (AKFTA) an Optimal Free Trade Area?” Asian Development Bank, Working Paper Series on Regional Integration no.21.
Park, S. (2002) “Measuring Tariff Equivalents in Cross-Border Trade in Services”, Trade working paper 353, East Asian Bureau of Economic Research
Péridy, N. and N. Uttama (2010) “Foreign Direct Investment and Productivity Spillovers: The Experience of ASEAN countries”, Journal of Economic Integration, forthcoming
Péridy (2009) “Regional Integration, Imperfect Competition and Welfare: The Experience of the Greater Arab Free Trade Area”, Economie Appliquée, 52(4): 131-156.
Péridy, N. (2005) “Towards a new trade policy between the USA and Middle-East countries : Estimating trade resistance and export potential ”, The World Economy, 28(4): 491-518.
Pomfret, R. (2003) Economic Analysis of Regional Trading Arrangements, Cheltenham and Northampton, Elgar.
Robson, P. (1998) The Economics of International Integration, 4th edition, London: Routledge.
Queen Mary University of London and Development Solutions (2009) “Study of the Existing Level of Liberalization in Selected Services Sectors, Final Report for DG Trade.
Roson, R. (2006) “Introducing imperfect competition in CGE models: technical aspects and implications”, Computational Economics, 28:29-49.
Schott, Jeffrey J., Scott C. Bradford, and Thomas Moll. “Negotiating the Korea-United States Free Trade Agreement.” Policy Briefs in International Economics, No. PB06-4. Washington, DC: IIE, June 2006. Schott, Jeffrey J., Scott C. Bradford and Thomas Moll (2006), Negotiating the Korea-United States Free Trade Agreement, Policy Brief, No. PB06-4, Institute for International Economics, Washington, D.C. Smith, A. and A. Venables (1988) “Completing the Internal Market in the European Community: Some Industry Simulations”, European Economic Review, 32(7): 1501:1525.
Stephenson, Sherry M., (1997), “Standards and conformity assessment as nontariff barriers to trade”, Policy Research Working Paper no. 1826, World Bank

108
U.S. International Trade Commission (USITC, 2007). “U.S.-Korea Free Trade Agreement: Potential Economy-wide and Selected Sectoral Effects”, investigation no. TA-2104-24, USITC Publication 3949. Washington, DC: USITC, September 2007. USTR– United States Trade Representative (2007a.), “Trade Facts: Free Trade with Korea, summary of the KORUS FTA” (www.ustr.gov). USTR – United States Trade Representative (2007b), 2007 National Trade Estimate Report on Foreign Trade Barries (retrieved from http://www.ustr.gov/about-us/press-office/reports-and-publications/archives/2007/2007-national-trade-estimate-report-fo-0). USTR (2009) “Korea-US Free trade agreement”, United States Trade Representative, http://www.ustr.gov/trade-agreements/free-trade-agreements/korus-fta
WTO (2009a) “Trade Policy Review: Republic of Korea”, WT/TPRs/S/204/Rev.1
WTO (2009b) “Trade Policy Review: European Communities”, WT/TPRs/S/214.
WTO (2010) “Regional Trade Agreements Information System (RTA-IS)”, www.wto.org.
YaleGlobal online (2007), US-South Korean Free-Trade Agreement: The Cost of Failure (retrieved from http://yaleglobal.yale.edu/article.print?id=8600).
Yang, J (2005). Learning by doing: The impact of a trade remedy case in Korea. In Managing the challenges of WTO participation: 45 case studies. (eds.) Gallegher, P., Low, P. and A. Stoler, Geneva.
Yasheng Huang, 1997, “Between two coordination failures-automotive industrial policy in China with a comparison to Korea”, William Davidson Institute, University of Michigan Business School Zhuang, R., J. Mattson and W. Koo (2007) “Implications of the US-Korea Free Trade Agreement for Agriculture and other Sectors of the Economy”, Agribusiness and Applied Economic Report 619, Center for Agricultural Policy and Trade Studies, North Dakota State University.

109
Appendices
Appendix 3.1: Derivation of the AVEs
Starting from equation (2.1) in the text, we differentiate it with respect to ntbn,c and logDSn,c. This leads to:
ntbcncn
cn
dcn
dcn
cn
cn
cn aventb
p
p
m
ntb
m,,
,
,
,
,
,
, log
log
loglogε=
∂∂
∂∂
=∂
∂ (A.1)
DScncn
cn
dcn
dcn
cn
cn
cn aveDS
p
p
m
DS
m,,
,
,
,
,
,
,
log
log
log
log
log
logε=
∂∂
∂∂
=∂∂
(A.2)
Where ntbcnave , and DS
cnave , are respectively the ad-valorem equivalent of NTBs and domestic
support imposed on good n in country c. Solving (A.1) and (A.2) for cnave, s, we obtain:
cncn
cn
cn
ntbcn
ntbcne
ntb
mave
,,
,
,,
1log1 ,
εε
β −=∂
∂= (A.4)
cn
DScn
cn
cn
cn
DScn DS
mave
,
,
,
,
,, log
log1
εβ
ε=
∂∂
= (A.5)

110
Appendix 3.2: Values of the elasticities of substitution
Source: GTAP7
Substitution
elasticitiesBetween Quality zones
Between consuming
region and other
regions within a quality
zone
Between regions other
than consuming region
in a given quality zone
Between varieties
(imperfect competition)
Imperfect
competition
One quality
zone
i Sector (sigma_GEO) (sigma_ARM) (sigma_IMP) (sigma_VAR)
Animal s01 Meat & Animal products 4,14 5,44 7,29
Dairy s02 Dairy 5,45 7,30 Y
OthAgr s03 Other Agriculture 3,98 5,22 Y
Food s04 Food 3,12 4,00 Y
BevTob s05 Beverage & Tobacco 1,92 2,30 Y
Primary s06 Primary 8,87 12,13 Y
Textile s07 Textile 4,48 5,93 7,97 10,86 Y
LeathCloth s08 Leather & Clothing 4,80 6,37 8,60 11,74 Y
Chemicals s09 Chemicals 4,96 6,60 Y
Metals s10 Metals 3,93 5,14 6,85 9,28 Y
CarsTrucks s11 Cars & Trucks 4,19 5,51 7,37 10,01 Y
TransEquip s12 Planes Ships Bikes Trains 4,14 5,44 7,28 9,88 Y
Electronic s13 Electronic equipment 4,90 6,52 8,80 12,03 Y
Machinery s14 Machinery 4,10 5,39 7,20 9,77 Y
OthManuf s15 Other Manufactured oroducts 4,41 5,83 Y
Trade s16 Trade 2,47 3,08 3,94 5,15 Y
SeaTransp s17 Sea Transport 2,40 2,98 3,80
AirTransp s18 Air Transport 2,40 2,98 3,80
OthTransp s19 Other Transport 2,40 2,98 3,80
Communic s20 Communication 2,33 2,87 3,65 4,75 Y
Finance s21 Finance 2,35 2,91 3,71 4,83 Y
Insurance s22 Insurance 2,40 2,98 3,80
Business s23 Business services 2,45 3,05 3,89 5,09 Y
Tourism s24 Recreation & related Services 2,34 2,89 3,68 4,78 Y
PubSer s25 Admin Defence Health Education 2,49 3,11 3,98 5,22 Y
OthSer s26 Other Services 2,85 3,62 4,70 6,24 Y

111
Appendix 3.3: Sensitivity Analysis
The robustness of the results has been checked with regard to 1) the values of the elasticities of substitution; 2) the values of NTBs; 3) the consideration of trade facilitation and 4) the magnitude of the reduction in protection for services. More precisely, the first sensitivity analysis (S1) includes a reduction of the elasticities of substitution by 50%; the second set (S2) uses the initial values of NTBs calculated in section 2 (i.e. without scaling down). The third sensitivity analysis (S3) includes trade facilitation. As mentioned in section 2, it is taken into account by considering that the time which is necessary to accomplish import procedures, such as customs procedure and time for processing goods at the port (Decreux and Fontagné, 2009). Finally, the last set of results (S4) considers a greater reduction (30% instead of 10%) in the protection of specific services, namely telecom, financial and business services.
All sensitivity analyses are calculated starting from the central simulation presented in section 3. The results are presented from Table A3.1 to Table A3.15. Basically, S1 generally reduces and smoothes all the effects (production, trade, employment, terms of trade, etc…) but leaves unchanged the basic conclusions. To give an example, the EU export increase to Korea is reduced from 41.1 billion euros to 17.6 billion euros. The corresponding figures for imports are also reduced from 34.4 to 17.8 billion euros. As another example, the EU bilateral trade balance for the car industry would deteriorate by 8.4 billion euros instead of 13.4 billion. On the other hand, the improvement of trade balance for machinery, chemicals and other manufactured products would decrease from 15 to 6 billion euros.
Conversely, S2 leads to amplified effects compared with the central simulation. This is due to the fact that S2 includes the initial NTB values (calculated in section 2), which are greater than in the central simulation. In this case, the FTA would lead to an increase in EU exports, imports and trade balance by about 74, 46 and 28 billion euros respectively. Again, the basic conclusions are generally unchanged. For example, positive effects on the EU trade balance are still recorded for machinery, chemicals and other manufactured products. In addition, a slight positive effect is also recorded for cars and trucks, which also show small but positive employment effects. However, negative employment effects for textiles are also greater (-4% instead of -2% in the central simulation).
S3, which considers trade facilitation, provides small additional gains for both the EU and Korea, especially with regard to trade, production and employment. For example, the EU and Korean overall exports increase from 1.4% to 1.8% and from 5.5 to 6.9% respectively. Similar increases are recorded for imports. Bilateral trade changes are also greater. Regarding the bilateral trade balance, the effects obtained in the central simulation are generally

112
reinforced with S3 (an increased surplus for the EU agriculture, services, chemicals and other manufactured products as well as an increased deficit for cars). The same amplified effects are also recorded for production and employment (increased positive effects for chemicals, machinery, other manufactured products, agriculture and services; increased negative effects for textile and cars and trucks).
The last sensitivity analysis (S4) provides insignificant changes in comparison with the central simulation, except for the specific services considered. In particular, bilateral EU exports to Korea are significantly increased for finance, communication, business services as well as insurance.
Finally, the other macroeconomic effects are not significantly changed whatever the sensitivity analysis considered. As a matter of fact, the Korean effective exchange rate is expected to appreciate, factor rewards slightly increase both in Korea and in the EU, tariff revenue is slightly reduced for Korea and terms of trade improves in Korea while slightly deteriorating in the EU. All these results correlate with those found in the central simulation.
Table A3.1: GDP changes due to the EU-Korea FTA (%).
Baseline 1
Central S1 S2 S3 S4
r01 European Union 0,07 0,04 0,31 0,04 0,07
r02 Korea 0,84 1,04 0,35 1,70 0,83
r03 Japan -0,07 -0,06 -0,15 -0,06 -0,07
r04 USA -0,03 -0,02 -0,05 -0,02 -0,03
r05 China & Taiwan -0,01 -0,00 -0,04 0,00 -0,01
r06 ASEAN -0,01 0,00 -0,02 -0,01 -0,01
r07 India -0,00 -0,00 -0,02 0,01 -0,00
r08 Oceania -0,05 -0,02 -0,08 -0,04 -0,05
r09 Canada -0,05 -0,05 -0,09 -0,06 -0,05
r10 EFTA 0,01 0,01 0,05 -0,00 0,01
r11 Brazil -0,01 -0,00 -0,01 -0,01 -0,01
r12 Chile -0,01 0,01 -0,00 -0,01 -0,01
r13 Russia 0,00 0,02 0,01 0,01 0,00
r14 Rest of World -0,01 0,01 -0,00 -0,01 -0,01

113
Table A3.2: Decomposition of the Welfare gain (%)
Baseline 2
Central S1 S2 S3 S4
r01 European Union 0,08 0,06 0,32 0,05 0,09
r02 Korea 0,46 0,56 0,06 1,33 0,45
r03 Japan -0,06 -0,06 -0,16 -0,07 -0,07
r04 USA -0,03 -0,03 -0,06 -0,03 -0,03
r05 China & Taiwan -0,02 -0,01 -0,04 -0,00 -0,02
r06 ASEAN -0,01 -0,01 -0,02 -0,01 -0,01
r07 India -0,00 -0,01 -0,01 0,00 -0,00
r08 Oceania -0,04 -0,03 -0,06 -0,03 -0,04
r09 Canada -0,04 -0,04 -0,08 -0,06 -0,04
r10 EFTA 0,01 0,01 0,06 0,00 0,01
r11 Brazil -0,01 -0,01 -0,01 -0,01 -0,01
r12 Chile -0,01 0,00 0,00 -0,00 -0,01
r13 Russia -0,00 0,01 0,01 0,01 -0,00
r14 Rest of World -0,01 -0,00 -0,00 -0,01 -0,01
EUROPEAN UNION Baseline 2 Baseline 3
Central S1 S2 S3 S4 Central S1 S2 S3 S4
Allocation efficiency gains 0,00 0,00 0,00 0,00 0,00 -0,00 -0,00 -0,00 -0,00 -0,00
Capital accumulation gains 0,01 0,01 0,03 0,01 0,01 0,01 0,01 0,03 0,01 0,01
Land supply gains 0,00 0,00 0,00 0,00 0,00 0,00 0,00 0,00 0,00 0,00
Other gains -0,00 -0,00 0,01 -0,00 0,00 -0,00 -0,00 0,01 -0,00 0,00
Terms of trade gains -0,02 -0,02 -0,07 -0,02 -0,02 -0,01 -0,01 -0,06 -0,01 -0,01
Trade cost gains 0,03 0,02 0,11 0,03 0,02 0,03 0,02 0,11 0,03 0,02
Variety gains -0,01 -0,00 0,00 -0,01 -0,01 -0,00 0,00 0,01 -0,01 -0,00
Welfare 0,01 0,00 0,08 0,01 0,01 0,02 0,02 0,09 0,02 0,02
KOREA Baseline 2 Baseline 3
Central S1 S2 S3 S4 Central S1 S2 S3 S4
Allocation efficiency gains 0,00 0,00 0,00 0,00 0,00 0,00 0,00 0,00 0,00 0,00
Capital accumulation gains 0,36 0,38 0,65 0,54 0,36 0,25 0,25 0,56 0,44 0,26
Land supply gains -0,00 -0,00 -0,00 -0,01 -0,00 -0,00 -0,00 -0,00 -0,00 -0,00
Other gains 0,09 0,07 -0,50 0,17 0,09 0,03 0,02 -0,54 0,11 0,03
Terms of trade gains 0,54 0,45 1,39 0,61 0,56 0,39 0,30 1,25 0,46 0,41
Trade cost gains 0,04 0,03 0,10 0,19 0,04 0,04 0,03 0,10 0,20 0,04
Variety gains 0,10 0,22 0,09 0,18 0,10 0,04 0,12 0,05 0,12 0,04
Welfare 1,12 1,15 1,73 1,69 1,14 0,75 0,72 1,41 1,33 0,77

114
Table A3.3: Effects on overall exports and imports (% change in value, no EU-intra trade)
EXPORTS Baseline 1 Baseline 2
Central S1 S2 S3 S4 Central S1 S2 S3 S4
r01 European Union 1,40 0,70 2,23 1,81 1,41 0,96 0,48 1,74 1,34 0,97
r02 Korea 5,50 3,01 9,59 6,91 5,59 4,01 2,12 7,98 5,39 4,09
r03 Japan -0,19 -0,09 -0,35 -0,22 -0,19 -0,17 -0,09 -0,35 -0,22 -0,17
r04 USA -0,07 -0,03 -0,13 -0,07 -0,07 -0,08 -0,04 -0,14 -0,07 -0,08
r05 China & Taiwan -0,07 -0,02 -0,06 -0,10 -0,06 -0,04 -0,02 -0,03 -0,08 -0,04
r06 ASEAN -0,02 0,01 -0,03 -0,02 -0,02 -0,03 -0,01 -0,03 -0,03 -0,03
r07 India -0,00 0,00 0,02 -0,01 0,00 -0,03 -0,01 -0,03 -0,04 -0,03
r08 Oceania -0,17 -0,05 -0,22 -0,17 -0,17 -0,12 -0,04 -0,16 -0,12 -0,12
r09 Canada -0,15 -0,09 -0,26 -0,19 -0,15 -0,12 -0,07 -0,23 -0,16 -0,12
r10 EFTA -0,03 -0,00 -0,02 -0,04 -0,03 -0,03 -0,00 -0,02 -0,03 -0,03
r11 Brazil -0,03 0,00 -0,02 -0,03 -0,03 -0,03 -0,01 -0,02 -0,03 -0,03
r12 Chile -0,05 0,01 -0,06 -0,05 -0,05 -0,04 -0,00 -0,05 -0,04 -0,04
r13 Russia -0,00 0,03 -0,01 0,02 -0,00 -0,01 0,01 -0,01 0,01 -0,01
r14 Rest of World -0,04 0,01 -0,05 -0,05 -0,04 -0,04 -0,00 -0,04 -0,04 -0,04
IMPORTS Baseline 1 Baseline 2
Central S1 S2 S3 S4 Central S1 S2 S3 S4
r01 European Union 1,27 0,64 2,04 1,64 1,28 0,88 0,44 1,61 1,22 0,89
r02 Korea 5,87 3,22 10,22 7,36 5,96 4,25 2,26 8,46 5,71 4,34
r03 Japan -0,20 -0,10 -0,37 -0,23 -0,20 -0,18 -0,09 -0,36 -0,23 -0,18
r04 USA -0,04 -0,01 -0,06 -0,03 -0,04 -0,04 -0,02 -0,07 -0,03 -0,05
r05 China & Taiwan -0,07 -0,02 -0,05 -0,11 -0,07 -0,04 -0,02 -0,03 -0,08 -0,04
r06 ASEAN -0,01 0,01 -0,01 -0,01 -0,01 -0,02 -0,00 -0,02 -0,02 -0,02
r07 India 0,00 0,01 0,03 -0,00 0,01 -0,02 -0,01 -0,01 -0,03 -0,02
r08 Oceania -0,14 -0,04 -0,18 -0,14 -0,14 -0,10 -0,04 -0,13 -0,10 -0,10
r09 Canada -0,14 -0,09 -0,25 -0,18 -0,14 -0,11 -0,07 -0,23 -0,15 -0,11
r10 EFTA -0,01 0,00 0,02 -0,02 -0,01 -0,01 0,01 0,03 -0,01 -0,01
r11 Brazil -0,04 -0,00 -0,04 -0,04 -0,03 -0,04 -0,01 -0,03 -0,04 -0,03
r12 Chile -0,04 0,01 -0,03 -0,04 -0,04 -0,03 0,00 -0,02 -0,03 -0,03
r13 Russia -0,00 0,04 -0,01 0,02 -0,00 -0,01 0,01 -0,01 0,01 -0,01
r14 Rest of World -0,03 0,01 -0,03 -0,04 -0,03 -0,03 0,00 -0,03 -0,03 -0,03

115
Table A3.4: Effects on bilateral exports and imports (% change in value, no EU-intra trade)
Table A3.5: Effects on terms of trade
BILATERAL EXPORTS: EU Baseline 1 Baseline 2
Central S1 S2 S3 S4 Central S1 S2 S3 S4
r01 European Union - - - - - - - - - -
r02 Korea 82,58 39,24 149,02 96,02 83,80 62,08 30,02 124,72 74,13 63,22
r03 Japan -0,43 -0,13 -1,15 -0,26 -0,45 -0,46 -0,18 -1,20 -0,31 -0,48
r04 USA -0,34 -0,10 -0,84 -0,22 -0,35 -0,37 -0,14 -0,88 -0,26 -0,38
r05 China & Taiwan -0,16 0,06 -0,90 0,15 -0,17 -0,29 -0,07 -1,01 0,03 -0,30
r06 ASEAN -0,17 0,02 -0,79 0,08 -0,18 -0,26 -0,07 -0,86 -0,01 -0,27
r07 India -0,20 -0,02 -0,57 -0,14 -0,21 -0,20 -0,06 -0,46 -0,17 -0,20
r08 Oceania -0,36 -0,04 -0,99 -0,13 -0,38 -0,38 -0,12 -0,97 -0,16 -0,40
r09 Canada -0,39 -0,12 -0,98 -0,29 -0,41 -0,43 -0,17 -1,04 -0,33 -0,45
r10 EFTA -0,13 -0,03 -0,29 -0,09 -0,13 -0,13 -0,04 -0,29 -0,09 -0,13
r11 Brazil -0,19 -0,00 -0,61 -0,03 -0,20 -0,24 -0,06 -0,63 -0,09 -0,25
r12 Chile -0,25 -0,04 -0,67 -0,13 -0,26 -0,23 -0,07 -0,64 -0,12 -0,25
r13 Russia -0,13 0,01 -0,44 -0,01 -0,13 -0,16 -0,04 -0,47 -0,05 -0,17
r14 Rest of World -0,25 -0,03 -0,72 -0,10 -0,26 -0,29 -0,09 -0,75 -0,15 -0,30
BILATERAL EXPORTS: KOREA Baseline 1 Baseline 2
Central S1 S2 S3 S4 Central S1 S2 S3 S4
r01 European Union 38,39 22,00 51,63 55,31 38,55 23,06 12,95 35,04 38,50 23,20
r02 Korea - - - - - - - - - -
r03 Japan -1,84 -1,07 -0,61 -3,54 -1,78 -0,93 -0,50 0,09 -2,69 -0,87
r04 USA 2,99 2,14 6,54 3,40 3,07 2,63 1,57 6,62 3,25 2,71
r05 China & Taiwan -1,57 -0,99 0,01 -3,28 -1,51 -0,53 -0,33 0,90 -2,26 -0,47
r06 ASEAN -0,54 -0,43 1,61 -1,95 -0,47 0,08 0,00 2,04 -1,37 0,14
r07 India 0,14 -0,42 3,27 -1,58 0,21 0,82 0,16 3,91 -1,12 0,89
r08 Oceania 0,49 0,41 4,02 -0,71 0,59 1,18 0,74 4,76 0,18 1,27
r09 Canada 5,51 3,49 10,47 6,90 5,63 4,71 2,61 10,72 6,45 4,82
r10 EFTA 2,50 1,38 7,11 1,94 2,61 2,45 1,33 7,17 1,95 2,55
r11 Brazil -1,37 -0,77 0,76 -3,26 -1,31 -0,26 -0,14 1,75 -2,17 -0,20
r12 Chile 4,56 2,94 8,26 5,64 4,66 3,01 1,82 6,90 4,09 3,11
r13 Russia 1,99 1,39 5,83 1,45 2,09 1,88 1,14 5,74 1,36 1,98
r14 Rest of World 1,68 0,83 6,20 0,45 1,78 2,10 1,10 6,57 1,01 2,20
TERMS OF TRADE Baseline 1 Baseline 2
Central S1 S2 S3 S4 Central S1 S2 S3 S4
r01 European Union -0,06 -0,06 -0,22 -0,07 -0,06 -0,03 -0,03 -0,19 -0,04 -0,04
r02 Korea 1,16 1,02 2,80 1,33 1,19 0,81 0,67 2,40 0,96 0,84
r03 Japan -0,08 -0,09 -0,17 -0,09 -0,08 -0,08 -0,08 -0,17 -0,09 -0,08
r04 USA -0,03 -0,03 -0,04 -0,04 -0,03 -0,03 -0,03 -0,04 -0,04 -0,03
r05 China & Taiwan -0,03 -0,03 -0,04 -0,04 -0,03 -0,02 -0,02 -0,03 -0,03 -0,02
r06 ASEAN -0,03 -0,02 -0,03 -0,04 -0,03 -0,02 -0,01 -0,02 -0,03 -0,02
r07 India -0,01 -0,02 -0,02 -0,01 -0,01 -0,01 -0,01 -0,03 -0,01 -0,01
r08 Oceania -0,05 -0,02 -0,05 -0,06 -0,05 -0,04 -0,02 -0,04 -0,05 -0,04
r09 Canada -0,02 -0,01 -0,01 -0,03 -0,02 -0,01 -0,01 -0,01 -0,02 -0,01
r10 EFTA -0,01 0,01 -0,03 0,01 -0,01 -0,02 -0,00 -0,04 -0,00 -0,02
r11 Brazil -0,02 -0,00 -0,02 -0,02 -0,02 -0,01 -0,01 -0,02 -0,02 -0,01
r12 Chile -0,01 0,01 0,00 -0,02 -0,01 -0,01 -0,00 0,01 -0,02 -0,01
r13 Russia -0,01 0,02 -0,02 0,00 -0,01 -0,01 0,01 -0,02 -0,00 -0,01
r14 Rest of World -0,01 0,01 -0,02 -0,02 -0,01 -0,01 -0,00 -0,01 -0,02 -0,01

116
Table A3.6: Production effects: Sectoral breakdown (European Union)
EUROPEAN UNION
Baseline 1 Baseline 2
Central S1 S2 S3 S4 Central S1 S2 S3 S4
a1 Agriculture 0,05 0,03 -0,04 0,05 0,04 0,03 0,03 -0,06 0,04 0,03
s01 Meat & Animal products 0,89 0,32 0,87 0,94 0,88 0,54 0,23 0,49 0,60 0,54
s02 Dairy 0,63 0,18 0,61 0,67 0,63 0,50 0,15 0,47 0,54 0,50
s03 Other Agriculture 0,10 0,05 0,01 0,15 0,10 0,06 0,03 -0,04 0,11 0,06
s04 Food 0,15 0,06 0,13 0,18 0,15 0,12 0,05 0,10 0,15 0,12
s05 Beverage & Tobacco 0,13 0,06 0,12 0,16 0,13 0,13 0,06 0,11 0,15 0,12
s06 Primary -0,01 -0,00 -0,03 -0,01 -0,01 -0,01 -0,00 -0,03 -0,01 -0,01
a2 NAMA -0,01 0,00 0,07 -0,04 -0,02 0,02 0,02 0,11 -0,01 0,01
s07 Textile -2,22 -0,76 -4,21 -2,27 -2,24 -2,06 -0,68 -4,26 -2,09 -2,07
s08 Leather & Clothing -0,04 0,08 -0,51 0,11 -0,05 -0,14 0,01 -0,64 0,02 -0,14
s09 Chemicals 0,17 0,09 0,07 0,28 0,16 0,09 0,06 -0,01 0,20 0,08
s10 Metals 0,02 0,05 0,13 -0,03 0,01 0,08 0,06 0,21 0,03 0,07
s11 Cars & Trucks -1,38 -0,79 0,64 -2,60 -1,40 -0,40 -0,21 1,70 -1,62 -0,42
s12 Planes Ships Bikes Trains -0,39 -0,07 -2,14 0,27 -0,42 -0,65 -0,33 -2,22 -0,02 -0,67
s13 Electronic equipment 0,05 0,13 -0,30 0,21 0,03 0,04 0,08 -0,26 0,21 0,02
s14 Machinery 0,27 0,26 0,11 0,36 0,26 0,19 0,17 0,06 0,28 0,17
s15 Other Manufactured products 0,16 0,05 0,18 0,23 0,16 0,13 0,04 0,15 0,20 0,12
a3 Services 0,00 0,00 0,00 0,01 0,01 -0,00 0,00 -0,00 0,01 0,00
s16 Trade -0,00 0,01 0,01 -0,00 -0,00 0,01 0,01 0,02 0,01 0,00
s17 Sea Transport 0,69 0,40 0,62 0,74 0,69 -0,07 -0,02 -0,14 -0,02 -0,07
s18 Air Transport 0,12 0,09 0,02 0,17 0,12 -0,07 -0,01 -0,18 -0,03 -0,07
s19 Other Transport 0,03 0,02 0,03 0,05 0,03 -0,00 0,01 0,00 0,01 -0,00
s20 Communication 0,00 0,00 -0,01 0,01 0,01 -0,01 0,00 -0,01 0,00 -0,00
s21 Finance -0,01 -0,00 -0,05 0,01 0,00 -0,01 -0,00 -0,06 -0,00 -0,00
s22 Insurance 0,02 0,01 -0,03 0,05 0,06 -0,00 0,00 -0,06 0,02 0,03
s23 Business services 0,01 0,01 0,03 0,02 0,03 0,01 0,01 0,03 0,02 0,02
s24 Recreation & related Services -0,02 -0,01 -0,04 -0,00 -0,02 -0,02 -0,00 -0,03 0,00 -0,02
s25 Admin Defence Health Education -0,01 -0,01 0,00 -0,01 -0,01 -0,01 -0,00 0,01 -0,01 -0,01
s26 Other Services 0,01 0,01 0,07 0,02 0,01 0,02 0,02 0,08 0,03 0,02
TOTAL (GDP change) 0,07 0,04 0,31 0,04 0,07 0,08 0,06 0,32 0,05 0,08

117
Table A3.7: Production effects: Sectoral breakdown (Korea)
KOREA
Baseline 1 Baseline 2
Central S1 S2 S3 S4 Central S1 S2 S3 S4
a1 Agriculture -0,45 -0,20 0,41 -0,89 -0,37 -0,07 -0,04 0,83 -0,58 0,00
s01 Meat & Animal products -7,89 -2,01 -7,91 -8,08 -7,88 -3,94 -1,34 -3,61 -4,20 -3,92
s02 Dairy -21,20 -4,50 -22,00 -21,51 -21,18 -16,98 -3,86 -17,70 -17,28 -16,97
s03 Other Agriculture -0,93 -0,39 -0,81 -1,22 -0,93 -0,66 -0,28 -0,53 -0,95 -0,65
s04 Food -2,85 -0,44 -2,90 -3,12 -2,84 -2,21 -0,44 -2,20 -2,48 -2,20
s05 Beverage & Tobacco -0,38 0,49 -0,10 -0,08 -0,37 -0,54 0,26 -0,23 -0,24 -0,53
s06 Primary -0,09 -0,05 -0,13 -0,14 -0,09 -0,07 -0,03 -0,11 -0,11 -0,07
a2 NAMA 0,90 0,89 0,25 1,60 0,95 0,41 0,48 -0,20 1,13 0,46
s07 Textile 34,25 16,32 59,51 35,03 34,36 24,33 11,88 46,96 24,28 24,43
s08 Leather & Clothing 9,48 3,27 16,35 8,43 9,56 8,77 2,91 16,71 7,44 8,85
s09 Chemicals -1,01 0,07 -2,30 -1,13 -0,96 -0,88 -0,08 -1,97 -1,03 -0,84
s10 Metals -1,98 -1,15 -2,42 -2,64 -1,87 -1,70 -0,83 -2,39 -2,41 -1,60
s11 Cars & Trucks 19,34 12,69 3,62 33,50 19,49 8,08 5,31 -3,60 20,67 8,21
s12 Planes Ships Bikes Trains 1,75 0,14 14,86 -4,12 1,88 4,72 2,79 17,08 -1,46 4,84
s13 Electronic equipment -1,56 -0,87 -0,06 -3,02 -1,49 -0,77 -0,30 0,45 -2,30 -0,71
s14 Machinery -2,94 -2,03 -2,21 -4,21 -2,85 -1,96 -1,12 -1,60 -3,39 -1,87
s15 Other Manufactured products -1,35 0,18 -2,24 -1,50 -1,33 -1,23 -0,02 -2,03 -1,38 -1,21
a3 Services -0,23 0,02 -0,02 -0,20 -0,29 -0,13 0,02 0,09 -0,10 -0,19
s16 Trade 0,42 0,49 0,63 0,73 0,43 0,27 0,31 0,51 0,59 0,29
s17 Sea Transport -2,75 -0,78 -2,00 -3,42 -2,71 -0,07 -0,15 0,59 -0,78 -0,03
s18 Air Transport -1,58 -0,46 -0,67 -2,24 -1,55 -0,09 -0,01 0,72 -0,79 -0,06
s19 Other Transport -0,12 0,24 0,27 -0,07 -0,10 0,02 0,15 0,42 0,05 0,05
s20 Communication -0,08 0,19 0,21 0,07 -0,12 -0,03 0,13 0,29 0,13 -0,07
s21 Finance -0,07 0,08 0,09 0,07 -0,12 -0,06 0,02 0,13 0,08 -0,11
s22 Insurance -0,82 -0,14 -0,73 -0,80 -1,19 -0,53 -0,10 -0,42 -0,52 -0,88
s23 Business services -0,96 -0,41 -0,64 -1,15 -1,14 -0,59 -0,24 -0,29 -0,79 -0,78
s24 Recreation & related Services 0,47 0,56 0,96 0,69 0,48 0,33 0,35 0,84 0,54 0,33
s25 Admin Defence Health Education -0,05 0,06 0,03 0,03 -0,03 -0,04 0,04 0,05 0,03 -0,02
s26 Other Services 0,94 0,95 1,58 1,49 0,95 0,65 0,60 1,34 1,19 0,66
TOTAL (GDP change) 0,84 1,04 0,35 1,70 0,83 0,46 0,56 0,06 1,33 0,46

118
Table A3.8: Trade effects: European Union (% change, sectoral breakdown)
EXPORTS: EU Baseline 1 Baseline 2
Central S1 S2 S3 S4 Central S1 S2 S3 S4
a1 Agriculture 1,87 0,77 1,91 2,22 1,86 1,15 0,51 1,13 1,42 1,14
a2 NAMA 1,61 0,85 2,95 2,12 1,59 1,17 0,60 2,47 1,65 1,16
a3 Services 0,27 0,16 -0,06 0,40 0,40 0,00 0,03 -0,33 0,12 0,13
s01 Meat & Animal products 12,33 4,50 12,86 12,75 12,31 6,06 2,92 6,21 6,34 6,05
s02 Dairy 13,10 3,31 12,99 13,62 13,09 8,35 2,57 8,23 8,71 8,34
s03 Other Agriculture 1,66 0,69 1,43 1,85 1,66 1,31 0,56 1,07 1,48 1,30
s04 Food 2,71 1,04 2,67 3,16 2,70 2,12 0,86 2,07 2,51 2,12
s05 Beverage & Tobacco 1,07 0,47 0,99 1,16 1,07 0,97 0,43 0,88 1,06 0,97
s06 Primary 0,01 0,04 0,08 0,17 0,02 -0,02 0,01 0,01 0,05 -0,02
s07 Textile -0,54 0,13 -2,66 0,16 -0,56 -1,36 -0,32 -3,96 -0,61 -1,39
s08 Leather & Clothing 5,44 3,05 6,24 6,34 5,42 2,72 1,60 3,16 3,52 2,70
s09 Chemicals 1,60 0,66 1,81 2,22 1,59 0,99 0,41 1,12 1,55 0,98
s10 Metals 1,99 1,13 2,58 2,61 1,96 1,52 0,81 2,10 2,11 1,49
s11 Cars & Trucks 5,56 2,12 23,44 5,72 5,52 5,67 2,31 22,92 5,79 5,63
s12 Planes Ships Bikes Trains 0,61 0,62 -1,12 1,83 0,57 -0,02 0,06 -1,59 1,12 -0,06
s13 Electronic equipment 1,89 0,86 2,38 2,93 1,86 1,34 0,57 1,88 2,35 1,31
s14 Machinery 1,94 1,31 1,95 2,66 1,92 1,33 0,85 1,35 2,03 1,31
s15 Other Manufactured products 0,79 0,33 0,97 1,12 0,79 0,58 0,23 0,74 0,88 0,57
s16 Trade 0,74 0,44 0,37 0,91 0,73 0,24 0,16 -0,13 0,40 0,23
s17 Sea Transport 0,93 0,23 0,79 1,00 0,93 -0,12 -0,00 -0,26 -0,05 -0,12
s18 Air Transport 0,28 0,12 0,03 0,38 0,27 -0,15 -0,02 -0,40 -0,06 -0,16
s19 Other Transport 0,10 0,06 -0,22 0,21 0,09 -0,18 -0,03 -0,50 -0,08 -0,19
s20 Communication 0,19 0,14 -0,14 0,31 0,30 -0,11 -0,03 -0,44 0,00 0,00
s21 Finance 0,18 0,15 -0,21 0,30 0,35 -0,00 0,03 -0,40 0,11 0,16
s22 Insurance 0,27 0,09 -0,06 0,37 0,49 0,06 0,02 -0,27 0,16 0,28
s23 Business services 0,41 0,25 0,10 0,56 0,61 0,14 0,10 -0,16 0,28 0,34
s24 Recreation & related Services -0,18 -0,03 -0,60 -0,03 -0,19 -0,22 -0,08 -0,64 -0,08 -0,23
s25 Admin Defence Health Education 0,07 0,08 -0,40 0,21 0,06 -0,26 -0,09 -0,73 -0,13 -0,27
s26 Other Services -0,08 0,02 -0,43 0,01 -0,09 -0,15 -0,03 -0,50 -0,06 -0,16
TOTAL 1,40 0,70 2,23 1,81 1,41 0,96 0,48 1,74 1,34 0,97
IMPORTS: EU Baseline 1 Baseline 2
Central S1 S2 S3 S4 Central S1 S2 S3 S4
a1 Agriculture 0,62 0,24 1,16 0,70 0,62 0,49 0,20 0,99 0,55 0,49
a2 NAMA 1,95 1,05 2,94 2,63 1,97 1,29 0,69 2,23 1,93 1,31
a3 Services 0,18 0,05 0,66 0,05 0,19 0,23 0,10 0,71 0,11 0,23
s01 Meat & Animal products 0,72 0,15 1,38 0,57 0,73 0,59 0,18 1,23 0,46 0,60
s02 Dairy 1,87 0,30 3,16 1,62 1,89 1,17 0,30 2,22 0,94 1,18
s03 Other Agriculture 0,50 0,11 0,97 0,40 0,51 0,45 0,14 0,89 0,36 0,45
s04 Food 0,61 0,18 1,16 0,51 0,62 0,48 0,16 1,01 0,39 0,49
s05 Beverage & Tobacco 0,22 0,05 0,53 0,15 0,23 0,22 0,07 0,52 0,15 0,22
s06 Primary 0,20 0,09 0,31 0,31 0,20 0,14 0,07 0,23 0,23 0,14
s07 Textile 4,60 1,84 8,33 4,87 4,62 3,45 1,38 6,91 3,68 3,46
s08 Leather & Clothing 0,76 0,26 1,72 0,62 0,77 0,56 0,23 1,40 0,43 0,57
s09 Chemicals 0,91 0,35 2,09 0,87 0,92 0,85 0,35 2,00 0,82 0,86
s10 Metals 0,36 0,16 1,17 0,36 0,37 0,37 0,20 1,16 0,36 0,38
s11 Cars & Trucks 14,75 8,65 16,15 22,50 14,81 7,14 4,19 8,39 13,40 7,19
s12 Planes Ships Bikes Trains 1,35 0,70 4,08 0,67 1,38 1,46 0,89 3,93 0,84 1,48
s13 Electronic equipment 0,62 0,32 1,30 0,69 0,63 0,47 0,24 1,12 0,53 0,48
s14 Machinery 0,61 0,25 1,59 0,75 0,63 0,62 0,33 1,57 0,76 0,65
s15 Other Manufactured products 0,41 0,12 1,06 0,32 0,42 0,42 0,15 1,05 0,34 0,43
s16 Trade 0,16 0,04 0,59 0,04 0,17 0,21 0,09 0,63 0,10 0,21
s17 Sea Transport 0,27 0,10 0,60 0,21 0,27 0,17 0,06 0,50 0,11 0,17
s18 Air Transport 0,14 0,03 0,51 0,05 0,15 0,17 0,06 0,53 0,08 0,17
s19 Other Transport 0,20 0,05 0,60 0,10 0,20 0,21 0,07 0,61 0,12 0,21
s20 Communication 0,15 0,05 0,57 0,05 0,16 0,20 0,09 0,62 0,10 0,21
s21 Finance 0,17 0,05 0,69 0,04 0,18 0,23 0,11 0,75 0,11 0,24
s22 Insurance 0,22 0,04 0,70 0,11 0,23 0,25 0,08 0,74 0,16 0,26
s23 Business services 0,15 0,03 0,61 0,01 0,16 0,21 0,09 0,67 0,08 0,21
s24 Recreation & related Services 0,22 0,06 0,75 0,09 0,23 0,27 0,12 0,79 0,15 0,28
s25 Admin Defence Health Education 0,24 0,08 0,83 0,13 0,25 0,30 0,14 0,90 0,20 0,31
s26 Other Services 0,23 0,06 0,74 0,11 0,24 0,26 0,10 0,78 0,16 0,27
TOTAL 1,27 0,64 2,04 1,64 1,28 0,88 0,44 1,61 1,22 0,89

119
Table A3.9: Trade effects: Korea (% change, sectoral breakdown)
EXPORTS: KOREA Baseline 1 Baseline 2
Central S1 S2 S3 S4 Central S1 S2 S3 S4
a1 Agriculture 4,87 1,77 10,65 4,02 4,97 4,52 1,80 10,26 6,17 4,61
a2 NAMA 6,04 3,46 9,97 8,05 6,13 4,16 2,32 7,94 -3,34 4,25
a3 Services -2,72 -1,42 -2,39 -4,34 -2,76 -1,70 -0,83 -1,51 5,31 -1,74
s01 Meat & Animal products 10,98 1,80 12,63 9,40 11,00 6,80 1,60 7,76 44,98 6,81
s02 Dairy 65,81 7,58 85,79 63,79 65,86 46,91 5,59 62,18 1,06 46,96
s03 Other Agriculture 2,59 0,28 2,57 1,84 2,59 1,80 0,27 1,54 2,62 1,80
s04 Food 4,72 1,50 6,12 4,34 4,73 3,03 0,89 4,19 0,05 3,04
s05 Beverage & Tobacco 0,38 0,16 0,68 0,02 0,39 0,42 0,12 0,66 0,71 0,43
s06 Primary 0,64 0,04 1,05 0,83 0,63 0,55 0,11 0,93 27,85 0,53
s07 Textile 42,87 21,11 76,29 44,07 42,98 27,67 14,07 54,23 37,04 27,76
s08 Leather & Clothing 70,88 27,17 117,27 72,30 71,07 37,11 14,77 70,27 4,94 37,25
s09 Chemicals 5,40 1,64 10,74 5,69 5,42 4,80 1,53 9,72 -3,63 4,82
s10 Metals -2,95 -1,75 -2,39 -4,38 -2,84 -2,12 -1,04 -1,93 44,61 -2,02
s11 Cars & Trucks 51,41 29,29 61,74 78,31 51,66 23,84 13,77 33,86 -0,53 24,03
s12 Planes Ships Bikes Trains 2,96 0,71 17,90 -3,35 3,10 6,14 3,46 20,41 -1,62 6,27
s13 Electronic equipment -0,92 -0,45 0,73 -2,10 -0,86 -0,38 -0,11 1,00 -3,02 -0,32
s14 Machinery -2,65 -1,89 -0,84 -4,07 -2,54 -1,35 -0,69 -0,04 0,52 -1,25
s15 Other Manufactured products 0,62 0,19 1,74 0,46 0,63 0,72 0,25 1,73 -2,51 0,73
s16 Trade -1,78 -0,94 -1,58 -3,20 -1,75 -1,07 -0,49 -1,00 -1,05 -1,04
s17 Sea Transport 1,56 0,38 2,21 0,88 1,60 -0,37 -0,16 0,18 -1,31 -0,34
s18 Air Transport -0,45 -0,25 0,31 -1,37 -0,42 -0,38 -0,18 0,26 -1,74 -0,35
s19 Other Transport -1,22 -0,51 -0,37 -2,27 -1,20 -0,66 -0,27 0,05 -2,91 -0,65
s20 Communication -2,55 -1,25 -2,09 -3,87 -2,56 -1,58 -0,72 -1,22 -3,43 -1,59
s21 Finance -2,93 -1,55 -2,58 -4,52 -2,94 -1,83 -0,90 -1,59 -4,73 -1,85
s22 Insurance -3,88 -1,30 -4,34 -6,06 -3,83 -2,51 -0,78 -3,15 -3,96 -2,47
s23 Business services -3,43 -1,82 -3,10 -5,22 -3,52 -2,13 -1,05 -1,95 -1,56 -2,23
s24 Recreation & related Services -0,89 -0,46 0,08 -1,96 -0,86 -0,46 -0,21 0,38 -5,08 -0,44
s25 Admin Defence Health Education -4,18 -2,19 -4,76 -6,51 -4,16 -2,69 -1,31 -3,48 -2,23 -2,67
s26 Other Services -1,76 -0,61 -0,75 -3,01 -1,73 -0,96 -0,26 -0,07 -0,72 -0,92
TOTAL 5,50 3,01 9,59 6,91 5,59 4,01 2,12 7,98 5,39 4,09
IMPORTS: KOREA Baseline 1 Baseline 2
Central S1 S2 S3 S4 Central S1 S2 S3 S4
a1 Agriculture 2,73 1,54 3,02 3,30 2,76 1,86 1,02 2,22 2,43 1,88
a2 NAMA 7,92 4,53 15,41 10,00 7,93 5,91 3,26 13,00 7,88 5,91
a3 Services 5,62 3,19 5,78 7,33 6,85 2,92 1,70 3,25 4,64 3,97
s01 Meat & Animal products 37,38 15,48 41,70 39,16 37,38 11,64 8,04 14,08 12,90 11,65
s02 Dairy 223,00 73,95 232,66 229,73 222,94 138,33 53,96 145,71 143,31 138,29
s03 Other Agriculture 2,47 1,90 3,26 3,33 2,48 2,33 1,36 3,31 3,15 2,34
s04 Food 10,80 5,43 11,69 13,07 10,80 8,25 4,19 9,14 10,25 8,25
s05 Beverage & Tobacco 26,36 12,50 27,25 28,23 26,35 23,59 11,36 24,55 25,40 23,58
s06 Primary -1,00 0,13 -1,44 -1,14 -0,97 -0,93 -0,02 -1,34 -1,07 -0,89
s07 Textile 13,30 6,17 19,60 15,44 13,33 9,53 4,07 16,03 11,30 9,56
s08 Leather & Clothing 5,12 3,89 5,57 6,96 5,10 2,28 1,90 2,61 3,97 2,28
s09 Chemicals 8,85 4,66 11,75 11,19 8,89 6,02 3,02 8,75 8,11 6,06
s10 Metals 4,90 3,30 5,68 6,87 4,90 3,30 2,13 4,11 5,26 3,31
s11 Cars & Trucks 94,86 44,25 324,20 106,33 94,77 82,41 39,81 290,15 93,04 82,33
s12 Planes Ships Bikes Trains 6,19 4,55 7,50 9,13 6,16 3,89 2,68 5,19 6,64 3,87
s13 Electronic equipment 1,59 1,27 2,47 2,31 1,59 1,10 0,80 1,98 1,80 1,10
s14 Machinery 9,85 6,33 12,32 12,96 9,82 6,50 4,06 8,82 9,45 6,48
s15 Other Manufactured products 5,81 2,69 8,01 7,75 5,82 4,29 1,86 6,38 6,13 4,30
s16 Trade 5,96 3,68 6,02 7,86 5,95 2,90 1,83 3,14 4,75 2,89
s17 Sea Transport 0,53 -0,38 0,65 0,68 0,54 0,16 0,16 0,30 0,30 0,17
s18 Air Transport 1,43 0,78 1,56 2,05 1,42 0,38 0,45 0,58 0,99 0,38
s19 Other Transport 1,98 1,28 1,49 3,20 1,99 0,68 0,59 0,35 1,89 0,69
s20 Communication 4,75 3,23 4,68 6,45 5,61 1,89 1,30 1,97 3,55 2,59
s21 Finance 13,96 7,91 13,94 16,09 19,54 7,11 4,17 7,27 9,10 11,48
s22 Insurance 20,22 5,29 20,92 23,17 29,18 9,86 2,90 10,74 12,53 16,37
s23 Business services 7,78 4,39 7,85 9,65 9,84 4,18 2,39 4,41 5,99 5,95
s24 Recreation & related Services 1,52 1,43 1,05 2,99 1,50 0,87 0,76 0,56 2,34 0,85
s25 Admin Defence Health Education 5,87 3,84 6,63 8,69 5,86 2,73 1,80 3,70 5,48 2,72
s26 Other Services 10,50 5,86 10,25 12,33 10,48 4,38 2,69 4,34 6,13 4,37
TOTAL 5,87 3,22 10,22 7,36 5,96 4,25 2,26 8,46 5,71 4,34

120
Table A3.10: Bilateral trade effects (% change, sectoral breakdown)
EXPORTS: EUROPEAN UNION
Baseline 1 Baseline 2
Central S1 S2 S3 S4 Central S1 S2 S3 S4
a1 Agriculture 163,49 67,70 201,94 183,70 163,45 129,22 54,24 165,15 146,55 129,19
a2 NAMA 83,97 41,82 168,64 99,05 83,94 64,90 32,53 144,93 78,64 64,87
a3 Services 24,82 11,37 24,56 26,83 32,62 10,10 4,99 9,99 11,86 17,22
s01 Meat & Animal products 331,56 122,25 363,00 338,06 331,53 267,98 94,55 300,54 273,22 267,95
s02 Dairy 1114,24 318,53 1160,83 1141,38 1114,00 928,06 263,54 974,62 952,21 927,86
s03 Other Agriculture 259,96 92,05 280,06 272,93 259,96 215,87 78,81 234,26 227,17 215,87
s04 Food 170,93 66,74 185,57 192,59 170,90 146,12 57,81 160,04 165,97 146,10
s05 Beverage & Tobacco 68,19 30,25 70,80 71,60 68,18 65,48 28,82 68,25 68,85 65,47
s06 Primary 84,76 35,36 149,89 176,94 84,83 82,65 34,29 147,70 174,06 82,71
s07 Textile 175,01 95,82 249,08 196,69 175,01 111,36 62,19 173,32 128,36 111,36
s08 Leather & Clothing 148,96 92,96 194,32 163,97 148,85 77,60 49,97 112,97 88,77 77,53
s09 Chemicals 89,70 36,20 127,03 111,60 89,74 61,22 24,97 94,06 80,08 61,26
s10 Metals 77,64 44,50 122,86 89,81 77,58 60,75 34,87 102,37 71,81 60,70
s11 Cars & Trucks 481,01 216,99 1645,67 536,39 480,62 447,40 200,75 1586,03 502,22 447,07
s12 Planes Ships Bikes Trains 55,62 34,01 89,25 66,07 55,52 46,35 27,84 78,98 56,05 46,27
s13 Electronic equipment 65,77 26,16 133,05 76,12 65,73 59,65 23,56 124,57 69,55 59,61
s14 Machinery 84,71 48,25 120,46 100,16 84,62 59,78 34,38 91,55 73,21 59,70
s15 Other Manufactured products 50,62 21,99 76,88 63,32 50,63 42,37 18,09 67,75 54,49 42,37
s16 Trade 44,93 22,24 44,41 47,89 44,90 18,90 9,79 18,67 21,33 18,87
s17 Sea Transport 10,74 2,53 10,67 10,96 10,75 -0,58 -0,04 -0,64 -0,39 -0,57
s18 Air Transport 10,06 3,36 9,89 10,83 10,05 -0,28 0,26 -0,39 0,39 -0,29
s19 Other Transport 14,67 5,21 13,61 16,20 14,67 -0,26 0,32 -1,03 1,07 -0,26
s20 Communication 35,54 19,01 34,87 38,02 49,57 5,09 3,05 4,71 7,00 16,10
s21 Finance 62,49 31,47 61,91 65,84 92,16 31,96 16,67 31,67 34,68 56,95
s22 Insurance 79,14 20,78 79,68 83,77 119,40 39,87 11,31 40,55 43,47 72,61
s23 Business services 31,90 16,57 31,56 34,47 43,85 16,62 8,79 16,47 18,88 27,39
s24 Recreation & related Services 1,32 1,38 0,34 2,95 1,28 0,62 0,67 -0,18 2,24 0,59
s25 Admin Defence Health Education 42,19 20,75 42,46 46,22 42,17 0,54 0,73 0,93 3,38 0,52
s26 Other Services 99,78 42,55 98,40 103,51 99,73 39,26 18,28 38,53 41,88 39,23
TOTAL 82,58 39,24 149,02 96,02 83,80 62,08 30,02 124,72 74,13 63,22
EXPORTS: KOREA
Baseline 1 Baseline 2
Central S1 S2 S3 S4 Central S1 S2 S3 S4
a1 Agriculture 76,23 67,70 132,00 87,72 76,43 51,22 54,24 98,88 60,47 51,38
a2 NAMA 37,51 41,82 48,32 55,66 37,68 21,82 32,53 31,49 38,43 21,97
a3 Services -2,45 11,37 -1,63 -4,09 -2,49 -1,43 4,99 -0,73 -3,08 -1,47
s01 Meat & Animal products 185,43 122,25 258,95 184,36 185,50 97,57 94,55 147,03 96,94 97,61
s02 Dairy 4221,63 318,53 5730,98 4209,99 4223,67 611,64 263,54 856,65 609,52 611,95
s03 Other Agriculture 82,98 92,05 101,53 83,10 82,98 50,98 78,81 65,92 51,11 50,98
s04 Food 80,91 66,74 104,05 86,12 80,94 40,87 57,81 58,79 44,93 40,89
s05 Beverage & Tobacco 47,98 30,25 55,29 48,60 48,00 34,28 28,82 40,84 34,85 34,30
s06 Primary 60,84 35,36 150,70 68,94 60,80 60,11 34,29 149,41 68,09 60,08
s07 Textile 182,95 95,82 317,83 200,14 183,22 96,07 62,19 185,81 106,88 96,25
s08 Leather & Clothing 210,70 92,96 338,76 223,75 211,09 93,73 49,97 172,19 101,25 93,96
s09 Chemicals 65,54 36,20 111,94 84,27 65,59 50,22 24,97 92,32 67,13 50,26
s10 Metals 9,52 44,50 17,13 17,75 9,68 6,62 34,87 13,58 14,60 6,77
s11 Cars & Trucks 131,57 216,99 147,35 203,32 131,97 50,38 200,75 62,56 96,70 50,63
s12 Planes Ships Bikes Trains 18,32 34,01 52,12 10,73 18,50 21,91 27,84 55,41 13,99 22,09
s13 Electronic equipment 6,76 26,16 9,54 10,28 6,84 3,40 23,56 5,77 6,83 3,48
s14 Machinery 9,09 48,25 13,35 16,73 9,24 7,46 34,38 11,08 14,88 7,59
s15 Other Manufactured products 31,65 21,99 51,39 43,38 31,67 26,78 18,09 45,75 38,04 26,80
s16 Trade -1,58 22,24 -0,87 -3,13 -1,53 -0,81 9,79 -0,24 -2,38 -0,77
s17 Sea Transport 1,82 2,53 2,75 1,08 1,86 -0,24 -0,04 0,58 -0,97 -0,21
s18 Air Transport -0,31 3,36 0,76 -1,31 -0,28 -0,23 0,26 0,73 -1,22 -0,19
s19 Other Transport -0,98 5,21 0,36 -2,14 -0,96 -0,40 0,32 0,80 -1,59 -0,38
s20 Communication -2,41 19,01 -1,52 -3,85 -2,41 -1,38 3,05 -0,58 -2,82 -1,39
s21 Finance -2,80 31,47 -2,14 -4,46 -2,81 -1,66 16,67 -1,11 -3,34 -1,68
s22 Insurance -3,67 20,78 -3,66 -5,94 -3,61 -2,26 11,31 -2,42 -4,56 -2,20
s23 Business services -3,28 16,57 -2,52 -5,19 -3,36 -1,93 8,79 -1,32 -3,87 -2,01
s24 Recreation & related Services -0,63 1,38 0,94 -1,85 -0,59 -0,16 0,67 1,29 -1,39 -0,12
s25 Admin Defence Health Education -3,96 20,75 -3,96 -6,43 -3,93 -2,39 0,73 -2,59 -4,91 -2,37
s26 Other Services -1,56 42,55 -0,11 -2,90 -1,52 -0,72 18,28 0,61 -2,08 -0,68
TOTAL 38,39 22,00 51,63 55,31 38,55 23,06 12,95 35,04 38,50 23,20

121
Table A3.11: Effects on bilateral trade values (billion euros, intra-EU trade excluded)
Table A3.12: Effects on sectoral bilateral trade EU-KOREA: (billion euros)
Central S1 S2 S3 S4
Baseline 1 Baseline 2 Baseline 1 Baseline 2 Baseline 1 Baseline 2 Baseline 1 Baseline 2 Baseline 1 Baseline 2
EU Exports to Korea 41,08 33,02 17,64 14,16 74,03 66,20 47,80 39,45 41,66 33,60
EU Imports from Korea 34,41 22,95 17,82 11,19 46,47 35,04 49,46 38,15 34,56 23,09
EU Trade balance with Korea 6,68 10,08 -0,18 2,97 27,56 31,16 -1,66 1,30 7,11 10,52
EU EXPORTS Baseline 1 Baseline 2
Central S1 S2 S3 S4 Central S1 S2 S3 S4
a1 Agriculture 8,48 3,27 10,47 9,53 8,48 6,82 2,70 8,72 7,74 6,82
a2 NAMA 30,71 13,54 61,68 36,23 30,70 25,36 11,08 56,64 30,73 25,35
a3 Services 1,89 0,83 1,87 2,04 2,48 0,84 0,38 0,83 0,99 1,43
s01 Meat & Animal products 2,02 0,66 2,21 2,06 2,02 1,32 0,49 1,48 1,35 1,32
s02 Dairy 1,63 0,44 1,70 1,67 1,63 1,39 0,38 1,46 1,42 1,39
s03 Other Agriculture 0,58 0,20 0,63 0,61 0,58 0,53 0,18 0,58 0,56 0,53
s04 Food 1,16 0,42 1,26 1,31 1,16 1,02 0,37 1,11 1,16 1,02
s05 Beverage & Tobacco 0,32 0,14 0,34 0,34 0,32 0,31 0,13 0,33 0,33 0,31
s06 Primary 0,39 0,13 0,69 0,82 0,39 0,30 0,11 0,53 0,63 0,30
s07 Textile 0,64 0,32 0,91 0,72 0,64 0,48 0,24 0,75 0,56 0,48
s08 Leather & Clothing 1,43 0,74 1,87 1,58 1,43 0,87 0,45 1,27 1,00 0,87
s09 Chemicals 6,38 2,45 9,03 7,93 6,38 4,72 1,79 7,25 6,17 4,72
s10 Metals 1,72 0,95 2,73 2,00 1,72 1,47 0,79 2,49 1,74 1,47
s11 Cars & Trucks 8,53 3,89 29,20 9,52 8,53 8,29 3,75 29,41 9,31 8,29
s12 Planes Ships Bikes Trains 0,45 0,28 0,73 0,54 0,45 0,40 0,24 0,67 0,48 0,39
s13 Electronic equipment 1,61 0,81 3,25 1,86 1,61 1,54 0,75 3,22 1,80 1,54
s14 Machinery 5,88 3,73 8,36 6,96 5,88 4,76 2,93 7,29 5,83 4,76
s15 Other Manufactured products 5,47 1,28 8,30 6,84 5,47 4,60 1,07 7,37 5,92 4,61
s16 Trade 0,38 0,20 0,37 0,40 0,38 0,19 0,10 0,19 0,21 0,19
s17 Sea Transport 0,41 0,09 0,41 0,42 0,42 -0,02 -0,00 -0,03 -0,02 -0,02
s18 Air Transport 0,28 0,09 0,28 0,30 0,28 -0,01 0,01 -0,01 0,01 -0,01
s19 Other Transport 0,15 0,05 0,14 0,16 0,15 -0,00 0,00 -0,01 0,01 -0,00
s20 Communication 0,04 0,02 0,04 0,04 0,05 0,01 0,00 0,01 0,01 0,02
s21 Finance 0,10 0,06 0,10 0,10 0,14 0,06 0,03 0,06 0,06 0,11
s22 Insurance 0,28 0,07 0,28 0,29 0,42 0,17 0,04 0,17 0,18 0,31
s23 Business services 1,05 0,51 1,04 1,13 1,44 0,61 0,29 0,60 0,69 1,00
s24 Recreation & related Services 0,01 0,01 0,00 0,02 0,01 0,00 0,00 -0,00 0,01 0,00
s25 Admin Defence Health Education 0,14 0,07 0,14 0,15 0,14 0,00 0,00 0,00 0,01 0,00
s26 Other Services 0,02 0,01 0,02 0,02 0,02 0,01 0,01 0,01 0,01 0,01
TOTAL 41,08 17,64 74,03 47,80 41,66 33,02 14,16 66,20 39,45 33,60
EU IMPORTS Baseline 1 Baseline 2
Central S1 S2 S3 S4 Central S1 S2 S3 S4
a1 Agriculture 4,74 1,83 8,21 5,45 4,75 3,87 1,40 7,47 4,57 3,89
a2 NAMA 29,75 16,04 38,32 44,15 29,89 19,12 9,81 27,59 33,68 19,25
a3 Services -0,09 -0,05 -0,06 -0,14 -0,09 -0,05 -0,02 -0,02 -0,10 -0,05
s01 Meat & Animal products 0,00 0,00 0,00 0,00 0,00 0,00 0,00 0,00 0,00 0,00
s02 Dairy 0,01 0,00 0,02 0,01 0,01 0,01 0,00 0,01 0,01 0,01
s03 Other Agriculture 0,02 0,01 0,02 0,02 0,02 0,01 0,00 0,02 0,01 0,01
s04 Food 0,09 0,04 0,11 0,09 0,09 0,06 0,02 0,08 0,06 0,06
s05 Beverage & Tobacco 0,00 0,00 0,00 0,00 0,00 0,00 0,00 0,00 0,00 0,00
s06 Primary 0,01 0,00 0,02 0,01 0,01 0,01 0,00 0,02 0,01 0,01
s07 Textile 4,25 1,57 7,39 4,65 4,26 3,54 1,22 6,83 3,93 3,54
s08 Leather & Clothing 1,21 0,48 1,94 1,28 1,21 0,84 0,31 1,55 0,91 0,85
s09 Chemicals 1,27 0,59 2,17 1,63 1,27 1,08 0,47 1,98 1,44 1,08
s10 Metals 0,36 0,20 0,64 0,66 0,36 0,24 0,15 0,50 0,54 0,25
s11 Cars & Trucks 21,93 12,33 24,56 33,89 22,00 13,27 6,83 16,46 25,47 13,34
s12 Planes Ships Bikes Trains 1,38 0,74 3,93 0,81 1,39 1,43 0,86 3,64 0,92 1,45
s13 Electronic equipment 2,21 0,93 3,13 3,37 2,24 1,11 0,49 1,88 2,23 1,13
s14 Machinery 1,67 0,91 2,45 3,07 1,70 1,31 0,79 1,95 2,62 1,34
s15 Other Manufactured products 0,09 0,08 0,15 0,12 0,09 0,08 0,07 0,14 0,11 0,08
s16 Trade -0,01 -0,01 -0,01 -0,02 -0,01 -0,00 -0,00 -0,00 -0,01 -0,00
s17 Sea Transport 0,01 0,00 0,01 0,00 0,01 -0,00 -0,00 0,00 -0,00 -0,00
s18 Air Transport -0,00 -0,00 0,01 -0,01 -0,00 -0,00 -0,00 0,00 -0,01 -0,00
s19 Other Transport -0,00 -0,00 0,00 -0,00 -0,00 -0,00 -0,00 0,00 -0,00 -0,00
s20 Communication -0,01 -0,00 -0,00 -0,01 -0,01 -0,00 -0,00 -0,00 -0,01 -0,00
s21 Finance -0,02 -0,01 -0,02 -0,03 -0,02 -0,01 -0,00 -0,01 -0,02 -0,01
s22 Insurance -0,00 -0,00 -0,00 -0,00 -0,00 -0,00 -0,00 -0,00 -0,00 -0,00
s23 Business services -0,05 -0,03 -0,04 -0,09 -0,06 -0,03 -0,02 -0,02 -0,06 -0,03
s24 Recreation & related Services -0,00 -0,00 0,00 -0,00 -0,00 -0,00 -0,00 0,00 -0,00 -0,00
s25 Admin Defence Health Education -0,00 -0,00 -0,00 -0,00 -0,00 -0,00 -0,00 -0,00 -0,00 -0,00
s26 Other Services -0,00 -0,00 -0,00 -0,00 -0,00 -0,00 -0,00 0,00 -0,00 -0,00
TOTAL 34,41 17,82 46,47 49,46 34,56 22,95 11,19 35,04 38,15 23,09

122
Table A3.13: Effects on sectoral employment: European Union
EU TRADE BALANCE Baseline 1 Baseline 2
Central S1 S2 S3 S4 Central S1 S2 S3 S4
a1 Agriculture 3,74 1,44 2,27 4,07 3,73 2,95 1,30 1,25 2,25 2,94
a2 NAMA 0,96 -2,50 23,36 -7,92 0,81 6,24 1,26 29,05 -8,33 6,10
a3 Services 1,97 0,88 1,93 2,19 2,57 0,89 0,41 0,86 1,54 1,48
s01 Meat & Animal products 2,02 0,66 2,21 2,06 2,02 1,32 0,49 1,48 1,32 1,32
s02 Dairy 1,62 0,44 1,68 1,66 1,62 1,38 0,38 1,44 1,38 1,38
s03 Other Agriculture 0,57 0,19 0,61 0,60 0,57 0,52 0,18 0,56 0,52 0,52
s04 Food 1,08 0,38 1,15 1,22 1,08 0,96 0,35 1,03 0,95 0,96
s05 Beverage & Tobacco 0,32 0,14 0,33 0,34 0,32 0,31 0,13 0,32 0,31 0,31
s06 Primary 0,38 0,13 0,67 0,81 0,38 0,29 0,11 0,51 0,29 0,29
s07 Textile -3,61 -1,25 -6,47 -3,93 -3,62 -3,05 -0,99 -6,08 -3,45 -3,06
s08 Leather & Clothing 0,23 0,26 -0,07 0,30 0,22 0,03 0,14 -0,28 -0,04 0,02
s09 Chemicals 5,11 1,87 6,86 6,30 5,11 3,64 1,31 5,27 3,28 3,64
s10 Metals 1,37 0,74 2,09 1,33 1,36 1,23 0,65 1,98 0,93 1,22
s11 Cars & Trucks -13,39 -8,44 4,64 -24,37 -13,47 -4,98 -3,09 12,95 -17,18 -5,05
s12 Planes Ships Bikes Trains -0,93 -0,46 -3,20 -0,27 -0,94 -1,04 -0,62 -2,96 -0,52 -1,05
s13 Electronic equipment -0,61 -0,12 0,12 -1,51 -0,64 0,43 0,26 1,34 -0,68 0,41
s14 Machinery 4,21 2,82 5,91 3,88 4,18 3,45 2,14 5,34 2,13 3,42
s15 Other Manufactured products 5,38 1,20 8,16 6,72 5,38 4,52 1,00 7,23 4,49 4,52
s16 Trade 0,39 0,21 0,38 0,42 0,39 0,19 0,10 0,19 0,20 0,19
s17 Sea Transport 0,41 0,09 0,40 0,42 0,41 -0,02 -0,00 -0,03 -0,02 -0,02
s18 Air Transport 0,29 0,09 0,27 0,31 0,28 -0,01 0,01 -0,02 -0,00 -0,01
s19 Other Transport 0,15 0,05 0,14 0,17 0,15 -0,00 0,00 -0,01 -0,00 -0,00
s20 Communication 0,04 0,02 0,04 0,05 0,06 0,01 0,00 0,01 0,03 0,02
s21 Finance 0,12 0,06 0,11 0,13 0,16 0,07 0,04 0,07 0,13 0,12
s22 Insurance 0,28 0,07 0,28 0,29 0,42 0,17 0,04 0,17 0,31 0,31
s23 Business services 1,10 0,54 1,08 1,22 1,50 0,64 0,31 0,62 1,06 1,03
s24 Recreation & related Services 0,01 0,01 0,00 0,02 0,01 0,00 0,00 -0,00 0,01 0,00
s25 Admin Defence Health Education 0,14 0,07 0,14 0,16 0,14 0,00 0,00 0,01 0,01 0,00
s26 Other Services 0,02 0,01 0,02 0,02 0,02 0,01 0,01 0,01 0,01 0,01
TOTAL 6,68 -0,18 27,56 -1,66 7,11 10,08 2,97 31,16 -4,54 10,52
EU skilled Baseline 1 Baseline 2 share in
Central S1 S2 S3 S4 Central S1 S2 S3 S4 total empl.
s01 Meat & Animal products 0,93 0,33 0,90 0,98 0,92 0,56 0,23 0,48 0,61 0,56 0,2%
s02 Dairy 0,66 0,19 0,63 0,70 0,66 0,52 0,15 0,47 0,56 0,52 0,3%
s03 Other Agriculture 0,11 0,06 -0,01 0,16 0,11 0,07 0,04 -0,06 0,12 0,07 0,3%
s04 Food 0,16 0,06 0,12 0,19 0,16 0,13 0,05 0,08 0,16 0,13 0,8%
s05 Beverage & Tobacco 0,13 0,06 0,09 0,15 0,13 0,12 0,05 0,08 0,14 0,12 0,1%
s06 Primary -0,02 -0,00 -0,08 -0,00 -0,02 -0,03 -0,02 -0,10 -0,02 -0,03 0,3%
s07 Textile -2,25 -0,76 -4,35 -2,30 -2,27 -2,10 -0,70 -4,44 -2,13 -2,12 0,2%
s08 Leather & Clothing 0,02 0,11 -0,39 0,17 0,01 -0,11 0,02 -0,58 0,05 -0,12 0,2%
s09 Chemicals 0,19 0,08 0,11 0,31 0,18 0,09 0,04 -0,01 0,20 0,08 2,6%
s10 Metals 0,04 0,06 0,19 -0,00 0,03 0,09 0,06 0,25 0,05 0,08 1,5%
s11 Cars & Trucks -1,42 -0,83 0,94 -2,66 -1,43 -0,42 -0,25 2,03 -1,68 -0,44 1,3%
s12 Planes Ships Bikes Trains -0,38 -0,06 -2,13 0,31 -0,40 -0,65 -0,33 -2,24 -0,00 -0,67 0,4%
s13 Electronic equipment 0,06 0,12 -0,26 0,24 0,04 0,04 0,06 -0,24 0,22 0,02 0,7%
s14 Machinery 0,30 0,28 0,17 0,41 0,29 0,20 0,16 0,08 0,30 0,18 3,6%
s15 Other Manufactured products 0,18 0,05 0,21 0,25 0,17 0,13 0,04 0,16 0,20 0,13 2,7%
s16 Trade -0,00 -0,00 -0,01 -0,01 -0,01 -0,00 0,00 -0,01 -0,00 -0,00 8,3%
s17 Sea Transport 0,33 0,17 0,36 0,38 0,32 0,07 0,04 0,10 0,13 0,07 0,3%
s18 Air Transport 0,12 0,09 0,02 0,17 0,12 -0,05 -0,01 -0,16 -0,01 -0,06 0,2%
s19 Other Transport 0,08 0,04 0,09 0,10 0,07 0,03 0,02 0,05 0,06 0,03 2,6%
s20 Communication -0,00 -0,00 -0,04 0,01 0,00 -0,02 -0,01 -0,06 -0,01 -0,01 2,5%
s21 Finance -0,01 -0,01 -0,07 0,00 0,00 -0,02 -0,01 -0,09 -0,01 -0,01 4,1%
s22 Insurance 0,03 0,00 -0,07 0,05 0,06 -0,01 -0,01 -0,10 0,01 0,02 1,7%
s23 Business services 0,00 -0,00 -0,03 0,01 0,01 -0,01 -0,01 -0,04 0,00 0,00 15,4%
s24 Recreation & related Services -0,03 -0,02 -0,06 -0,01 -0,03 -0,02 -0,01 -0,06 -0,01 -0,03 4,5%
s25 Admin Defence Health Education -0,01 -0,01 -0,02 -0,01 -0,01 -0,01 -0,01 -0,01 -0,01 -0,01 40,1%
s26 Other Services 0,01 0,00 0,03 0,01 0,01 0,01 0,01 0,03 0,01 0,01 5,0%

123
Table A3.14: Effects on sectoral employment: Korea (%)
EU unskilled Baseline 1 Baseline 2 share in
Central S1 S2 S3 S4 Central S1 S2 S3 S4 total empl.
s01 Meat & Animal products 0,99 0,34 0,95 1,04 0,98 0,60 0,24 0,51 0,65 0,60 0,7%
s02 Dairy 0,74 0,20 0,69 0,77 0,74 0,58 0,16 0,52 0,62 0,58 0,9%
s03 Other Agriculture 0,12 0,05 -0,01 0,17 0,12 0,07 0,03 -0,08 0,12 0,07 2,8%
s04 Food 0,17 0,05 0,12 0,20 0,17 0,13 0,04 0,08 0,16 0,13 1,8%
s05 Beverage & Tobacco 0,14 0,05 0,08 0,16 0,14 0,12 0,05 0,06 0,14 0,13 0,3%
s06 Primary -0,02 -0,01 -0,10 -0,01 -0,02 -0,04 -0,03 -0,12 -0,03 -0,04 0,4%
s07 Textile -2,30 -0,77 -4,46 -2,34 -2,31 -2,17 -0,71 -4,59 -2,20 -2,19 0,5%
s08 Leather & Clothing 0,06 0,12 -0,36 0,22 0,05 -0,09 0,02 -0,57 0,08 -0,10 0,7%
s09 Chemicals 0,20 0,08 0,11 0,32 0,19 0,09 0,04 -0,01 0,21 0,09 3,2%
s10 Metals 0,03 0,05 0,17 -0,02 0,02 0,08 0,06 0,23 0,04 0,07 3,1%
s11 Cars & Trucks -1,50 -0,87 0,90 -2,79 -1,51 -0,47 -0,27 2,03 -1,77 -0,48 2,4%
s12 Planes Ships Bikes Trains -0,38 -0,05 -2,19 0,33 -0,41 -0,66 -0,33 -2,29 0,01 -0,68 0,7%
s13 Electronic equipment 0,07 0,12 -0,27 0,26 0,05 0,05 0,06 -0,25 0,24 0,03 0,9%
s14 Machinery 0,30 0,28 0,15 0,40 0,28 0,19 0,16 0,06 0,29 0,17 4,4%
s15 Other Manufactured products 0,18 0,04 0,21 0,26 0,18 0,13 0,03 0,15 0,20 0,13 5,4%
s16 Trade -0,01 -0,00 -0,04 -0,00 -0,01 -0,01 -0,01 -0,04 -0,00 -0,01 15,8%
s17 Sea Transport 0,32 0,17 0,29 0,40 0,32 0,05 0,02 0,02 0,13 0,05 0,6%
s18 Air Transport 0,12 0,09 -0,03 0,18 0,11 -0,07 -0,02 -0,22 -0,01 -0,07 0,5%
s19 Other Transport 0,07 0,04 0,07 0,11 0,07 0,02 0,01 0,02 0,06 0,02 5,0%
s20 Communication -0,01 -0,00 -0,07 0,01 -0,00 -0,03 -0,02 -0,09 -0,01 -0,02 1,6%
s21 Finance -0,01 -0,00 -0,08 0,01 0,00 -0,03 -0,01 -0,10 -0,01 -0,02 2,7%
s22 Insurance 0,02 0,00 -0,07 0,06 0,06 -0,01 -0,01 -0,11 0,02 0,02 1,1%
s23 Business services -0,00 -0,00 -0,06 0,01 0,01 -0,02 -0,01 -0,08 -0,00 -0,01 9,0%
s24 Recreation & related Services -0,03 -0,02 -0,07 -0,01 -0,03 -0,03 -0,02 -0,07 -0,01 -0,03 2,8%
s25 Admin Defence Health Education -0,01 -0,01 -0,02 -0,00 -0,01 -0,01 -0,01 -0,02 -0,00 -0,01 24,7%
s26 Other Services 0,00 -0,00 -0,01 0,01 0,00 -0,00 -0,00 -0,01 0,01 0,00 8,2%
KOREA skilled Baseline 1 Baseline 2 share in
Central S1 S2 S3 S4 Central S1 S2 S3 S4 total empl.
s01 Meat & Animal products -9,41 -2,62 -9,50 -9,75 -9,39 -4,70 -1,74 -4,41 -5,14 -4,68 0,1%
s02 Dairy -22,74 -5,08 -23,63 -23,18 -22,72 -18,23 -4,30 -19,05 -18,67 -18,21 0,1%
s03 Other Agriculture -1,26 -0,57 -1,08 -1,66 -1,25 -0,86 -0,40 -0,67 -1,27 -0,85 0,1%
s04 Food -3,05 -0,80 -3,24 -3,54 -3,03 -2,33 -0,68 -2,49 -2,83 -2,32 0,4%
s05 Beverage & Tobacco -0,84 -0,04 -0,90 -0,83 -0,82 -0,85 -0,08 -0,90 -0,84 -0,83 0,1%
s06 Primary -0,80 -0,84 -1,15 -1,28 -0,80 -0,54 -0,53 -0,91 -1,02 -0,53 0,1%
s07 Textile 34,85 16,33 62,55 35,10 34,97 24,35 11,71 48,02 23,82 24,45 0,3%
s08 Leather & Clothing 11,52 3,93 21,90 10,32 11,61 9,99 3,26 20,72 8,51 10,09 0,2%
s09 Chemicals -0,79 -0,23 -1,28 -1,13 -0,74 -0,57 -0,22 -0,90 -0,95 -0,52 1,4%
s10 Metals -2,43 -1,67 -3,12 -3,43 -2,32 -1,99 -1,16 -2,93 -3,03 -1,88 2,9%
s11 Cars & Trucks 22,40 14,18 10,69 36,79 22,57 9,80 6,14 1,59 22,43 9,95 2,4%
s12 Planes Ships Bikes Trains 0,87 -0,74 13,05 -5,23 1,01 3,99 2,07 15,50 -2,45 4,12 1,0%
s13 Electronic equipment -2,01 -1,43 -0,68 -3,86 -1,94 -1,08 -0,66 -0,07 -3,00 -1,01 3,2%
s14 Machinery -3,33 -2,51 -2,87 -5,00 -3,24 -2,19 -1,41 -2,07 -4,03 -2,10 0,4%
s15 Other Manufactured products -1,61 -0,17 -2,68 -1,96 -1,59 -1,40 -0,24 -2,40 -1,75 -1,37 0,1%
s16 Trade 0,15 0,16 0,15 0,28 0,18 0,10 0,09 0,11 0,22 0,12 0,1%
s17 Sea Transport -0,06 -0,09 0,13 -0,56 -0,04 -0,19 -0,38 -0,06 -0,70 -0,17 0,3%
s18 Air Transport -1,12 -0,72 -0,69 -1,82 -1,09 -0,24 -0,31 0,10 -0,97 -0,21 0,2%
s19 Other Transport -0,22 -0,10 0,09 -0,37 -0,19 -0,03 -0,04 0,27 -0,20 -0,00 2,4%
s20 Communication -0,56 -0,35 -0,62 -0,70 -0,59 -0,36 -0,23 -0,41 -0,50 -0,39 2,5%
s21 Finance -0,50 -0,41 -0,65 -0,63 -0,54 -0,35 -0,29 -0,49 -0,48 -0,40 4,4%
s22 Insurance -0,97 -0,36 -1,03 -1,07 -1,33 -0,62 -0,24 -0,67 -0,74 -0,97 2,8%
s23 Business services -1,31 -0,83 -1,26 -1,74 -1,49 -0,83 -0,51 -0,81 -1,27 -1,01 9,9%
s24 Recreation & related Services 0,27 0,29 0,57 0,33 0,28 0,19 0,18 0,50 0,25 0,20 3,4%
s25 Admin Defence Health Education -0,17 -0,13 -0,23 -0,21 -0,15 -0,11 -0,09 -0,17 -0,16 -0,09 40,4%
s26 Other Services 0,51 0,47 0,82 0,79 0,53 0,36 0,29 0,70 0,63 0,38 6,4%

124
Table A3.15: Other results
KOREA unskilled Baseline 1 Baseline 2 share in
Central S1 S2 S3 S4 Central S1 S2 S3 S4 total empl.
s01 Meat & Animal products -10,19 -3,02 -10,48 -10,69 -10,18 -5,24 -2,02 -5,17 -5,84 -5,23 0,2%
s02 Dairy -24,80 -5,62 -25,83 -25,36 -24,79 -20,06 -4,74 -21,05 -20,62 -20,05 0,2%
s03 Other Agriculture -1,93 -1,12 -2,05 -2,60 -1,92 -1,33 -0,76 -1,47 -2,02 -1,33 2,2%
s04 Food -3,53 -1,11 -3,86 -4,16 -3,52 -2,68 -0,88 -3,01 -3,32 -2,67 0,4%
s05 Beverage & Tobacco -1,35 -0,44 -1,62 -1,54 -1,35 -1,22 -0,34 -1,51 -1,42 -1,21 0,2%
s06 Primary -1,38 -1,32 -1,98 -2,09 -1,38 -0,94 -0,84 -1,61 -1,67 -0,95 0,2%
s07 Textile 35,13 16,23 63,09 35,16 35,24 24,26 11,57 47,90 23,50 24,35 0,7%
s08 Leather & Clothing 10,87 3,70 20,97 9,52 10,95 9,61 3,12 20,10 7,97 9,69 0,4%
s09 Chemicals -1,19 -0,54 -1,87 -1,66 -1,15 -0,87 -0,42 -1,39 -1,38 -0,83 1,4%
s10 Metals -2,86 -2,04 -3,70 -4,05 -2,76 -2,29 -1,39 -3,40 -3,52 -2,19 4,2%
s11 Cars & Trucks 22,42 14,04 10,54 36,75 22,57 9,76 6,05 1,38 22,32 9,90 3,3%
s12 Planes Ships Bikes Trains 0,38 -1,09 12,41 -5,91 0,51 3,64 1,84 14,99 -3,01 3,76 1,4%
s13 Electronic equipment -2,58 -1,87 -1,48 -4,65 -2,52 -1,50 -0,94 -0,74 -3,64 -1,44 3,4%
s14 Machinery -3,74 -2,83 -3,40 -5,56 -3,65 -2,48 -1,61 -2,50 -4,48 -2,39 8,7%
s15 Other Manufactured products -2,06 -0,43 -3,32 -2,54 -2,04 -1,73 -0,41 -2,93 -2,22 -1,72 1,6%
s16 Trade -0,26 -0,15 -0,42 -0,28 -0,24 -0,20 -0,10 -0,37 -0,23 -0,18 10,1%
s17 Sea Transport -0,52 -0,45 -0,51 -1,20 -0,50 -0,52 -0,61 -0,59 -1,21 -0,51 0,2%
s18 Air Transport -1,56 -1,07 -1,31 -2,44 -1,55 -0,56 -0,53 -0,42 -1,47 -0,55 0,3%
s19 Other Transport -0,59 -0,36 -0,41 -0,87 -0,57 -0,30 -0,21 -0,15 -0,60 -0,28 4,0%
s20 Communication -1,02 -0,70 -1,26 -1,33 -1,06 -0,69 -0,45 -0,95 -1,01 -0,73 1,8%
s21 Finance -0,91 -0,71 -1,21 -1,19 -0,97 -0,65 -0,48 -0,96 -0,93 -0,70 3,4%
s22 Insurance -1,15 -0,41 -1,21 -1,27 -1,53 -0,76 -0,27 -0,82 -0,90 -1,12 2,6%
s23 Business services -1,68 -1,08 -1,75 -2,23 -1,88 -1,10 -0,67 -1,22 -1,66 -1,29 7,9%
s24 Recreation & related Services 0,02 0,16 0,27 0,02 0,01 0,01 0,10 0,25 0,00 0,00 3,0%
s25 Admin Defence Health Education -0,23 -0,04 -0,20 -0,21 -0,22 -0,17 -0,03 -0,14 -0,16 -0,16 25,5%
s26 Other Services 0,01 0,06 0,09 0,08 0,02 -0,00 0,03 0,09 0,06 0,01 0,0%
EUROPEAN UNION Baseline 1 Baseline 2
Central S1 S2 S3 S4 Central S1 S2 S3 S4
Real effective exchange rate 0,05 0,01 0,19 0,00 0,05 0,07 0,04 0,21 0,02 0,07
Real return to capital 0,10 0,04 0,21 0,07 0,11 0,09 0,04 0,19 0,06 0,09
Skilled real wages 0,04 0,03 0,14 0,04 0,04 0,05 0,04 0,15 0,05 0,05
Tariff revenue (points of GDP) -0,00 -0,00 -0,00 -0,00 -0,02 -0,00 -0,00 -0,00 -0,00 -0,01
Unskilled real wages 0,03 0,02 0,12 0,03 0,03 0,04 0,03 0,13 0,04 0,04
KOREA Baseline 1 Baseline 2
Central S1 S2 S3 S4 Central S1 S2 S3 S4
Real effective exchange rate 0,46 0,54 0,22 0,87 0,45 0,24 0,26 0,02 0,65 0,23
Real return to capital 0,22 0,03 0,10 0,07 0,23 0,15 0,04 -0,00 -0,00 0,17
Skilled real wages 1,79 1,76 2,76 2,57 1,79 1,23 1,15 2,23 2,01 1,24
Tariff revenue (points of GDP) -0,03 -0,02 -0,03 -0,03 -0,26 -0,02 -0,01 -0,02 -0,02 -0,19
Unskilled real wages 1,66 1,48 2,41 2,28 1,67 1,15 0,97 1,94 1,77 1,17

125
Appendix 4.1: Data and Data Sources for Empirical Modeling on Auto Sector
Korean Import Data
Korean automobile import data comes from the United Nations COMTRADE dataset. Import
data are provided at the six digit level for the years 2007 and 2008 according to the HS 2007
system of industrial classification. Data is provided for the following industries:
870310 - Vehicles (excl. of 87.02) principally designed for the transport of persons, specially
designed for travelling on snow; golf cars & similar vehicles
870321 - Vehicles (excl. of 87.02 & 8703.10) principally designed for the transport of
persons, with spark-ignition internal combustion reciprocating piston engine, of a cylinder
capacity not>1000cc
870322 - Vehicles (excl. of 87.02 & 8703.10) principally designed for the transport of
persons, with spark-ignition internal combustion reciprocating piston engine, of a cylinder
capacity >1000cc but not >1500cc
870323 - Vehicles (excl. of 87.02 & 8703.10) principally designed for the transport of
persons, with spark-ignition internal combustion reciprocating piston engine, of a cylinder
capacity >1500cc but not >3000cc
870324 - Vehicles (excl. of 87.02 & 8703.10) principally designed for the transport of
persons, with spark-ignition internal combustion reciprocating piston engine, of a cylinder
capacity >3000cc
870331 - Vehicles principally designed for the transport of persons (excl. of 87.02 & 8703.10-
8703.24), with C-I internal combustion piston engine (diesel/semi-diesel), of a cylinder
capacity not >1500cc
870332 - Vehicles principally designed for the transport of persons (excl. of 87.02 & 8703.10-
8703.24), with C-I internal combustion piston engine (diesel/semi-diesel), of a cylinder
capacity >1500cc but not >2500cc
870333 - Vehicles principally designed for the transport of persons (excl. of 87.02 & 8703.10-
8703.24), with C-I internal combustion piston engine (diesel/semi-diesel), of a cylinder
capacity >2500cc

126
870390 - Vehicles principally designed for the transport of persons (excl. of 87.02 & 8703.10-
8703.24), with C-I internal combustion piston engine (diesel/semi-diesel), n.e.s. in 87.03
A list of the partner countries is given in Table A1.1 along with the years they are present
(either 2007, 2008 or both).
Geographical Data
Information on the distance between trading partners comes from CEPII’s Distance dataset.
Tariff Data in the Korean Automobile Industry
Data on tariffs in the Korean automobile industry and in the other destination countries in the
alternative trade (EU export) model come from the World Trade Organisation’s
comprehensive tariff dataset. This is available for the years 2006, 2007 and 2008 and is
classified according to the HS 2007 6 digit system of classification for 2007 and 2008 and the
HS 2002 version for 2006 (identical).
National Endowments
Data on physical capital and the number of workers in the national labour force come from
Antweiler and Trefler (2002). The most recent year available is 1992. Human capital
endowments are taken from the latest version of the Barro and Lee (1993) dataset. They are
calculated using the percentage of children completing primary, secondary and higher
education in 1999.
Import Demand Elasticities
From Kee et al. (2005a) or adapted from related work undertaken by the EU.
Incidence of Non-Tariff Barriers
Given the assessment in section 4 of this chapter about the limited penetration of Korean car
market in the small and medium empire size categories, the incidence of NTBs in a particular
category (D=1 for the presence of binding NTBs and D=0 for NTBs being absent or non-
binding) of Korean imports was set as follows:
D=1 (HS870321; HS870322; HS870323; HS870331; HS870332)
D=0 otherwise

127
For that part of the modelling using EU automobile exports as the dependent variable the
incidence of NTBs (D=1) in other than the Korean market was identified by those country-
product combinations where Kee et al (2005b) identify a positive tariff-equivalent, otherwise
D was set to zero.

128
Table A1.1: Country and Year Coverage
Partner Year Coverage
Algeria 2008Areas, nes 2008Australia 2007, 2008Austria 2007, 2008Bahrain 2008Belgium 2007, 2008Brazil 2008Canada 2007, 2008China 2007, 2008China, Hong Kong SAR 2007, 2008Colombia 2008Czech Rep. 2008Denmark 2007, 2008Dominica 2008Dominican Rep. 2008Finland 2007, 2008France 2007, 2008Georgia 2008Germany 2007, 2008Guam 2007, 2008Guatemala 2007, 2008Hungary 2007, 2008India 2007, 2008Indonesia 2007, 2008Iran 2008Italy 2007, 2008Jamaica 2007Japan 2007, 2008Kuwait 2007, 2008Libya 2008Luxembourg 2007Malaysia 2007, 2008Mexico 2007, 2008Mongolia 2007N. Mariana Isds 2007Netherlands 2007, 2008New Zealand 2007, 2008Oman 2007, 2008Other Asia, nes 2007, 2008Pakistan 2007Panama 2007Philippines 2007, 2008Poland 2007, 2008Portugal 2007, 2008Qatar 2007, 2008Romania 2007Russian Federation 2007, 2008Saudi Arabia 2008Senegal 2008

129
Table A1.1 cont'd: Country and Year Coverage
Partner Year Coverage
Singapore 2008Slovakia 2007, 2008South Africa 2007Spain 2007, 2008Sweden 2007, 2008Switzerland 2007, 2008Thailand 2007, 2008Turkey 2007, 2008USA 2007, 2008Ukraine 2007, 2008United Arab Emirates 2007, 2008United Kingdom 2007, 2008Uzbekistan 2007, 2008Vanuatu 2007Venezuela 2007Viet Nam 2007, 2008World 2007, 2008

130
Appendix 4.2: Econometric Results for Auto Sector
Effect of NTBs on Korean Imports
In Tables A2.2A and A2.2B we report regressions for the imports of country j to Korea on
non-tariff barriers (NTBs), relative resource endowments and the natural logarithm of
distance. Relative physical and human capital endowments are calculated as:
EndowmentCapitalPartner
EndowmentCapitalKoreaRKEik __
__=
Table A2.2A: Korean Imports (Unitary elasticity value used to constrain dependent variable)
1 2
NTB Dummy -1.48*** -2.42**(-3.51) (-2.46)
Relative Physical Capital Endowment -52.84** -(-2.05)
Relative Human Capital Endowment -.91* -.80***(-1.95) (-4.67)
Distance -.20 -1.44***(-.65) (-5.30)
Year Dummies Yes YesCommodity Dummies No YesPartner Dummies No Yes
Number of Observations 233 233R2 .14 .66
Notes: Dependent variable is as shown in equation. Robust t-statistics are reported in parentheses. ***, ** and * indicate significance at the 1, 5 and 10 percent levels.
Although not reported in table A2.2A we also tested for variation in the intensity of the NBT
effects across different import sources, by including an EU dummy variable and interacting it
with the NTB dummy. This showed that the effect of NTBs on EU imports was no different
to that on imports from other sources.

131
Table A2.2B: Korean Imports (Alternative elasticity-value used to constrain dependent variable)
Regression1 2
NTB Dummy -1.48*** -2.42**(-3.51) (-2.46)
Relative Physical Capital Endowment -52.84** -(-2.05)
Relative Human Capital Endowment -.91* -.80***(-1.95) (-4.67)
Distance -.20 -1.44***(-.65) (-5.30)
Year Dummies Yes YesCommodity Dummies No YesPartner Dummies No Yes
Number of Observations 233 233R2 .14 .66
Notes: Dependent variable is as shown in equation 1. Robust t-statistics are reported in parentheses. ***, ** and * indicate significance at the 1, 5 and 10 percent levels.
In Table A2.2B we repeat the regressions in Table A2.2A but use an elasticity of import
demand of -2.20 used by the EU for their own modeling purposes to measure the dependent
variable (see eq. 1 in chapter 4). Despite the changes this has on the dependent variable the
coefficient point estimates are largely unchanged, and not identifiable at two decimal points.
Effect of NTBs on European Union Exports
We repeat the previous exercise but use European Union exports to alternative country
destinations (including Korea) as the dependent variable rather than Korean imports. The
dependent variable is aggregated to the EU level as are the relative capital and distance
variables. Regression 1 in Table A2.3A corresponds with regression 1 in Table A2.2A. We
now include an interaction term between the NTB dummy and a Korean import dummy, to
distinguish between the average effect of NTBs against EU exports across all countries given
by the coefficient on the coefficient on the NTB dummy variable only and the specific NTB
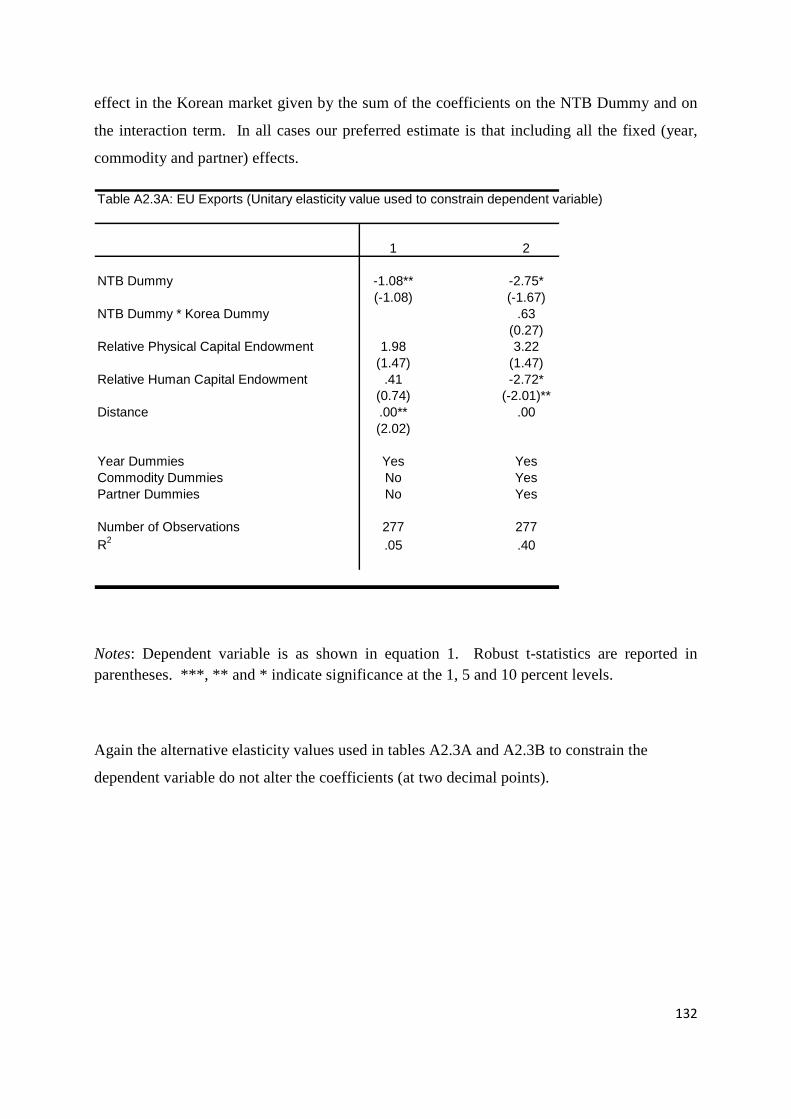
132
effect in the Korean market given by the sum of the coefficients on the NTB Dummy and on
the interaction term. In all cases our preferred estimate is that including all the fixed (year,
commodity and partner) effects.
Table A2.3A: EU Exports (Unitary elasticity value used to constrain dependent variable)
1 2
NTB Dummy -1.08** -2.75*(-1.08) (-1.67)
NTB Dummy * Korea Dummy .63(0.27)
Relative Physical Capital Endowment 1.98 3.22(1.47) (1.47)
Relative Human Capital Endowment .41 -2.72*(0.74) (-2.01)**
Distance .00** .00(2.02)
Year Dummies Yes YesCommodity Dummies No YesPartner Dummies No Yes
Number of Observations 277 277R2 .05 .40
Notes: Dependent variable is as shown in equation 1. Robust t-statistics are reported in parentheses. ***, ** and * indicate significance at the 1, 5 and 10 percent levels.
Again the alternative elasticity values used in tables A2.3A and A2.3B to constrain the
dependent variable do not alter the coefficients (at two decimal points).

133
Table A2.3B: EU Imports (Alternative elasticity value used to constrain dependent variable)
1 2
NTB Dummy -.96* -2.80*(-1.67) (-1.70)
NTB Dummy * Korea Dummy .64(0.28)
Relative Physical Capital Endowment 6.79*** 3.26(3.18) (1.44)
Relative Human Capital Endowment .79 -2.74*(1.12) (-1.93)
Distance .00** .00(2.33) (1.15)
Year Dummies Yes YesCommodity Dummies No YesPartner Dummies No Yes
Number of Observations 277 277R2 .11 .57
Notes: Dependent variable is as shown in equation 1. Robust t-statistics are reported in parentheses. ***, ** and * indicate significance at the 1, 5 and 10 percent levels.