final report - consortium for energy efficiency
TRANSCRIPT

Final Report
Evaluation of the Transition C&I Retrofit Programs
Prepared for: The Energy Trust of Oregon
June 16, 2004

Prepared by: Hossein Haeri Quantec, LLC
K:\Projects\2003-59 (ETO) Transition CI\Report\Final Report_061604_sd.doc
Quantec Offices6229 SE Milwaukie Ave.Portland, OR 97202503 228-2992503 228-3696 faxwww.quantecllc.com
Printed on recycled paper with soy-based inksPrinted on recycled paper with soy-based inks
Boulder, CO 80302303 998-0102303 998-1007 fax
Barrington, RI 02806(401) 289-0059(401) 289-0287 fax
Reedsburg, WI 53959(608) 524-4844(608) 524-6361 fax
Huntington Beach, CA 92646(714) 287-6521
1722 14th St., Suite 230 6 Ridgeland Rd 212 E Main St., Suite G 20022 Cove Circle

Acknowledgements
We wish to recognize the contributions of Rick Weijo, Mari Vanewettering, and Jim Cox at Portland General Electric and Don Jones at PacifiCorp in compiling the necessary documents and data for this evaluation. Without their generous support, this study would not have been possible.
quantec Evaluation of Transition C&I Programs – The Energy Trust of Oregon
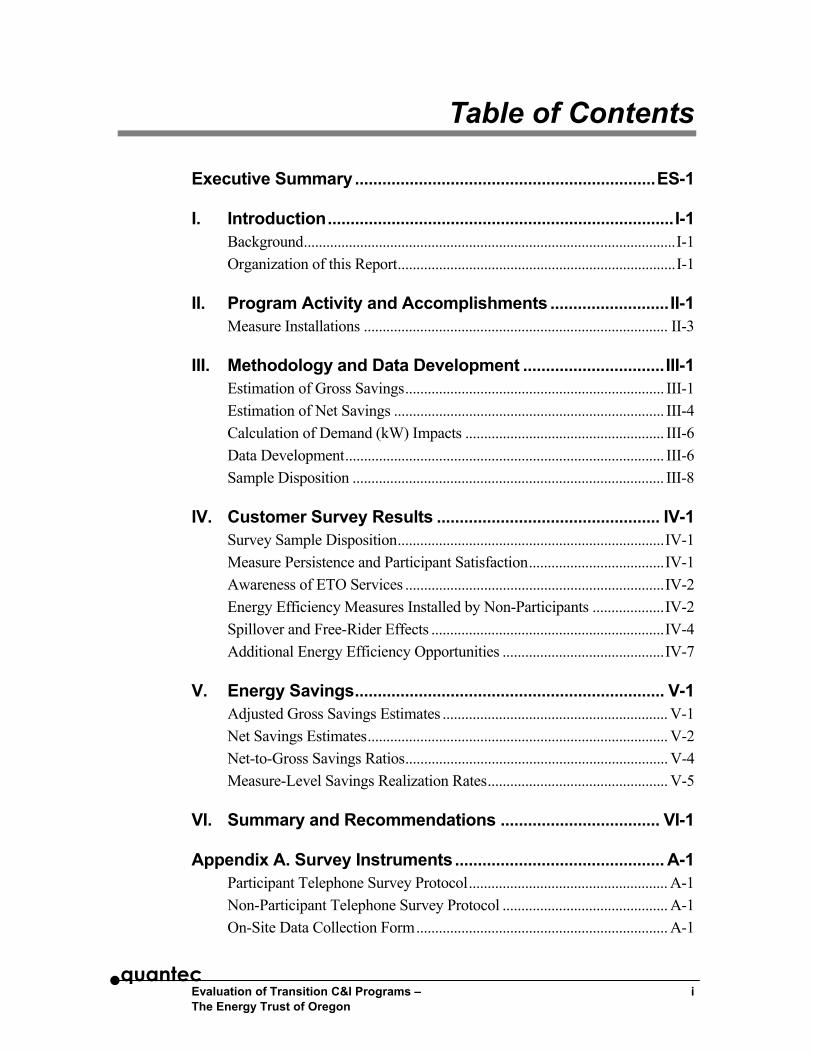
Table of Contents
Executive Summary..................................................................ES-1
I. Introduction............................................................................I-1 Background...................................................................................................I-1 Organization of this Report..........................................................................I-1
II. Program Activity and Accomplishments ..........................II-1 Measure Installations ................................................................................. II-3
III. Methodology and Data Development ...............................III-1 Estimation of Gross Savings..................................................................... III-1 Estimation of Net Savings ........................................................................ III-4 Calculation of Demand (kW) Impacts ..................................................... III-6 Data Development..................................................................................... III-6 Sample Disposition ................................................................................... III-8
IV. Customer Survey Results ................................................. IV-1 Survey Sample Disposition.......................................................................IV-1 Measure Persistence and Participant Satisfaction....................................IV-1 Awareness of ETO Services .....................................................................IV-2 Energy Efficiency Measures Installed by Non-Participants ...................IV-2 Spillover and Free-Rider Effects ..............................................................IV-4 Additional Energy Efficiency Opportunities ...........................................IV-7
V. Energy Savings.................................................................... V-1 Adjusted Gross Savings Estimates ............................................................ V-1 Net Savings Estimates................................................................................ V-2 Net-to-Gross Savings Ratios...................................................................... V-4 Measure-Level Savings Realization Rates................................................ V-5
VI. Summary and Recommendations ................................... VI-1
Appendix A. Survey Instruments.............................................. A-1 Participant Telephone Survey Protocol..................................................... A-1 Non-Participant Telephone Survey Protocol ............................................ A-1 On-Site Data Collection Form................................................................... A-1
quantec Evaluation of Transition C&I Programs – i The Energy Trust of Oregon
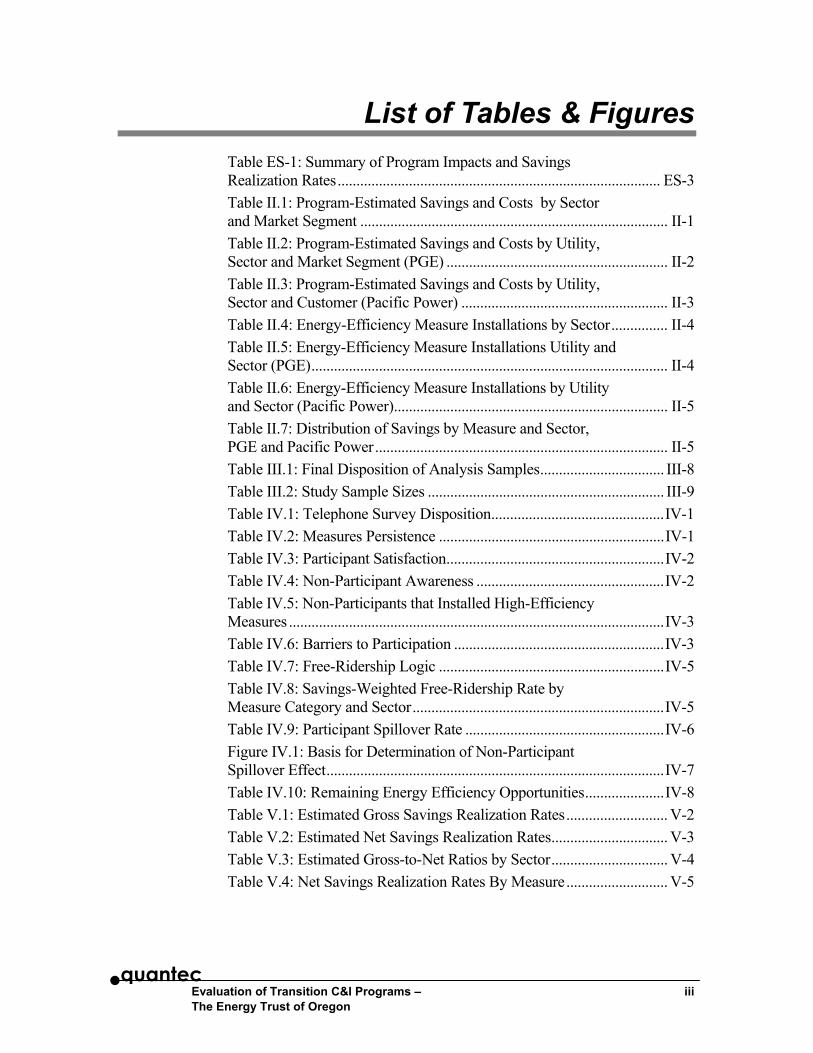
List of Tables & Figures Table ES-1: Summary of Program Impacts and Savings Realization Rates...................................................................................... ES-3 Table II.1: Program-Estimated Savings and Costs by Sector and Market Segment .................................................................................. II-1 Table II.2: Program-Estimated Savings and Costs by Utility, Sector and Market Segment (PGE) ........................................................... II-2 Table II.3: Program-Estimated Savings and Costs by Utility, Sector and Customer (Pacific Power) ....................................................... II-3 Table II.4: Energy-Efficiency Measure Installations by Sector............... II-4 Table II.5: Energy-Efficiency Measure Installations Utility and Sector (PGE)............................................................................................... II-4 Table II.6: Energy-Efficiency Measure Installations by Utility and Sector (Pacific Power)......................................................................... II-5 Table II.7: Distribution of Savings by Measure and Sector, PGE and Pacific Power.............................................................................. II-5 Table III.1: Final Disposition of Analysis Samples................................. III-8 Table III.2: Study Sample Sizes ............................................................... III-9 Table IV.1: Telephone Survey Disposition..............................................IV-1 Table IV.2: Measures Persistence ............................................................IV-1 Table IV.3: Participant Satisfaction..........................................................IV-2 Table IV.4: Non-Participant Awareness ..................................................IV-2 Table IV.5: Non-Participants that Installed High-Efficiency Measures ....................................................................................................IV-3 Table IV.6: Barriers to Participation ........................................................IV-3 Table IV.7: Free-Ridership Logic ............................................................IV-5 Table IV.8: Savings-Weighted Free-Ridership Rate by Measure Category and Sector...................................................................IV-5 Table IV.9: Participant Spillover Rate .....................................................IV-6 Figure IV.1: Basis for Determination of Non-Participant Spillover Effect..........................................................................................IV-7 Table IV.10: Remaining Energy Efficiency Opportunities.....................IV-8 Table V.1: Estimated Gross Savings Realization Rates........................... V-2 Table V.2: Estimated Net Savings Realization Rates............................... V-3 Table V.3: Estimated Gross-to-Net Ratios by Sector............................... V-4 Table V.4: Net Savings Realization Rates By Measure........................... V-5
quantec Evaluation of Transition C&I Programs – iii The Energy Trust of Oregon

Executive Summary
The Energy Trust of Oregon, Inc. (ETO) was established in March 2001 as a non-profit public entity to manage the investment of public purpose funds for acquisition of energy efficiency and renewable energy resources in the service areas of Oregon’s two major investor-owned electric utilities, Portland General Electric (PGE) and Pacific Power. To avoid an interruption in the provision of energy efficiency services to electric utility customers, and to continue the acquisition of cost-effective conservation resources, in 2001 the ETO contracted with PGE and Pacific Power to continue their standing programs and services while the ETO developed its own programs. This report summarizes the programmatic activities and achievements of the commercial and industrial energy efficiency services offered by the two utilities during this transition period.
This evaluation was intended as a comprehensive effort to provide reliable and accurate estimates of actual energy and demand savings resulting from the transition commercial and industrial programs in 2002 and 2003, with an emphasis on the lighting components and to identify an optimal approach for estimating “gross” and “net” program impacts through rigorous testing of alternative methodologies. The results of this effort are expected to provide a template for ETO’s future impact evaluations of similar programs.
To fulfill these objectives, data were collected from both secondary and primary sources through telephone surveys of program participants and a stratified, random sample of non-participating facilities. Additional data on business operations and site characteristics for participants were collected by visiting a random sample of facilities. Estimates of “gross” and “net” savings were developed using six industry-standard methods. The principal findings of the study are as follows:
• Between March 2002 and December 2003, PGE and Pacific Power provided energy-efficient retrofit services to 644 participants (410 PGE, 234 Pacific Power) through 760 individual projects, completed through eight separate program initiatives. Estimated savings from these projects averaged nearly 141 MWh per year per participant for a total estimated savings of 90 GWh per year. These savings provided an equivalent reduction of 10.4 MWa in demand with a cumulative peak impact of 11.3 MW.
• Average cost per completed project was slightly under $24,000, and utility incentives covered, on average, 26% of project costs.
• Energy savings is split almost evenly between the commercial and industrial sectors (55% commercial, 45% industrial). Offices, food stores, and miscellaneous buildings comprised the largest number of
quantec Evaluation of Transition C&I Programs – ES-1 The Energy Trust of Oregon

participants in the commercial sector, accounting for over 60% of the commercial sector savings.
• Lighting, HVAC, air compression, motors, and refrigeration were the main measures installed under the utility programs. Lighting retrofit, installed primarily in office buildings and retail facilities, was by far the most commonly installed measure, as 75% (529) of customers received lighting retrofits and/or lighting controls. Nearly 12% of all lighting measures were installed in industrial facilities.
• Surveys of participants show that the vast majority (96%) of the installed measures are still in place and functioning properly. Measure failures were reported only in six cases, all associated with lighting measures. Nearly all participants state that they are either “very” or “somewhat” satisfied with the services and measures they received.
• Approximately one-third of non-participants report being aware of the ETO and the services it offers. Only a small fraction in this group (6%) had sought information regarding high efficiency energy equipment.
• Six different methods consisting of engineering, statistical, and hybrid engineering/statistical approaches were used to derive estimates of “gross” and “net” savings. To provide a common basis for comparison of results from these methods, all savings estimates were computed on the basis of “savings realization rate,” i.e. the ratio of estimated (ex post) savings and the initial (ex ante) engineering calculations.
• The experience of this study has made clear that engineering methods for calculation of savings, combined with on-site verification on a small sample of sites, is a reliable and cost-effective means for verification of savings, especially for larger commercial sites and industrial facilities, which do not lend themselves well to statistical analysis.
• Simulation modeling, using simple-to-use software involving a reasonable level of data collection effort such as EZSim, is an effective approach for verification of savings. However, it is difficult to perform for large commercial and industrial facilities due to the inherent complexity of the energy systems and extensive data requirements. The relatively high cost of simulation also limits sample size, leading to unacceptably large margins of error when the results are extrapolated to the population of participants.
• Application of statistically adjusted engineering (SAE) techniques in the context of a well conceived quasi-experimental research design is the most reliable and cost-effective means of deriving estimates of “net” impacts for small- to medium-size facilities. However, these
quantec Evaluation of Transition C&I Programs – ES-2 The Energy Trust of Oregon

techniques do not lend themselves to analysis of savings in larger facilities.
• Verification results, as summarized in Table ES.1, show that 93% of the expected program-level savings were realized. The net savings realization rate was particularly high in the industrial sector, where nearly 100% of the expected savings were realized. Savings realization rates were generally lower for lighting than for other measures.
Table ES-1: Summary of Program Impacts and Savings Realization Rates
Program Impacts Program-Reported Savings
Realization Rate
Adjusted Gross
Savings
Free- Ridership/ Spillover
Factor
Net-To-Gross Ratio
Net Impacts
Small/Medium Commercial (MWh)* 29,512 0.86 25,380 0.010 0.85 25,085 Large Commercial (MWh) ** 19,826 0.94 18,636 0.040 0.90 17,843 Industrial (MWh) ** 41,371 1.00 41,371 0.006 0.99 41,111 Overall (MWh) 90,708 0.94 85,387 0.015 0.93 84,039 Overall (MWa) 10,355 0.94 9,747 0.015 0.93 9,593 * Based on SAE Methodology ** Based on On-site verification
Free-ridership and spillover effects comprise the principal sources of divergence of net from gross savings. On average, 8% of the program savings is attributable to free-ridership, predominantly associated with lighting measures. The programs also produced significant spillover in terms of both additional measures installed by participants and program-induced investments in energy-efficiency by non-participants. The spillover effects are estimated at nearly 8%, thus tend to offset free-ridership.
Methods tested in this evaluation resulted in a wide range of results for estimates of gross and net savings. The choice of a suitable method is inevitably predicated on the tradeoffs among three factors: estimation cost, accuracy, and efficiency of the estimates. It is equally important to recognize that the appropriateness of various methods are to be judged with regards to the reasonableness of their results in light of experience and expert judgment. The lessons learned in this study suggest that on-site verification, in conjunction with well-structured surveys, is the most effective approach for verification of savings in large commercial and industrial sectors. Statistically adjusted engineering methods, on the other hand, appear as a robust and cost-effective means of verification for small- and medium-size commercial buildings.
quantec Evaluation of Transition C&I Programs – ES-3 The Energy Trust of Oregon

I. Introduction
Background
The Energy Trust of Oregon, Inc. (ETO) was established in March 2001 in keeping with Oregon’s electric energy restructuring law, SB 1149. The law, adopted by the Oregon legislature in 1999, directed the Oregon Public Utility Commission to select an organization to manage the investment of public purpose funds for acquisition of energy efficiency and renewable energy resources in the service areas of Oregon’s two major investor-owned electric utilities, Portland General Electric (PGE) and Pacific Power, a subsidiary operating company of PacifiCorp. The public purpose fund is generated through a three percent (3%) contribution from customers of the two utilities.
To avoid an interruption in the provision of energy efficiency services to electric utility customers, and to continue the acquisition of cost-effective conservation resources, in 2001 the ETO contracted with PGE and Pacific Power to continue their standing programs and services while the ETO developed its own programs.
In December 2003, the ETO engaged the services of Quantec, LLC, to evaluate the programmatic activities and achievements of the two utilities in the commercial and industrial sectors during this transition period (2002 and 2003). The principal goal of the evaluation was two-fold:
1. To provide reliable and accurate estimates of actual energy and demand savings resulting from the transition commercial and industrial (C&I) programs, with an emphasis on the lighting components
2. To test alternative methodologies for estimating “gross” and “net” program impacts and to identify an optimal approach that may be used as a template for ETO’s future impact evaluations
Organization of this Report
This document is organized in six parts. Section II provides a summary of the program efforts and accomplishments of PGE and Pacific Power during the study period. Sections III is dedicated to a discussion of study design, data elements, and methodology. The results of customer surveys and characteristics of participants and non-participants are discussed in Section IV. Section V presents the results of gross and net savings estimates derived from the application of alternative methods. Finally, the general conclusions and recommendation emerging from the study are presented in Section VI.
quantec Evaluation of Transition C&I Programs – I-1 The Energy Trust of Oregon

II. Program Activity and Accomplishments
Between March 2002 and December 2003, PGE and Pacific Power provided energy-efficient retrofit services to 644 participants (410 PGE, 234 Pacific Power) through 760 individual projects1 in the commercial and industrial sectors. These services were offered through eight distinct program initiatives by the two utilities. Program savings averaged nearly 141 MWh per year per participant, and total electricity savings from the completed projects were estimated at 90 GWh per year. This translates into an average reduction in demand of 10.4 MWa and cumulative peak impacts of 11.3 MW. Average cost per completed project was slightly under $24,000. Utility incentives covered 26% of total project cost on average, but ranged from 18% (offices buildings) to 34% (industrial facilities). Program activities and accomplishments by sector and market segment are summarized in Table II.1. Separate results for PGE and Pacific Power are shown in Tables II.2 and II.3, respectively. The savings achieved through the programs by both utilities are expected to produce a 10.3 MWa of reduction in demand and a peak impact of 11.3 MW.
Table II.1: Program-Estimated Savings and Costs by Sector and Market Segment
Customer Segment
No. Partici-pants
Average Project
Cost
Average Incentive Payment
Mean Annual Savings
(kWh/Year)
Total Annual Savings
(kWh/Year)
Average Demand Impact (kWa)
Average Peak
Impact (kW)
Commercial Food Stores 50 $12,907 $3,453 181,574 9,078,684 1,036 820 Health 24 $13,848 $4,434 96,591 2,318,193 265 265 Lodging 19 $19,783 $5,298 69,601 1,322,418 151 151 Miscellaneous 140 $18,553 $3,949 75,782 10,609,510 1,211 2,084 Office 161 $15,445 $2,771 72,784 11,718,217 1,338 1,931 Restaurant 9 $2,019 $499 12,569 113,121 13 7 Retail 65 $20,930 $4,618 80,015 5,200,965 594 595 Schools 44 $34,617 $7,636 123,568 5,436,970 621 647 Warehouse 28 $37,166 $8,480 126,398 3,539,144 404 284
Industrial 104 $49,332 $16,587 397,798 41,370,963 4,723 3,703 Total 644 $24,085 $6,183 140,851 90,708,185 10,355 11,289
1 A “participant” may be a combination of multiple projects and measures for a single
customer at a specific location.
quantec Evaluation of Transition C&I Programs – II-1 The Energy Trust of Oregon

PGE’s commercial and industrial energy efficiency services were offered under five separate programs, namely Retrofit Lighting, Retrofit HVAC, Retrofit Custom Incentive, Retrofit Commissioning, and Industrial Process.
As can be seen in Table II.2, PGE installed energy efficiency equipment for 410 participants under its programs at an average cost of $16,427 per participant. Each participant was expected to save about 94 MWh annually for a total annual savings of nearly 38.5 GWh. Industrial customers were, on average, the largest savers, accounting for more than 30% of the total program savings. Offices, food stores, and miscellaneous commercial segments followed the industrial sector with 17%, 16%, and 14% of total savings, respectively. Offices and miscellaneous commercial buildings made up nearly one-half of the participants in the program. Demand impacts of the PGE programs are estimated at nearly 4.4 MWa with a reduction of 4.8 MW in peak load.
Table II.2: Program-Estimated Savings and Costs by Utility, Sector and Market Segment (PGE)
Customer Segment
No. Partici-pants
Average Project
Cost
Average Incentive Payment
Mean Annual Savings
(kWh/Year)
Total Annual Savings
(kWh/Year)
Average Demand Impact (kWa)
Average Peak
Impact (kW)
Commercial Food Stores 34 $15,620 $4,214 185,002 6,290,077 718 568 Health 17 $10,785 $2,520 58,232 989,939 113 113 Lodging 4 $36,551 $8,750 102,489 409,954 47 47 Miscellaneous 96 $11,008 $2,762 57,149 5,486,333 626 1,078 Office 100 $14,007 $2,724 66,183 6,618,331 756 1,091 Restaurant 4 $1,531 $362 11,046 44,182 5 3 Retail 38 $14,251 $3,802 75,238 2,859,033 326 327 Schools 30 $28,275 $6,025 72,132 2,163,957 247 258 Warehouse 20 $20,529 $5,585 91,303 1,826,064 208 147
Industrial 67 $24,037 $8,076 175,305 11,745,457 1,341 1,051 Total 410 $16,427 4,239 93,740 38,433,327 4,387 4,783
Pacific Power offered its energy efficiency services under three separate programs: Small C&I Retrofit Incentive, Large C&I Retrofit Incentive, and Energy FinAnswer. Two hundred and thirty-four customers participated in these programs during the evaluation period with a total estimated savings of nearly 52.3 MWh. Project costs averaged approximately $37,500, with incentive covering level of 26% of project costs on average. Although PGE provided service to more customers, Pacific Power utilized more funds due to generally larger projects with average costs of more than twice that of PGE. The majority of savings (57%) were estimated to originate from industrial projects. Offices and miscellaneous commercial buildings follow the industrial sector with estimated savings of to save 10% of the total program
quanec Evaluation of Transition C&I Programs – II-2 The Energy Trust of Oregon
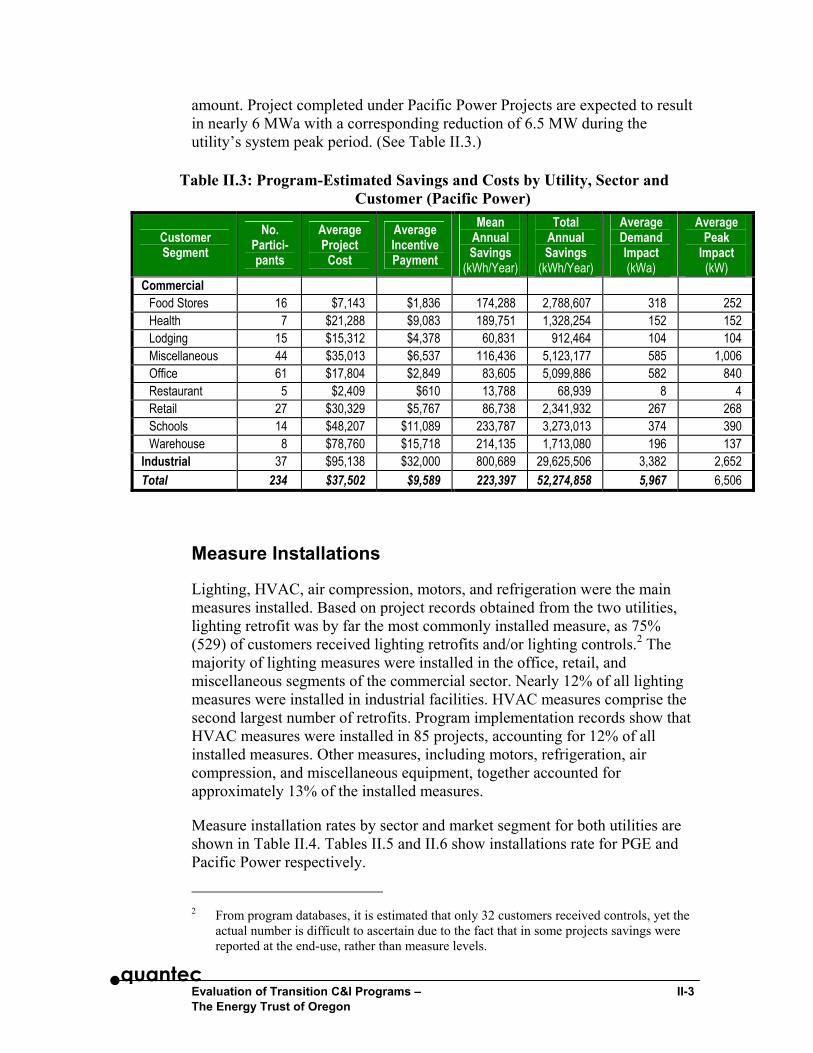
amount. Project completed under Pacific Power Projects are expected to result in nearly 6 MWa with a corresponding reduction of 6.5 MW during the utility’s system peak period. (See Table II.3.)
Table II.3: Program-Estimated Savings and Costs by Utility, Sector and Customer (Pacific Power)
Customer Segment
No. Partici-pants
Average Project
Cost
Average Incentive Payment
Mean Annual Savings
(kWh/Year)
Total Annual Savings
(kWh/Year)
Average Demand Impact (kWa)
Average Peak
Impact (kW)
Commercial Food Stores 16 $7,143 $1,836 174,288 2,788,607 318 252 Health 7 $21,288 $9,083 189,751 1,328,254 152 152 Lodging 15 $15,312 $4,378 60,831 912,464 104 104 Miscellaneous 44 $35,013 $6,537 116,436 5,123,177 585 1,006 Office 61 $17,804 $2,849 83,605 5,099,886 582 840 Restaurant 5 $2,409 $610 13,788 68,939 8 4 Retail 27 $30,329 $5,767 86,738 2,341,932 267 268 Schools 14 $48,207 $11,089 233,787 3,273,013 374 390 Warehouse 8 $78,760 $15,718 214,135 1,713,080 196 137
Industrial 37 $95,138 $32,000 800,689 29,625,506 3,382 2,652 Total 234 $37,502 $9,589 223,397 52,274,858 5,967 6,506
Measure Installations
Lighting, HVAC, air compression, motors, and refrigeration were the main measures installed. Based on project records obtained from the two utilities, lighting retrofit was by far the most commonly installed measure, as 75% (529) of customers received lighting retrofits and/or lighting controls.2 The majority of lighting measures were installed in the office, retail, and miscellaneous segments of the commercial sector. Nearly 12% of all lighting measures were installed in industrial facilities. HVAC measures comprise the second largest number of retrofits. Program implementation records show that HVAC measures were installed in 85 projects, accounting for 12% of all installed measures. Other measures, including motors, refrigeration, air compression, and miscellaneous equipment, together accounted for approximately 13% of the installed measures.
Measure installation rates by sector and market segment for both utilities are shown in Table II.4. Tables II.5 and II.6 show installations rate for PGE and Pacific Power respectively.
2 From program databases, it is estimated that only 32 customers received controls, yet the
actual number is difficult to ascertain due to the fact that in some projects savings were reported at the end-use, rather than measure levels.
quantec Evaluation of Transition C&I Programs – II-3 The Energy Trust of Oregon

Table II.4: Energy-Efficiency Measure Installations by Sector, PGE and Pacific Power
Lighting HVAC Air Compression Motors Refrigeration Other
Food Stores 29 16 - - - 14 11 - - - Health 20 4 - - - 1 . 2 Lodging 15 3 - - - 2 . - - - Miscellaneous 121 14 1 4 1 5 Office 146 20 1 1 - - - - - - Restaurant 9 . - - - - - - - - - - - - Retail 58 10 - - - - - - - - - - - - Schools 42 5 - - - - - - - - - 2 Warehouse 26 . - - - 1 1 - - - Industrial 63 13 20 9 8 8 Total* 529 85 22 32 21 17
* Cumulative total is greater than number of participants because some participants had multiple measure types.
Table II.5: Energy-Efficiency Measure Installations by Utility and Sector (PGE)
Lighting HVAC Air Compression Motors Refrigeration Other
Food Stores 14 7 - - - 14 2 - - - Health 15 2 - - - - - - - - - - - - Lodging 2 2 - - - - - - - - - - - - Miscellaneous 85 10 - - - 1 - - - - - - Office 90 12 - - - - - - - - - - - - Restaurant 4 -- - - - - - - - - - - - - Retail 32 9 - - - - - - - - - - - - Schools 29 1 - - - - - - - - - - - - Warehouse 19 -- - - - 1 - - - - - - Industrial 51 7 6 3 2 1 Total* 341 50 6 19 4 1
* Cumulative total is greater than number of participants because some participants had multiple measure types.
Expected energy savings split almost evenly between the commercial and industrial sectors (55% commercial, 45% industrial). Offices, food stores, and miscellaneous buildings comprised the largest number of participants in the commercial sector, accounting for more than 60% of the commercial sector savings. As shown in Table II.7, the distribution of electricity savings by and large corresponds with measure installation rates. The largest portion (43%) of savings was associated with lighting measures, primarily retrofit and controls. Air compression and refrigeration measures, installed mainly in the industrial sector, together account for nearly one-third of total savings. Refrigeration
quanec Evaluation of Transition C&I Programs – II-4 The Energy Trust of Oregon

measures were the most frequently installed measure in food stores, after lighting, and accounted for 30% of savings in this segment. Motor replacements were responsible for nearly 20% of savings. Restaurants had the least number of participants; lighting was the only measure installed in this segment, producing modest savings.
Table II.6: Energy-Efficiency Measure Installations by Utility and Sector (Pacific Power)
Lighting HVAC Air Compression Motors Refrigeration Other
Food Stores 15 9 - - - - - - 9 - - - Health 5 2 - - - 1 - - - 2 Lodging 13 1 - - - 2 - - - - - - Miscellaneous 36 4 1 3 1 5 Office 56 8 1 1 - - - - - - Restaurant 5 - - - - - - - - - - - - - - - Retail 26 1 - - - - - - - - - - - - Schools 13 4 - - - - - - - - - 2 Warehouse 7 - - - - - - - - - 1 - - - Industrial 12 6 14 6 6 7 Total* 188 35 16 13 17 16
* Cumulative total is greater than number of participants because some participants had multiple measure types.
Table II.7: Distribution of Savings by Measure and Sector, PGE and Pacific Power
Total
Annual Savings
(kWh/Year) Lighting HVAC
Air Compres-
sion Motors Refriger-
ation Other
Commercial Food Stores 9,078,684 40% 5% 0% 0% 29% 26% Health 2,318,193 54% 13% 0% 6% 0% 27% Lodging 1,322,418 76% 20% 0% 0% 0% 4% Miscellaneous 10,609,510 56% 21% 1% 9% 7% 7% Office 11,718,217 64% 31% 3% 0% 0% 1% Restaurant 113,121 100% 0% 0% 0% 0% 0% Retail 5,200,965 94% 6% 0% 0% 0% 0% Schools 5,436,970 71% 26% 0% 3% 0% 0% Warehouse 3,539,144 82% 0% 0% 0% 16% 3%
Industrial 41,370,963 19% 9% 36% 2% 30% 3% Total Savings (kWh/Year) 90,708,185 39,006,233 12,413,673 15,523,647 2,298,572 16,277,005 5,189,055
quantec Evaluation of Transition C&I Programs – II-5 The Energy Trust of Oregon

III. Methodology and Data Development
The research approach in this study was structured to test a set of alternative techniques to identify an appropriate “optimal” method, which provides measures of gross and net energy impacts at an acceptable level of accuracy and at a reasonable cost. The research plan was designed to provide satisfactory answers to the following questions:
1. What is the set of industry-standard methodologies that have been applied to the estimation of gross and net impacts of commercial and industrial programs?
2. What are the expected accuracy, data requirements, computational complexity, and costs associated with each method?
3. How do these methods compare in terms of relative accuracy and cost?
4. How appropriate are these for estimating the effects of specific energy efficiency measures, particularly lighting?
5. Are these methods equally appropriate for large and small retrofit projects?
6. What are the most effective approaches for estimating potential free-ridership and spillover effects, and which ones are applicable to large and small sites?
To answer these questions, this study employed a set of conventional methods for estimating gross savings, net savings, free-ridership, and spillover effects. This approach also provided the opportunity to judge the appropriateness of alternative data-collection methods such as site visits and phone surveys and to compare their cost effectiveness.
Estimation of Gross Savings
There are a large number of methodological approaches and estimation techniques for estimating gross impacts of energy-efficiency retrofit programs. These approaches are generally based on purely engineering methods, statistical techniques, or combinations of the two, and they vary significantly with respect to analytic approach, data requirements, accuracy, and cost. For the purpose of this project, six methods were used to estimate gross savings. To provide a common basis for comparison of results from these methods, all savings estimates were computed on the basis of “savings realization rate,” i.e. the ratio of estimated (ex post) savings and the initial (ex ante) engineering calculations.
quantec Evaluation of Transition C&I Programs – III-1 The Energy Trust of Oregon

Method 1: On-Site Verification
This method involves a complete audit of the participant facility to collect data on structural, energy systems, and operating characteristics and to verify the installed measures. The savings calculations are also audited for applicability and accuracy. Gross savings are then estimated using either the original engineering algorithms or alternative methods judged to be more appropriate. On-site verifications were performed on a random sample of 50 small-to-medium-size commercial sites and 20 large commercial and industrial facilities.
Method 2: Energy Simulation Modeling
Energy simulation based on data collected through a complete facility audit represents the highest, the most complete, and the most expensive level of analysis. Gross savings are computed as the difference in total energy use between two simulation scenarios, both calibrated to monthly consumption: “baseline” and “post installation.” The baseline scenario is constructed assuming facility conditions before the installation of energy efficiency measures, and the post-installation scenario takes into account the impacts of installed measures on building energy requirements. This method is assumed to produce the most accurate estimates of gross savings and establishes the benchmark for all subsequent methods. Simulation modeling was performed using the EZSim energy simulation software on the sample of commercial sites with on-site data. For each site, simulations were done using site visit data, pre-installation (baseline) annual billing history (2001 electricity only), and corresponding, location-specific weather data.
As part of this analysis, the data inputs collected from site visits were compared to the same inputs obtained from project files and telephone surveys to determine whether energy simulation could have been performed by relying solely on project files and phone survey data without additional site visits.
Method 3: Simple Pre-Post Differencing
This method is by far the crudest method for estimating gross savings. It is based on a simple subtraction of post-program consumption from pre-program consumption without taking into account any other determinants of energy use, or energy efficiency measures installed.
Method 4: Regression-Based Differencing
This technique is a simple approach for estimating gross savings. It is a close variant of Method 3 and involves a comparison of pre- and post-installation electricity consumption within a regression framework with the following general specification:
∆kWhit = α + λ1∆HDDit + λ2∆CDDit + ε it
quanec Evaluation of Transition C&I Programs – III-2 The Energy Trust of Oregon

Where, for each participant i and calendar month t,
• ∆kWh it is difference in average daily consumption between the pre-and post-program periods
• HDDit is the change in average daily heating degree days based on facility location
• CDDit is the change in average daily cooling degree days based on facility location
• ε it is the error term
In this specification, α represents gross savings. A comparison of this method with Method 3 demonstrates the extent to which electricity consumption in commercial facilities is sensitive to variations in weather.
Method 5: Statistically Adjusted Engineering (SAE) Model
This is a simple conventional SAE model; therefore, it relies only on consumption histories and climate variables. Using energy consumption during the post-installation period as the dependent variable and weather and engineering estimates of savings as the primary independent variables, this approach involves estimating a regression model with the following specification:
ADC i = αi + βEEi + λ1HDDit + λ2CDDit + ε it
Where, for each customer i and calendar month t,
• αi is a unique intercept for each participant derived by estimating the relationship using the ANCOVA (fixed effects) procedure
• ADCit is the average daily consumption during the pre- and post-program periods
• EEi is a vector of initial engineering estimates of savings; the associated beta is the realization rate
• HDDit, is average daily heating degree days based on facility location
• CDDit is the average daily cooling degree days based on facility location
• ε it is the error term
Method 6: Simulation-Based SAE (EZ Sim-Adjusted SAE)
This approach involves extrapolating the measure-specific savings realization rates obtained from building simulation (Method 2) to the entire population of participants and using the results in a statistically adjusted engineering model to estimate realization rates for each segment and the population of
quantec Evaluation of Transition C&I Programs – III-3 The Energy Trust of Oregon

participants. Gross savings realization rates are estimated using the following specification:
ADCit =αi + βEE*i + λ1HDDit + λ2CDDit + ε it
Where, for each participant, ADC, HDD, CDD, and ε it are the same as in Method 5. EE*
i is a vector of simulation-adjusted engineering estimates of savings. The associated beta is the realization rate.
This method was implemented in four steps:
1. Estimate savings for individual energy efficiency measures using building simulations on a sample of sites
2. Compute realization rates for individual energy efficiency measures in the sample and calculate mean realization rates by facility type
3. Apply the computed realization rates from the sample to the population of participants to calculate “adjusted engineering savings estimates”
4. Use the “adjusted savings estimates” in a conventional SAE specification to calculate realization rates across the population of participants
Engineering simulation is perhaps the most accurate means of verifying savings estimates (especially when combined with site visits) but tends to be expensive to apply. SAE models, on the other hand, while inexpensive and easy to implement, are likely to produce biased estimates if the explanatory variables (i.e., the engineering estimates) are measured with error. This condition often leads to biased estimated coefficients (biased realization rates). This method, therefore, combines the best in the two approaches.
Estimation of Net Savings
There are generally three potential sources for disparity between the “gross” and “net” savings: naturally occurring conservation, self-selection, and free-ridership/spillover effects. A variety of techniques have been employed for capturing and accounting for these effects in previous evaluations of energy-efficiency programs. These techniques in general involve either direct
quanec Evaluation of Transition C&I Programs – III-4 The Energy Trust of Oregon

elicitation through surveys of participants, application of quasi-experimental research designs, or the application of statistical choice models.3
For the purposes of this evaluation we tested two approaches: direct elicitation and quasi-experimental research design. In particular, this analysis sought to assess the value and reliability of participant surveys as a means of determining free-ridership and spillover effects in the context of commercial and industrial programs.
Direct Elicitation
As part of this evaluation, we designed and implemented a survey of participants and non-participants to obtain specific information on customers’ decision-making processes and to identify the factors that influence the decision to invest in energy efficiency. The main challenge in this effort was to structure the survey instrument in a manner that would result in an accurate characterization of the participants’ decision-making processes without being overly intrusive. The results were then used to adjust Methods 1 and 2 above to derive net impacts.
Quasi-Experimental Research Design
This method represents a more direct approach to verification of net savings by incorporating data on a control group in the analysis to explicitly account for the impact of baseline changes in energy usage during the program period. This approach was used in estimating net impacts in statistical models and applied to Methods 4 through 6 using the following specifications:
• Method (4a): ∆kWhit = α + βPART + λ1∆HDDit + λ2∆CDDit + ε it
• Method (5a):ADC it = αi + βEEi + λ1HDDit + λ2CDDit + ε it
• Method (6a):ADCit =αi + βEE*i + λ1HDDit + λ2CDDit + ε it
The main difference between these specifications and the original gross savings models described above is that they include non-participant data. In
3 Statistical choice models use regression techniques to estimate probabilities of
participation based on specific customer characteristics, which are presumed to have an effect on the decision to participate in an energy-efficiency program. These generally include corporate structure, relative importance of energy costs, and incentive amounts. The estimated probabilities are then incorporated as explanatory variables in a savings regression model to account for potential free-ridership. While this approach is an effective strategy for estimating free-ridership, it does not capture the separate effects of spillover and naturally occurring conservation. Attempts to calibrate a choice model in this study were unsuccessful, and statistically reliable estimates could not be obtained. In our judgment, the limited variation in measure installations and incentive amounts were perhaps the main confounding factors.
quantec Evaluation of Transition C&I Programs – III-5 The Energy Trust of Oregon

the first specification (Method 4a), PART is a binary variable with the values of 1 for participants and 0 for non-participants.
Calculation of Demand (kW) Impacts
Demand impacts were estimated by applying measure coincidence factors derived from end-use load shapes. Demand impacts were calculated in terms of both average annual (kWa) and peak-coincident demand impacts. Commercial sector load profiles were compiled with information from PGE and the Northwest Power and Conservation Council. Coincident peak impacts were calculated for the winter a.m. peak periods for PGE and Pacific Power based on each utility’s system load profiles.
Data Development
Application of the methods described above required the compilation of a large database from multiple primary and secondary sources.
Primary Data Collection
Telephone surveys of participants and non-participants and on-site data collection on a sample of participating sites were the main sources for the primary data used in this study. Copies of telephone survey questionnaires and on-site data collection forms are found in Appendix A.
Participant telephone surveys were conducted on a stratified random sample of participants. The purpose of these surveys was to collect data on:
• Verification of measure installations
• Condition and quality of installations
• Satisfaction with program services
• Business characteristics (facility type, corporate structure)
• Site characteristics (fuel types, square footage, primary heating and cooling systems)
• Free-ridership
• Additional measures installed without program-related incentives (spillover)
• Awareness of ETO and its services
These telephone surveys also provided the means for recruitment of participants for site visits.
quanec Evaluation of Transition C&I Programs – III-6 The Energy Trust of Oregon

Non-participant telephone surveys were conducted on a stratified random sample. The non-participant surveys focused on collecting data on:
• Business characteristics (facility type, corporate structure)
• Site characteristics (fuel types, square footage, primary heating and cooling systems)
• Installation of high efficiency measures
• Awareness of ETO-sponsored programs
• Influence of ETO on installation of measures
• Barriers to participation
On-site audits were conducted on a stratified sample of 50 small- and medium-size commercial sites and 20 large commercial and industrial facilities. These audits focused on verification of installations through visual inspection, determination of measure quality and completeness, and collecting data on primary business and facility characteristics. The results of site audits were used as a basis for verification of savings and compilation of data for energy simulations.
Secondary Data
The data elements included:
• Consumption history and account information from PGE and Pacific Power (monthly kWh, meter read dates, rates codes, adjustment codes, account number, SIC code, zip code and/or county)
• Electronic program files from PGE and Pacific Power (facility types, installed measures, date of installation (s), estimated savings, project costs, incentive levels, facility location and contact information)
• Participant “paper files” were also collected from each utility to supplement the electronic data. These were collected only for participants who agreed to have site visits per telephone survey.
• Phone survey data (operating hours, measures installed, participant satisfaction, fuel use, energy equipment inventory, free-rider/spillover questions, self-motivated energy efficiency improvements and actions)
• Site visit information (operating hours, verification of measures installed, fuel use, energy equipment inventory, free-rider/spillover questions, self-motivated energy efficiency improvements)
• Weather data from National Oceanic and Atmospheric Administration (NOAA): average daily temperatures, heating
quantec Evaluation of Transition C&I Programs – III-7 The Energy Trust of Oregon

degree-days, and cooling-degree days. The weather data were collected from multiple stations in the service areas of the two utilities and matched to participating sites by zip code.
• PGE and Pacific Power system load profiles consisting of one complete year of hourly system load data for the 2002 calendar year
• Hourly end-use load shapes from PGE and Northwest Power and Conservation Council
Sample Disposition
The sample frame for this study was comprised of the census of 644 participating facilities and a stratified sample of approximately 1,600 non-participating customers in the PGE and Pacific Power service areas. To ensure comparability of the two groups, the non-participant sample was drawn so that the number of cases in each stratum was proportionate to that of participants.
The preparation of participants’ data for the statistical analyses resulted in elimination of a number of facilities from the database primarily due to anomalous or incomplete data. Approximately 35% of the original sample consisting of industrial, agricultural, and colleges, was removed due to the fact that facility types do not lend themselves to statistical analysis. Moreover, approximately 15% of sites were removed due to insufficient billing data, large swings in consumption or difficulties in matching meter points to treated facilities. As can be seen in Table III.1, the data compilation and cleaning processes resulted in an attrition of 16% in the PGE sample and 18% in the Pacific Power sample.
Table III.1: Final Disposition of Analysis Samples PGE Pacific Power Data Screen
Removed Remaining Removed Remaining Original Sample 410 234 Removed industrial, agriculture, colleges for billing analysis 85 325 44 190 Installed measures in 2003 (incomplete pos-program kWh data 75 250 17 173 Starting Sample for Billing Analysis 250 173 Insufficient pre- or post program kWh data (less than 300 days) 12 238(95%) 17 156(90%) Post-program consumption changed by more than 50% 19 219(88%) 8 148(86%) Estimated savings less than 1% or more than 100% of pre kWh 6 213(85%) 3 145(84%) Outliers 4 209(84%) 4 141(82%) Final Sample 41 209(84%) 32 141(82%)
The final disposition of the analysis samples by utility is shown in Table III.2. As part of the data-collection effort, 216 participants and 200 non-participants were surveyed by phone. Seventy-four facilities, including the 20 largest sites, were visited for on-site data collection and interviews. Seven hundred sites
quanec Evaluation of Transition C&I Programs – III-8 The Energy Trust of Oregon

consisting of 350 participants and a matching sample of 350 non-participants were included in the statistical analysis. Energy simulations were performed on 44 sites. Simulation modeling proved impractical in seven sites where primarily outdoor lighting measures were installed.
For purposes of statistical analysis, the non-participants in each sector were drawn so that the distribution of annual consumption in this group matched that of participants. The matching of the two samples was accomplished in two steps. First, participants in each market segment were assigned to four quartiles based on their total annual consumption. For each quartile, a sample of non-participants was then drawn randomly so that the frequency distributions of the two groups were identical. This procedure ensured a nearly perfect comparability between the two groups.
Table III.2: Study Sample Sizes Sample Sizes Activity
PGE Pacific Power Notes
Participants Site Visits 42 32 Comprised of 20 largest sites and a
stratified sample of 54 other sites Energy Simulation 22 22 Simulation could not be applied to seven
sites including several large industrials and few commercial sites with mostly outdoor lighting measures.
Phone Surveys 138 78 Stratified random sample including the 20 largest customers.
Statistical Modeling 209 141 Subset of participants with complete consumption histories.
Non-Participants Site Visits None None Energy Simulation None None Phone Surveys 124 76 Stratified, random proportionate samples. Statistical Modeling 209 141 Matching samples stratified by building type
and annual consumption.
quantec Evaluation of Transition C&I Programs – III-9 The Energy Trust of Oregon

IV. Customer Survey Results
Survey Sample Disposition
The participant sample was conducted on a random stratified sample of 216 participants. The non-participant phone survey was conducted on a stratified sample of 200 commercial and industrial customers who had not participated in any utility-sponsored program in 2002 or 2003. Distribution of the completed phone surveys by utility and customer sector is shown in Table IV.1.
Table IV.1: Telephone Survey Disposition Participants Non- Participants
PGE Pacific Power PGE Pacific Power Commercial Food Stores 18 2 4 2 Health 7 3 6 5 Lodging 1 7 1 5 Miscellaneous 40 15 20 25 Office 19 26 40 16 Restaurant 2 2 5 2 Retail 17 10 17 8 Schools 16 9 24 10 Warehouse 13 3 6 3 Industrial 5 1 1 0 Total Savings (kWh/Year) 138 78 124 76
Measure Persistence and Participant Satisfaction
The vast majority (96%) of participants’ measures are reported to be still in place and functioning properly. Measure failures were reported only in six cases, all associated with lighting measures due to either burnout or malfunctioning.
Table IV.2: Measures Persistence N %
Working Measures 328 96% Non-Working Measures 12 4%
Lighting Retrofits 11 Lighting Controls 1
Respondents were also asked to rate their satisfaction with the equipment, technical help, and expected energy savings. As shown in Table IV.3, nearly
quantec Evaluation of Transition C&I Programs – IV-1 The Energy Trust of Oregon

all participants stated that they were either “very” or “somewhat” satisfied. There were no marked differences between the two utilities in this regard. A significant number (20%), however, were uncertain of the impact of the measures on their energy bill.
Table IV.3: Participant Satisfaction Equipment Technical Help Savings
Very Satisfied 76% 77% 53% Somewhat Satisfied 19% 14% 20% Somewhat Dissatisfied 3% 3% 4% Very Dissatisfied 1% 1% 1% Uncertain 0% 5% 20%
Awareness of ETO Services
Non-participants were asked if they were aware of the ETO-funded commercial and industrial retrofit programs. Approximately one-third responded that they were aware of such programs. Only a small fraction of non-participants (6%) had sought information regarding high efficiency energy equipment. See Table IV.4.
Table IV.4: Non-Participant Awareness PGE Pacific Power Overall Awareness of ETO Programs 41 33% 19 25% 60 30% Sought Information 7 6% 5 7% 12 6%
Energy Efficiency Measures Installed by Non-Participants
Survey results show that 20% of the non-participants installed high-efficiency equipment similar to those offered by utility programs during the previous two years on their own. Of these, lighting was cited as the most frequently installed measure, followed by HVAC measures, motors, and lighting controls. See Table IV.5.
quanec Evaluation of Transition C&I Programs – IV-2 The Energy Trust of Oregon

Table IV.5: Non-Participants that Installed High-Efficiency Measures Customers %
Installed High E Measures 41 21% Lighting retrofits 20 27% Lighting controls 10 13% HVAC 21 28% Motors 11 15% Air Compression 4 5% Other 9 12%
Non-participants that had installed high-efficiency equipment were asked if they received funding from other sources. Several reported funding from the Oregon Office of Energy, while two reported funding from other utilities (EWEB and Salem Electric).
Non-participants who reported to have installed new energy-efficiency measures were also probed for reasons preventing them from soliciting funding for their installations. “Lack of information” was the main reason cited by respondents. Other reasons, as listed in Table IV.6, include “wrong timing” (e.g., depletion of program funds at the time of the request), insufficient incentives, and the “hassle” associated with the paper work.
Table IV.6: Barriers to Participation Reason Number
Too little information 23 Wrong timing 8 Not sure 7 Too little Incentive 5 Too much hassle 5 No funding available 5 No decisions at this level 3 Other 8
When non-participants were asked about ways in which the ETO could encourage them to participate, it appeared that many did not distinguish between the tax-credits available through the Oregon Energy Office and the incentives provided by the ETO. Several respondents indicated that more information and subsidies would indeed help, and a small number of respondents indicated that incentives are unlikely to help due to the lack of matching funds on their parts.
quantec Evaluation of Transition C&I Programs – IV-3 The Energy Trust of Oregon

Spillover and Free-Rider Effects
Free-rider and spillover effects comprise the principal sources of variance between gross and net savings. Determination of the levels of these effects through direct elicitation was, therefore, an important component of telephone surveys of both participants and non-participants.
Free-Ridership
A key component of the participant survey was to find out whether some or all of the energy-efficiency measures offered under the utility programs would have been installed without the incentives. That is, to determine that portion of energy savings which might not be entirely attributable to the program. For the purpose of this study, free-ridership estimates were made based on participants’ responses to a series of logically structured questions as follows:
• Had the participant already ordered or installed the measure prior to participating in the program?
• Would the participant have installed the measure without program incentives and if so, o Would the installed measures be at the same level of
efficiency? o Would all of the measures have been installed? o Would the measures have been installed within the same time
frame (within the next two years)? o Were the measure costs incorporated in the participant’s short
or long-term capital budgets?
A free-rider “score” was then calculated for each respondent depending of answers to these questions. These scores were derived as a composite index by assigning weights to alternative combinations of responses. The basis for the assignation of free-ridership scores is shown in Table IV.7.
Sector-specific free-ridership rates were then calculated for lighting and non-lighting measures by weighting free-ridership scores by kWh savings estimates. (Number of responses for individual measures other than lighting was too small to allow calculation of free-rider estimates on a measure-by-measure basis.)
As shown in Table IV.8, this analysis has shown that on average, 8% of the program savings would have been realized without the program incentives.4 Lighting was found to have by far a higher free-ridership rate than non-lighting measures (10% for lighting compared to 1% for other measures). The
4 Utility-specific samples were too small to allow separate analyses for each utility.
quanec Evaluation of Transition C&I Programs – IV-4 The Energy Trust of Oregon

observed difference, however, is likely to be the results of the fact that lighting retrofit was the most common measure installed under the programs. The level of free-ridership was found to be highest for food stores (18%), followed by schools (12%) and restaurants (12%). Based on the survey responses, there were no free-riders in the lodging and warehouse market segments.
Table IV.7: Free-Ridership Logic Free-
Ridership Score
Already Ordered or Installed
Would have Installed w/o
Program Same
Efficiency Would have
Installed All of the Measures
Planning to Install Soon
Already in Budget
100% Yes Yes - - - - - - - - - - - - 0% No No - - - - - - - - - - - - 0% No Yes No - - - - - - - - - 50% No Yes Yes Yes Yes Yes 25% No Yes Yes Yes No Yes 25% No Yes Yes Yes Yes No 0% No Yes Yes Yes No No 25% No Yes Yes No Yes Yes
12.5% No Yes Yes No No Yes 12.5% No Yes Yes No Yes No
0% No Yes Yes No No No
Table IV.8: Savings-Weighted Free-Ridership Rate by Measure Category and Sector
Overall Lighting Non-Lighting Food Stores 18% 34% 0% Health 2% 2% - - - Lodging 0% 0% - - - Miscellaneous 9% 8% 23% Office 7% 9% 4% Restaurant 12% 12% - - - Retail 8% 8% 0% Schools 12% 14% 0% Warehouse 0% 0% 0% Overall 8% 10% 1%
quantec Evaluation of Transition C&I Programs – IV-5 The Energy Trust of Oregon

Spillover Effects
Spillover effects represent potential electricity savings realized as a result of the customers’ voluntary installation of measures without program support. In this study, two different sources for spillover were considered:
1. The effects associated with additional measures installed by participants where such decisions were reportedly influenced by the program
2. The effects associated with independent installation of high-efficiency measures by non-participants who were aware of and reportedly influenced by the program
Estimation of spillover effects associated with participants was based on whether they had installed additional measures and the extent to which this decision was influenced by the program. As can be seen in Table IV.9, nearly 10% of participants reported to have installed additional measures; of these, more than 50% stated that they were “very” or “somewhat” influenced by the program. Due to the lack of surveyed participants’ knowledge of the energy savings expected from the additional measures, a weighting scheme could not be applied and spillover is estimated based simply on response frequencies. The spillover rate for participants, as shown in Table IV.9, is estimated at approximately 8%.
Table IV.9: Participant Spillover Rate
No. Respondents
Spillover Attribution
No. Spillover
Installed Additional Measures 27 16 Decision Influenced by Program
Very 13 100% 13 Somewhat 2 67% 1 Moderately 6 33% 2 Not at all 6 0% 0
Overall Spillover 8%
The spillover effect associated with non-participant actions is based on the number of non-participants who were reportedly aware of program services but chose to install energy efficiency measures without program support. A preliminary analysis of these was reported in Table IV.5 above. The logic for calculation of non-participants and response frequencies are shown in Figure IV.1. Of the 41 non-participants who report to have installed high-efficiency measures, 76% were aware of the utility programs and 52% indicated that they were influenced by it. The spillover rate for non-participants is calculated as the product of these figures, or 8%.
quanec Evaluation of Transition C&I Programs – IV-6 The Energy Trust of Oregon

Logically, the combined spillover effect associated with the program is estimated as the sum of spillover rates from participant (8%) and non-participant sources (8%). Yet, in our judgment, this approach is likely to overstate the actual spillover rate due to the fact that the survey findings provide no guidance as to the magnitude of potential savings that are likely to result from the reported installations. We therefore discounted the overall spillover rate by 50%. Based on the participant and non-participant responses, the overall spillover effect attributable to the program is estimated at 8% of savings. It is important to note that the actual spillover effects are likely to be higher due to fact that the approach outlined above does not account for potential “market-transformation” effects of the program. These effects generally manifest themselves in terms of increased availability of high-efficiency equipment due to the market activity generated by the program.
Figure IV.1: Basis for Determination of Non-Participant Spillover Effect
Surveyed Non ParticipantsN=202
Surveyed Non ParticipantsN=202
Did not Install MeasuresN=159 (80%)
Did not Install MeasuresN=159 (80%)
Installed High EfficiencyMeasures
N=41 (21%)
Installed High EfficiencyMeasures
N=41 (21%)
Aware of ProgramN=31 (76%)
Aware of ProgramN=31 (76%)
Not Aware of ProgramN=10 (24%)
Not Aware of ProgramN=10 (24%)
InfluencedN=16 (52%)InfluencedN=16 (52%)
Not InfluencedN=15 (48%)
Not InfluencedN=15 (48%)
Additional Energy Efficiency Opportunities
Participants and non-participants were asked if any additional opportunities for high-efficiency equipment were available at their facilities. More than one-half of participants indicated opportunities with the HVAC system. As shown in Table IV.10, about 25% of participants and non-participants report an interest in lighting retrofits. The table below summarizes the proportion of responses for each category of energy efficiency opportunity.
quantec Evaluation of Transition C&I Programs – IV-7 The Energy Trust of Oregon

Table IV.10: Remaining Energy Efficiency Opportunities
Participants Non-Participants
Lighting Retrofits 23% 25% Lighting Controls 5% 24% HVAC 52% 24% Motors 5% 17% Air Compression 1% 11% Other 6% 0% Total Responses 77 170
quanec Evaluation of Transition C&I Programs – IV-8 The Energy Trust of Oregon

V. Energy Savings
In this study, savings estimates are characterized in terms of three distinct measures: initial (ex ante) engineering, adjusted gross (ex post), and net savings. The ex ante estimates consist of calculated savings derived during the project design phases. Ex post estimates are defined as ex ante estimates verified either through on-site verification, simulation, or statistical analysis of consumption histories. Finally, net savings represent verified ex post estimates adjusted for various market effects such as free-ridership, spillover, and naturally occurring conservation. This section presents a summary of estimated savings resulting from the application of six different methods for estimating gross and net savings.
Adjusted Gross Savings Estimates
Estimated gross savings resulting from the application of the six methods described in Section II, the original savings estimates and the savings realization rates by sector and commercial market segments, are reported in Table V.1. For reasons that were discussed before, the statistical methods were applied only to the commercial sector. Moreover, due the large variance in total annual consumption levels, the large and small-/medium-size commercial sites were analyzed separately. No attempt was made to apply simulation modeling to industrial facilities and several commercial sites where only outdoor lighting measures were installed.
As can be seen in Table V.1, the overall gross savings realization rates resulting from the application of the six estimation methods show a relatively wide range of 70% to over 100% in the small- and medium-size commercial sites and between 56% and 94% for large commercial facilities. Gross realization rate for the industrial sector is estimated at approximately 100% based on on-site verifications.
Margins of error, calculated at a 90% level of confidence, also vary widely across the different methods, ranging from 3% for the SAE models to 13% for the energy simulation results. It is important to note that the relatively large margins of error associated with site visits (11%) and simulation modeling (13%) are primarily a result of small sample sizes. It therefore appears that the greater accuracy associated with these methods, especially simulation modeling, is likely to be offset by lower levels of confidence, since the high costs associated with these methods precludes their application to large samples.
Gross savings estimates also show a wide range both across segments (within method variance) and across methods (within segment variance). The health and restaurant segments, for example, show consistently higher savings across
quantec Evaluation of Transition C&I Programs – V-1 The Energy Trust of Oregon
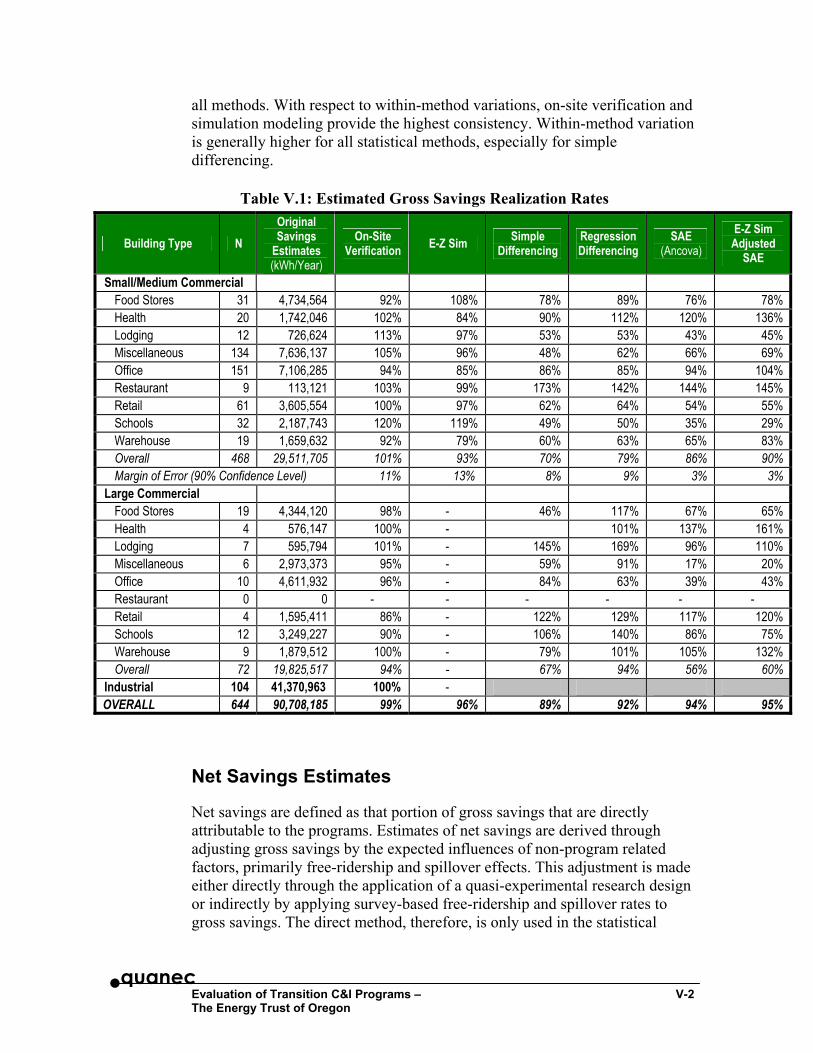
all methods. With respect to within-method variations, on-site verification and simulation modeling provide the highest consistency. Within-method variation is generally higher for all statistical methods, especially for simple differencing.
Table V.1: Estimated Gross Savings Realization Rates
Building Type N Original Savings
Estimates (kWh/Year)
On-Site Verification E-Z Sim Simple
Differencing Regression Differencing
SAE (Ancova)
E-Z Sim Adjusted
SAE
Small/Medium Commercial Food Stores 31 4,734,564 92% 108% 78% 89% 76% 78% Health 20 1,742,046 102% 84% 90% 112% 120% 136% Lodging 12 726,624 113% 97% 53% 53% 43% 45% Miscellaneous 134 7,636,137 105% 96% 48% 62% 66% 69% Office 151 7,106,285 94% 85% 86% 85% 94% 104% Restaurant 9 113,121 103% 99% 173% 142% 144% 145% Retail 61 3,605,554 100% 97% 62% 64% 54% 55% Schools 32 2,187,743 120% 119% 49% 50% 35% 29% Warehouse 19 1,659,632 92% 79% 60% 63% 65% 83% Overall 468 29,511,705 101% 93% 70% 79% 86% 90% Margin of Error (90% Confidence Level) 11% 13% 8% 9% 3% 3%
Large Commercial Food Stores 19 4,344,120 98% - 46% 117% 67% 65% Health 4 576,147 100% - 101% 137% 161% Lodging 7 595,794 101% - 145% 169% 96% 110% Miscellaneous 6 2,973,373 95% - 59% 91% 17% 20% Office 10 4,611,932 96% - 84% 63% 39% 43% Restaurant 0 0 - - - - - - Retail 4 1,595,411 86% - 122% 129% 117% 120% Schools 12 3,249,227 90% - 106% 140% 86% 75% Warehouse 9 1,879,512 100% - 79% 101% 105% 132% Overall 72 19,825,517 94% - 67% 94% 56% 60%
Industrial 104 41,370,963 100% - OVERALL 644 90,708,185 99% 96% 89% 92% 94% 95%
Net Savings Estimates
Net savings are defined as that portion of gross savings that are directly attributable to the programs. Estimates of net savings are derived through adjusting gross savings by the expected influences of non-program related factors, primarily free-ridership and spillover effects. This adjustment is made either directly through the application of a quasi-experimental research design or indirectly by applying survey-based free-ridership and spillover rates to gross savings. The direct method, therefore, is only used in the statistical
quanec Evaluation of Transition C&I Programs – V-2 The Energy Trust of Oregon

methods, while the indirect method was applied to non-statistical approaches, namely simulation and on-site verification.
The results, as shown in Table V.2, indicate that estimates of net saving realization rates in the small and medium-size commercial sites range between 63% (simple differencing) and 100% (on-site verification). The overall, program-level realization rates, however, show a relatively smaller range of 85% (simple differencing) to 97% (on-site verification). With respect to segment-specific estimates, the statistical methods result in unrealistically high realization rates of over 200% for simple and regression-based differencing. In our judgment, these anomalous estimates are purely a function of very small sample sizes for this segment.
Table V.2: Estimated Net Savings Realization Rates
Building Type N Original Savings
Estimates (kWh/Year)
On-Site Verification* E-Z Sim* Simple
Differencing Regression Differencing
SAE (Ancova)
E-Z Sim Adjusted
SAE
Small/Medium Com. Food Stores 31 4,734,564 81% 95% 65% 64% 75% 77% Health 20 1,742,046 107% 88% 111% 112% 119% 135% Lodging 12 726,624 121% 104% 21% 32% 41% 43% Miscellaneous 134 7,636,137 103% 94% 51% 52% 64% 67% Office 151 7,106,285 94% 85% 63% 64% 94% 104% Restaurant 9 113,121 98% 94% 228% 223% 142% 144% Retail 61 3,605,554 99% 96% 59% 59% 54% 56% Schools 32 2,187,743 113% 112% 68% 68% 42% 35% Warehouse 19 1,659,632 98% 85% 54% 54% 65% 82% Overall 468 29,511,705 100% 92% 63% 64% 85% 90%
Margin of Error (90% Confidence Level) 11% 13% 12% 11% 3% 3% Large Commercial
Food Stores 14 4,344,120 98% - - - - - Health 2 576,147 100% - - - - - Lodging 6 595,794 39% - - - - - Miscellaneous 4 2,973,373 93% - - - - - Office 7 4,611,932 88% - - - - - Restaurant 0 0 0% - - - - - Retail 3 1,595,411 86% - - - - - Schools 5 3,249,227 90% - - - - - Warehouse 4 1,879,512 100% - - - - - Overall 72 19,825,517 90% - - - - -
Industrial 104 41,370,963 99% - OVERALL 644 90,708,185 97% 95% 85% 86% 93% 94% * Adjusted by free-ridership and spillover effects based on survey results.
quantec Evaluation of Transition C&I Programs – V-3 The Energy Trust of Oregon

Net-to-Gross Savings Ratios
Initial ex ante and the final net savings estimates from the commercial and industrial programs implemented by PGE and Pacific Power are reported in Table V.3. These net savings estimates are based on the results of SAE models for the small- and medium-size commercial sites and on-site verification for the large commercial and industrial facilities. In our judgment, these methods represent the most cost-effective approaches for estimating net savings in these sectors and provide reasonably accurate results.
Table V.3: Estimated Gross-to-Net Ratios by Sector
Building Type N Initial Savings Estimates Net Savings Net/Gross
Ratio Small/Medium Commercial
Food Stores 31 4,734,564 3,550,923 75% Health 20 1,742,046 2,073,035 119% Lodging 12 726,624 297,916 41% Miscellaneous 134 7,636,137 4,887,128 64% Office 151 7,106,285 6,679,907 94% Restaurant 9 113,121 160,632 142% Retail 61 3,605,554 1,946,999 54% Schools 32 2,187,743 918,852 42% Warehouse 19 1,659,632 1,078,761 65% Overall Sm./Med. Commercial 468 29,511,705 25,084,950 85%
Large Commercial Food Stores 19 4,344,120 4,273,211 98% Health 4 576,147 576,147 100% Lodging 7 595,794 231,119 39% Miscellaneous 6 2,973,373 2,774,162 93% Office 10 4,611,932 4,052,693 88% Restaurant 0 Retail 4 1,595,411 1,373,605 86% Schools 12 3,249,227 2,930,354 90% Warehouse 9 1,879,512 1,879,512 100% Overall Large Commercial 72 19,825,517 17,842,965 90%
Industrial 104 41,370,963 41,110,714 99% Program Level 644 90,708,185 84,038,629 93%
The net-to-gross ratios, calculated as the ratio of verified net savings and initial, ex ante estimates, indicate that 93% of the expected program-level savings were actually realized. The results show that nearly all estimated savings in the industrial sector were realized. The savings realization rate for the large commercial facilities was 90% on average, while 85% of expected savings in the small- and medium-size commercial buildings were realized.
quanec Evaluation of Transition C&I Programs – V-4 The Energy Trust of Oregon

Measure-Level Savings Realization Rates
Measure-specific savings realization rates were estimated for lighting and non-lighting measures for the sample of small/medium commercial sites. Because of the scarcity of cases where only non-lighting measures were installed, savings associated with these measures were consolidated into one group. This aggregation was particularly necessary for calibrating the SAE model to create sufficient variation in the explanatory variables.
Measure-specific net realization rates for three of the main methods are reported in the table below. As can be seen, savings realization rate for lighting measures were lower than for non-lighting measures. The lower realization rate for lighting measures is consistent with the results of participant surveys, where failures were reportedly all associated with lighting measures.
Estimates obtained from simulation and SAE methods both seem reasonable. However, the simulation results predict a markedly higher realization rate for lighting measures than does SAE (91% compared to 77%). In comparing these estimates it is important to note that, first, the margin of error associated with the simulation results are considerably higher they are for the SAE results. Second, based on the survey results, nearly 90% of the overall free-ridership effect is attributable to lighting measures. Once adjusted for the difference in free-ridership rate, the actual E-Z Sim net realization rate for lighting would be close to 82% (91% * 90%).
The SAE estimate is also likely to be understated due to the limited number of sites where non-lighting measures were installed. In our view, therefore, the adjusted simulation estimate of 82% appears as a more reasonable approximation of net realization rate for lighting measures.
Table V.4: Net Savings Realization Rates by Measure
Site Visit Adjusted E-Z Sim SAE (Ancova)
Lighting 95% 91% 77% Non Lighting 116% 95% 97% Overall 100% 92% 85%
quantec Evaluation of Transition C&I Programs – V-5 The Energy Trust of Oregon

VI. Summary and Recommendations
The methods tested in this evaluation resulted in a wide range of results for estimates of gross and net savings. In choosing a suitable method, it is important to take three factors into account: estimation cost, accuracy, and efficiency of the estimates. The choice must be made through careful weighing of these factors based on practical considerations and careful assessment of possible tradeoffs among these. Finally, it is important to recognize that the results must also appear “reasonable” in light of experience and expert judgment.
Engineering Methods
The results of this study have shown that initial engineering estimates generally tend to be a good approximation of observed impacts. However, they cannot be relied upon as a sole means of determining actual savings. The use of engineering methods for calculation of savings, combined with on-site verification on a small sample of participants is a reliable and cost-effective means of verification, especially for larger commercial sites and industrial facilities.
Simulation modeling, using simple-to-use software involving a reasonable level of data-collection effort, such as EZSim, is an effective approach to savings verification. However, simulation modeling is difficult to perform for large commercial and industrial facilities due to the inherent complexity of the energy systems and extensive data requirements for a thorough energy simulation. Simulation modeling, using field data, is also expensive and, therefore, can be applied only to small samples, hence resulting in relatively high margins of error when the results are extrapolated to the population of participants. For the large commercial and industrial sites, we recommend using initial engineering estimates in conjunction with on-site inspection and verification of installed measures and operating conditions on a properly drawn sample.
Statistical Consumption Analysis
The experience of this study has shown that simple pre-post differencing is not a reliable approach for verification of savings. Savings estimates derived through this method are generally accompanied by unacceptably high margins of error.
The results of this study have also shown that more advanced statistical methods such as regression-based techniques, which explicitly account for exogenous factors such as weather result in more reliable estimates without
quantec Evaluation of Transition C&I Programs – VI-1 The Energy Trust of Oregon

imposing additional analysis costs. It is, moreover, indicated that the application of the latter methods in the context of a quasi-experimental research design is an effective means of deriving estimates of “net” impacts, particularly for small- to medium-size facilities.
It is important to point out that it is imperative that any quasi-experimental research design be structured with a carefully constructed comparison group. This is especially important where large variances in participants’ annual consumption are present. The recommended approach for such research design is to first construct “matching” control groups, which are representative of the range of annual consumption of participants.
In this study, a statistical matching technique was used to ensure comparability of the participant and non-participant groups. This approach involved first assigning the participants to quartiles based on pre-participation annual consumption levels. For each quartile, an equal number of non-participants, whose consumption matched the range, were drawn randomly from the population of non-participants and designated as a control group. To ensure the validity of this approach, the sampling process was repeated through a Monte Carlo simulation approach to examine the results with multiple samples. One hundred iterations resulted in less than 1% variation in overall savings realization results and no more than 3% variation in the segment-specific results.
Quasi-experimental research design is at best difficult to implement for large commercial and industrial facilities for the following reasons:
a. Difficult to find a comparable control group
b. Savings, especially for lighting retrofit programs, generally represent a small fraction of total annual consumption. Also, they are difficult to capture in a statistical analysis of consumption histories due to the intervention of a myriad of confounding factors
c. Generally it is very difficult to map meters to actual project sites in the case of multi-meter and multi-facility customers
In the absence of complete information on customers’ facilities and accurate identification of “meter points,” matching of the participating “projects” to the appropriate customers and meters can pose an insurmountable challenge. In our view, this problem may be addressed by accurate recording of utility meter points and associated meter numbers at the time of the initial audit or installation.
Combined Engineering/Statistical Methods
Combined engineering/ SAE techniques represent the most accurate and cost-effective approach for estimating gross savings, particularly in the small- and medium-size facilities. Application of these techniques in the context of a
quanec Evaluation of Transition C&I Programs – VI-2 The Energy Trust of Oregon

quasi-experimental research design has also shown to provide reliable estimates of net impacts in these sectors.
In our view, and based on the lessons learned in this study, SAE models offer three distinct advantages over other approaches. First, the approach relies solely on already available program activity and consumption data. Second, it affords the opportunity to estimate gross and net realization rate at the program and measure levels directly. Finally, it imposes little or no incremental cost over other statistical approaches, since its data requirements are essentially the same.
Based on the results of this study, it appears that the use of simulation analysis in conjunction with statistical methods improves the estimates modestly. However, the gains in accuracy are not justified by the additional data-collection and analysis cost.
Free-Ridership and Spillover Effects
The results of this study have shown that well structured and well executed surveys may be an effective way to obtain estimates for free-ridership and spillover effects. However, the use of surveys for large commercial, multi-facility commercial and industrial customers might prove problematic. In these cases it is often difficult to identify the actual decision makers, and misconstrued questions or misreported responses can have dramatic effects on program attribution.
Our findings also suggest that the programs offered by the two utilities generated appreciable spillover effects and that these were large enough to offset the potential free-ridership effects. The absence of any apparent net market effects suggests that the ETO may consider excluding an assessment of free-ridership in its future evaluations. What is more, since, from a societal point of view, incentive payments constitute “transfer” payments, arguably the question of free-ridership might no be entirely relevant to appraisals of program performance.
Methodology Recommendations
Calculation of net impacts in the small- and medium-size commercial buildings is best accomplished through combined statistical/engineering estimation using a quasi-experimental design. Application of the various methods for calculating savings realization rates indicate that SAE models are the most cost-effective methods for estimating net impacts in the small- and medium-size commercial sites and appear to provide reasonable estimates with an acceptable margin or error.
Simulation modeling provides an accurate means of estimating gross impacts. However, due to its high analysis and data costs, it can only be applied to limited samples; therefore it does not improve statistical precision above what
quantec Evaluation of Transition C&I Programs – VI-3 The Energy Trust of Oregon

can be obtained from on-site verification. On-site inspection and verification on a small sample of sites in found to be the most reasonable and cost-effective method for estimating gross savings in the large commercial and industrial sectors.
quanec Evaluation of Transition C&I Programs – VI-4 The Energy Trust of Oregon

Appendix A. Survey Instruments
Participant Telephone Survey Protocol
Non-Participant Telephone Survey Protocol
On-Site Data Collection Form
quantec Evaluation of Transition C&I Programs – A-1 The Energy Trust of Oregon

«Project_Name»
Participant Survey for Transition C&I Retrofit Programs
Company Name: «Project_Name»
Contact: «Contact_First_Name» «Contact_Last_Name»
City/State: «Contact_Address» «Contact_Address1», «Contact_City»
Telephone: «Contact_Phone»
Utility: «Utility»
Business Type: «seg_name»
Completion of Participation: «endDate»
Program Name : «Program_Name»
Survey Date:
Survey outcome:
______ Five or more call backs ______ Wrong number
______ Contact no longer at company ______ Refusal
______ Other. Specify
Surveyor Notes:
Measures Installed «meas_1» «meas_2» «meas_3» «meas_4» «meas_5» «meas_6»

Hello, I’m calling on behalf of the Energy Trust of Oregon regarding a study of energy conservation opportunities in Oregon. Are you familiar with the Energy Trust of Oregon?
• Yes .............................................................................continue
• No...............................................................................Explain ETO and continue: The Energy Trust of Oregon is a nonprofit organization promoting clean energy. Under an agreement with the Public Utility Commission, the Energy Trust receives the 3 percent public purpose charge from PGE and PacifiCorp customers. Most of these funds are invested in energy conservation and green power.
This is not a solicitation; we are simply trying to gather some information that will help the Energy Trust to improve their energy efficiency program planning efforts and services. None of this information will be used to re-calculate incentives or tax credits already received. Our records show that this facility received energy efficiency measures through «Utility»’s energy efficiency program which the Energy Trust funded. Are you familiar with your company’s participation?
• Yes .............................................................................This is a short survey that will take no longer than 10 minutes. Is this a good time for you?
• Not a good time..........................................................Could we schedule a time for me to call you back? Record: date/time _____________________________________________
• No...............................................................................Who would be a better contact? (RECORD INFO) ____________________________________________________
MEASURE INSTALLATION
Our records show that you received «meas_1», «meas_2», «meas_3», «meas_4», «meas_5», «meas_6», «meas_7», «meas_8»,«meas_9». I would like to ask a few questions, about each of these.
1. Are all of the [Measures] still in place and functioning properly?
•..................................................................................Yes
•..................................................................................No (if specify in SOURCE and QUANTITY in table below)

Table 1 Q1 Q1, specify
Measure Functioning Properly (Type
Y or N) Source/Quantity of Non-function
«meas_1»
____Burn out ____Removal ____Malfunction ____No longer needed ____Change in operating conditions ____Did not meet design expectations _____Other ___________ __________ Quantity (prefer percentage)
«meas_2» «meas_3» «meas_4» «meas_5» «meas_6» «meas_7» «meas_8» «meas_9»
FREE RIDERSHIP FOR EACH MEASURE:
2. Would you have installed the [MEASURE] without the program incentive?
• _____ Yes
• _____ No..............................................................(Loop to Next Measure/Q6)
• _____ Uncertain...................................................(Loop to Next Measure/Q6)
3. Before the project, had you previously installed the same type of [MEASURE] without an incentive?
• _____ Yes
• _____ No..............................................................(Loop to Next Measure/Q6)
• _____ Uncertain...................................................(Loop to Next Measure/Q6)

4. To the same level of efficiency?
• _____ Yes
• _____ No
5. [Only for multiple measures] Would you have installed:
• _____ All of the measures
• _____ Some of the measures (Specify )
6. Would you have installed the [MEASURE]: (record in Table 2)
• _____ In the same year
• _____ In one to two years
• _____ In three to five years
• _____ More than five years out
7. Did you have funding these measures in your short or long-term capital improvements plan/budget?
• _____ Short Term (0-1 years)
• _____ Long Term 1-5 years)
• _____ No..............................................................(Loop to Next Measure/Q6)
8. Was it already ordered?
• _____ Yes
• _____ No
Table 2: Free-Ridership Grid: Enter For each installed program measure
Measure Installed
w/o incentive
?
Same level of
Efficiency?
Amount of Measures?
Time Frame Budgeted?
«meas_1»
«meas_2»
«meas_3»
«meas_4»
«meas_5»
«meas_6»
«meas_7»

SPILLOVER
9. Since participating in the program, have you installed any additional energy efficiency measures without incentives from your utility or other energy organizations?
• _____ Yes
• _____ No..............................................................GO TO Q10
10. Please describe the type and quantity of the equipment or measures. [If asked, this is for Oregon only]
11. Overall, how influential would you say the program was in your decision to install additional measures?
• _____ Very influential
• _____ Somewhat influential
• _____ Moderately influential
• _____ Not at all influential
REMAINING POTENTIAL
12. In your opinion, are there any remaining opportunities for additional energy efficiency improvements at your facility after participating the «Program_Name»?
• _____ Yes
• _____ No (Skip to Q12)
13. What are those opportunities? Opportunity
14. What about at other locations within Oregon?
• _____ Yes
• _____ No
• _____ Not Applicable (Only Location)

15. What are those opportunities? Opportunity
PROGRAM SATISFACTION I’d also like to ask you a few quick questions regarding your level of satisfaction with various elements of the «Program_Name».
16. First, how satisfied are you with the retrofitted equipment?
• ______ Very Satisfied
• ______ Somewhat Satisfied
• ______ Somewhat Dissatisfied
• ______ Very Dissatisfied
17. ____________________________________________________________________ [Any comments given regarding satisfaction of the equipment]
18. How satisfied were you with the technical assistance provided by the utility?
• ______ Very Satisfied
• ______ Somewhat Satisfied
• ______ Somewhat Dissatisfied
• ______ Very Dissatisfied
19. ____________________________________________________________________ [Any comments given regarding satisfaction of the equipment]
20. Second, how satisfied are you with the savings realized by the project?
• ______ Very Satisfied
• ______ Somewhat Satisfied
• ______ Somewhat Dissatisfied
• ______ Very Dissatisfied
• ______ Don’t Know/Undistinguishable

21. ___________________________________________________________________ [Any comments given regarding satisfaction with savings]
COMPANY INFORMATION
Finally, I just have a few questions that allow us to classify your business.
22. Our records show that your facility is a «seg_name». Is this correct?
• _____ Yes
• _____ No (Record new business type: )
23. Is your business a:
• _____ Independent Firm......................................Go to Q21
• _____ Franchise
• _____ Local Chain
• _____ National Chain
24. Where are final investment decisions made for matters such as energy efficiency upgrades?
• _____ This facility
• _____ Oregon
• _____ Elsewhere
25. What are the current weekday operating hours?
26. What are the current weekend operating hours?
27. Since the project, Have there been any changes in your facility (such as remodeling, hours of operation changes, facility layout ) that would affect the operation of these measures?
• Yes
• No.........................................................................Go to Q25

28. Please describe the general nature of the change.
• Remodel [basic description]
• Hours of operation change [OLD HOURS]
• Facility Layout [basic description]
• Process Capacity [basic description]
29. What is the square footage and number of stories (floors) of the facility? [PAC customer shows square footage as «sqft»]
• ______ Total sq. ft.
• ______ Conditioned sq. ft. (Heat and/or Cool)
• ______ Number of stories (floors)
30. Is the building framed with….
• ______ Wood frame
• ______ Masonry
• ______ Cement block
• ______ Steel frame
• ______ Other (Specify: )
• ______ Don’t know
31. What is the primary heating fuel used at the facility?
• ______ Electric
• ______ Gas
• ______ Oil
• ______ Steam
• ______ Other (Specify: )
• ______ Don’t know

32. What is the primary water heating fuel used at the facility??
• ______ Electric
• ______ Gas
• ______ Oil
• ______ Steam
• ______ Other (Specify: )
• ______ Don’t know
33. Does the facility have a cooling system?
• ______ Yes
• ______ No............................................................Go to Q32
• ______ Don’t know .............................................Go to Q32
34. What type of system?
• ______ Air cooled
• ______ Evaporative
• ______ Chilled water
• ______ Other (Specify: )
• ______ Don’t know
35. Is there an economizer on the cooling system?
• ______ Yes
• ______ No
• ______ Don’t know
36. As part of this study, we would like to collect more detailed information on a few facilities. Would it be OK if one of our professional engineers calls you to schedule an on-site visit?
• ______ Yes
• ______ No
37. Any last comments regarding your participation in the «Program_Name»?
Thank and terminate.

«Project_Name»
Non-Participant Survey for Transition C&I Retrofit Programs
Company Name: «Project_Name»
Contact: «Contact_First_Name» «Contact_Last_Name»
City/State: «Contact_Address» «Contact_Address1», «Contact_City»
Telephone: «Contact_Phone»
Utility: «Utility»
Business Type: «seg_name»
Survey Date:
Survey outcome:
______ Five or more call backs ______ Wrong number
______ Contact no longer at company ______ Refusal
______ Other (specify )
Surveyor Notes:
Ask to speak with Building or Facility Manager.
1. Hello, I’m calling on behalf of the Energy Trust of Oregon regarding a study of energy conservation opportunities in Oregon. Are you familiar with the Energy Trust of Oregon?
• Yes .......................................................................continue
• No.........................................................................Explain ETO and continue: The Energy Trust of Oregon is a nonprofit organization promoting clean energy. Under an agreement with the Public Utility Commission, the Energy Trust receives the 3% public purpose charge from PGE and PacifiCorp customers. Most of these funds are invested in energy conservation and green power.

This is not a solicitation; we are simply trying to gather some information that will help the Energy Trust to improve its energy efficiency program planning efforts and services.
2. At this facility, are you the person who makes decisions regarding the purchase of energy-using equipment such as heating or cooling systems or lighting?
• Yes
• No ........................................................................Who would be a better contact? (Record info ____________________________________________________)
3. This is a short survey that will take no longer than 5 minutes. Is this a good time for you?
• Yes .......................................................................continue
• No.........................................................................Could we schedule a time for me to call you back? Record: (date/time )
4. In the past three years, have you installed any new energy-using equipment for remodeling, upgrades, or expansion? (If asked, we mean something that is more significant than installing a new light bulb. We’re looking for HVAC improvements, lighting retrofits, installation of lighting controls, building shell improvements, etc.)
• Yes
• No.........................................................................Skip to Q16

5. For the following categories: please note what you have installed, the approximate percentage of facility affected and the efficiency level of the equipment that you installed:
Equipment Type Installed: (Y/N) Percent of Facility Affected Efficiency Level
Lighting Retrofits High
Code levels Don’t know
Lighting Controls High
Code levels Don’t know
HVAC High
Code levels Don’t know
Motors High
Code levels Don’t know
Air Compression High
Code levels Don’t know
Others High
Code levels Don’t know
6. Are you aware of the <<UTILITY>> programs funded by the Energy Trust that provide incentives for the installation of energy efficiency equipment?
• Yes
• No.........................................................................Skip to Q9
7. Has your awareness of the <<UTILITY>> incentive programs influenced your decision to install this equipment?
• Yes
• No.........................................................................Skip to Q9
8. Please rate the level of influence on a scale of 1 to 5 with 5 as great influence and 1 as very little.
•
9. Did you receive funding from any outside source for energy efficiency improvements?
• Yes
• No.........................................................................Skip to Q11

10. May I ask what source(s)?
• (specify )
• If ENERGY TRUST/ PGE/PC between March 2002- March 2003 ...................................Thank and terminate
• All others..............................................................Skip to Q13
11. In making your decision to install the equipment, did you seek information about funding sources:
• Yes
• No
12. Why have you chosen not to obtain funding?
• Too little incentive
• Too much hassle
• Too little information
• Wrong timing
• Other (Specify: )
13. Overall, how important is energy efficiency in your purchasing and installation decisions?
• Extremely Important
• Very Important
• Important
• Not very important
14. In your opinion, are there any remaining opportunities for energy efficiency improvements at your facility?
• Yes (specify in following table)
• No.........................................................................Skip to Q19
Opportunity Lighting Retrofits: Lighting Controls: HVAC: Motors: Air Compression: Other:

15. What is the reason you have not installed energy efficient equipment:
• Lack of capital
• Lack of information about energy efficient options
• Inconvenient ........................................................Skip to 18
• Decisions are made elsewhere .............................Skip to 18
• Must time changes with other facilities ...............Skip to 18
• Energy bills are not a burden ...............................Skip to 18
• Other (specify: ) Skip to 18
16. Are you aware of the <<UTILITY>> programs funded by the Energy Trust that provide incentives for the installation of energy efficiency equipment?
• Yes
• No.........................................................................Skip to Q18
17. What can the ETO do to encourage you to participate?
•
COMPANY INFORMATION
Finally, I just have a few questions that allow us to classify your business.
18. Our records show that your facility is a «seg_name». Is this correct?
• Yes
• No (Record new business type: )
19. Is your business a:
• Independent Firm.................................................Skip to Q21
• Franchise
• Local Chain
• National Chain

20. Where are investment decisions made for matters such as equipment changes and upgrades?
• This facility
• Oregon
• Elsewhere
21. What is the square footage of the facility?
• ___________
22. What is the conditioned square footage of the facility?
• ___________
23. How many stories (floors) is the facility?
• ___________
24. What is the primary heating fuel used at the facility?
• Electric
• Gas
• Oil
• Steam
• Other (specify: )
• Don’t know
25. What is the primary water heating fuel used at the facility?
• Electric
• Gas
• Oil
• Steam
• Other (specify: )
• Don’t know

26. Does the facility have a cooling system?
• Yes
• No.........................................................................Thank and terminate
• Don’t know ..........................................................Thank and terminate
27. What type of system?
• Air cooled
• Evaporative
• Chilled water
• Other (specify: )
• Don’t know
Thank and terminate.

Evaluation of the Transition C&I Retrofit Programs On-Site Data Collection Form 2004
General Project Information
Project ID Number Utility Audit Date (m/d/y) Auditor Name
PacifiCorp
PGE
Building Type Program
Type Program
Start Date Program
Completion Date
Commercial _____ Industrial _____
Business Name
Street Address
City Zip
Contact Name Title
Phone # e-Mail
Total Bldg. Area (SF) Rentable Area (SF) SIC
Other Program Participation? Yes No Start Date End Date Program Name
Program Name
Program Name
Utility Program Types
PacifiCorp PGE 1 Small Retrofit (Schedule 115) 4 Retro Lighting 2 Retrofit Lighting (Schedule 116) 5 Retro HVAC 3 Energy Finanswer (Schedule 125) 6 Retro Custom
7 New Lighting 8 New HVAC 9 New Custom Incentive 10 New Earth Advantage
Building Types - Industrial 1 Chemical / Allied products 2 Electric / Electronic equipment 3 Food & Related products 4 Instruments / Related products
Building Types - Commercial 5 Lumber / Wood products
1 Assembly 6 Machinery (except electrical) 2 Education 7 Metal – Fabricated products 3 Food Store 8 Metal – Primary Industries 4 Hospital 9 Miscellaneous 5 Hotel / Motel 10 Paper / Allied products 6 Misc. 11 Petroleum related 7 Other Health 12 Printing / Publishing 8 Office 13 Rubber / Misc. Plastics products 9 Restaurant 14 Stone/Clay/Glass/Concrete products
10 Retail 15 Transportation equipment 11 Warehouse 16 Utilities

Installed Measures
Name: Proposed Savings (kWh/yr):
Lighting Retrofit Envelope Air Compressor
Lighting Controls Motors Refrigeration
HVAC Equipment Other Category
HVAC Controls
Lighting Retrofit
Affected Bldg. Area (SF)
Usage Hours Total Lighting Watts Affected
Watts / SF ∆ Watts / SF
Baseline (Proj File)
Proposed (Proj File)
Baseline (Site Visit)
Verified (Site Visit)
Baseline
ID Fixture Qty Watts / Fixture Total Watts Hours kWh/Yr
1
2
W/ft^2
Verification (Site Visit)
ID Fixture Qty Watts / Fixture Total Hours kWh/Yr
1
2
W/ft^2
change W/ft^2

Building Data
Total No. of Floors No. Floors Below Grade
Construction Type Cement Block Masonry Steel Frame Wood Frame
Wall Area (SF) % Glass Area Roof Area (SF)
Layers of Glazing 1 2 3
Glazing Material Clear Opaque Reflective Tinted
Fill Material Gas-filled Low-e None
Frame Type Metal Vinyl Wood
Interior Lighting Data
Interior Lighting Type T12 T8 T5 HPS MH
Ballast Type Electronic EE Magnetic
Est. LPD (W/SF) Annual Usage Factor (%) Average Hours/Day
Control Type Daylighting EMS T/C Manual None (continuous)
HVAC System Data
Single Duct – Heat Only Single Duct – Cool Only Single Duct – Heat & Cool Duct Configuration
Dual Duct Radiant, No Fans
On / Off CV - T/C CV - On / Off Fan Controls
VAV - Damper VAV – Vanes VAV – VSD VAV – Press. Reset
Heating Electric Resistance HP – Air Source HP – Ground Source
Fuel Type Natural Gas Steam Other
Temp Setpoint Occupied _______ Unoccupied _______
Heat Recovery Heat Pump Loop Other None
Cooling Chiller - Electric Evaporative HP – Air Source HP – Ground Source
System Type Absorption - Gas Absorption - Steam None
Temp Setpoint Occupied _______ Unoccupied _______
Economizer Yes No
Water Heating Fuel Electric Resistance Natural Gas Steam None

Utility Account Information
Account # Meter #
Account #1
Account #2
Account #3
Account #4
Account #5
Account #6
Account #7
Account #8
Account #9
Account #10