final report - cape town · page 1 of 203 water and sanitation customer perception and satisfaction...
TRANSCRIPT

WATER AND
SANITATION
CUSTOMER
PERCEPTION AND
SATISFACTION
SURVEY PROJECT
FINAL
REPORT

Page 1 of 203
WATER AND SANITATION CUSTOMER PERCEPTION AND SATISFACTION SURVEY
PROJECT
2013/2014 OUTCOMES
FINAL REPORT
NOVEMBER 2014

Page 2 of 203
TABLE OF CONTENTS
Table of Contents .......................................................................................................................................... 2
LIST OF FIGURES ...................................................................................................................................... 10
LIST OF TABLES ........................................................................................................................................ 14
EXECUTIVE SUMMARY ............................................................................................................................ 16
1. PROJECT BACKGROUND ................................................................................................................. 22
1.1 Project background ........................................................................................................................... 22
1.2 Project scope .................................................................................................................................... 22
1.3 Survey objectives .............................................................................................................................. 22
2. LITERATURE REVIEW ....................................................................................................................... 24
2.1 Introduction ....................................................................................................................................... 24
2.2 Definition of key terms ....................................................................................................................... 24
2.3 Significance of water and sanitation ................................................................................................. 24
2.4 Progress and challenges: Sustainability ........................................................................................... 25
2.5 Environmental impact ........................................................................................................................ 25
2.6 Water conservation ........................................................................................................................... 26
2.7 Water and sanitation: Quality and availability ................................................................................... 26
2.8 Affordability ....................................................................................................................................... 27
2.9 Conclusion ........................................................................................................................................ 27
3. METHODOLOGY ................................................................................................................................ 28
3.1 Introduction .................................................................................................................................. 28
3.2 Questionnaire development .............................................................................................................. 28
3.3 Data collection ................................................................................................................................... 28
3.3.1 Data collection methods .......................................................................................................... 28
3.3.2 Sampling ................................................................................................................................. 28
3.4 Data capturing and cleaning ............................................................................................................. 31
3.5 Conclusion ........................................................................................................................................ 31
4. CATALOGUE OF FINDINGS - FORMAL ............................................................................................... 32
4.1. Introduction .................................................................................................................................. 32
4.2. Demographic and economic indicators ....................................................................................... 32
4.2.1. Project area ............................................................................................................................. 32
4.2.2. Respondents age .................................................................................................................... 32
4.2.3. Gender .................................................................................................................................... 33
4.2.4. Racial grouping ....................................................................................................................... 34

Page 3 of 203
4.2.5. Language ................................................................................................................................ 34
4.2.6. Household income................................................................................................................... 35
4.2.7. Level of education ................................................................................................................... 35
4.2.8. Occupation status.................................................................................................................... 36
4.2.9. Type of property ...................................................................................................................... 37
4.2.10. Property Ownership................................................................................................................. 37
4.2.11. Household occupants .............................................................................................................. 38
4.2.12. Types of toilet .......................................................................................................................... 39
4.2.13. Ownership of electronic communication mediums .................................................................. 39
4.3. Insights into water and sanitation services ................................................................................. 39
4.3.1. Access to other water sources ................................................................................................ 40
4.3.2. Type of other sources of water ................................................................................................ 40
4.3.3. Average use of water .............................................................................................................. 40
4.3.4. Comparison of water consumption .......................................................................................... 41
4.3.5. Impact of tariffs on water usage .............................................................................................. 42
4.3.6. Perceptions on water and sanitation service delivery ............................................................. 42
4.4. Water conservation ..................................................................................................................... 43
4.4.1. Knowledge of water-conservation promotions ........................................................................ 44
4.4.2. Behaviour change towards water conservation ...................................................................... 44
4.4.3. Behaviours that facilitate water conservation .......................................................................... 45
4.4.4. Awareness of presentations .................................................................................................... 46
4.5. Perceptions on water and sanitation services ............................................................................. 46
4.5.1. Ratings on water quality .......................................................................................................... 47
4.5.2. Satisfaction with water availability ........................................................................................... 47
4.5.3. Experience with water-related problems ................................................................................. 48
4.5.4. Categories of water-related problems ..................................................................................... 49
4.5.5. Occurrence of water-related problems .................................................................................... 49
4.5.6. Overall satisfaction with sanitation services ............................................................................ 50
4.5.7. Sanitation related problems experienced ................................................................................ 50
4.5.8. Sewerage or sanitation problems experienced ....................................................................... 51
4.5.9. Sewerage related problems frequency ................................................................................... 51
4.6 Customer complaint lodging process .......................................................................................... 52
4.6.1 Knowledge of the City’s contact details ......................................................................... 52
4.6.2 Complaint lodging of faulty or broken sewerage pipes ................................................ 53
4.6.3 Reporting of water or sanitation related problems ........................................................ 54

Page 4 of 203
4.6.2 Workmen service delivery rating ............................................................................................. 54
4.6.3 Time taken to fix water or sanitation problem ......................................................................... 56
4.6.4 Service quality of workmen ..................................................................................................... 56
4.6.5 Expected time in order to be fixed........................................................................................... 57
4.7 Value/billing process ................................................................................................................... 58
4.7.2 Average monthly payment ...................................................................................................... 58
4.7.3 Frequency in checking water and sanitation bill ..................................................................... 59
4.7.4 Respondents’ opinions on water bill........................................................................................ 60
4.7.5 Satisfaction with the billing process ........................................................................................ 60
4.7.6 Rating of price of water services ............................................................................................. 61
4.7.7 Rating of price of sanitation services ...................................................................................... 62
4.7.8 Monthly household free water ................................................................................................. 63
4.7.9 Use of water management device........................................................................................... 63
4.7.10 Water availability and water management device ................................................................... 64
4.7.11 Frequency of water running out and water management devices .......................................... 65
4.7.12 Satisfaction with water management device ........................................................................... 66
4.7.13 Backyarders and formal residents’ households ...................................................................... 66
4.7.14 Backyarders with access to a standpipe ................................................................................. 67
4.7.15 Satisfaction with intervention ................................................................................................... 68
4.7.16 Overall satisfaction with water intervention ............................................................................. 68
4.7.17 Installation of a prepaid water meter ....................................................................................... 69
4.8 Awareness of customer service contact details for queries/ complains...................................... 70
4.8.2 Knowledge of contact details for queries. ............................................................................... 70
4.8.3 Awareness of the City’s landline and SMS numbers .............................................................. 71
4.8.4 Use of customer contact details .............................................................................................. 72
4.8.5 Readiness to receive informational materials ......................................................................... 72
4.8.6 Information sharing.................................................................................................................. 73
4.8.7 Preferred method of communication ....................................................................................... 74
4.9 Water and sanitation environmental impact ................................................................................ 75
4.9.2 Awareness of the impact of blocked sewers ........................................................................... 75
4.9.3 Awareness of the City’s by-laws ............................................................................................. 75
4.9.4 Categories of by-laws .............................................................................................................. 76
4.9.5 Awareness of illegal discharges into a sewer ......................................................................... 77
4.9.6 Awareness of penalty charges ................................................................................................ 77
4.9.7 Requests from water and sanitation presentations ................................................................. 78

Page 5 of 203
5. RECORD OF FINDINGS- INFORMAL................................................................................................ 80
5.1 Introduction .................................................................................................................................. 80
5.2 Demographics and economic indicators ..................................................................................... 80
5.2.2 Project area ............................................................................................................................. 80
5.2.3 Respondents’ age ................................................................................................................... 80
5.2.4 Gender .................................................................................................................................... 81
5.2.5 Racial group ............................................................................................................................ 82
5.2.6 Language most spoken at home ............................................................................................. 82
5.2.7 Monthly household income ..................................................................................................... 83
5.2.8 Level of educational attainment .............................................................................................. 83
5.2.9 Occupation status.................................................................................................................... 84
5.2.10 Household occupants .............................................................................................................. 85
5.2.11 Type of toilet ............................................................................................................................ 85
5.2.12 Electronic communication mediums........................................................................................ 86
5.3 Water supply and sanitation services ......................................................................................... 87
5.3.2 Access to other water sources ................................................................................................ 87
5.3.3 Sources of other water access ................................................................................................ 87
5.3.4 Average use of water .............................................................................................................. 88
5.3.5 Comparison of water consumption .......................................................................................... 89
5.3.6 Impact of tariffs on water usage .............................................................................................. 89
5.3.7 Perceptions of water and sanitation services .......................................................................... 91
5.4 Water conservation ..................................................................................................................... 92
5.4.2 Promotions on water conservation .......................................................................................... 92
5.4.3 Behaviour change ................................................................................................................... 92
5.4.4 Behaviours linked to water conservation ................................................................................ 93
5.4.5 Awareness of Water Conservation Officers ............................................................................ 94
5.5 Quality, availability and satisfaction ............................................................................................ 94
5.5.2 Ratings on water quality .......................................................................................................... 94
5.5.3 Satisfaction with water availability ........................................................................................... 95
5.5.4 Experience with water-related problems ................................................................................. 96
5.5.5 Categories of water-related problems ..................................................................................... 96
5.5.6 Distance to closest tap ............................................................................................................ 97
5.5.7 Number of households sharing tap ......................................................................................... 98
5.5.8 Household access to a standpipe ........................................................................................... 98
5.5.9 Time taken to fetch water from a standpipe ............................................................................ 99
Page 6 of 203
5.5.10 Daily water usage from the standpipe ................................................................................... 100
5.5.11 Water use during the last six month ...................................................................................... 100
5.5.12 Happiness towards standpipe ............................................................................................... 101
5.5.13 Overall satisfaction with standpipe intervention .................................................................... 101
5.5.14 Satisfaction with sanitation services...................................................................................... 102
5.5.15 Experiences with sanitation related problems ....................................................................... 103
5.5.16 Type of sanitation problems experienced ............................................................................. 103
5.5.17 Frequency of sanitation-related problems ............................................................................. 104
5.5.18 Distance to closest toilet ....................................................................................................... 105
5.5.19 Households sharing same toilet ............................................................................................ 105
5.5.20 Reporting on faulty/broken sewerage ................................................................................... 105
5.6 Knowledge of customer service contact details ........................................................................ 106
5.6.2 Awareness of how to contact the Department ...................................................................... 106
5.6.3 Contact with the City of Cape Town ...................................................................................... 107
5.6.4 Service provision experience rating ...................................................................................... 108
5.6.5 Time taken to respond to queries .......................................................................................... 108
5.6.6 Rating of service experience ................................................................................................. 109
5.6.7 Estimated time to resolve problems ...................................................................................... 110
5.7 Knowledge and awareness of contact details ........................................................................... 110
5.7.2 Awareness of customer contact details ................................................................................ 110
5.7.3 Awareness of landline and SMS numbers ............................................................................ 111
5.7.4 Use of customer service contact numbers ............................................................................ 112
5.7.5 Interest in receiving information ............................................................................................ 112
5.7.6 Ranking of communication channel ...................................................................................... 113
5.7.7 Sharing of water and sanitation information .......................................................................... 113
5.8 Awareness of sanitation environmental impact ......................................................................... 114
5.8.2 Awareness of blocked sewers’ impact .................................................................................. 114
5.8.3 Awareness of the City of Cape Town by-laws ...................................................................... 115
5.8.4 Familiarity with water and sanitation by-law categories ........................................................ 116
5.8.5 Awareness of illegal sewer discharges ................................................................................. 116
5.8.6 Awareness of water and sanitation penalty charges ............................................................. 117
5.8.7 Behaviours resulting in penalty charges ............................................................................... 118
5.8.8 Interest in presentations ........................................................................................................ 118
6. RECORD OF FINDINGS – BUSINESS ............................................................................................ 120
6.1 Introduction ................................................................................................................................ 120

Page 7 of 203
6.2 Characteristics of business respondents .................................................................................. 120
6.3 Water and sanitation services ................................................................................................... 120
6.3.1 Other water sources .............................................................................................................. 120
6.3.2 Types of other water sources ................................................................................................ 120
6.3.3 Business monthly water usage ............................................................................................. 121
6.3.4 Comparison of current and previous water consumption...................................................... 121
6.3.5 Impact of tariff increases ....................................................................................................... 122
6.3.6 Perceptions on water and sanitation services ....................................................................... 123
6.4 Perceptions on quality ............................................................................................................... 124
6.4.1 Water quality rating ............................................................................................................... 124
6.4.2 Satisfaction with provision of tap water ................................................................................. 124
6.4.3 Experience with water related problems ............................................................................... 125
6.4.4 Occurrence of water-related problems .................................................................................. 126
6.4.5 Overall satisfaction with sewerage services ......................................................................... 126
6.4.6 Experience with blockage or sanitation related problem ...................................................... 127
6.4.7 Frequency of sanitation-related problems ............................................................................. 128
6.5 Knowledge of contact details for queries .................................................................................. 128
6.5.1 Knowledge of the City’s contact details ................................................................................ 128
6.5.2 Reporting of water or sanitation related problems in the past 3 months ................. 129
6.5.3 Service delivery quality rating ............................................................................................... 129
6.5.4 Time taken to fix problems .................................................................................................... 130
6.5.5 Rating of service delivery quality........................................................................................... 131
6.5.6 Estimated time to fix problems .............................................................................................. 131
6.6 Value/billing processes ............................................................................................................. 132
6.6.1 Average monthly payment .................................................................................................... 132
6.6.2 Bill-checking frequency ......................................................................................................... 133
6.6.3 Perceptions on billing services .............................................................................................. 134
6.6.4 Satisfaction level with billing process .................................................................................... 134
6.6.5 Rating of price of water services ........................................................................................... 135
6.6.6 Rating of sanitation services prices....................................................................................... 135
6.6.7 Receipt of free water ............................................................................................................. 136
6.6.8 Water-management device ownership ................................................................................. 136
6.6.9 Installation of a prepaid water meter ..................................................................................... 137
6.6.10 Awareness of step-tariff ........................................................................................................ 138
6.7 Knowledge of contact details for queries .................................................................................. 138

Page 8 of 203
6.7.1 Awareness of customer service contact details .................................................................... 138
6.7.2 Awareness of City’s landline and SMS numbers .................................................................. 139
6.7.3 Contact with the City ............................................................................................................. 139
6.7.4 Interest in receiving information ............................................................................................ 140
6.7.5 Preferred method of communication ..................................................................................... 141
6.7.6 Information sharing................................................................................................................ 141
6.7.7 Nature of business ................................................................................................................ 142
6.7.8 Number of employees ........................................................................................................... 144
6.7.9 Type of toilets ........................................................................................................................ 144
6.7.10 Water-conservation policy ..................................................................................................... 145
6.7.11 Annual water audit................................................................................................................. 146
6.8 Knowledge on sanitation environmental impact........................................................................ 146
6.8.1 Awareness of impact of blocked sewers on environment ..................................................... 146
6.8.2 Awareness of City by-laws .................................................................................................... 147
6.8.3 Awareness of types of City by-laws ...................................................................................... 148
6.8.4 Awareness of illegal discharges ............................................................................................ 148
6.8.5 Awareness of penalty charges .............................................................................................. 149
6.8.6 Interest in presentations ........................................................................................................ 149
7. DISTRICT ANALYSIS – FORMAL .................................................................................................... 151
7. Introduction .................................................................................................................................... 151
7.1 Water consumption ................................................................................................................... 151
7.1.1 Monthly average water use ................................................................................................... 151
7.1.2 Current water consumption compared to previous year ....................................................... 152
7.2 Billing processes ....................................................................................................................... 152
7.2.1 Water tariffs impact on water consumption ........................................................................... 152
7.3 Information materials ................................................................................................................. 153
7.3.1 Awareness of advertising material ........................................................................................ 153
7.3.2 Behaviour change to conserve water .................................................................................... 154
7.4 Water services........................................................................................................................... 154
7.4.1 Satisfaction with provision of tapped water ........................................................................... 154
7.4.2 Experience with water-related problems ............................................................................... 155
7.5 Sanitation services .................................................................................................................... 155
7.5.1 Satisfaction with sanitation or sewerage services ................................................................. 155
7.5.2 Exposure to sewerage or sanitation related problems .......................................................... 156
7.6 Awareness of customer service contact details ........................................................................ 156

Page 9 of 203
7.7 Water billing............................................................................................................................... 157
7.7.1 Average water use per month ............................................................................................... 157
7.7.2 Satisfaction with the billing process ...................................................................................... 159
7.8 Water management device ownership ...................................................................................... 159
8. DISTRICT ANALYSIS – INFORMAL ................................................................................................ 160
8.1 Average use of water by district ................................................................................................ 160
8.2 Knowledge of water conservation promotions .......................................................................... 161
8.2.1 Change in behaviour ............................................................................................................. 162
8.2.2 Awareness of water conservation officers ............................................................................ 162
8.3 Water-related problems experienced ........................................................................................ 163
8.3.1 Overall satisfaction with water services ................................................................................ 163
8.3.2 Sanitation problems experienced .......................................................................................... 164
8.3.3 Overall satisfaction with sanitation services .......................................................................... 164
8.4 Information materials receipt ..................................................................................................... 165
8.5 Effects of blocked sewer on the environment ........................................................................... 165
9. Comparison of findings ................................................................................................................. 167
9.1 Formal Findings......................................................................................................................... 167
9.2 Informal Findings ....................................................................................................................... 180
9.3 Comparison: Business Findings................................................................................................ 190
10. CONCLUSIONS AND Recommendations .................................................................................... 201
10.1 Formal ....................................................................................................................................... 201
10.2 Informal ..................................................................................................................................... 202
10.3 Business .................................................................................................................................... 203

Page 10 of 203
LIST OF FIGURES Figure 1: Distribution of the formal residential participants by district ........................................................ 32
Figure 2: Distribution of respondents by age .............................................................................................. 33
Figure 3: Gender ......................................................................................................................................... 33
Figure 4: Distribution of respondents by race ............................................................................................. 34
Figure 5: Occupational status ..................................................................................................................... 36
Figure 6: Distribution of respondents according to the type of property lived in ......................................... 37
Figure 7: Ownership of premises ................................................................................................................ 37
Figure 8: Number of people in household ................................................................................................... 38
Figure 9: Type of water source ................................................................................................................... 40
Figure 10: Water used each month ............................................................................................................. 40
Figure 11: Water consumption compared to previous year ........................................................................ 41
Figure 12: Effects of tariff increases on water usage .................................................................................. 42
Figure 13: Knowledge of promotions .......................................................................................................... 44
Figure 14: Change of behaviour ................................................................................................................. 44
Figure 15: Awareness of presentations by Water Conservation Officers ................................................... 46
Figure 16: Ratings on water quality ............................................................................................................ 47
Figure 17: Overall satisfaction with water availability ................................................................................. 47
Figure 18: Experience with water-related problems ................................................................................... 48
Figure 19: Water related problems experienced ......................................................................................... 49
Figure 20: Overall satisfaction with sanitation or sewerage services ......................................................... 50
Figure 21: sewerage blockage or sanitation problems experienced........................................................... 50
Figure 22: Knowledge of contact details ..................................................................................................... 52
Figure 23: Reporting on faulty/broken pipes ............................................................................................... 53
Figure 24: Reporting of water or sanitation related problem in the last 3 months ...................................... 54
Figure 25: Call Centre rating ....................................................................................................................... 55
Figure 26: Time taken to fix the water or sanitation problem ...................................................................... 56
Figure 27: Service quality of workmen ........................................................................................................ 57
Figure 28: Expectations on duration of problem resolution ........................................................................ 58
Figure 29: Bill-checking frequency .............................................................................................................. 59
Figure 30: Respondents’ opinion on the billing process ............................................................................. 60
Figure 31: Satisfaction level with billing process......................................................................................... 61
Figure 32: Rating of water services’ pricing ................................................................................................ 61
Figure 33: Rating of sanitation services’ pricing ......................................................................................... 62
Figure 34: Free water supplied by the City of Cape Town per month ........................................................ 63
Figure 35: Water-management device ownership ...................................................................................... 64
Figure 36: Availability of water when using a water management device .................................................. 65
Figure 37: Frequency of running out of water when using water management devices ............................ 65
Figure 38: Satisfaction with water management device ............................................................................. 66
Figure 39: Residents with backyarders in their households ....................................................................... 67
Figure 40: Backyarders’ access to standpipes ........................................................................................... 67
Figure 41: Household residents’ satisfaction with water intervention provided to backyarders ................. 68
Figure 42: Household residents’ satisfaction with water intervention provided to backyarders ................. 69
Figure 43: Installation of prepaid water meter............................................................................................. 69
Figure 44: Awareness of contact details ..................................................................................................... 70
Figure 45: Awareness of the landline and SMS service numbers .............................................................. 71
Figure 46: Use of customer service contact detail ...................................................................................... 72

Page 11 of 203
Figure 47: Readiness to receive promotional material ............................................................................... 73
Figure 48: Information sharing .................................................................................................................... 73
Figure 49: Awareness of impact of blocked sewers ................................................................................... 75
Figure 50: Awareness of City's by-laws ...................................................................................................... 75
Figure 51: Categories of by-laws ................................................................................................................ 76
Figure 52: Awareness of illegal discharges into a sewer ............................................................................ 77
Figure 53: Awareness of penalty charges ................................................................................................... 77
Figure 54: Willingness to attend presentations by the Water and Sanitation Department ......................... 78
Figure 55: Distribution of the informal area participation by district ............................................................ 80
Figure 56: Distribution of respondents by age ............................................................................................ 81
Figure 57: Distribution of respondents by gender ....................................................................................... 81
Figure 58: Distribution of respondents by race ........................................................................................... 82
Figure 59: Distribution of respondents by occupation status ...................................................................... 84
Figure 60: Distribution of respondents by number of occupants per household ........................................ 85
Figure 61: Access to electronic communication mediums .......................................................................... 86
Figure 62: Other sources of water .............................................................................................................. 87
Figure 63: Type of other water sources ...................................................................................................... 88
Figure 64: Average monthly water use ....................................................................................................... 88
Figure 65: Household water consumption compared to previous year ...................................................... 89
Figure 66: Effects of tariff increases on water usage .................................................................................. 90
Figure 67: Promotions on water conservation ............................................................................................ 92
Figure 68: Change in behaviour to conserve water .................................................................................... 93
Figure 69: Awareness of presentations by Water Conservation Officers ................................................... 94
Figure 70: Water quality ratings .................................................................................................................. 95
Figure 71: Overall satisfaction with water availability ................................................................................. 95
Figure 72: Experience with water-related problems ................................................................................... 96
Figure 73: Experienced water-related problems ......................................................................................... 97
Figure 74: Distance between household and closest tap ........................................................................... 97
Figure 75: Number of households sharing the same tap ............................................................................ 98
Figure 76: Access to a standpipe ................................................................................................................ 99
Figure 77: Time taken to fetch water from a standpipe .............................................................................. 99
Figure 78: Water usage from the standpipe per day ................................................................................ 100
Figure 79: Water use during the last six month ........................................................................................ 100
Figure 80: Happy with the intervention of tags in order to access from the standpipe ............................. 101
Figure 81: How satisfied are you with the intervention? ........................................................................... 102
Figure 82: Satisfaction with sewerage and sanitation services ................................................................ 102
Figure 83: Experiences with sewerage blockage or sanitation related problems within the last year ...... 103
Figure 84: Sewerage blockage and sanitation problems .......................................................................... 104
Figure 85: Frequency of sewerage blockage or problem ......................................................................... 104
Figure 86: Household distance to closest toilet ........................................................................................ 105
Figure 87: Reporting on broken/faulty sewerage pipes ............................................................................ 106
Figure 88: Awareness of how to contact the Department ......................................................................... 107
Figure 89: Contact with the City of Cape Town in the last 3 months ........................................................ 107
Figure 90: Time taken to respond to queries ............................................................................................ 109
Figure 91: Service experience rating ........................................................................................................ 109
Figure 92: Estimated time to resolve problems......................................................................................... 110
Figure 93: Awareness of customer service contact details ....................................................................... 111
Figure 94: Awareness of landline and SMS numbers ............................................................................... 111

Page 12 of 203
Figure 95: Use of customer service contact number ................................................................................ 112
Figure 96: Interest in receiving information ............................................................................................... 113
Figure 97: Discussion of water and sanitation issues ............................................................................... 114
Figure 98: Awareness of impact of blocked sewers on environment ....................................................... 115
Figure 99: Awareness of City by-laws ....................................................................................................... 115
Figure 100: Familiarity with water and sanitation by-laws ........................................................................ 116
Figure 101: Awareness of illegal discharges into sewer ........................................................................... 117
Figure 102: Awareness of water and sanitation penalty charges ............................................................. 117
Figure 103: Behaviours that result in penalty charges .............................................................................. 118
Figure 104: Interest in receiving water and sanitation presentations........................................................ 119
Figure 105: Other water sources .............................................................................................................. 120
Figure 106: Comparison of current and previous water consumption ...................................................... 122
Figure 107: Impact of tariff increase ......................................................................................................... 122
Figure 108: Water quality rating ................................................................................................................ 124
Figure 109: Satisfaction with water services ............................................................................................. 125
Figure 110: Experience with water-related problems ............................................................................... 125
Figure 111: How often do you experience water related problems? ........................................................ 126
Figure 112: Satisfaction with sanitation or sewerage services ................................................................. 127
Figure 113: Experience with sewerage blockage problems ..................................................................... 127
Figure 114: Frequency of occurrence of sanitation problems ................................................................... 128
Figure 115: Use of customer service contact number .............................................................................. 129
Figure 116: Contacting the City to report problems .................................................................................. 129
Figure 117: Waiting period before fixing problem ..................................................................................... 130
Figure 118: Rating of services received .................................................................................................... 131
Figure 119: Estimated time to fix problems ............................................................................................... 132
Figure 120: Average monthly water and sanitation payment .................................................................... 133
Figure 121: Bill-checking frequency .......................................................................................................... 133
Figure 122: Perceptions on billing services .............................................................................................. 134
Figure 123: Satisfaction with billing process ............................................................................................. 135
Figure 124: Rating of water prices ............................................................................................................ 135
Figure 125: Rating of sanitation services .................................................................................................. 136
Figure 126: Receipt of free water .............................................................................................................. 136
Figure 127: Ownership of water management device .............................................................................. 137
Figure 128: Installation of prepaid water meter device ............................................................................. 137
Figure 129: Awareness of step-tariff ......................................................................................................... 138
Figure 130: Awareness of customer service contact details ..................................................................... 139
Figure 131: Awareness of landline and SMS numbers ............................................................................. 139
Figure 132: Contact with the City .............................................................................................................. 140
Figure 133: Interest in receiving information ............................................................................................. 140
Figure 134: Information sharing ................................................................................................................ 141
Figure 135: Nature of business ................................................................................................................. 143
Figure 136: Number of employees ............................................................................................................ 144
Figure 137: Type of toilets......................................................................................................................... 145
Figure 138: Water conservation policy ...................................................................................................... 145
Figure 139: Annual water audit ................................................................................................................. 146
Figure 140: Awareness of the impact of blocked sewers on the environment ......................................... 147
Figure 141: Awareness of City by-laws ..................................................................................................... 147
Figure 142: Awareness of forms of by-laws .............................................................................................. 148
Page 13 of 203
Figure 143: Awareness of illegal discharges ............................................................................................ 148
Figure 144: Awareness of penalty charges ............................................................................................... 149
Figure 145: Interest in water and sanitation presentations ....................................................................... 149

Page 14 of 203
LIST OF TABLES
Table 1: Summary of key findings- comparative analysis ........................................................................... 18
Table 2: Required sample-size for informal residential areas .............................................................. 29
Table 3: Required sample-size for formal residential areas ................................................................. 30
Table 4: Language ..................................................................................................................................... 34
Table 5: Monthly household income ....................................................................................................... 35
Table 6: Educational status attained ....................................................................................................... 35
Table 7: Type of toilets in household ...................................................................................................... 39
Table 8: Electronic medium of communication ..................................................................................... 39
Table 9: Other sources of water .............................................................................................................. 40
Table 10: Perception on water and sanitation services ........................................................................ 42
Table 11: Behavioural changes in household to conserve water ........................................................ 45
Table 12: Occurrence of water-related problems .................................................................................. 49
Table 13: Type of sanitation related problem......................................................................................... 51
Table 14: Frequency of occurrence of sewerage-related problems .................................................... 52
Table 15: Monthly water and sewerage bill ............................................................................................ 59
Table 16: Respondents’ preferred channel of receiving information .......................................................... 74
Table 17: Distribution of respondents according to languages used .......................................................... 82
Table 18: Distribution of respondents by monthly household income ........................................................ 83
Table 19: Distribution of respondents by educational level ........................................................................ 84
Table 20: Distribution of respondents by type of toilet ................................................................................ 86
Table 21: Informal residents’ perceptions on water and sanitation............................................................. 91
Table 22: Water conservation measures undertaken ................................................................................. 93
Table 23: Number of households sharing the same tap ........................................................................... 105
Table 24: Rating of service delivery .......................................................................................................... 108
Table 25: Rank of respondents’ preferred medium of communication ..................................................... 113
Table 26: Monthly water usage ................................................................................................................. 121
Table 27: Perception on water and sanitation services ............................................................................ 123
Table 28: Rating of quality of received services ....................................................................................... 130
Table 29: Preferred method of communication ................................................................................... 141
Table 30: Average monthly usage of water .............................................................................................. 151
Table 31: Current water usage compared to the previous year................................................................ 152
Table 32: Impact of tariff increases on water consumption ...................................................................... 153
Table 33: Awareness on advertising materials ......................................................................................... 153
Table 34: Behaviour change to conserve water........................................................................................ 154
Table 35: Satisfaction with provision of tapped water ............................................................................... 154
Table 36: Water-related problems experienced ........................................................................................ 155
Table 37: Satisfaction with sanitation and sewerage services.................................................................. 156
Table 38: Experience of sewerage or sanitation related problems ........................................................... 156
Table 39: Awareness of customer service contact details ........................................................................ 157
Table 40: Distribution of water billing by district ........................................................................................ 158
Table 41: Distribution of water billing by district ........................................................................................ 159
Table 42: Ownership of water management device ................................................................................. 159
Table 43: Average use of water by district ................................................................................................ 161
Table 44: Knowledge on water conservation promotions ......................................................................... 161
Table 45: Behaviour change to conserve water........................................................................................ 162
Table 46: Awareness of Water Conservation Officers .............................................................................. 162

Page 15 of 203
Table 47: Water-related problems experienced ........................................................................................ 163
Table 48: Overall satisfaction with water .................................................................................................. 163
Table 49: Distribution of reported water and sanitation problems ............................................................ 164
Table 50: Distribution of reported water and sanitation problems ............................................................ 164
Table 51: Willingness to receive information about water and sanitation initiatives ................................. 165
Table 52: Effects of blocked sewer on the environment by district ........................................................... 165
Table 53: Comparison of findings - Formal ............................................................................................... 167
Table 54: Comparison of findings – Informal ............................................................................................ 180
Table 55: Comparison of findings – Business ........................................................................................... 190
Page 16 of 203
EXECUTIVE SUMMARY
“Water is the driving force of all nature.”
Leonardo di Vinci (1452 -1519)
During the past year, water and sanitation services have received global attention. Much of the discourse revolved around the United Nation’s Millennium Development Goals (MGD) 2015. Although South Africa has reached the water MGD goal before the deadline, many citizens are still without water and sanitation services despite a progressive constitution acknowledging these services as a right to human dignity. In order to improve water and sanitation within the country, President Jacob Zuma established the Department of Water Affairs and Sanitation earlier this year, and appointed Nomvula Mokonyane as its first minister. Initially, Minister Mokonyane has set her sights on upgrading water infrastructure in order to ensure rural communities have access to water, as well as promoting water conservation To gain contextual awareness with regard to water and sanitation services in the City of Cape Town, a customer perception and satisfaction survey (herein referred to as WSSP 2013/2014) was conducted for the 2012/13 financial year. The purpose of the survey was to determine customer perceptions and attitudes concerning the provision of water and sanitation services provided by the Department in the City of Cape Town. In addition, water and sanitation remains a powerful indicator for the state of human development in any community. A basic provision of and access to water and sanitation offers benefits at many levels, including public health, livelihoods, wellbeing and human dignity – advantages that extend from the individual throughout the community. According to the World Health Organisation (WHO), access to drinking water requires that the water source be less than a kilometre away from a household and that it is possible to reliably obtain at least twenty (20) litres per member, per household, per day. Basic sanitation refers to facilities that ensure hygienic separation of human excreta from human contact, such as:
flush or pour-flush toilet/ latrines to a piped sewer system, a septic tank or a pit latrine; ventilated improved pit latrines; pit latrines with slab; and composting toilets.
With that in mind, the City of Cape Town has embarked on a mission to ensure that its customers are well serviced and provided with basic water and sanitation services. As a way to monitor its progress in water and sanitation service provision, the Department has introduced mechanisms to assist in evaluating customers’ perceptions and satisfaction levels. Consequently, each year the Department commits itself to engage in a study to explore the extent to which it is meeting the needs and demands of its customers.
Survey target groups
The survey targeted at least 1900 respondents, constituting formal residential areas (1000), informal
residential areas (600) and business enterprises (300) in eight districts of Cape Town notably;
Central Cape Town; Heidelberg/ Kuilsriver; Khayelitsha; Klipfontein; Kraaifontein/ Blouberg; Mitchells Plain; South Peninsula; and Tygerberg/ Bellville.

Page 17 of 203
A total of 2051 respondents (1058 formal, 657 informal and 336 business), who were selected from the formal and informal residential as well as business areas, participated in the survey.
Data collection
Data collection for the formal and informal residential areas commenced on August 15, 2014 and was completed on October 10, 2014. Field workers were recruited to collect data based on educational merit, research experience and multilingualism. All field workers received adequate training in order to equip them with the necessary skills, before the data collection process begun. Methods of data collection and administration consisted of face-to-face (pencil and paper administration) and online administration of questionnaires.
Data analysis and interpretation
Data capturing was performed during the month of October, 2014. Data was captured on an online tool to facilitate data cleaning, processing and analysis. In total, 2051 questionnaires were captured and analysed using Microsoft Excel. Descriptive statistics analysis was used to describe and summarise the data into meaningful ways to allow interpretation of data. Descriptive statistics was useful to summarise the data using a combination of tabulated description (tables), graphical description (graphs and figures) and statistical commentary (i.e. discussion of results).
Major findings
Generally, the residents in formal, informal and business residential areas are satisfied with the City of
Cape Town with respect to provision of water and sanitation services.
Formal residential areas
The majority of the formal residents (85.78%) were satisfied with water availability and majority (84.49%) said they water quality was good.
Majority of residents (85.24% in the formal areas said they did not experience any water related problem in the last year.
The majority (85.50%) of residents in the formal areas said they were satisfied with the City’s sanitation or sewerage services.
Most of the respondents (69.59%) indicated they were satisfied with the City of Cape Town’ billing process.
The majority of respondents in the formal residential areas (87.78%) indicated that they did not have any sewerage blockage or sanitation-related problems in the past year.
Informal areas
Most respondents (74.81%) in the informal areas reported that they are satisfied with water availability;
Less than half of the respondents (43.64%) mentioned that they were satisfied with the sewerage and
sanitation services.
Business areas
Majority of businesses (84.45%) were satisfied with the water services provided by the City of Cape
Town.
Majority of businesses (87.31%) indicated they were satisfied with the City of Cape Town’s water
delivery services.

Page 18 of 203
Majority of the businesses (86.12%) were satisfied with the billing process
Conclusions and recommendations
Generally, the formal areas, informal areas residents and businesses are satisfied with the City of Cape Town’s delivery services with regard water and sanitation. The City of Cape Town must not rest on its laurel though, but continue to seek innovative ways to keep customers happy and maintain the satisfaction among its customers and even better the levels of satisfaction. With regards to water conservation efforts, the City of Cape should put more resources in terms of conducting water conservation campaigns across all districts as most of the respondents indicated they had not come across Water Conservation Offices presenting in their own localities. It is important that the City of Cape widely publicise the benefits that can be derived from water management devices in order to create awareness among the business enterprises and formal residential areas since most said they had not installed water management devices. Frequent engagements with informal residents regarding conservation of water can go a long way in raising the need of conserving water and reporting timeous reporting of any water-related and sanitation-related problems. A synopsis of the comparative findings are presented in table 1 below.
Table 1: Summary of key findings- comparative analysis

Page 19 of 203
Theme
Formal residential
area
Informal
residential
Business area
Remarks
Water and sanitation services
Overall 5.31% are not satisfied with the City of Cape Town in providing tap water.
14.68% have experienced water related problems within the last year.
Overall 3.44%
are not satisfied with the City of Cape Town in providing sanitation or sewerage services.
12.22% of the respondents have experienced a sewerage blockage or sanitation related problem within the last year.
Overall 13.67% are not satisfied with the City of Cape Town in providing tap water.
37.25% have experienced water related problems within the last year.
Overall 42.88%
are not satisfied with the City of Cape Town in providing sanitation or sewerage services.
46.32% have experienced a sewerage blockage or sanitation related problem within the last year.
Only 2.42% are not satisfied with the City of Cape Town in providing tap water.
9.58% have experienced water related problems within the last year.
Only 3.03%
are not satisfied with the City of Cape Town in providing sanitation or sewerage services.
11.11% have experienced a sewerage blockage or sanitation related problem within the last year.
Most of the respondents are satisfied with the provision of tap water and sanitation services by the City of Cape Town.
Water conservation
55.55% have not changed their behaviour to conserve water within the last year.
39.30% have not seen any advertisements promoting
53.15% have not changed their behaviour to conserve water within the last year.
54.43% indicated that they have not seen advertisements
81.52% have not changed their behaviour to conserve water within the last year.
The Department needs to conduct an awareness campaign on change of behaviour regarding water conservation and conduct

Page 20 of 203
Theme
Formal residential
area
Informal
residential
Business area
Remarks
water conservation.
72.41% have not heard or seen Water Conservation officers doing presentations in their communities.
from the Department promoting water conservation.
74.89% have not seen Water Conservation officers doing presentations on sewerage blockage.
more presentations regarding sewerage blockage.
Customer lodging and service delivery
42.13 indicated that do not know how to contact the City if they encounter a water or sanitation problem.
76.83% said that they do not know how to contact the City if they experience a water or sanitation problem.
39.16% indicated that they are not aware of the customer service contact numbers, in case they have water or sanitation problems.
The findings reveal that the Department needs to increase awareness of the customer service contacts as many seem not to know about them.
Awareness on sanitation environmental impact
51.53% are not aware of the impact of blocked sewers on the environment.
73.50% are not aware of the City’s by-laws that regulate water usage and water abuse.
68.63% are not aware of what illegal discharges into a sewer are.
53.49% stated that they are aware of the impact of blocked sewers on the environment.
91.10% are not aware of the City’s by-laws that regulate water usage and water abuse.
77.45% are not aware of what illegal discharges into a sewer are.
33.23% indicated that they are not aware of the impact of blocked sewers on the environment.
68.26% are not aware of the City’s by-laws that regulate water usage and water abuse.
75.68% are not aware of
There is a need for consumer sensitisation to the regulatory mechanisms that control the abuse of water and sanitation services.

Page 21 of 203
Theme
Formal residential
area
Informal
residential
Business area
Remarks
88.78% are unaware of water and sanitation offenses that result in penalty charges.
90.95% indicated unawareness of water or sanitation offenses resulting in penalty charges.
what illegal discharges into a sewer are.
86.83%
stated that they are not aware of water or sanitation offenses resulting in penalty charges.

Page 22 of 203
1. PROJECT BACKGROUND
1.1 Project background In order to continue its journey towards service excellence, the Water and Sanitation Department (herewith referred to as the “Department”) has developed and implemented an international standard of service delivery (ISO 9001:2008). According to the standard, the department is required to establish a customer focus with the aim of identifying, evaluating and meeting its consumers’ needs. A nuanced understanding is thus required with regard to the populations’ engagement with water and sanitation services, as well as the community contexts in which interventions are being implemented. Having consumer insight allows the City of Cape Town to design interventions that directly impact on water and sanitation needs and challenges, with the intention of enhancing customer satisfaction.
1.2 Project scope The project was conducted against the backdrop of the above. The purpose of the research was to gain an in-depth understanding into the perceptions and attitudes of consumers who make use of services provided by the department. Thus, the water and sanitation customer perception and satisfaction survey was conducted for three successive years (2011/2012, 2012/2013 and 2013/2014) with the aim of eliciting customers’ opinions and awareness related to services provided by the department. The most recent customer perception and satisfaction survey targeted 1900 respondents, in order to achieve three sub-sample groups, namely informal residential areas, formal residential areas and business entities. In accordance with the scope, the project was conducted within the following eight Cape Town districts:
Central Cape Town;
Heidelberg/Kuilsriver;
Khayelitsha;
Klipfontein;
Kraaifontein;
Mitchells Plain;
South Peninsula; and
Tygerberg/Bellville.
1.3 Survey objectives The project’s primary objective was to generate a rich contextual understanding with regard to customers’ perceptions and attitudes toward the departments’ service delivery. These perceptions and attitudes may be of importance in terms of developing intervention strategies that aligns with the department’s effort to achieve and maintain service excellence. The objectives of conducting a customer survey for the department are as follows:
to enable water and sanitation to gain great insights about customer requirements; to generate feedback about water and sanitation’s products and services as well as customer
service; to attune water and sanitation towards more focused customer services to develop better
relationships with customers to achieve brand success; to assist with quick measures to bring about the desired improvements or address complaints and
provide corrective actions;

Page 23 of 203
to drive innovative efforts and initiatives at water and sanitation branches; and to consistently and better address customer needs and expectations, maintain brand reputation
and facilitate long term relationships with water and sanitation customers.

Page 24 of 203
2. LITERATURE REVIEW
2.1 Introduction South Africa’s constitution recognises that everyone has a right of access to basic water supply and basic sanitation. Furthermore, the constitution acknowledges that water services institutions must take responsible measures to realise these rights. In order to provide insight into the research context, an examination of key texts pertaining to water and sanitation is of importance. Not only does such an investigation provide a contextual grasp on water and sanitation delivery in South Africa, it also offers an opportunity to operationalise key terms as well as an in-depth understanding with regard to the progress and challenges that currently affect the sustainability of these services. This section therefore addresses themes related to accessibility and infrastructure, environmental impact and conservation, and sustainability within the water and conservation paradigm of South Africa.
2.2 Definition of key terms Within the borders of South Africa, all water is governed by the Water Services Act of 1997 and the National Water Act of 1998. According to the Water Service Act 108 of 1997, all South African citizens have “the right of access to basic water supply and the right to basic sanitation necessary to secure sufficient water and an environment not harmful to human health or well-being.” The Act defines these terms as the following:
“basic sanitation” means the prescribed minimum standard of services necessary for the safe, hygienic and adequate collection, removal, disposal or purification of human excreta. domestic waste-water and sewage from households, including informal households;
“basic water supply” means the prescribed minimum standard of water supply services necessary for the reliable supply of a sufficient quantity and quality of water to households, including informal households, to support life and personal hygiene.
“buckets system” means a privately owned bucket or container which is used by informal residents.
Upon further inquiry, informal residents reported that these buckets are used within their homes and emptied at their nearest available sanitation site (flush toilet, conservancy tank, chemical toilet, portable flush toilet, 100 litre container toilet, or enviro loo). The bucket system is not recognised as an official type of sanitation available for installation in the informal settlements, according to the City of Cape Town, due to current policy which aims to eradicate its use.
In addition to the right of access to basic water supply and basic sanitation, the South African National Treasury (2011) refers to a basic water supply service as infrastructure necessary to supply 25 litres of potable water, per person, per day from a source within 200 meters of a household, and with a minimum flow of 10 litres per minute (in the case of communal water points); or 6 000 litres of potable water, supplied per formal connection per month (in the case of house connections). The Treasury refers to basic sanitation services as the provision of basic sanitation facilities, which is easily accessible to a household, and the sustainable operation of the facility. This includes the safe removal of human waste and wastewater from the premises, where this is appropriate and necessary, and the communication of good sanitation, hygiene and related practices.
2.3 Significance of water and sanitation An update report by the World Health Organisation and UNICEF (2014) states that since 1990, more than 2 billion people globally gained access to improved drinking water and improved sanitation. More than half

Page 25 of 203
of the world’s population has access to water within their homes. However, 700 million people worldwide do not share the right to a readily available source of drinking water. In addition to this, the majority of these disadvantaged individuals are located within the sub-Saharan African region. The report estimates that 2.5 billion people globally do not have access to improved sanitation facilities and of these, 1 billion are still practice open defecation. In South Africa, lack of resources such as access to water and sanitation has been associated with spatial geography which reflects an enduring resemblance to the Apartheid system. As such, the Human Rights Commission (2014) claims that those who lack basic resources necessary to secure sufficient water and an environment not harmful to human health or well-being, are those who were historically deprived of their rights. These geographical areas are characterised by high levels of poverty, overcrowding, crime, violence, substance abuse, unemployment, mortality, and morbidity; low levels of knowledge in terms of awareness of rights with regard to accessing resources; low levels of education and generally low levels of life satisfaction. Access to water and sanitation has been recognised as a human right, globally. If not made available, affordable and sustainable, adverse effects may be experienced within all levels of society, from the individual to the economy. Adverse consequences may influence areas such as human development, public health, education, socio-economic activities, and other environmental resources. Against the above backdrop, it is apparent that the monitoring and evaluation of access to water and sanitation is a necessary indicator of social inequality.
2.4 Progress and challenges: Sustainability South Africa has vastly progressed since 1994 with regard to water and sanitation services. Reports estimate that only about half of the country’s citizens have had access to basic water and sanitation services in the same year. Post-apartheid innovative and inclusive policies directly contributed to an increase in access to these services, on a national level. Recently, the Department of Water Affairs reported that national access to basic water and sanitation services has exceeded the United Nation’s Millennium Development Goals with regard to water and sanitation ahead of the 2015 deadline, due to placing focus on developing new infrastructure. Recent indicators report that 11% of South African’s households (formal and informal) lack basic sanitation services. As a result of deterioration of infrastructure, the Human Rights Commission has estimated that at least 26% of households with sanitation services residing in formal areas do not meet the standard requirements. Alarmingly, 9% of water services were reported to be at risk of disease outbreak with 38% of water services being at a high risk to decline in a state of emergency. Key findings reported by Statistics South Africa (2014) reflect a trend of progress. The rate of South African consumers has increased from 2012 to 2013 for water (3.3%) and sewerage and sanitation (6.2%). Furthermore, the report states that within the Western Cape, a reduction of 31.7% was observed with regard to the number of households using the bucket toilet system. On the other hand, although economic progress has been experienced during the past two decades, access to water and sanitation services are bombarded with barriers, especially among our poorest citizens. As a result, service delivery within rural and impoverished communities, as well as marginalised groups, remains at the under- and unserved end of the spectrum.
2.5 Environmental impact As mentioned, water and sanitation services are vital to the wellbeing of South Africa, on a national level. Inadequate services within the water and sanitation sector directly and indirectly influence access to other human rights, such as education, health, work and dignity , to name a few. Such barriers may heighten the

Page 26 of 203
exposure of vulnerable groups on socio-economical levels, effecting individuals, families and communities. These services that are at risk of disease outbreak threatens South Africa’s public health sector and adds additional burdens to the current backlog in health resources currently experienced. Research indicates that in Africa, 115 people die hourly due to illness linked to poor sanitation, hygiene and contaminated water (UNICEF, 2010). The Human Rights Commission (2014) forecasts that if trends continue, 2.4 billion people will still lack basic sanitation services in 2015, regardless if countries meet the Millennium Development Goals or not. It is therefore required that grassroots interventions be implemented in order to encourage individuals to take their health and wellbeing in their own hands, to ensure that the environment is preserved. The Department of Water and sanitation has introduced policies that promote environmental sustainability, yet there seems to be a lack of empowerment and awareness at the individual level.
2.6 Water conservation In South Africa, it has been estimated that half of all water is wasted in urban areas due to water loss or ineffective service delivery. About 36% of drinking water is lost through leaking pipes, dripping taps and illegal water usage. Although plans for a water-secure future have been established, a systemic approach is necessary in order to involve the general South African public. Not only is water conservation a vital aspect, but demand management and service delivery are equally important too. As a natural resource, water is valuable, scarce and an overstrained commodity which require diligent management. It is against this background that the Department has developed communication materials, aimed at promoting water conservation behaviours in households. In addition, the City of Cape Town has implemented various awareness campaigns and educational tools to add in assisting with water conservation.
2.7 Water and sanitation: Quality and availability According to South Africa’s water quality guidelines, domestic water refers to consumption within a domestic environment, as well as water used for the environment; these include drinking, food and beverage preparation, personal hygiene, gardening, and so on. In terms of level of water satisfaction, consumers have indicated discontent with the quality of water received. Seventy-six percent of consumers rated water services as good in 2005. In 2007, this figure decreased by 4% and in 2010, 64% of consumers rated the water as good quality. Changes in water quality may impact health and the economy. At the individual level, inferior quality of water may result in acute and irreversible health effects, if consumed. South African national statistics indicate that 85% of households have basic access to water and 70% have access to basic sanitation. The commission reported that nationally, 60.1% of South Africans make use of flush toilets, 2.5% use chemical toilets and 8.8% make use of ventilated pit latrines. Compared to the Western Cape, 89.6% use flush toilets, 0.9% use chemical toilets and 0.6% use ventilated pit latrine. However, water and sanitation services within agricultural environments do not reach farm workers, as a result of privately owned land. As such, these workers are heavily reliant on the land owner to provide access to these services. In addition, people residing within rural environments are at a higher risk of experiencing negative outcomes due to their reliance on the environment to support their lifestyles. Lack of sanitation services have also been attributed to inappropriate infrastructure, such as facilities which do not meet minimum standards outlined by authorities, maintenance issues, and ineffective governance. Unsafe water, inadequate sanitation, insufficient hygiene, and a lack of water and sanitation access and services are issues which need attention in order to maintain a standard of human dignity. It is therefore imperative for the Department to continue improving the quality of water and access to sanitation, as well as the availability of these resources in the City of Cape Town. Of concern however, is the fact that a large

Page 27 of 203
number of households within the Western Cape (3.7%) rely on the use of the bucket system for sanitation, compared to national statistics (2.1%).
2.8 Affordability South Africa enshrines access to basic water and sanitation in its constitution, as such it is an expectation that that water and sanitation facilities and services be available and affordable for all. For this to be a reality, effective state management is of vital importance, especially in terms of reducing overuse and pollution. On the other hand, privatisation of water management is another avenue which may be used in order to ensure development of water and sanitation infrastructure. If the latter is to be effective, state authority should be responsible for the regulation of water and sanitation services. Statistics South Africa (2014) reports that more than 5 million South Africans received free basic water services and more that 3 million received free basic sewerage and sanitation services in 2013. Furthermore, the Western Cape consisted of the highest proportion (77.3%) of consumers who make use of free basic water services. In terms of sewerage and sanitation, the Western Cape once again reported the highest proportion (69.4%) of consumers who make use of free basic sewerage and sanitation services
2.9 Conclusion The literature provides contextual insight into water and sanitation services and facilities within South Africa. In terms of sustainability, environmental impact, conservation, quality, availability and affordability, South Africa has progressed from a state in which resources were extremely limited or withheld from its citizens. Although progress is aligned with international standards, many rural areas are underserved or not served at all. As a result, South Africa’s marginalised communities may be at higher risk of experiencing negative outcomes with regard to health, education, standard of living, nutrition, and so forth. It therefore imperative for the department, as well as the City of Cape Town, to monitor and evaluate these services periodically, in order to establish, maintain and ensure excellent service delivery.

Page 28 of 203
3. METHODOLOGY
3.1 Introduction In order to gain insight into consumers’ perceptions with regard to the City of Cape Town’s water and sanitation services, the project adopted a survey methodology. Face-to-face interviews were conducted within three distinct research areas, namely formal residential areas, informal residential areas and business enterprises.
3.2 Questionnaire development As mentioned, the study aimed to analyse data from three distinct subgroups. Questionnaires were utilised as the research instrument and was based on the previous projects (WSSP 2011/2012; 2012/2013), namely:
Formal residential area; Informal residential area; and Business area.
3.3 Data collection Data was collected from August 15 to October 10, 2014. Field workers were recruited to collect data based on educational merit, research experience and multilingualism. All field workers received adequate training in order to equip them with the necessary skills, before the data collection process begun.
3.3.1 Data collection methods
The questionnaires were administered using two methods, namely:
Face-to-face and paper and pencil administration
Eight residential districts were selected from a pool provided by the Department. Thereafter, field workers administered face-to-face and paper and pencil questionnaires with customers in informal and formal residential areas. One-on-one engagement allowed field workers to assist respondents if the need arose,
which further complimented the quality of the data.
Online administration Business consumers of water and sanitation services in the City of Cape were surveyed through the use of an online questionnaire. Due to a low response rate, the initial approach was supplemented through the use of face-to-face questionnaire administration.
3.3.2 Sampling The City of Cape Town comprises of eight districts, namely South Peninsula, Tygerberg/ Bellville, Khayelitsha, Helderberg/ Kuilsriver, Mitchell’s Plain, Kraaifontein/ Blouberg, Central Cape Town and Klipfontein. Each district is further subdivided into suburbs (formal areas) and townships (informal areas). To ensure that the sample represented the broader population, a predetermined sample size was specified for each area, in each district within the City of Cape Town.

Page 29 of 203
The following outlines the sampling procedure:
For each district, the area/ suburb considered in the survey was selected using random sampling whereby each area/suburb had an equal chance of being selected.
Samples were recruited using systematic sampling methods. Field workers were allocated specific sections (based on street names) within each selected area (formal and informal). Fieldworkers initially selected a household at random and thereafter, every Nth household in the street was selected (where N represents the interval unit).
In total, the project aimed to recruit a targeted sample size of 1900 respondents from the City of Cape Town. The estimated targeted sample size was further subdivided within each research area, which consisted of the following: 1000 respondents from formal areas, 600 respondents from informal areas and 300 respondents within the business area. Achieved sample sizes from selected areas and districts are recorded in table 2 and 3 below.
The business sample was selected based on a pool of small, medium and large businesses
provided by the City of Cape Town. Unfortunately, due to a low online response rate, a lack of contact details and an inability to access businesses from the pool provided, field workers resorted to convenience sampling methods in order to meet the targeted sample-size (n = 300). After businesses were identified, field workers administered the research instrument using face-to-face and pencil and paper techniques.
Table 2: Required sample-size for informal residential areas
District Selected area Interviewed per area Total
1 South Peninsula Masiphumelele 25
76 Capricorn 26
Zululand 25
2 Tygerberg/Bellville Fisantekraal 26
78 Bishop Lavis 27
Freedom Farm 25
3 Khayelitsha Khayelitsha –Site B 26
81 Harare –Monwabisi Park
25
Macassar -Nkanini 30
4 Helderberg/Kuilsriver Delft 23
82 Blue Downs 30
Mfuleni 29
5 Mitchell's Plain Phillipi 25
80 Mitchell’s Plain 27
Browns Farms 28
6 Kraaifontein/Blouberg Du Noon 21
99 Wallacedene 24
Dornbach 21
Site 5 33

Page 30 of 203
District Selected area Interviewed per area Total
7 Central Cape Town Langa 24
74 Kosovo 25
6th Avenue Kensington 25
8 Klipfontein Nyanga 23
87 Gugulethu 20
Barcelona 21
Kanana 23
Grand total 657
Table 3: Required sample-size for formal residential areas
District Selected area Interviewed per selected area
Total
1 South Peninsula
Muizenberg 26
125
Simon’s Town 25
Ocean View 23
Fish Hoek 26
Sunnydale 25
2 Tygerberg/Bellville
Bellville 28
130
Elsies River 27
Parow 27
Boston 25
Brackenfell 23
3
Khayelitsha
Harare 23
131
Mandela Park 23
Ikwezi Park 25
Makhaza 28
Graceland 31
4 Heidelberg/Kuilsriver
Kuilsriver 37
142
Delft 29
Happy Valley 24
Serepta 26
Soneike 26
5 Mitchell's Plain
Montclair 25
130
Lentergeur 28
Woodlands 26
Tafelsig 26
Mandalay 25

Page 31 of 203
District Selected area Interviewed per selected area
Total
6 Kraaifontein/Blouberg
Durbanville 24
125
Kraaifontein 23
Bloubergstand 24
Bothasig 26
Edgemead 28
7 Central Cape Town
Rondebosch 28
152
Claremont 34
Newlands 31
Woodstock 29
Gardens 30
8 Klipfontein
Athlone 25
123
Gugulethu 25
Manenberg 23
Heideveld 25
Rylands 25
Grand Total 1058
3.4 Data capturing and cleaning A total of 2032 questionnaires were captured between September 17, and October 14, 2014. Data cleaning was conducted between the 15 to the 28 October 2014. Finally, dataset spread sheets were compiled and submitted to the City of Cape Town.
3.5 Conclusion The methodology section of this report provides an overview with regard to the procedure employed in order to ensure that research instruments, data collection and sampling techniques are aligned to yield data of a high quality.
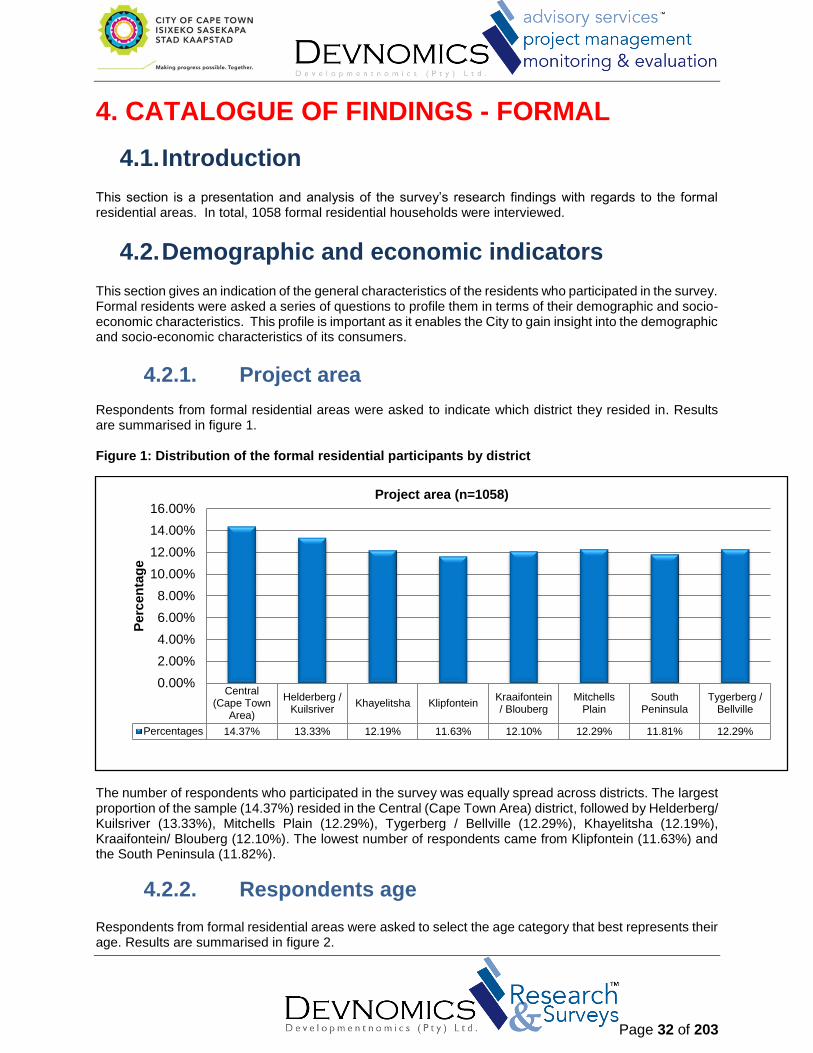
Page 32 of 203
4. CATALOGUE OF FINDINGS - FORMAL
4.1. Introduction This section is a presentation and analysis of the survey’s research findings with regards to the formal residential areas. In total, 1058 formal residential households were interviewed.
4.2. Demographic and economic indicators This section gives an indication of the general characteristics of the residents who participated in the survey. Formal residents were asked a series of questions to profile them in terms of their demographic and socio-economic characteristics. This profile is important as it enables the City to gain insight into the demographic and socio-economic characteristics of its consumers.
4.2.1. Project area Respondents from formal residential areas were asked to indicate which district they resided in. Results are summarised in figure 1. Figure 1: Distribution of the formal residential participants by district
The number of respondents who participated in the survey was equally spread across districts. The largest proportion of the sample (14.37%) resided in the Central (Cape Town Area) district, followed by Helderberg/ Kuilsriver (13.33%), Mitchells Plain (12.29%), Tygerberg / Bellville (12.29%), Khayelitsha (12.19%), Kraaifontein/ Blouberg (12.10%). The lowest number of respondents came from Klipfontein (11.63%) and the South Peninsula (11.82%).
4.2.2. Respondents age Respondents from formal residential areas were asked to select the age category that best represents their age. Results are summarised in figure 2.
Central(Cape Town
Area)
Helderberg /Kuilsriver
Khayelitsha KlipfonteinKraaifontein/ Blouberg
MitchellsPlain
SouthPeninsula
Tygerberg /Bellville
Percentages 14.37% 13.33% 12.19% 11.63% 12.10% 12.29% 11.81% 12.29%
0.00%
2.00%
4.00%
6.00%
8.00%
10.00%
12.00%
14.00%
16.00%
Perc
en
tag
e
Project area (n=1058)

Page 33 of 203
Figure 2: Distribution of respondents by age
The figure shows that the 35 to 39 year old category had the highest number of respondents, at 31.79%, followed by the 25 to 34 year old category (27.25%). The third highest number of respondents was for people aged between 50 and 64 years, at 20.81%. The 18 to 24 year old category constituted 10.88% of the respondents and the lowest number of respondents were either 65 years old or older (9.27%).
4.2.3. Gender Respondents from formal residential areas were asked to indicate their gender. The findings are shown in figure 3 below. Figure 3: Gender
The figure above shows that 47.40% of the respondents were male and 52.60% were female. The distribution of respondents by gender is noteworthy, as traditionally it is believed that within the household, females have a better understanding of water and sanitation issues than males – and are therefore more likely to provide greater contextual insight into these issues, compared to men.
10.88%
27.25%
31.79%
20.81%
9.27%
Age (n=1057)
18-24
25-34
35-49
50-64
65+
52.60%
47.40%
Distribution of respondents by gender (n=1057)
Female
Male

Page 34 of 203
4.2.4. Racial grouping Respondents from formal residential areas were asked to indicate which racial group they self-identified with. The findings are shown in figure 4 below. Figure 4: Distribution of respondents by race
As seen in Figure 4, 35.76% of formal residential respondents self-identified as coloured; 33.49% self-identified as white; and 26.58% of the formal residents self-identified with the black racial group. The smallest group of respondents self-identified as Indian (3.22%) while the remaining 0.95% did not want to disclose their racial affiliation.
4.2.5. Language Respondents from formal residential areas were asked to identify which language spoke predominantly, at home. Table 4 shows that, within the sample, English (42.82%) is the most widely spoken language; followed by Afrikaans (30.25%) and Xhosa (22.40%). The remaining 1.42% indicated that they speak other languages such as French and Shona at home, while the other 1.80% did not wish to disclose their home language. Very few respondents indicated that they spoke Tshivenda, seSotho and Zulu. These findings may be of interest to the City of Cape Town, specifically with regard to its communication strategies. Table 4: Language
Language Count Percentage (%)
Afrikaans 320 30.25
Do not want to disclose 19 1.80
English 453 42.82
isiNdebele 1 0.09
IsiXhosa 237 22.40
IsiZulu 3 0.28
Other 15 1.42
Sepedi 2 0.19
Sesotho 4 0.38
seSotho saLeboa 2 0.19
Black ColouredDo not wantto disclose
Indian White
Percentages 26.58% 35.76% 0.95% 3.22% 33.49%
0.00%
5.00%
10.00%
15.00%
20.00%
25.00%
30.00%
35.00%
40.00%
Perc
en
tag
e
Racial Groups (n = 1057)

Page 35 of 203
Language Count Percentage (%)
Tshivenda 1 0.09
Xitsonga 1 0.09
Total 1058 100.00
4.2.6. Household income Respondents from formal residential areas were asked to select the most appropriate category that reflects their monthly household income. The findings are shown in table 5 below. Table 5: Monthly household income
Income category Count Percentage (%)
Did not want to disclose 477 45.13
None 97 9.18
R1 - R500 39 3.69
R1 001 - R2 000 74 7.00
R10 001 - R12 000 38 3.60
R12 001 - R15 000 41 3.88
R15 001+ 50 4.73
R2 001 - R4 000 91 8.61
R4 001 - R6 000 65 6.15
R501 - R1 000 38 3.60
R501-R1 000 1 0.09
R6 001 - R10 000 46 4.35
Total 1057 100.00
The table above shows that the highest percentage of respondents (45.13%) refused to divulge their monthly household income, followed by 9.18% who indicated that they do not receive any monthly household income and 8.61% indicated that their monthly income is between R2000 and R4000. The findings also reveal that 3.69% of the respondents indicated that their monthly household income was between R1 and R500, 4.73% indicated that their monthly household income was more than R15000, and the lowest percentage of respondents (0.09%) indicated that their monthly household income was between R501 and R1000.
4.2.7. Level of education Respondents from formal residential areas were asked to select the most appropriate category that reflects their highest level of educational attainment. The findings are shown in 6 below. Table 6: Educational status attained

Page 36 of 203
Educational status attained Count Percentage (%)
Completed primary schooling 140 13.36
Completed secondary schooling 365 34.83
Do not want to disclose 135 12.88
No formal schooling 49 4.68
Other (please specify) 12 1.15
Post graduate degree 60 5.73
Post graduate diploma 57 5.44
Post-secondary i.e. certificate (excluding degree)
106 10.11
University degree 124 11.83
Grand Total 1048 100.00%
Most respondents (34.83%) indicated that they had completed secondary school; followed by 13.36% who had completed primary school; 11.83% indicated that they had university degrees while 10.11% had attained post-secondary qualifications, such as certificates (excluding degrees). 5.73% of the respondents indicated that they had a post graduate degree, while the other 5.54% had a post graduate diploma and 4.68% indicated they had no formal schooling.
4.2.8. Occupation status Respondents from formal residential areas were asked to report their occupational status. The findings are shown in figure 5 below. Figure 5: Occupational status
The figure above shows that most (42.42%) of the respondents were employed, followed by 30.11% who were unemployed. 10.89% of the formal residents indicated that they run their own businesses while 8.14% were retired. The proportion of respondents who were studying was 5.21% while lowest percentage of respondents (3.22%) described their occupations as pensioners, housewives, religious leaders, while others were both working and studying.
42.42%
3.22%
10.89%
8.14%
5.21%
30.11%
Occupation Status (n=1056)
Employed
Other
Own business
Retired
Student
Unemployed

Page 37 of 203
4.2.9. Type of property Respondents from formal residential areas were asked to report the type of property they lived in. The findings are shown in figure 6 below. Figure 6: Distribution of respondents according to the type of property lived in
The figure above shows that the majority (88.38%) of the respondents indicated that they resided in houses and 8.38% indicated a flat as their type of dwelling. However very few of the formal residents indicated that they resided in “semi-detached,” “cluster/ house” and “town house/ duplex flats”.
4.2.10. Property Ownership Respondents were asked to indicate whether they rented or owned their household dwelling. The findings are shown in figure 7 below.. Figure 7: Ownership of premises
0.86%8.38%
88.38%
0.76% 0.76% 0.86%0.00%
10.00%
20.00%
30.00%
40.00%
50.00%
60.00%
70.00%
80.00%
90.00%
100.00%
Cluster/house Flat House Other Semi-detached Townhouse/Duplex
flats
Dwelling Type (n=1050)

Page 38 of 203
Most (74.71%) respondents indicated they owned their dwelling premises and 22.15% said they rented such.
4.2.11. Household occupants Respondents from formal residential areas were asked to select the category that best represented the number of people living in their households. The findings are shown in figure 8. Figure 8: Number of people in household
Most of the formal residents (49.57%) indicated that there were 1 to 3 people in their homes while 41.34% indicated they had 4 to 6 people living in their households. Fewer formal residents (6.89%) said there were 7 to 9 people living in their households while 2.20% said that there were 10 or more people living with them.
Other Own Rent
Type of property 3.14% 74.71% 22.15%
0%
10%
20%
30%
40%
50%
60%
70%
80%P
erc
en
tag
es
Ownership of premises (n=1052)
49.57%
2.20%
41.34%
6.89%
Number of people per household (n=1045)
1 – 3
10+
4 - 6
7 - 9

Page 39 of 203
4.2.12. Types of toilet Respondents from formal residential areas were asked to report on the type of toilets being used in their households. The findings are shown in table 7.
Table 7: Type of toilets in household
Row Labels Count Percentages
Conservancy tank 4 0.38%
Chemical Toilet 0 0.00%
Portable Flush 3 0.28%
Flush toilet 1048 99.24%
Other 1 0.09%
Grand Total 1056 100.00%
Almost all informal respondents (99.24%) reported that they made use of flush toilets within their households.
4.2.13. Ownership of electronic communication mediums
Respondents were asked to indicate which electronic medium of communication they had in their household. Multiple selected response options were possible. The results are illustrated in table 8 below. Table 8: Electronic medium of communication
Medium of communication Count Percentage (%)
Radio 729 20.82
TV with local channels only (SABC 1, 2 3, eTV and community TV)
891 25.45
Satellite TV 646 18.45
Cellular phone 938 26.79
Landline telephone 294 8.40
Other 3 0.09
Total cases mentioned 3501 100.00
Table 8 shows that 25.45% of formal residents said they owned a TV with local stations, 26.79% of the sample had household access to a cellular phone; while 20.82% owned a radio within their household. Residents also indicated that they had satellite TV (18.45%) and fewer residents said that their household owned a landline telephone (8.40%). These findings show that residents use a variety of electronic forms of communication, and this presents the City with insights into how to target and reach the residents in formal areas.
4.3. Insights into water and sanitation services Respondents were asked a number of questions in order to gain insights into the water supply and sanitation services provided by the City. The results are presented below.

Page 40 of 203
4.3.1. Access to other water sources Respondents were asked whether or not they had access to water sources, other than piped water. The findings are presented in table 9 below. Table 9: Other sources of water
Do you have access to other sources of water? Count Percentage (%)
No 958 90.63
Yes 99 9.37
Grand Total 1057 100.00%
These findings demonstrate that with regards to water sources, the vast majority (90.63%) of residents rely on the City of Cape Town, which suggests that there is significant potential for the City to expand its functional scope. This demonstrates how extensive the provision of piped water to formal residential areas already is and how the quality of water is paramount as majority of consumers depend on the city.
4.3.2. Type of other sources of water Formal residential respondents, who reported that they had access to water sources other than piped water, were asked to specify which water sources they had access to. The findings are shown in figure 9. Figure 9: Type of water source
The findings show that the majority (78.00%) of formal residents made use of a borehole as an alternative source of water, 15.00% made use of river water and 6.00% relied on rain water as an alternative source of water.
4.3.3. Average use of water Respondents from formal residential areas were asked to estimate their households’ monthly average water use (i.e. tap water). The findings are shown in figure 10. Figure 10: Water used each month
78.00%
15.00%
6.00% 1.00%
Which of these water sources do you have access to in addition to piped water? (n=99)
Borehole
River Water
Rain water
Other (Please specify)

Page 41 of 203
Figure 10 shows that most (40.11%) respondents had no idea with regard to the amount of water they used each month. This should be a matter of concern to the City, as this lack of knowledge on the part of the residents could impact adversely on the City’s desire to encourage residents’ attitudes and behaviours related to water conservation.
4.3.4. Comparison of water consumption Respondents from formal residential areas were asked to indicate whether they were using more, the same or less water, compared to the previous year. The findings are shown in figure 11. Figure 11: Water consumption compared to previous year
Figure 11 shows that the highest proportion (46.78%) of respondents said that they used the same amount of water; 23.58% said that they did not know whether they were using more or less water; 15.35% of the sample were using less water; and 14.30% said that they were using more water, compared to last year. The large proportion of respondents who did not know whether they were using more or less water, compared to the last year should be of concern to the City.
Between1000 and5000 litres
Between10000
and15000litres
Between5000 and
10000litres
Between500 and
1000 litres
Less than500 litres
More than15000litres
No idea/don’t
know
Percentages 10.84% 1.43% 2.47% 16.92% 26.81% 1.43% 40.11%
0.00%5.00%
10.00%15.00%20.00%25.00%30.00%35.00%40.00%45.00%
Perc
en
tag
es
Household water use per month (n=1052)
23.58%
15.34%
14.30%
46.78%
Change in household water use (n = 1056)
Don’t know
Less
More
Same
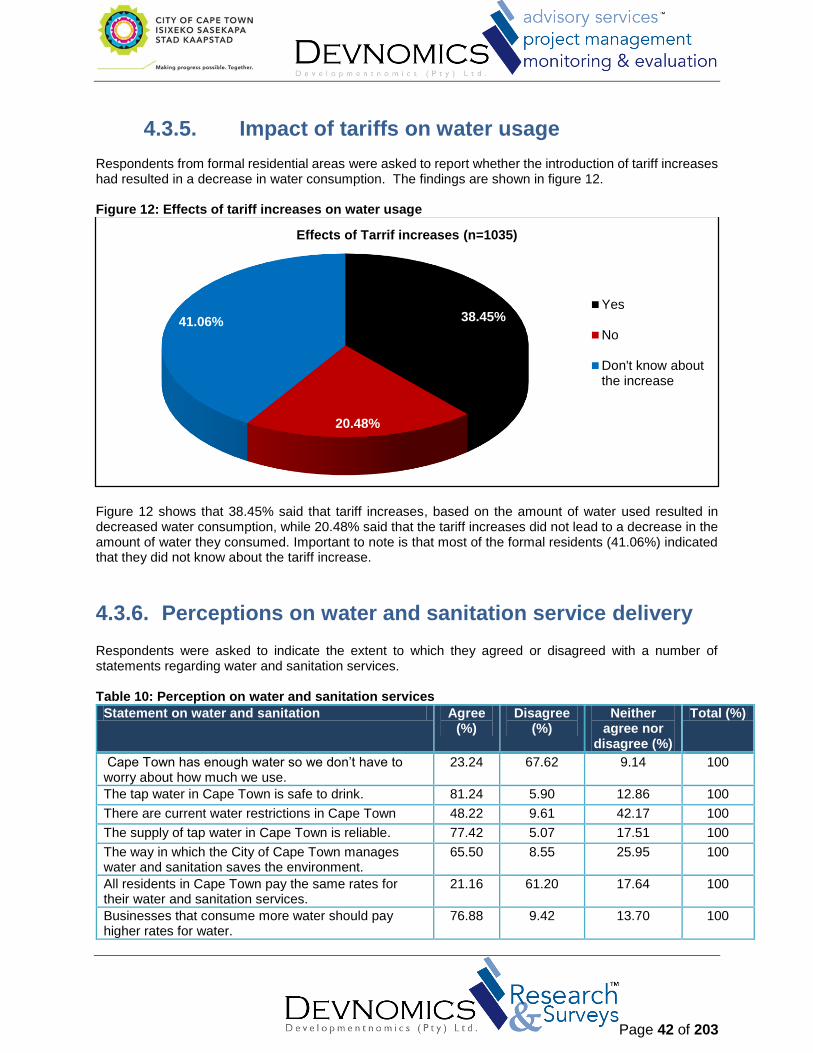
Page 42 of 203
4.3.5. Impact of tariffs on water usage Respondents from formal residential areas were asked to report whether the introduction of tariff increases had resulted in a decrease in water consumption. The findings are shown in figure 12. Figure 12: Effects of tariff increases on water usage
Figure 12 shows that 38.45% said that tariff increases, based on the amount of water used resulted in decreased water consumption, while 20.48% said that the tariff increases did not lead to a decrease in the amount of water they consumed. Important to note is that most of the formal residents (41.06%) indicated that they did not know about the tariff increase.
4.3.6. Perceptions on water and sanitation service delivery Respondents were asked to indicate the extent to which they agreed or disagreed with a number of statements regarding water and sanitation services. Table 10: Perception on water and sanitation services
Statement on water and sanitation Agree (%)
Disagree (%)
Neither agree nor
disagree (%)
Total (%)
Cape Town has enough water so we don’t have to worry about how much we use.
23.24 67.62 9.14 100
The tap water in Cape Town is safe to drink. 81.24 5.90 12.86 100
There are current water restrictions in Cape Town 48.22 9.61 42.17 100
The supply of tap water in Cape Town is reliable. 77.42 5.07 17.51 100
The way in which the City of Cape Town manages water and sanitation saves the environment.
65.50 8.55 25.95 100
All residents in Cape Town pay the same rates for their water and sanitation services.
21.16 61.20 17.64 100
Businesses that consume more water should pay higher rates for water.
76.88 9.42 13.70 100
38.45%
20.48%
41.06%
Effects of Tarrif increases (n=1035)
Yes
No
Don't know aboutthe increase

Page 43 of 203
Statement on water and sanitation Agree (%)
Disagree (%)
Neither agree nor
disagree (%)
Total (%)
Disadvantaged people should get free water and sanitation services.
73.45 10.22 16.33 100
The price of water and sanitation services in Cape Town is fair to everyone.
30.30 30.78 38.93 100
The City of Cape Town manages its water supply in a responsible way.
50.10 9.51 40.39 100
Table 10 illustrates that 23.24% of formal residents can be said to disagree with the following statement: “Cape Town has enough water, so we don’t have to worry about how much we use”. On the other hand, 69.62% of respondents disagreed with the statement and only 9.14% were neutral. Majority of the respondents (81.24%) can be said to agree with the statement that “the tap water in Cape Town is safe to drink’. On the other hand, 5.90% of the residents can be said to disagree with the statement, and 12.86% were neutral to the statement. More than 500 formal residents (48.22%) agreed with the statement that “there are current water restrictions in Cape Town”. It can be observed that 9.62% of respondents disagree with the statement, while a sizeable group of residents (42.17%) are indifferent to the statement. Majority of the respondents (77.42%) can be said to also agree with the following statement that “the supply of tap water in Cape Town is reliable”. It can be further observed that 17.51% of respondents were indifferent to the statement and only 5.07% can be said to disagree with the statement. The majority of formal residents (65.50%) indicated that they agreed with the statement following statement: “the way in which the City of Cape Town manages water and sanitation saves the environment”. 25.95%% were indifferent to the statement while 8.55% of the respondents disagreed.
Majority (61.20%) of the residents indicated that they disagreed with the statement that “all residents in Cape Town pay the same rates for their water and sanitation services”, while 17.64% of respondents were indifferent to the statement and 21.16% agreed. The findings also shows that 76.88% formal residents agreed with the statement “businesses that consume more water should pay higher water rates”; 13.70% indicated they were neutral to the statement while 9.42% residents disagreed with the statement. The findings also show that a large number of formal residents (73.45%) agreed with the statement that “disadvantaged people should get free water and sanitation’ and 16.33% are indifferent to the statement. 10.22% of the residents however disagreed with the statement. The largest proportion of respondents (38.93%) indicated that they were indifferent to the following statement: “the price of water and sanitation in Cape Town is fair to everyone”; while 30.30% of the formal residents agreed and 30.78% disagreed with the statement. Table 10 also shows that 50.10% of the residents agreed with the statement that “the City of Cape Town manages its water supply in a responsible way”, while 40.39% were indifferent and 9.51% residents disagreed.
4.4. Water conservation

Page 44 of 203
In order to gain insight into the City’s conservation initiatives, the following questions were designed to elicit consumers’ knowledge and awareness with regard to the impact of these initiatives.
4.4.1. Knowledge of water-conservation promotions Respondents were asked whether they have heard radio advertisements or seen advertisements or pamphlets from the City that promote water conservation. The findings are shown in figure 13. Figure 13: Knowledge of promotions
Figure 13 shows that 60.70% of the respondents have heard radio advertisements or seen advertisements such as pamphlets that promote water conservation, while 39.30% had not. The City should therefore do more in terms of promoting water conservation. It could adopt an integrated communication strategy by deploying a number of communication tactics such as advertising, exhibitions and workshops, “word-of-mouth” advertising, website advertising, pamphlets, billboard advertising and transit advertising (advertising in trains, buses and taxis). Of the respondents that were unaware of any advertisements or pamphlets from the City of Cape Town promoting water, the largest numbers were from Claremont (Central Cape Town), Kuilsriver (Helderberg), Gugulethu (Klipfontein), Lentegeur and Tafelsig in Mitchells Plain.
4.4.2. Behaviour change towards water conservation Respondents from formal residential areas were asked whether or not their households’ behaviour has changed behaviour with the aim of conserving water, during the past year. Findings are illustrated in figure 14. Figure 14: Change of behaviour
39.30%
60.70%
Exposure to advertisements or pamphlets promoting water conservation (n=1056)
No
Yes

Page 45 of 203
Most respondents (55.55%) indicated that they changed their behaviour regarding water conservation in the past year, and 44.45% did not. It would be advisable for the City to therefore intensify its water conservation awareness programmes in order to increase the level of awareness. This is particularly important on the backdrop of “every drop of water counts.” Of the respondents who were unaware of any advertisements from City of Cape Town, Majority were from Claremont (Central Cape Town), Kuilsriver (Helderberg) and Lentegeur (Mitchells Plain).
4.4.3. Behaviours that facilitate water conservation Formal residential respondents, who reported that their households’ behaviour had changed with the aim of conserving water, were asked to specify from a list, which behaviours concerning water conservation had changed during the past year. The findings are shown in table 11. It is important to note that respondents were allowed to select multiple response-options. Table 11: Behavioural changes in household to conserve water
Water conservation behaviour adopted Count Percentage (%)
I thaw frozen foods in fridge or microwave instead of running water 260 17.93
I turn off the tap while brushing teeth/washing hands 343 23.66
I don’t water the garden between 10 am and 4 pm 133 9.17
I planted plants that use little water 75 5.17
I mulch the flower beds to keep and hold moisture in the soil 43 2.97
I collect rain water 29 2.00
I installed a water saving device in the toilet 41 2.83
I wash the car with a bucket not a hose pipe 194 13.38
I use water conserving tap fittings 40 2.76
I re-use water after bathing 60 4.14
I shower rather than bath 231 15.93
55.55%
44.45%
Change in household behavior to conserve water (n = 1055)
No
Yes

Page 46 of 203
Water conservation behaviour adopted Count Percentage (%)
Other 1 0.07
Total 1450 100.00
Table 11 shows that 23.66% of the respondents indicated that their change in behaviour with respect to water conservation entailed “turning off the tap while brushing teeth/washing hands”, followed by 17.93% of respondents who indicated “thawing frozen foods in the fridge or microwave instead of running water” as their change in behaviour. Residents (15.93%) indicated that they took showers rather than a bath while 13.38% used a bucket instead of a hose when washing their vehicles in order to conserve water.
4.4.4. Awareness of presentations Respondents from the formal residential areas were asked whether or not they were aware of any Water Conservation Officers doing presentation on sewer blockage awareness in their communities. The findings are shown in figure 15.
Figure 15: Awareness of presentations by Water Conservation Officers
As revealed in figure 15, the majority (72.41%) of respondents have not seen presentations promoting water conservation, while 27.59% indicated that they had seen any promotional adverts. Although formal resident’s awareness has increased, the Department is advised to continuously work on reaching all of its stakeholders. Maximising on electronic mediums of communication, as cited earlier can go a long way in this regard. Of the respondents that were not aware of any water conservation officers from the City of Cape Town doing presentations on sewer blockage awareness in the community, the largest numbers were from Claremont (Central Cape Town), Newlands (Central Cape Town), Lentegeur and Tafelsig in Mitchells Plain district.
4.5. Perceptions on water and sanitation services
72.41%
27.59%
Awareness of City of Cape Town community presentations (n = 1044)
No
Yes

Page 47 of 203
The survey’s other objective was to measure customers’ perceptions and satisfaction with the water quality, availability, and also the quality of the sanitation services they receive. Respondents were asked a number of questions.
4.5.1. Ratings on water quality Respondents from formal residential areas were asked to rate the quality of water, supplied by the City of Cape Town. The findings are shown in figure 16.
Figure 16: Ratings on water quality
Expressed as percentages, the counts in figure above show that with regard to the water-quality variables, 58.85% rated the taste of the water as good, while 66.76% rated its smell as good. In terms of water colour, 62.10% rated it as good and 63.82% rated the water pressure as good. With regards to the overall quality, 64.48% of respondents rated it as good.
4.5.2. Satisfaction with water availability Respondents from formal residential areas were asked to report on their overall satisfaction with the City of Cape Town’s provision of tap water. The findings are indicated in figure 17. Figure 17: Overall satisfaction with water availability
Taste Smell Colour Overall quality Water
pressure
Excellent 25.64% 22.92% 22.12% 20.99% 21.65%
Good 58.85% 66.76% 62.10% 64.48% 63.82%
Average 11.64% 8.14% 12.67% 11.40% 11.97%
Poor 3.88% 2.18% 3.12% 3.13% 2.56%
0.00%
10.00%
20.00%
30.00%
40.00%
50.00%
60.00%
70.00%
80.00%
Perc
en
tag
es
Water quality

Page 48 of 203
The figure above shows that the majority of the formal residents (85.78%) were satisfied and only 5.31% were dissatisfied. The remainder of the respondents were neither satisfied nor dissatisfied (8.91%) with the City’s overall availability to provide tap water. There were generally very low levels of dissatisfaction across all districts. However, the largest proportions of dissatisfied respondents were from Newlands in Central Cape Town district.
4.5.3. Experience with water-related problems Respondents from formal residential areas were asked to report whether or not they experienced water-related problems during the past year. The findings are illustrated in figure 18. Figure 18: Experience with water-related problems
The majority of respondents indicated that they did not experience any water-related problems during the past year. However, 14.68% reported that they experienced water-related problems, in the past year.
85.78%
8.91%5.31%
Overall satifaction with City of Cape Town water (n = 1055)
Satisfied
Neither satisfied nordissatisfiedDissatisfied
14.68%
85.32%
Experience with water- related problems within the last year (n = 1056)
Yes
No

Page 49 of 203
Majority of the respondents who experienced water-related problems within the last year resided in Graceland and Harare in Khayelitsha district.
4.5.4. Categories of water-related problems Respondents from formal residential areas, who have experienced water-related problems during the past year, were asked to indicate the type of water-related problems they have experienced. Figure 19 below show the categories identified. Figure 19: Water related problems experienced
Formal residents who said that they experienced water problems, indicated that they encountered burst-pipes (30.39%); low-pressure problems were experienced by 23.04% of the respondents while other residents (26.96%) had experienced no water. Residents experienced underground leaks to a lesser extent (13.24%).
4.5.5. Occurrence of water-related problems Respondents from formal residential areas were asked how often they experienced water-related problems. The findings are indicated in table 12. Table 12: Occurrence of water-related problems
Frequency of occurrence of water-related problem Count Percentages (%)
Cannot say but frequently 21 13.91
Cannot say but rarely 27 17.88
Daily 27 17.88
Monthly 10 6.62
Never 1 0.66
Once or twice a year 36 23.84
Twice a month 21 13.91
Weekly 8 5.30
Grand Total 151 100.00%
Findings in table 12 above show that 13.91% of the City’s formal residents were uncertain about the occurrence of water-related problems, however these respondents regard the occurrence as frequent. The largest proportion of respondents (23.84%) indicated that their problems occurred once or twice a year,
Burst pipesLow
pressureNo water
Underground leaks
Other
Problems experienced 30.39% 23.04% 26.96% 13.24% 6.37%
0.00%
5.00%
10.00%
15.00%
20.00%
25.00%
30.00%
35.00%
Perc
en
tag
e
Water-related problems expereinced ( n=155)

Page 50 of 203
while 17.88% had problems daily and 13.91% had problems twice a month. Fewer residents had problems on a monthly (6.62%) and weekly (5.30%) basis.
4.5.6. Overall satisfaction with sanitation services Respondents from formal residential areas were asked to report on their overall satisfaction with sanitation or sewerage services. The findings are shown in figure 20. Figure 20: Overall satisfaction with sanitation or sewerage services
Figure 20 shows that the majority (85.50%) of respondents was satisfied with the City’s sanitation or sewerage services. Those who are neither satisfied nor dissatisfied with the service constituted 11.07% of the respondents, while 3.44% are dissatisfied. There were generally very low levels of dissatisfaction across all districts. However, the largest proportion of dissatisfied respondents is from Montclair in Mitchells Plain.
4.5.7. Sanitation related problems experienced Respondents from formal residential areas were asked if they had experienced sewerage blockage or sanitation problems, during the past year. Findings are summarised in figure 21 below. Figure 21: sewerage blockage or sanitation problems experienced
85.50%
11.07%3.44%
Overall satifaction with City of Cape Town sanitation and sewerage services (n=1048)
Satisfied
Neither satisfied nordissatisfied
Dissatisfied

Page 51 of 203
The majority of respondents (87.78%) indicated that they did not have any sewerage blockage or sanitation-related problems, while 12.22% of respondents indicated that they experienced sewerage blockage or sanitation related problems, during the past year. The largest number of respondents that experienced a sewerage blockage or sanitation related problem within the last year are from Happy Valley in Helderberg as well as Kwezi Park and Makhaza in Khayelitsha.
4.5.8. Sewerage or sanitation problems experienced Respondents from formal residential areas, who indicated that they experienced sewerage blockage or sanitation related problems, were asked to indicate the type of sewerage blockage or sanitation related problems. The findings are summarised in table 13. Table 13: Type of sanitation related problem
Nature of sanitation related problem experienced Count Percentage (%)
Other 24 19.83
Uncollected excretion 30 24.79
Uncollected industrial waste 20 16.53
Untreated sewerage effluent 47 38.84
Total 121 100.00
The highest percentage of respondents (24.79%) indicated that they experienced sewerage or sanitation problems related to uncollected excretion. The findings also revealed that 16.53% mentioned that they experienced problems with uncollected industrial waste; while 38.84% pointed out that they experienced problems with untreated sewerage effluent.
4.5.9. Sewerage related problems frequency Respondents from formal residential areas, those who experienced sewerage blockage or sanitation related problems, were asked to report the frequency of sewerage blockages or sanitation related problems. Findings are summarised in table 14 below.
12.22%
87.78%
Experience with sewerage blockage or sanitation related problems (n=1056)
Yes
No

Page 52 of 203
Table 14: Frequency of occurrence of sewerage-related problems
Frequency of sewerage related problem Count Percentage (%)
Cannot say but frequently 13 10.74
Cannot say but rarely 29 23.97
Daily 17 14.05
Monthly 11 9.09
Never 2 1.65
Once or twice a year 21 17.36
Twice a month 18 14.88
Weekly 10 8.26
Total 121 100.00
Table 14 illustrates the number of people who experienced sewerage blockage or related problems. 14.05% of the respondents indicated that they experienced daily sewerage blockage problems, 8.26% of the respondents indicated that they experienced sewerage blockage or water-related problems on a weekly basis, while 9.09% stated that they experienced sewerage blockage or related problems on a monthly basis. 14.88% of the respondents indicated that they only experienced problems twice a month. On the other hand, only 1.65% of respondents stated that they never experienced sewerage blockage or sanitation-related problems, while 23.97% of respondents indicated that they experienced sewerage blockage or related problems rarely.
4.6 Customer complaint lodging process Respondents were asked a set of questions designed to measure customers’ satisfaction with the customer complaints-lodging process, and the quality of services by the City. Questions under this section were designed to measure customers’ satisfaction with the complaints lodging process and the quality of services provided by the Department.
4.6.1 Knowledge of the City’s contact details
Respondents from formal residential areas were asked to indicate whether or not they knew how to contact the City of Cape Town’s Water and Sanitation Department if they experienced problems with water and sanitation services. Findings are summarised in figure 22 below. Figure 22: Knowledge of contact details

Page 53 of 203
Most of respondents (57.97%) reported that they knew how to contact the City’s Water and Sanitation Department, if problems with water and sanitation occurred. Majority of the respondents who do not know how to contact the City of Cape Town’s Water and Sanitation Department in the event of a problem are from Rondebosch and Woodstock in Central Cape Town as well as Makhaza in Khayelitsha district.
4.6.2 Complaint lodging of faulty or broken sewerage pipes
Respondents from formal residential areas indicated whether or not they reported faulty/ broken sewerage pipes to the City of Cape Town. Findings are shown in figure 23. Figure 23: Reporting on faulty/broken pipes
As illustrated in the figure, 70.60% of respondents indicated that they reported faulty pipes, while 29.40% did not.
42.03%
57.97%
Knowledge of City's Water and Sanitation Department's contact details (n=1054)
No
Yes
70.60%
29.40%
Reporting of faulty/broken sewerage pipes (n=1058)
Yes
No

Page 54 of 203
4.6.3 Reporting of water or sanitation related problems
Respondents from formal residential areas were asked whether or not they contacted the City of Cape Town to report a water or sanitation problem, during the past three months. The responses are shown in figure 24. Figure 24: Reporting of water or sanitation related problem in the last 3 months
Figure 24 show that the majority of respondents (84.78%) did not contact the City, while only 15.22% contacted the City to report water or sanitation problems in the past three months.
4.6.2 Workmen service delivery rating Respondents were asked to rate their experience with the Call Centre. Their responses are shown in figure 25.
15.22%
84.78%
Contact made with the City in the last 3 months (n=611)
Yes
No

Page 55 of 203
Figure 25: Call Centre rating
The easeof findingthe rightoptions
when youcall.
The timetaken to
get hold ofthe rightperson inthe callcentre
Beingserved in aprofessional mannerand giving
you areferencenumber.
Landlinenumber is
alwaysavailableand not
engaged
Staffhandles
complainsin a
dignifiedmanner
Staffprovideprompt
feedbackon SMSessend about
querieslogged
TheSMSes are
instantlydelivered
Community workersare alwayswilling to
help
Community workershandles
complainsin a
dignifiedmanner
Councillorsare flexiblein offeringassistance
Average 17.33% 35.14% 15.58% 23.19% 20.83% 23.33% 18.52% 26.39% 25.71% 18.67%
Excellent 26.67% 8.11% 27.27% 28.99% 23.61% 11.67% 11.11% 27.78% 22.86% 22.67%
Good 42.67% 35.14% 35.06% 17.39% 31.94% 25.00% 25.93% 29.17% 28.57% 21.33%
Poor 13.33% 21.62% 22.08% 30.43% 23.61% 40.00% 44.44% 16.67% 22.86% 37.33%
0.00%
5.00%
10.00%
15.00%
20.00%
25.00%
30.00%
35.00%
40.00%
45.00%
50.00%
Perc
en
tag
es
Please rate your experience of the service you received when you contacted the City of Cape Town (n=93)
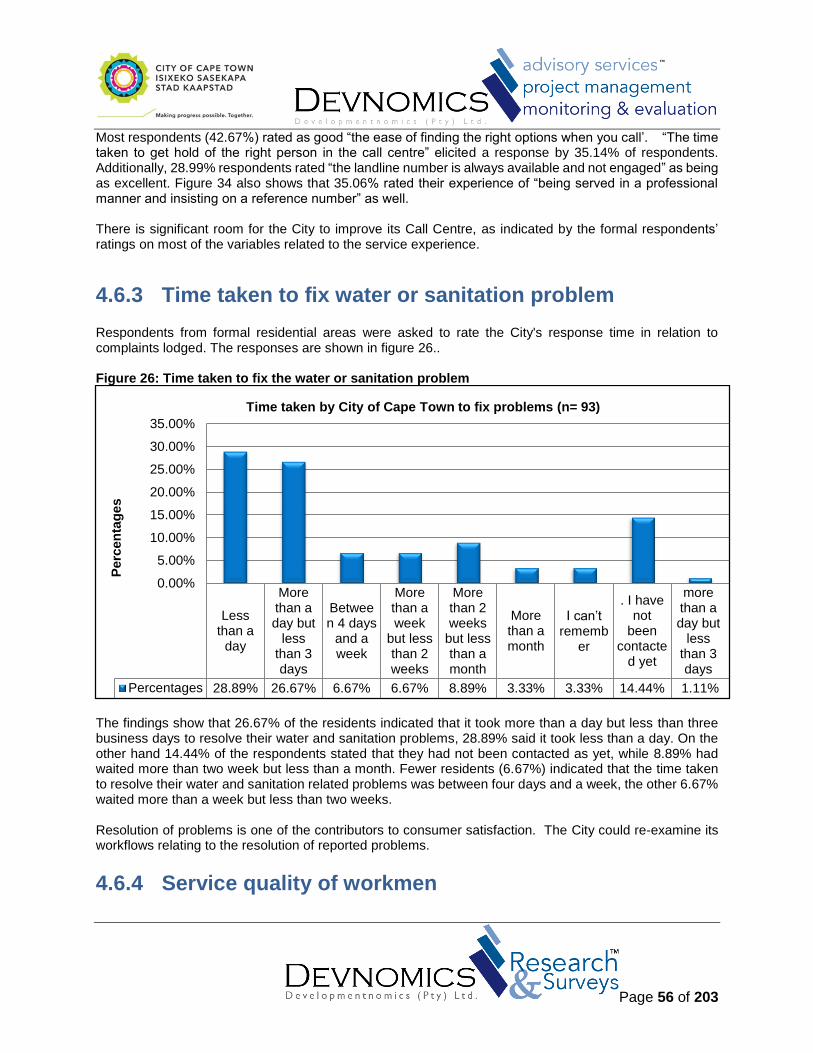
Page 56 of 203
Most respondents (42.67%) rated as good “the ease of finding the right options when you call’. “The time taken to get hold of the right person in the call centre” elicited a response by 35.14% of respondents. Additionally, 28.99% respondents rated “the landline number is always available and not engaged” as being as excellent. Figure 34 also shows that 35.06% rated their experience of “being served in a professional manner and insisting on a reference number” as well. There is significant room for the City to improve its Call Centre, as indicated by the formal respondents’ ratings on most of the variables related to the service experience.
4.6.3 Time taken to fix water or sanitation problem Respondents from formal residential areas were asked to rate the City's response time in relation to complaints lodged. The responses are shown in figure 26.. Figure 26: Time taken to fix the water or sanitation problem
The findings show that 26.67% of the residents indicated that it took more than a day but less than three business days to resolve their water and sanitation problems, 28.89% said it took less than a day. On the other hand 14.44% of the respondents stated that they had not been contacted as yet, while 8.89% had waited more than two week but less than a month. Fewer residents (6.67%) indicated that the time taken to resolve their water and sanitation related problems was between four days and a week, the other 6.67% waited more than a week but less than two weeks. Resolution of problems is one of the contributors to consumer satisfaction. The City could re-examine its workflows relating to the resolution of reported problems.
4.6.4 Service quality of workmen
Lessthan a
day
Morethan aday but
lessthan 3days
Between 4 days
and aweek
Morethan aweek
but lessthan 2weeks
Morethan 2weeks
but lessthan amonth
Morethan amonth
I can’t rememb
er
. I havenot
beencontacte
d yet
morethan aday but
lessthan 3days
Percentages 28.89% 26.67% 6.67% 6.67% 8.89% 3.33% 3.33% 14.44% 1.11%
0.00%
5.00%
10.00%
15.00%
20.00%
25.00%
30.00%
35.00%
Perc
en
tag
es
Time taken by City of Cape Town to fix problems (n= 93)

Page 57 of 203
Respondents from formal residential areas were asked to rate their experiences with the service provided by the workmen/ team who arrived to fix their reported water and sanitation problems. The findings are shown in figure 27. Figure 27: Service quality of workmen
Figure 27 shows that for each variable, most respondents (35.00%) rated “the quality of work performed by the workmen/team” as good. With regard to “the professionalism of the workmen/team”, 35.90% reported a good rating, and “the time taken to fix the problem by the workmen/team” received a 36.84% response as good. In other words, the performance of workmen was rated as good on all the service-quality dimensions under consideration. There is thus room for improvement in the quality of services provided by the City’s workmen or teams. The training of the workmen or teams, in terms of a quality approach to service delivery, could assist in this regard.
4.6.5 Expected time in order to be fixed Respondents from formal residential areas were asked estimate how long (time frame) they think a water and/ or sanitation problem should take to be fixed after being reported. The findings are shown in figure 28 below.
The quality of workperformed by theworkmen/team
Professionalism of theworkmen/team
The time taken to fix theproblem by theworkmen/team
Excellent 32.50% 30.77% 27.63%
Good 35.00% 35.90% 36.84%
Average 17.50% 17.95% 17.11%
Poor 15.00% 15.38% 18.42%
0.00%5.00%
10.00%15.00%20.00%25.00%30.00%35.00%40.00%
Perc
en
tag
es
Workmen/ team rating (n= 93)

Page 58 of 203
Figure 28: Expectations on duration of problem resolution
Most respondents (54.79%) expected a water or sanitation problem to be fixed within an hour of reporting it. A sizeable number (21.42%) expected resolution within six hours, 6.54% expected resolution within 12 hours and 5.69% expected a solution in twenty four hours. The results also indicated that 2.37% of respondents expected the problem to be resolved in more than two days and 1.52% of respondents reported an expectation of within 2 days. A proportion of the residents (7.68%) indicated they did not know which time frame they consider appropriate for a problem to be solved. The City could anticipate the needs and expectations of its customers and use the information to manage customer expectations in order to help customers set realistic expectations. The management of customer expectations involves customer education programmes where consumers are also educated about their responsibilities. In this way, the City could reduce the service-delivery gap which exists between the City and its consumers.
4.7 Value/billing process Respondents were asked a number of questions designed to obtain information regarding customers’ satisfaction with the value derived from the City in relation to the billing processes.
4.7.2 Average monthly payment Respondents from formal residential areas were asked how much they paid on a monthly average, for their water and sewerage. The findings are shown in table 15 below.
Don’t know
Morethan 2days
Within 1hour
Within 12hour
Within 2days
Within 24hour
Within 6hour
Percentage 7.68% 2.37% 54.79% 6.54% 1.52% 5.69% 21.42%
0.00%
10.00%
20.00%
30.00%
40.00%
50.00%
60.00%
Perc
en
tag
es
Expected time for City of Cape Town to fix problems ( n=1055)

Page 59 of 203
Table 15: Monthly water and sewerage bill
Monthly water and sewerage bill Count Percentage (%)
Don’t know 193 18.29
Nothing 82 7.77
R1 - R250 290 27.49
R1 001 - R1 500 33 3.13
R1 501 - R2 000 11 1.04
R2 001 - R2 500 4 0.38
R2 500+ 8 0.76
R251 - R500 242 22.94
R501 - R750 111 10.52
R751 - R1 000 81 7.68
Total 1055 100.00
Table 15 above shows that 27.49% of the respondents indicated that they paid between R1 and R250; 22.94% said they paid between R251 and R500. 18.29% stated that they did not know the amount they paid on their water and sewerage bill.
4.7.3 Frequency in checking water and sanitation bill Respondents were asked how often they checked their water or sewerage bill. The findings are shown in figure 28. Figure 29: Bill-checking frequency
Most respondents (66.86%) said they always checked their water or sewerage account on their rates bill, followed by 13.54% who said they never check their bills. The results also show that 11.34% said they mostly check their bills, and similarly 8.26% said they sometimes check their bills.
66.86%
11.34%
13.54%
8.26%
Frequency in checking water / sewerage accounts (n = 1041)
Always
Mostly
Never
Sometimes

Page 60 of 203
There were generally very low numbers of respondents that do not check their water/sewerage accounts. However, the largest proportions of respondents that do not check their bills were from Happy Valley in Helderberg.
4.7.4 Respondents’ opinions on water bill Respondents were also asked to indicate whether or not they agreed or disagreed with a number of statements presented to them. The findings are shown in figure 30. Figure 30: Respondents’ opinion on the billing process
Figure 30 shows that 82.83% of respondents agree with the statement that “the water bills are sent on time”. On the other hand, only 2.54% disagreed with the statement while 14.63% were neutral. Majority of the respondents (64.04%) agreed that “the meter reading is accurate”. 27.39% were neutral to the statement while 8.57% disagree. Most (53.33%) respondents agreed with the statements that “the water utility provides sufficient information on its services”. Furthermore, 38.83% were neutral and only 7.85% disagreed with the statement. Most (67.80%) of the respondents agreed with the statement that “the water network is in good condition” while 3.51% disagreed with this statement. 28.69% of the residents however were neutral. The City should therefore continuously innovate and improve its service-delivery processes to begin shifting customers’ perceptions from the neutral position towards the positive position.
4.7.5 Satisfaction with the billing process
The water billsare sent on time
The meterreading isaccurate
The water utilityprovides sufficientinformation on its
services
The waternetwork is in good
condition
Agree 82.83% 64.04% 53.33% 67.80%
Neutral 14.63% 27.39% 38.83% 28.69%
Disagree 2.54% 8.57% 7.85% 3.51%
0.00%10.00%20.00%30.00%40.00%50.00%60.00%70.00%80.00%90.00%
Perc
en
tag
es
We would like to know your response to each of the following statements.

Page 61 of 203
Respondents from formal residential areas were asked to indicate their level of satisfaction with regard to the billing process. The findings are shown in figure 31 Figure 31: Satisfaction level with billing process
A majority of the respondents (69.59%) indicated they were somewhat satisfied, 17.83% were neither satisfied nor dissatisfied, and 12.58% were somewhat dissatisfied with the billing process. The City could attempt to continuously monitor the changes within its customer base, to help it engage more with its customers, and move them positively along the satisfaction scale. Stakeholder engagement and subsequent management could be possible mechanisms for the City to use.
4.7.6 Rating of price of water services Respondents from formal residential areas where asked to rate the price of water supplied by the City of Cape Town. The figure below is a demonstration of formal residents’ rating of the price of water services. Figure 32: Rating of water services’ pricing
69.59%
17.83%
12.58%
Overall satifaction with City of Cape Town sanitation and sewerage services (n = 1049)
Satisfied
Neither satisfied nordissatisfied
Dissatisfied

Page 62 of 203
The findings illustrated in figure 32 above shows that 44.03% of the respondents felt water services were fairly priced while only 2.67% felt the cost was cheap. On the other hand, 43.55% expressed that they found the cost of water services expensive.
4.7.7 Rating of price of sanitation services Respondents from formal residential areas where asked to rate the price of sanitation services supplied by the City of Cape Town. The findings are summarised in figure 33 below. Figure 33: Rating of sanitation services’ pricing
The findings showed that 47.88% of the formal residents said that sanitation and sewerage services were fairly priced and 1.54% felt they were cheap. 43.15% however felt these services were expensive.
2.67%
9.74%
43.55%
44.03%
Rating of water services pricing (n= 1047)
Cheap
Don’t know
Expensive
Fairly priced
1.54%
7.43%
43.15%
47.88%
Overall satifaction with City of Cape Town sanitation and sewerage services (n = 1036)
Cheap
Don’t know
Expensive
Fairlypriced

Page 63 of 203
4.7.8 Monthly household free water Formal residents were asked to indicate the amount of free water the City of Cape Town supplies them each month. Figure 34: Free water supplied by the City of Cape Town per month
Figure 34 above shows that 46.14% of residents stated that they did not know the amount of free water they received. 36.22% said they did not receive any free water. On the other hand 10.96% stated that they received 350 litres per month; 1.91% said they received 600 litres; 2.10% received 2000 litres while 1.43% indicated 4000 litres; and only 0.57% of residents receive 8000 litres.
4.7.9 Use of water management device In an endeavor to conserve and avoid wasteful habits, electronic devices have been developed to help households monitor and manage their water use. Respondents from formal residential areas were asked if they owned a water-management device (an electronic device designed to manage the use of water in the household). The findings are shown in figure 35 below.
2 000litres /
2kl
350litres
4000litres /
4kl
6 000litres /
6kl
600litres
8 000litres /
8kl
Don’t know
None
Free water per month 2.10% 10.96% 1.43% 0.67% 1.91% 0.57% 46.14% 36.22%
0.00%5.00%
10.00%15.00%20.00%25.00%30.00%35.00%40.00%45.00%50.00%
Perc
en
tag
es
Free water supplied by the City of Cape Town per houshold per month (n =1049)

Page 64 of 203
Figure 35: Water-management device ownership
Findings shown in figure 35 indicate that 93.34%, a clear majority of respondents reported that they did not have water management device and only 6.66% said that their households were in possession of water management devices. Given this scenario, it is clear that the water management gadget is not a familiar device amongst respondents. There is therefore need for the Department to work to increase awareness of the benefits of the device through information and education initiatives.
4.7.10 Water availability and water management device Respondents who said they had water management devices were asked if their devices ever ran out of water. As seen in figure 36 below, 50.77% of respondents reported that their water management device ran out of water while 49.23% of the respondents indicated that their device did not run out of water. There were generally very low numbers of respondents that may run out of water from the water management device. However, the largest proportions are from Delft in Helderberg.
6.66%
93.34%
Residents with a water management device (n=1051)
Yes
No

Page 65 of 203
Figure 36: Availability of water when using a water management device
4.7.11 Frequency of water running out of device Those who indicate that their device ran out of water were asked about the frequency in which this occurred.
Figure 37 below illustrates their responses. Figure 37: Frequency of running out of water when using water management devices
Figure 37 shows that most respondents (52.94%) said their devices ran out of water on a daily basis, 17.65% stated this occurred once a week, while 8.82% said twice a week and 8.82% experienced this only once a month.
50.77%49.23%
Residents' water management device running out of water (n=70)
Yes
No
Any other DailyOnce per
monthOnce per
weekTwice per
week
Frequency 11.76% 52.94% 8.82% 17.65% 8.82%
0.00%
10.00%
20.00%
30.00%
40.00%
50.00%
60.00%
Perc
en
tag
e
Frequency of water running out of water management device (n=70)

Page 66 of 203
4.7.12 Satisfaction with water management device Respondents from the formal residential areas were asked about their overall satisfaction with their water management devices. Results are summarised in figure 38 below. Figure 38: Satisfaction with water management device
The figure above shows that 55.93% of the respondents were satisfied with their devices and 10.17% were neither satisfied nor dissatisfied. However 33.90% expressed dissatisfaction with their water management devices. There were generally very low numbers of respondents that may run out of water from the water management device. However, the largest proportion is from Delft in Helderberg.
4.7.13 Backyarders and formal residents’ households Respondents from the formal residential areas were asked to indicate whether or not they had backyarders in their household. The findings are summarised in figure 39 below.
55.93%
10.17%
33.90%
Overall satifaction with water management (n=70)
Satisfied
Neither satisfied nor dissatisfied
Dissatisfied

Page 67 of 203
Figure 39: Residents with backyarders in their households
The figure above shows that only 8.06% of the formal residents had backyarders in their households.
4.7.14 Backyarders with access to a standpipe Respondents from the formal residential areas, those who indicated that they have backyarders as part of their household, were asked to report whether or not their backyarders have access to water from a standpipe. Figure 40 below indicates that 62.20% of the respondents stated that their backyarders had access to water through a standpipe. Figure 40: Backyarders’ access to standpipes
91.94%
8.06%
Residents with backyarders in their household (n=1054)
No
Yes
62.20%
37.80%
Residents whose backyarders have access to water through a standpipe (n= 84)
No
Yes

Page 68 of 203
4.7.15 Satisfaction with intervention Furthermore, formal residential respondents with backyarders were asked to indicate whether or not they were happy with the intervention (the fact that the backyarders received a tag and can get their water from a standpipe without having to use your water). Findings are illustrated in figure 41. Figure 41: Household residents’ satisfaction with water intervention provided to backyarders
The figure above shows that 78.57% of the respondents expressed that they were satisfied with the intervention while 21.43% were not satisfied. Respondents gave various reasons for their responses. Those who said yes explained that they were happy with regard to the following statements: “they do not have to pay extra for water”, “not paying for the water and they learned how to conserve water" and “they do not have to walk in and out of my house”. Those who said no indicated that they were not happy because their backyarders also used the same tap they used, that they could leave them without any water to cook or clean. Others were not happy as the rent is reduced because of standpipes and because they only received R350, which does not last. Other residents felt “it will be good to have a standpipe of their own instead of coming in the house to collect water.” There were generally very low numbers of respondents that were not happy with the intervention in the sense that backyarders have received a tag and can get their water from a standpipe without using the residents’ water. The few that responded were from Gardens and Woodstock in Central Cape Town, Kuilsriver and Serepta in Helderberg, Kraaifontein.
4.7.16 Overall satisfaction with water intervention
78.57%
21.43%
Residents who are happy that backyarders have their own tag and do not have to use their water (n = 84)
Yes
No
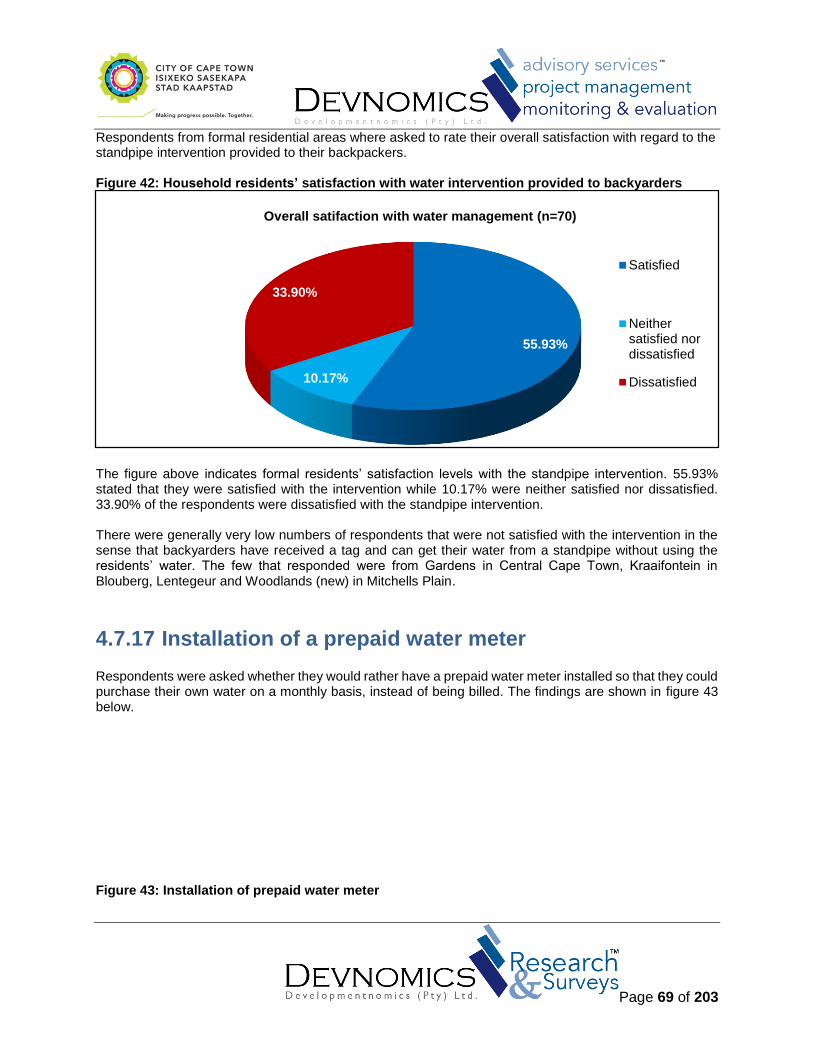
Page 69 of 203
Respondents from formal residential areas where asked to rate their overall satisfaction with regard to the standpipe intervention provided to their backpackers. Figure 42: Household residents’ satisfaction with water intervention provided to backyarders
The figure above indicates formal residents’ satisfaction levels with the standpipe intervention. 55.93% stated that they were satisfied with the intervention while 10.17% were neither satisfied nor dissatisfied. 33.90% of the respondents were dissatisfied with the standpipe intervention. There were generally very low numbers of respondents that were not satisfied with the intervention in the sense that backyarders have received a tag and can get their water from a standpipe without using the residents’ water. The few that responded were from Gardens in Central Cape Town, Kraaifontein in Blouberg, Lentegeur and Woodlands (new) in Mitchells Plain.
4.7.17 Installation of a prepaid water meter Respondents were asked whether they would rather have a prepaid water meter installed so that they could purchase their own water on a monthly basis, instead of being billed. The findings are shown in figure 43 below. Figure 43: Installation of prepaid water meter
55.93%
10.17%
33.90%
Overall satifaction with water management (n=70)
Satisfied
Neithersatisfied nordissatisfied
Dissatisfied

Page 70 of 203
The majority (85.65%) of respondents indicated that they would rather not have a prepaid water meter installed in their households.
4.8 Awareness of customer service contact details for queries/ complains
Respondents were asked a series of questions to determine if they knew the City’s contact details, whether they would be willing to receive information from the City, and also the preferred means of communication.
4.8.2 Knowledge of contact details for queries. Respondents were asked if they were aware of the City's customer-service contact details for queries. Their responses are shown in the figure 44 below. Figure 44: Awareness of contact details
14.35%
85.65%
Residents who would rather have a prepaid meter (n=1052)
Yes
No

Page 71 of 203
Slightly more than half the respondents indicated that they were aware of the customer-service contact details for queries. There still remains a need for the City to increase and expand its existing information and educational initiatives, so that other residents become aware of the contact details. Of the respondents that were not aware of the customer service contact for the City of Cape Town, the largest numbers were from Rondebosch (Central Cape Town), Happy Valley in Helderberg, Mandela Park in Khayelitsha and Tafelsig in Mitchells Plain.
4.8.3 Awareness of the City’s landline and SMS numbers Respondents from formal residential areas were asked if they were aware of the City's landline and SMS numbers for all service calls. The responses are shown in figure 45. The majority of the respondents (61.43%) indicated that they were aware of the landline and SMS numbers. Figure 45: Awareness of the landline and SMS service numbers
54.16%
45.84%
Residents who know the City’s customer service contact details (n=1045)
Yes
No

Page 72 of 203
4.8.4 Use of customer contact details Respondents from formal residential areas, those who were aware of the City’s landline and SMS numbers, were further asked if they had actually made use of the City’s contact details. Figure 46 shows that the majority of respondents (61.61%) had not made use of the City’s contact details. Figure 46: Use of customer service contact detail
4.8.5 Readiness to receive informational materials
61.43%
38.57%
Residents who are aware of the landline and SMS (n=566)
Yes
No
38.39%
61.61%
Residents who have made use of the numbers (n=336)
Yes
No

Page 73 of 203
Respondents from formal residential areas were asked if they would like to receive water-related information in the forms such as pamphlets, stickers and posters that are frequently distributed by the Department. The findings are shown in figure 47. Figure 47: Readiness to receive promotional material
The majority of respondents (74.45%) indicated they would like to receive literature (material such as pamphlets, stickers, and posters) related to water and various initiatives on water and sanitation, from the City.
4.8.6 Information sharing Respondents from the formal residential areas were asked whether or not they discuss water and sanitation media articles or information with family, friends and work colleagues. The findings are shown in figure 48 below. Figure 48: Information sharing
74.45%
25.55%
Residents interested in receiving information from the City (n=1045)
Yes
No
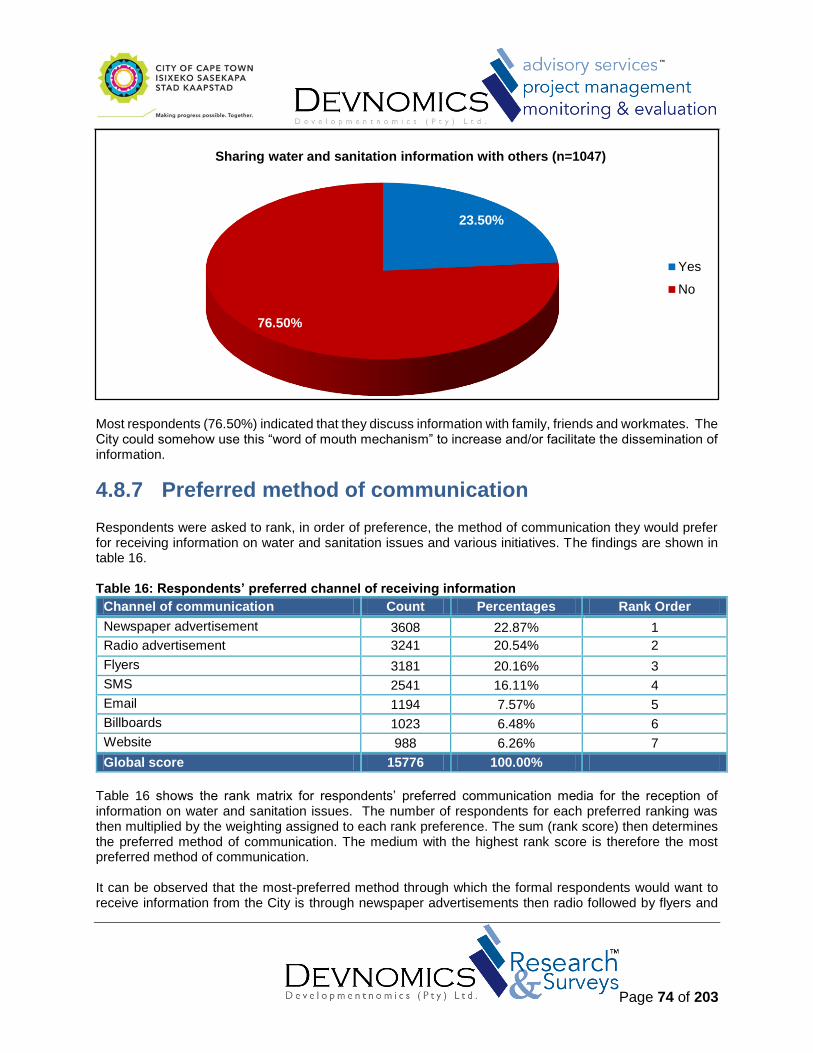
Page 74 of 203
Most respondents (76.50%) indicated that they discuss information with family, friends and workmates. The City could somehow use this “word of mouth mechanism” to increase and/or facilitate the dissemination of information.
4.8.7 Preferred method of communication Respondents were asked to rank, in order of preference, the method of communication they would prefer for receiving information on water and sanitation issues and various initiatives. The findings are shown in table 16. Table 16: Respondents’ preferred channel of receiving information
Channel of communication Count Percentages Rank Order
Newspaper advertisement 3608 22.87% 1
Radio advertisement 3241 20.54% 2
Flyers 3181 20.16% 3
SMS 2541 16.11% 4
Email 1194 7.57% 5
Billboards 1023 6.48% 6
Website 988 6.26% 7
Global score 15776 100.00%
Table 16 shows the rank matrix for respondents’ preferred communication media for the reception of information on water and sanitation issues. The number of respondents for each preferred ranking was then multiplied by the weighting assigned to each rank preference. The sum (rank score) then determines the preferred method of communication. The medium with the highest rank score is therefore the most preferred method of communication. It can be observed that the most-preferred method through which the formal respondents would want to receive information from the City is through newspaper advertisements then radio followed by flyers and
23.50%
76.50%
Sharing water and sanitation information with others (n=1047)
Yes
No

Page 75 of 203
then via SMS. The least-preferred method is through email, billboards and the website. The City could consider these findings in its communication strategy.
4.9 Water and sanitation environmental impact Respondents from formal residential areas were asked if they were aware of the impact water and sanitation has on the environment.
4.9.2 Awareness of the impact of blocked sewers Respondents from formal residential areas were asked whether or not they were aware of the impact that blocked sewers have on the environment. The findings are shown in figure 49. Figure 49: Awareness of impact of blocked sewers
Most respondents (51.53%) indicated that they were not aware of the impact of blocked sewers on the environment in the City. Of the respondents that were not aware of the impact that blocked sewers have on the environment, the largest numbers were from Rondebosch and Woodstock in Central Cape Town, and Kuilsriver in Helderberg.
4.9.3 Awareness of the City’s by-laws Respondents from formal residential areas were asked whether or not they were aware of the City’s by-laws that regulate water usage and water abuse. The findings are shown in figure 50 below. Figure 50: Awareness of City's by-laws
48.47%
51.53%
Awareness of the impact that blocked sewers have on the environment (n=1048)
Yes
No

Page 76 of 203
The figure above indicates that 73.50% are not aware of the City’s by-laws that regulate water usage and water abuse. The City is advised to increase its current efforts to educate and inform communities about the by-laws that regulate water usage and water abuse. Of the respondents that were not aware of the City’s by-laws to regulate water usage, the largest numbers were from Rondebosch in Central Cape Town and Kuilsriver in Helderberg.
4.9.4 Categories of by-laws Respondents from formal residential areas were further asked to indicate which by-laws they were aware of. The findings are shown in figure 51. Figure 51: Categories of by-laws
The finding show that 59.31% of the respondents indicated that they were aware of the water by-law (2010); 29.34% were aware of the industrial effluent and waster by-law, 2006. Respondents (9.46%) also indicated they were aware of the treated effluent by-law, 1.89% however did not know any of the listed by-laws.
26.50%
73.50%
Residents' knowledge of the City's by-laws (n = 1049)
Yes
No
Water by-law2010
Industrialeffluent and
waste by-law,2006
Treatedeffluent by-law, 2009
None Other
City by-laws 59.31% 29.34% 9.46% 1.89% 0.00%
0.00%10.00%20.00%30.00%40.00%50.00%60.00%70.00%
Perc
en
tag
es
Residents knowledge of by-laws (n=278)

Page 77 of 203
4.9.5 Awareness of illegal discharges into a sewer The respondents from formal residential areas were asked to indicate whether or not they were aware of what ‘illegal discharges’ into a sewer is. The results (see figure 52 below) indicated that 68.63% of the respondents said no. Figure 52: Awareness of illegal discharges into a sewer
Respondents were further asked to indicate the type of illegal discharges they were aware of. Most respondents listed concerns such as health hazards and air pollution leaving a bad smell and causing illness. Of the respondents that were not aware of what ‘illegal discharges’ into the sewer are, the largest numbers were from Delft and Kuilsriver in Helderberg.
4.9.6 Awareness of penalty charges Respondents were asked if they were aware of water and sanitation offenses resulting in penalty. The responses are illustrated in figure 53 below. Figure 53: Awareness of penalty charges
31.37%
68.63%
Residents knowledge of 'illegal discharges' (n=1052)
Yes
No

Page 78 of 203
Not surprisingly, 88.78% of the respondents said no, they were not aware of water and sanitation penalties. This is not surprising, seeing as 73.50% have no knowledge of the City’s by-laws in the first instance. Of the respondents that were not aware of water and sanitation offenses resulting in penalties, the largest numbers were from Delft and Kuilsriver in Helderberg and Makhaza in Khayelitsha.
4.9.7 Requests from water and sanitation presentations In conclusion, respondents from the formal residential areas were asked if they would like the City of Cape Town’s Water and Sanitation Department to do a presentation in your community regarding water conservation, water pollution and sewer blockages. An impressive 85.21% of the respondents expressed their interest with regard to attending presentations provided by the City’s Water and Sanitation Department. Figure 54: Willingness to attend presentations by the Water and Sanitation Department
11.22%
88.78%
Residents awareness of water and sanitation penalties (n = 1043)
Yes
No

Page 79 of 203
85.21%
14.79%
Residents that would like the City to do a presentation on waterconservation, water pollution and sewer blockages(n=1048)
Yes
No

Page 80 of 203
5. RECORD OF FINDINGS- INFORMAL
5.1 Introduction A total of 657 questionnaires were successfully administered in all eight districts of the City of Cape Town (CoCT) in informal residential areas. Informal residential areas are usually households with no proper structure as a result of their semi-legal status, infrastructure and services are usually inadequate.
5.2 Demographics and economic indicators
5.2.2 Project area As mentioned above, 657 respondents from informal residential areas were asked to indicate which district they resided in. The findings are shown in figure 55. Figure 55: Distribution of the informal area participation by district
All the districts had a very reasonable percentage of participation in informal areas. The district that had the highest participation rate was Kraaifontein/ Blouberg with 15.07%, second highest number of participants resided in Klipfontein with 13.24%, and respectively followed by other districts as shown above. The lowest district participation rate was from Central Cape Town area with a percentage of 11.26%.
5.2.3 Respondents’ age Respondents from informal residential areas were asked to select the age category that best represents their age. Results are summarised in figure 56.
Central (Cape
Town Area)
Helderberg /
KuilsriverKhayelitsha Klipfontein
Kraaifontein /
BloubergMitchells Plain
South
Peninsula
Tygerberg /
Bellville
Count 74 82 81 87 99 80 76 78
Percentages 11.26% 12.48% 12.33% 13.24% 15.07% 12.18% 11.57% 11.87%
0
20
40
60
80
100
120
Perc
en
tag
es
Project area (n=657)

Page 81 of 203
Figure 56: Distribution of respondents by age
The largest group of informal areas respondents came from the 25 to 34 age group with 43.34%, second by 35 to 49 with 32.01%, followed by 18 to 24 with 15.31% and the two lowest groups of respondents were 50 to 64 with 7.04% and 65 years and older with 2.30%. .
5.2.4 Gender Respondents from informal residential areas were asked to indicate their gender. The findings are shown in figure 57 below. Figure 57: Distribution of respondents by gender
The majority of respondents were females with 67.38% and 32.32% were males and the lowest respondents were those who did not want to disclose their gender with 0.30%. This indicates that females are regarded as active participants in household activities that affect the wellbeing of the household. Furthermore, women consist of the largest proportion of the population, compared to men. The issue of gender roles and expectations may have contributed to the female sample size in the survey.
15.31%
43.34%
32.01%
7.04% 2.30%
Age (n=653)
18-24
25-34
35-49
50-64
65+
0.30%
67.38%
32.32%
Gender (n=656)
Do not want to disclose
Female
Male

Page 82 of 203
5.2.5 Racial group Respondents from informal residential areas were asked to indicate which racial group they self-identified with. The findings are shown in figure 58 below. Figure 58: Distribution of respondents by race
The findings indicated that the most predominant racial group, within the sample, was those that self-identified as black (90.37%), followed by the coloured racial group (9.17%), white racial group (0.15%) and those who did not want to disclose their self-identified racial group (0.31%). This clearly indicates that the majority of the black racial group resides in informal areas.
5.2.6 Language most spoken at home Respondents from informal residential areas were asked to identify which language they spoke predominantly, at home. Table 17: Distribution of respondents according to languages used
Language spoken Count Percentage (%)
Afrikaans 57 44.19
Did not disclose 5 0.76
English 5 0.76
isiNdebele 2 0.30
IsiXhosa 569 86.61
IsiZulu 6 0.91
Other 1 0.15
Sesotho 4 0.61
seSotho saLeboa 2 0.30
siSwati 1 0.15
Tshivenda 1 0.15
Xitsonga 4 0.61
Black ColouredDo not want to
discloseWhite
Percentages 90.37% 9.17% 0.31% 0.15%
0.00%10.00%20.00%30.00%40.00%50.00%60.00%70.00%80.00%90.00%
100.00%
Pe
rce
nta
ge
Race (n=654)

Page 83 of 203
Total 657 100
With regard to the high percentage of self-identified racially black respondents living in informal settlements, it is interesting to note that the majority of respondents (86.61%) identified isiXhosa as their home language 86.61%, followed by 44.19% of Afrikaans speaking respondents. Other languages shown in the table are not regarded as common mother-tongue languages in the informal settlements, especially in the city of Cape Town. IsiXhosa is the most commonly spoken language in the informal residential areas of Cape Town, compared with other South African local languages. Some respondents indicated that they speak other languages such as Shona, which is not a South African language.
5.2.7 Monthly household income Respondents from informal residential areas were asked to select the most appropriate category that reflects their monthly household income. The findings are shown in table 18 below. Table 18: Distribution of respondents by monthly household income
Row Labels Count Percentage (%)
Did not disclose 121 18.53
None 235 35.99
R1 - R500 37 5.67
R1 001 - R2 000 89 13.63
R10 001 - R12 000 2 0.31
R12 001 - R15 000 1 0.15
R2 001 - R4 000 78 11.94
R4 001 - R6 000 14 2.14
R501 - R1 000 69 10.57
R6 001 - R10 000 7 1.07
Total 653 100%
The findings show that the majority of the respondents (35.99%) from informal areas had no source of income, whereas 18.53% did not want to disclose their monthly income. The highest monthly household income that was reported by respondents (13.63%) was R1001 to R2000. 0.15% of respondents reported that their source of income was R12001 to R15000. It can be argued that the lack of income is a result of the high unemployment rate in the informal areas, which is shown also in the study by the figure which follows below (figure 69). This should be an important point to the City of Cape Town, in terms of possible interventions regarding communications. The issue of income level is closely related to educational levels as well.
5.2.8 Level of educational attainment Respondents from informal residential areas were asked to select the most appropriate category that reflects their highest level of educational attainment. The findings are shown in table 19 below.

Page 84 of 203
Table 19: Distribution of respondents by educational level
Educational status attained Count Percentage (%)
Completed primary schooling 223 34.10
Completed secondary schooling 285 43.58
Did not want to disclose 39 5.96
No formal schooling 64 9.79
Other 1 0.15
Post graduate diploma 3 0.46
Post-secondary i.e. certificate (excluding degree) 36 5.50
University degree 3 0.46
Total 654 100.00
The findings show that most (43.58%) of the respondents said they had completed secondary schooling. A very low proportion of respondents (0.46%) have completed university degrees and post graduate diploma (0.46%). 34.10% of the respondents have completed primary schooling and 9.79% of the respondents have no formal schooling. 5.96% of the respondents did not want to disclose their level of education and 0.15% of the respondents had other qualifications. Evidently shown in the figure, most of the respondents have not been in higher institutional learning, the majority of them have only completed secondary schooling, which is highly expected in informal areas. This might be caused by the lack of resources to continue with higher learning or lack of access to information since most of these places lack social-economic empowerment. This could provide a starting point for the City of Cape Town in terms of the messages relayed to informal residents, regarding water and sanitation services.
5.2.9 Occupation status Respondents from informal residential areas were asked to report their occupational status. The findings are shown in figure 59 below. Figure 59: Distribution of respondents by occupation status
27.94%
1.98%
2.29%
0.92%
3.36%
63.51%
Occupation Status (n=655)
Employed
Other
Own business
Retired
Student
Unemployed

Page 85 of 203
The findings of the study clearly show that 63.51% of the respondents in the informal areas were unemployed during the period of the study. In addition, 35.99% of the respondents had no source of income; this could be explained by the lack of employment that is shown in this figure above. More than a quarter of the respondents (27.94%) were employed, 3.36% of the respondents were students, 2.29% owned businesses, and 0.92% of the informal respondents were retired. Some of the respondents reported that they were either pensioners, casual workers, self-employed or volunteers as well.
5.2.10 Household occupants Respondents from informal residential areas were asked to select the category that best represented the number of people living in their households. The findings are shown in figure 60. Figure 60: Distribution of respondents by number of occupants per household
Indicated by the figure above, 45.45% of the respondents have between 1 and 3 people living in their households. Furthermore, the findings show that 44.04% of the respondents have 4 to 6 people living in their households, while 9.09% reported that their household consists of between 7 and 9 people, and 1.41% of the respondents reported having households 10 or more people. Observing the situation of the informal areas, it is not common to have fewer people living in informal households, despite the predominant notion that informal areas consist of overcrowded households.
5.2.11 Type of toilet Respondents from informal residential areas were asked to report on the type of toilets being used in their households. The findings are shown in table 20 below.
45.45%
44.04%
9.09%
1.41%
Number of People per Household (n=638)
1 – 3
4 - 6
7 - 9
10+

Page 86 of 203
Table 20: Distribution of respondents by type of toilet
Type of toilet Count Percentage (%)
100 Litre Container Toilet 5 0.78
Chemical toilet 131 20.44
Conservancy tank 24 3.74
Enviro loo 15 2.34
Flush toilet 335 52.26
Other 69 10.76
Portable flush toilet 62 9.67
Total 641 100.00
The findings show that the majority of the respondents (52.26%) used flush toilets, while a small proportion (0.78%) of the respondents used 100 litre container toilet. Some (20.44%) respondents used chemical toilets, 9.67% used portable flush toilets, while 3.74% used conservancy tanks, and 2.34% used enviro loos. Few of the respondents (10.76%) said they dug holes for themselves or used their neighbours’ toilets. Some said sometimes the portable flush toilets provided by the council and commonly known as the ‘pota-pota’ toilets in the informal settlements, get full early before the collections time resulting in some residents resorting to the alternative use of personal “buckets”. This paints an unpleasant picture with regards to the population’s access to adequate and decent sanitation.
5.2.12 Electronic communication mediums Respondents from informal residential areas were asked to indicate which electronic medium of communication they had in their household. Multiple selected-response options were possible. The results are illustrated in figure 61 below. Figure 61: Access to electronic communication mediums
The figure shows that the 33.38% of respondents from the informal settlements had TV with local channels followed by 30.52% with cellular phone and 28.75% with radio. These figure show that the three mentioned medium are commonly used in the informal arrears by most people, because they are somehow reasonable
Other
TV withlocal
channelsonly
SataliteTV
Cellularphone
Landline Radio None
Percentage 0.07% 33.38% 5.72% 30.52% 0.82% 28.75% 0.75%
0.00%5.00%
10.00%15.00%20.00%25.00%30.00%35.00%40.00%
Perc
en
tag
e
Electronic medium of Communication
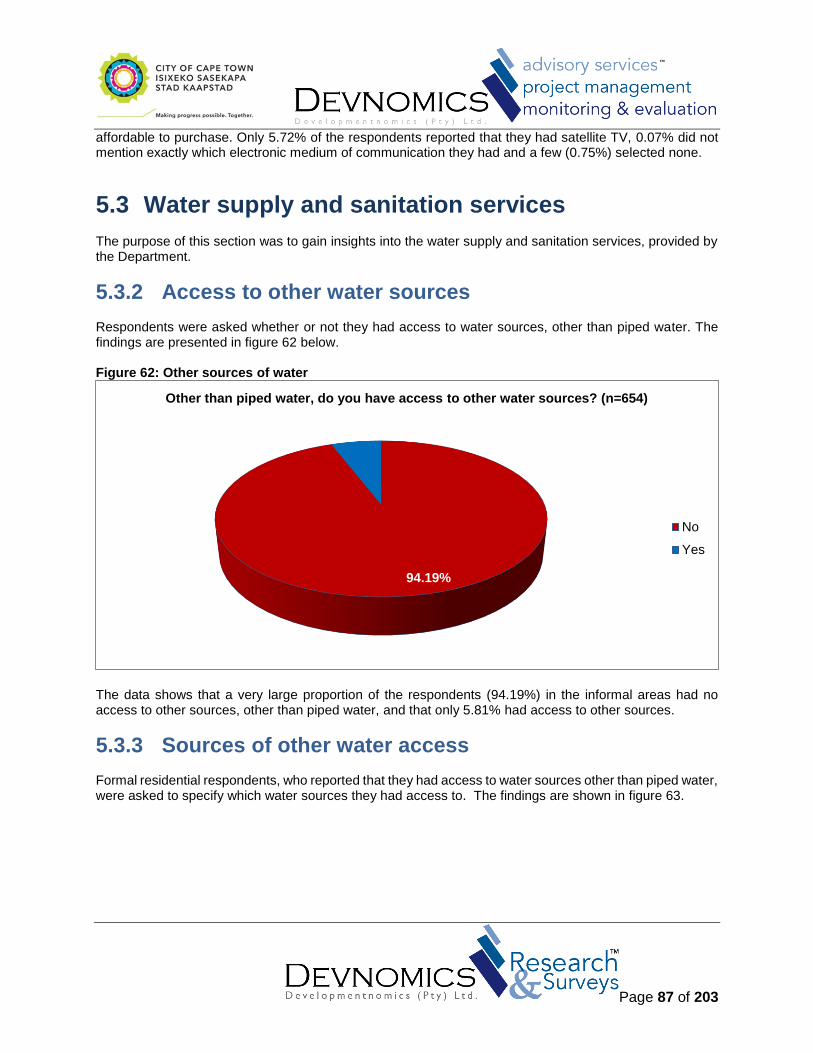
Page 87 of 203
affordable to purchase. Only 5.72% of the respondents reported that they had satellite TV, 0.07% did not mention exactly which electronic medium of communication they had and a few (0.75%) selected none.
5.3 Water supply and sanitation services The purpose of this section was to gain insights into the water supply and sanitation services, provided by the Department.
5.3.2 Access to other water sources Respondents were asked whether or not they had access to water sources, other than piped water. The findings are presented in figure 62 below. Figure 62: Other sources of water
The data shows that a very large proportion of the respondents (94.19%) in the informal areas had no access to other sources, other than piped water, and that only 5.81% had access to other sources.
5.3.3 Sources of other water access Formal residential respondents, who reported that they had access to water sources other than piped water, were asked to specify which water sources they had access to. The findings are shown in figure 63.
94.19%
5.81%
Other than piped water, do you have access to other water sources? (n=654)
No
Yes

Page 88 of 203
Figure 63: Type of other water sources
Most of the informal area residents who had said that they have alternative sources other than piped water said they used river water (58.82%), 20.59% said they had access to rain water, 17.65% said they had access to borehole water and 2.94% said they had access to other sources of water.
5.3.4 Average use of water Respondents from informal residential areas were asked to estimate their households’ monthly average water use (i.e. tap water). The findings are shown in figure 64. Figure 64: Average monthly water use
Rain water River water Borehole Other
Percentage 20.59% 58.82% 17.65% 2.94%
0.00%
10.00%
20.00%
30.00%
40.00%
50.00%
60.00%
70.00%
Perc
en
tag
es
Access to water sources other than piped water (n=38)
Between25
bucketsand 50buckets
Between250
bucketsand 500buckets
Between50
bucketsand 250buckets
Between500
bucketsand 750buckets
Less than25
buckets
More than750
buckets
No idea/ don’t know
Series1 21.97% 8.91% 13.52% 4.45% 25.81% 1.54% 23.81%
0.00%
5.00%
10.00%
15.00%
20.00%
25.00%
30.00%
Perc
en
tag
es
Average water use (tap water) per month (n=651)

Page 89 of 203
The survey found that the largest proportion of the sample (25.81%) indicated that their households used less than 25 buckets of water per month, followed by 23.81% claiming that they had no idea about their monthly water usage and 21.97% using between 25 and 50 buckets of water per month. Only a few respondents (1.54%) used more than 750 buckets. According to Grafone, et al. (2008:4), the average number of buckets used by a household in an informal area is 33 buckets per week or 660 litres.
5.3.5 Comparison of water consumption Respondents from formal residential areas were asked to indicate whether they were using more, the same or less water, compared to the previous year. The findings are shown in figure 65. Figure 65: Household water consumption compared to previous year
The majority of the respondents (51.76%) reported that they used the same amount of water as they did the previous year. Respondents (20.83%) reported that they were not aware of the amount of water they used, followed by 20.52% who reported that their water usage had increased and 6.89% mentioned that their household water usage had decreased. A small proportion of the respondents reported that they were unable to indicate whether their water usage increased, decreased or stayed the same, compared to the previous year. It can be assumed that some of the people living in informal areas do not pay too much attention to water usage in their households.
5.3.6 Impact of tariffs on water usage Respondents from informal residential areas were asked to report whether the introduction of tariff increases had resulted in a decrease in water consumption. The findings are shown in Figure 78.
20.83%
6.89%
20.52%
51.76%
How much water is your household currently consuming, compared to the previous year? (n=653)
Don’t know
Less
More
Same

Page 90 of 203
Figure 66: Effects of tariff increases on water usage
75.42%
20.43%
4.15%
Has the introduction of tariff increases based on the amount of water you use, resulted in your household decreasing its water consumption? (n=652)
Don’t know about the increase
No
Yes

Page 91 of 203
The findings show that the majority of informal residential respondents (75.42%) did not know about the tariff increases, followed by 20.43% of those that did not change their water consumption. Only a few (4.14%) respondents decreased their water consumption. Based on the findings it clearly shows that most people living in informal settlements still need to be taught about things such as tariff increases so that they can be aware. These findings are expected as residents in the informal areas do not pay for water.
5.3.7 Perceptions of water and sanitation services Residents in informal areas were asked to indicate the extent to which agree or disagree with some statements about water and sanitation services. The results are shown in the table below. Table 21: Informal residents’ perceptions on water and sanitation
Statement about water and sanitation services Agree (%)
Disagree (%)
Neither agree nor disagree
(%)
Total (%)
Cape Town has enough water so we don’t have to worry about how much we use.
32.45 57.61 9.94 100.00
The tap water in Cape Town is safe to drink. 88.24 4.02 7.74 100.00
There are current water restrictions in Cape Town 44.00 11.68 44.32 100.00
The supply of tap water in Cape Town is reliable. 69.71 10.58 19.71 100.00
The way in which the City of Cape Town manages water and sanitation saves the environment
54.52 13.79 31.69 100.00
All residents in Cape Town pay the same rates for their water and sanitation services.
22.68 56.22 21.10 100.00
Businesses that consume more water should pay higher rate for water.
80.56 8.46 10.97 100.00
Disadvantaged people should get free water and sanitation. 89.15 1.75 9.09 100.00
The price of water and sanitation in Cape Town is fair to everyone.
31.89 28.69 39.42 100.00
The City of Cape Town manages its water supply in a responsible way(give example)
49.44 14.65 35.91 100.00
Most respondents (57.61%) disagreed with the following statement: “Cape Town has enough water so we don’t have to worry about how much we use.” The majority of the respondents (88.24%) agreed that “the tap water in Cape Town is safe to drink.” With regard to the following statement: “There are current water restrictions in Cape Town,” 44.00% of the respondents agreed while most (69.71%) agreed that “the supply of tap water in Cape Town is reliable” and most (54.52%) agreed with the statement that “the way in which the City of Cape Town manages water and sanitation saves the environment”. Most of respondents (56.22%) claimed they did not agree that all residents in Cape Town pay the same rates for their water and sanitation services, 80.56% agreed that businesses should pay a higher rate for water if they consume more water, and 89.15% agreed that “disadvantaged people should get free water and sanitation”. Respondents (31.89%) agreed, 28.69% neither agreed nor disagreed and 39.42% disagreed with the statement following statement: “The price of water and sanitation in Cape Town is fair to everyone.” Finally, 49.44% agreed, 14.65% of the respondents neither agreed nor disagreed and 35.91 disagreed with the following statement: “the City of Cape Town manages its water supply in a responsible way.”

Page 92 of 203
5.4 Water conservation Analysis of findings under this section is based on respondents’ general awareness and impact of the Department’s water and conservation initiatives.
5.4.2 Promotions on water conservation Respondents were asked whether they have heard radio advertisements or seen advertisements or pamphlets from the City that promote water conservation. The findings are shown in figure 67. Figure 67: Promotions on water conservation
The majority (54.43%) of informal residential respondents that were interviewed was not aware of any advertisement or pamphlets from the city of Cape Town that promoted water conservation. Only 45.57% of the respondents were aware of the advertisements or pamphlets from the Department promoting water conservation. Findings indicate that the Department should strive to improve customers’ exposure and access to promotional materials. Of those who were not aware of the advertisements or pamphlet were mostly from Site 5 (Kraaifontein/Blouberg), Harare (Khayelitsha), Mfuleni (Helderberg/Kuilsriver), and Fisantekraal (Tygerberg/Bellville).
5.4.3 Behaviour change Respondents from informal residential areas were asked whether or not their households’ behaviour has changed behaviour with the aim of conserving water, during the past year. Findings are summarised in figure 68 below.
54.43%
45.57%
Have you heard or seen any advertisements or pamphlets from City of Cape Town that promotes water conservation? (n=654)
No
Yes

Page 93 of 203
Figure 68: Change in behaviour to conserve water
The majority of respondents (53.15%) reported that there was a change in behaviour in order to conserve water, while 46.85% indicated that there was no change in behaviour. This means that the Department needs to increase or rather review its advertising strategies, in order to evoke behavioural change. Of those who did not change their household behavior to conserve water were mostly from Harare and Site C (Khayelitsha), Wallacedene (Kraaifontein).
5.4.4 Behaviours linked to water conservation Informal residential respondents, who reported that their households’ behaviour had changed with the aim of conserving water, were asked to specify from a list, which behaviours concerning water conservation had changed during the past year. The findings are shown in table 22. It is important to note that respondents were allowed to select multiple response-options.
Table 22: Water conservation measures undertaken
Water conservation measure Count Percentage
I turn off the tap if I see running water 289 38.96%
I report water leaks 213 28.81%
I re-use water after bathing 75 10.29%
I turn off a tap while brushing teeth/washing hands 124 16.87%
I wash the car with a bucket not a hose pipe 35 4.80%
Other 2 0.27%
Out of the 305 respondents who reported a change in behaviour, most (38.96%) said that they turned off the tap when they see running water, followed by 28.81% who said they would report water leaks. A count of 124 respondents (16.87%) said that they turned off the tap while brushing teeth/ washing hands, 10.29% said that they re-used water after bathing, and 4.80% said they used a bucket to wash their cars instead of a hose pipe.
53.15%
46.85%
Has your household changed behaviour to conserve water within the last year? (n=651)
No
Yes

Page 94 of 203
5.4.5 Awareness of Water Conservation Officers Respondents from the informal residential areas were asked whether or not they were aware of any Water
Conservation Officers doing presentations on sewer blockage awareness in their communities. The
findings are shown in figure 69.
Figure 69: Awareness of presentations by Water Conservation Officers
The majority of the respondents (74.89%) indicated that they were not aware of any presentations on sewerage blockage by the Water Conservation Officers, in their communities. Only 25.11% reported that they were aware of the sewerage blockage campaigns that were conducted in their areas. This clearly shows that there is low visibility of Water Conservation Officers within informal residential areas. The Department therefore has to ensure that more presentations on sewerage blockage awareness are conducted. As a way forward, it will be important for the City of Cape Town to inform the customers of the days that these Officers will be visiting, so that everyone will have the opportunity to benefit from these awareness campaigns.
5.5 Quality, availability and satisfaction Residents in the informal areas were asked questions to uncover their perceptions of water quality and water availability and satisfaction with sanitation services.
5.5.2 Ratings on water quality Respondents from formal residential areas were asked to rate the quality of water, supplied by the City of Cape Town. The findings are shown in figure 70.
74.89%
25.11%
Awareness of presentations by Water Conservation Officers in the City of Cape Town (n=653)
No
Yes

Page 95 of 203
Figure 70: Water quality ratings
The results illustrated in figure above shows that most residents rate all the water quality dimensions good to excellent. This seem to suggest that the department have in place the necessary infrastructure and human resources to ensure that water quality meets and exceeds the customers’ needs.
5.5.3 Satisfaction with water availability Respondents from informal residential areas were asked to report on their overall satisfaction with the City of Cape Town’s provision of tap water. The findings are indicated in figure 71.. Figure 71: Overall satisfaction with water availability
Most respondents (74.81%) in the informal areas reported that they are satisfied with the water availability, 13.67% showed dissatisfaction with the availability of water in their respective areas and 11.52% of those were neither satisfied nor dissatisfied. General the number was low of those who were dissatisfied with the City of Cape Town provision of water tap, the few that respondent were mostly from Freedom Farm (Tygerberg/Bellville), Brown Farms (Mitchell’s Plain) and Wallacedene (Kraaifontein/Blouberg).
Taste Smell Colour Overall qualityWater
pressure
Average 8.58% 7.07% 11.20% 11.41% 16.90%
Excellent 26.19% 24.73% 25.31% 24.22% 21.86%
Good 63.09% 66.05% 60.89% 61.88% 52.56%
Poor 2.14% 2.15% 2.61% 2.50% 8.68%
0.00%
10.00%
20.00%
30.00%
40.00%
50.00%
60.00%
70.00%
Perc
en
tag
es
Overall water quality (n=657)
13.67%
11.52%
74.81%
How satisfied are you with the water provided by the City of Cape Town? (n=651)
Dissatisfied
Neither satisfied nor dissatisfied
Satisfied

Page 96 of 203
5.5.4 Experience with water-related problems Respondents from informal residential areas were asked to report whether or not they experienced water-related problems during the past year. The findings are illustrated in figure 72. Figure 72: Experience with water-related problems
The findings show that the majority of respondents (62.75%) had not experienced water-related problems within the past 12 months. This interrelates with the previous question that was asked about overall satisfaction with the water provision by the Department. However, 37.25% reported that they have experienced the problems in the past 12 months, which is regarded as a high number of people that are still facing problems regarding service delivery.
5.5.5 Categories of water-related problems Respondents from informal residential areas, who have experienced water-related problems during the past year, were asked to indicate the type of water-related problems they have experienced. Figure 73 below show the categories identified.
62.75%
37.25%
Have you experienced water-related problems within the last 12 months? (n=655)
No
Yes

Page 97 of 203
Figure 73: Experienced water-related problems
Findings show that 39.16% of the respondents experienced non-availability of water-related problems, followed by 24.02% indicating that they experienced low pressure. 22.72% respondents experienced burst pipes, 11.23% experienced underground leaks and 2.87% claimed to have other water-related problems, besides those listed above. All the water-related problems mentioned above are operation and maintenance related. The respondents were further asked to indicate the frequency with which they experienced water-related problems. Most of the respondents (23.43%) experienced weekly water-related problems, followed by 19.67% that claimed to have water-related problems twice a month, while 17.15% experienced the problem daily and 13.81% experienced problems monthly. Only 5.86% of the respondents could not report on the frequency of their water-related problems, while 5.44% of the sample experience water-related problems rarely and 0.84% never.
5.5.6 Distance to closest tap Respondents from informal residential areas were asked to report the distance to the nearest tap, from home. The findings are shown in figure 74. Figure 74: Distance between household and closest tap
Burst pipes Low pressure No waterUnderground
leaksOther
Count 87 92 150 43 11
Percentage 22.72% 24.02% 39.16% 11.23% 2.87%
0
20
40
60
80
100
120
140
160
Perc
en
tag
es
Water-related problems (n=244)
0 - 25metres
0-25metres
101 –125
metres
26 -50metres
51 –75 metres
76 -100metres
Morethan 150metres
Percentage 86.46% 0.15% 0.15% 9.08% 3.69% 0.31% 0.15%
0.00%
20.00%
40.00%
60.00%
80.00%
100.00%
Perc
en
tag
es
Distance to the closest tap, from home. (n=650)
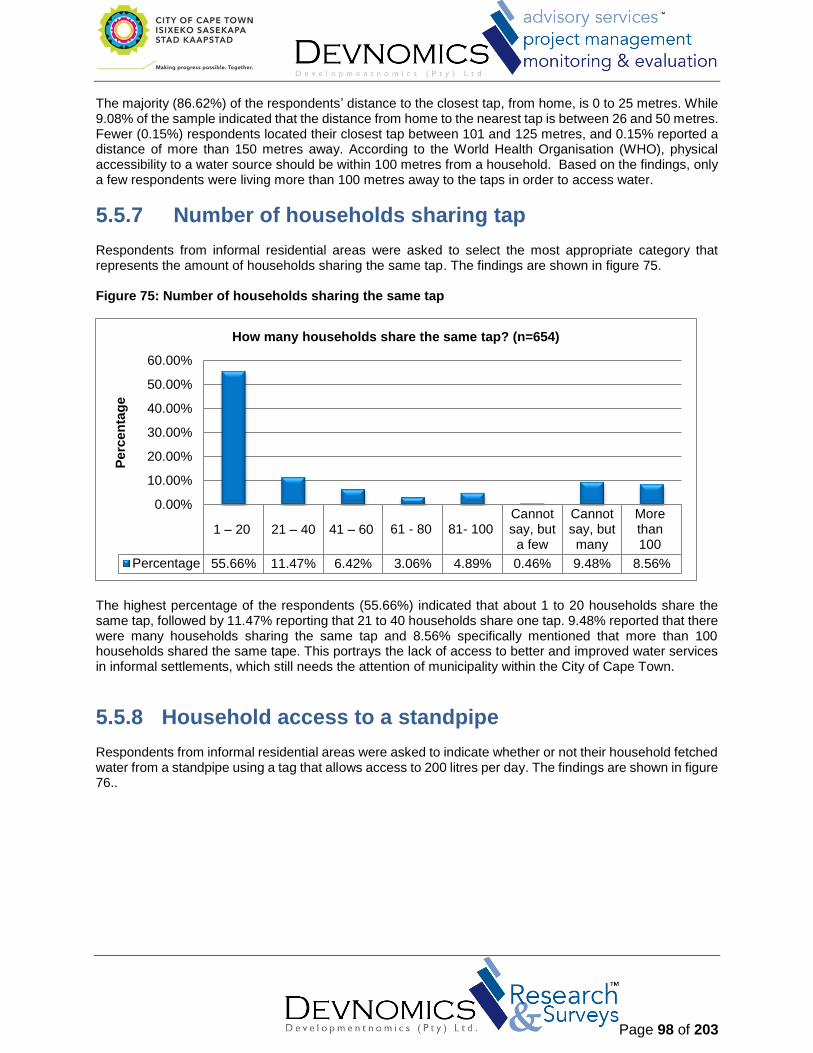
Page 98 of 203
The majority (86.62%) of the respondents’ distance to the closest tap, from home, is 0 to 25 metres. While 9.08% of the sample indicated that the distance from home to the nearest tap is between 26 and 50 metres. Fewer (0.15%) respondents located their closest tap between 101 and 125 metres, and 0.15% reported a distance of more than 150 metres away. According to the World Health Organisation (WHO), physical accessibility to a water source should be within 100 metres from a household. Based on the findings, only a few respondents were living more than 100 metres away to the taps in order to access water.
5.5.7 Number of households sharing tap Respondents from informal residential areas were asked to select the most appropriate category that represents the amount of households sharing the same tap. The findings are shown in figure 75. Figure 75: Number of households sharing the same tap
The highest percentage of the respondents (55.66%) indicated that about 1 to 20 households share the same tap, followed by 11.47% reporting that 21 to 40 households share one tap. 9.48% reported that there were many households sharing the same tap and 8.56% specifically mentioned that more than 100 households shared the same tape. This portrays the lack of access to better and improved water services in informal settlements, which still needs the attention of municipality within the City of Cape Town.
5.5.8 Household access to a standpipe Respondents from informal residential areas were asked to indicate whether or not their household fetched water from a standpipe using a tag that allows access to 200 litres per day. The findings are shown in figure 76..
1 – 20 21 – 40 41 – 60 61 - 80 81- 100Cannotsay, but
a few
Cannotsay, butmany
Morethan100
Percentage 55.66% 11.47% 6.42% 3.06% 4.89% 0.46% 9.48% 8.56%
0.00%
10.00%
20.00%
30.00%
40.00%
50.00%
60.00%
Perc
en
tag
e
How many households share the same tap? (n=654)
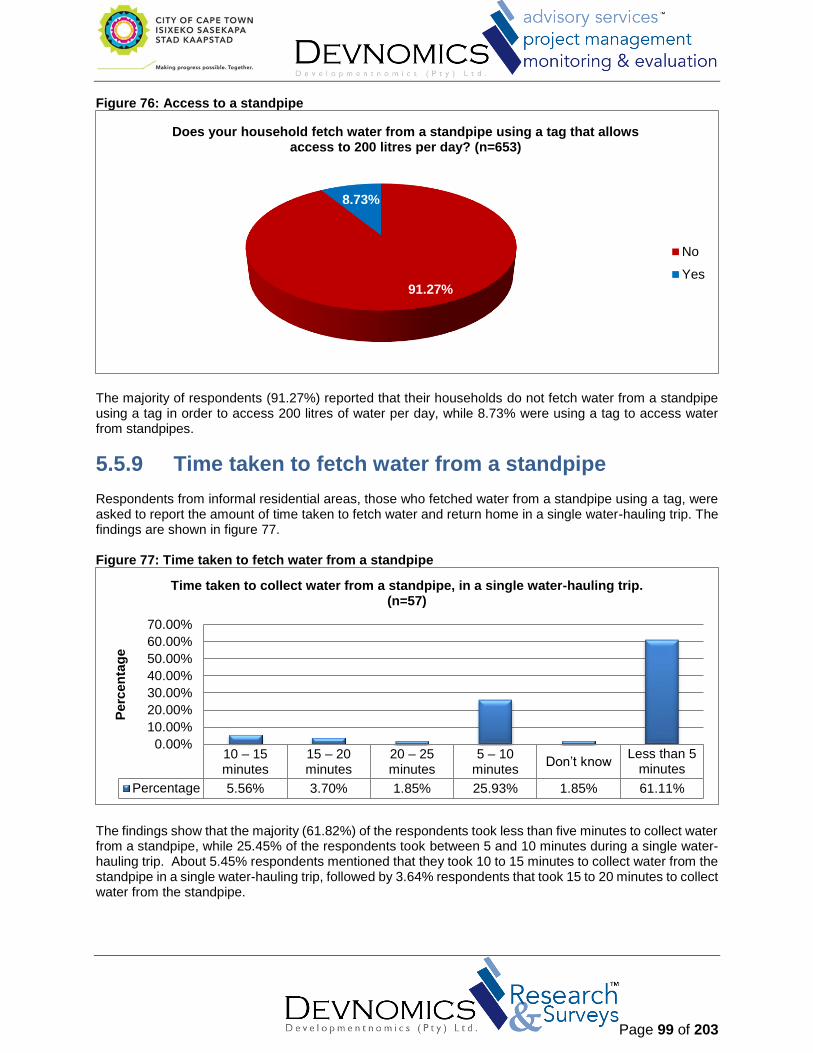
Page 99 of 203
Figure 76: Access to a standpipe
The majority of respondents (91.27%) reported that their households do not fetch water from a standpipe using a tag in order to access 200 litres of water per day, while 8.73% were using a tag to access water from standpipes.
5.5.9 Time taken to fetch water from a standpipe Respondents from informal residential areas, those who fetched water from a standpipe using a tag, were asked to report the amount of time taken to fetch water and return home in a single water-hauling trip. The findings are shown in figure 77. Figure 77: Time taken to fetch water from a standpipe
The findings show that the majority (61.82%) of the respondents took less than five minutes to collect water from a standpipe, while 25.45% of the respondents took between 5 and 10 minutes during a single water-hauling trip. About 5.45% respondents mentioned that they took 10 to 15 minutes to collect water from the standpipe in a single water-hauling trip, followed by 3.64% respondents that took 15 to 20 minutes to collect water from the standpipe.
91.27%
8.73%
Does your household fetch water from a standpipe using a tag that allows access to 200 litres per day? (n=653)
No
Yes
10 – 15 minutes
15 – 20 minutes
20 – 25 minutes
5 – 10 minutes
Don’t knowLess than 5
minutes
Percentage 5.56% 3.70% 1.85% 25.93% 1.85% 61.11%
0.00%
10.00%
20.00%
30.00%
40.00%
50.00%
60.00%
70.00%
Perc
en
tag
e
Time taken to collect water from a standpipe, in a single water-hauling trip. (n=57)

Page 100 of 203
5.5.10 Daily water usage from the standpipe Respondents from informal residential areas were asked to report the amount of water used per day, when accessing the standpipe. The findings are shown in figure 78. Figure 78: Water usage from the standpipe per day
More than a half of the respondents (62.82%) mentioned that they used less than 200 litres per day, whereas 23.21% did not know the amount of water they used per day. 9.09% used more than 200 litres per day, followed by 5.45% that used 200 litres per day. It is interesting to note that the majority of the respondents, in the informal areas, are not using as much water as expected.
5.5.11 Water use during the last six month Respondents from informal residential areas were asked to report whether their daily water use increased, decreased or remained the same during the past six months. The findings are shown in figure 79 below. Figure 79: Water use during the last six month
5.45%
23.64%
61.82%
9.09%
How much water fromt he standpipe do you use per day? (n=57)
200 litres per day
Don’t know
Less than 200 litres per day
More than 200 litres per day
3.51%
66.67%
24.56%
5.26%
Water use during the last six months? (n=57)
Decreased
Don’t know
Increased
Remained the same

Page 101 of 203
Most of the respondents (66.67%) do not know the amount of water used for the last six month, whereas 24.56% respondents’ water usage had increased. Only 5.26% respondents reported that the amount of water used has remained the same and 3.51% reported that the amount used has decreased for the last six months. This could be interesting for the Department of water and sanitation to probe further and train people in informal area about water-related concerns.
5.5.12 Happiness towards standpipe Respondents from informal residential areas were asked to indicate whether or not they are happy with the intervention (the fact that households received a tag and can get water from a standpipe). The findings are shown in figure 80. Figure 80: Happy with the intervention of tags in order to access from the standpipe
The majority respondents (80.77%) were happy with regard to the intervention. However, 19.23%% were not happy. Generally, the number was low of those who were not happy with the intervention, the few that respondent were mostly from Fisantekraal (Tygerberg/Bellville), Zululand and Masiphumelele (South Peninsula), and Mitchell’s Plain (Mitchell’s Plain).
5.5.13 Overall satisfaction with standpipe intervention Respondents from informal residential areas were asked to report their level of satisfaction with regard to the intervention. The findings are shown in figure 81.
19.23%
80.77%
Are you happy with the intervention? (n=57)
No
Yes

Page 102 of 203
Figure 81: How satisfied are you with the intervention?
The majority of the respondents (77.78%) were satisfied with the intervention of tags to access water from the standpipe. Few (14.81%) of those that were dissatisfied with the intervention, followed by 7.41% of those who were neither satisfied nor dissatisfied.
5.5.14 Satisfaction with sanitation services Respondents from informal residential areas were asked to report their level of satisfaction with regard to the City of Cape Town’s provision of sanitation or sewerage services. The findings are shown in figure 82. Figure 82: Satisfaction with sewerage and sanitation services
Less than half of the respondents (43.64%) mentioned that they were satisfied with the sewerage and sanitation services. On the other hand, 42.88% were not satisfied with sewerage and sanitation services, followed by 13.48% who are neither satisfied nor dissatisfied. What comes to the fore is that there is less satisfaction with sanitation and sewage service delivery. The provision of sewerage and sanitation services is not being carried as there is not much difference between the numbers of customers who are satisfied and those who are not. Of those who were dissatisfied with the City of Cape Town provision of sanitation
14.81%
7.41%
77.78%
How satisfied are you with the intervention? (n=57)
Dissatisfied
Neither satisfied nordissatisfied
Satisfied
42.88%
13.48%
43.64%
How satisfied are you with the City of Cape Town in providing you with sanitation or sewerage services? (n=653)
Dissatisfied
Neither satisfied nor dissatisfied
Satisfied

Page 103 of 203
or sewerage services were mostly from Langa (Central Cape Town), Brown Farms (Mitchell’s Plain) and Barcelona (Klipfontein).
5.5.15 Experiences with sanitation related problems Respondents from informal residential areas were asked if they had experienced sewerage blockage or sanitation problems, during the past year. Findings are summarised in figure 83. Figure 83: Experiences with sewerage blockage or sanitation related problems within the last year
Most respondents (53.68%) reported that they had not experienced any problems whereas 46.32% experienced sewerage blockages or sanitation-related problems, during the past year.
5.5.16 Type of sanitation problems experienced Respondents from informal residential areas, who indicated that they experienced sewerage blockage or sanitation related problems, were asked to indicate the type of sewerage blockage or sanitation related problems. The findings are summarised in figure 84 below.
53.68%
46.32%
Sewerage blockage or sanitation related problems in the last year. (n=652)
No
Yes

Page 104 of 203
Figure 84: Sewerage blockage and sanitation problems
A 46.49% of the respondents reported untreated sewerage effluent in their communities, followed by 26.76% of respondents who complained about uncollected excretion. While 19.73% indicated that they have experience blocked toilets and drains during the past year. A small proportion of respondents (7.02%) experienced uncollected industrial waste during the past year.
5.5.17 Frequency of sanitation-related problems Respondents from informal residential areas, those who experienced sewerage blockage or sanitation related problems, were asked to report the frequency of sewerage blockages or sanitation related problems. Findings are summarised in figure 85. Figure 85: Frequency of sewerage blockage or problem
Overall all the responses from the participants regarding their experiences towards a sewerage blockage or problem were low. A proportion of 24.75% and 24.41 respectively were experiencing the problem weekly and daily, whereas 17.73% experienced the blockage twice a month.
OtherUncollected
excretionUncollected
industrial waste
Untreatedsewerageeffluent
Percentage 19.73% 26.76% 7.02% 46.49%
0.00%5.00%
10.00%15.00%20.00%25.00%30.00%35.00%40.00%45.00%50.00%
Perc
en
tag
es
Sewerage blockage or sanitation problems. (n=302)
Cannotsay but
frequently
Cannotsay butrarely
Daily Monthly NeverOnce ortwice a
year
Twice amonth
Weekly
Percentage 5.69% 5.02% 24.41% 12.37% 0.33% 9.70% 17.73% 24.75%
0.00%
5.00%
10.00%
15.00%
20.00%
25.00%
30.00%
Perc
en
tag
es
How often do you experience a sewerage blockage or problem? (n=302)
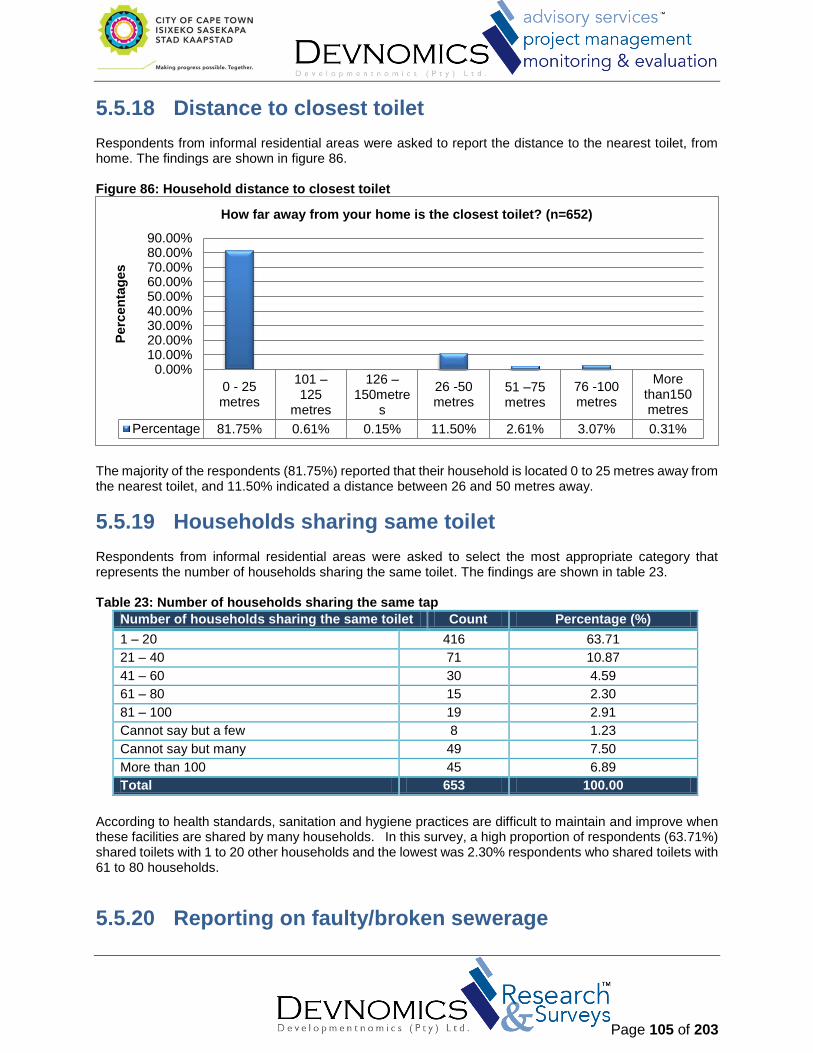
Page 105 of 203
5.5.18 Distance to closest toilet Respondents from informal residential areas were asked to report the distance to the nearest toilet, from home. The findings are shown in figure 86. Figure 86: Household distance to closest toilet
The majority of the respondents (81.75%) reported that their household is located 0 to 25 metres away from the nearest toilet, and 11.50% indicated a distance between 26 and 50 metres away.
5.5.19 Households sharing same toilet Respondents from informal residential areas were asked to select the most appropriate category that represents the number of households sharing the same toilet. The findings are shown in table 23. Table 23: Number of households sharing the same tap
Number of households sharing the same toilet Count Percentage (%)
1 – 20 416 63.71
21 – 40 71 10.87
41 – 60 30 4.59
61 – 80 15 2.30
81 – 100 19 2.91
Cannot say but a few 8 1.23
Cannot say but many 49 7.50
More than 100 45 6.89
Total 653 100.00
According to health standards, sanitation and hygiene practices are difficult to maintain and improve when these facilities are shared by many households. In this survey, a high proportion of respondents (63.71%) shared toilets with 1 to 20 other households and the lowest was 2.30% respondents who shared toilets with 61 to 80 households.
5.5.20 Reporting on faulty/broken sewerage
0 - 25metres
101 –125
metres
126 –150metre
s
26 -50metres
51 –75 metres
76 -100metres
Morethan150metres
Percentage 81.75% 0.61% 0.15% 11.50% 2.61% 3.07% 0.31%
0.00%10.00%20.00%30.00%40.00%50.00%60.00%70.00%80.00%90.00%
Perc
en
tag
es
How far away from your home is the closest toilet? (n=652)

Page 106 of 203
Respondents from informal residential areas were asked whether or not they report faulty/ broken sewerage pipes to the City of Cape Town. The findings are shown in figure 87. Figure 87: Reporting on broken/faulty sewerage pipes
Slightly more than half of the respondents (50.53%) reported that they did report faulty/ broken sewerage pipes to the city.
5.6 Knowledge of customer service contact details This segment of the report focuses on the assessment of respondents’ knowledge and awareness of the City’s customer service contact details for queries, complaints and/or suggestions.
5.6.2 Awareness of how to contact the Department Respondents from informal residential areas indicated whether or not they knew how to contact the City of Cape Town’s Water and Sanitation Department if they experienced problems with water and sanitation services. Findings are summarised in figure 88 below.
43.49%
56.51%
Do you report faulty/ broken sewerage pipes to the City of Cape Town (n=654)
No
Yes

Page 107 of 203
Figure 88: Awareness of how to contact the Department
The findings show that the majority of respondents (76.83%) did not know how to contact the city, while 23.17% said that they knew how to contact the city’s Department of Water and Sanitation, in case of a faults or blockage. Of those who did not know how to contact the CoCT Water and Sanitation Department when they encounter a problem were mostly from Site 5 (Kraaifontein/Blouberg), Mfuleni (Helderberg/Kuilsriver).
5.6.3 Contact with the City of Cape Town Respondents from informal residential areas were asked whether or not they contacted the City of Cape Town to report a water or sanitation problem, during the past three months. The responses are shown in figure 89. Figure 89: Contact with the City of Cape Town in the last 3 months
76.83%
23.17%
Do you know how to contact the City of Cape Town’s Water and Sanitation Department? (n=656)
No
Yes
54.42%
45.58%
Have you contacted City of Cape Town to report water/sanitation related problems in the last 3 months? (n=147)
No
Yes

Page 108 of 203
The figure above shows that most respondents (54.42%) had not contacted the City of Cape Town in the last three months. Only 45.58% contacted the city. This makes sense, since the majority of the respondents did not know how to contact the City.
5.6.4 Service provision experience rating Respondents were asked to rate their experience with the Call Centre. Their responses are shown in table 24. The majority of the respondents indicated that they had contacted the City Council their interactions with the City was good. The efficiency of the City in responding to customer concerns through their SMS service was also one area which stood out with a mostly ‘average’ customer satisfaction rating. Table 24: Rating of service delivery
Service quality dimension Average (%)
Excellent (%)
Good (%)
Poor (%)
Total (%)
The ease of finding the right options when you call. 13.16 10.53 42.11 34.21 100.00
The time taken to get hold of the right person in the call centre
16.67 11.11 33.33 38.89 100.00
Being served in a professional manner and giving you a reference number.
24.32 13.51 32.43 29.73 100.00
Landline number is always available and not engaged
22.86 11.43 28.57 37.14 100.00
Staff handles complains in a dignified manner 25.00 13.89 30.56 30.56 100.00
Staff provide prompt feedback on SMSes send about queries logged
35.71 10.71 7.14 46.43 100.00
The SMSes are instantly delivered 25.00 12.50 4.17 58.33 100.00
Community workers are always willing to help 21.74% 26.09 26.09 26.09 100.00
Community workers handles complains in a dignified manner
26.67 22.22 22.22 28.89 100.00
Councillors are flexible in offering assistance 14.00 14.00 30.00 42.00 100.00
5.6.5 Time taken to respond to queries Respondents from informal residential areas were asked to rate the City's response time in relation to complaints lodged. The responses are shown in figure 90 below.

Page 109 of 203
Figure 90: Time taken to respond to queries
When asked about the response time of the City with regard to queries, 34.85% of the respondents mentioned that the city fixed their water or sanitation problems less than a da. Fewer respondents (15.15%) indicated that the Department took more than a day but less than three days to fix their water or sanitation problems. These findings should prompt the Department to prioritise areas that have unresolved problems.
5.6.6 Rating of service experience Respondents from informal residential areas were asked to rate their experiences with the service provided by the workmen/ team who arrived to fix their reported water and sanitation problems. The findings are shown in figure 91. Figure 91: Service experience rating
The largest proportions of respondents reported that the quality of services by the city of Cape Town was excellent. In addition, respondents (27.12%, 36.21% and 27.27%) regarded the three categories as being good in terms of service delivery. While 20.34%, 15.52% and 18.18% respectively felt that the service was average, followed by 15.25%, 18.97 and 25.45% who felt that the service was poor.
Less thana day
More thana day butless than3 days
Between 4days anda week
More thana weekbut lessthan 2weeks
More than2 weeksbut lessthan amonth
More thana month
I can’t remember
Notcontacted
yet
Percentage 34.85% 15.15% 21.21% 3.03% 7.58% 3.03% 3.03% 12.12%
0.00%5.00%
10.00%15.00%20.00%25.00%30.00%35.00%40.00%
Perc
en
tag
eHow long did you wait before the water or sanitation problem was fixed? (n=67)
The quality of workperformed by theworkmen/team
Professionalism of theworkmen/team
The time taken to fix theproblem by theworkmen/team
Average 19.30% 16.07% 18.87%
Excellent 36.84% 30.36% 30.19%
Good 28.07% 35.71% 24.53%
Poor 15.79% 17.86% 26.42%
0.00%5.00%
10.00%15.00%20.00%25.00%30.00%35.00%40.00%
Perc
en
tag
es
Rating experience of service received (n=67)

Page 110 of 203
5.6.7 Estimated time to resolve problems Respondents from informal residential areas were asked to estimate how long (time frame) they expect a water and/ or sanitation problem should take to be fixed, after being reported. The findings are shown in figure 92. Figure 92: Estimated time to resolve problems
The majority of the respondents (59.39%) expected their problems to be fixed within 1 hour of notifying the City of Cape Town, followed by 18.93% who expected a response within 6 hours.
5.7 Knowledge and awareness of contact details
5.7.2 Awareness of customer contact details Respondents were asked if they were aware of the City's customer-service contact details for queries. Their responses are shown in figure 93 below.
Don’t know
Morethan 2days
Within 1hour
Within 12hour
Within 2days
Within 24hour
Within 6hour
Percentage 4.59% 2.29% 59.48% 7.03% 1.22% 6.42% 18.96%
0.00%
10.00%
20.00%
30.00%
40.00%
50.00%
60.00%
70.00%
Perc
en
tag
e
How long in your estimation, would you expect a water and sanitation problem to be fixed? (n=654)

Page 111 of 203
Figure 93: Awareness of customer service contact details
The data indicated that the majority of respondents (80.61%) were not aware of the customer service contact details, while a small proportion of 19.39% of respondents were aware of the contact details. This clearly shows that the department need to make sure that these resources are accessible to people. Of those who did not know about the City of Cape Town’s customer service contact details in case they had queries were mostly from Site 5 (Kraaifontein/Blouberg), Mitchell’s Plain and Brown farms (Mitchell’s Plain), Fisantekraal and Freedom farm.
5.7.3 Awareness of landline and SMS numbers Respondents from informal residential areas were asked if they were aware of the City's landline and SMS numbers for all service calls. The responses are shown in figure 94. Figure 94: Awareness of landline and SMS numbers
80.61%
19.39%
Do you know about the City of Cape Town’s customer service contact details in case you have queries? (n=655)
No
Yes
40.83%
59.17%
Are you aware that the City has a landline and SMS numbers for all service calls? (n=127)
No
Yes

Page 112 of 203
A total of 59.17% of the respondents mentioned that they were aware of the City of Cape Town’s landline and SMS service numbers. A significant percentage of 40.83% respondents were not aware of the numbers that can be used to contact the City of Cape Town. Therefore, the Department needs to raise awareness on the customer service contact details, so that customers can have access to assistance when they encounter water and sanitation problems. Generally, the number was low of those who were not aware that the City has a landline and SMS numbers for all service calls, the few that respondent were mostly from Mfuleni (Helderberg/Kuilsriver), Doornbach (Kraaifontein/Blouberg), and Bishop Lavis (Tygerberg/Bellville).
5.7.4 Use of customer service contact numbers Respondents from informal residential areas, those who were aware of the City’s landline and SMS numbers, were further asked if they had actually made use of the City’s contact details. The figure below indicates that 58.82% of the respondents have made use of the City of Cape Town’s contact details before. Figure 95: Use of customer service contact number
5.7.5 Interest in receiving information Respondents from informal residential areas were asked if they would like to receive water-related information, such as pamphlets, stickers and posters that are frequently distributed by the Department. The findings are shown in figure 96 below,.
41.18%
58.82%
Have you made use of these numbers before? (n=71)
No
Yes

Page 113 of 203
Figure 96: Interest in receiving information
Majority of the respondents (92.09%) expressed interest in receiving information from the Department, while only 7.91% of the respondents reported a lack of interest. This shows significant interest among the population to have information about their service provider and the services that they are getting.
5.7.6 Ranking of communication channel Respondents were asked to rank, in order of preference, the method of communication they would prefer for receiving information on water and sanitation issues and various initiatives. The findings are shown in table 25. Table 25: Rank of respondents’ preferred medium of communication
Preferred medium of communication
Count Percentage (%) Rank Order
Newspaper advertisement 2764 23.77 1
SMS 2690 23.14 2
Flyers 2513 21.61 3
Radio advertisement 2463 21.18 4
Email 629 5.41 5
Website 545 4.69 6
Other 23 0.20 7
Total 11627 100.00
The most preferred method of communication, as rated by respondents, are the following: newspapers (23.77%), SMS (23.14%), flyers (21.61%), radio advertisements (21.18%), and email (5.41%). The least preferred method of communication is websites (4.69%).
5.7.7 Sharing of water and sanitation information
7.91%
92.09%
Would you like to receive information on water and sanitation initiatives? (n=657)
No
Yes

Page 114 of 203
Respondents from the informal residential areas were asked whether or not they discuss water and sanitation media articles or information with family, friends and work colleagues. The findings are shown in figure 97. Figure 97: Discussion of water and sanitation issues
According to the study, most (67.89%) of the respondents from informal areas did not discuss water and sanitation issues with family members or colleagues, while 32.11% discussed these issues with their family, friends or work colleagues.
5.8 Awareness of sanitation environmental impact Analysis of respondents’ awareness of sanitation environmental impact is presented under this section of the report.
5.8.2 Awareness of blocked sewers’ impact Respondents from informal residential areas were asked whether or not they were aware of the impact that blocked sewers have on the environment. The findings are shown in figure 98.
67.89%
32.11%
Do you discuss water and sanitation media articles or information with your family, friends or work colleagues? (n=654)
No
Yes

Page 115 of 203
Figure 98: Awareness of impact of blocked sewers on environment
Over half of the respondents (53.49%) were aware of the environmental impact posed by blocked sewers, while 46.51% were not aware. Of those who did not know about the City of Cape Town’s customer service contact details in case they had queries were mostly from Blue Downs (Helderberg/Kuilsriver), Mitchell’s Plain (Mitchell’s Plain), and Site 5 (Kraaifontein/Blouberg).
5.8.3 Awareness of the City of Cape Town by-laws Respondents from informal residential areas were asked whether or not they were aware of the City’s by-laws that regulate water usage and water abuse. The findings are shown in figure 99. Figure 99: Awareness of City by-laws
53.49%
46.51%
Are you aware of the impact blocked sewers has on the environment? (n=645)
No
Yes
91.10%
8.90%
Are you aware of the City’s by-laws that regulate water usage and water abuse? (n=652)
No
Yes

Page 116 of 203
A large number of 91.10% respondents reported that they were not aware of the City’s by-laws, while 8.90% were aware of the City by-laws. Of those who were not aware of the City’s by-laws that regulate water usage and water abuse, were mostly
from Mitchell’s Plain and Brown farms (Mitchell’s Plain), Mfuleni (Helderberg/Kuilsriver), Blue Downs
(Helderberg/Kuilsriver), and Zululand (South Peninsula).
5.8.4 Familiarity with water and sanitation by-law categories Respondents from informal residential areas were further asked to indicate which by-laws they were aware of. The findings are shown in figure 100. Figure 100: Familiarity with water and sanitation by-laws
The majority of 51.52% respondents reported that were familiar with the water by-law of 2010 and only 35.85% were aware of the industrial effluent and waste-by-law, 2006. In addition, only 7.58% of the sample was aware of the treated effluent by-law of 2009.
5.8.5 Awareness of illegal sewer discharges The respondents from informal residential areas were asked to indicate whether or not they were aware of what ‘illegal discharges’ into a sewer is. Results are summarised in figure 101.
Water by-law2010
Industrialeffluent and
waste by-law,2006
Treatedeffluent by-law, 2009
None Other
Percentage 51.52% 34.85% 7.58% 6.06% 0.00%
0.00%
10.00%
20.00%
30.00%
40.00%
50.00%
60.00%
Perc
en
tag
e
Which are the by-laws you are aware of? (n=58)

Page 117 of 203
Figure 101: Awareness of illegal discharges into sewer
About 77.45% of the respondents were not aware of ‘illegal discharges’ into sewers. Only 22.55% of the respondents were familiar with illegal discharges into a sewer. Of those who were not aware of what ‘illegal discharges’ into a sewer are, were mostly from Site 5 (Kraaifontein/Blouberg), Mitchell’s Plain and Brown farms (Mitchell’s Plain), and Fisantekraal and (Tygerberg/Bellville).
5.8.6 Awareness of water and sanitation penalty charges Respondents were asked if they were aware of water and sanitation offenses resulting in penalty. The responses are illustrated in figure 102. Figure 102: Awareness of water and sanitation penalty charges
The majority of 90.95% respondents said they were not aware, only 10.09% said that they were aware of penalty charges regarding water and sanitation services abuse. The city of Cape Town should make this information accessible to people that are in the marginalised communities.
77.45%
22.55%
Are you aware of what ‘illegal discharges’ into a sewer are? (n=652)
No
Yes
90.95%
9.05%
Are you aware of any penalty charges regarding water and sanitation services abuse? (n=652)
No
Yes

Page 118 of 203
Of those who were not aware of any penalty charges regarding water and sanitation services abuse, were
mostly from Site 5 (Kraaifontein/Blouberg), Blue Downs and Mfuleni (Helderberg/Kuilsriver), Makhaza
(Khayelitsha) and Mitchell’s Plain (Mitchell’s Plain).
5.8.7 Behaviours resulting in penalty charges Respondents from informal residential areas, those who were aware of penalty charges regarding water and sanitation service abuse, were asked to identify the water and sanitation issues whose penalty charges they were aware of. Findings are presented in figure 103. Figure 103: Behaviours that result in penalty charges
The majority of respondents (33.72%) knew that making illegal water connections resulted in penalty charges, while 29.07% understood that throwing old oil in the drain or sewer also resulted in a penalty charge, followed by 24.42% reported that they were aware that the throwing of foreign items or objects in the drain may result in penalty charges. Very few respondents were knowledgeable that penalty charges may result when you not repairing leaking pipes on your property.
5.8.8 Interest in presentations In conclusion, respondents from the informal residential areas were asked if they would like the City of Cape Town’s Water and Sanitation Department to do a presentation in their community regarding water conservation, water pollution and sewer blockages. Results are summarised in figure 104.
Making illegalwater
connections
Throwing old oilin the
drain/sewer
Throwing foreignitems /objects in
the drain
Not repairingleaking pipes inyour property
Percentage 33.72% 29.07% 24.42% 12.79%
0.00%5.00%
10.00%15.00%20.00%25.00%30.00%35.00%40.00%
Perc
en
tag
es
What are the water and sanitation issues whose penalty charges you are aware of? (n=59)

Page 119 of 203
Figure 104: Interest in receiving water and sanitation presentations
The majority of the respondents (94.91%) indicated that they were interested to have water and sanitation presentations in their respective communities. Although, few (5.09%) of the respondents pointed out that they were not interested in having presentations in their communities. It is important to note that the majority of the people were interested to have presentations in their communities to increase their awareness of water and sanitation related information. It is therefore the responsibility of the department to make that visible.
5.09%
94.91%
Would you like the City of Cape Town’s Water and Sanitation Department to do a presentation in your community regarding water conversation, water pollution and sewer blockages? (n=648)
No
Yes

Page 120 of 203
6. RECORD OF FINDINGS – BUSINESS
6.1 Introduction Respondents under this target group varied from moderate to heavy water consumption businesses. A total of 336 interviews were conducted with respondents in the business areas.
6.2 Characteristics of business respondents Respondents in the business sample were asked a series of questions in order to obtain the profile of the respondents, in terms of their economic characteristics. This profile is important to enable the Department to gain insight into the economic characteristics of the consumption of its products.
6.3 Water and sanitation services
6.3.1 Other water sources Respondents from the business sample were asked whether or not they had access to water sources, other than piped water. The findings are presented in figure 105 below. Figure 105: Other water sources
As depicted in the figure above, 99.40% of the respondents indicated that they had no access to other water sources. On the other hand, 0.60% said they had access to other water sources. The above findings are an indication that the Department provides water services to a large number of businesses.
6.3.2 Types of other water sources It was found that out of the businesses interviewed; only 2 mentioned that they had access to borehole water. No other water source was considered as an option among the respondents. Thus majority of the respondents did not have access to other water sources.
99.40%
0.60%
Access to other water sources (n=334)
No
Yes

Page 121 of 203
6.3.3 Business monthly water usage Respondents from the business sample were asked to estimate their households’ monthly average water use (i.e. tap water). The findings are shown in table 26. Generally, 18.86% specified that they used between 500 and 1000 litres of water per month. Heavy water users constituted a mere 1.50% of the total respondents (more than 100 000 litres per month). Conversely, 32.93% of the total sample indicated that they had no knowledge of the business’ monthly water consumption. Table 26: Monthly water usage
Monthly water usage Count Percentage (%)
Between 1 000 and 5 000 litres 44 13.17
Between 10 000 and 15 000 litres 20 5.99
Between 15 000 and 20 000 litres 6 1.80
Between 20 000 and 30 000 litres 5 1.50
Between 30 000 and 40 000 litres 1 0.30
Between 40 000 and 50 000 litres 4 1.20
Between 5 000 and 10 000 litres 20 5.99
Between 50 000 and 75 000 litres 1 0.30
Between 500 and 1 000 litres 63 18.86
Between 75 000 and 100 000 litres 5 1.50
Less than 500 litres 50 14.97
More than 100 000 litres 5 1.50
No idea/don’t know 110 32.93
Total 334 100.00%
6.3.4 Comparison of current and previous water consumption
Respondents from the business sample were asked to indicate whether they were using more, the same or less water, compared to the previous year. The findings are shown in figure 106.

Page 122 of 203
Figure 106: Comparison of current and previous water consumption
When asked to give a comparison of the current and previous year water consumption, 49.39% of the respondents said that their water usage was still the same. This could be attributed to the nature of business each company is engaged in. 17.68% said the business was using more water than the previous year, while 4.88% commented that the business water usage had dropped. A drop in business water consumption might be due to a change in water conservation behaviours, somehow proving that businesses are aware and practicing some of the Department’s water conservation initiatives. However, 28.05% indicated a lack of knowledge regarding how much water they used within a month.
6.3.5 Impact of tariff increases Respondents from the business sample were asked to report whether the introduction of tariff increases had resulted in a decrease in water consumption. The findings are shown in Figure 107. Figure 107: Impact of tariff increase
28.05%
4.88%
17.68%
49.39%
Water consumption as compared to previous year (n = 328)
Don’t know
Less
More
Same
24.45%
75.55%
Effect of tariff increases on businesses decreasing water consumption (n = 319)
Yes
No

Page 123 of 203
The mainstream 75.55% of the respondents pointed out that business water consumption remained the same regardless of the increase in water tariffs. On the other hand, 24.45% had reduced business water usage with the increase of water tariffs. Water conservation efforts might be in use by businesses that have reduced water usage.
6.3.6 Perceptions on water and sanitation services Respondents were asked to indicate the extent to which they agreed or disagreed with a number of statements regarding water and sanitation services. Table 27: Perception on water and sanitation services
Perception on water and sanitation services Agree (%)
Disagree (%)
Neither agree nor
disagree (%)
Total (%)
Cape Town has enough water so we don’t have to worry about how much we use.
19.94 73.72 6.34 100.00
The tap water in Cape Town is safe to drink. 88.52 5.74 5.74 100.00
There are current water restrictions in Cape Town. 50.61 35.15 14.24 100.00
The supply of tap water in Cape Town is reliable. 85.20 9.37 5.44 100.00
The City of Cape Town looks after the environment in the way it deals with waste water.
62.89 22.96 14.15 100.00
All residents in Cape Town pay the same rates for their water and sanitation services.
11.52 81.82 6.67 100.00
Businesses that consume more water should pay higher rates for water.
68.58 27.19 4.23 100.00
Poor people should get free water and sanitation services.
67.07 25.91 7.01 100.00
The price of water and sanitation services in Cape Town is fair to everyone.
31.91 44.68 23.40 100.00
The City of Cape Town manages its water supply in a responsible way.
52.29 26.61 21.10 100.00
The majority of the respondents (73.72%) disagreed that ‘the City of Cape Town has enough water, so we don’t have to worry about how much we use.’ Subsequently, 81.82% disagreed with the statement that all residents had to pay the same rates for their water and sanitation services. Moreover, 44.68% disagreed with the statement that poor people should get free water and sanitation services. However, respondents were in agreement with some of the statements regarding water and sanitation services. As high as 85.20% of the total population believed that water was reliable while 62.89% thought that the City of Cape Town looked after the environment in its dealing with waste water. 50.61% were in agreement with the statement that ‘there are current water restrictions in the City of Cape Town,’ 68.58% accept as true the fact that ‘businesses that consume more water should pay higher rates for water.’ 67.07% opined that ‘poor people should get free water and sanitation services. Lastly, 52.29% agreed that, ‘the City of Cape Town manages its water supply in a responsible manner.’ A total of 81.52% of companies highlighted that they have not changed their water use behaviour to facilitate water conservation within their businesses. On the contrary, 18.48% have changed their behaviour in an effort to conserve water. Absence of behaviour change by some of the companies might be attributed to the idea of prioritising business success rather than engaging in water saving mechanisms.

Page 124 of 203
6.4 Perceptions on quality Analysis of findings on respondents’ perceptions on water quality, availability and sanitation services are presented under this section.
6.4.1 Water quality rating Businesses were asked to rate the quality of water, supplied by the City of Cape Town. The findings are shown in figure 108. Figure 108: Water quality rating
71.60%, 68.69% and 70.27% rated water pressure, overall quality and taste of water as average whilst the 71.17% of the total sample rated the colour and 73.19% rated smell as average.
6.4.2 Satisfaction with provision of tap water Respondents from the business sample were asked to report on their overall satisfaction with the City of Cape Town’s provision of tap water. The findings are indicated in figure 109 below.
0.00% 10.00% 20.00% 30.00% 40.00% 50.00% 60.00% 70.00% 80.00% 90.00%100.00%
Taste
Smell
Colour
Overall quality
Water pressure
Taste Smell Colour Overall quality Water pressure
Excellent 16.82% 14.76% 15.32% 14.89% 15.71%
Good 11.71% 11.75% 11.41% 14.89% 10.27%
Average 70.27% 73.19% 71.17% 68.69% 71.60%
Poor 1.20% 0.30% 2.10% 1.52% 2.42%
Perceptions on water quality, availability and sanitation services

Page 125 of 203
Figure 109: Satisfaction with water services
The findings show that 87.31% shared the opinion that they were satisfied by the Department’s water and sanitation service delivery. A mere 2.42% illustrated dissatisfaction with the Department’s service delivery. 10.27% were indifferent, as they said they were neither satisfied nor dissatisfied.
6.4.3 Experience with water related problems Respondents from the business sample were asked to report whether or not they experienced water-related problems during the past year. The findings are illustrated in figure 110. Figure 110: Experience with water-related problems
The 90.42% of the respondents confirmed that they had not encountered any water-related experiences in the past year, although 9.58% specified that their business experienced water-related problems.
2.42%
10.27%
87.31%
Satisfaction with the City of Cape Town in providing businesses with tap water (n = 331)
Dissatisfied
Neither satisfied nordissatisfied
Satisfied
90.42%
9.58%
Experience with water related problems within the last year (n = 334)
No
Yes

Page 126 of 203
6.4.4 Occurrence of water-related problems Respondents from the business sample were asked how often they experienced water-related problems. The findings are indicated in figure 111. Figure 111: How often do you experience water related problems?
36.36% of participants indicated that they experienced water problems once or twice a year while 28.13% rarely experienced water problems, while 15.15% indicated that they experienced problems once or twice a month. The Department should ensure that water problems are addressed in time, whenever they are reported, because business production may be affected, especially where there are frequent water problems.
6.4.5 Overall satisfaction with sewerage services Respondents from formal residential areas were asked to report on their overall satisfaction with sanitation or sewerage services. The findings are shown in figure 112.
Daily WeeklyOnce orTwice aMonth
MonthlyOnce orTwice a
year
Cannotsay but
frequently
Cannotsay butrarely
Never
Percentage 9.09% 6.06% 15.15% 3.03% 36.36% 3.03% 27.27% 0.00%
0.00%
5.00%
10.00%
15.00%
20.00%
25.00%
30.00%
35.00%
40.00%
Perc
en
tag
es
Frequency of water-related problems (n = 32)

Page 127 of 203
Figure 112: Satisfaction with sanitation or sewerage services
Overall, the majority 84.45% of businesses were content with the sanitation or sewerage services provided by the Department, as compared to the 3.03% who showed dissatisfaction with the services rendered by the Department.
6.4.6 Experience with blockage or sanitation related problem
Respondents from formal residential areas were asked if they had experienced sewerage blockage or sanitation problems, during the past year. Findings are summarised in figure 113. Figure 113: Experience with sewerage blockage problems
Virtually all respondents 88.89% had not experienced any sewerage blockage or sanitation related problems. 11.11% of the total business sample encountered sewerage blockage or sanitation related
3.03%11.52%
85.45%
Overall satisfaction with the City of Cape Town providing sanitation or sewerage services (n = 330)
Dissatisfied
Neither satisfied nordissatisfied
Satisfied
88.89%
11.11%
Experience with a sewerage blockage or sanitation related problem within the last year (n = 333)
No
Yes

Page 128 of 203
problems. This shows that the business areas are well serviced in terms of water and sanitation service provision.
6.4.7 Frequency of sanitation-related problems Respondents from the business sample, who indicated that they experienced sewerage blockage or sanitation related problems, were asked to indicate the type of sewerage blockage or sanitation related problems. The findings are summarised in figure 114. Figure 114: Frequency of occurrence of sanitation problems
As displayed in the figure above, most respondents (63.89%) said that they experienced sewerage problems once or twice a year. This shows that there is room for improvement to satisfy other participants, who indicated that they sometimes experience problems.
6.5 Knowledge of contact details for queries Respondents were asked whether or not they knew how to contact the Department if they encountered any problems with water and sanitation services. The findings are illustrated below.
6.5.1 Knowledge of the City’s contact details Respondents from the business sample indicated whether or not they knew how to contact the City of Cape Town’s Water and Sanitation Department if they experienced problems with water and sanitation services. Findings are summarised in figure 115. Out of a total number of 334 business respondents, 65.87% had knowledge of water and sanitation contact details. 34.13% did not know how to contact the Water and Sanitation Department at all.
8.33%8.33%
63.89%
16.67%
2.78%
How often do you experience a sewerage blockage or problem? (n=37)
Daily
Monthly
Once or twice a year
Twice a month
Weekly

Page 129 of 203
Figure 115: Use of customer service contact number
6.5.2 Reporting of water or sanitation related problems in the past 3 months
Respondents from the business sample were asked whether or not they contacted the City of Cape Town to report a water or sanitation problem, during the past three months. The responses are shown in figure 116. Figure 116: Contacting the City to report problems
The study showed that only 90.88% of the respondents had contacted the City, while 9.12% stated that they had never contacted the City to report a water and sanitation-related problem.
6.5.3 Service delivery quality rating Business respondents were asked to rate their experience of the service they received when they contacted the City of Cape Town. The findings are shown in table 28 below.
34.13%
65.87%
Knowledge of how to contact the Department (n = 334)
No
Yes
90.88%
9.12%
Have you contacted the City of Cape Town to report water or sanitation related problem in the last three months? (n = 220)
No
Yes

Page 130 of 203
Table 28: Rating of quality of received services
Service delivery dimension Average (%)
Excellent (%)
Good (%)
Poor (%)
Total (%)
The ease of finding the right options when you call.
23.53% 17.65% 52.94% 5.88% 100.00
The time taken to get hold of the right person in the call centre
23.53% 5.88% 64.71% 5.88% 100.00
Being served in a professional manner and giving you a reference number.
11.76% 5.88% 82.35% 0.00% 100.00
Landline number is always available and not engaged
29.41% 11.76% 41.18% 17.65% 100.00
Staff handles complains in a dignified manner
18.75% 6.25% 75.00% 0.00% 100.00
Staff provide prompt feedback on SMSes send about queries logged
42.86% 7.14% 42.86% 7.14% 100.00
The SMSes are instantly delivered 42.86% 14.29% 42.86% 0.00% 100.00
The findings show that most (52.94%) rated as good ‘the ease of finding the right options when you call’. Moreover, 64.71 % rated “the time taken to get hold of the right person in the call center” as ‘good’. Furthermore, 82.35% rated their experience of “being served in a professional manner and insisting on a reference number” as ‘good’. Only 41.18% agreed that the landline number was always available and not engaged. Additionally, 75.00% agreed that ‘staff handles complaints in a dignified manner.’ There is room for the City to improve its Call Centre as respondents rated some of the dimensions of the service experienced in this regard as average and sometimes no comment.
6.5.4 Time taken to fix problems Those who contacted the City to lodge a complaint were asked how long they waited before the reported problem(s) was resolved by the workmen from the City of Cape Town Figure 117: Waiting period before fixing problem
Less than aday
More than aday but lessthan 3 days
Between 4days and a
week
More than aweek but lessthan 2 weeks
More thantwo weeks
but less thana month
Percentage 17.65% 58.82% 11.76% 5.88% 5.88%
0.00%
10.00%
20.00%
30.00%
40.00%
50.00%
60.00%
70.00%
Perc
en
tag
es
Duration of wait before water and sanitation problems were fixed by workmen from City of Cape Town (n = 17)

Page 131 of 203
Most respondents (58.82 %) said they waited more than a day but less than 3 days for the City to fix the problem. In addition, 17.65% respondents said they only waited for less than a day. 11.76% said they waited between 4 days and a week whilst 5.88% indicated that they waited more than a week but less than two weeks before the sanitation problems were fixed. Nonetheless, 5.88% said they still had not been contacted regarding the reported problem.
6.5.5 Rating of service delivery quality Business organisations that participated in the survey were asked what their experiences were with regard to the service they received from the workmen/ team that responded and came to their site to resolve the reported water or sanitation problem. The findings are shown in the figure below. Figure 118: Rating of services received
43.75 % of the respondents rated as good “the quality of work performed by the workmen/team”. Half of the respondents 50.00% indicated that they were being served in a professional manner. Similarly, 50.00% of the respondents rated as good “the time taken to fix the problem by the workmen/team”. On the other hand, none of the respondents (0.00%) rated all the aspects as poor. The analysis above shows that the majority of business respondents rated all three aspects as good and excellent.
6.5.6 Estimated time to fix problems Respondents from the business sample were asked to estimate how long (time frame) they think a water and/ or sanitation problem should take to be fixed after being reported. The findings are shown in figure 119.
The quality of workperformed by theworkmen/team
Professionalism of theworkmen/team
The time taken to fixthe problem by the
workmen/team
Average 25.00% 25.00% 25.00%
Excellent 31.25% 25.00% 25.00%
Good 43.75% 50.00% 50.00%
0.00%
10.00%
20.00%
30.00%
40.00%
50.00%
60.00%
Perc
en
tag
es
Service received rating (n=17)

Page 132 of 203
Figure 119: Estimated time to fix problems
46.35% of the business respondents expected a problem to be fixed within 1 hour of reporting to the City. 28.70% of respondents’ expectations fall within 6 hours, and 12.69% expected resolutions within 12 hours. The results also indicated that 6.95% of respondents would be happy to be attended to within 24 hours, 2.42% within 2 days and 1.51% said they did not know which time frame they considered appropriate for water or sanitation related problem to be solved. The Department could anticipate the needs and expectations of its customers and use that information to manage customer expectations, as well as help customers set realistic expectations. The management of customer expectations involves customer education programmes, where consumers are also educated about their responsibilities. In this way, the Department could reduce the service-delivery gap which exists between the Department and its consumers.
6.6 Value/billing processes Questions under this section were designed to gauge customer satisfaction with the value derived from the water and sanitation services satisfaction levels to the billing processes.
6.6.1 Average monthly payment Respondents from the business sample were asked how much they paid on a monthly average, for their water and sewerage. The findings are shown in figure 120.
Don’t know
More than2 days
Within 1hour
Within 12hour
Within 2days
Within 24hour
Within 6hour
Percentage 1.51% 1.21% 46.53% 12.69% 2.42% 6.95% 28.70%
0.00%5.00%
10.00%15.00%20.00%25.00%30.00%35.00%40.00%45.00%50.00%
Perc
en
tag
es
How long would you expect a water and sanitation problem to be fixed (n = 331)

Page 133 of 203
Figure 120: Average monthly water and sanitation payment
According to the results, 29.00% of the respondents did not know how much they paid for their water and sewerage bill each month. The percentage of the respondents who said that their monthly water and sewage bill was more than R2500, R501 to R750 and R751 to R1000 were 13.90%, 5.74% and 10.57%, respectively. 12.08% paid between R251 and 500, while 14.80% paid between the range of R501 and R750 for their water and sewerage bill each month. Only 3.93 % of the respondents reported paying a monthly bill of between R1 and R250.
6.6.2 Bill-checking frequency Respondents were asked how often they checked their water or sewerage bill. The findings are shown in figure 121.. Figure 121: Bill-checking frequency
A considerable number of respondents (62.42%) indicated that they always checked their water/sewerage account, followed by 21.34% who said they never checked their bills. The results further indicate that respondents (10.83%) said they mostly checked their bills, and 5.41% said they sometimes checked their bills.
Don’t know
Nothing
R1 − R250
R1 001 − R1 500
R1 501 − R2 000
R2 001 − R2 500
R2500+
R2500+
R251 − R500
R501 − R750
R751 − R1 000
R751-R1000
Percentage 29.00% 1.51% 3.93% 4.53% 5.74% 3.32% 13.90% 0.30% 12.08% 14.80% 10.57% 0.30%
0.00%5.00%
10.00%15.00%20.00%25.00%30.00%35.00%
Perc
en
tag
eAverage monthly expenditure for water and sewerage bill
(n = 331)
62.42%10.83%
21.34%
5.41%
How often do you check your water/sewerage account on your rates bill? (n = 314)
Always
Mostly
Never
Sometimes

Page 134 of 203
6.6.3 Perceptions on billing services Respondents were also asked to indicate whether or not they agreed or disagreed with a number of statements presented to them. The findings are shown in figure 122. Figure 122: Perceptions on billing services
The figure above illustrates that 86.94% agreed with the statement that their water bills are sent on time. Only a few respondents (11.68%) disagreed with this statement and 1.37% reported being neutral. On the other hand 68.51% indicated that they agreed that the meter reading is accurate. 28.72% disagreed with this statement and only 2.77% reported being neutral with regard to accurate meter readings. 64.69% of respondents can be said to agree with the statement “water utility provides sufficient information on its services”. 31.12% disagreed with the statement and 4.20% were neutral. Some 72.34% agreed with the statement “water network is in good condition”. The figure further illustrates that only 25.89% disagreed with the statement while 1.77% were indifferent.
6.6.4 Satisfaction level with billing process Respondents from the business sample were asked to indicate their level of satisfaction with regard to the billing process. The findings are shown in figure 123.
The water billsare sent on time
The meterreading isaccurate
The water utilityprovidessufficient
information on itsservices
The waternetwork is in
good condition
Disagree 11.68% 28.72% 31.12% 25.89%
Neutral 1.37% 2.77% 4.20% 1.77%
Agree 86.94% 68.51% 64.69% 72.34%
0.00%
20.00%
40.00%
60.00%
80.00%
100.00%
120.00%
Perc
en
tag
es
We would like to know your responses to each of the following statements

Page 135 of 203
Figure 123: Satisfaction with billing process
Majority of the respondents (86.12%) was satisfied with the billing process and 13.88% were dissatisfied. The Department should continuously monitor the changes within its customer base, to help it engage more with its customers, and move them positively along the satisfaction scale. Stakeholder engagement and subsequent management could be adopted as possible mechanisms to achieve this goal.
6.6.5 Rating of price of water services Respondents from the business sample where asked to rate the price of water supplied by the City of Cape Town. Figure 124 below is a demonstration of formal residents’ rating of the price of water services. Figure 124: Rating of water prices
More than half of the total business sample (60.84%) believed that water was fairly priced while 31.33% said that it was expensive. 7.53% did not know and only 0.30% believed that it was cheap.
6.6.6 Rating of sanitation services prices Respondents from formal residential areas where asked to rate the price of sanitation services supplied by the City of Cape Town. The findings are summarised in figure 125 below.
Satisfied DissatisfiedNeither satisfied not
dissatisfied
Percentage 86.12% 13.88% 0.00%
0.00%
20.00%
40.00%
60.00%
80.00%
100.00%
Perc
en
tag
eSatisfaction with the service level of Water and Sanitation Department with
respect to the billing process (n = 281)
Expensive Fairly Priced Cheap Don’t Know
Percentage 31.33% 60.84% 0.30% 7.53%
0.00%
10.00%
20.00%
30.00%
40.00%
50.00%
60.00%
70.00%
Perc
en
tag
e
Price rating of water supplied by the CIty of Cape Town (n = 332)

Page 136 of 203
Figure 125: Rating of sanitation services
61.09% of the respondents that provided feedback on this particular question believed that sanitation services were fairly priced while 30.70% said that it was expensive, and 8.21% did not know.
6.6.7 Receipt of free water Respondents within the business samples were asked to indicate the amount of free water the City of Cape Town supplies them with each month. Figure 126: Receipt of free water
The analysis shows that 46.30% business respondents did not know the amount of free water the City supplied them with. 37.96% indicated that they did not receive free water from the City. 11.42% of the respondents stated that they received 350 litres of free water from the City of Cape Town each month.
6.6.8 Water-management device ownership
Expensive Fairly Priced Cheap Don’t Know
Percentage 30.70% 61.09% 0.00% 8.21%
0.00%
10.00%
20.00%
30.00%
40.00%
50.00%
60.00%
70.00%
Perc
en
tag
ePrice rating of sanitation services supplied by CIty of Cape Town (n = 329)
None 350 Litres 600 Litres2000
Litres/2kl4000
Litres/ 4kl6000
Litres/ 6kl8000
Litres/ 8klDon’t know
Percentage 37.96% 11.42% 4.32% 0.00% 0.00% 0.00% 0.00% 46.30%
0.00%
5.00%
10.00%
15.00%
20.00%
25.00%
30.00%
35.00%
40.00%
45.00%
50.00%
Perc
en
tag
e
Amount of free water provided to businesses by the City of Cape Town (n = 324)

Page 137 of 203
In an endeavor to conserve and avoid wasteful water habits, electronic devices have been developed to help households monitor and manage their water use. Respondents from the business sample were asked if they owned a water-management device (an electronic device designed to manage the use of water in the household). The findings are shown in figure 127 below. Figure 127: Ownership of water management device
The figure above shows that the majority of the respondents (96.98%) indicated that they did not have a water-management device, while only 3.02% said that they do make use of water-management devices. Thus, there is need for the Department to increase awareness of the benefits of the device through information and education initiatives.
6.6.9 Installation of a prepaid water meter Respondents were asked whether they would rather have a prepaid water meter installed so that they could purchase their own water monthly and not be billed. The findings are shown below. Figure 128: Installation of prepaid water meter device
96.98%
3.02%
Do you have a water management device (n=331)
No
Yes
90.88%
9.12%
Would you rather have a prepaid water meter installed so you can purchase your own water monthly and not be billed? (n = 329)
No
Yes

Page 138 of 203
The majority (90.88%) of respondents indicated that they would rather not have a prepaid water meter installed.
6.6.10 Awareness of step-tariff Respondents were asked whether they are aware of the step-tariff. Step-tariff is the increase in tariff charges determined by levels of consumption. The findings are shown in figure 129. Figure 129: Awareness of step-tariff
According to the figure above 80.24% said they were not aware of step-tariff while only 19.76% had indicated that they are aware.
6.7 Knowledge of contact details for queries Respondents were asked whether or not they knew how to contact the Water and Sanitation Department if they encounter any problems with water and sanitation services. The findings are illustrated in the analyses below.
6.7.1 Awareness of customer service contact details
Respondents were asked if they were aware of the City's customer-service contact details for queries. Their responses are shown in figure 130 below.
80.24%
19.76%
Awareness of Step-tariff (n = 329)
No
Yes
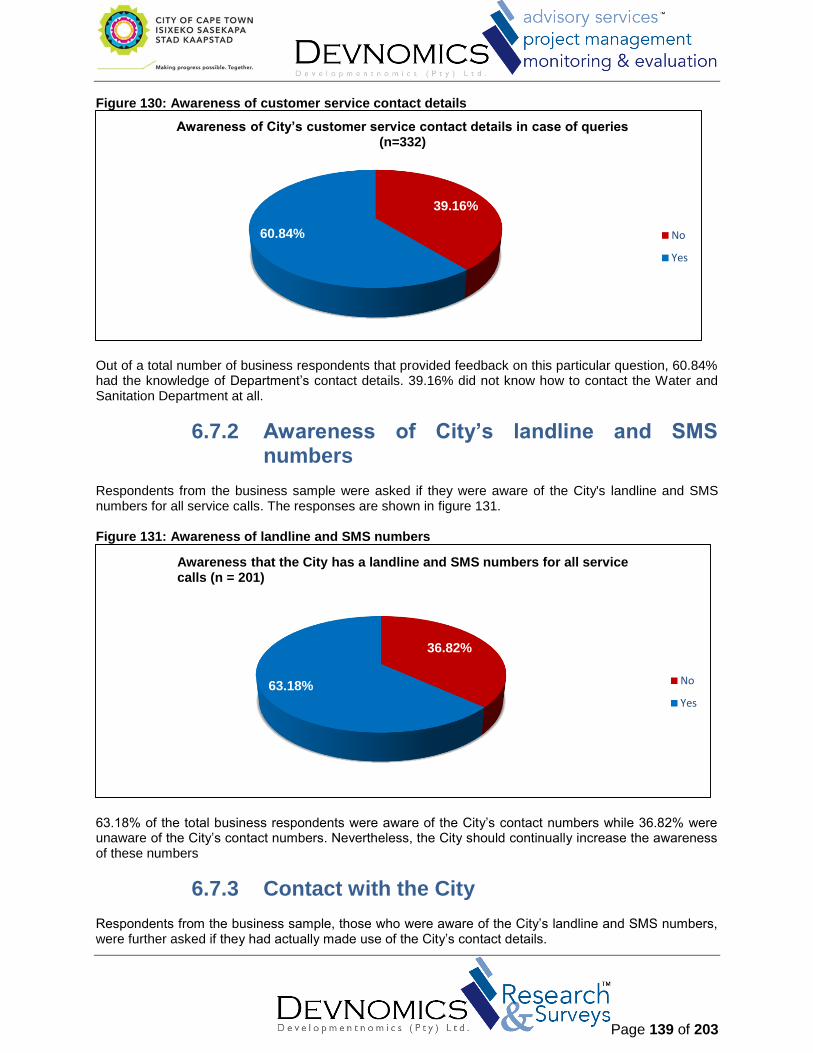
Page 139 of 203
Figure 130: Awareness of customer service contact details
Out of a total number of business respondents that provided feedback on this particular question, 60.84% had the knowledge of Department’s contact details. 39.16% did not know how to contact the Water and Sanitation Department at all.
6.7.2 Awareness of City’s landline and SMS numbers
Respondents from the business sample were asked if they were aware of the City's landline and SMS numbers for all service calls. The responses are shown in figure 131. Figure 131: Awareness of landline and SMS numbers
63.18% of the total business respondents were aware of the City’s contact numbers while 36.82% were unaware of the City’s contact numbers. Nevertheless, the City should continually increase the awareness of these numbers
6.7.3 Contact with the City Respondents from the business sample, those who were aware of the City’s landline and SMS numbers, were further asked if they had actually made use of the City’s contact details.
39.16%
60.84%
Awareness of City’s customer service contact details in case of queries (n=332)
No
Yes
36.82%
63.18%
Awareness that the City has a landline and SMS numbers for all service calls (n = 201)
No
Yes

Page 140 of 203
Figure 132: Contact with the City
Findings in figure 132 above shows that 69.84% had not made use of these numbers. 30.16% stated that they had contacted the City using its SMS or landline numbers for service calls. .
6.7.4 Interest in receiving information Respondents from the business sample were asked if they would like to receive water-related information in the forms such as pamphlets, stickers and posters that are frequently distributed by the Department. The findings are shown in figure 133. Figure 133: Interest in receiving information
The findings in figure 133 shows that 71.99% of the respondents indicated they would like to receive literature (material such as pamphlets, stickers, and posters) explaining various initiatives on water and sanitation from the Department.
69.84%
30.16%
Have you made use of these numbers before? (n=126)
No
Yes
28.01%
71.99%
Would you like to receive information on various initiatives on water and sanitation from the Water and Sanitation Department? (n = 332)
No
Yes

Page 141 of 203
6.7.5 Preferred method of communication Respondents were asked to rank, in order of preference, the method of communication they would prefer for receiving information on water and sanitation issues and various initiatives. The findings are shown in table 29. Table 29: Preferred method of communication
Preferred method of communication Count Percentage (%) Rank Order
Flyers 5528 65.24 1
Newspaper advertisement 943 11.13 2
Radio advertisement 778 9.18 3
Email 535 6.31 4
SMS 408 4.82 5
Website 281 3.32 6
Total 8473 100.00
Flyers were chosen as the most preferred medium of communication by the businesses with a percentage of 65.24% followed by newspaper advertisements with 11.13% and radio advertisements (9.18%). Email, as a preferred medium of communication, amounted to 6.31% of the respondents. SMS was preferred by 11.49% of the respondents and websites received the lowest rank, compared to the other methods of communication..
6.7.6 Information sharing Respondents from the business sample were asked whether or not they discuss water and sanitation media articles or information with family, friends and work colleagues. The findings are shown in figure 134. Figure 134: Information sharing
A considerable number of respondents (72.64%) indicated that they do not discuss information with family, friends and workmates whereas only 27.36% reported discussing information with family, friends or workmates.
72.64%
27.36%
Do you discuss water and sanitation media articles or information with your family, friends or work colleagues? (n=329)
No
Yes
Page 142 of 203
6.7.7 Nature of business Respondents in the business sample were asked to indicate the industry that best describes the nature of their business, in order to obtain the profile of the respondents, in terms of their economic characteristics. This profile is important to enable the Department to gain insight into the economic characteristics of the consumers of its services. Of the respondents who participated in the business survey, 61.13% were in wholesale, retail and motor trade, catering, followed by 12.15% in other businesses such as transport, storage and communication. Personal services constituted 5.67% of the business sample. The lowest percentage of business respondents indicated that they belonged to the agriculture, hunting, foresty and fishing industry (1.62%), as well as the construction industry (1.62%).

Page 143 of 203
Figure 135: Nature of business
Agriculture, hunting,forestry
and fishing
Construction
Electricity,gas and
water
Finance,real estate
andbusinessservices
Government services
Manufacturing
OtherPersonalservices
Transport,storage
andcommunic
ation
Wholesale, retail and
motortrade,
cateringand
accommodation
Percentage 1.62% 1.62% 2.83% 2.83% 2.02% 10.12% 0.00% 5.67% 12.15% 61.13%
0.00%
10.00%
20.00%
30.00%
40.00%
50.00%
60.00%
70.00%
Perc
en
tag
es
Industry that best describes the nature of the business (n = 330)

Page 144 of 203
6.7.8 Number of employees Respondents were asked to indicate the number of employees in the company concerned. The findings are illustrated below. Figure 136: Number of employees
Findings in figure 136 show that 48.79% of respondents said that there were 10 to 49 employees in their business, followed by 43.94% who said they were 0 to 9 employees, and 1.82% stated that they had 250 and more employees. The findings further show that an array of small, medium and large firms participated in the survey with more participants tending toward the small and medium sized firms and businesses.
6.7.9 Type of toilets Respondents from the business sample were asked to report on the type of toilets being used in their households. The findings are shown in figure 137 below.
0 - 9 10 - 49 50 - 249 250 and more
Percentage 43.94% 48.79% 5.45% 1.82%
0.00%
10.00%
20.00%
30.00%
40.00%
50.00%
60.00%
Perc
en
tag
es
Number of employees (n = 330)

Page 145 of 203
Figure 137: Type of toilets
Majority of the respondents (98.50%) said they used the flush toilet, while only 1.20% of the businesses used a septic tank and 0.30% had no toilet.
6.7.10 Water-conservation policy Respondents were asked if they had a water conservation policy. The findings are shown in figure 138. Figure 138: Water conservation policy
The majority of responded (90.30%) reported not having a water conservation policy in place, at their place of employment. The City should encourage businesses, through its communication processes, to draft and widely distribute a water-conservation policy within the business. This is important as; in general, businesses tend to use more water than households.
Flush toilet Septic tankChemical
toiletLong drop
Bucketsystem
Other,specify
No toilet
Percentage 98.50% 1.20% 0.00% 0.00% 0.00% 0.00% 0.30%
0.00%
20.00%
40.00%
60.00%
80.00%
100.00%
120.00%
Perc
en
tag
eTypes of toilets used by business (n = 333)
90.30%
9.70%
Do you have a conservation policy?(n=330)
No
Yes

Page 146 of 203
6.7.11 Annual water audit Business respondents were asked if they partake in an annual water audit. Results are summarised in figure 139. Figure 139: Annual water audit
A vast majority of respondents (91.44%) indicated that they did not undertake an annual water audit.
6.8 Knowledge on sanitation environmental impact
Analysis was done to measure respondents’ awareness of the impact of sanitation on the environment.
6.8.1 Awareness of impact of blocked sewers on environment
Respondents were asked if they were aware of the impact that blocked sewers have on the environment. The findings are shown in figure 140 below.
91.44%
8.56%
Do you have an annual water audit? (n=327)
No
Yes
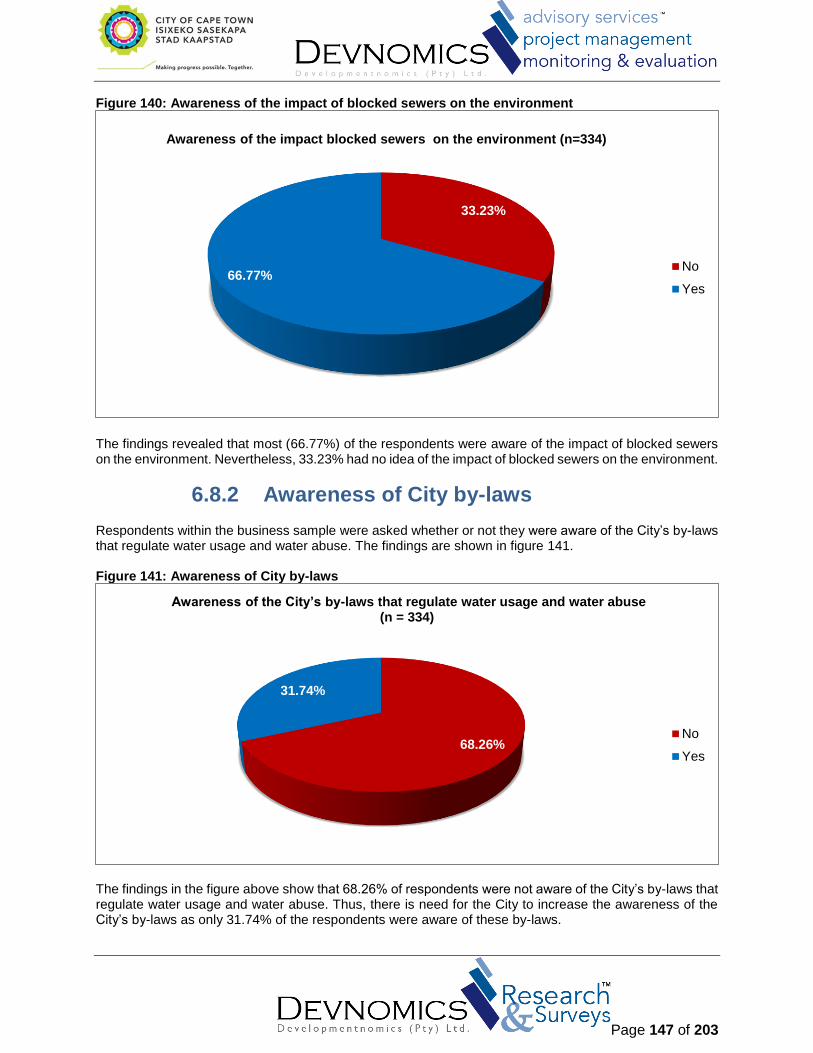
Page 147 of 203
Figure 140: Awareness of the impact of blocked sewers on the environment
The findings revealed that most (66.77%) of the respondents were aware of the impact of blocked sewers on the environment. Nevertheless, 33.23% had no idea of the impact of blocked sewers on the environment.
6.8.2 Awareness of City by-laws Respondents within the business sample were asked whether or not they were aware of the City’s by-laws that regulate water usage and water abuse. The findings are shown in figure 141. Figure 141: Awareness of City by-laws
The findings in the figure above show that 68.26% of respondents were not aware of the City’s by-laws that regulate water usage and water abuse. Thus, there is need for the City to increase the awareness of the City’s by-laws as only 31.74% of the respondents were aware of these by-laws.
33.23%
66.77%
Awareness of the impact blocked sewers on the environment (n=334)
No
Yes
68.26%
31.74%
Awareness of the City’s by-laws that regulate water usage and water abuse (n = 334)
No
Yes

Page 148 of 203
6.8.3 Awareness of types of City by-laws Respondents from the business sample were further asked to indicate which by-laws they were aware of. The findings are shown in figure 142. Figure 142: Awareness of forms of by-laws
63.56% are aware of water by-law 2010, followed by industrial effluent and waste by-law (32.20%) and treated effluent by-law at 2.54%
6.8.4 Awareness of illegal discharges The respondents within the business sample were asked to indicate whether or not they were aware of what ‘illegal discharges’ into a sewer is. The findings are shown in figure 153 below. Figure 143: Awareness of illegal discharges
Water by-law2010
Industrialeffluent and
waste by-law,2006
Treatedeffluent by-law, 2009
Other None
Percentage 63.56% 32.20% 2.54% 0.00% 1.69%
0.00%
10.00%
20.00%
30.00%
40.00%
50.00%
60.00%
70.00%
Perc
en
tag
es
Awareness of by-laws (n = 106)
75.68%
24.32%
Awareness of illegal discharges (n=334)
No
Yes

Page 149 of 203
75.68% of the respondents had no idea of what illegal discharges are. 24.32% do said they are aware of what it meant.
6.8.5 Awareness of penalty charges Respondents were asked if they were aware of water and sanitation offenses resulting in penalty. The responses are illustrated in figure 144. Figure 144: Awareness of penalty charges
The findings revealed that most (86.83%) of the respondents were not aware of the water and sanitation penalty charges. Communication specifically targeted at businesses could be used to improve these awareness levels.
6.8.6 Interest in presentations In conclusion, respondents from the business sample were asked if they would like the City of Cape Town’s Water and Sanitation Department to do a presentation in your community regarding water conservation, water pollution and sewer blockages. The findings are shown in figure 145 below. Figure 145: Interest in water and sanitation presentations
86.83%
13.17%
Awareness of water and sanitation offences resulting in penalties (n=334)
No
Yes
45.96%54.04%
Would you like the City of Cape Town’s Water and Sanitation Department to do a presentation at your business regarding water conversation, water pollution and sewer blockages? (n=322)
No
Yes

Page 150 of 203
Slightly over half of the respondents (54.04%) were interested in having a presentation at their businesses regarding water conservation, water pollution and sewerage blockages. The City should take the initiative and educate businesses as they have expressed their willingness to get better acquainted with water, sanitation, pollution and sewerage blockages. This could motivate other businesses to follow suit.

Page 151 of 203
7. DISTRICT ANALYSIS – FORMAL
7. Introduction A total of 1058 respondents were surveyed from households in formal residential areas. The analysis below pertains to the findings obtained from the following eight districts within the City of Cape Town:
Central Cape Town; Heidelberg/ Kuilsriver; Khayelitsha; Klipfontein. Kraaifontein; Mitchells Plain; South Peninsula; Tygerberg/ Bellville;
7.1 Water consumption
7.1.1 Monthly average water use Respondents from formal residential areas were asked to estimate their monthly water use (i.e. tap water). The findings are shown in table 30. Table 30: Average monthly usage of water
District
How much water from the city of Cape Town do you think your household uses on average each month?
Don’t know (%)
Less than
500 (%)
500-1000 (%)
1000- 5000 (%)
5000- 10000
(%)
10000- 15000
(%)
More than
15000 (%)
TOTAL (%)
Central Cape Town Area (n=151)
45.70 29.80 14.57 6.62 0.66 0.66 1.99 100.00
Helderberg/ Kuilsriver (n=141)
50.35 24.82 8.51 5.67 3.55 4.26 2.84 100.00
Khayelitsha (n=129)
41.09 27.91 18.60 8.53 1.55 0.78 1.55 100.00
Klipfontein (n=123)
23.58 39.21 17.89 16.26 2.44 0.81 0.81 100.00
Kraaifontein/ Blouberg (n=128)
38.28 19.53 21.88 13.28 5.47 0.78 0.78 100.00
Mitchells Plain (n=129)
43.41 20.93 17.05 10.28 3.10 2.33 2.33 100.00
South Peninsula (n=124)
45.97 23.39 16.94 12.10 1.61 0.00 0.00 100.00
Tygerberg/ Bellville (n=126)
29.92 29.92 21.26 14.96 1.57 1.57 0.79 100.00
According to the results, water use across all districts should be low, with the largest proportion of formal household respondents reporting that that they use less than 500 litres per month. However, Kraaifontein/ Blouberg is the only district which locates its largest proportion of formal residential respondents’ water use between 500 and 1000 litres. Of particular concern is the fact that residential participants do not know their

Page 152 of 203
average water use per month. The majority of respondents within the Helderberg/ Kuilsriver reported that they have no idea with regards to their average monthly water use, followed by the largest to the smallest proportions of respondent, namely: Southern Peninsula, Central Cape Town area, Mitchells Plain, Khayelitsha, Kraaifontein/ Blouberg, Tygerberg/ Bellville, and Klipfontein. Specially designed strategies are required with the aim of raising awareness, particularly in areas where knowledge of water use is low. Strategies such as these are necessary to promote water conservation, as well as empower individuals to track their water consumption using simple, effective and concise tools.
7.1.2 Current water consumption compared to previous year Respondents from formal residential areas were asked to report whether they used less, more, or the same amount of water compared to the previous year. Results are summarised in table 31 below. Table 31: Current water usage compared to the previous year
District Don’t
know (%) Less (%) More (%)
Same (%)
Total (%)
Central (Cape Town Area)(n=151) 38.41 13.25 11.26 37.09 100.00
Helderberg/ Kuilsriver (n=141) 21.28 17.02 19.15 42.55 100.00
Khayelitsha (n=129) 17.05 20.16 15.50 47.29 100.00
Klipfontein (n=123) 19.51 25.20 17.07 38.21 100.00
Kraaifontein/ Blouberg (n=128) 31.25 13.28 10.16 45.31 100.00
Mitchells Plain (n=129) 6.20 9.30 21.71 62.79 100.00
South Peninsula (n=125) 33.60 14.40 8.80 43.20 100.00
Tygerberg/ Bellville (n=130) 19.23 10.77 10.77 59.23 100.00
By comparing current water consumption with that of last year, results revealed that the majority of formal residential respondents were using the same amount of water. Of particular interest is the Mitchells Plain district, with 62.79% using the same amount of water as the previous year and 6.20% of respondents claiming that they are unaware of their water usage. Similarly to the estimated average water use per month, a high number of respondents from the formal residential areas have reported that they are not aware of increases or decreases in their water consumption during the previous year, especially those residing in the Central Cape Town area, South Peninsula and Kraaifontein/ Blouberg districts.
7.2 Billing processes
7.2.1 Water tariffs impact on water consumption Respondents from formal residential areas were asked to report on whether the introduction of tariff increases, based on the amount of water used, resulted in households decreasing its water consumption. Results are summarised in table 32.

Page 153 of 203
Table 32: Impact of tariff increases on water consumption
District Don’t know
(%) Less (%) More (%) Total(%)
Central (Cape Town Area)(n=151) 57.34 5.59 37.06 100.00
Helderberg/ Kuilsriver (n=141) 45.71 16.43 37.86 100.00
Khayelitsha (n=129) 35.94 23.44 40.63 100.00
Klipfontein (n=123) 44.26 18.08 37.70 100.00
Kraaifontein/ Blouberg (n=128) 36.00 25.60 38.40 100.00
Mitchells Plain (n=129) 35.94 30.47 33.59 100.00
South Peninsula (n=125) 39.34 21.31 39.34 100.00
Tygerberg/ Bellville (n=130) 31.50 25.20 43.31 100.00
The largest proportion of respondents reported that they were unaware of the tariff increases in relation to water consumption. The majority of respondents located in the Central Cape Town district did not know if their household water consumption increased or decreased. In addition, the largest proportion of respondents who did not know about their water consumption was located in the Helderberg/ Kuilsriver district, followed by Klipfontein and Mitchells Plain. Tygerberg/ Bellville, Khayelitsha, South Peninsula and Kraaifontein/ Blouberg district found that its largest proportion of formal residential respondents had indicated that their water consumption increased as a result of water tariff increases. The Central Cape Town area district has the lowest response rate in terms of decreased water consumption, due to tariff increases, followed by Helderberg/ Kuilsriver and Klipfontein.
7.3 Information materials
7.3.1 Awareness of advertising material Respondents from formal residential areas were asked to report on whether they have seen or heard any advertisements or pamphlets from the City of Cape Town, promoting water conservation. Results are summarised in table 33. Table 33: Awareness on advertising materials
District No (%) Yes (%) Total (%)
Central (Cape Town Area) (n=153) 42.11 57.89 100.00
Helderberg/ Kuilsriver (n=141) 44.68 55.32 100.00
Khayelitsha (n=129) 37.21 62.79 100.00
Klipfontein (n=123) 47.97 52.03 100.00
Kraaifontein/ Blouberg (n=128) 31.03 67.97 100.00
Mitchells Plain (n=129) 56.59 43.41 100.00
South Peninsula (n=125) 24.00 76.00 100.00
Tygerberg/ Bellville (n=129) 28.68 71.32 100.00
The majority of respondents claimed to have seen or heard advertisements or pamphlets from the City of Cape Town that promotes water conservation, with the exception of Mitchells Plain. More than 56.59% of respondents in the Mitchells Plain district reported that they had not come into contact with material sponsored by the City of Cape Town which promotes water conservation.

Page 154 of 203
Initially, awareness efforts should be directed at districts such as Mitchells Plain, Klipfontein, Helderberg/ Kuilsriver and Central Cape Town area. These districts pertain to the highest percentage of respondents who said that they have not seen advertisement from the City of Cape Town, on water conservation.
7.3.2 Behaviour change to conserve water Respondents from formal residential areas were asked to report on whether their household has changed behaviour with the aim of conserving water, during the past year. Results are summarised in table 34 below. Table 34: Behaviour change to conserve water
District No (%) Yes (%) Total (%)
Central (Cape Town Area) (n=152) 61.84 38.16 100.00
Helderberg/ Kuilsriver (n=141) 56.74 43.26 100.00
Khayelitsha (n=129) 48.84 51.16 100.00
Klipfontein (n=122) 57.38 42.62 100.00
Kraaifontein/ Blouberg (n=128) 50.00 50.00 100.00
Mitchells Plain (n=129) 61.24 38.76 100.00
South Peninsula (n=125) 48.00 52.00 100.00
Tygerberg/ Bellville (n=129) 58.91 41.09 100.00
Five out of the eight districts within the City of Cape Town indicated that they have not changed their household behaviour during the last year, with the aim of conserving water. The majority of respondents who claimed to observe no behavioural changes are located within the Central Cape Town area, Mitchells Plain, Tygerberg/ Bellville, Klipfontein and Helderberg/ Kuilsriver districts. However, the majority of respondents who have changed their behaviour in order to conserve water are located within South Peninsula and Khayelitsha. The Kraaifontein/ Blouberg district was the only area to report that 50.00% of their respondents changed their household behaviour, with the remaining 50% claiming that they have not observed any behavioural change in order to conserve water.
7.4 Water services
7.4.1 Satisfaction with provision of tapped water Respondents from formal residential areas were asked to rate their overall satisfaction with the tap water provided by the City of Cape Town. Results are summarised in table 35. Table 35: Satisfaction with provision of tapped water
District Dissatisfied
(%)
Neither satisfied nor dissatisfied (%)
Satisfied (%) Total (%)
Central (Cape Town Area) (n=152) 8.55 8.55 82.89 100.00
Helderberg / Kuilsriver (n=141) 3.55 6.38 90.07 100.00
Khayelitsha (n=129) 3.10 8.53 88.37 100.00
Klipfontein (n=123) 0.81 17.89 81.30 100.00
Kraaifontein / Blouberg (n=128) 6.25 12.50 81.25 100.00
Mitchells Plain (n=128) 13.28 10.16 76.56 100.00

Page 155 of 203
District Dissatisfied
(%)
Neither satisfied nor dissatisfied (%)
Satisfied (%) Total (%)
South Peninsula (n=124) 3.23 3.23 93.55 100.00
Tygerberg / Bellville (n=130) 3.08 4.62 92.31 100.00
Overall, a vast majority of respondents across all districts reported that they were satisfied with the provision of tap water by the City of Cape Town. Respondents in Mitchells Plain district are regarded as the most dissatisfied (13.28% dissatisfied responses). Furthermore, Klipfontein district recorded the highest number of people who are neither satisfied nor dissatisfied (17.89%), as well as the lowest number of dissatisfied water consumers (0.81%), compared to the other seven districts.
7.4.2 Experience with water-related problems Respondents from the formal residential areas were asked to report whether or not they have experienced water-related problems during the past year. Results are summarised in table 36. Table 36: Water-related problems experienced
District No (%) Yes (%) Total (%)
Central (Cape Town Area) (n=152) 94.74 5.26 100.00
Helderberg / Kuilsriver (n=141) 85.11 14.89 100.00
Khayelitsha (n=129) 58.91 41.09 100.00
Klipfontein (n=123) 80.49 19.51 100.00
Kraaifontein / Blouberg (n=127) 89.7 10.24 100.00
Mitchells Plain (n=129) 83.72 16.28 100.00
South Peninsula (n=125) 95.20 4.80 100.00
Tygerberg / Bellville (n=130) 93.08 6.92 100.00
Although the number of respondents who have claimed that they have not experienced any water-related problem is high, respondents across all districts reported that they have experienced water related problems. However, with regard to the latter, the Khayelitsha district reports the highest number of respondents (41.09%) who indicated that they have experienced water related problems, during the past year. Nonetheless, South Peninsula district has the highest number of respondents (95.20%) indicating that they have not had water-related problems, shortly followed by Central Cape Town area district with 94.74% and Tygerberg/ Bellville district with 93.08%.
7.5 Sanitation services
7.5.1 Satisfaction with sanitation or sewerage services Respondents from formal residential areas were asked to rate their overall satisfaction with the City of Cape Town in providing you with sanitation or sewerage services. Results are summarised in table 37..

Page 156 of 203
Table 37: Satisfaction with sanitation and sewerage services
District Dissatisfied
(%) Neither satisfied nor dissatisfied (%)
Satisfied (%) Total (%)
Central (Cape Town Area(n=152) 0.00 12.50 87.50 100.00
Helderberg / Kuilsriver (n=141) 5.67 7.09 87.23 100.00
Khayelitsha (n=126) 2.38 13.49 84.13 100.00
Klipfontein(n=122) 3.28 14.75 81.97 100.00
Kraaifontein / Blouberg (n=127) 3.94 11.02 85.04 100.00
Mitchells Plain (n=126) 8.73 19.05 72.22 100.00
South Peninsula (n=124) 1.61 3.23 95.16 100.00
Tygerberg / Bellville (n=130) 2.31 7.69 90.00 100.00
Across all districts, respondents indicated that they are satisfied with the City’s provision of sanitation and sewerage services. South Peninsula, Tygerberg/ Bellville and Central Cape Town area reported the highest number of respondents who indicated that they were satisfied with the City’s sanitation and sewerage services. However, Mitchells Plain had the largest proportion of dissatisfied respondents, compared to the other districts.
7.5.2 Exposure to sewerage or sanitation related problems
Respondents from formal residential areas were asked whether or not they have experienced sewerage blockage or sanitation related problems, during the past year. Results are summarised in table 38. Table 38: Experience of sewerage or sanitation related problems
District No (%) Yes (%) Total (%)
Central (Cape Town Area) (n=152) 95.39 4.61 100.00
Helderberg / Kuilsriver (n=141) 81.56 18.44 100.00
Khayelitsha (n=126) 71.32 28.68 100.00
Klipfontein (n=122) 84.55 15.45% 100.00
Kraaifontein / Blouberg (n=127) 92.19 7.81% 100.00
Mitchells Plain (n=126) 86.82 13.18% 100.00
South Peninsula (n=124) 93.60 6.40% 100.00
Tygerberg/ Bellville (n=130) 96.12 3.88% 100.00
The vast majority of respondents, across all districts, claimed that they have not experienced sanitation or sewerage related problems, during the past year. A large proportion of respondents (28.68%) within the Khayelitsha district, however, reported that they have experienced problems relating to sewerage blockage or sanitation-related problems.
7.6 Awareness of customer service contact details Respondents from formal residential areas were asked if they knew how to contact the City of Cape Town’s Water and Sanitation Department, if they encountered a problem with water and sanitation services. Results are summarised in table 39 below.

Page 157 of 203
Table 39: Awareness of customer service contact details
District No (%) Yes (%) Total (%)
Central (Cape Town Area) (n=151) 48.34 51.66 100.00
Helderberg / Kuilsriver (n=140) 42.14 57.86 100.00
Khayelitsha (n=128) 54.69 45.31 100.00
Klipfontein (n=123) 43.90 56.10 100.00
Kraaifontein / Blouberg (n=127) 31.50 68.50 100.00
Mitchells Plain (n=130) 44.62 55.38 100.00
South Peninsula (n=125) 31.20 68.80 100.00
Tygerberg / Bellville (n=130) 38.46 61.54 100.00
Although the number of respondents who have claimed that they do not know how to contact the water and sanitation department was high, the majority of respondents across all districts reported that they are aware of the appropriate contact information. However, the Khayelitsha district is an exception to the latter, which is the only district which has reported a majority of respondents that are unaware of contact details for the City of Cape Town’s Water and Sanitation Department. Central Cape Town area district follows Khayelitsha as the second highest number of respondents (48.34%) and Mitchells Plain (44.62%) who indicated that they did not know how to contact the department.
7.7 Water billing
7.7.1 Average water use per month
Central Cape Town district has the highest number of respondents, 34.24% who indicated that they are not aware of the water billing followed by South Peninsula with 22.58%.

Page 158 of 203
Table 40: Distribution of water billing by district
District Don’t know (%)
Nothing (%)
R1 - R250 (%)
R1001 - R1500 (%)
R1501 - R2000 (%)
R2001 - R2500 (%)
R2500+ (%)
R251 - R500 (%)
R501 - R750 (%)
R751 - R1000 (%)
Total (%)
Central (Cape Town Area) (n=152)
32.24 4.61 10.53 7.89 1.32 0.66 1.32 11.84 14.47 15.13 100.00
Helderberg / Kuilsriver (n=141) 15.60 18.44 28.37 0.71 0.00 1.42 0.00 24.11 9.22 2.13 100.00
Khayelitsha (n=129) 13.95 22.48 39.53 0.00 0.78 0.00 0.00 17.83 3.10 2.33 100.00
Klipfontein (n=123) 13.01 2.44 33.33 3.25 0.00 0.00 0.81 38.21 5.69 3.25 100.00
Kraaifontein / Blouberg(n=127) 16.54 6.30 16.54 6.30 5.51 0.79 2.36 16.54 13.39 15.75 100.00
Mitchells Plain (n=129) 11.63 5.43 41.86 0.00 0.00 0.00 0.00 29.46 6.20 5.43 100.00
South Peninsula (n=124) 22.58 1.61 18.55 3.23 0.00 0.00 0.81 18.55 22.58 12.10 100.00
Tygerberg / Bellville (n=130) 18.46 0.00% 33.85 3.08 0.77 0.00 0.77 29.23 9.23 4.62 100.00

Page 159 of 203
7.7.2 Satisfaction with the billing process Respondents from the formal residential area were asked to indicate whether they were satisfied, neither satisfied nor dissatisfied, or dissatisfied with regard to the Water and Sanitation Departments’ service level and billing process. Findings are summarised in table 41. Table 41: Distribution of water billing by district
District Dissatisfied
(%) Neither satisfied
nor dissatisfied (%) Satisfied
(%) Total (%)
Central (Cape Town Area) (n=152) 13.25 21.19 65.56 100.00
Helderberg / Kuilsriver (n=141) 9.22 21.28 69.50 100.00
Khayelitsha (n=126) 17.19 16.41 66.41 100.00
Klipfontein (n=122) 12.30 19.67 68.03 100.00
Kraaifontein / Blouberg (n=127) 7.81 17.19 75.00 100.00
Mitchells Plain (n=126) 27.56 19.69 52.76 100.00
South Peninsula (n=124) 6.40 16.00 77.60 100.00
Tygerberg / Bellville (n=130) 7.09 10.24 82.68 100.00
Majority of respondents indicated that they were satisfied with the billing process, across all districts. Mitchells Plain district has the highest percentage of respondents (27.56%) who indicated that they were dissatisfied with the billing process.
7.8 Water management device ownership A water management device is an electronic device designed to manage the use of water in the household. Respondents from formal residential areas were asked if they made use of water management devices in their households. Results are summarised in table 42. Table 42: Ownership of water management device
District No(%) Yes (%) Total (%)
Central (Cape Town Area) (n=151) 97.35 2.65 100.00
Helderberg / Kuilsriver (n=140) 87.86 12.14 100.00
Khayelitsha (n=129) 87.60 12.40 100.00
Klipfontein (n=122) 92.62 7.38 100.00
Kraaifontein / Blouberg (n=126) 97.62 2.38 100.00
Mitchells Plain (n=129) 93.80 6.20 100.00
South Peninsula (n=124) 93.55 6.45 100.00
Tygerberg / Bellville (n=130) 96.15 3.85 100.00
The use of a water management device is not primarily common in across districts, however Khayelitsha (12.49%) and Helderberg/ Kuilsriver (12.14%) reported the highest number of respondents who have indicated that they made use of water management devices. Central Cape Town district reports the highest non-use of water management devices (97.35%).

Page 160 of 203
8. DISTRICT ANALYSIS – INFORMAL A total of 657 respondents were surveyed from households in informal residential areas. The analysis below pertains to the findings obtained from the following eight districts within the City of Cape Town:
Central Cape Town; Heidelberg/ Kuilsriver; Khayelitsha; Klipfontein; Kraaifontein; Mitchells Plain; South Peninsula; Tygerberg/ Bellville.
8.1 Average use of water by district Respondents from informal residential areas were asked to estimate their monthly water use (i.e. tap water). The findings are shown in table 25. With regard to four out of the eight districts, the largest proportion of respondents from informal residential areas reported that they use less than 25 buckets of water per month. These districts, in order of highest number of respondents to lowest are Mitchells Plain, Khayelitsha, Klipfontein and Helderberg/ Kuilsriver. South Peninsula and the Mitchells Plain districts both use between twenty-five and fifty buckets of water per month. The largest proportion of respondents from Helderberg/ Kuilsriver and Tygerberg/ Bellville reported that they were unaware of their monthly water use.

Page 161 of 203
Table 43: Average use of water by district
8.2 Knowledge of water conservation promotions The findings regarding knowledge of water conservation promotions are given in table 44 below. Table 44: Knowledge on water conservation promotions
District No (%) Yes (%) Total
Central (Cape Town Area) (n=74) 51.35 48.65 100.00
Helderberg / Kuilsriver (n=82) 60.98 39.02 100.00
Khayelitsha (n=78) 58.97 41.03 100.00
Klipfontein (n=87) 60.92 39.08 100.00
Kraaifontein / Blouberg (n=99) 52.53 47.47 100.00
Mitchells Plain (n=80) 42.50 57.50 100.00
South Peninsula (n=76) 43.42 56.58 100.00
District
Less than 25 buckets (%)
25-50 buckets (%)
50-250 buckets (%)
250-500 buckets (%)
500-750 buckets (%)
More than 750 buckets (%)
No idea (%)
Total (%)
Central (Cape Town Area) (n=74)
25.68 22.97 14.86 4.05 12.16 0.00 20.27 100.00
Helderberg/ Kuilsriver (n=82)
23.17% 12.20 6.10 20.73 4.88 1.22 31.71 100.00
Khayelitsha (n=80)
38.75 15.00 11.25 8.75 6.25 3.75 16.25 100.00
Klipfontein (n=84)
29.76 21.43 9.52 11.90 4.76 0.00 22.62 100.00
Kraaifontein/ Blouberg (n=99)
24.24 30.30 15.15 3.03 0.00 1.01 26.26 100.00
Mitchells Plain (n=80)
41.25 18.75 5.00 2.50 0.00 1.25 31.25 100.00
South Peninsula (n=76)
7.89 32.89 22.37 18.42 2.63 1.32 14.47 100.00
Tygerberg/ Bellville (n=76)
14.47 21.05 25.00 2.63 6.58 3.95 26.32 100.00

Page 162 of 203
Tygerberg / Bellville (n=78) 64.10 35.90 100.00
The majority of respondents from Tygerberg/ Bellville, Helderberg/ Kuilsriver, Klipfontein, Khayelitsha, Kraaifontein/ Blouberg and Central Cape Town claimed to not have seen or heard any water conservation advertisements from the City of Cape Town. Districts such as Mitchells Plain and South Peninsula consisted of the highest amount of respondents who reported contact with promotional material by the City of Cape Town.
8.2.1 Change in behaviour Respondents from informal residential areas were asked to report on whether their household has changed behaviour with the aim of conserving water, during the past year. Results are summarised in table 45. Table 45: Behaviour change to conserve water
District No (%) Yes (%) Total (%)
Central (Cape Town Area) (n=70) 44.29 55.71 100.00
Helderberg/ Kuilsriver (n=82) 58.54 41.46 100.00
Khayelitsha (n=81) 55.56 44.44 100.00
Klipfontein (n=85) 64.71 35.29 100.00
Kraaifontein/ Blouberg (n=99) 57.58 42.42 100.00
Mitchells Plain (n=80) 52.50 47.50 100.00
South Peninsula (n=76) 44.74 55.26 100.00
Tygerberg/ Bellville (n=78) 43.59 56.41 100.00
Tygerberg/ Bellville recorded the highest proportion of respondents who claim that they have changed their household behaviour in order to conserve water. In addition, the majority of respondents from Central Cape Town area and South Peninsula conserved water during the past year, due to household behavioural changes. Five of the districts, however reports a majority of respondents who claim that they have not changed their household behaviour with the aim of conserving water, during the past year. The districts are the following: Klipfontein, Helderberg/ Kuilsriver, Kraaifontein/ Blouberg, Khayelitsha and Mitchells Plain.
8.2.2 Awareness of water conservation officers Respondents from informal residential areas were asked if they were aware of any Water Conservation Officers, from the City of Cape Town, doing presentations on sewer blockage awareness in their communities. Results are summarised in table 46. Table 46: Awareness of Water Conservation Officers
District No (%) Yes (%) Total (%)
Central (Cape Town Area) (n=73) 76.71% 23.29% 100.00%
Helderberg / Kuilsriver (n=82) 92.68% 7.32% 100.00%
Khayelitsha (n=81) 69.14% 30.86% 100.00%
Klipfontein(n=85) 89.41% 10.59% 100.00%
Kraaifontein / Blouberg (n=99) 62.63% 37.37% 100.00%
Mitchells Plain (n=80) 57.50% 42.50% 100.00%
South Peninsula (n=75) 74.67% 25.33% 100.00%

Page 163 of 203
Tygerberg / Bellville (n=78) 78.21% 21.79% 100.00%
Large proportions of respondents from each district have reported awareness of Water Conservation Officers from the City of Cape Town. On the other hand, the majority of respondents across all districts recorded a lack of awareness in terms of presentations done by Water Conservation Officers. Helderberg/ Kuilsriver district records the highest amount of respondents who are unaware of these promotional efforts, while Mitchells Plain district has the largest proportion of respondents who claim to be aware of Water Conservation Officers and their promotional efforts in communities.
8.3 Water-related problems experienced Respondents from informal residential areas were asked to report whether or not they have experienced water-related problems during the past year. Results are summarised in table 47. Table 47: Water-related problems experienced
District No (%) Yes (%) Total (%)
Central (Cape Town Area) (n=72) 52.78 47.22 100.00
Helderberg / Kuilsriver (n=82) 76.83 23.17 100.00
Khayelitsha (n=81) 60.49 39.51 100.00
Klipfontein (n=87) 83.91 16.09 100.00
Kraaifontein / Blouberg (n=99) 62.63 37.37 100.00
Mitchells Plain (n=80) 56.25 43.75 100.00
South Peninsula (n=76) 50.00 50.00 100.00
Tygerberg / Bellville (n=78) 55.13 44.87 100.00
Water related problems were mainly being experienced in the South Peninsula district (50.00%), followed by Central Cape Town area (47.22%), while Klipfontein district has the least water related problems (83.91% of these respondents have not experienced water related problems) during the past year.
8.3.1 Overall satisfaction with water services Respondents from informal residential areas were asked to rate their satisfaction with the tap water provided by the City of Cape Town. Results are summarised in table 48. Table 48: Overall satisfaction with water
District Dissatisfied
(%)
Neither satisfied nor dissatisfied
(%)
Satisfied (%) Total (%)
Central (Cape Town Area) (n=73) 12.53% 23.29% 64.38% 100.00%
Helderberg / Kuilsriver (n=82) 6.10% 10.98% 82.93% 100.00%
Khayelitsha (n=80) 12.50% 13.75% 73.75% 100.00%
Klipfontein (n=86) 4.65% 2.33% 93.02% 100.00%
Kraaifontein / Blouberg (n=98) 16.33% 10.20% 73.47% 100.00%
Mitchells Plain (n=80) 16.25% 16.25% 68.50% 100.00%
South Peninsula (n=75) 17.33% 2.67% 80.00% 100.00%

Page 164 of 203
District Dissatisfied
(%)
Neither satisfied nor dissatisfied
(%)
Satisfied (%) Total (%)
Tygerberg / Bellville (n=77) 24.68% 14.29% 61.04% 100.00%
There is general satisfaction with water services across all districts (61.00% - 93.02%). Tygerberg/ Bellville district records the highest proportion of respondents (24.68%) who are dissatisfied with the water and sanitation services offered by the City of Cape Town.
8.3.2 Sanitation problems experienced Respondents from informal residential areas were asked whether or not they have experienced sewerage blockage or sanitation related problem within the last year. Results are summarised in table 49. Table 49: Distribution of reported water and sanitation problems
District No (%) Yes (%) Total (%)
Central (Cape Town Area) (n=74) 39.19 60.81 100.00
Helderberg / Kuilsriver (n=82) 57.32 42.68 100.00
Khayelitsha (n=78) 46.15 53.85 100.00
Klipfontein (n=87) 72.41 27.59 100.00
Kraaifontein / Blouberg (n=99) 67.68 32.32 100.00
Mitchells Plain (n=80) 35.00 65.00 100.00
South Peninsula (n=76) 46.05 54.95 100.00
Tygerberg / Bellville (n=76) 59.21 40.79 100.00
The majority of respondents from Mitchells Plain, Central Cape Town Area, South Peninsula and Khayelitsha reported to have experienced water and sanitation problems during the past year. Mitchells Plain district has the highest number of responds to experience these problems. The Kraaifontein/ Blouberg district has the lowest number of respondents who reports to not have experienced any water and sanitation problems, during the past year.
8.3.3 Overall satisfaction with sanitation services Respondents from informal residential areas were asked whether they are satisfied, neither satisfied nor dissatisfied, or dissatisfied with the City of Cape Town providing sanitation or sewerage services. Findings are summarised in table 50. Table 50: Distribution of reported water and sanitation problems
District Dissatisfied
(%)
Neither satisfied nor dissatisfied (%)
Satisfied (%) Total (%)
Central (Cape Town Area) (n=74) 52.70 14.86 32.43 100.00
Helderberg / Kuilsriver (n=82) 21.95 9.76 68.29 100.00
Khayelitsha (n=79) 45.57 16.46 37.97 100.00
Klipfontein (n=86) 53.49 3.49 43.02 100.00
Kraaifontein / Blouberg (n=99) 46.46 12.12 41.41 100.00

Page 165 of 203
Mitchells Plain (n=80) 43.75 23.75 32.50 100.00
South Peninsula (n=76) 42.11 9.21 48.68 100.00
Tygerberg / Bellville (n=77) 36.36 19.48 44.16 100.00
Results indicate that Helderberg/ Kuilsriver district reported a majority of respondents who were satisfied with the services provided by the City of Cape Town. The majority of respondents who were dissatisfied resided within the Central Cape Town area and Klipfontein districts.
8.4 Information materials receipt Respondents from informal residential areas were whether or not they would like to receive information on the City of Cape Town’s water and sanitation initiatives. Results are summarised in table 51. Table 51: Willingness to receive information about water and sanitation initiatives
District No (%) Yes (%) Total (%)
Central (Cape Town Area) (n=74) 6.76 93.24 100.00
Helderberg / Kuilsriver (n=82) 7.41 92.59 100.00
Khayelitsha (n=81) 10.34 89.66 100.00
Klipfontein (n=87) 7.41 92.59 100.00
Kraaifontein / Blouberg (n=99) 11.11 88.89 100.00
Mitchells Plain (n=80) 8.75 91.25 100.00
South Peninsula (n=76) 0.00 100.00 100.00
Tygerberg / Bellville (n=78) 16.67 83.33 100.00
The survey revealed that, generally, residents of the City of Cape Town are willing to receive information about water and sanitation .The highest numbers of people who are ready to receive such information reside in the South Peninsula district (100.00%). However, 16.67% of respondents in Tygerberg/ Bellville district expressed an aversion in terms of being willingness to receive water and sanitation information.
8.5 Effects of blocked sewer on the environment
Respondents from informal residential areas were whether or not they would like to receive information on the City of Cape Town’s water and sanitation initiatives. Results are summarised in table 52. Table 52: Effects of blocked sewer on the environment by district
District No (%) Yes (%) Total (%)
Central (Cape Town Area) (n=71) 36.62% 63.38% 100.00%
Helderberg/ Kuilsriver (n=79) 59.49% 40.51% 100.00%
Khayelitsha (n=77) 50.65% 49.35% 100.00%
Klipfontein (n=85) 72.94% 27.06% 100.00%
Kraaifontein/ Blouberg (n=99) 59.60% 40.40% 100.00%
Mitchells Plain (n=80) 52.50% 47.50% 100.00%
South Peninsula (n=76) 43.42% 56.58% 100.00%
Page 166 of 203
Tygerberg/ Bellville (n=78) 47.44% 52.56% 100.00%
Central Cape Town area and South Peninsula districts recorded the highest numbers when it came to knowledge on the impact that sewerage blockages have on the environment, with 63.38% and 56.58% respectively. The majority of respondents form Kraaifontein/ Blouberg, Helderberg/ Kuilsriver, Mitchells Plain and Khayelitsha districts report insufficient knowledge with regard to the effects of sewerage blockages have on the environment.

Page 167 of 203
9. Comparison of findings
9.1 Formal Findings Table 53: Comparison of findings - Formal
ID 2012/2013 survey 2013/2014 survey 2014/2015 survey Remarks
1
Demographics and socio-economic indicators
Age 36.7% of the respondents
were aged between 35-49 years
32.13% was aged between 35-49 years old
31.79% was aged between 35-49 years old
This age group appeared to be dominating in both surveys though slightly lower as compared to the 2012/2013 and 2013/2014 survey.
Gender 60.14% of the
respondents were female 56.32% was
female 52.60% was female
Women are still leading in the surveys. The social position of women in the households put them in a good stead to be well acquainted with water and sanitation issues, as compared to men.
Race 38% of the respondents
were from the Black racial group
46.75% of the total population was from the Coloured racial group
35.76% of the total sample was from the coloured group
2013/2014 findings have presented a true reflection that the majority of Cape Town occupants are Coloureds, unlike the 2012/2013 survey where more Blacks were dominating. This has shown a remarkable improvement in ensuring that there is a better and realistic racial group representation. The trend as continued in the latest survey, with

Page 168 of 203
ID 2012/2013 survey 2013/2014 survey 2014/2015 survey Remarks
the largest demographic group belonging to the coloured race.
Language 38% were isiXhosa
speaking
The majority 47.81% of the respondents speak Afrikaans
The majority 42.82% of the respondents speak English
Afrikaans was the main language used for communication in the City of Cape Town in the 2013/2014 survey. There has been a shift as 47.70% now use English as the main language of communication.
Household income
17.93% were not willing to disclose their household income
11.19% did not disclose household income
45.13% did not disclose household income
Undisclosed household income has been noted to be a trend under this target group. The number decreased from the previous survey (2012/2013) by 6.74%. However in the 2014/2015 survey, the figure has risen to 45.13%
Educational level
50.10% completed secondary school
44.54% completed secondary school
34.83% completed secondary school
In all surveys, most of the respondents have completed secondary school, though the number has decreased in the 2013/2014 survey. There has been an even further drop to 34.83% in the 2014/2015 survey.
Employment status
48.15% was employed
46.79% indicated that they are employed
42.42% indicated that they are employed
There is a noticeable drop in the number of people who are in employed in the 2013/2014 survey.

Page 169 of 203
ID 2012/2013 survey 2013/2014 survey 2014/2015 survey Remarks
An even further drop has been noted in the 2014/2015 survey to 42.42%
2 Access to water and sanitation services Access to water
and sanitation services
Amount of water used monthly
63.5% of respondents
said they did not know the household monthly usage
34.51% had no
idea how much water is consumed in the household monthly
40.11% had no idea how
much water is consumed in the household monthly
Awareness levels on household monthly water usage are still very low. Though the percentage has decreased from the previous year. This shows that the department has gone a step further in promoting awareness of water and sanitation issues.
Amount of water used compared to last year
44% of respondents assumed that they are using the same amount of water as the previous year.
52.96%
indicated they are using the same amount of water as the previous year. The number has slightly gone up to 8.59%, as compared to the 2012/2013 survey
46.78% indicated that they
are using the same amount of water as the previous year.
Effects of introduction of tariff increases
51% of formal residents
said the introduction of tariff increases resulted in
23.22% of the
respondents said that the
38.45% of the respondents
said that the increase in tariffs prompted them to
It is worrisome that respondents (21.01%) in the 2013/2014 survey said that they are not aware of the increases and this figure has risen to

Page 170 of 203
ID 2012/2013 survey 2013/2014 survey 2014/2015 survey Remarks
them decreasing water consumption.
increase in tariffs prompted them to decrease their household water consumption.
decrease their household water consumption.
41.06% in the 2014/2015 survey. The Department needs to communicate more with their customers with regards to tariff increases.
Perceptions on water and sanitation services
47% of the respondents
disagreed with the statement that “Cape Town has enough water, so we don’t have to worry about how much we use’.
48% of the respondents agreed that there are current water restrictions in Cape Town”.
36% of respondents agreed that “the price of water and sanitation is fair to everyone”.
60.28%
disagreed with the statement that Cape Town has enough water and people must not worry about how to use it.
62.08% were in agreement that there are current water restrictions in Cape Town
47.31% were of the opinion that the price of water and sanitation is fair to everyone. There is a marked increase in this
67.62% disagreed with the
statement that Cape Town has enough water and people must not worry about how to use it.
48.22% were in agreement that there are current water restrictions in Cape Town
38.93% were of the opinion that the price of water and sanitation is fair to everyone. There is a marked decrease in this perception, as compared to the 2013/2014 survey
There has been a marked reduction in the percentages between the 2013/2014 survey and the 2014/2015 survey, except for the respondents perceptions with regard to Cape Town’s ample supply of water.There is a need for the Department to aggressively tackle awareness campaigns and educate the customers on water and sanitation services.

Page 171 of 203
ID 2012/2013 survey 2013/2014 survey 2014/2015 survey Remarks
perception, as compared to the 2012/2013 survey
3
Water conservation Water
conservation
Knowledge of water conservation promotions
79% of the formal
residents said they have heard a radio advertisement or seen advertisements or pamphlets from the City that promote water conservation.
54.29% of the
respondents said that they have had access to advertisements promoting water conservation
60.70% of the respondents
said that they have had access to advertisements promoting water conservation
The levels of awareness
regarding water conservation promotions have dropped from 2012/2013 by a significant 24.31% in the 2013/2014 survey. However there has been an increase in the level of awareness by 6.41%. In as much as there is a small increase in the level of awareness, the Department should consider expanding its communication channels in order to reach out to many customers.
Furthermore, there should be
more education by the Department to its customers regarding conserving water as the percentage has dropped from 63.85% in the 2013/2014 survey to 55.55% in the 2014/2015 survey.
Change of behaviour to conserve water
63% indicated they had
changed their behaviour regarding the conservation of water in the last year.
63.85% have
changed their behaviour in an effort to conserve water.
55.55% have changed their
behaviour in an effort to conserve water.

Page 172 of 203
ID 2012/2013 survey 2013/2014 survey 2014/2015 survey Remarks
4
Perceptions on water and sanitation services (service delivery quality)
Perceptions on water and sanitation services (service delivery quality)
Perception of taste of water
47% and 42% rated the
taste of water as excellent and good respectively (total of 89% positive perception)
9.5% rated the taste of water as average and 1.5% rated it as poor.
61.68% rated
the taste of water as good, while 22.85 said it was excellent
On the other hand 12.28 said the taste was average and 2.89 indicated that the taste of water is very poor
58.85% rated the taste of
water as good, while 25.64% said it was excellent
On the other hand 11.64% said the taste was average and 3.88% indicated that the taste of water is very poor
Positive cumulative percentage on the taste of water totals to 84.49% which is lower than that of the 2012/2013 (89%). This could be an area that the Department might be interested in looking into. Positive rating on smell of the water amounts to 86.23% which is again less than that from the 2012/2013 survey. However, this figure has risen to 89.68% in the 2014/2015 survey which shows an improvement regarding perception on smell and efforts by the Department.
Perception of smell of water
41.5% and 51.0% rated
the smell as excellent and good respectively (total of 92.5% positive perception).
6.5% rated the smell of water as average and 1.0% rated the smell of water as poor.
66.97 rated the
smell of water as good and 19.26% excellent, while 1.9% rated the smell of water as poor.
66.76% rated the smell of
water as good and 22.92% excellent, while 2.18% rated the smell of water as poor.

Page 173 of 203
ID 2012/2013 survey 2013/2014 survey 2014/2015 survey Remarks
Positive perception of colour of the water is 85.03%. Again, it is lower than that of the 2012/2013. This figure has dropped slightly in the 2014/2015 survey to 84.22%. However there has been an increase in the perception regarding the pressure from the total positive feedback of 78.04% for the 2013/2014 survey to 85.47% for the 2014/2015 survey. The perception of overall quality has risen from a total positive feedback of 83.23% in the 2013/2014 survey to 85.47% in the 2014/2015 survey. The figures have surpassed the
Perception of colour of water
41.5% and 47.1% rated
the colour of water as excellent and good respectively (total of 88.6% positive perception).
10.5% rated the colour of water as average and 0.9% as poor.
With regards to
water colour, 64.57% said its good, 20.46% said its excellent
12.48% said its average and 2.10% said its poor
With regards to water
colour, 62.10% said it is good, 22.12% said it is excellent.
12.67% said it is average and 3.12% said it is poor
Perception of water pressure
42.3% and 41.6% rated
the water pressure as excellent and good respectively (total of 83.9% positive perception).
13.3% rated the water pressure as average and 2.8% rated water pressure as poor.
58.28% said that
the water pressure is good and 19.76% excellent
16.57% said the water pressure is average while 3.19% said it was poor.
63.82% said that the water
pressure is good and 21.65% excellent.
11.98% said the water pressure is average while 2.57% said it was poor.
Overall quality
42.3% and 42.7% rated
the overall quality of water as excellent and good respectively (total of 85% positive perception).
18.76 indicated
its excellent, 64.47% said its good while 12.87% rated
20.99% indicated overall
water quality as excellent, 64.48% said its good while 11.40% rated the overall

Page 174 of 203
ID 2012/2013 survey 2013/2014 survey 2014/2015 survey Remarks
13.2% rated the overall quality as average and 1.8% as poor.
the overall quality average and 2.30% said it was poor
quality as average and 3.13% said it was poor
2012/2013 positive feedback of 85.00%.
Satisfaction with water availability
41% and 45% said they
were very satisfied and satisfied, respectively (total of 86% - satisfied).
The majority
83.23% are satisfied with water availability
The majority 85.78% are
satisfied with water availability
There is a very high increase in the satisfaction levels of water availability as compared to the 2012/2013. The figures have increased slightly to 85.78% in the 2014/2015 survey. This shows that the Department has improved in the provision of water services
Occurrence of water related problems
60% indicated that they never experienced a water-related problem and 8% said they experienced water-related problems daily.
79.46%
highlighted that they did not encounter any water-related problems while 20.46 indicated that they faced water-related problems
0.66% highlighted that they
did not encounter any water-related problems while 99.34% indicated that they faced water-related problems whether monthly, weekly, daily, frequently or rarely.
There is an astounding number of those that experience water-related problems. Nonetheless, an increase in those who have faced water-related problems has increased, as compared to the 2012/2013 survey and the 2013/2014 survey. The change in statistics could be attributed to the fact that more people have expressed concern about their water related problems.
Satisfaction with the City with respect to the
35% and 42% said they
were very satisfied and
85.80% indicated that they are satisfied with the
85.50% indicated that they are satisfied with the provision of water and sanitation services
There is a notable increase in the satisfaction levels from the 2013/2014. However, there is a slight decrease between the 2013/2014

Page 175 of 203
ID 2012/2013 survey 2013/2014 survey 2014/2015 survey Remarks
provision of sanitation and sewerage services
satisfied respectively (total of 77% - satisfied).
provision of water and sanitation services
and the 2014/2015 surveys of 0.30%. Nonetheless, respondents have shown satisfaction with the service delivery from the three surveys.
Occurrence of sewerage blockage or sanitation problems
67% said they never experienced a sewerage blockage problem and 2% said they experienced sewerage blockage or sanitation problems daily
78.97% commented that they have not experienced any sewerage blockage or sanitation problems
21.03% indicated that they have experienced sewerage blockage problems
87.78% commented that they did not experienced any sewerage blockage or sanitation problems
12.22% indicated that they experienced sewerage blockage problems
In the 2013/2014 survey an outstanding increase was identified in those who were experiencing sewerage or sanitation problems. However, the percentage reduced in the 2014/2015 survey, by 8.81%. Thus despite the reduced percentage, the Department still needs to work on servicing the sewerage and sanitation infrastructure.
5
Rating of services received when contacting the call centre
Rating of
services received when contacting the call centre

Page 176 of 203
ID 2012/2013 survey 2013/2014 survey 2014/2015 survey Remarks
“Ease of finding the right options when you call’
6.4% and 31.7% rated this service quality measure as excellent and good respectively. The findings also show that 54% of respondents rated the measure as average and 7.9% as poor.
53.62% said it was good while 10.14% said it was poor
69.34% rated the service as good and excellent collectively. 13.33% rated it as poor.
There was generally a remarkable improvement in all aspects with reference to the responses to customer queries, as compared to the 2012/2013 survey.
“The time taken
to get hold of the right person in the call centre”
4.8% and 30.2% rated the
service quality measure as excellent and good respectively. The findings also show that 46.0% rated the measure as average and 19% as poor.
48.55% said it
was good where as 18.12% rated it as poor
43.25 said it was good and
excellent collectively whereas 21.62% rated it as poor
“Being served in
a professional manner and insisting on reference number”
4.7% and 49.2% rated the
service quality measure as excellent and good respectively. 39.7% rated the measure as average and 6.4% as poor.
57.25%
indicated it was good while 6.52% said it was poor
62.33% indicated it was
good and excellent collectively, while 22.08% said it was poor

Page 177 of 203
ID 2012/2013 survey 2013/2014 survey 2014/2015 survey Remarks
“The time taken to fix the problem”
6.3% and 30.2% rated the service quality measure as excellent and good respectively. 36.5% rated the measure as average and 27.0% as poor.
28.26% commented that time taken to fix the problem took more than a day but less than three days
28.89% commented that time taken to fix the problem took less than a day
Expectations
of the City’s response time
Most (67.7%) respondents
expect a problem to be fixed within 6 hours followed by a 14.4% of respondents who expect a resolution within an hour and 12.7% who expect a resolution within 12 hours. The results also indicate that 2.7% of respondents expect a resolution within 2 days, 1.0% within 24 hours and 1.5% said they don’t know which time frame they consider appropriate for a problem to be solved.
28.66% expects
the problem to be fixed in 6 hours while 15.63% within 12 hours and 15.13% within 24 hours respectively
54.79% expect the problem
to be fixed within an hour. 21.42% expect the problem to be fixed in 6 hours while 6.54% within 12 hours and 5.69% within 24 hours respectively
There is an increased expectation for problems to be fixed within an hour as compared to the previous two surveys. More respondents were of the opinion that they would expect to be attended to within an hour rather than 12 hours or 24 hours.
6
Value/billing process
Value/billing
process

Page 178 of 203
ID 2012/2013 survey 2013/2014 survey 2014/2015 survey Remarks
Frequency of checking water bills
40% said always 13% said mostly 13% said sometimes 34% said never
50.31% said they always check their water bills.
24.69% said they never check their bills.
66.86% said they always check their water bills.
13.54% said they never check their bills.
There is a marked improvement in the number of people checking their bills from the previous two surveys to the 2014/2015 survey.
Rating of price of water
10.26% said its very expensive
26.61% said its expensive 37.91% said its fairly
priced 1.46% said its cheap 1.85% said the household
does not pay for water 21.54% said they don’t
know
26.85%
indicated that water is expensive.
45.27% indicated that water is cheap.
43.55% indicated that water
is expensive.
2.67% indicated that water is cheap.
Almost the same number of people for the 2012/2013 and 2013/2014 surveys indicated that water is expensive. However, the percentage increased to 43.55% in the 2014/2015 survey. There is a difference of 43.81% in people who said water is cheap. More people in 2013/2014 felt water is cheap. However, such figure plummeted in the 2014/2015 to a mere 2.67% who believe that pricing of water is cheap. More people have indicated that sanitation facilities are cheap in 2013/2014 compared to 2012/2013. However in the 2014/2015 survey, this figure dropped dramatically to 1.54%. This should be a reason for
Rating of the
price of sanitation services
10.72 said its very expensive
24.56% said its expensive 37.33% said its fairly
priced 1.75% said its cheap 3.12% said its very cheap 22.51% said they don’t
know
24.92% said
sanitation facilities are expensive.
24.21% said sanitation facilities are fairly priced.
48.83% said water is cheap.
43.15% said sanitation
facilities are expensive. 47.88% said sanitation
facilities are fairly priced. 1.54% said water is cheap.

Page 179 of 203
ID 2012/2013 survey 2013/2014 survey 2014/2015 survey Remarks
concern for the Department as many do not consider the sanitation services anywhere close to cheap.
Ownership
of water management device
39% of respondents said
they had a water management device and most (61%) did not have one.
18.66% said
they have a water management device.
6.66% said they have a
water management device while 93.34% expressed that they do not have a water management device.
These results suggest that there is a gradual decrease of customers who have water management devices.
Installation
of a prepaid water meter
15% said they would like a prepaid water meter installed
Only 13.52% said they want prepaid water metres.
Only 14.35% said they want prepaid water metres.
Between the 2012/2013 and 2013/2014 surveys, there was a drop in the percentage of those that wanted the prepaid meter. However, this figure slightly increased in the 2014/2015 survey as compared to the 2013/2014 survey by a percentage of 0.83%. The Department could take initiative by widely creating awareness on the benefits of prepaid water meters.

Page 180 of 203
9.2 Informal Findings Table 54: Comparison of findings – Informal

Page 181 of 203
ID
2012/2013 survey
2013/2014 survey
2014/2015 survey
Remark
1.
Demographics and socio-economic indicators
Age 37.60% were between the
ages of 25-34 years 34.53% were
recorded from 25-34
43.34% were between 25-
34 years
A noted increase in the participation of the 25-34 year old age group in the 2014/2015 survey
Gender 61.06% of the respondents
were females 57.59% were
females
67.38% were females
Females still dominating, in this case, women are more than man in population so it is expected. Another point is that women are more receptive than men in in participation.
Race 85% was from the Black
racial group 71.56% is Black
90.37% were black
Black people are common in the informal areas as compared to other racial groups.
Language 85.36% speak IsiXhosa
language 66.07% speak
IsiXhosa
86.61% were IsiXhosa
speaking
This correlates with the race aspect; therefore, the language used to communicate mainly in this part of the province is IsiXhosa.

Page 182 of 203
ID
2012/2013 survey
2013/2014 survey
2014/2015 survey
Remark
Household income
The majority 37.77% indicated no source of income
27.97% had no income
35.99% had no income Most residents in the informal residential areas are not employed, hence, more recordings on no household income. However, the number of unemployed respondents for 2014/2015 survey has decreased compare to 2012/2013.
Educational level
44.33% have completed
secondary school
49.62% completed
secondary school
43.58% completed
secondary school
There is a decrease in the number of respondents who completed secondary school as compared to the 2012/2013 survey.
Employment status
51.58% were not employed 58.41% is not
employed
63.51% were not employed
There is an increase in the unemployment status of the respondents in informal resident areas as compared to 2012/2013 survey by 5.10%
2 Water services
Amount of water used per month
The survey showed that 61%
of the respondents said they did not know the amount of water the household was using per month.
The survey revealed
that only 16.94% of the respondents said they did not know the amount of water the household used per month
The survey revealed that
only 23.81% of the respondents said they did not know the amount of water the household used per month
There is an increase in the number of people who are not conscious of the amount of water their household used on a monthly basis compared to 2013/2014 survey.

Page 183 of 203
ID
2012/2013 survey
2013/2014 survey
2014/2015 survey
Remark
Amount of water used compared to last year
45.6% of respondents said
they do not know if their household is using more, the same or less amount of water compared to a year ago.
25.15% of the
respondents said they do not know if their household is using more, less or the same amount of water as compared to a year ago
20.83% of the respondents
said they do not know if their household is using more, less or the same amount of water as compared to a year ago
The findings reveal a decrease in knowledge of the quantity of water used per household per month over the year. This increase is in line with the above increase in knowledge of monthly water consumption.
Perceptions on water and sanitation services
50% of respondents
disagreed with the statement that “Cape Town has enough water, so we don’t have to worry about how much we use”.
49% of informal residents agreed that there are current water restrictions in Cape Town. .
49.85% of
respondents disagreed with the statement that “Cape Town has enough water, so we don’t have to worry about how much we use”.
29.55% of informal residents agreed that there are current water restrictions in Cape Town.
57.61% of respondents
disagreed with the statement that “Cape Town has enough water, so we don’t have to worry about have to worry about how much we use”.
44.00% of informal residents agreed that there are current water restrictions in Cape Town.
The number of people who disagreed about the City having enough water has increased compared to other years. 29.55% in the previous survey agreed that there are restrictions on water in Cape Town, this year it has increased to 44.00%.
3
Water conservation

Page 184 of 203
ID
2012/2013 survey
2013/2014 survey
2014/2015 survey
Remark
Knowledge of water conservation promotions
56.74% of respondents said
they have heard a radio advertisement, or seen advertisements or pamphlets from the City that promote water conservation.
37.13% of the
respondents mentioned that they have seen advertisements or pamphlets from the City of Cape Town that promotes water conservation.
45.57% of the respondents
mentioned that they have seen advertisements or pamphlets from the City of Cape Town that promotes water conservation.
The recent survey shows there has been an increase in the number of people who have seen advertisements or pamphlets from the City that promote water conservation. This means that there is an improvement compare to 2013/2014 survey, but still not above 56.74% of 2012/2013 survey.
Change of behaviour to conserve water
57.57% indicated they had
changed their behaviour regarding the conservation of water in the last year.
54.37% of the
respondents mentioned that there has been a change of behaviour within their households regarding the conservation of water
53.15% of the respondents
mentioned that there has been a change of behaviour within their households regarding the conservation of water
The number of people who indicated that there has been behaviour change within their households decreased by 1.18% per cent from the previous survey
4 Water quality

Page 185 of 203
ID
2012/2013 survey
2013/2014 survey
2014/2015 survey
Remark
Perception on quality of the taste of water
44.4% and 44.1% rated the
taste of water as excellent and good respectively (total of 88.5% positive perception). .
The taste of
water was adjudged to be in the positive by a cumulative percentage of 90% of the respondents.
63.09% rated the taste
of water as good and 26.19% as excellent.
Perception on smell of water
45.5% and 43.0% rated the
smell as excellent and good respectively (total of 88.5% positive perception).
16.57% and 71.49%
rated the smell as excellent and good respectively giving a cumulative percentage of 88.06%
66.05% rated the smell of
water as good and 24.73% as excellent.

Page 186 of 203
ID
2012/2013 survey
2013/2014 survey
2014/2015 survey
Remark
Perception on colour of water
44.1% and 44.1% rated the
colour of water as excellent and good respectively (total of 88.2% positive perception).
9.1% rated the colour of water as average and 2.7% rated the colour of water as poor.
17.76% and 61.94%
rated the colour of water as excellent and good respectively (total of 79.7% positive perception).
15.67% rated the colour of water as average and 4.48% rated the colour of water as poor.
60.89% rated the colour of water as good and 25.31% as excellent.
The perception on the overall quality of water delivered by the City remains on the positive side so far. The survey reveals that the percentage of positive perception on the smell of water remains impressively high at 90.78%. The number of respondents who adjudged it to be excellent has increased compared to last year results. There has been a general increase in the perceptions on the colour of water with 86.20%. Again, following suit in the trends seen above the number of positive perceptions is increasing. There has been a general positive increase in the perceptions on the water pressure with 74.42% compare to the 2013/2014 survey.
Perception on water pressure
45.7% and 36.8% rated the
water pressure as excellent and good respectively (total of 82.5% positive perception).
16.87% and 49.40%
rated the water pressure as excellent and good respectively (total of 66.27% positive perception).
52.56% rated the water
pressure of water as good and 21.86% as excellent.

Page 187 of 203
ID
2012/2013 survey
2013/2014 survey
2014/2015 survey
Remark
Overall quality
45.7% and 36.8% rated the overall quality of water as excellent and good respectively (total of 82.5% positive perception).
19.70% and 60.30% rated the overall quality of water as excellent and good respectively (total of 80% positive perception).
61.88% rated the overall
quality of water as good and 24.22% as excellent.
Overall, positive perception of the customers on the quality of water from the city of Cape Town has increased to 86.10% compare to the previous years.
Satisfaction with water availability
13% and 51.41% said they
were very satisfied and satisfied (total of 64.41% - satisfied).
A total of 64.62% of
the respondents indicated that they were satisfied
A total of 74.81% of the
respondents indicated that they were satisfied
The level of satisfaction with
the availability of water has increased at 74.81% compared to the previous surveys.
The survey shows a negative decrease in respondents who mentioned that they have not experienced any water related problems.
Occurrence of water related problems
25% said they never
experienced a water-related problem and 10.6% said they experienced water-related problems twice a month.
66.47% said they
never experienced a water-related problem and 33.53% said they experienced water-related problems twice a month
Only 0.84% said they
never experienced a water-related problem and 23.43% said they experienced water-related problems weekly.

Page 188 of 203
ID
2012/2013 survey
2013/2014 survey
2014/2015 survey
Remark
Satisfaction with the City’s provision of sanitation and sewerage services
3.49% and 20.3% said they
were very satisfied and satisfied respectively (total of 23.8% - satisfied).
46.26% said they
were satisfied with the City’s provision of sanitation and sewerage services.
43.64% said they were
satisfied with the City’s provision of sanitation and sewerage services.
In the current survey the
percentage has decreased the number of respondents mentioned that they were satisfied with the City’s sanitation and sewerage provisions compare to the 2013/2014 survey
There has been a marked decrease in the number of respondents who indicate that they have not experienced any blockage.
Occurrence of sewerage blockage or problems
30% said they never
experienced a water-related problem and 22% said they experienced sewerage blockage problems daily.
59.04% said they
never experienced any sewerage blockages. 40.96 said they had experience sewerage blockages or problems
Only 0.33% said they
never experienced any sewerage blockages. 24.75% said they had experience sewerage blockages or problems weekly
5
Customer service contact details
“Ease of finding the right options when you call”
6.4% and 31.7% rated this
service quality measure as excellent and good respectively.
11.76% and 35.29%
indicated that excellent and good respectively (cumulative percentage of 47.05%
42.11% rated as good and
10.53% as excellent. Half of the respondents spoke in the positive about the reception once they called seeking assistance.
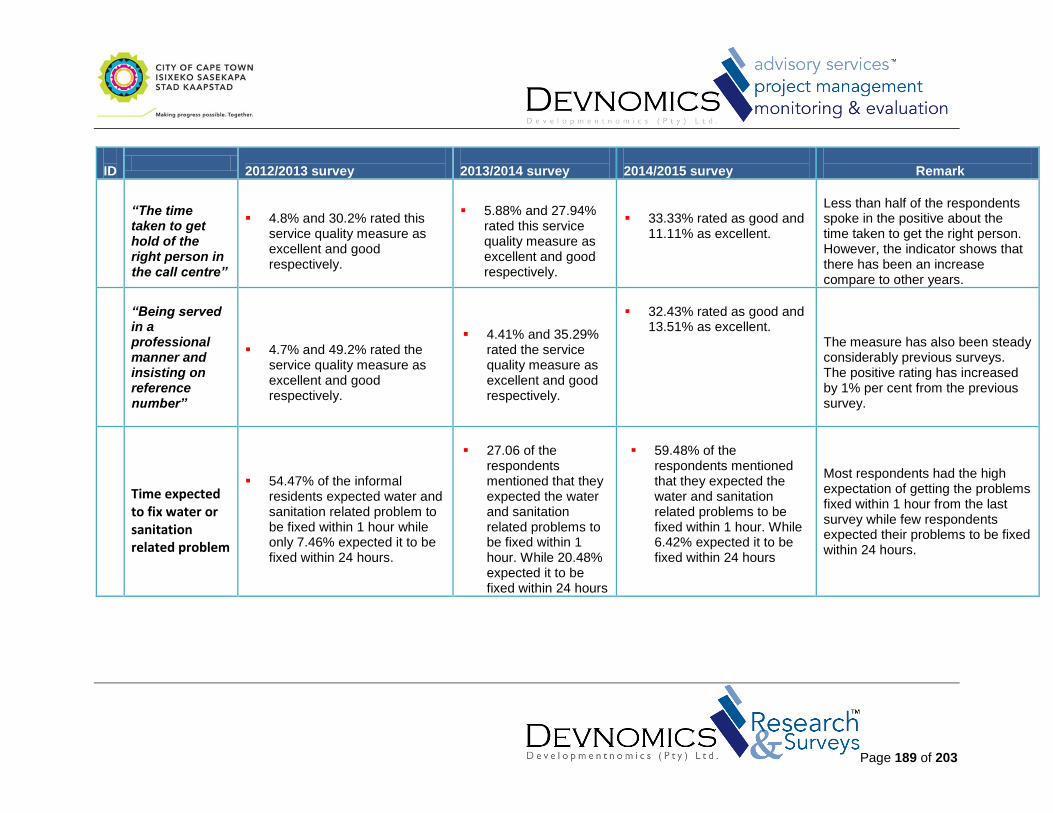
Page 189 of 203
ID
2012/2013 survey
2013/2014 survey
2014/2015 survey
Remark
“The time taken to get hold of the right person in the call centre”
4.8% and 30.2% rated this
service quality measure as excellent and good respectively.
5.88% and 27.94%
rated this service quality measure as excellent and good respectively.
33.33% rated as good and
11.11% as excellent.
Less than half of the respondents spoke in the positive about the time taken to get the right person. However, the indicator shows that there has been an increase compare to other years.
“Being served in a professional manner and insisting on reference number”
4.7% and 49.2% rated the service quality measure as excellent and good respectively.
4.41% and 35.29%
rated the service quality measure as excellent and good respectively.
32.43% rated as good and
13.51% as excellent.
The measure has also been steady considerably previous surveys. The positive rating has increased by 1% per cent from the previous survey.
Time expected to fix water or sanitation related problem
54.47% of the informal
residents expected water and sanitation related problem to be fixed within 1 hour while only 7.46% expected it to be fixed within 24 hours.
27.06 of the
respondents mentioned that they expected the water and sanitation related problems to be fixed within 1 hour. While 20.48% expected it to be fixed within 24 hours
59.48% of the
respondents mentioned that they expected the water and sanitation related problems to be fixed within 1 hour. While 6.42% expected it to be fixed within 24 hours
Most respondents had the high expectation of getting the problems fixed within 1 hour from the last survey while few respondents expected their problems to be fixed within 24 hours.

Page 190 of 203
9.3 Comparison: Business Findings Table 55: Comparison of findings – Business
ID 2013/2014 survey 2014/2015 survey Remark
1.
Economic indicators
Type of business
64.13% were in the retail trade business
27.27% of the total sample was from the manufacturing industry
followed by wholesale, retail and motor trade, catering and accommodation at 25.65%
Agriculture, hunting, forestry and fishing contributed to 1.20% of the total sample.
45.21% of the total sample reported that they were from the wholesale, retail and motor trade, catering and accommodation industry.
An outstanding achievement has been noted in the increase of the manufacturing industry in the 2013/2014. It is believed that the manufacturing industry is usually a heavy water user and the survey was reflective of this belief. According to the latest survey’s results, the agricultural, hunting, forestry and fishing sector has dramatically decreased. This may be due to lack of representation within the sample. Nonetheless, wholesale, retail and motor trade, catering and accommodation industry has grown as a result of Cape Town’s status as being one of the world’s premier destinations.

Page 191 of 203
ID 2013/2014 survey 2014/2015 survey Remark
Number of employees
30.79% had the range of 1-10 employees
49.50% had 10-49 employees
46.47% has 0-9 employees, while 51.60% had between 10-49 employees
The findings have shown an improvement in the involvement of medium to large sized companies in the 2013/2014 survey, as compared to the 2012/2013 survey which only targeted small businesses whose water consumption is very minimal. The 2014/2015 survey provides support for the previous finding.
2
Water services
Amount of water used per month
The survey showed that 80.63% of respondents said they did not know the amount of water they used per month.
The survey showed that 25.97% of respondents said they did not know the amount of water they used per month
32.74% of all respondents indicated that they did not know the amount of water used per month
Amount of water used compared to last year
Most respondents
(62%) said they think they are using the same amount of water as the previous year. 18% of respondents said that they did not know whether they used the same amount or more.
Just over half of the
respondents 57.19% said they think they are using the same amount of water as the previous year. Only 19.28% of respondents said that they did not know whether they used the same amount or more.
49.39% of all respondents said that their water usage was the same, compared to the previous year, and 28.05% indicated that they did not know whether their water usage increased or decreased.

Page 192 of 203
ID 2013/2014 survey 2014/2015 survey Remark
Effects of introduction of tariff increases
64% of respondents
said the introduction of tariff increases did not result in them decreasing their water consumption, while 36% said it resulted in them decreasing their water consumption.
77.38% of respondents
indicated that the introduction of tariff increases did not result in them decreasing their water consumption, while 22.62% said it resulted in them decreasing their water consumption.
75.55% of respondents indicated that the introduction of tariff increases did not result in them decreasing their water consumption, while 24.45% said it resulted in them decreasing their water consumption.
The number of respondents who have no knowledge of their water consumption has reduced significant from 80.63% to 25.97% in the 2013/2014t survey. This figure increased by 6.77% during the last year. Comparatively, fewer respondents in the current survey think they are using the same amount of water and slightly more (8.77% more) said they did not know what their consumption was, compared to the previous year. Slightly fewer respondents indicated that tariff increases did not result in decreased water consumption, compared to last year’s survey. In addition, slightly more respondents indicated that due to tariff increased, their water consumption decreased.

Page 193 of 203
ID 2013/2014 survey 2014/2015 survey Remark
Perceptions on water and sanitation services
There are an almost
equal percentage of respondents who agreed and disagreed that “Cape Town has enough water, so we don’t have to worry about how much we use”.
67.30% of respondents agreed that “there are current water restrictions in Cape Town”. 26.03% of respondents were unsure if there were water restrictions or not.
More than 50% of respondents believed that “the price of water and sanitation is fair to everyone”.
65.48% of the
respondents in the current survey disagreed that “Cape Town has enough water, so we don’t have to worry about how much we use”.
49.68% of respondents agreed that “there are current water restrictions in Cape Town”. 26.13% of respondents were unsure if there were water restrictions or not.
45.15% of respondents believed that “the price of water and sanitation is fair to everyone”.
73.72% of the respondents disagreed that “Cape Town has enough water, so we don’t have to worry about how much we use”.
50.61% of respondents agreed that “there are current water restrictions in Cape Town”, and 14.24% of respondents were unsure if there were water restrictions or not.
44.68% of respondents disagreed that “the price of water and sanitation is fair to everyone”. However, 31.91% of respondents agreed with the statement.
The results give a mixed picture over the period of the three surveys. In the current survey there is a clear majority of 73.72% who disagreed with the notion that “Cape Town has enough water, so we don’t have to worry about how much we use” Noteworthy, is the high number of respondents (44.68%) who believed that the pricing regime to be unfair.
3
Value/ Billing

Page 194 of 203
ID 2013/2014 survey 2014/2015 survey Remark
Water conservation policy
Most respondents
(78.73%) said they did not have a water conservation policy, while 21.27% responded positively.
71.48% said they did not
have a water conservation policy, while 28.06% responded positively.
Majority of respondents (90.30%) indicated that they did not have a water conservation policy, while only 9.70% of businesses had a water-conservation policy.
The number of respondents indicating that they did not have water conservation policies increased during the past year, according to the sample.
Annual water audit
Most respondents
(90.48%) indicated that they do not undertake an annual water audit. Therefore, only 9.52% of respondents said yes, “they have an annual water audit”.
86.32% of the
respondents indicated that they do not undertake an annual water audit. Therefore, only 13.68% of respondents said yes, “they have an annual water audit”.
Most respondents (91.44%) indicated that they do not undertake an annual water audit. Therefore, only 8.56% of respondents said yes, “they have an annual water audit”.
There was a reduction by 5% of the number of respondents who undertook annual water audits, with regard to the previous two surveys. The current findings however surpassed last year’s results by 5.12%.
Water management device
The findings show that
36% said they had a water management device and 64% of respondents said they did not have a water management device.
The findings show that
18.33% said they had a water management device and 81.67% of respondents said they did not have a water management device.
The findings show that 3.02% said that they had a water management device and 96.98% of respondents did not make use of water management devices..
The number of respondents with water management devices as reflected in the three surveys. The figures indicate a consistent decrease during the past three years.

Page 195 of 203
ID 2013/2014 survey 2014/2015 survey Remark
Prepaid meter installation
The findings show that
only 17.14% of respondents would like to install a prepaid water meter.
The findings show that
only 7.26% of respondents would like to install a prepaid water meter.
The findings show that only 9.12% of respondents would like to install a prepaid water meter.
The number of respondents who would prefer a prepaid meter to monthly billing increased in the current survey.
4 Water quality
Perception on quality taste of water
32.06% and 53.65%
rated the taste of water as excellent and good respectively (total of 85.71% positive perception).
8.71% and 71.29% rated
the taste of water as excellent and good respectively (total of 80% positive perception).
11.68% and 70.06%
rated the taste of water as excellent and good respectively (more than an 81.74% positive perception rate).
Perception on smell of water
31.43% and 55.6%
rated the smell of water as excellent and good respectively (total of 87.03% positive perception).
7.42% and 77.74% rated
the smell of water as excellent and good respectively (total of 85.16% positive perception).
11.68% and 72.75%
rated the smell of water as excellent and good respectively (total of 84.43% positive perception).
Perception on colour of water
30.16% and 54.92%
rated the colour of water as excellent and good respectively (total of 85.08% positive perception).
7.74% and 76.45% rated
the colour of water as excellent and good respectively (total of 84.19% positive perception).
11.68% and 72.75%
rated the colour of water as excellent and good respectively (total of 84.43% positive perception).

Page 196 of 203
ID 2013/2014 survey 2014/2015 survey Remark
Perception on water pressure
29.84% and 51.43%
rated the water pressure as excellent and good, respectively (total of 81.27% positive perception)
7.42% and 78.06% rated
the water pressure as excellent and good, respectively (total of 85.48% positive perception)
10.18% and 70.96% rated the water pressure as excellent and good, respectively (total of 81.14% positive perception)

Page 197 of 203
Overall quality
26.98% and 56.51%
rated overall quality as excellent and good respectively (total of 83.49% positive perception)
8.71% and 76.77% rated
overall quality as excellent and good respectively (total of 85.48% positive perception)
14.67% and 67.66% rated overall quality as excellent and good respectively (total of 82.33% positive perception)
The number of respondents who perceived the taste of water to be good and excellent, slightly increased compared to last year. Slightly fewer respondents indicated positive reactions with regard to the smell of the water provided by the City of Cape Town, compared to the previous two surveys. The number of the respondents who rated their perception of the colour of water to be good increased slightly in the 2014/2015 survey. The overall positive perception on water pressure decreased by 4.34%, according to the current findings.

Page 198 of 203
ID 2013/2014 survey 2014/2015 survey Remark Although the results indicate an increase in positive perceptions, between 2012/2013 and 2013/2014, the current findings indicate a drop in positive perception with regard to the overall quality of water.
Satisfaction with water availability
29.84% and 56.19%
said they were very satisfied and satisfied (total 86.03% - satisfied).
Total 94.48% respondents
expressed satisfaction with the availability of tap water on their premises.
Total 87.31% respondents expressed satisfaction with the availability of tap water on their premises.
There is a significant decrease in the number of respondents who are ‘satisfied’ with the services rendered by the City of Cape Town, compared to the previous years’ survey.
Occurrence of water related problems
49.84% said they never
experienced a water-related problem).
84.09% of the
respondents indicated that they never experienced a water-related problem.
An impressive 90.42% of the respondents indicated that they never experienced a water-related problem.
The current survey revealed that an increase of 6.33% of respondents have never experienced water related problems, compared to the previous survey.
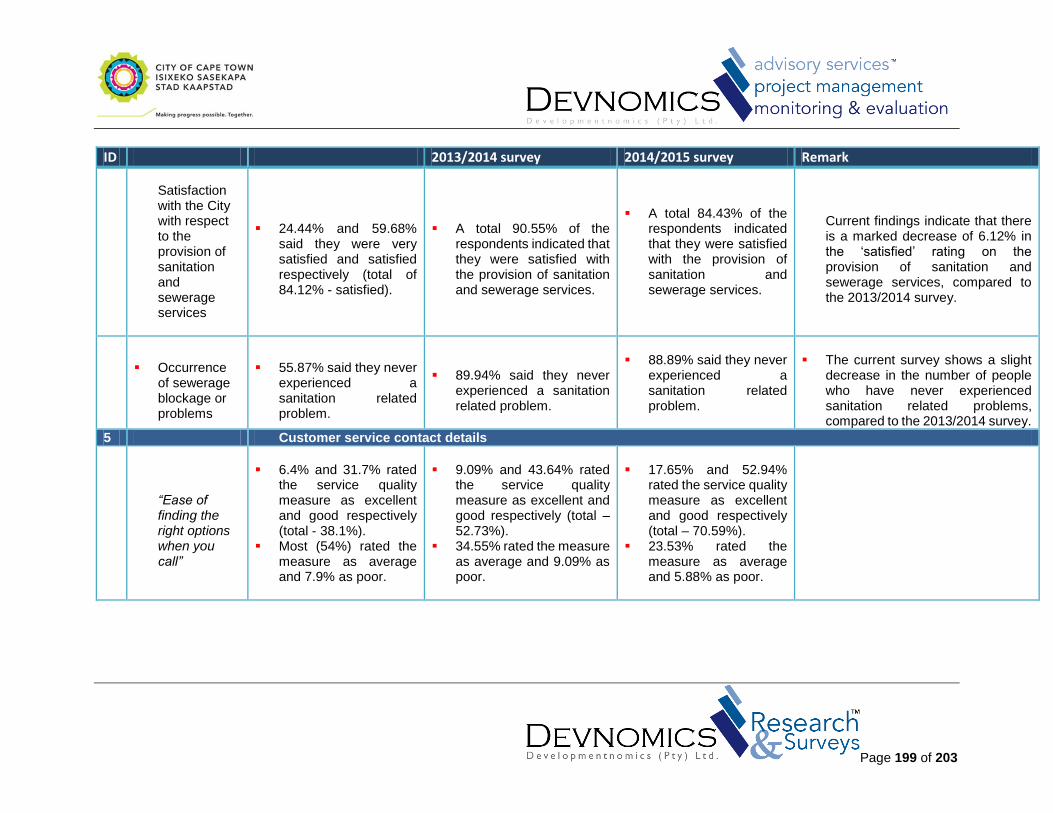
Page 199 of 203
ID 2013/2014 survey 2014/2015 survey Remark
Satisfaction with the City with respect to the provision of sanitation and sewerage services
24.44% and 59.68%
said they were very satisfied and satisfied respectively (total of 84.12% - satisfied).
A total 90.55% of the
respondents indicated that they were satisfied with the provision of sanitation and sewerage services.
A total 84.43% of the respondents indicated that they were satisfied with the provision of sanitation and sewerage services.
Current findings indicate that there is a marked decrease of 6.12% in the ‘satisfied’ rating on the provision of sanitation and sewerage services, compared to the 2013/2014 survey.
Occurrence
of sewerage blockage or problems
55.87% said they never
experienced a sanitation related problem.
89.94% said they never
experienced a sanitation related problem.
88.89% said they never experienced a sanitation related problem.
The current survey shows a slight
decrease in the number of people who have never experienced sanitation related problems, compared to the 2013/2014 survey.
5 Customer service contact details
“Ease of finding the right options when you call”
6.4% and 31.7% rated
the service quality measure as excellent and good respectively (total - 38.1%).
Most (54%) rated the measure as average and 7.9% as poor.
9.09% and 43.64% rated
the service quality measure as excellent and good respectively (total – 52.73%).
34.55% rated the measure as average and 9.09% as poor.
17.65% and 52.94%
rated the service quality measure as excellent and good respectively (total – 70.59%).
23.53% rated the measure as average and 5.88% as poor.

Page 200 of 203
ID 2013/2014 survey 2014/2015 survey Remark
“The time taken to get hold of the right person in the call centre”
4.8% and 30.2% rated
the service quality measure as excellent and good respectively (total – 35%).
Most (46.0%) rated the measure as average and 19% as poor.
3.64% and 52.73% rated
the service quality measure as excellent and good respectively (total – 56.37%).
23.64.0% rated the measure as average and 18.18% as poor.
23.53% and 64.71%
rated the service quality measure as excellent and good respectively (total – 88.24%).
5.88% rated the measure as average and 5.88% as poor.
The survey revealed a dramatic increase of nearly 18% in the number of the respondents who adjudged the quality of the measure to be excellent. The measure as revealed has seen significant increase in the ‘excellent’ and ‘good’ rating The trend continues to show significant improvement of quality of service and response from the customer service desk.
“Being served in a professional manner and insisting on reference number”
4.7% and 49.2% rated
the service quality measure as excellent and good respectively (total – 53.9%).
39.7% rated the measure as average and 6.4% as poor.
3.64% and 70.91% rated
the service quality measure as excellent and good respectively (total – 74.55%).
20.00% rated the measure as average and 3.64% as poor.
5.88% and 82.35%
rated the service quality measure as excellent and good respectively (total – 88.23%).
11.76% rated the measure as average.

Page 201 of 203
10. CONCLUSIONS AND RECOMMENDATIONS
10.1 Formal The majority of the formal respondents indicated they had at attained some level of schooling, which suggests that the messages the City of Cape Town might use should be easily understood if information needs are correctly matched with the communication means deployed to satisfy those needs. The City could also make use of this to increase the overal awareness of services provided by the City.
In terms of the occupation status, the results indicate that the majority of respondents who were interviewed were economically active and therefore had vested interests in water and sanitation issues.
Formal residents own a variety of electronic means of communication. This presents the Department with an excellent opportunity to communicate with its target residents. The City of Cape Town needs to ensure that their services remain “quality focused” as a large number of people rely on them. The lack of awareness with regard to respondents not knowing how much water they used each month as well as the general lack of knowledge of residents should be a matter of concern for the Department, and should not impact negatively on the Department’s desire to encourage residents to conserve water, as nearly half the respondents disagreed with the statement “Cape Town has enough water, so we don’t have to worry about how much we use”. It is also worrisome, that a large number (41.06%) of respondents were not aware of the increases. The department therefore needs to improve on their communication with regards to tariff increases. Most people agree that “the tap water in Cape Town is safe to drink’ and a large number of the respondents agree that “the supply of tap water in Cape Town is reliable”. These are positive sentiments, and the Department should focus on developing better relationships with customers and in such a way improve its image. Most (55.55%) of the respondents indicated that they had changed behaviour to conserve water within the last year. However there is still scope for the City of Cape Town to revisit and enhance the current conservation campaigns in order to secure the objectives of the Water Conservation and Water Demand Strategy. This is key considering the observation that most (72.41%) respondents indicated that they were not aware of Water Conservation Officers conducting presentations in their communities. The majority of formal residents have heard radio advertisements or seen advertisements or pamphlets that promote water conservation. The water-quality dimensions were rated as good by most residents. The Call Centre is the main “point of contact”, followed by the Department itself. Most consumers who contacted the Call Centre rated the service as average. There is thus room for improvement for Call Centre teams. The betterment could require additional training of the workers or teams with regard to a quality approach to service delivery. Most consumers (54.79%) expect a problem to be fixed within an hour after reporting it, and such an expectation can be challenging to the Department. The Department could, however, use its knowledge to

Page 202 of 203
anticipate the needs and expectations of its customers and therefore help the customers to set realistic expectations. Management of customer expectations involves customer-education programmes, in which the consumers are also educated about their obligations and responsibilities. In this manner the Department could reduce service-delivery gaps which may exist between the Department and its consumers.
Most residents (57.97%) know how to contact the Department. However, more concerted efforts – in
addition to already existing initiatives – could be used by the Department to increase the pool of residents who know how to contact the Department. Customer knowledge of the different ways of contacting the Department is important, because of water conservation initiatives; customers are encouraged to report a fault as soon as possible and therefore should know how to contact the Department. Customers responded indifferently (neutral) to three out of four perception statements. The main goal of the Department should be to continuously innovate and improve its service-delivery processes so that there is movement on the perception domain from the neutral towards the positive position. In the case of the four statements given here, the ideal should be movement towards the strongly agree position of the perception domain. Slightly more than half of the respondents did not know the customer-service contact details for queries. There is need for the City of Cape Town to increase and expand its existing information and educational initiatives, so that an increased number of residents is aware of the service-contact details for queries.
Most respondents (74.45%) indicated they would like to receive literature (material such as pamphlets, stickers, and posters) explaining various initiatives on water and sanitation, from the Department.
The most-preferred method for receipt of information from the City of Cape Town is newspaper, radio, flyers, SMS. The least-preferred methods are the website, billboards and emails. The Department could, in its communication strategy, take into account these interesting findings. The Department could increase its current efforts to educate and inform the communities on the by-laws that regulate water usage and water abuse.
10.2 Informal The findings are useful to see the different population groups that dominate the City, these groups are important to identify as they can assist the City to find appropriate ways to have a realistic racial group representation. The findings show that most of the people who participated in this survey fall within 25-34 age group (43.34%). Within these groups, most of the respondents were females. It is generally believed that within the households women have a better understanding of water and sanitation issues than males, and hence this outcome. In terms of race, more black than coloured households participated in the survey. Generally, more black people reside in informal areas and therefore it is not surprising that the most spoken language was Xhosa. The City of Cape Town will have to find a way of uplifting the lives of black people through provision of better water and sanitation services. A higher percentage of households seem to be using flush toilets; however, there are still many households making use of the bucket system. It is a concern that most informal residents do not access to adequate water and sanitation facilities despite that the City of Cape Town is providing the services to the informal areas.

Page 203 of 203
The City could make use of television and cellular phones for communicating with households in informal areas. The residents need to obtain more education about water usage; most of the people do not know or are unsure of the average use of water per month, or in comparison with the previous year. Generally, the residents feel that the quality of water is good and are quite satisfied with its availability. Even though the people are satisfied with the availability of water, they still occasionally experience problems associated with water like burst pipes, no water or low pressure. The occurrence of water-related problems seems not to be a big issue; most people reported that it never happened and some said it occurred only once or twice a year. The City needs to have highly-skilled technicians who will act promptly to fix problems immediately after they are reported. Most households (80.61%) in informal areas said they did not know how to contact relevant departments about their concerns regarding water and sanitation or do not have the means to do so. They should be educated on what to do when they have problems in relation to water and sanitation. Since most respondents are unhappy with the Call Centre services, the Department needs to provide a better alternative for the residents to use to contact them. Most residents (75.89%) were not aware of the fact that Water Conservation Officers were conducting presentations on water conservation in the communities. There is need to widen these campaigns in all the districts.
10.3 Business The Department should establish strategic alliances with business and business assocations and their associations, in order to promote awareness and knowledge of water management and conservation. As the study revealed, , most of the business respondents (96.98%) did not have water-management devices. There is scope for the Department to widely publicise the benefits that can be derived from such devices.
The Department might want to use its monopolist status to change behaviour, and also to introduce incentives in conjunction with business to support the message of conservation, whilst promoting its own brand as the beacon of Africa.
Slightly fewer respondents indicated that tariff increases did not result in decreased water consumption, compared to last year’s survey. In addition, slightly more respondents indicated that due to tariff increased, their water consumption decreased. A higher percentage of business respondents as opposed the formal residents had no idea of the amount of water they used each month. This should be a grave matter of concern to the Department, as this group of stakeholders is thought to be more informed. Their lack of knowledge may impact adversely on the Department’s desire to encourage business and employees to conserve water. Businesses must be encouraged to attempt to change the behaviour of their employees. They cannot hide behind the fact that they pay for the service and their use is irrelevant. As in the case with formal residents, these are positive signals which the Department should build on in its attempt to develop better relationships with customers and strengthen its brand. A large percentage of business respondents indicated that they would like to receive information and literature such as pamphlets, stickers and posters explaining the various initiatives on water and sanitation. This presents an opportunity to the City of Cape Town to engage with the business sector.
...whatever may be our wishes, our inclinations, or the dictates of our passion, they cannot alter the state of facts and evidence.
- John Adams, 1770
Uncover ing fac t s . P roduc ing ev idence .
Contact Us | P. Kola Jolaolu [C] +27 82 558 3413 | Busisiwe Hlongwane [C] +27 82 445 7693 | Harry Dladla [C] +27 76 643 2087
[A] 1 TFT House, 13 Challenger Avenue, International Business Gateway Park, New Road, Midrand, 1682 Postnet Suite #57, Private Bag X19 Menlo Park 0102 [T] +27 10 593 3102 | [F] +27 10 593 3099
[A] Developmentnomics Suite, 6th Floor, SOUTH AFRICAN RESERVE BANK BUILDING, 60 St George’s Mall, Cnr Hout Street and St George’s Mall, Cape Town, 8001 PO Box 1274, Cape Town, 8000, South Africa[T] +27 21 460 0435 | [F] +27 21 422 5626
[E] [email protected] | [W] www.developmentnomics.co.za
Developmentnomics (Pty) Ltd is a level 1 contributor to BBBEE with a rating of AAA+