final report building up the future sub group on advanced
TRANSCRIPT

Final Report
Building Up the Future
Sub Group on Advanced Biofuels
Sustainable Transport Forum
Edited by: Kyriakos Maniatis Ingvar Landälv Lars Waldheim Eric van den Heuvel Stamatis Kalligeros March – 2017


3
Disclaimer: The SGAB report has been approved by the Members of the Sustainable Transport Forum. However, a Member has expressed its concern regarding the proposed recommendations on food-based biofuels. This Member also considered that the report should give deeper consideration to the sustainable availability of lipid-based advanced biofuels. EUROPEAN COMMISSION
Directorate-General for Transport Unit MOVE.DDG1.B.4 - Sustainable & Intelligent Transport Directorate B - Investment, Innovative & Sustainable Transport
Contact: Antonio Tricas Aizpun
E-mail: [email protected]
European Commission B-1049 Brussels

4
LEGAL NOTICE
This document has been prepared for the European Commission however it reflects the views only of the authors, and the Commission cannot be held responsible for any use which may be made of the information contained therein.
More information on the European Union is available on the Internet (http://www.europa.eu).
Luxembourg: Publications Office of the European Union, 2017
ISBN 978-92-79-69010-5 doi: 10.2832/494620
© European Union, 2017
Reproduction is authorised provided the source is acknowledged.
Europe Direct is a service to help you find answers to your questions about the European Union.
Freephone number (*):
00 800 6 7 8 9 10 11
(*) The information given is free, as are most calls (though some operators, phone

5
HOW TO OBTAIN EU PUBLICATIONS Free publications: • one copy: via EU Bookshop (http://bookshop.europa.eu); • more than one copy or posters/maps: from the European Union’s representations (http://ec.europa.eu/represent_en.htm); from the delegations in non-EU countries (http://eeas.europa.eu/delegations/index_en.htm); by contacting the Europe Direct service (http://europa.eu/europedirect/index_en.htm) or calling 00 800 6 7 8 9 10 11 (freephone number from anywhere in the EU) (*). (*) The information given is free, as are most calls (though some operators, phone boxes or hotels may charge you).
Priced publications:
• via EU Bookshop (http://bookshop.europa.eu). Priced subscriptions: • via one of the sales agents of the Publications Office of the European Union
(http://publications.europa.eu/others/agents/index_en.htm).

EUROPEAN COMMISSION
6
Abstract
This study seeks to support the European Commission in the elaboration of a methodology for the deployment of advanced biofuels. Currently, the contribution of advanced and other renewable fuels is very limited in the EU with a relative higher cost than fossil fuels they aim to replace. The Sub Group on Advanced Biofuels of the Sustainable Transport Forum consisted of 32 industry experts representing all advanced biofuels value chains as well as the transport sectors of aviation, maritime and heavy duty transport. The work of the Sub Group on Advanced Biofuels put forward a simple and transparent definition for advanced biofuels, proposed reliable targets for deployment of advanced biofuels in the EU market by 2030, updated the technology status of the various value chains and examined thoroughly the production costs of advanced biofuels. The Sub Group on Advanced Biofuels also considered carefully the proposals on decarbonising transport in the recast of the Renewable Energy Directive and put forward proposals for improvements aiming to create a long term stable framework for encouraging billions of investments. Ziel dieser Studie ist es, die Europäische Kommission bei der Ausarbeitung einer Methodik für den Einsatz von modernen Biokraftstoffen zu unterstützen. Derzeit ist der Beitrag moderner und anderer erneuerbarer Kraftstoffe in der EU sehr begrenzt auf Grund der höheren Kosten im Vergleich zu den zu ersetzenden fossilen Brennstoffen. Die Untergruppe zu modernen Biokraftstoffen des Forums für nachhaltigen Verkehr setzte sich zusammen aus 32 Sachverständigen aus der Industrie, die alle Wertschöpfungsketten moderner Biokraftstoffe sowie die Sektoren Luft-, See- und Schwerlastverkehr repräsentiert haben. Als Ergebnis ihrer Arbeit hat die Untergruppe zu modernen Biokraftstoffen eine einfache und transparente Definition für moderne Biokraftstoffe sowie belastbare Ziele für deren Einsatz in der EU bis zum Jahr 2030 vorgeschlagen, den Stand der Technik bezüglich der verschiedenen Wertschöpfungsketten aktualisiert und die Herstellungskosten von modernen Biokraftstoffen sorgfältig geprüft. Die Untergruppe zu modernen Biokraftstoffen hat auch die im Rahmen der Neufassung der Richtlinie zur Förderung der Nutzung von Energie aus erneuerbaren Quellen gemachten Vorschläge zur Dekarbonisierung des Verkehrs sorgfältig geprüft und Verbesserungsvorschläge vorgelegt mit dem Ziel, einen langfristigen und stabilen Rahmens zu schaffen, der Investitionen in Milliardenhöhe ankurbelt. La présente étude vise à soutenir la Commission européenne dans l’élaboration d’une méthodologie pour le déploiement des biocarburants avancés. Actuellement, la contribution des carburants avancés et d’autres carburants renouvelables est très limitée dans l’UE, avec un coût relativement plus élevé que les combustibles fossiles qu’ils visent à remplacer. Le Sous-Groupe sur les Biocarburants Avancés du Forum du Transport Durable se composait de 32 experts représentant toute la chaîne de valeur des biocarburants avancé, ainsi que les secteurs de transports maritime, aérien et des véhicules utilitaires lourds. Le Sous-Groupe sur les Biocarburants Avancés a présenté une définition simple et transparente pour les biocarburants avancés, proposé des objectifs fiables pour le déploiement des biocarburants avancés sur le marché de l’UE d’ici à 2030, mis à jour le statut de la technologie statut des différentes chaînes de valeur et examiné de manière approfondie les coûts de production des biocarburants avancés.

EUROPEAN COMMISSION
Le Sous-Groupe sur les Biocarburants Avancés a également soigneusement examiné les propositions relatives à la décarbonisation du secteur des transports dans le cadre de la refonte de la Directive sur les Energies Renouvelables et a présenté des propositions d’améliorations visant à créer un cadre stable à long terme pour encourager des investissements de plusieurs milliards d’euros.

8

9
Sub Group on Advanced Biofuels
Positions, Recommendations and Key Messages from the Industry
Final Report
Building up the future
Date: 10 March 2017 Disclaimer
This document on "Positions & Recommendations – Final Report" has been drafted by the Core Team of the Sub Group of Advanced Biofuels (SGAB) of the Sustainable Transport Forum (STF). The stakeholders who contributed to this study shared the aim of establishing a constructive and transparent exchange of views on the policy, technical, economic and environmental issues associated with the development and deployment of advanced biofuels. The objective was to evaluate the boundaries under which advanced biofuels can contribute to mitigating carbon emissions from transport. Each stakeholder contributed knowledge and vision of these issues. The information and conclusions in this report represent these contributions, but should not be treated as binding on the companies and organisations involved. The positions and recommendations listed hereafter do not necessarily reflect the official position either of the Commission or of the Organizations represented by the SGAB Members; nor they are recommended by the Commission or of the Organizations represented by the SGAB Members. The Commission does not guarantee the accuracy of the status included in this report and by no means should they be considered as official recommendations. Neither the Commission nor any person acting on the Commission’s, or the Organizations represented by the SGAB Members' behalf may be held responsible for the use which may be made of the information contained herein. The individuals concerned have offered their views in a personal capacity.

10
Contents
Abstract ...................................................................................................................................... 6
Disclaimer ................................................................................................................................... 9
Contents ................................................................................................................................... 10
Table of Figures ........................................................................................................................ 14
List of Tables ............................................................................................................................ 15
Executive Summary .................................................................................................................. 16
Mandate the Sub Group on Advanced Biofuels ..................................................................... 16
European Biofuels Experience ............................................................................................... 17
Conclusions and Recommendations from the SGAB ............................................................. 17
The “Winter Package” and Biofuels ....................................................................................... 19
The Renewable and Advanced biofuels industry ................................................................... 20
Preamble .................................................................................................................................. 21
Structure ................................................................................................................................ 21
Setting the scene ................................................................................................................... 24
SECTION I: Building up the future ............................................................................................ 26
I.1 Key Messages from the Industry .......................................................................................... 26
I.1.1 Definitions ...................................................................................................................... 26
I.1.2 Contributions to 2030 ..................................................................................................... 27
I.1.3 Necessary policy framework .......................................................................................... 27
I.2. Strategic Positions & Recommendations ............................................................................ 28
I. 2.1 Overarching SGAB Working Basis ................................................................................ 28
I.2.2 What the Industry can deliver by 2030 ........................................................................... 29
I.2.3 SGAB's Contributions to the EU Energy and Climate change policies: .......................... 33
Key Messages ....................................................................................................................... 33
Background ....................................................................................................................... 34
The build-up of production volume ..................................................................................... 35
Number of plants, investments ........................................................................................... 39
I.2.4 Decarbonising transport: A Bird's eye view on the EU policies ....................................... 40
Key Messages ....................................................................................................................... 40
Take away SGAB concerns, the six "What Ifs" ...................................................................... 41
The Policy background: Bird's eye view: where we have to go .......................................... 42
The EU Emissions Trading Scheme (ETS) ........................................................................ 44

11
The Policy background: Bird's eye view: where are we now? ............................................ 45
The Policy background: Bird's eye view: Are we on the right path? ....................................... 49
The REDII Proposal ........................................................................................................... 49
Translating the REDII proposal in actual market and technology terms ............................. 51
Translating the REDII proposal in climate change targets and assessing their compatibility with wider EU policies ........................................................................................................ 53
The SGAB's concerns ........................................................................................................ 55
I.2.5 Resource availability ...................................................................................................... 56
Setting the scene ................................................................................................................... 56
Biomass Availability ............................................................................................................... 57
Key Messages ....................................................................................................................... 57
Background ....................................................................................................................... 57
Abandoned Agricultural land .............................................................................................. 61
Salty, semi-arid and dry areas ........................................................................................... 62
I.2.6 Aviation and Heavy duty transport ................................................................................. 64
Key Messages ....................................................................................................................... 64
Aviation .............................................................................................................................. 64
Heavy Duty Transport ........................................................................................................ 65
Background ....................................................................................................................... 65
Aviation's Concerns on blending mandate ......................................................................... 67
I.2.7 The lignocellulosic ethanol market wall .......................................................................... 69
Key Messages ....................................................................................................................... 69
Background ....................................................................................................................... 69
I.2.8 Linking definitions with technology status, time to market and fossil fuel blends ............ 71
I.3. Technology Status and Reliability of the value chains ......................................................... 78
I.3.1 Technology Status ......................................................................................................... 78
Key Messages ....................................................................................................................... 78
Background ....................................................................................................................... 78
I.3.2 Biofuels and future availability of RES-H2 ...................................................................... 80
Key Messages ....................................................................................................................... 80
Background ....................................................................................................................... 80
Gasification-based biofuels ................................................................................................ 81
Hydrogenation of HVO, FPO and HTL liquids .................................................................... 83

12
Upgrading of biogas ........................................................................................................... 84
Policy perspectives ............................................................................................................ 84
I.3.3 Mutual synergies of a 1G/2G plant co-location ............................................................... 85
Key Messages ....................................................................................................................... 85
Background ....................................................................................................................... 85
I.4. COSTS OF BIOFUELS ....................................................................................................... 87
Take away Messages ............................................................................................................ 87
Data ................................................................................................................................... 89
Methodology ...................................................................................................................... 90
I.5. NECESSITY FOR AN EU MARKET FOR BIOFUELS ......................................................... 91
SECTION II: WEAK POLICIES OF THE PAST ......................................................................... 93
II.1. Obstacles to achieve an internal market for transportation fuels with bio-components (compartmentalisation of the EU biofuels market) ..................................................................... 93
Key Messages ....................................................................................................................... 93
Background ....................................................................................................................... 93
II.2. NER 300-Initiative and Status of the Selected Bioenergy Projects ..................................... 96
Key Messages ....................................................................................................................... 96
Background ....................................................................................................................... 96
RECOMMENDATIONS FOR FUTURE SIMILAR INITIATIVES ................................................. 98
4. Overview of Renewable Fuels, Biofuels Mandates and Regulations ..................................... 99
Key Messages ....................................................................................................................... 99
Background ..................................................................................................................... 100
RECOMMENDATIONS ........................................................................................................... 101
SECTION III: BACKGROUND & SUPPORTING DATA .......................................................... 102
III.1. Public Consultation REDII - Response Report ................................................................ 102
Key Messages ..................................................................................................................... 102
Background ..................................................................................................................... 104
The Renewable Energy in Transport section consisted of 3 questions: ............................ 104
III.2. Response to the Low Carbon Fuels 2030 Questionnaire ................................................ 107
Key Messages ..................................................................................................................... 107
Background ..................................................................................................................... 107
III.3. The Current Situation in Transport Fuels......................................................................... 108
Take away Messages .......................................................................................................... 108

13
Background ..................................................................................................................... 109
The Use of Fossil Fuels and Renewable Fuels in Transport ............................................ 109
III.4. International Airlines Group on Sustainable Aviation Fuel ............................................... 116
International Civil Aviation Organization (ICAO) ................................................................... 117
III.5 ED95 as a solution for decarbonising Heavy Duty Transport ........................................... 119
ANNEX I: SGAB Members & Observers ................................................................................. 120
Members of the Sub-Group on Advanced Biofuels .............................................................. 120
SGAB Observers of Sustainable Transport Forum .............................................................. 121
ANNEX II: SGAB Deliverables ................................................................................................ 122
1. Minutes of Meetings ......................................................................................................... 122
2.Reports ............................................................................................................................. 122
3.Memos .............................................................................................................................. 123
ANNEX III: Extracts from Memos ............................................................................................ 124
AIII.1. Terminology and Glossary ............................................................................................ 124
AIII.2. References and Reports ............................................................................................... 125
AIII.3 On NER 300 .................................................................................................................. 126
AIII.3.1 Experiences from a NER300 Contractor ..................................................................... 126
AIII.3.2. Remarks and experiences in advanced biofuels area ................................................ 128
AIII.4. State aid rules and industrial investments in the innovation chain ................................. 130
14
Table of Figures
Figure 1: Final Energy demand in transport by fuel type and share ........................................... 35 Figure 2: The volume build-up, for the “Base” scenario. Absolute quantities (i.e. no double-counting). .................................................................................................................................. 36 Figure 3: The volume build-up, for the “Progressive” scenario. Absolute quantities (i.e. no double-counting). ...................................................................................................................... 37 Figure 4: GHG savings quantity and relative saving for the “Base” and "Progressive" scenario 38 Figure 5: Decoupling GHG emissions from Gross Domestic Product ........................................ 45 Figure 6: Greenhouse gas emission trends, projections and targets in the EU.......................... 46 Figure 7: Evolution of GHG emissions by sector (1990=100), EU ............................................. 47 Figure 8: Freight transport in the EU ......................................................................................... 47 Figure 9: Evolution of CO2 emissions (Mt) by sector................................................................. 48 Figure 10: RED II proposed structure of caps and minimum shares for the various fuels .......... 50 Figure 11: Projections of GHG reduction potential between 2020 and 2050. ............................ 54 Figure 12: RED II modest proposal to 2030 and the enormous effort needed post 2030 if the EU policy targets are going to be met. ............................................................................................ 54 Figure 13: Where we are, where we will be by 2030 and where we have to reach by 2050. ..... 55 Figure 14: Utilised Agricultural Area (UAA = SAU, Superficie Agricola Utilizzata) reduction in DE, ES, FR, IT between 1974-2010. ................................................................................................ 61 Figure 15: Utilised Agricultural Area (UAA = SAU, Superficie Agricola Utilizzata) change in DE, ES, FR, IT between 1990-2010. ................................................................................................ 62 Figure 16: Simplified diagram indicating the flexibility of technology innovation in converting biomass and waste streams into high value products ............................................................... 71 Figure 17: The principle of external hydrogen enhancement ..................................................... 83 Figure 18: Summary of production cost..................................................................................... 89 Figure 19: Distribution of the respondents’ rating to Q28 on transport policy objective. ........... 105 Figure 20: Distribution of the respondents’ rating to Q30 on effective means. ......................... 106 Figure 21: World consumption of transport fuel 2012. ............................................................. 110 Figure 22: The share of transport modes in global transport energy consumption. Total 2,596 Mtoe. ...................................................................................................................................... 111 Figure 23: The geographical variation in energy consumption 20122, by mode and by region. ............................................................................................................................................... 111 Figure 24: The EU28 consumption of transport fuel 2014. ...................................................... 112 Figure 25: The share of renewable transport fuels in the EU/EIA countries. ............................ 113 Figure 26: The development of fuel consumption per transport mode to 2050. ....................... 114 Figure 27: The development of fuel consumption to 2050. ...................................................... 115

15
List of Tables
Table 1. The status and technical readiness for various types of fuels ...................................... 31 Table 2. EU-28 Vehicle stock in 2014 compared to main trading partners ................................ 48 Table 3. Resource estimate and potential biofuel production (EU context). ............................... 59 Table 4. Resource estimate and potential biofuel production (Global context). ......................... 60 Table 5. Salty, semi-arid and dry areas in Southern Europe ..................................................... 63 Table 6. Classification of Bio, Low carbon fossil, e- & Hydrogen Transport Fuels .....................72 Table 7. Petrol/Diesel/Kerosene blends with biofuels and time to market deployment...............75 Table 8. Summary of Biofuels Production Costs……………..……………………………………...87
16
Executive Summary
Mandate the Sub Group on Advanced Biofuels The Sub Group on Advanced Biofuels (SGAB)1 was created on the recommendation of the Sustainable Transport Forum (STF) as a consultative group. Its mandate is to develop appropriate strategies and recommendations which could facilitate the deployment and use of advanced biofuels in the EU, and to provide inputs on other relevant policies related to energy and climate change. These views, summarised in this report2, will contribute to thinking during the comprehensive revision of the Renewable Energy Directive, currently in progress. The 2030 Climate and Energy package3 calls for significant measures for decarbonizing transport, EU targets of 20% GHG reduction in transports in 2030 relative to the emissions 2008 and 60% reduction in 2050, relative to the emissions from transport in 1990. The EC Summer package proposed high Non-ETS4 GHG reduction up to 40% to some MS, where transport is having a major share of emissions5. Strong policies to achieve these targets are needed. On 30 November 2016 the European Commission issued the Winter Package6 which included a comprehensive revision of the Renewable Energy Directive, COM(2016) 767 final, (RED II)7. The Renewable and Advanced biofuels industry is the only player in the EU that can ensure the deployment of sustainable fuels for decarbonising the transport sector. This industry is ready to make a commitment towards the EU and its citizens for the 2030 energy and climate change targets of the European Union. While this industry is the key developer of innovative technologies and responsible for bringing them from the lab scale to market deployment it is also at the same time the main investor that can build these state-of-the art plants and whereby the EU can achieve significant GHG reductions in transport.
1 The SGAB consists of 34 experts and 16 observers. They were selected to provide a range of informed views from technology providers involved in developing advanced biofuel value chains which are close to deployment, as well as representatives from the oil sector, each transport sector, the research community, think tanks, an NGO and key consultants. The members are listed in Annex 1 of the report. 2 In addition to this Final Report, the SGAB produced a number of reports memos and presentations which have been uploaded on a dedicated SGAB Interest Group on the Communication and Information Resource Centre for Administrations, Businesses and Citizens (CIRCABC). 3 A policy framework for climate and energy in the period from 2020 to 2030, COM(2014) 15 4 The Commission proposed a reduction target for domestic GHG emissions of 40% compared to 1990, to be shared between the ETS and non-ETS sectors, as the centre piece of the EU's energy and climate policy for 2030.The collective effort for the non-ETS sector must also be allocated among the individual Member States in an appropriate and timely way. The attribution is made on the basis of relative wealth using GDP per capita which resulted in a wide spread of obligations ranging from a 20% reduction to a 20% increase in emissions. 5 A European Strategy for Low-Emission Mobility, COM(2016) 501 final 6 https://ec.europa.eu/energy/en/news/commission-proposes-new-rules-consumer-centred-clean-energy-transition 7 http://ec.europa.eu/energy/sites/ener/files/documents/1_en_act_part1_v7_1.pdf
17
European Biofuels Experience The European experience of biofuels has been difficult. While European technology developers and fuel producers were leading players, market developments have been affected by the policy uncertainty and changes in direction at both EU and member state levels. Since 2003 the EU legislation on biofuels has changed twice substantially, and become more complex. While there was significant investment in production capacity to produce both biodiesel and bioethanol to fulfil the biofuels mandates embodied in the Biofuels Directive and RED, much of the capacity is under-deployed. In addition to these changes in priorities, the different provisions for implementing the biofuels requirements of the RED in the Member States have caused difficulties as market operators are confronted with many different rules in Member States, and therefore are operating in a fragmented market. For small-and medium-size fuel suppliers, in particular, the barriers created by these different regulations mean that, despite the single EU market for road fuel and vehicles no such single market exists for biofuels. There is currently no clear long term market framework for advanced biofuels over the 15-20-year time horizon which is needed to provide security to potential investors. While there has been strong support for research and development activities from both the EC and within member states, support for demonstration and early commercialisation projects has been less successful. In particular, the NER 300 programme has failed in its efforts to support large scale advanced biofuels facilities. This situation can be contrasted with that in the US where clear market arrangements for advanced biofuels are provided by the Renewable Fuels Standard8, and combined with support for deployment of large scale production facilities facilitated by loan guarantee programmes.
Conclusions and Recommendations from the SGAB
The advanced fuels industry can contribute between 7.2% and 10.7% of total EU transport energy needs by 2030. Sustainable biofuels derived roughly equally from lignocellulosic feedstocks and hydrogenated lipid fuels can provide between 6 and 9%; in addition, e-Fuels can contribute between 0.5% and 0.7% and low carbon fossil fuels between 0.7% and 1.0% of transport fuel needs by 2030.
However, such a contribution can only be delivered if an appropriate policy framework is in place which creates the conditions which enable the substantial investments required to develop, demonstrate and deploy the technologies.
The main elements of the necessary framework are:
8 Renewable Fuel Standard Program, https://www.epa.gov/renewable-fuel-standard-program

18
A stable policy framework between 2020 and 2030, and which also gives a planning horizon sufficiently beyond 2030 for those who will invest in this decade.
Mandatory obligations for deployment of sustainable low carbon fuels for 2030
placed on EU suppliers of transport fuels.
Separate obligations should be established for advanced biofuels, e-fuels and low carbon fossil fuels, given the different level of maturity of the technologies. This is preferred instead of the current “double counting” system.
Obligations should be based on the lower end of the potential contribution
from the various sustainable fuels above, with a review and potential revision scheduled for 2025. Subject to achieved and planned progress the targets should be extended or revised upwards up to 2035 to provide continuity for investments.
Appropriate and dedicated financial mechanisms and instruments need to be
developed for the advanced fuels above to facilitate technology development and market deployment.
Coherent regulations for implementation of these measures and strict oversight
by the European Commission is necessary to foster a truly European industry and to avoid a malfunctioning market situation and trade barriers among the Member States.
Crop based biofuels should not be phased out from 2020 as currently planned. The current maximum level of “food-based” biofuels (7% of transport fuel needs) should be continued until at least 2030 but should be subject to stringent sustainability requirements including minimum levels of green-house gas savings. This is because:
o The current production already contributes to substantial greenhouse gas
reductions, to the agricultural economy, to the diversification of the EU supply of energy in transport and to fuel diversity on the market.
o The present consumption of crop material for biofuels does not affect the
food supply and this will remain unchanged for the period considered. o Such a significant policy change as the early phase out of food-based
biofuels will increase investors’ concerns about policy uncertainty and so inhibit investment also in advanced biofuels and other renewable fuels. Investors will fear that as early as 2025 and possibly post 2030 the EU

19
might phase out advanced biofuels before they can have their return on investment. This is very serious and critical issue of trust and political risk for the biofuel industry as a whole.
A conservative estimate indicates a combination of “food based biofuels”,
advanced biofuels, e-fuels and low-carbon fossil fuels at the recommended levels could provide 12-15% of the total energy used in transports in the EU and lead GHG saving of some 85-110 million tons of CO2, or 7-9% of the total GHG emissions from the total transport sector by 2030.
On the basis of reliable publications, the SGAB has judged that there are
sufficient quantities of biomass, waste streams, process by-products and residues to meet the proposed 2030 targets without any adverse effects on the environment or other economic sectors.
The “Winter Package” and Biofuels On November 30, 2016, the European Commission issued the Winter Package which included a comprehensive revision of the RED9 (RED II) which includes provisions for the biofuels sector for the period 2020-2030. SGAB welcome the fact that several of its recommendations have been included in the RED II proposals. These include fixed mandate on market operators for advanced renewable fuels, with subcategories. However, there are a number of aspects of the proposals which fall short of what is required. These include:
A long-term stable policy compatible with the investment horizon in terms of sustainability, competitiveness and innovation need to be more strongly established in order to ensure investor confidence.
The level of the mandates need to be improved to approach as a minimum the 7.2% of advanced renewable fuels under the SGAB base scenario with scope to increase this to the 10.7% in SGAB progressive scenario based on a review in 2025.
Since the compliance of market operators with the mandates is critical, a pan-EU certificate trading system should be developed along with a dissuasive penalty for non-compliance should also be enforced.
A proper functioning of the internal market also for advanced renewable fuels must be ensured, preferably through a directly applicable Regulation.
9 Renewable energy directive, 2009/28/EC
20
A clear plan and mechanism for dedicated investment support for advanced renewable fuels production plants and for targeted support for R&D and Innovation needs to be clearly spelled out.
A dedicated support mechanism to introduce Advanced Biofuels in Aviation needs to be developed.
A flexible and open approach which allows new value chains and fuels to enter the mandated targets should be included.
Arrangements need to be improved basing qualification of biofuels on a comparison of the “well-to-wheel” green-house gas savings, air quality and technical performance with those of the fossil fuel(s) it replaces in the transport mode considered.
The Renewable and Advanced biofuels industry The Renewable and Advanced biofuels industry is the only player in the EU that can ensure the deployment of sustainable fuels for decarbonising the transport sector. This industry is ready to make a commitment towards the EU and its citizens for the 2030 energy and climate change targets of the European Union. While the industry is the key developer of innovative technologies and responsible to bringing them from the lab scale to market deployment, at the same time is the main investor that can build these state-of-the-art plants and achieve significant GHG reductions in transport. Without the active involvement of the Renewable and Advanced biofuels industry at all levels, the EU will fail to achieve its climate change commitments in decarbonising transport.

21
Preamble
Structure
The Sub Group on Advanced Biofuels (SGAB) was created on recommendation of the Sustainable Transport Forum (STF) as a consultative group. The mandate of the SGAB was specified in the "Terms of Reference for a sub-group on advanced biofuels to be established under the Sustainable Transport Forum": "The sub-group on Advanced Biofuels shall assist the STF in recommending appropriate strategies for advancing the implementation of the said Directive, notably through issuing recommendations aimed at facilitating the deployment and use of alternative fuels at EU level. The latter can, additionally, provide inputs for other relevant policies related to energy and climate change." Based on the Terms of Reference of the SGAB, discussions on sustainability issues and GHG emissions of the various value chains and biofuels were out of scope as these are defined by legislation. The focus of the SGAB was on issuing recommendations aimed at facilitating the deployment and use of alternative fuels at EU level. The SGAB consists of 34 Experts, 16 Observers and the Core Team being the Chair, the Vice-Chair and 3 Reviewers. The Chair was a jointly nominated by DG MOVE and DG ENER. The Vice Chair was selected by the Commission in view of his Membership in STF and SGAB as well as the European Biofuels Technology Platform (EBTP). The Reviewers were selected by DG ENER to support the Chair and Vice Chair. The procedures for the selection of the Experts were based on guidelines from STF. 34 Experts were invited to be Members of the SGAB. These were selected in view of coverage of technology providers of value chains close to deployment, the oil sector, all transport sectors, representatives from the research community, think tanks, an NGO and key consultants. All Members of the STF could become Observers in the SGAB. 16 STF Members have joined the SGAB as Observers. Few organisations are both Members in the STF and SGAB.
The positions and recommendations hereafter in this report are those of the Members of the SGAB acting as independents and do not necessarily reflect the official position either of their Organizations or of the Commission.

22
The SGAB, in addition to this Final Report, produced 5 Reports by the Core Team, 19 Memos and 1 report by the Members, Observers or Reviewers as well as detailed minutes of the meetings and 7 presentations from Members, Observers or Reviewers and suggested Guests. These have been uploaded on a dedicated SGAB Interest Group on the Communication and Information Resource Centre for Administrations, Businesses and Citizens (CIRCABC). The Members and Observers of the SGAB are listed in Annex I while Annex II lists the SGAB deliverables.
The Report consists of three sections.
Section I: The Industry recommends a way forward with concrete targets and steps to be undertaken by the decision makers aiming to achieve a significant degree of decarbonisation (i.e. the reduction of GHG emissions by substituting fossil carbon-bearing fuels, but the fuels substituting these still contain carbon) in transport in the EU by 2030. Finally, the REDII proposal of the European Commission's Winter Package is analysed and compared to the EU policy targets. Section I is the main SGAB report.
Section II: The industry highlights the failures of the existing policy, financial mechanisms and overall situation in stimulating the creation of an advanced biofuel industry, hoping that the decision makers will improve the new policies for the post 2020 period.
The topic of "biofuels" in general, and "advanced biofuels" in particular, is very complex and has become controversial often based on positions not always supported by facts, figures and scientific analysis. The SGAB decided that drafting a full report addressing all issues might be counterproductive and just another report added on the pile of those already existing (see SGAB Report "List of important references and reports"). Therefore, it was agreed within the SGAB that its final report to the Sustainable Transport Forum and the European Commission will consist of Strategic Positions, Recommendations & Key Messages as well as analyses of the key barriers that have, and still do, hindered the development and deployment of Advanced Biofuels, i.e. Section I of this report. The Final Report hereinafter is based significantly on key take away messages from the various SGAB reports and memos in Section II and III in support of Section I. The Final Report is thus representing the best understanding of the experts involved about what the advanced biofuels industry would like to see in EU policy and market development.

23
Section III: Provides background data either in support for Section I or to show that the design of the current policies was not appropriate in delivering the expected impact. However, it should be noted that the Memos in Sections II and III do not necessarily represent the position of all Members of the SGAB, but of its majority.

24
Setting the scene Transport at present consumes one third of all energy used within the EU and generates one quarter of the greenhouse gas (GHG) emissions. The energy use was increasing up to approximately 2010 but, according to the EU 2016 reference scenario, then was expected to drop and, due to the projected increase in the actual transport work, to level out from the period 2020-2030 at around 350 Mtoe (million tons of oil equivalents) in all transport modes, associated with a drop in the sector GHG emissions of 10%. However, other sectors have reduced both their energy consumption and use of fossil fuels significantly more. Hence, the GHG emissions from transport are expected to constitute a larger share of the overall EU GHG emissions, up to over 40% in 2050, thereby also becoming the dominant sector in terms of GHG emissions. To counteract this projection, the use of low GHG emission fuels and energy sources (biofuels and others, RE electricity) must increase significantly during the coming period. While e-mobility has a high potential long-term, due to the vehicle change-out rate, and also limited substitution possibilities in certain transport sectors (heavy duty, aviation), liquid fuels will remain the dominating fuel source for the decades to come. The development of e-mobility has also been slower than anticipated linked to cost, vehicle availability and a lack of infrastructure. After the turn of the century, polices were enacted by the European Union to counteract the growth in energy use and GHG emissions from the transport sector, targeting both the vehicle efficiency and the fuels used. In 2003, the Biofuel directive (2003/30/EC) set an energy target of 5.7% biofuels in land transport for 2010, resulting in that 4.7% was reached in that year. There was only an implicit relation between biofuels (of any kind) and a high GHG reduction. The biofuels in use (biodiesel, ethanol and some HVO) were mainly based on food crop feedstock’s, and sometimes associated with undesirable impacts on land use, and furthermore, imports were significant. This initiated a debate on the efficiency and value of biofuels as a climate change mitigation instrument. The Renewable Energy Directive (RED, 2009/28/EC) adopted in 2009 set a target of 10% on an energy basis of the EU (land-based) transport in 2020. This should come from renewable sources (biofuels, RE electricity etc.), but also required a verifiable GHG reduction of at least 35% initially, to be increased by 2018 to 60% for new installations. Still, the debate on the impact of expanding biofuels continued, resulting in that in 2015 the ILUC directive (2015/1513/EC), amending the RED directive, the 10% target was modified. Food- and crop-based biofuels were capped to 7%, while also introducing “advanced biofuels”, derived from industrial, forestry and agricultural wastes, associated with a target of 0.5%. Advanced biofuels and e-mobility were further supported by (energy-wise) being counted twice (“double-counting”) or more, respectively, towards the national targets. The 2014 fulfilment of the RED target was only 5.9% (approx. 14 Mtoe), and the bulk of this quantity is still from food- and crop-based biofuels, but where the actual usage of the EU installed capacity is only between 50% and 70% for biodiesel and ethanol, respectively.

25
Advanced biofuels are very predominantly FAME and HVO from waste biogenic fats and oils while others have not yet come into production on a significant scale or are used for purposes other than transport fuel (Combined Heat and Power - CHP) like the greater part of biomethane.

26
SECTION I: Building up the future
I.1 Key Messages from the Industry
I.1.1 Definitions The SGAB, after several discussions and deliberations, puts forward the definitions listed below on the basis that they represent the most reasonable and simple working principles while adhering the EU legislation in force.
Advanced Biofuels are those produced from biomass1 other than food/feed crops while meeting the EU sustainability regime2 under the legislation in force3. 1 Biomass as defined under RED or any amendment to it. 2 Sustainability regime as defined under EU Legislation 3 Existing legislation in force at the time of consideration.
Advanced Renewable Fuels are advanced biofuels, and, liquid and gaseous fuels produced from renewable intermediates or renewable process by-products (H2, CO, CO2 etc.).
Low Carbon Fossil Fuels are liquid and gaseous fuels produced by the conversion of exhaust or waste streams of fossil fuel industrial applications via catalytic, chemical, biological or biochemical processes.
e-Fuels are Advanced Renewable Fuels produced from renewable electricity via electrolysis.

27
I.1.2 Contributions to 2030
I.1.3 Necessary policy framework
The advanced biofuels industry can contribute between 6% and 9% of total EU transport energy needs by 2030 from sustainable biofuels. Both lignocellulosic and hydrogenated lipid fuels will contribute equally to these target levels; i.e. 3% or 4.5% each. e-Fuels can in addition, contribute between 0.5% and 0.7% by 2030 Fuels produced from Low Carbon Fossil Fuels can further contribute between 0.7% and 1.0% by 2030.
The above-mentioned contributions can only be achieved if:
• There is a stable EU policy framework between 2020 and 2030, which also gives a planning horizon sufficiently beyond 2030 for those who will invest in this decade.
• Mandatory targets are fixed based on the lower contribution of the various
sustainable fuels above with a revision in 2025. Subject to achieved and planned progress the targets should be extended or revised upwards up to 2035 to provide continuity for investments.
• Appropriate and dedicated financial mechanisms and instruments need to be
developed for the advanced fuels defined above to facilitate technology development and market deployment.
• The compartmentalisation of the EU biofuels market has led to a
malfunctioning market situation and trade barriers among the Member States. A truly European industry can only be achieved if more coherent regulations and strict oversight by the European Commission concerning their implementation is developed, in line with the ambitions of the Energy Union.

28
I.2. Strategic Positions & Recommendations
I. 2.1 Overarching SGAB Working Basis These Strategic Positions & Recommendations are valid and make sense only if the European Union, its political leaders and its citizens are of the opinion that Advanced Biofuels and Renewable fuels shall play an important role in meeting the EU's climate change targets by making a reasonable contribution by 2030.
The SGAB worked on the basis that the European Commission, the European Parliament and the Member States, thus the European Union, do expect a reasonable contribution of Advanced Biofuels by 2030 in view of the need for these fuels for decarbonizing transport. The SGAB cautions that unless its recommendations are taken on board by the legislature, advanced biofuels and renewable fuels will not make a reasonable contribution by 2030 and that the EU may fall short of its COP21, Paris Agreement

29
I.2.2 What the Industry can deliver by 2030 Given the appropriate policy framework and financing structure the industry can deliver 13.2% of total EU transport needs from sustainable fuels by 2030 in a base scenario and up to 16.7% in a progressive scenario; this is equal to 46 and 58 Mtoe/a of total 345 Mtoe/a by 2030 in EU.
Contribution of Food/feed crop-land based Fuels to the 2030 target in % of total EU energy for transport
Base scenario Progressive scenario Food/feed crop-land based 6.010 Food/feed crop-land based 6.010
Contribution of Advanced Renewable Fuels to the 2030 target
in % of total EU energy for transport Base scenario Progressive scenario
Advanced Biofuels: -Lignocellulosic & other biofuels -Lipid-based biofuels
3.0 3.0
Advanced Biofuels:-Lignocellulosic and other biofuels -Lipid-based biofuels
4.5 4.5
e-fuels 0.5 e-fuels 0.7
Total 6.5 Total 9.7
Contribution of CCU / Low Carbon Fossil Fuels to the 2030 target
in % of total EU energy for transport Base scenario Progressive scenario
Low Carbon Fossil Fuels (CCU) 0.7 Low Carbon Fossil Fuels (CCU) 1.0
Contribution of all Fuels to the 2030 target
in % of total EU energy for transport Base scenario Progressive scenario Type % Type %
Food/feed crop-land based 6.0 Food/feed crop-land based 6.0
Advanced Renewable Fuels 6.5 Advanced Renewable Fuels 9.7
Low Carbon Fossil Fuels (CCU) 0.7 Low Carbon Fossil Fuels (CCU) 1.0
Total 13.2 Total 16.7
10 As defined in the amended RED directive (2009/28/EC) Article 3d, see ILUC directive (2015/1513/EU) Article 2(2)(d). These relate to the RED directive denominator of basically road transport, and hence the 7% are reduced to 6% when changing the denominator to all energy used in transport, which is the basis for the SGAB 2030 targets.

30
The Rationale behind these numbers is:
1. To be economically viable, the expected operational life time of an advanced biofuel plant is 15-20 years.
2. It usually takes on the average 3 years to build and put in commercial operation an advanced biofuels facility. Therefore, and assuming that the REDII will be adopted by end of 2018, no new plant under this legislative regime will come into operation before the end of 2021 (end 2018+3y= end 2021). This also implies that no new plant will be constructed after 2028 (2028+3y= 2030) unless a new policy extending targets beyond 2030 is in place. It follows that any advanced biofuel investment will have a lifetime which continues to at least 2035 and possibly 2040.
3. This implies that the REDII when implemented must provide a stable environment for the new plants that will be constructed until at least 2035, and preferably longer. This should be promoted also by national decarbonisation policies and dedicated measures for transport.
4. Crop based biofuels should not be phased out: a. The diesel replacement advanced biofuels - except HVO - are all still in the
development stage and need at least 5 years’ development before they could be considered as reliable technologies ready for investment and commercialisation. Some of them may need more than 5 years’ development work and their contribution may possibly still insignificant by 2030. If the technology fails due to wrong implementation measures (such as the Risk Sharing Financial Facility (RSFF), NER300 etc. or to policy issues such as a new type of ILUC discussion) the transport decarbonisation target will not be met. Thus, it is too risky to phase out crop based biofuels already by 2030. They should only start to be phased out after 2030. The present consumption of crop material for biofuels does not affect the food supply and this will remain unchanged for the period considered.
b. If the crop based biofuels will be phased out by 2030 or earlier, it will give the wrong signal to the investors of advanced biofuels since they will have the fear that as early as 2025 and possibly post 2030 the EU may phase out advanced biofuels in an eventual revision of RED II or an eventual REDIII before they can have their return on investment. This is very serious and critical issue of trust and political risk for the industry.

31
5. The industry is convinced that new developments and innovation can deliver crop-based biofuels which provide very high GHG reduction, above 70% compared to fossil fuels use, while food security issues in the European context remain respected. If the implementation of such technology improvements and optimisations in the production of crop based biofuels will be restricted it would the GHG objective of decarbonising transport.
6. In case the 7% target of crop based biofuels will not be reached in practice by 2020, it is recommended to use the remaining balance of the 2020 accomplishment (assuming that by 2020 only 6.5% is achieved, then the remaining balance is 0.5%), to fulfil the 7% target with crop-based biofuels of minimum 70% GHG reduction compared to fossil fuels. This will allow 0.5% of very high GHG reduction (above 70%) crop-based biofuels in the EU market.
7. In the table, it is reasonable to add: a. 0.5% and 0.7% respectively in the two scenarios contribution of e-fuels b. 0.7% and 1% respectively in the two scenarios contribution of Low Carbon Fossil
Fuels.
8. It is critical that a "Rainbow" or "Band" type of target is established in RED II which provides technology specific sub targets. A spectrum of technologies needs to be developed and commercialised to meet the targets for 2030 and, especially, to lay the ground for future developments, and these are at different stages of maturity (see Table 1). If there is just a single advanced biofuels category there is a very high risk that the HVO and possibly Low Carbon Fossil Fuels will dominate market deployment to the detriment of the development and deployment of other advanced biofuel value chains such as those from lignocellulosic biomass. If this happens innovation in the EU on advanced lignocellulosic biofuels will stagnate and limit the total volumes of advanced biofuels reaching the market post-2030.
Table 1. The status and technical readiness for various types of fuels
Type Fuel Time to deployment
after REDII, years Commercial Crop based, HVO,
Anaerobic Digestion to Biomethane
0
1st of a kind, ready for commercialisation
Cellulosic ethanol, Methanol, DME Synthetic Biomethane
3
Innovation ready for 1st of a kind Other Lignocellulosic Synthetic fuels
4-8
Advanced innovation stage Pyrolysis oils, Synthetic and Low Carbon Fossil Fuels
5-10
Early innovation stage e-fuels, algae, etc. 5-8

32
The targets in the table above make sense only if a stable and long term REDII is adopted. Otherwise there will be no deployment of innovative technologies, with the exception of hydrogenated fuels. If these targets will not be met by 2030 the decarbonisation targets for 2030 and 2050 (20% reduction relative 2008, 60% reduction relative to 1990, respectively) cannot be met. Other measures like electric cars, energy efficiency, transport system improvements and smart mobility cannot meet these EU targets without renewable transportation fuels.

33
I.2.3 SGAB's Contributions to the EU Energy and Climate change policies:11 This section aims to quantify the targets in the two scenarios on an energy basis, a percentage basis and GHG potential.
Key Messages
11 Extracts from a Memo prepared by Lars Waldheim, Consultant, SGAB Reviewer
1. The SGAB has proposed the relative biofuel targets for 2030: 13.2% for the Base Scenario and 16.7% for the Progressive Scenario (see I.2.2 above) based on total energy in transport, these two figures including both advanced biofuels, low carbon fossil fuels, e-fuels and crop-based fuels.
2. Based on the data in “EU Reference Scenario, 2016 Energy, transport and GHG
emissions. Trends to 2050”, and assuming that the cap of 7% of food-crop based biofuels in land transport introduced in the ILUC directive 2015/1513/EU remains post-2020 and is used to its full allowance, the above targets can be translated to the following absolute quantities of biofuels used in 2030:
approx. 19 Mtoe based on food-crops* 10-15 Mtoe Advanced biofuel, lignocellulosic-based *** 10-15 Mtoe Advanced biofuel, HVO-based *** 2-3 Mtoe Low Carbon Fossil Fuels (CCU)*** 2 Mtoe e-fuels***
3. These quantities in total translate to 12-15% (no double-counting) of the total
energy used in transports in the EU. 4. A conservative estimate indicates a GHG saving of some 85-110 million tons of CO2,
or 7-9% of the total GHG emissions from the total transport sector. The EU decarbonisation target for transport in 2030 is 20% reduction relative to emissions in 2008 or in absolute terms 193 million tons, i.e. the biofuels can contribute to around half of this target whereas other measures must be put in place to fulfil the target. For 2050 the target is 60% reduction relative to 1990 emissions, i.e. another 278 million tons in GHG reduction is required between 2030 and 2050. Thus, despite new technologies and other changes, biofuels will continue to play an important role also long after 2030.
5. An interpolation indicates that approximately 10% renewable fuels will be reached
in 2020, calculated as per the RED directive (2009/28/EC), comparable to the 10% target in the said directive.
2014 Eurostat data indicate the following: 10 Mtoe based on food-crops*, 3 Mtoe based double-counting fuels** & 6%
renewable fuels calculated as per the RED directive (2009/28/EC) * As defined in the amended RED directive (2009/28/EC) Article 3d, see ILUC directive (2015/1513/EU) Article 2(2)(d) ** As defined in Article 21(d) (2009/28/EC) *** As defined SGAB definitions.

34
Background
One of SGAB's main objectives is to give a recommendation on targets for advanced biofuels in 2030. During the discussions two other categories, e-fuels and Low Carbon Fossil Fuels, were defined and targets were developed. To also give an indication of the overall quantities of these fuels required in 2030 to meet such targets and the impact on the GHG emissions from transport, the following estimates were made. In these estimates, it has been assumed that the cap of 7% for food-crop based biofuels, as a percentage of to the final energy used for transport, remains in force unaltered after 2020. However, it is also assumed that the 7% is used to more or less its full quantity. Two sources of numerical data have been used in addition to the SGAB targets. Eurostat data that goes up to 2014. For 2005-2009 this data is in accordance with 2003/30/EC, but from 2010 to 2014, the data is reported according to 2009/28/EC, including e.g. double counting. Since the ILUC directive only came into force in 2015, no official data based on this directive have yet been published. The "EU Reference Scenario, 2016 Energy, transport and GHG emissions. Trends to 205012". This scenario is based on Markal/Simes modelling and covers the period 2000 to 2050. The data covers the total energy use for transport, expected share of electricity, share of renewable electricity in total electricity generated, the share of biofuels, GHG emission from all sectors including transport etc. However, on biofuels (of any nature) this source assumes a constant 6% from 2020-2050, these figures being replaced by the SGAB targets. The most pertinent data can be seen in the Figure 1 below. For the present analysis, only data for the period 2020 to 2030 have been used.
12 EU Reference Scenario, 2016 Energy, transport and GHG emissions. Trends to 2050. DG ENER, July 2016.
The realization of these scenarios requires the installation of 1-2 HVO plants per year between 2020 and 2030, whereas for lignocellulosic biofuels, e-fuels and Low Carbon Fuels, 5-10 plants of each type is required per year in that decade. The food-crop based fuels have already an installed capacity to meet the above quantity, but this is under-utilized today, such that only some cost-effective re-investments are required.

35
Figure 1: Final Energy demand in transport by fuel type and share7
The methodology used for this analysis is described in the Memo that can be found in the CIRCABC.
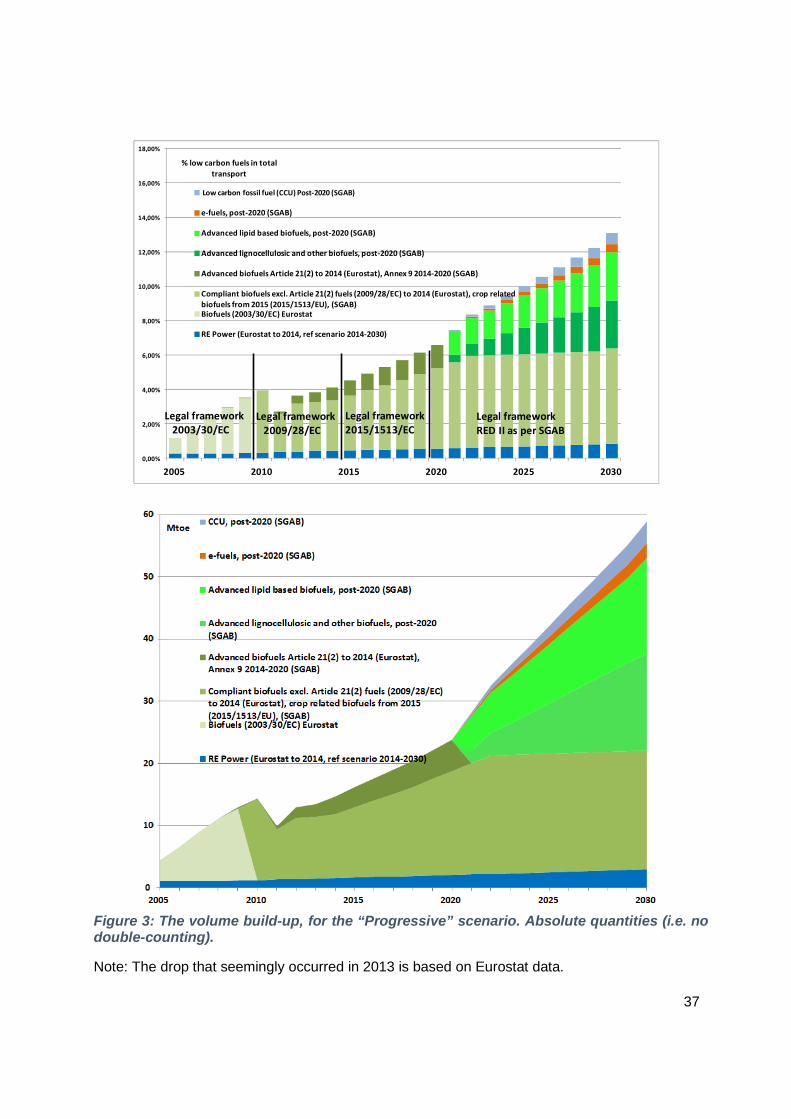
The build-up of production volume The build-up of production volume is shown for the “Base” and “Progressive” scenarios in Figure 2 and Figure 3, respectively. In both cases the use of food-crop-based fuels is assumed to level out at 19 Mtoe, which is slightly below the cap volume allowed. The advanced lignocellulosics, and the advanced HVO both reach 10.3 Mtoe and 15.5 Mtoe, respectively, in the two scenarios. E-fuel provides 1.7 Mtoe and 2.4 Mtoe, respectively in the two scenarios, whereas Low Carbon Fuels provide 2.4 Mtoe to 3.4 Mtoe. The “Base” scenario of renewable energy reaches an overall level of 13% in 2030 (assuming no double-counting), of which less than 1% is renewable power. In the “Progressive” scenario it comes to 16% in 2030, again of with less than 1% of renewable power.

36
Figure 2: The volume build-up, for the “Base” scenario. Absolute quantities (i.e. no double-counting).
Note: The drop that seemingly occurred in 2013 is based on Eurostat data.
0,00%
2,00%
4,00%
6,00%
8,00%
10,00%
12,00%
14,00%
16,00%
18,00%
2005 2010 2015 2020 2025 2030
% low carbon fuels in total transport
CCU, post-2020 (SGAB)
e-fuels, post-2020 (SGAB)
Advanced lipid based biofuels, post-2020 (SGAB)
Advanced lignocellulosic and other biofuels, post-2020 (SGAB)
Advanced biofuels Article 21(2) to 2014 (Eurostat), Annex 9 2014-2020 (SGAB)
Compliant biofuels excl. Article 21(2) fuels (2009/28/EC) to 2014 (Eurostat), crop related biofuels from 2015 (2015/1513/EU), (SGAB)Biofuels (2003/30/EC) Eurostat
RE Power (Eurostat to 2014, ref scenario 2014-2030)
Legal framework2003/30/EC
Legal framework2009/28/EC
Legal frameworkRED II as per SGAB
Legal framework2015/1513/EC
Low carbon fossil fuel (CCU) Post-2020 (SGAB)
37
Figure 3: The volume build-up, for the “Progressive” scenario. Absolute quantities (i.e. no double-counting).
Note: The drop that seemingly occurred in 2013 is based on Eurostat data.
0,00%
2,00%
4,00%
6,00%
8,00%
10,00%
12,00%
14,00%
16,00%
18,00%
2005 2010 2015 2020 2025 2030
% low carbon fuels in total transport
CCU, post-2020 (SGAB)
e-fuels, post-2020 (SGAB)
Advanced lipid based biofuels, post-2020 (SGAB)
Advanced lignocellulosic and other biofuels, post-2020 (SGAB)
Advanced biofuels Article 21(2) to 2014 (Eurostat), Annex 9 2014-2020 (SGAB)
Compliant biofuels excl. Article 21(2) fuels (2009/28/EC) to 2014 (Eurostat), crop related biofuels from 2015 (2015/1513/EU), (SGAB)Biofuels (2003/30/EC) Eurostat
RE Power (Eurostat to 2014, ref scenario 2014-2030)
Legal framework2003/30/EC
Legal framework2009/28/EC
Legal frameworkRED II as per SGAB
Legal framework2015/1513/EC
Low carbon fossil fuel (CCU) Post-2020 (SGAB)

38
Based on the assumptions made here and if the use of RE electric follows the “Reference Scenario” from the Markal/Simes model, the SGAB estimate for 2020 means that the RED/ILUC target of 10% would be reached. This is not related to the SGAB scenarios for 2030; but the assumption made of 5 Mtoe of Annex IX fuels in 2020, used as a starting point for the projections in this work, obviously affects the estimate of the RED target fulfilment. The absolute and relative GHG saving for the two SGAB scenarios from 2017 to 2030 are shown in Figure 413.
Figure 4: GHG savings quantity and relative saving for the “Base” and "Progressive" scenario
The GHG savings, based on the conservative calculation defined in the methodology implies that some 85 million tonnes of emissions can be saved in 2030 for the “Base” and over 110 million tonnes in the “Progressive” scenario, respectively.
In relative terms this is equivalent to 7%, or 9%, of the total GHG emissions from transport, as estimated from the “Reference Scenario” report. The GHG intensity estimated was initially 2.9 ton CO2eq/toe in 2017 but had been reduced to 2.74 and 2.69 ton CO2eq/toe, respectively, in 2030. The EU decarbonisation target for transport in the 2030 package is 20% reduction of GHG emissions in 2030, relative to the emissions from transport in 2008, 967 million tons. The
13 The rest of GHG reduction target of 18-19 % in The European Strategy for Low-Emission Mobility should be met by other measures, mainly by electric cars, energy efficiency and smart mobility etc.
0,0%
1,0%
2,0%
3,0%
4,0%
5,0%
6,0%
7,0%
8,0%
9,0%
10,0%
0,0
20,0
40,0
60,0
80,0
100,0
120,0
2015 2017 2019 2021 2023 2025 2027 2029
CO2 savings in transport, %million tons CO2
CO2 savings from biofuels, e-fuels and low carbon fossil fuels (CCU), Progressive Scenario, Mtons
CO2 savings from biofuels, e-fuels and low carbon fossil fuels (CCU), Realistic Scenario, Mton
CO2 savings in transport from biofuels, e-fuels and low carbon fossil fuels (CCU), Progressive Scenario, %
CO2 savings in transport from biofuels,e-fuels and low carbon fossil fuels (CCU), Realistic Scenario, %
39
target is then in absolute terms 193 million tons, i.e. the biofuels can contribute to around half of this target whereas to obtain target fulfilment, other measures must be put in place to achieve the second half of the reduction. For 2050 the target is 60% reduction relative to the 1990 emissions, i.e. another 278 million tons in GHG reduction is required in addition to what is expected to be achieved in 2030. Thus, despite that new technologies and changes social and infrastructural patterns will deliver most of this reduction, biofuel will continue to play an important role also long after 2030.
Number of plants, investments The current installed European capacity14 of FAME (ca 250 plants) and food-crop based ethanol is 25 Mm3 and 8.5 Mm3 (ca 80 plants), respectively, which translates to an existing potential production capacity of 24 Mtoe, to be compared to the 10 Mtoe of such fuels actually used in 2014, and the 7% cap at approximately 19 Mtoe. Therefore, it has been assumed that the capacity in existing FAME and first generation ethanol plants will be used with few new installations, these being more or less replacements.
HVO plants are either in co-processing with a fossil refinery, up to 0.2 Mtoe units are operated at present in the EU, a few dedicated HVO plants of 0.1-1.0 Mtoe, some of which are stand-alone but some are installed at operating fossil refinery sites. To come from an assumed total capacity (dedicated+ co-processing) of approx. 5 Mtoe HVO production in 2020 to 10-15 Mtoe in 2030 requires the addition of maybe 10-20 plants in a decade to a total fleet of 20-30 installations.
Lignocellulosic biofuels plants typically have a capacity around 0.05 Mtoe or less for cellulosic ethanol in the first installations, while gasification plant capacity for the production of advanced biofuels is projected to be in a range of 0.1-0.3 Mtoe. Assuming an average size of 0.15 Mtoe/a production capacity in the future 60 to 100 installations would be required to be in operation when approaching 2030, i.e. 6-10 plants have to be constructed each year over the decade 2030-2030.
Plant size for e-fuels and Low Carbon Fuels are expected to be smaller so some tens of plants for each application would be installed to 2030.
14 See SGAB memo “The Current Situation in Transport Fuels”

40
I.2.4 Decarbonising transport: A Bird's eye view on the EU policies
Key Messages
The EU has managed to decouple GDP growth from GHG emissions.
The EU is well on track to achieve its GHG emission reduction target of a 20%
decrease compared with 1990 levels by 2020.
The policies and measures currently accounted for in national projections will not be sufficient to deliver the savings needed to achieve the EU’s reduction target of at least 40% by 2030 (compared with 1990 levels).
Even if the 2030 target is achieved, a faster pace of emission reductions will be required if the EU is to reach its long-term (2050) decarbonisation objective - a reduction by 80% to 95% compared with 1990 levels.
Transport emissions are not being reduced by as much as other sectors, targets are 20% reduction relative to 2008 in 2030 and 40% reduction relative to 1990 in 2050, respectively.
Current policies are inadequate and insufficient in achieving the longer-term targets.
Road freight transport is by large the most important indicator of the economic activity in the EU and all scenarios indicate that this will remain the case in future decades.
Emissions in the field of transport decrease at much slower pace than other sectors, and the transport sector becomes the largest source of CO2 emissions after 2030.
E-mobility has high potential to reduce GHG emissions, but it will primarily affect the light-duty vehicles up to 2050 and possibly start from the petrol sector rather than the diesel.
Therefore, liquid fuels will remain in significant quantities also in the decades after 2030 for at least aviation and heavy-duty vehicles.

41
Take away SGAB concerns, the six "What Ifs"
Key Messages Continued:
The RED II proposal has not put forward robust and convincing proposals addressing these shortcomings and basically the same situation as existing at present is projected up to 2030 and 2050.
The RED II proposal does not result to any significant reduction of the oil dependency in the transport sector either.
1. What if the much-hyped future techno-economic visions for car electric batteries do not come about at the foreseen pace, or are found to be unacceptable or too expensive to the driving public?
2. What if the massive investment in the necessary electricity supply and transport infrastructure is insufficient and becomes a bottleneck for the growth of e-mobility?
3. What if we were to find in 2030 that the best advanced biofuels technologies for the heavy duty and aviation markets should have been first developed and introduced in the passenger market, but were set aside?
4. What if the lack of ambition in advanced renewable fuels to 2030 fails to bring forward cost competitive low carbon fuels for the heavy duty vehicle/aviation sector?
5. What if the techno-economic barriers seen today for the diesel type of advanced fuels are not overcome?
6. What if by increasing the GHG minimum contribution from 60% to 70% we end up limiting significantly the volume base (and thus the value chains) of sustainable and renewable fuels? The overall result may be unnecessarily high environmentally performing biofuels but low volumes and, therefore, overall reduced saving of CO2 emissions, undershooting all efforts?

42
The Policy background: Bird's eye view: where we have to go
The European Union has very ambitious targets for combating climate change and it is a global leader on this front. This has been a long-term ambition of the EU.
On 8.3.2011 the European Commission issued the Communication "A Roadmap for moving to a competitive low carbon economy in 2050"15. The Communication was based on the European Council reconfirmation in February 2011 that in order to keep climate change below 2°C the EU must achieve the objective of reducing greenhouse gas emissions by 80%-95% by 2050 compared to 1990. The Communication presented a Roadmap for possible action up to 2050 which could enable the EU to deliver greenhouse gas reductions in line with the 80% to 95% target agreed. It outlined milestones which would show whether the EU is on course for reaching its target, policy challenges, investment needs and opportunities in different sectors, bearing in mind that the 80% to 95% reduction objective in the EU would largely need to be met internally.
On 28.3.2011 the European Commission issued the Communication "White Paper Roadmap to a Single European Transport Area"16 with the target that by mid-century, greenhouse gas emissions from transport will need to be at least 60% lower than in 199017 and be firmly on the path towards zero. The White Paper pointed out that transport in the EU still depended on oil for about 94% of its energy needs, which was much higher than in any other sector and made transport heavily dependent on imports. While the transition to low-emission alternative energy in transport had already begun, it would need to accelerate in the next decade. It was an opportunity for Europe to develop leadership in new products, such as advanced biofuels. Relevant infrastructure needed to be rolled-out.
On 22.1.2014 the European Commission issued the Communication "2030 Climate and Energy" package18 which called for significant measures for decarbonizing transport; EU targets of 20% GHG reduction in transport in 2030 relative to the emissions 2008 and 60% reduction in 2050, relative to the emissions from transport in 1990. The Communication pointed out that EU was then well on track to meet the 2020 targets for greenhouse gas emissions reduction and renewable energy and significant improvements had been made in the intensity of energy use thanks to more efficient buildings, products, industrial processes and vehicles. Greenhouse gas emissions in 2012 decreased by 18% relative to emissions in 1990 and were expected to reduce further to levels 24% and 32% lower than in 1990 by 2020 and 2030 respectively on the basis of existing policies. Against this background, the 2030 policy framework should be based on full implementation of the 20/20/20 targets. Among other it called for an ambitious commitment to reduce greenhouse gas emissions in line with the 2050 roadmaps. Delivery of this commitment should follow a cost-efficient approach which responds to the challenges of 15 A Roadmap for moving to a competitive low carbon economy in 2050, COM(2011) 112 final 16 White Paper: Roadmap to a Single European Transport Area – Towards a competitive and resource efficient transport system, COM (2011) 144 17Note: this percentage is based on the IPCC methodology; meaning a 60% reduction in the transport sector; therefore, only regarding Tank-to-Wheel. Electricity, hydrogen and biofuels are in this method seen as zero emission options 18 A policy framework for climate and energy in the period from 2020 to 2030, COM(2014) 15 final

43
affordability, competitiveness, security of supply and sustainability, and which takes account of current economic and political circumstances. The Commission proposed to set a greenhouse gas emission reduction target for domestic EU emissions of 40% in 2030 relative to emissions in 1990. Appropriate measures by Member States were expected to deliver a 32% reduction relative to emissions in 1990. This would require continued effort but at the same time it showed that the proposed target for 2030 was achievable.
The Commission did not think it appropriate to establish new targets for renewable energy or the greenhouse gas intensity of fuels used in the transport sector or any other sub-sector after 2020. The assessment of how to minimise indirect land-use change emissions resulted in the conclusion that that first-generation biofuels have a limited role in decarbonising the transport sector. The Commission has already indicated, for example, that food-based biofuels should not receive public support after 202019. A range of alternative renewable fuels and a mix of targeted policy measures building on the Transport White Paper are needed to address the challenges of the transport sector in a 2030 perspective and beyond. The focus of policy development should be on improving the efficiency of the transport system, further development and deployment of electric vehicles, second and third generation biofuels and other alternative, sustainable fuels as part of a more holistic and integrated approach.
On 20.07.2016 the Commission issued the Communication on Low-Emission Mobility20 which reaffirmed that transport in the EU still depended on oil for about 94% of its energy needs, which is much higher than in any other sector and makes transport heavily dependent on imports. While the transition to low-emission alternative energy in transport had already begun, it would need to accelerate in the next decade. The Communication pointed out that it is was an opportunity for Europe to develop leadership in new products, such as advanced biofuels and that relevant infrastructure needs to be rolled-out.
On 30.11.2016 the Commission issued the "Winter Package" proposing new rules for consumer centred clean energy transition21. The Package consists of various Communications and revision of Directives including that of the Renewable Energy Directive (RED II). The review of the RES Directive has four main objectives22: (i) Contribute to limiting global average temperature increase to not more than 2°C, in view of achieving 1.5°C in line with the EU’s commitment towards Paris COP 21 objectives; (ii) achieve in a cost effective way a share of at least 27% of RE in the EU by 2030; (iii) make the EU economy more energy secure by reducing its import dependence; (iv) contribute to becoming the world leader in Renewable Energy (RE) and a global hub for developing advanced and competitive RE technologies. Furthermore, the revision points out that due to the existence of specific market failures and barriers, EU level policies are needed to ensure that the at least 27% EU-level binding RE target is collectively met by Member States, and is met in the most cost-effective and least distortive manner.
19 COM(2012) 595 20A European Strategy for Low-Emission Mobility, COM(2016) 501 final, Brussels, 20.7.2016 21 Clean Energy For All Europeans, COM(2016) 860 final http://ec.europa.eu/energy/en/news/commission-proposes-new-rules-consumer-centred-clean-energy-transition 22 Executive Summary of the Impact Assessment, SWD(2016) 419 final, part 1/2

44
The EU Emissions Trading Scheme (ETS) To achieve its future Green House Gas (GHG) emission targets, the EU has adopted sectorial targets and relevant legislation under the ETS, for the following divisions:
Emissions from large point sources, mostly from industrial installations, are covered by the EU ETS23. These represent about 40%-45% of EU GHG emissions and a large proportion of them falls under the power generation sector.
Other activities covered by the EU ETS include cement production, iron and steel production, and oil refining.
Since 2012, the EU ETS covers GHG emissions from aviation24 (EU, 2008). The mitigation of all ETS emissions is being addressed at EU level through a single ETS-wide emission cap and a ‘carbon market’ through which emission allowances can be traded.
GHG emissions not covered by the EU ETS are covered under the Effort Sharing Decision (ESD)25. These emissions are from a more diverse range of sectors or activities such as road transport, energy consumption in buildings, agriculture and waste management. Since 2013, the ESD sets annual targets for each Member State from 2013 until 2020. It is therefore the Member States that are responsible and such efforts are implemented at national level. Member States can use or apply a combination of several EU policies and measures in addition to their national initiatives. GHG emissions and removals from the Land Use, Land-Use Change and Forestry (LULUCF) sector are not covered under either the EU ETS or the ESD. LULUCF activities represent a net reported carbon sink, removing the equivalent of about 7% of the EU’s total GHG emissions every year26. These removals are not taken into account in the EU’s 2020 target under the 2009 climate and energy package. However, in 2016, the European Commission proposed to integrate this sector into the EU 2030 Climate and Energy Framework from 2021 onwards.
In summary, Member States are therefore responsible for reducing emissions covered under only the ESD, while ETS emissions are tackled at EU level.
23 Directive 2009/29/EC of the European Parliament and of the Council of 23 April 2009 amending Directive 2003/87/EC so as to improve and extend the greenhouse gas emission allowance trading scheme of the Community, http://eurlex.europa.eu/LexUriServ/LexUriServ.do?uri=OJ:L:2009:140:0063:0087:en:PDF 24 Directive 2008/101/EC of the European Parliament and of the Council of 19 November 2008 amending Directive 2003/87/EC so as to include aviation activities in the scheme for greenhouse gas emission allowance trading within the Community, http://eurlex.europa.eu/LexUriServ/LexUriServ.do?uri=OJ:L:2009:008:0003:0021:en:PDF 25 Decision No 406/2009/EC of the European Parliament and of the Council of 23 April 2009 on the effort of Member States to reduce their greenhouse gas emissions to meet the Community’s greenhouse gas emission reduction commitments up to 2020, http://eur-lex.europa.eu/LexUriServ/LexUriServ.do?uri=OJ:L:2009:140:0136:0148:EN:PDF 26 Trends and projections in Europe 2016 - Tracking progress towards Europe's climate and energy targets, European Environmental Agency, 2016.

45
The Policy background: Bird's eye view: where are we now? Overall the EU has managed to decouple GDP growth from GHG emissions as Figure 5 shows.
The European Union (EU) is well on track to achieve its greenhouse gas (GHG) emission reduction target of a 20% decrease compared with 1990 levels by 2020. In 2014, GHG emissions were already 23% less than 1990 levels. The latest national projections available from Member States indicate that by 2020, EU GHG emissions will remain well below the 2020 target. Although the 2020 reduction target is expected to be met by a sufficient margin, the policies and measures currently accounted for in national projections will not be sufficient to deliver the savings needed to achieve the EU’s reduction target of at least 40% by 2030 (compared with 1990 levels). The pace of GHG emission reductions is projected to slow down after 2020. A continuation of this pace will not be sufficient to achieve the EU’s target of a 40% reduction by 2030 (compared with 1990 levels).
Figure 5: Decoupling GHG emissions from Gross Domestic Product
According to the European Environmental Agency27 - "Even if the 2030 target is achieved, a faster pace of emission reductions will be required if the EU is to reach its long-term (2050) decarbonisation objective - a reduction of EU GHG emissions by 80 to 95% compared with 1990 levels. Such a reduction can take place only in the context of a major transformation of the 27 Ibid 11 above, Trends and projections in Europe 2016 - Tracking progress towards Europe's climate and energy targets, European Environmental Agency, 2016.
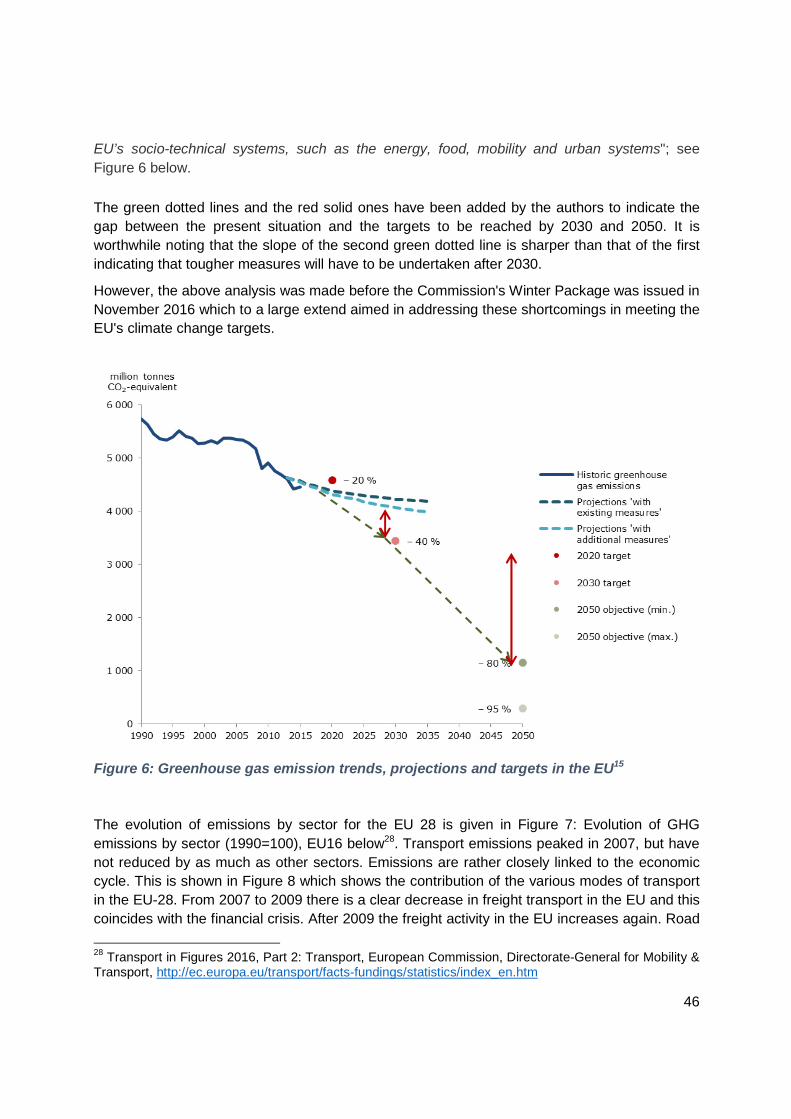
46
EU’s socio-technical systems, such as the energy, food, mobility and urban systems"; see Figure 6 below. The green dotted lines and the red solid ones have been added by the authors to indicate the gap between the present situation and the targets to be reached by 2030 and 2050. It is worthwhile noting that the slope of the second green dotted line is sharper than that of the first indicating that tougher measures will have to be undertaken after 2030.
However, the above analysis was made before the Commission's Winter Package was issued in November 2016 which to a large extend aimed in addressing these shortcomings in meeting the EU's climate change targets.
Figure 6: Greenhouse gas emission trends, projections and targets in the EU15
The evolution of emissions by sector for the EU 28 is given in Figure 7: Evolution of GHG emissions by sector (1990=100), EU16 below28. Transport emissions peaked in 2007, but have not reduced by as much as other sectors. Emissions are rather closely linked to the economic cycle. This is shown in Figure 8 which shows the contribution of the various modes of transport in the EU-28. From 2007 to 2009 there is a clear decrease in freight transport in the EU and this coincides with the financial crisis. After 2009 the freight activity in the EU increases again. Road
28 Transport in Figures 2016, Part 2: Transport, European Commission, Directorate-General for Mobility & Transport, http://ec.europa.eu/transport/facts-fundings/statistics/index_en.htm

47
freight transport is by large the most important contributor to the economic activity in the EU and all scenarios indicate that this will remain the case in future decades.
Figure 7: Evolution of GHG emissions by sector (1990=100), EU16
Figure 8: Freight transport in the EU15
0
200
400
600
800
1000
1200
1400
1600
1800
2000
2200
1995 1996 1997 1998 1999 2000 2001 2002 2003 2004 2005 2006 2007 2008 2009 2010 2011 2012 2013 2014
EU28 Performance by Mode for Freight Transport1995 - 2014
billion tonne-kilometres
Road Sea Rail Inland Waterway Oil Pipeline Air

48
The Table 2 below shows the comparison of the vehicles in the EU and its main trading partners26. It clearly shows that the EU has the highest passenger cars stock and about 3-fold the commercial freight vehicles compared to the USA while the EU has more than a third commercial freight vehicles compared to Japan.
Table 2. EU-28 Vehicle stock in 2014 compared to main trading partners
Vehicle stock in 2014 EU-28 USA Japan China Russia
Passenger cars stock, million
250 240 71 83 41
Motorization, cars / 1000 persons
491 753 561 61 288
Commercial freight
vehicles, million 36 11 6. 21 6
All scenarios indicate that road freight transport will continue increasing in the years ahead and in absence of dedicated action emissions from freight transport would rise considerably by 2030 (by approximately 10% compared to 2010).
Figure 9 shows the results from the PRIMES model scenario up to 2050 that demonstrates a steep decrease in power generation, whereas emissions in the field of transport decrease at much slower pace, and the transport sector becomes the largest source of CO2 emissions after 203029.
Figure 9: Evolution of CO2 emissions (Mt) by sector17
29 EU Reference Scenario 2016, Energy, transport and GHG emissions Trends to 2050, European Commission Directorate General for Energy, https://ec.europa.eu/energy/sites/ener/files/documents/20160712_Summary_Ref_scenario_MAIN_RESULTS%20(2)-web.pdf

49
The Policy background: Bird's eye view: Are we on the right path?
The REDII Proposal With the Winter Package the Commission proposed the revised Renewable Energy Directive (RED II). In order to foster the decarbonisation and energy diversification of the EU transport sector, REDII introduced an obligation on European transport fuel suppliers to provide an increasing share of renewable and low-carbon fuels, including advanced biofuels, renewable transport fuels of non-biological origin (e.g. hydrogen), waste-based fuels and renewable electricity. The level of this obligation is progressively increasing from 1.5% in 2021 (in energy terms) to 6.8% in 2030. While in order to minimize the Indirect Land-Use Change (ILUC) impacts, it introduced a cap on the contribution of food-based biofuels towards the EU renewable energy target.
RED II includes:
A gradual increase of starting from 1.5% in 2021 to 6.8% by 2030 minimum share of energy from advanced biofuels and biomethane produced from feedstock listed in Annex IX, renewable transport fuels on non-biological origin, waste based fossil fuels and renewable electricity.
Within the above share a minimum of 3.6% of advanced biofuels produced from feedstock included in Annex IX part A.
A cap of 1.7% of biofuels produced from organic wastes and residues with mature technologies basically from Annex IX part B.
A cap on the contribution of food-based biofuels starting at 7% in 2021 and going down progressively to 3.8% in 2030.
National databases to ensure traceability of the fuels and mitigate the risk of fraud.
Preferential rules apply to advanced aviation fuels in order to support their deployment in the aviation sector (their energy content is accounted 20% more).
Member States are allowed to support crop based biofuels of low ILUC performance.
An increase of the minimum GHG contribution of advanced biofuels from 60% to 70%.
The above proposed structure of caps and minimum shares are depicted in Figure 10 below.

50
Figure 10: RED II proposed structure of caps and minimum shares for the various fuels30
It is clear from Figure 10 that overall the RED II proposal foresees:
A very modest increase of 2.1% of renewable fuels and biofuels on energy basis between 2021 and 2030.
A significant contribution from cellulosic fuels from Annex IX part A.
A reasonable contribution from RES-e fuels together with waste based fossil fuels
The food-crop based biofuels are not part of the obligation for fuel suppliers to provide renewable low carbon fuels. There is a high risk that due to the lack of such support these conventional fuels will no longer be used. The fact that they will contribute to the overall EU renewable energy target will not be a stimulus to use them, as fuel suppliers are not responsible for reaching that target. So, the EU might end up with a situation that in 2020 between 8.5% and 10% of renewable transport energy was provided by biofuels, and in 2021 this might drop abruptly to only 1.5%31 as the market players might not see opportunities to get the additional costs of conventional biofuels covered. And the market has to start all over again to rebuild the
30 K. Maniatis, “The role of Advanced Biofuels in Decarbonising Transport RED II”, Lignofuels 2017, Helsinki, adapted from an EC package presentation on RED II. 31 1.5%: the contribution of Annex IX Part B advanced biofuels by 2020

51
share to reach 6.8% by 2030. This could have catastrophic consequences for all players as trust to the policy landscape would evaporate.
The following section undertakes an analysis of the above structure of caps and minimum shares and discusses whether the overall REDII proposal meets the needs for decarbonising transport and addresses in a convincing way the climate change policies of the EU.
Translating the REDII proposal in actual market and technology terms The EU fuels market is dependant to diesel type fuels which are used almost exclusively in heavy duty transport, aviation and maritime transport modes (approx. 70%) while petrol has an overall small share (approx. 20%)32.
In Figure 6 the diesel-type fuel is covered by the blue33 and light green areas. Basically, the REDII proposes capping these two areas and decreasing the contribution of crop based biofuels. Overall REDII proposes a reduction of diesel type fuels from about 8.2% on energy basis in 2021 to 5.8% in 2030.
The darker green area addresses lignocellulosic biofuels but so far only ethanol from lignocellulosics has gone through the phase of first commercial plants and is ready for commercialisation. The other technologies that can produce diesel type fuels for heavy duty transport, aviation and maritime transport modes (such as Fischer-Tropsch and Dimethyl Ether) are still further away from the stage of early commercialisation, and they are not expected to reach it before 2025 at the soonest34. The specific investment (capital/product output energy per time unit) for such plants is similar to the specific investment for lignocellulosic ethanol, but plants are larger in capacity because of economy of scale factors. Such technologies therefore require larger investments in absolute terms; compared to those for lignocellulosic ethanol, but the output is also higher.
The yellow area addresses renewable electricity, e-fuels and fuels from fossil waste streams. The latter covers any kind of waste stream from the fossil industry such as plastics and waste flue gases. Generally, they have lower costs to be converted into fuels due to their "waste" nature than the e-fuels; therefore, there is the risk that they would attract the majority of the investments being the low hanging fruits. The RED II does not specify a minimum GHG reduction required for fossil waste streams in order to have a significant GHG reduction potential for EU transport, specific guidelines are indicated to be forthcoming.
32 PRIMES Reference Scenario for the year 2020 33 In the blue area ethanol from sugars and starches is also included but overall this is relative small in relation to FAME biodiesel. 34 No decision for such investments is to be expected before RED II is approved which will take about 2 years after it was proposed, i.e. December of 2018. If a decision to invest is taken on 01/01/2019 it will take about 3 years to permit, built, commission and operate a plant, i.e. 31/12/2021. No second investment is to be expected in the following 2-3 years due to problem shooting and optimisation activities. This has always been the experience with new and complex technologies based on first-of-a-kind-plants; as has been the case with lignocellulosic ethanol.

52
It is also clear that the EU policies rely heavily on abundant and cheap Renewable Energy Sources (RES) electricity; however, every sector of the EU energy system needs and plans to utilise RES electricity:
The power sector in reducing its reliance of coal and lignite.
The transport sector in electrifying transport (in particular for light duty vehicles).
The industry/households/transport in using it when available via batteries
The fossil fuel refineries in converting RES electricity to H2 and use it in the refinery operations to decrease their GHG footprint.
The chemical industry in converting RES electricity to H2 and use it in the production of green chemicals to decrease their GHG footprint.
The fuels industry in converting RES electricity to H2 and use it in the production of e-fuels to decarbonise transport.
The last 3 of the above market applications make only market sense if there is excess and cheap electricity during periods of low power demand, i.e. it basically relies on wind and solar power. This raises another critical issue related to the fact that these sources of energy are intermittent and not always available. To be cost effective, building such commercial facilities necessitates the continuous supply of RES electricity and not an intermittent one to achieve a good capacity utilization factor; otherwise the economic viability is lost.
This multi-sector subscription to RES electricity in order to decarbonize represents a significant gap in the whole logic of the policy of a heavy reliance on RES electricity in transport. This gap can only be filled with carbon-neutral power such as e.g. provided by thermal power with CCS or by a significant expansion of nuclear energy. However, such power comes with a high cost.
Furthermore, the Eurostat figure for the total net electricity generation in 2014 was approx. 3,032 TWh, of which 25% was RE power. The Net generation is expected to rise to 3,900 TWh in 2050 of which 55% is from RES, according to the EU Reference Scenario 2050. The same source gives the energy demand in transports, see Figure 7, to around 350 MToe or around 4,000 TWh. Since electric vehicles are around 4 times as efficient as ICE vehicles, switching 10% of the transport energy to e-mobility would reduce the energy required in transports to 3,700 TWh and consume 100 TWh of electricity. This is a sizable fraction of the 900 TWh increase in the power generation between 2014 and 2050, considering that this net also includes a significant phase-out of controllable fossil power.
The market penetration of e-mobility is influenced by technical developments, policy incentives, infrastructure investments and the availability of low-cost RE power. The balance point between these factors at a time some decades in the future is difficult to forecast. Relying too much on this technology in its infancy as a major means of emission reductions introduces a risk that GHG emission targets cannot be met.
To a great extend the SGAB is concerned that the RED II is very conservative, unambitious and puts off serious efforts in decarbonising transport until post 2030 policies.

53
Translating the REDII proposal in climate change targets and assessing their compatibility with wider EU policies
The figure below, 11 and 12, shows that the REDII proposal will only achieve very modest progress towards the climate change policies of the EU and specifically decarbonising transport. The assumptions used in deriving this graph are:
The overall transport energy demand and associated CO2 emissions are based on Eurostat data and the EU Reference Scenario 2016, respectively.
Crop based biofuels are reduced to zero post 2030. These are assumed to have GHG reduction of 65% on an average as no new plants are foreseen past 2023.
Advanced biofuels produced from feedstock under Annex IX B remain capped as proposed by REDII also after 2030.
The split between advanced biofuels, and also e-Fuels and fuels produced from fossil waste streams is not known, or indicated in the RED II proposal. For lack of projections for this split, it has been assumed that Annex IX A biofuels provide 2/3 of the fuels and e-Fuels and fuels produced from fossil waste streams provide the balance. The advanced biofuels have an assumed average GHG reduction of 75%, and the e-fuels etc. 95%, respectively. Since this difference in GHG potential has been assumed, this split to some extent affects the amount of these fuels required to meet the 2050 GHG target.
The advanced biofuels and also e-Fuels and fuels produced from fossil waste streams only reach the minimum targets in 2021-2030 of the REDII. As stated above, the advanced biofuels produced from feedstock under Annex IX A are expected to provide the bulk of biofuels after 2030.
e-Fuels and fuels produced from fossil waste streams also make significant contributions, assumed in this projection to be approximately half of that of advanced biofuels.
Figure 11 shows the necessary reductions in CO2 emission pathways. Up to 2015 it is based on the available statistics. Between 2020 and 2030, it is based on the estimate of the GHG reduction obtained from the estimated use of biofuels, as in Figure 12. From 2030, it is based on a linear extrapolation to meet the 2050 target.
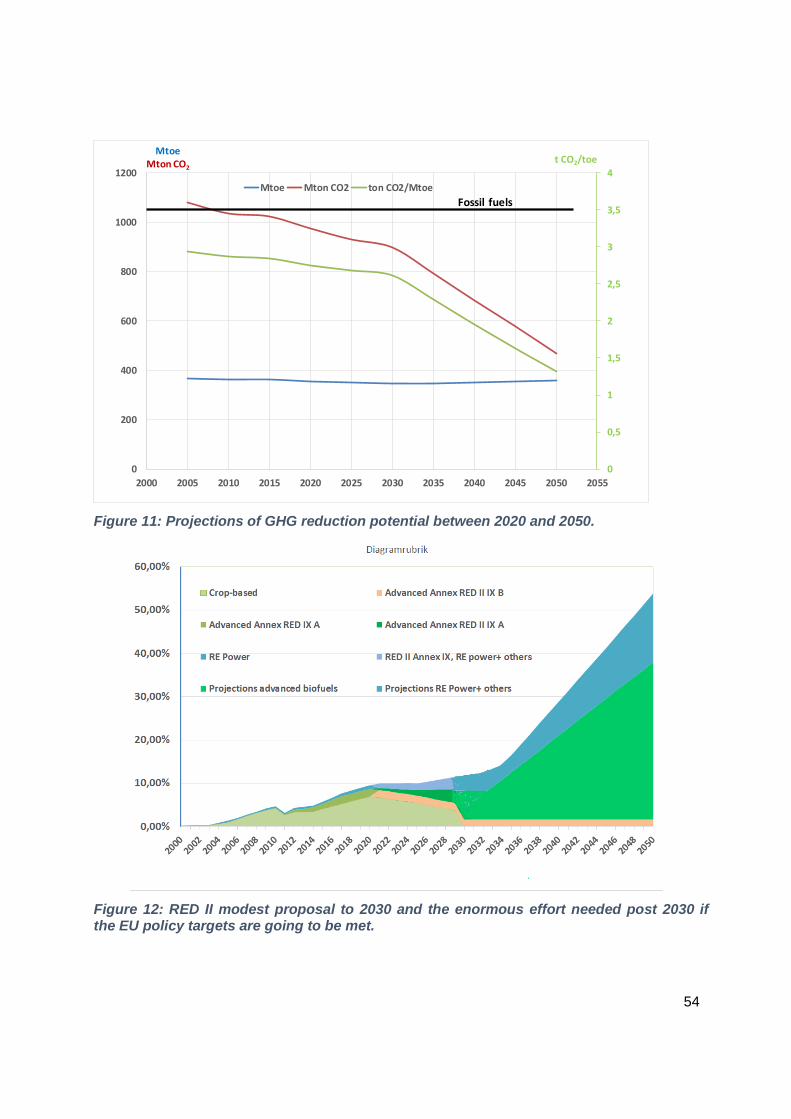
54
Figure 11: Projections of GHG reduction potential between 2020 and 2050.
Figure 12: RED II modest proposal to 2030 and the enormous effort needed post 2030 if the EU policy targets are going to be met.
0
0,5
1
1,5
2
2,5
3
3,5
4
0
200
400
600
800
1000
1200
2000 2005 2010 2015 2020 2025 2030 2035 2040 2045 2050 2055
t CO2/toeMtoe
Mton CO2
Mtoe Mton CO2 ton CO2/MtoeFossil fuels

55
Finally, Figure 13 is a translation of Figure 11 and Figure 12 into GHG reduction compared to the policy targets, again extrapolating from the 2030 estimate to the 2050 target.
As can be seen, relative to the trends in 2000-2020 and the somewhat slower trend estimated for 2020-2030, there is a very significant step-up required to meet the target in 2050. But there is at present no policies indicated on how such a radical step-up can be accomplished, putting the realism of the target in jeopardy.
Figure 13: Where we are, where we will be by 2030 and where we have to reach by 2050.
The SGAB's concerns
0
100
200
300
400
500
600
700
800
2005 2010 2015 2020 2025 2030 2035 2040 2045 2050
Mton CO2eq
Mtoe
Target GHG 2050, i.e. 40 % of 784 Mtons GHG emissions in transport1990
Transport energy use, Mtoe from Ref.Scenario 2016
Target GHG 2030, i.e. 80 % of 967 Mton GHG emissions in transport 2008
Estimated GHG savings, Biofuel+RE power+fuels, Mton
Ref scenario 2016AssumptionsTransport energy use, EC Ref. Sceanrio 20162005-2014 Eurostat data2020 RED target 10 % achieved2020-2030 RED II min. levels achieved2030 extrapolated to meet target1G Crop based fuels average 65 % GHG red.2G fuels average 75 % GHG red.RE power + fuels average 95 % red.
The SGAB is seriously concerned that the REDII proposal is very modest, unambitious and does not provide any confidence to the industry that it will be an effective tool in meeting the EU policies in decarbonising transport.

56
I.2.5 Resource availability
Setting the scene
On the basis of reliable publications, the SGAB has judged that there are
sufficient quantities of biomass, waste streams, process by-products and residues to meet the 2030 SGAB Targets without any adverse effects on the environment or other economic sectors.
The SGAB points out that a significant number of hectares of agricultural land
is being abandoned by the farmers on an annual basis and that the abandonment rate has accelerated in the period 2000-2010.
The SGAB also raises the issue of salty, semi-arid and dry areas in Southern
Europe the surface of which exceeds the EU agricultural areas. A significant portion of such low-quality land could be reclaimed for non-food cultivation purposes.
The SGAB strongly recommends that dedicated policies should be developed
to stop the reduction in utilised agricultural area and promote the reclaiming of low quality land. Such policies not only will strongly benefit the farming communities of the EU but in addition provide significant additional quantities of biomass for energy or other purposes.

57
Biomass Availability35
Key Messages
Background During the SGAB discussions it became clear that insights on the potential availability of biofuels resources would be needed and supportive to understand the 2030-targets. The information in this section summarizes insights from recent reports and studies on the potential availability of resources for biofuels in Europe. This memo does not intend to provide a scientific-level review, nor does it intend to provide a complete overview of all resource availability studies. Based on information provided by the SGAB members and observers and of members of the core-team, information has been drawn from a suggested set of 13 reports and studies.
35 Extracts from a report compiled by Eric van den Heuvel, Studio Gear, SGAB Reviewer
1. Notwithstanding the structural differences in the various studies, even the
cautiously estimated share of advanced biofuel production based on forecasted biomass availability indicate a possible contribution of at least 7% of these fuels in 2020 and a similar or slightly higher share in 2030 in the EU context.
2. Based on these estimates, it is concluded that for the SGAB target of 6% share
of advanced biofuels in total transport in 2030 under the base scenario sufficient feedstocks resources will be available.
3. The approaches that focus on improving agricultural and/or silvicultural
operations provide insights that substantially more resources could be made available for all biomass purposes including bioenergy. This reflects a kind of ‘hidden potential’: the opportunities can only be grasped when efforts towards such improved agricultural, forestry and waste collection management techniques are undertaken.
4. Based on such improved practises that can be implemented relatively easily it
is concluded that for the SGAB target of at least 9% of advanced biofuels in total transport in 2030 under the progressive scenario sufficient feedstock resource will be available.

58
There are many studies focusing on assessing the availability of advances biofuel feedstock resources for a national, EU and/or global perspective. Many of these provide information on today’s resource potential, and also are forward looking to 2020, 2030 or 2050. Each study sets out different focus areas, assumptions, calculation methods and uses different data sets. This makes it difficult to easily compare information on availability of sustainable biomass resources and their corresponding (advanced) biofuels production potential and the displacement potential for fossil fuels in road transport. Two different approaches can be seen from the reviewed reports: (i) an approach based on the assessment of wastes and residues in a given, current existing, setting, and (ii) an approach which challenges the potential improvements of current practices, e.g. in the agricultural operations. The resulting estimates for biomass resource availability differ accordingly. Based on information provided by the SGAB members and observers and of members of the core-team, information has been drawn from a suggested set of reports and studies:
− Biofrontiers – Responsible innovation for tomorrow’s liquid fuels; Harrison, P., Malins, C, and Searle, S., 2016.
− Advanced Biofuel Feedstocks – An Assessment of Sustainability, E4Tech, 2014. − A reassessment of global bioenergy potential in 2050, Searle, S, Malins, C, 2015. − Boosting Biofuels – Sustainable Path to Greater Energy Security, IRENA, 2016. − The Energy Report – 100% renewable energy by 2050, Ecofys, for WWF, 2011. − Biomass Futures – Deliverable 3.3: Atlas of EU biomass potentials, Alterra and IIASA,
for EC DG ENER 2012. − Maximising the yield of biomass from residues of agricultural crops and biomass from
forestry – ECOFYS, University of Hohenheim, Unique Forestry and Land Use GmbH and Scientific Energy Centre "Biomass" study under Framework Contract SRD/MOVE/ENER/SRD.1/2012-409.
− Sectorial data provided by the European Waste to Advanced Biofuels Association (EWABA).
− Sectorial data provided by the European Recovered Fuel Organisation (ERFO).
It is important to indicate that these reports have been commissioned for different reasons and in most cases not specifically address biomass resource availability for the biofuels sector in EU or provide information on the time horizon of 2030. In the following tables information from the various reports is assembled and where possible addressed towards the biofuels sector and to the time horizons of 2020 and 2030. Table 3 reflects information for the EU Context and Table 4 reflects global information on biomass resource availability.

59
Table 3. Resource estimate and potential biofuel production (EU context).
Report
Resource estimate36 Resulting biofuels potential Displacement
in road transport
fuels
tonnes, Mtoe per year as provided in
reports
expressed in PJ primary energy per
year
In tonnes advanced biofuels per year
in PJ advanced
biofuels per year
Biofrontiers, 2016
140 million tonnes of
wastes and residue
feedstocks
27 million in
2020 7% in 2020
Advanced Biofuel Feedstocks – An Assessment of Sustainability, 2014
2,961 million wet
5,500 in 2020
(eq. to 128 Mtoe)
Biomass Futures, Atlas of EU biomass potentials, 2012. Resource potentials are for total bioenergy utilisations.
314 Mtoe (2012)
375-429 (2020) * 353-411 (2030) *
13,100
15,700-18,000
14,800-17,200
* In Biomass Futures project for 2020 and 2030 two scenarios have been explored: a reference scenario (higher potentials) and a sustainability scenario (lower potentials), resulting in different levels of resource mobilization. For information please refer to the Biomass Futures reports.
36 Information is as provided in the reports
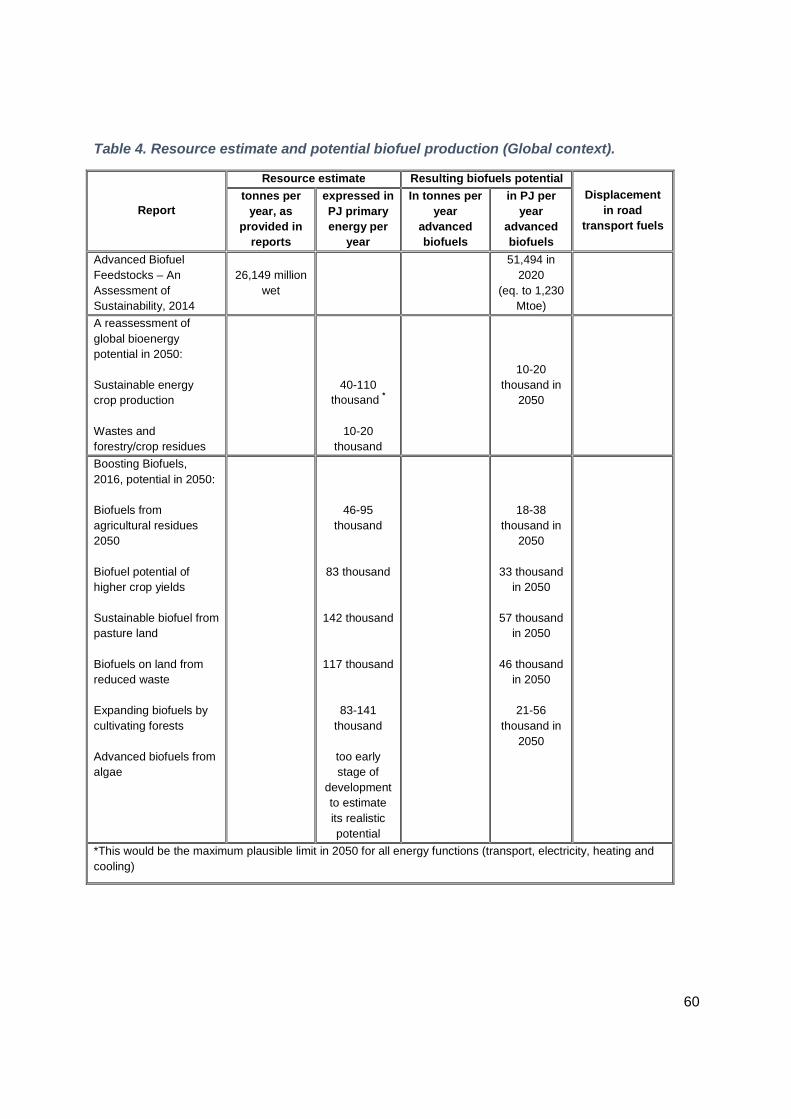
60
Table 4. Resource estimate and potential biofuel production (Global context).
Report
Resource estimate Resulting biofuels potential Displacement
in road transport fuels
tonnes per year, as
provided in reports
expressed in PJ primary energy per
year
In tonnes per year
advanced biofuels
in PJ per year
advanced biofuels
Advanced Biofuel Feedstocks – An Assessment of Sustainability, 2014
26,149 million wet
51,494 in 2020
(eq. to 1,230 Mtoe)
A reassessment of global bioenergy potential in 2050: Sustainable energy crop production Wastes and forestry/crop residues
40-110 thousand *
10-20
thousand
10-20
thousand in 2050
Boosting Biofuels, 2016, potential in 2050: Biofuels from agricultural residues 2050 Biofuel potential of higher crop yields Sustainable biofuel from pasture land Biofuels on land from reduced waste Expanding biofuels by cultivating forests Advanced biofuels from algae
46-95 thousand
83 thousand
142 thousand
117 thousand
83-141 thousand
too early stage of
development to estimate its realistic potential
18-38 thousand in
2050
33 thousand in 2050
57 thousand
in 2050
46 thousand in 2050
21-56
thousand in 2050
*This would be the maximum plausible limit in 2050 for all energy functions (transport, electricity, heating and cooling)

61
Abandoned Agricultural land37 While a lot of discussion and attention has been given to the availability of biomass resources and their completion with other uses such as for chemicals and materials, there has been little or no discussion on the subject of agricultural land abandonment in the EU. Figure 14 below show the reduction in Utilised Agricultural Area (UAA) in Germany, Spain, France and Italy between 1974-2010. A noticeable acceleration in UAA reduction is clear for the period 2000-2010 in all four countries.
Source EUROSTAT Figure 14: Utilised Agricultural Area (UAA = SAU, Superficie Agricola Utilizzata) reduction in DE, ES, FR, IT between 1974-2010.
Figure 15 shows the same reduction as percentage of utilised agricultural land. Not all EU Countries thus face the same dimension of the problem, but the major EU agricultural Member States show the same trend, with Spain and Italy demonstrating higher loses in UAA. The main reasons for this general tendency can be summarized as follows:
Increased conversion of farmland to urban. Not sufficiently attractive income from agriculture for farmers.
37 Extracts from a Memo prepared by Professor David Chiaramonti, University of Florence & Director of RE.CORD
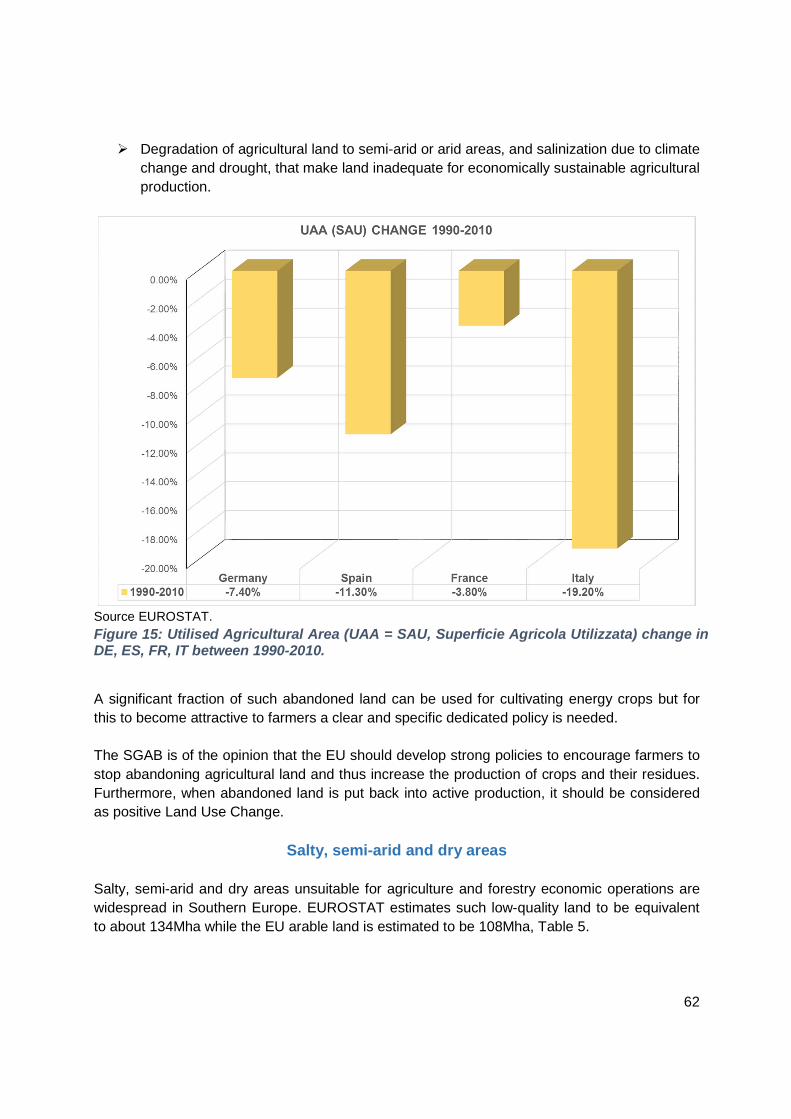
62
Degradation of agricultural land to semi-arid or arid areas, and salinization due to climate change and drought, that make land inadequate for economically sustainable agricultural production.
Source EUROSTAT. Figure 15: Utilised Agricultural Area (UAA = SAU, Superficie Agricola Utilizzata) change in DE, ES, FR, IT between 1990-2010.
A significant fraction of such abandoned land can be used for cultivating energy crops but for this to become attractive to farmers a clear and specific dedicated policy is needed. The SGAB is of the opinion that the EU should develop strong policies to encourage farmers to stop abandoning agricultural land and thus increase the production of crops and their residues. Furthermore, when abandoned land is put back into active production, it should be considered as positive Land Use Change.
Salty, semi-arid and dry areas Salty, semi-arid and dry areas unsuitable for agriculture and forestry economic operations are widespread in Southern Europe. EUROSTAT estimates such low-quality land to be equivalent to about 134Mha while the EU arable land is estimated to be 108Mha, Table 5.

63
Table 5. Salty, semi-arid and dry areas in Southern Europe
Land type EU surface area (ha) Salt affected soils 80,000,000 Arid soils (high sensitivity) 14,000,000 Arid soils (moderate sensitivity) 40,000,000
TOTAL 134,000,000 Remark: EU arable land = 108 Mha
Certainly, not all of this land could be reclaimed for energy crop activities but with modern agro-economic techniques and management systems a significant fraction could be reclaimed and used for the cultivation of energy or other crops. As with abandoned agricultural land, when such degraded land can be reclaimed for the cultivation of energy or other crops it should be considered as positive Land Use Change and encouraged.

64
I.2.6 Aviation and Heavy duty transport38
Key Messages
38 Extracts from a report compiled by Leigh Hudson of British Airways reproduced in full in section III.4
Aviation The SGAB is of the opinion that:
Sustainable Aviation Fuel (SAF) is integral to any future fuels policy and that the development of technologies for aviation and other sectors with limited substitution options are prioritised.
Long term policy certainty and financial and risk sharing mechanisms must be
provided for new technologies to encourage investment in advanced fuels production. These aspects should be addressed in future EU mechanisms to ensure that the EU is able to exploit future markets for advanced fuels technologies.
Aviation must be included in the incentive regime provided by REDII.
Support must be provided for the scaling-up and rollout of SAF production
capacity through the provision of financial products and services structured in a way to unlock private sector sources of capital.
Ensures that additional funding is available for R&D that can also help leverage
private sector funding.
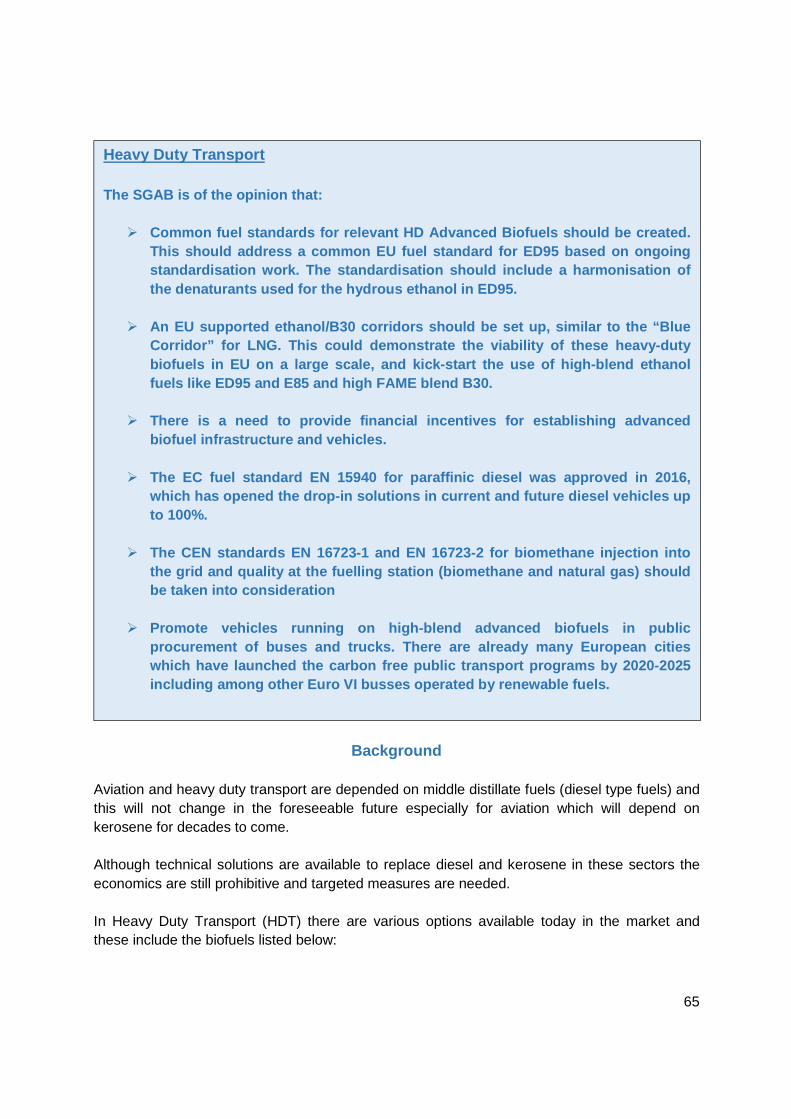
65
Background
Aviation and heavy duty transport are depended on middle distillate fuels (diesel type fuels) and this will not change in the foreseeable future especially for aviation which will depend on kerosene for decades to come. Although technical solutions are available to replace diesel and kerosene in these sectors the economics are still prohibitive and targeted measures are needed. In Heavy Duty Transport (HDT) there are various options available today in the market and these include the biofuels listed below:
Heavy Duty Transport The SGAB is of the opinion that:
Common fuel standards for relevant HD Advanced Biofuels should be created. This should address a common EU fuel standard for ED95 based on ongoing standardisation work. The standardisation should include a harmonisation of the denaturants used for the hydrous ethanol in ED95.
An EU supported ethanol/B30 corridors should be set up, similar to the “Blue
Corridor” for LNG. This could demonstrate the viability of these heavy-duty biofuels in EU on a large scale, and kick-start the use of high-blend ethanol fuels like ED95 and E85 and high FAME blend B30.
There is a need to provide financial incentives for establishing advanced biofuel infrastructure and vehicles.
The EC fuel standard EN 15940 for paraffinic diesel was approved in 2016, which has opened the drop-in solutions in current and future diesel vehicles up to 100%.
The CEN standards EN 16723-1 and EN 16723-2 for biomethane injection into
the grid and quality at the fuelling station (biomethane and natural gas) should be taken into consideration
Promote vehicles running on high-blend advanced biofuels in public
procurement of buses and trucks. There are already many European cities which have launched the carbon free public transport programs by 2020-2025 including among other Euro VI busses operated by renewable fuels.

66
B30 (30% vol. FAME in diesel), CEN has developed a standard to specify the fuel quality and characteristic of such a blend dedicated for HDT.
Hydrotreated vegetable oils, are in principle drop-in biofuels They are allowed in any proportions provided that the final blend complies with the requirements of EN 590. The use of renewable feedstock at refineries is also allowed provided that the final fuel meets the requirements of EN 590. CEN has developed the EN 15940 standard which describes the requirements and the test methods for marketed and delivered paraffinic diesel fuel containing a level of up to 7.0% (V/V) Fatty Acid Methyl Ester (FAME).
The EC fuel standard EN 15940 for paraffinic diesel was approved in 2016, which has opened the drop-in solutions in current and future diesel vehicles up to 100%.
ED95 (95% hydrous ethanol + additives), has been used in buses and trucks since 1986, mostly in Scandinavia, but also in France, the UK, Belgium, Poland, Italy and Spain. It is an official EU emission certification fuel39. ED95 is standardized in Sweden and standardization processes are underway in France; however, it is necessary to develop a CEN standard if wider utilisation is to be achieved40.
Dimethyl ether, has been successfully demonstrated in Sweden by Chemrec and Volvo, and an ISO standard has been developed. At present there are no plans to build a first-of-a-kind industrial plant but Volvo, Ford and other OEMs are active in continued development of DME fuelled vehicles.
Biomethane, has also been tested by several engine manufacturers but there are no
plans to use it extensively41 at present. In aviation there are limited options at present to use biofuels blended with kerosene in accordance with ASTM D7566 (Standard Specification for Aviation Turbine Fuel Containing Synthesized Hydrocarbons) meeting the requirements of ASTM D1655 (Specification for Aviation Turbine Fuels):
Synthesized Paraffinic Kerosene from Hydroprocessed Esters and Fatty Acids (HEFA): Hydrotreated Vegetable Oils, are in principle drop-in biofuels allowed up to 50% vol. blend based on ASTM standards. Currently it is the main biofuels used in all flight test programmes and commercial operation with biofuels produced by NESTE & UOP. The test and approval procedures for a less demanding, more diesel-like HVO quality with a lower blend ratio, High-Freezing Point HEFA (HFP-HEFA) is on-going.
39 Commission Regulation (EU) No 582/2011 of 25 May 2011 40 See also III.4. ED95 as a solution for decarbonising Heavy Duty Transport 41 SCANIA Euro VI gas busses and trucks are used by several European cities, particularly at night time (quiet gas engines). There are 400 biomethane busses in Stockholm city transport and biomethane busses in several cities in the UK, France.

67
Synthesized Iso-Paraffins (SIP) from Hydroprocessed Fermented Sugars: Farnesene, produced through fermentation of sugars by yeast, has also been developed by the cooperation of Amyris with Total and allowed for use up to a 10% vol. blend with kerosene based on ASTM standards.
Alcohol to Jet SPK (ATJ-SPK): Conversion of alcohols into fully synthetic, drop-in jet fuels has been developed by a number of companies. Gevo’s Isobutanol to jet pathway has been added to the ASTM D7566 Standard. Additional pathways are in development including pilot demonstration scale by Swedish Biofuels, Byogy and LanzaTech.
From the above only the HEFA fuels have been used extensively in mainly demonstration flights and limited number of short duration commercial programmes. There are two more approved ASTM D7566 standards related to Fischer-Tropsch pathways42 but at present these are not pursued by any developer. Additional sixteen (16) pathways are in development and under review of ASTM including pilot demonstration scale by Swedish Biofuels, Byogyand LanzaTech (alcohol conversion to jet fuel) and Biochemtex (conversion of lignin into drop-in bio fuel).
Aviation's Concerns on blending mandate The International Airlines Group (IAG) is committed to accelerating the development and commercialisation of Sustainable Aviation Fuel (SAF). Government support mechanisms will be critical in achieving this objective. A robust support mechanism to allow advanced biofuels to reach commercial scale is needed. However, IAG is concerned on the issue of a regional mandate and does not advocate a SAF blending mandate applied only to fuel uplifts in Europe. This is due to concern of eventual ensuing of significant market price distortions by increasing the cost of jet fuel relative to other parts of the world. IAG advocates that Mandates must take account of the international nature of aviation and avoid any competitive distortion effects. However, this IAG policy contradicts the main position of the SGAB that fixed Mandate for Advanced Renewable Fuels with subcategories to Market Operators (see Executive Summary) is the most effective policy to achieve market deployment of advanced biofuels. It is indeed true that aviation is a very complex and problematic area because no tax is paid on the kerosene fuel while the market has an international rather than a national or European dimension. These problems became apparent with the attempt to implement the EU Emissions Trading Scheme in the aviation sector. Since the start of 2012 emissions from all flights from, to and within the European Economic Area (EEA) – the 28 EU Member States, plus Iceland, Liechtenstein and Norway – are included in the EU emissions trading system (EU ETS) for EU and non-EU airlines alike. Like industrial installations covered by the system, airlines receive tradeable allowances covering a certain level of CO2 emissions from their flights per year. 42 Fischer-Tropsch Hydroprocessed Synthesized Paraffinic Kerosene and Fischer Tropsch (FT) Synthesized Kerosene with Aromatics derived by Alkylation of Light Aromatics from nonpetroleum sources
68
In the period 2013-2016, only emissions from flights within the EEA fall under the EU ETS. In addition, member states can, and e.g. the Netherlands have already done so, include aviation into their implementation of the RED directive modalities. The International Civil Aviation Organization (ICAO) agreed in 2013 to develop a global market-based mechanism to address international aviation emissions by 2016 and apply it by 2020. This agreement followed years of pressure from the EU for global action. To allow time for the international negotiations, the EU ETS requirements were suspended for flights in 2012 to and from non-European countries. On October 2016 (06/10/2016) ICAO put forward its Carbon Offsetting and Reduction Scheme for International Aviation (CORSIA) which is a voluntarily mechanism with no clear and strict implementation rules. Implementation will begin with a voluntary pilot phase from 2021 through 2023, followed by an, again voluntary, first phase, from 2024 through 2026. The next phase from 2027 to 2035 would see all states on board, with some few exemptions. CORSIA is planned to use, already operative carbon trading systems for off-setting, such as e.g. the EU-ETS. SGAB has serious doubts whether the CORSIA, in particular because of its main post-2030 perspective, will be an effective tool in decarbonising aviation.

69
I.2.7 The lignocellulosic ethanol market wall
Key Messages
Background The ethanol EU28 fuel consumption in 2014 was 2.6 Mtoe or 5.2 million m3. The use of gasoline in the EU is estimated at about 70 Mtoe in 2020 (down from 79 Mtoe in 2014), or about 82 million m3. E10 allows the blending of 10% by volume of ethanol which corresponds to 8 million m3. This equals the EU nameplate 1G capacity while the use in 2014 was 6 million m3 (just below 8% by volume relative to gasoline, and 3.8% in energy terms). This leaves little space for
Crop based ethanol has filled the existing 10% blend wall in the gasoline market and the market for flex-fuel vehicles blends, e.g. E85, is limited.
Shifting from crop based ethanol to lignocellulosic ethanol brings improved
GHG performance; however, the market for lignocellulosic ethanol remains minute in absolute numbers and demand.
Lignocellulosic ethanol is the only advanced biofuel besides HVO that currently
is ready to enter the market. A plausible, although undesirable, scenario is that too few of the other value chains for advanced biofuels will reach market maturity in time to deliver any significant volumes of advanced biofuels before the mid-2020s. Therefore, unless some expansion of the ethanol for transport market can generate a pull for lignocellulosic ethanol on top of remaining 1G ethanol, there is a risk that the transport decarbonisation policies of the EU will fail.
There is urgent need for the commercialization of a new “ultra-performance
petrol” based on high octane E20/25 blend, with superior energy efficiency to the existing petrol fleet.
Increased use of ED 95 in the medium and heavy duty transport will facilitate
the uptake of lignocellulosic ethanol in the diesel segment.
These initiatives would provide the expansion of the alcohol market that would give investors in advanced alcohols the comfort that 2G ethanol can grow without competing with existing 1G capacity. This is especially a key issue for investors who address both markets. In addition, it will ensure the continuation of technology development, while securing contribution to decarbonisation policies.

70
lignocellulosic ethanol investments in the EU, as crop based ethanol imports can be increased if necessary. If the blend wall will not be addressed towards E20/25 there are three practical options to increase the demand for lignocellulosic ethanol:
more flex-fuel vehicles operating on E85, medium and heavy duty vehicles operating on ED 95, and/or, Alcohol to Jet (ATJ) for the aviation sector
Otherwise the cellulosic ethanol will be capped to limited volumes in the EU. Suggestions that it will drive crop based ethanol out of the market due to its better GHG performance are unfounded and seem highly unlikely due to the increased cost of production of lignocellulosic ethanol compared to crop based ethanol produced in already existing plants. From the above options ATJ can only have an effect in the medium to long term, and is associated with some cost issues for lack of incentives in aviation fuels. The introduction of E85 vehicles has brought mixed results, it requires dedicated vehicles and infrastructure as well as tests on the driver loyalty when price relation to gasoline is not favourable. ED95 is an interesting option as it connects ethanol to diesel vehicles in addition to FAME and drop-in diesel type fuels. In the US, the ethanol industry goes for E15, which has also been approved by EPA. US automakers have since 2012 gradually accepted and given warranties for this fuel and in 2017, 80% of the new light duty vehicles sold had such warranties. The European Commission has given three contracts to CEN to carry out investigations on the performance of 20/25 ethanol blend in petrol. In a recent contract, CEN, in cooperation with CONCAWE, ACEA and the bioethanol industry, will also investigate petrol/ethanol use in light vehicle diesel engines. It is expected that these contracts will be finalized by mid-2018. Subject to the results of these studies, the European Commission will consider in consultation with the stakeholders the option to give a mandate the CEN for an E20/25 blend in gasoline by revising the EN 228 gasoline standard. Clariant together with Daimler has operated an E20 fleet test program in Germany. Such initiatives could lift the blend wall significantly, if adopted in fuel standards in the future.

71
I.2.8 Linking definitions with technology status, time to market and fossil fuel blends
Policy and decision makers, stakeholders, civil society and consumers at all levels, regional, national, European or International, have serious problems comprehending the complexity, status and readiness of the numerous advanced biofuels technologies that are under development and needed to deploy such biofuels in the market place. The complexity of the sector is illustrated below (Error! Reference source not found.) in a simplified diagram indicating that, subject to the value chain selected, there are numerous routes that can deliver several final products. However, the key message is that along all process steps additional value is added to the intermediates and final products in respect to the previous. Modern biorefineries are maximizing the added value of various biomass products and environmental benefit in small, medium and large scale operations.
Figure 16: Simplified diagram indicating the flexibility of technology innovation in converting biomass and waste streams into high value products43
43 K. Maniatis, ENER/C2 value chain analysis for advanced biofuels and biochemicals; Lignofuels 2016, Helsinki.

72
Advanced Biofuel plants (as well as all bioenergy technologies and plants) are complex systems dependent on complicated logistics, operational procedures and maintenance practices. Therefore, they cannot be compared, as often is the case, to wind farms or PV systems. Wind turbines and PV cells can be manufactured and mass produced and the energy source comes for free. This is not possible with an Advanced Biofuel or bioenergy plant, and where there is also a cost of procuring the energy source (feedstock), transforming it into a fuel with dedicated specifications that can be used by the equipment in the conversion plant and transport it to the plant site.
The SGAB, after several discussions and deliberations, puts forward the Table 6 which aims to link resources, to conversion pathways or technologies, their readiness in view of market deployment and the possible products for use in the market. The SGAB does not claim that this table covers all resources, all conversion pathways or technologies and all possible fuels, or that the technology readiness is accurately representing all possible variations. However, the SGAB is of the opinion that the Table is a good reference for discussion amongst all stakeholders. Table 7 presents similar information but from the point of view of appropriate blends with fossil fuels.
All Advanced Biofuel plants (as well as all bioenergy and biorefinery plants) have to be specifically designed taking into account variations in the biomass composition (e.g. moisture content, concentration of pollutants etc.), nature (e.g. wood, straw, sewage sludge etc.), and availability for secured supply, output capacity etc. as well as the site conditions and its available infrastructure. This adds expense and time during the engineering phase of a project even when undertaken by an experienced technology provider replicating a design for the same technology.

73
Table 6. Classification of BIO, Low carbon fossil, e- & Hydrogen Transport Fuels Raw material Technology Type of biofuel Status TRL1 Application
Conv
entio
nal
Sugar* Fermentation Ethanol Commercial Gasoline blend, E10, E85, ED95£, upgrade to biokerosene
Starch* Vegetable oils* Esterification or
transesterification FAME/Biodiesel Diesel blend, B7, B10, B30
Fats Food crops Biogas production &
removal of CO2 Biomethane 100% in heavy duty transport, flex fuel vehicles,
captive fleets, injected in the gas grid Vegetable oils & fats Hydrotreatment Hydrogenated Diesel drop-in or 100%, bio-kerosene$
Adva
nced
Waste streams of oils & fats Esterification or transesterification
FAME/Biodiesel Commercial Diesel blend, B7, B10, B30
MSW2, sewage sludge, animal manures, agricultural residues, energy crops
Biogas or landfill production & removal of CO2
Biomethane 100% in heavy duty transport, flex fuel vehicles, captive fleets, injected in the gas grid
Used cooking oils, liquid waste streams & effluents7
Hydrotreatment Hydrogenated Diesel drop-in or 100%, bio-kerosene$
Lignocellulosics, MSW, solid industrial waste streams/residues3
Enzymatic hydrolysis+ fermentation
Ethanol
TRL 8-9 Gasoline blend, E10, E85, ED95, upgrade to biokerosene
Other alcohols TRL 6-7 Gasification + fermentation
Ethanol, methanol
TRL 6-7
Lignocellulosics, MSW, liquid industrial waste streams & effluents5 or intermediate energy carriers6
Gasification + catalytic synthesis
Synthetic4 TRL 6-8 Depends on fuel type; can be used for blends or drop-in with diesel, gasoline, kerosene, bunker fuel or as pure biofuel e.g. Biomethane, DME, MD95, FT
Algal oils8 and other non-food oils Hydrotreatment Hydrogenated TRL 4-5 Diesel drop-in or 100%, bio-keroseneEsterification FAME/Biodiesel TRL 5-6 Diesel blend, B7, B10, B30, 100%
Pyrolysis oils from lignocellulosics, MSW, waste streams
Hydrotreatment Hydrotreated TRL 5-6 Diesel drop-in or 100%
Co-processing in existing petroleum refineries9
Petrol, diesel, kerosene
TRL 5-6 All of the above
Non-lignocellulosic biomass, (algae, non-food biomass)10
Various as above Petrol, diesel, methane,
TRL 4-5 Various as above

74
hydrogenated
Sugars 11 (cellulosic, non-food) Microbial Petrol, diesel, kerosene
TRL 4-6 Diesel drop-in or 100%, bio-kerosene
Supply of waste/byproduct gases Technology Type of biofuel Status Application
Low
Car
bon
Foss
il Fu
els
Steel & Chemical Industry
Fermentation Ethanol TRL 6-7 Gasoline blend, E10, E85, E95,Upgrading & Catalytic synthesis
Methanol TRL 5-6 Shipping, blends with gasoline, M95, M100Methane TRL 5-6 100% in heavy duty transport, flex fuel vehicles,
captive fleets, injected in the gas grid Waste polymers, plastics, non-biodegradable fraction of MSW
Gasification + catalytic synthesis & fermentation
Synthetic4 & alcohols from fermentation
TRL 6-8 Depends on fuel type; can be used for blends with diesel, gasoline, kerosene, drop-in
e-Fu
els
Supply of H2 Technology Type of biofuel Status ApplicationRES electricity Catalysis Methanol TRL 5-6 Shipping, blends with gasoline, M95, M100RES electricity Methane TRL 5-6 100% in heavy duty transport, flex fuel vehicles,
captive fleets, injected in the gas grid RES electricity Synthetic2 TRL 5-6 Depends on fuel type; can be used for blends
with diesel, gasoline, kerosene, drop-in

75
*Capped by ILUC £ ED95: 95% hydrous ethanol + additives for medium & heavy duty transport $ There is always also a smaller fraction of gasoline (nafta) from Hydrotreatment processes. 1Technology Readiness Level, http://ec.europa.eu/research/participants/data/ref/h2020/wp/2014_2015/annexes/h2020-wp1415-annex-g-trl_en.pdf, as of
medio 2016. Needs dedicated financial mechanisms: Note: Value chains at low TRL need financial support for longer duration while value chains at high TRL need financial support for relative shorter period, however, the financial support for high TRL technologies is by order of magnitude higher than that of low TRL per project. This is due to the high investment costs for the hardware or "steel in the ground".
2 Municipal Solid Waste biodegradable fraction 3 Waste fibres 4 Synthetic biofuels are produced from the catalytic synthesis of CO+H2 and can be: Liquid: ethanol, methanol, Fischer Tropsch (diesel replacement), dimethyl ether (LPG replacement or 100% in vapour phase), Gas: biomethane, 5E.g. tall oil, black liquor 6Pyrolysis oils 7Waste streams from food industry, or pulp & paper (tall Oil) 8Oils extracted from algae 9 In co-processing the bio component ends up in all output streams of the refinery 10Algae: they can be used as biomass in gasification processes or anaerobic digestion or extract algal oils and therefore can produce all types of biofuels 11Produced from lignocellulosic biomass, MSW and other waste streams 12 The ethanol, methanol or methane have to be bio- or RES

76
Table 7. Petrol/Diesel/Kerosene blends with biofuels and time to market deploymentMarket Application Type of Biofuel Category Technology Status Time to
market Raw material
Petr
ol
Gasoline blend, E10, E85, E95
Ethanol Convectional Fermentation Commercial 0 Sugar, starchAdvanced Enzymatic hydrolysis
+fermentation TRL 8-9 0-3 Lignocellulosics, MSW2, solid industrial
waste streams or residues3 Gasification + fermentation
TRL 5-6 4-8
Gasification + catalytic synthesis
TRL 6-7 4-8 Lignocellulosics, MSW2, liquid industrial waste streams & effluents5 or intermediates6
Gasoline blend, M3, M10, M56*
Methanol Advanced Gasification + catalytic synthesis
TRL 6-7 4-8 Lignocellulosics, MSW2, liquid industrial waste streams & effluents5 or intermediates6
Gasoline drop-in
All drop-in fuels routes for diesel produce a parallel gasoline fraction
NOTE: For clarity the processing routes are not repeated here.
Dies
el
Diesel blend, B7, B10, B30,
100%
FAME/Biodiesel Convectional Esterification or transesterification
Commercial 0 Vegetable oils**, used cooking oils, fats.
Diesel drop-in or 100%
Hydrogenated Advanced Hydrotreatment Commercial 0 Vegetable oils**, fats, used cooking oils, liquid waste streams & effluents7
Fisher Tropsch Advanced Gasification + catalytic synthesis
TRL 6-7 4-8 Lignocellulosics, MSW, liquid industrial waste streams & effluents5 or intermediates6
Hydrotreated Advanced Hydrotreatment TRL 5-6 5-10 Pyrolysis oils from lignocellulosics, MSW, waste streams Co-processing in
existing petroleum refineries9
TRL 5-6 4-8
Hydrogenated Advanced Hydrotreatment TRL 5-6 6-12 Algal oils8 and other non-food oilsFAME/Biodiesel Advanced Esterification TRL 5-6 5-10
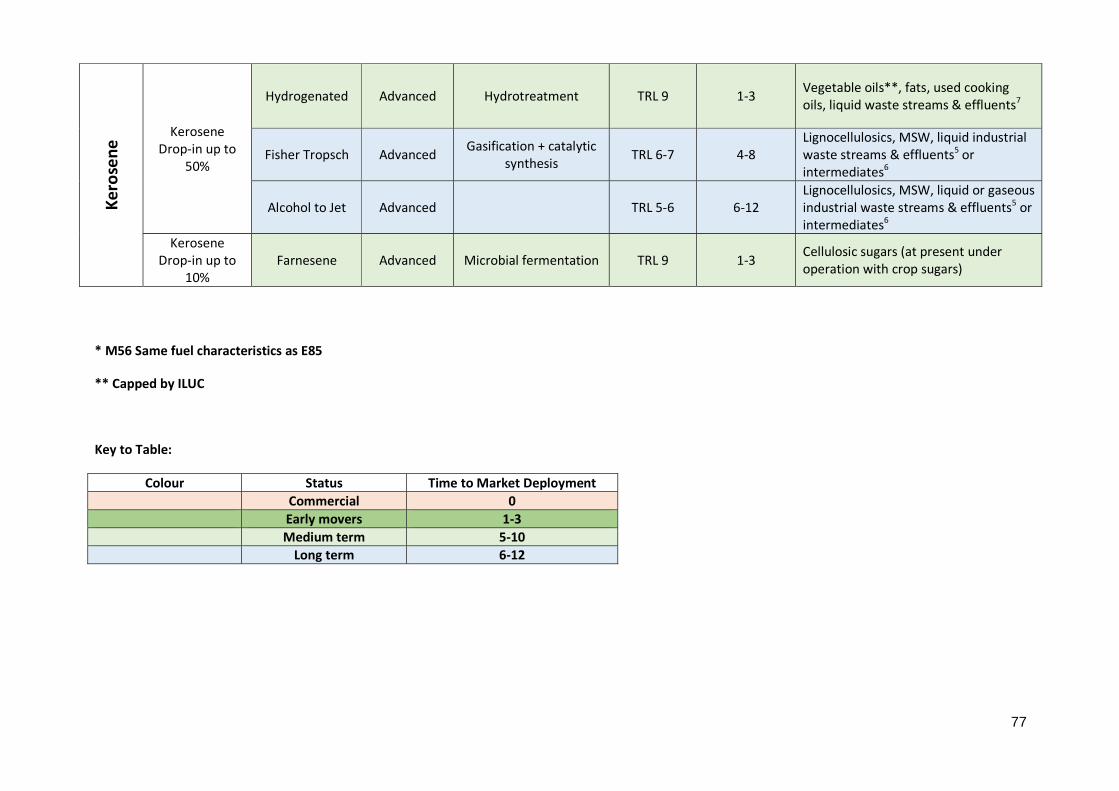
77
* M56 Same fuel characteristics as E85
** Capped by ILUC
Key to Table:
Kero
sene
Kerosene Drop-in up to
50%
Hydrogenated Advanced Hydrotreatment TRL 9 1-3 Vegetable oils**, fats, used cooking oils, liquid waste streams & effluents7
Fisher Tropsch Advanced Gasification + catalytic synthesis TRL 6-7 4-8
Lignocellulosics, MSW, liquid industrial waste streams & effluents5 or intermediates6
Alcohol to Jet Advanced TRL 5-6 6-12 Lignocellulosics, MSW, liquid or gaseous industrial waste streams & effluents5 or intermediates6
Kerosene Drop-in up to
10% Farnesene Advanced Microbial fermentation TRL 9 1-3 Cellulosic sugars (at present under
operation with crop sugars)
Colour Status Time to Market Deployment Commercial 0 Early movers 1-3 Medium term 5-10 Long term 6-12

78
I.3. Technology Status and Reliability of the value chains44
I.3.1 Technology Status
Key Messages
Background
• Hydrogenated Vegetable Oil (HVO) is already commercial today at a scale of millions of tons. The EU oil industry is retrofitting existing refineries to produce HVO. Future production capacity growth is limited by availability of sustainable oils but could double. However, when used oils and process residues from industrial operations are taken into consideration on a global scale the capacity can increase significantly, if accepted by policymakers and the market.
• Lignocellulosic or second generation (2G) ethanol is on the verge of being commercial with a several industrial scale first-of-a-kind plants using a variety of integrated technologies in early operation. The technology developers are competing in licensing/exploiting their technology to locations with strong support policies. All of them are based on agricultural residues while technologies based on forestry residues still have to reach the level of industrial scale demonstration.
• Gasification technologies lag relative to 2G ethanol, with a small number of plants in early operation and in pilots. Typically, the economic gasification plant capacity has been significantly higher than a 2G ethanol plant, creating pressure on investment capital. Technically it could provide quantities in 2030 if the move to scale can be accomplished by 2020.
44 Compiled by Ingvar Landälv, Division of Energy Sciences, Luleå University of Technology; SGAB Vice Chair
A lack of long term stable legislation hinders the development of promising routes to reach demonstration and commercial deployment stage. This is in particular the case for capital intensive technologies. The level of innovation and belief in technology progress among industrial parties is high and has led into significant progress in technology development. A wide range of different value chains are being demonstrated at industrial scale. These value chains differ in conversion technology, the feedstocks used, the process employed and the resulting liquid and gaseous fuels. All technologies are striving to increase their respective Technology Readiness Level (TRL) and to reach industrial deployment. However, the low energy prices and other uncertainties on the market situation in addition to the political risks are a common barrier that for the last years has been a common obstacle to overcome.

79
• Two relatively small trials of co-processing Fast Pyrolysis Bio Oil (FPBO) in refineries in Brazil and the USA are known to have taken place. If successful, a large number of relatively small pyrolysis plants will have to be built to come to sizable total volume within the decade to come. Upgrading capacity for FPBO will most likely use existing refinery infrastructure at first.
• Biological base methane is already commercially available for use as transport fuel in captive fleets, injecting in the natural gas grid or conversion to biomethanol. The further development with respect to the scale that bio-based methane is used in transport depends on the competitive demand for biomethane for use in Combined Heat and Power (CHP)-plants.
• Power to Gas or Liquids (PtG/L) is being developed at demonstration scale currently given the expected availability of excess renewable power. However, Low Carbon Fossil Fuels produced via Carbon Capture and Utilization (CCU) is not a widely-used technology at large scale yet and the technology at present can only access smaller carbon dioxide sources. Thus it may have a limited impact in terms of volumes by 2030 unless close coupled integration with large sources providing cheap renewable electricity will be demonstrated.
• Algae technology is at the early demonstration scale and still in the process of optimising energy efficiency as is required for the harvesting, drying and processing of algal products to fuels. Opportunities in fuel markets are still limited, with the exception of biomethane. This development may therefore only make an indent in the biofuels market post 2025.
• Low Carbon Fossil Fuels from waste industrial streams applications for the production of liquid or gaseous fuels are close to reaching the first-of-a-kind plant status. They may possibly offer significant quantities by 2030.

80
I.3.2 Biofuels and future availability of RES-H245
Key Messages
Background Power to Gas/Liquids (P2G/L) offers attractive opportunities to convert renewable electricity overcapacity to chemical hydrocarbons like methane and liquid fuels like renewable diesel and gasoline. First demonstration units are running in Europe where e.g. biogenic CO2 from anaerobic digestion biogas production is converted to methane or methanol in Island. When P2G/L technology in integrated to a biomass based syngas unit or a bioethanol plant etc.,
45 Compiled by Lars Waldheim, Consultant, SGAB Reviewer, Kai Sipila, VTT & Ingvar Landälv, Division of Energy Sciences, Luleå University of Technology; SGAB Vice Chair.
Hydrogen from excess RES electricity can advantageously be used in
various advanced biofuel value chains to further reduce the carbon foot print.
Syngas produced from biomass can utilize -from a small to a big fraction - hydrogen to significantly increase the yield of biogenic carbon in biofuels up to 300 % at high marginal efficiency.
Also, other advanced biofuel production processes that involve hydrogenation (such as the HVO process, upgrading of fast pyrolysis oil, hydrothermal liquefaction crude, depolymerised lignin et al) could benefit from RES excess hydrogen. Such processes require up to 1%-4% by weight hydrogen.
Sustainable external hydrogen could in many instances replace hydrogen based on natural gas commonly used in refineries.
In the case of biogas, the carbon dioxide co-generated (up to 40%) together with methane can be hydrogenated by renewable hydrogen to methane, thereby increasing the biomethane output, and also the quality of the product.
Depending on the typical scale of operation and specific use of hydrogen, the electrolyser capacity to fully supply renewable hydrogen could range from 1 MW magnitude for biogas plants up to 100 MW or more for large gasification and HVO installations.
If sufficiently low cost electricity is available, such installations could provide demand side balancing at a scale that has grid stabilization impacts.
Compared to e-fuels, where CAPEX covers both the electrolysis plant and biofuels plant, biofuels plants only require the CAPEX of the electrolysis plant and for some marginal changes to the existing biofuel processing line.

81
using the CO2 by-product, significant market benefits can be achieved. Typically, production capacity can be doubled with 30% additional capex compared to traditional advanced synthetic biofuels plant. This B2B integration will improve significantly the raw material efficiency and GHG sustainability of the advanced biofuels in order to meet REDII target of 70% GHG reduction. Technology is ready to market take-up by innovative piloting, demonstration and flagship projects in Europe.
The Power to gas or liquids concepts are based on that electricity can be converted to hydrogen. Hydrogen is already today an immensely important chemical in the production of both fossil fuels and biofuels for transport, as well as for many other chemicals such as ammonia etc.
Today the main commercial route to hydrogen is by means of reforming of natural gas, but also gasification of coal and oil is used. In the past, also electrolysis was used when low cost hydropower was available, and transfer lines to other markets were too costly. Since then electrolysis technologies have been improved and renewable electricity, that is foreseen to be available abundantly at low cost in the medium to long term, will be a main provision route for hydrogen, and also for demand side grid balancing.
The state of the art in electrolysis technology is described in a recent report46. The efficiency in producing hydrogen by electrolysis is today 40%-65% and could rise to above 70% in the future. The cost reported today is 1,000-2,000 €/kW electric input, but a significant drop in cost is expected due to the combined effect of the learning curve and the expected increases in overall production volumes of this inherently modular technology.
However, since hydrogen is also a key reactant or utility for many types of biofuels, and since liquid fuels still will be used in significant quantities for at least few more decades, positive synergies with biofuels can be exploited while introducing e-fuels, e-mobility and hydrogen as transport fuels.
Gasification-based biofuels When the production of synthetic biofuels is maximally enhanced by an external hydrogen source, the increased in fuel output from a given amount of biomass, in comparison to non-enhanced configurations, is approximately 2-fold for production of methane or 1-fold gasoline by means of indirect steam gasification; and approximately 3-fold for the same two products using oxygen-blown gasification.
Gasification-based biofuels such as methanol/DME, bio-methane and FT diesel are all produced by conversion of the biomass to a synthesis gas intermediate, i.e. a mixture of CO and H2. In the raw syngas, there are also considerable amounts of CO2 formed in the gasification process that is later rejected in the syngas upgrading down to levels of a few % by volume in the purified synthesis gas.
Depending on the fuel produced, the stoichiometric ratio of H2/CO in the synthesis gas should be approximately 2, with the exception of methane, where it should be 3. However, typical biomass gasifiers produce a gas that has a ratio of 1:1 to 1.5:1, such that the water gas shift reaction: 46 Development of Water Electrolysis in the European Union. Final Report. Fuel cells and hydrogen Joint undertaking. E4tech, Sàrl with Element Energy Ltd, February 2014.

82
CO+H2O→CO2+H2
is used to convert some of the CO present in the raw gas to additional hydrogen. This reaction is exothermic, implying a loss of energy from the synthesis gas and hence lower yield of biofuel, and it adds to the CO2 already present in the gas. The combined loss of CO2 from the gasification and the shift process implies that around half of the biogenic carbon on a molar basis is lost as CO2, i.e. the biogenic carbon yield to biofuel is decreased and cannot substitute fossil fuel carbon otherwise emitted.
However, if there is hydrogen available, this could have a considerable impact on the biofuel output. As an initial step, external hydrogen could be used to partially of fully avoid the use of water gas shift. Depending on the gasification system (oxygen-blown or steam –indirect) and product, up to 30%-50% more CO could be converted to biofuels, relative to the biofuel yield with water gas shift and no added external hydrogen.
As a second step, also the CO2 in the gas, like in a P2G process, can be partially or fully hydrogenated to CO such that all biogenic carbon ends up in the fuel product. The complete conversion has been studied by Il. Hannula47, who concluded that, again depending on the product and the gasification process, the biofuel output could increase by 100%-300%. However, since this full usage of electrolyzers would require between 1 and 1.7 MW electricity per MW of biomass feeds, and planned biofuels plants typically starts with 100 MW biomass input, such a full conversion requires significant amounts of electricity. The marginal efficiency from electricity to biofuels for the complete conversion was found to be around 50%. Only eliminating shift conversion has a higher marginal efficiency, around 65%, as less hydrogen is consumed per carbon atom in CO compared to CO2. This means that the biofuel route compares well with producing hydrogen by electrolysis in efficiency, there is almost no, or very little degrading of the electric energy when used in conjunction with biofuels.
Hannula also studied the economic impact and found that the average electric break-even price was as low as 27-35 €/MWh for different configurations. The impact of the potential for generation of low-carbon fuels is also very high; the biomass and waste resources in the EU could theoretically be used as a basis for production of half the transport fuels in the EU, compared to a less significant 10%-20% without this exploitation of synergies. A simplified principle of external hydrogen enhancement is depicted below in Figure 17.
47 Hydrogen enhancement potential of synthetic biofuels manufacture in the European context: A techno-economic assessment Ilkka Hannula, Energy 104 (2016) 199e212

83
Figure 17: The principle of external hydrogen enhancement 47
Note: a detailed figure presenting the above principles cab be found in Chapter 4, Figure 4.1, of the "Technology status and reliability of the value chains" Report in CIRCABC
Hydrogenation of HVO, FPO and HTL liquids To upgrade the triglyceride fed to HVO in plants of 100,000-1,000,000 tons per year capacity, the hydrogen consumption is in the range of 3%-4% by weight of the feed depending on the process and feedstock, and approximately 80%-85% of the feed comes out as fuel liquids. For 100,000 tons per year plant (like the UPM plant in Lappeenranta), the electrical consumption could be of the order of 25-30 MW to supply all the hydrogen and for the largest HVO installations, one magnitude larger.
Fast pyrolysis is a way of converting solid biomass to a liquid fuel, Fast Pyrolysis Oil (FPO), which can substitute other fuels in combustion applications. However, the bio-oil requires upgrading to be used as a drop-in hydrocarbon fuel, as, among several issues, the oxygen content is too high. One way of upgrading pyrolysis oil is by hydrogenation of the oxygen contained in the FPO to steam. For a state-of-the-art FPO plant, e.g. the Joensuu plant, that produces 50,000 tons of FPO per year, hydrogenation requires of the order some 3% by weight or of 0.2 ton/hr hydrogen, i.e. a 10 MW electrolyser.
Also for other forms of thermal treatment of biomass such as HTL and of biomass by-products such as lignin, a considerable amount of hydrogen is also required. HTL crude bio-oils typically hold 5%-12% oxygen that would require 0.5%-1.5% by weight hydrogen per kg of feed. Raw lignin holds approximately 30% oxygen and unless treated by some intermediate de-polymerization/deoxygenation process, would require up to 4% hydrogen.

84
Upgrading of biogas External hydrogen could be used to hydrogenate the CO2 fraction in biogas, typically 40%, to additional methane arrive at a more valuable product. In the case of bio-methane for use in transport, this would save on the upgrading cost, and also retain more biogenic carbon in the product. The CO2 Electrofuels project funded by Nordic Energy Research48, claims that the methane output can be increased by 65%, using Solid Oxide Electrolyser (SOE) technology. Since a typical biogas plant is quite small, typically below 2 MW biogas output, it would then require of the order of a 3 MW electrolyser.
Policy perspectives According to the current RED and REDII, the carbon intensity of the excess electricity used in the biofuels process needs to reflect the ‘regional emission intensity’ of electricity production. The configurations passing the 60% and 70% GHG emission saving requirements of the current RED and proposed REDII criteria are very tight to traditional P2G/L concepts.
The 60% (70%) emission saving threshold can be achieved in the integrated Power to Biofuels concepts (P2B) if the emission intensity of electricity stays below 104-130 gCO2eq/kWh (84-105 gCO2eq/kWh), and the emission factor of biomass raw material does not become as critical as in many traditional, non-integrated biofuels concepts. For the non-enhanced concept design, the emission factor for wood needs to remain below 17 gCO2eq /MJ wood (13 gCO2eq /MJ wood) for the produced fuel to comply with the current RED (REDII) limit, whereas for the hydrogen-enhanced P2B process, the wood emission factor could be 46 gCO2eq /MJ wood (36 gCO2/MJ wood) for the product to still meet the 60% (70%) limit, assuming the use of zero emission (10 gCO2eq /kWh) electricity.
In section "Number of plants, investments" p. 39 above it has been shown that lignocellulosic based BTL units are needed by 2030 in up to 60 to 100 new installations of an (assumed) average size of 0.15 Mtoe/a. When introducing the hydrogen enhanced biofuels production concepts with typically a double capacity and 30% additional Capital Expenditure (CAPEX), it can offer a significant cost-effective concept to market uptake of advanced renewable fuels in the EU.
48 http://www.nordicenergy.org/project/synthetic-fuels-for-heavy-transportation/

85
I.3.3 Mutual synergies of a 1G/2G plant co-location
Key Messages
Background
The integration of advanced (2G) biofuel plants with conventional (1G) biofuel plants can lead to significant synergies and cost savings, especially for bioethanol plants49. Advanced biofuel plants can be implemented as stand-alone units or integrated with conventional biofuel plants.
Integration strategies can refer to: co-location (installing a separate 2G entity adjacent to an existing 1G facility), retrofitting (altering the existing 1G production line for producing 2G biofuels alongside 1G biofuels) or repurposing (adjusting the production process of an existing (mothballed) facility to produce 2G biofuels). There are cases where significant synergies between 2G and 1G plants exist, while in other cases, integration options are very limited. The variety of conceptual and design studies identify cost-savings from co-location for all 2G conversion pathways in the order of 5%-10%50.
The co-location of the two generations may lead to substantial conjoint cash flow synergies in:
cost reduction, productivity and/or revenue increase
This can be achieved by further utilizing the existing technical/operational & commercial know how of the 1G business including its experienced personnel. Such examples are based on using the capacities, knowledge & tools along the value chain in:
49 For biodiesel, conversion of fossil refineries to advanced biofuel production based on hydrogenation of various types of oils is another promising option as well. 50RES-T-BIOPLANT, Towards advanced biofuels – options for integrating 1st and 2nd generation biofuel production, IEA RETD, 2016; http://iea-retd.org/archives/publications/res-t-bioplant
Co-locating an existing 1st Generation (1G) plant and a new greenfield 2nd
Generation (2G) plant can have mutual commercial and technical benefits.
The type of existing 1G plant can range from ethanol49, biogas50 and combined heat & power plant facilities or the combination of it (multi-type facility colocation).
Depending on the concrete case-by-case set up, the targeted synergies can work in both directions of the already operating 1G asset as well as to the planned investment case of the 2G project.
86
feedstock sourcing & supply chain management development, realization & O&M of biofuel production facilities & product’s marketing & distribution
At the same time, existing 1G facility assets can be used with significant 2G CAPEX reduction potential51 possible in existing 1G operations such as:
logistic & storage solutions for raw materials & products e.g. existing train connection at site
core production processes like rectification & distillation52 non-core processes like CHP, waste water & vinasse treatment common use of offices
Integration of the actual process can be very beneficial, and in particular when exchange of mass/intermediates streams and energy flows is achieved amongst the plants. The most likely option is using part of the 2G’s lignin based energy (“green” steam and/or electricity) for the 1G facility.53 This can lead to further GHG reductions in the 1G facility resulting in improved CO2 certificates generating higher prices and hence increasing the revenues on the existing and partially to fully written off 1G asset. Finally, integration of a 2G biofuel plant can successfully take place in existing or repurposed forest industry operations such as pulp and paper mills, with or without integration with sawmills. In such cases the harvesting, supply and storage operations are already ensured and various vessels and building are readily available. The ST1 Cellunolix® facility54 producing cellulosic ethanol from sawdust at Kajaani, Finland; (under commissioning at the time of writing this report) is such an example. However effective policy instruments are crucial. A market start-up will only happen if stable support to technology development and technology commercialization is given (by way of economic incentives) for a reasonable timeframe reflecting investment lifetimes.
51 under strict condition of the possibility of a higher equipment utilization in concrete case 52 Source: Raizen presentation CMD 2015; Unica: Kutas, G. 19.01.2016 53 Example Lignin burned at the Poet’s Project Liberty cellulosic ethanol plant in Iowa / US, will produce process steam for that facility and the colocated corn-ethanol plant. Source: http://www.ethanolproducer.com/articles/12006/fired-up-undefinedby-lignin 54 http://www.st1biofuels.com/company/news/cellunolix-ethanol-plant-to-be-built-in-finland

87
I.4. COSTS OF BIOFUELS55
Take away Messages Biofuels will remain more expensive than fossil fuels (with rare exceptions) unless the costs of mitigating climate change are going to be factored in the cost of fossil fuels.
• The cost of biofuels is mainly governed by the cost of the resource (feedstock) and cost of capital (the investment) and only value chains based on waste streams with zero or negative cost offer possibilities for competitive cost production at present.
Fuels for aviation • Aviation fuel is one product or side product in processes that generate drop-in
fuels (diesel, gasoline, kerosene) in varying proportions, such that production cost is related to the product slate and value of all products
• Aviation Hydrogenated Ether and Fatty Acids (HEFA) can be produced at a cost of 80-90 EUR/MWh
• Aviation fuel via Fischer-Tropsch (FT) synthesis or through sugar pathway can be produced at a cost of 110-140 EUR/MWh
Commercially available biofuels • Biomethane produced from waste streams and via biogas (anaerobic
digestion) has at present the lowest cost at about 40-50 EUR/MWh. In certain niche markets it can be competitive to fossil fuels mainly due to negative or zero feedstock prices.
• Hydrotreated Vegetable Oils (HVO) have a production cost in the range of 50-90 EUR/MWh subject to the cost of the feedstock.
Cellulosic ethanol at the stage of early commercialisation • The production cost of cellulosic ethanol is estimated in the range of 90-110
EUR/MWh subject to the feedstock cost.
Biofuels in the stage of First of a Kind (FOAK) • Biomethane, methanol, ethanol and DME from waste and biomass via
gasification have a production cost of 60-80 EUR/MWh.
• Transport fuels via the FT process have a production cost of 90-140 EUR/MWh subject to the feedstock cost and uncertainty regarding investment intensity.
The key Take away Messages are based on work carried out by the SGAB group. Production cost data are summarized in Table 8 and schematically depicted in Figure 18.
55 Compiled by Ingvar Landälv, Division of Energy Sciences, Luleå University of Technology; SGAB Vice Chair and Lars Valdheim, Consultant, SGAB Reviewer.

88
They are a summary of information provided in reference 8 and from data taken from the memo. Table 8. Summary of Biofuels Production Costs
Biofuel type production costs
Feedstock price EUR/MWh
Production cost rangeEUR/MWh
Production cost range EUR/GJ
Aviation HEFA 40-60 80-90 22-25 Aviation sugar fermentation & FT synthesis
Sugar 65-85 FT: 10-20 EUR/MWh 110-140 31-39
HVO liquids 40 50-70 14-19 60 70-90 19-25
Biomethane from biogas 0-80 40-120 11-34
Cellulosic ethanol 13 103 29 10 85 24
Biomethane & ethanol from waste (1) 67-87 19-24
FT liquids from wood
20 105-139 29-35 10-15 90-105 25-29
Biomethane, methanol &Dimethyl Ether (DME), from wood
20 71-91 20-25
10-15 56-75 16-21
Pyrolysis bio-oil co-processing 10-20 58-104 14-27
Pyrolysis bio-oil stand alone 10-20 83-118 23-33
(1) Base: Net tipping fee of 55 EUR/ton, energy content of 4.4 MWh/ton, Conversion efficiency of 50%

89
Figure 18: Summary of production cost.
When considering the costs above in a consolidated assessment one should also consider other aspects and limitations associated with a fuel such as the flexibility of use of the fuels (e.g. drop-in, blendable, need for specific vehicles and infrastructure), what capacity can be expected (the TRL level) and the volumetric potential of the fuel in question (e.g. the low cost for bio-methane via AD is associated with certain suitable waste substrates but since such substrates are limited in quantity AD cannot give the large volumes at this low cost as e.g. biomethane via gasification that benefits from a far larger feedstock basis.)
Data The cost data regarding CAPEX have, with the exception of data directly received from SGAB stakeholders, been found in publicly available documents, and have been cited when possible. Further sources are compilations and analyses of such data, made and analysed by others. This category consists both of information published in publicly available reports and non-published material available to the authors of this memo, and here the full background cannot be disclosed. Regarding Operating Expenses (OPEX), there is less specific information available in public or shared by the stakeholders. In most cases OPEX has been specified as a yearly cost

90
related to a percentage of the plant investment. See the various biofuels for further information.
Performance i.e. the relation between the feedstock input and the product output has been based on a similar set of sources as for the CAPEX.
The cost of feedstock used in the estimates have been based on the values of traded feedstocks whenever possible, complemented by estimates from other sources or cost related to alternative processing cost, this latter is in particular applicable to wastes.
Data used for calculation of the production costs are available in the memo. CAPEX and cost of feedstock are the two most dominating factors. In most cases, they contribute to about 80% of the total production cost. Using the memo, it is therefore easy to adjust these two parameters and further determine their respective influence on the overall production cost.
Methodology The simplified methodology used to reach production cost of biofuels is based on summarizing the capital cost contribution, the OPEX contribution and the feedstock contribution. The CAPEX data have been collected from projects that have been or is in construction whenever possible. Otherwise the cost is based on the cost estimates representing cost estimates for projects close to an investment decision that was not, or still is not reached. CAPEX has been converted to an investment intensity, expressed as medium value with a +/- and has been expressed as EUR/kW (some places complemented with USD/bpd or other units due to source of information). This is done to allow comparison of capital expenditure for various biofuels and with other technologies also outside the biofuel area. Typical plants size varies considerably between small biogas plants to large plants for HVO production. Investment intensity (EUR/kW) should be studied having this in mind.
CAPEX is seen as equal to the overnight investment cost for building the plant and no cost for interest during construction or working capital has been added. The capital recovery charge is composed of an annual cost estimated as an annuity based on the CAPEX using a real interest of 10% for 15 years, i.e. a factor of 13.3% per year56. Elements of a fully elaborated project economic model such as level of grant support, debt-to-equity ratio, loan repayment grace and amortization periods, etc. have been ignored.
OPEX, less feedstock, as used, have been expressed as an annual percentage of CAPEX or as a percentage of the production cost. The percentage includes co-feeds, labour, feedstock associated costs on the site, maintenance, by-product disposal etc. When available, relevant data from project estimates have been the basis for the percentage or other figures used.
Feedstock cost contribution is estimated from the performance data and feedstock cost.
The production cost is seen as the sum of the capital recovery charge, OPEX and feedstock procurement costs on an annual basis divided by the expected or quoted yearly production output.
56 NOTE: In the report there are a few exceptions from this capital charge

91
I.5. NECESSITY FOR AN EU MARKET FOR BIOFUELS57
In pursuing the objectives of the Energy Union Strategy, European economic operators can only play their full roll in a European energy market which is integrated and encourages cross-border activity, based on common rules that promote a dynamic, innovative and competitive economy.
Whilst this objective is clearly stated in the Treaty on the functioning of the European Union, Member States’ right to determine the conditions for determining their energy mix in terms of resource exploitation, energy sources and supply is also preserved.
As the EU’s energy policy has evolved, notably in the light of climate policy, the level of ambition has also been raised, with ambitious targets having been set both at EU and Member State level on reduction of GHG emissions, energy efficiency, the use of renewable energy sources. In some cases, these targets have been further translated into specific sectors and products, notably in the case of biofuels for transport.
Experience with the biofuels sector has demonstrated the complexity of this legal framework which has resulted in a set of 28 national regulatory frameworks and the inevitable resulting costs and barriers to trade. This has been documented in the report “Obstacles to achieve an internal market for transportation fuels with bio-components” which identifies a number of concerns and concludes that "The EU biofuels market is badly fragmented and nothing that approaches a “common market".
Increasingly, obligations to fulfil EU targets (whether implemented at EU or national level) are falling on economic operators (e.g. fuel suppliers). However, there is little attempt at EU level to address the market obstacles that these fuel suppliers are facing in delivering on their obligations due to divergence of approach between Member States e.g. on the authorisation on the use of specific food-stocks for biofuels or the approach to double-counting.
This is of particular concern, given that major investments are required to underpin EU policy on advanced renewable fuels – and yet the fragmentation of the market and the lack of legislative stability are hampering the development of long term business plans needed for such investments.
At minimum, greater transparency is needed on the implications of what is an intrinsic aspect of EU energy policy: the juxtaposition of the aim of a functioning internal energy market (which promotes new and renewable forms of energy) and Member States’ right to determine their energy mix.
The draft Governance regulation offers an opportunity in this respect, bestowing upon the European Commission a clear monitoring role in an iterative process whereby recommendations and proposals can be made in order to ensure that common objectives are being adequately pursued. However, the ex-ante role that the Commission has in analysing and commenting on Member States’ plans, as well as its role in monitoring transposition and implementation of EU law should be more clearly defined. It should include 57 Compiled by UPEI.

92
responsibility for identifying and addressing potential barriers to cross-border activities, not only in the gas and electricity markets but for all energy products – including liquid fuels.
Indeed, Member States must be given flexibility when they implement EU policies and legislation in view of attaining common goals and objectives. Nevertheless, such flexibility should not contribute to the regulatory fragmentation that many market players face today across the EU, causing market barriers and distortions. This is essential if a true internal energy market is to be achieved across the EU for all products. While each Member State must be given the option to adapt EU legislation to its own specificities, transposition and in particular, implementation of EU legislation must be assured in a coherent manner across the EU. This is not always the case today.

93
SECTION II: WEAK POLICIES OF THE PAST
II.1. Obstacles to achieve an internal market for transportation fuels with bio-components (compartmentalisation of the EU biofuels market)58
Key Messages
Background
An in-depth analysis of market operators has come to the following conclusions:
• The EU biofuels market is badly fragmented and nothing that approaches a "common market".
• It is nearly impossible for market operators to obtain a clear and reliable view on how Member States (MS) have transposed and implemented the EU legislation on renewable energy. Such a comprehensive overview is long overdue. Greater accessibility and transparency in this respect would help the European Commission to identify potential threats to the common market and the principle of free movement of goods.
58 Extracts from a Report prepared by Rob Vierhout, Consultant.
Even though there is in the European Union a single market for road fuel and road vehicles there is a concern, especially amongst small and medium size fuel suppliers that, in reality, such a single market does not exist for biofuels. These market operators feel that they have to operate in a fragmented market confronted with many different rules in a great number of Member States. Notwithstanding that there is already for more than 12 years EU legislation on biofuels the stage of a truly internal market on biofuels is still not achieved. Besides the fact that Member States have a rather different approach on how to transpose and implement the EU law there is also the frequent changes of legislation at EU level itself that contributes to increased complexity and uncertainty. Since 2003 the EU legislation on biofuels has changed twice substantially, not to simplify the law but first and foremost to expand the number of rules. There is, unfortunately, less energy put in explaining the law and to pursue actions that would reduce the level of inconsistency in transposition.

94
• The various Communications (guidelines) the Commission published to clarify the legislation did not prevent that MS have transposed and implemented the law in quite different ways. The Guidelines are either not clear enough or still leave too much room for interpretation.
• The highest differentiation can be noted in the way the double counting measure is complied with.
• The present system of sustainability certificates issued is not transparent enough. Only a limited number of Voluntary Schemes (VS) have registers (or database) of certificates issued. An EU register will minimise the risk of fraud with certificates and will make monitoring and control of certificates much easier.
• The rules on mutual recognition of Voluntary Schemes (VS) are not clear enough and results in market operators having to obtain various certificates for the same batch of fuel. This means additional costs and potentially cases of fraud.
• The EU’s mass-balancing rules were created only for liquid biofuels and have hindered trade of biomethane via the gas grid cross borders. The EU’s gas grid should be recognised as one logistical facility without national borders.
Even though EU legislation is clear on the maximum level of bio-component than can be blended there are differences between the MS how much bio-component is allowed or can be used for both ethanol and bio-diesel. This makes it difficult for fuel suppliers to trade fuel with bio-components cross border. The variety in transposition in national law and implementation at national level is obstructing a truly common market for trading transportation fuels with bio-components cross border. Considering that advanced biofuels’ role to play in reducing emissions from transport should increase strongly, a coherent and consistent transposition of Directive 2015/1513/EU is vital. The Commission has not (yet) issued any guidance documents for Member States and market operators on how to comply or to transpose in the best possible way Directive 2015/1513/EU. Considering the history of how MS have transposed the previous Directives on renewable energy it is strongly recommended. If guidance is not provided for we can expect continued fragmentation of the market and further confusion for market operators.
The Commission should be more forceful in starting infringement cases. Seven years after the RED has been adopted there are still MS that have not complied with the directive.
The best way to minimize or avoid national rules that obstruct a common market for transportation fuels with bio-components is to have EU law that allows as little as room possible for interpretation of the law (harmonization) with the lowest possible level of complexity; implementation rules to be set at Community level. It is unclear how the new regime on VS (Directive 2015/1513/EU) will apply to those schemes that still have a license to operate under Directive 2009/28/EC. The objective should be to have a level-playing field between all VS, operating under identical rules.

95
To date two MS have a system in place to trade biofuels through a system of tickets or credits (similar to the US RIN-system). The benefit of such a system is that biofuel can be used also in sectors (such as shipping or aviation) on which no obligation rests, whereas the operators in these sectors can sell the tickets against market value to obligated parties.
96
II.2. NER 300-Initiative and Status of the Selected Bioenergy Projects59
Key Messages The key Take away Messages from the experience of the industry with NER300 up to March 2016 are:
There are several limitations in the design of the NER300. If the aim is to promote and support promising technologies for first-of-a-kind plants any new similar programme (e.g. NER400) should be re-designed along the recommendations below.
Background The funds for the NER300 grants were obtained by selling up to 300 million carbon allowances (rights to emit 1 ton of CO2) from the set-aside for the New Entrants’ Reserve (NER i.e. new industries established after the ETS system was implemented). The sales of the EUAs was EUR 1.65 billion from the first tranche sales (200 million EUAs) in 2011-2012 and EUR 0.55 billion from the sales of the remaining 100 million EUAs in the second tranche
59 Extracts from a report prepared by Lars Waldheim, Consultant, SGAB Reviewer.
1. NER300 has failed to promote several promising technologies from the pilot/demonstration to the first-of-a-kind plants status. 2. Only 90% of the allocated budget was attributed to projects. 3. As of March 2016, only three projects have yet become operative, two in bioenergy and a wind project representing only 4% of the budget. 4. In particular, NER300 was not the right tool for advanced 2nd generation biofuels technologies. The cancellation of the four bioenergy projects of the 1st call represents 45% of the bioenergy budget (23% of the total budget), and combined with the two projects in other RES areas, a total of 31% of the overall budget from the 1st call has been cancelled. 5. Two other projects (one in bioenergy and the other in Carbon Capture and Sequestration (CCS)) are in high risk of cancellation too, if this would take place the total cancellation of projects would amount to as much as 50% of the overall budget.

97
in 2013-2014.The funding from the NER300 program can be obtained for installations of different innovative energy projects including renewable energy, smart grids and CCS.
The selection of projects was based on call for proposals. Each of the EU Member States could be granted at least one project and no Member State would be granted more than three projects in total.
The money from the first tranche was allocated to finance projects selected from a 1st call for proposals in 2011, with the remainder disbursed in a 2nd call in 2012. First funding in of any project was in 2014.
One difference between the NER300 funding and other funding available for technology demonstrations in e.g. the EC Framework Programs or from national support was that is not considered as state-aid, i.e. other sources of public funding and support can be complementing a NER300 grant.
The background to this was that the grant was determined on the basis of the cost arising from the application of an innovative renewable energy technology, relative to a “conventional comparator”. The level of funding awarded to a project is capped at 50% of these extra costs (investment and operating) and hence the support would neither distort the market nor give an over-compensation.
However, the grant is not received directly in the beginning of a project or in proportion to the project spending (unless a MS provides a corresponding capital guarantee). Instead, the grant funding to a project is only receivable once the plant has been constructed and has come into operation. The grant will then be paid during the initial five years of operation based on a pro rata basis of the actual production achieved relative to the nameplate production capacity, but with a margin for reduced capacity factor for the use of new technologies. This margin required that in order to obtain 100% of the grant funding allocated to a project, the actual capacity over the first five years of operation must reach 75% of the nominal output.

98
RECOMMENDATIONS FOR FUTURE SIMILAR INITIATIVES
1. Support should be mainly be provided during the design and construction phases of a plant and not only when the plant becomes operational and sells its products in the market. 2. Preparing detailed feasibility studies for first-of-a-kind plants entails a significant cost up to several hundred thousand EURO and at present there is no support for such work. Support should be provided under separate tier for promising technologies that have been proven at demonstration scale. 3. Technology development has its own pace and it doesn't follow the pace of either the Commission or EIB. Thus, a more flexible call system or better an "open call" should be designed if the aim is for the Commission and the EIB to facilitate the industry and not the other way round. 4. There is a paradox; from one point of view the more innovative the technology the more attractive it is (e.g. the gasification projects for Fischer-Tropsch). However, from the other point of view such projects are much more sensitive to any disturbance on external factors and thus the higher the risk for cancellation. At the same time such technologies need support much more than other less risky technologies.
99
4. Overview of Renewable Fuels, Biofuels Mandates and Regulations60
Key Messages
60 Extracts from a Memo by Lars Waldheim, Consultant, SGAB Reviewer.
The formulation of mandates in the EU Member States is more or less
unique for each member state, i.e. the policy mechanisms to reach the 2020 target on the internal market are very fragmented.
There are at least 16 different ways of expressing the mandates 2020 target
(17 if no mandate is seen as a method which seems to apply to a large number of member states).
Even the mandate formulations in terms of the units are widely differing
between volume, energy or GHG emission terms.
There are also targets for biofuel blending into diesel and gasoline, respectively, both with or without an overarching national target for total quantity or GHG reduction.
Some countries require certain GHG reduction of all biofuels, according to
the ILUC directive.
To meet the RED requires that an accepted assessment scheme is used and an external certification that the requirements of the scheme are met. With almost 20 different approved schemes in use and with limited cross-acceptance, there is huge fragmentation creating a non-transparent situation.
Some countries apply double counting, some do not.
Some Member States accept co-processing of biofuels in e.g. fossil
refineries, some accept it with constraints and some do not accept it under any circumstance.

100
Background The situation introduces significant trade barriers in the internal market and additional costs to the companies involved, and hence in the end to the consumers and tax-payers. The fragmentation also hinders consolidation among the market actors and an increased market risk, including the risk of political changes.
Therefore, a more coherent EU-wide system post-2020 is desirable, where targets could differ between member states but these are built on the same basis, i.e. either relating to energy or volume.
An analysis of biofuel mandates in the EU indicates that the EU market and policy landscape is very fragmented in the way that the use of biofuels is encouraged in the member states in order to meet the 2020 target. The analysis resulted in 16 different schemes, not counting “no scheme” that can be assumed as existing in the twelve Member States where no specific mandates were found. Even the measures are widely differing between volume, energy or GHG emission terms.
This far, only two member states, the Netherlands and UK, have introduced a trade system.
The mandates are formulated differently, as GHG reduction, as % by volume or energy of total transport fuel demand or as % by volume or energy related to specific transport fuels, e.g. ethanol in gasoline, and also combinations of a target for overall transport fuels and for individual transport fuels.
There are also in some countries demands on the sustainability of the fuels, expressed as GHG reduction in some countries as a complement to the volume mandate, and in accordance with the ILUC directive.
Fuel companies work in volume or mass units in the day-to-day management of the fuels and this is also how their operation is reported to the tax and custom offices. To come to an energy basis is also reachable by simple conversion factors already in use in many places. Using volumes or energy blend rates as the basis for the obligation therefore becomes less cumbersome than GHG emissions or other more policy-oriented expression of their obligation.
The RFS2 system in the USA provides this guidance by having a volume target, defined as ethanol equivalents in energy for each category of biofuel, each year. EPA then translates this to a ratio for the obligated parties for the calculation of RINs required to meet the obligation, based on the volume sales of fossil fuels. The criticism is more to the late settlement of the volume target, and to the lack of availability of cellulosic ethanol to meet individual obligations.
Using GHG reduction as a basis becomes more complicated because each individual fuel type based on a specific origin (and maybe even batch traded) then has some level of GHG emission associated with it. In the future, there may well be a similar declaration of the GHG of fossil fuels to distinguish between individual fossil sources. Then it opens for unintended consequences, i.e. one volume of biofuel would have a better GHG reduction the more carbon intensive the fossil component used is, so a percentage target can be reached with less biofuel if a tar sand comparator is selected causing an overall higher GHG emissions.

101
Regarding the GHG reduction of each biofuel batch or production unit, this has to be verified by the approved methodologies and procedures of the RED directive and auditing. In RFS2, EPA approves the feedstock, the pathway and also approves the production installations such that they are in line with the production characteristics of the approved pathway. This would appear less onerous than the recurring verifications and certifications of the plants and processing which is required to be done within the EU. In addition, since there are many voluntary schemes (19 at the moment according to the EC web page) that have been approved and are in use within the EU this is an added complication when biofuels are traded between parties using different schemes. Even if there are some schemes that mutually recognise each other, in the end some parties may have to have parallel schemes to have flexibility in the operation and an improved security in the supply to customers. These are additional barriers to the introduction of biofuels that can be translated to costs added to the already more expensive biofuels.
RECOMMENDATIONS
Policies or systems addressing energy in transport or GHG reduction should be:
at the level of the obligated market actors
formulated in terms of measures that are close to the units in which fuels are traded or taxed; such as on energy basis
To further facilitate transparent trade in biofuels, a program for a wider cross-compliance between the different certification schemes is needed.

102
SECTION III: BACKGROUND & SUPPORTING DATA
III.1. Public Consultation REDII - Response Report61
Analysis and presentation of the results of the responses from SGAB Members and Observers to the public stakeholder consultation on the preparation of a new Renewable Energy Directive for the period 2020 to-2030.
Key Messages
The respondents also provided detailed comments which have been summarised as follows:
61 Extracts from a report compiled by Eric van den Heuvel, Studio Gear, SGAB Reviewer
Overall the RED was not effective in promoting the wider objectives of the transport and energy policies.
The important barriers seen as having hampered the development of
renewable fuels: Changing policy environment, which results in the lack of long term
rules and support Insecure and fragmented investment climate Cost competitiveness of second generation biofuels No support for non-bio low-carbon fuels in RED Absence of targets for aviation and shipping sector Absence of post-2020 targets for Renewable Energy in transport
The most effective measures to promote renewable fuels are:
Targeted financial support for advanced technologies Obligations on market players across the EU Harmonisation at Member State level

103
Short term, unstable legislation led to investment insecurity.
RED failed to focus on high-GHG saving fuels – RED and FQD were not
correlated.
The debate on ILUC was complex and lasted for several years and ultimately led to complex solutions such as caps and sub-targets.
An EU-harmonized approach in the Member States should be established.
Advanced biofuels do need a substantial mandate to take off.
RED did not lower investment risks for the production of biofuels facilities in
Europe.
RED did not facilitate fuel cost reduction
Post-2020 policy should broaden the portfolio of fuels that bring decarbonisation
potential.
With respect to the most important barriers hampering the development of sustainable renewable fuels and renewable electricity use in transport the following issues were mentioned by the respondents:
Changing and variable policy environment.
Insecure and fragmented investment climate.
Cost competitiveness of second generation biofuels.
Non-bio low-carbon fuels not incorporated in RED or other legislation.
Lack of long term rules and support.
Absence of targets for aviation and shipping sector.
Absence of post-2020 targets for Renewable Energy in transport.
The respondents indicated which measures should be taken into account when developing a new RED in the period after 2020 with respect to renewable fuels in transport:
104
The introduction of certain market players' obligations at the EU level.
Targeted financial support for deployment of innovative low- carbon
technologies (in particular to the heavy-duty transport and aviation industry).
More harmonised promotion measures at Member States level.
Increased use of certain market players' obligations at Member State level.
Background
For REDII a survey process was initiated by the Commission to consult stakeholders and citizens on the new renewable energy directive, foreseen before the end of 201662. The consultation was open from 18 November 2015 and closed 10 February 2016. Also for the updated EU bioenergy policy a public consultation took place at the time of writing this report and that consultation closed on 22 May 2016. The responses of both consultations will be used for the impact assessment of the new renewable energy directive. The impact assessment was prepared in the second half of 2016.
In order to get a quick feedback from the position of the industry on the public stakeholder consultation for RED II the Members and Observers were asked to complete the Renewable Energy in Transport section of the public consultation document. On basis of the responses the SGAB could provide recommendations to DG Energy and DG Move of the European Commission with respect to possible measures to further enhance the development ‘Advanced Biofuels’ in Europe. This was seen as an input from the industry and technology developers who are also investors in most of the cases and thus their responses were considered critical.
The Renewable Energy in Transport section consisted of 3 questions:
Transport policy objectives, Q28 (To what extent has the RED been successful in addressing the following EU transport policy objectives?) With respect to the question on the transport policy objectives the responses from the SGAB members and observed is presented in Figure 19. The figure shows the distribution of the rating scores of the respondents, i.e. is how they viewed that the transport policy objectives have been addressed by the current RED. The objectives which received the highest total percentage score for ‘very successful’ and ‘successful’ are presented at the top of the graph.
62 https://ec.europa.eu/energy/en/consultations/preparation-new-renewable-energy-directive-period-after-2020

105
Figure 19: Distribution of the respondents’ rating to Q28 on transport policy objective.
Important barriers Q29, (Please name the most important barriers hampering the development of sustainable renewable fuels and renewable electricity use in transport?) Overall, based on the comments of the respondents, the important barriers seen as having hampered the development of renewable fuels are summarized as follows:
• Changing policy environment, which results in the lack of long term rules and support
• Insecure and fragmented investment climate • Cost competitiveness of second generation biofuels • No support for non-bio low-carbon fuels in RED • Absence of targets for aviation and shipping sector • Absence of post-2020 targets for Renewable Energy in transport
Effective means Q30, (Please rate the most effective means of promoting the consumption of sustainable renewable fuels in the EU transport sector and increasing the uptake of electric vehicles) With respect to the question on the most effective means the responses from the SGAB members and observed is presented in Figure 20. The figure shows the distribution of the rating scores of the respondents, i.e. is which means they view as most effective for the development of sustainable renewable fuels in the transport sector. These results can be taken into account for the development of a new RED. The means which received the

106
highest total percentage score for ‘very effective’ and ‘effective are presented at the top of the graph.
Figure 20: Distribution of the respondents’ rating to Q30 on effective means.

107
III.2. Response to the Low Carbon Fuels 2030 Questionnaire63
Key Messages With respect to the Objectives for the issue of renewable energy in transport of the existing Renewable Energy Directive the responses from the Members and Observers of the Sub Group Advanced Biofuels are summarized below.
Background
A questionnaire on the mandate for Low Carbon Fuels (LCF) was distributed to the SGAB members and observers. The questions related to the suitable formulation of a mandate for 2030, the numerical value of such a mandate and the impact of proposed mandates on greenhouse gas emissions, jobs investments etc. Only 15 questionnaires have been returned. As a majority of the respondents desired to give this information under confidentiality, the data and arguments are summarized but no citations or identified comments are included.
63 Extracts from a Memo by Lars Waldheim, Consultant, SGAB Reviewer.
A majority prefers a target expressed in %, or a target expressed both in % and an energy unit.
A small majority is in favour of differentiated targets for different transport
modes
A large majority does not want targets that differentiate between different types of LCF fuels (i.e. non-crop fuels).
A large majority is in favour of defining halfway or biennial targets also for
the period 2020-2030 to ensure that there is a market development not only in the years just before 2020.
The few answers giving actual figures for mandates and other data are not
consistent in terms of the assumptions made and therefore the numbers cannot be compared or used for a recommendation. As a follow-on this also applies to other derived impacts e.g. investments, biomass usage, GHG emission reduction etc.

108
III.3. The Current Situation in Transport Fuels64
Take away Messages
64 Extracts from a Memo by Lars Waldheim, Consultant, SGAB Reviewer.
Overall the renewable fuels are 5.7% of the transport fuels in 2014, relative
to the 10% target in 2020. This is the target that was set for 2010.
Most member states are close to this target, but there are some significant deviations where a few member states have almost no renewable fuels and two member states (Finland, Sweden) have already passed the 2020 target.
The 14 Mtoe of biofuels used in 2014 must be doubled to 2020 to meet the
RED (Renewable Energy Directive) target of 10% unless significantly propped up by the use of RE electricity in the rail system.
The production in the EU of ethanol, 4.7 million tons, and biodiesel, 10.1
million tons, respectively, in 2014, is at present more or less in balance with the demand while there are no significant imports (or exports) in the last years.
However, there is a very significant installed overcapacity for both ethanol
and biodiesel; relative to the current production (overall utilization is only 75% and 50%, respectively).
The HVO capacity in Europe is close to 2 million tons but how much is
actually used in Europe is not clear as some quantities are exported outside Europe.
So called second generation fuels are not being produced in any significant
quantity yet.
The ethanol consumption corresponds to a blend ratio of almost 8% by volume in all gasoline. Further expansion by blending is limited by the 10% blend wall, unless flex fuel vehicles sales increased drastically.
The biodiesel usage, relative to the diesel consumption indicates that the blend wall is also very close; at present some 6% or more, relative to 7% accepted in the diesel fuel standard.
There is still some room for additional production and utilization for both
ethanol and biodiesel before the cap on crop-based fuels of 7% is reached.

109
Background The 2020 target of 10% cannot rely on first generation biofuels alone, as these were capped to 7% in 2015, and foreseen to be complemented by a combination of Renewable Electricity (RE) electricity, waste based biofuels and advanced biofuels, where a 0.5% reference target for the member states is proposed for the latter. However, the anticipated capacity build-up of advanced and waste-based renewable fuels have gone slower than what was anticipated in 2009 when the original RED directive was launched.
To change this slow increase in the production of renewable advanced fuels, a system that both provides the necessary policy framework and ensures a viable market for the renewable fuel products must be put in place.
The purpose of this section is to give an overview of the use of transports fuels. Since transport fuels is a global issue, the document has a global outlook, but since the objective of SGAB relates to the decarbonisation of the transport sector in the EU and more specifically targets for 2030 on renewable fuels (advanced biofuels, biofuels and renewable fuels) the document will focus on the EU situation.
The aim has been to provide as updated information as possible on the present use of transport fuels. However, there is a lag in statistical reporting and to generate certain more in-depth perspectives from the statistics requires compilation from various sources which has been beyond the resources available for this work. This also means that the data cannot be consistently given for one year; instead the most recent information found has been used.
The Use of Fossil Fuels and Renewable Fuels in Transport
The global consumption of petroleum products for all purposes (i.e. transport, heating and power generation) in 2014 amounted to 4,211 Mtoe, this being distributed such that USA used 20%, the rest of North, Central and South America 12%, EU28 14%, Eurasia excluding EU 6%, China 12%, Japan 5%, India 4% and the rest of Asia and the Pacific’s 13%, Middle East 9% and Africa 4%. The overall rate of growth has been slightly under 1%/year over the last decade. The use of transport fuels, including biofuels, in 2012 amounted to 2 658 Mtoe, or 63% of all consumption of petroleum products in that year, Figure 21.
In Figure 22, the global (fossil) consumption is divided according to the mode of transport. Passenger transports by light duty vehicles (LDVs) consumes almost half of the total energy, followed by air, heavy duty trucks and marine at almost the same fraction, followed by marine, bus, rail and others.
In Figure 23, the geographic variation in energy consumption of the various transport modes is shown.

110
Figure 21: World consumption of transport fuel 2012.
(Adapted from 65, 66) There are fairly large regional differences in the relative importance of passenger transports, freights, rail and air as means for transport. However, the industrialized countries have a similar pattern and also consume half of the transport energy, i.e. this pattern gains considerable weight in a global perspective.
The EU28 fuel consumption in 2014 is shown in Figure 24. The volume of biofuels, biogas oline, biodiesel and biogas (for Eurostat definitions see text below the figure caption) was 14 Mtoe in 2014 (biodiesel 11.3, biogas oline 2.6 and biogas 0.1 Mtoe, respectively), a share of approximately 4% of the overall fuel consumption. However, the projected share67 rises to 5.7% in land transport 2014, to be compared with the RED directive 10% target of 2020, when estimated as in this directive (i.e. excluding aviation and maritime use, and with some double-counting on certain fuels and adding renewable electricity68 used in transport).
65 BP statistical review of world energy2015. 66 U.S. Energy Information Administration, International Transportation Energy Demand Determinants (ITEDD-2015). 67 Renewable energy progress report. COM(2015) 293 final, SWD(2015) 117 final}. 68 Approx. 1.5 Mtoe (estimate, 27.5 %, EU share of RE electricity and gross 5.6 Mtoe electricity used in transport).
39%
36%
12%
9%1%
0% 0%2%
Motor gasoline
Diesel
Jet fuel
Resid. Oil
Propane
Natural gas
Electricity
Biofuels
< 1 %< 1 %2012
2 658 Mtoe

111
Figure 22: The share of transport modes in global transport energy consumption. Total 2,596 Mtoe.
(Adapted from 66)
Figure 23: The geographical variation in energy consumption 20122, by mode and by region.
45,2%
12,0%
10,5%
12,0%
12,0%
1,9% 3,8%2,3%
Cars
HDVs
LDVs
Air
Marine
Rail
Bus
Other

112
Figure 24: The EU28 consumption of transport fuel 2014.
(Based on data compiled from 69) Note that gas/diesel oil includes non-road transports. Biodiesel contains all liquid biofuels which are added to, blended with or used straight as transport diesel (e.g. FAME, DME, BTL, HVO, vegetable oil). Bio-gasoline contains liquid biofuels which are added to, blended with or used straight as transport gasoline (e.g. bio-ethanol, bio-methanol, 47% of bio-ETBE and 36 % of bio-MTBE
However, there is a considerable spread in this number among the member states, Figure 25. Some of the member states are lagging behind in this figure, while most are close to the EU average, France and Austria a bit more than the average and Finland and Sweden is ahead with the 10% goal already being passed.
69 http://ec.europa.eu/eurostat/web/energy/data/database
55%
22%
14%
2%2% 1% 3% 1%
0%
Gas/ Diesel oil
Gasoline
Aviation kerosene
Electricity
LPG
Natural gas
Biodiesel
Biogasoline
Biogas
352 Mtoe
EU28 2014
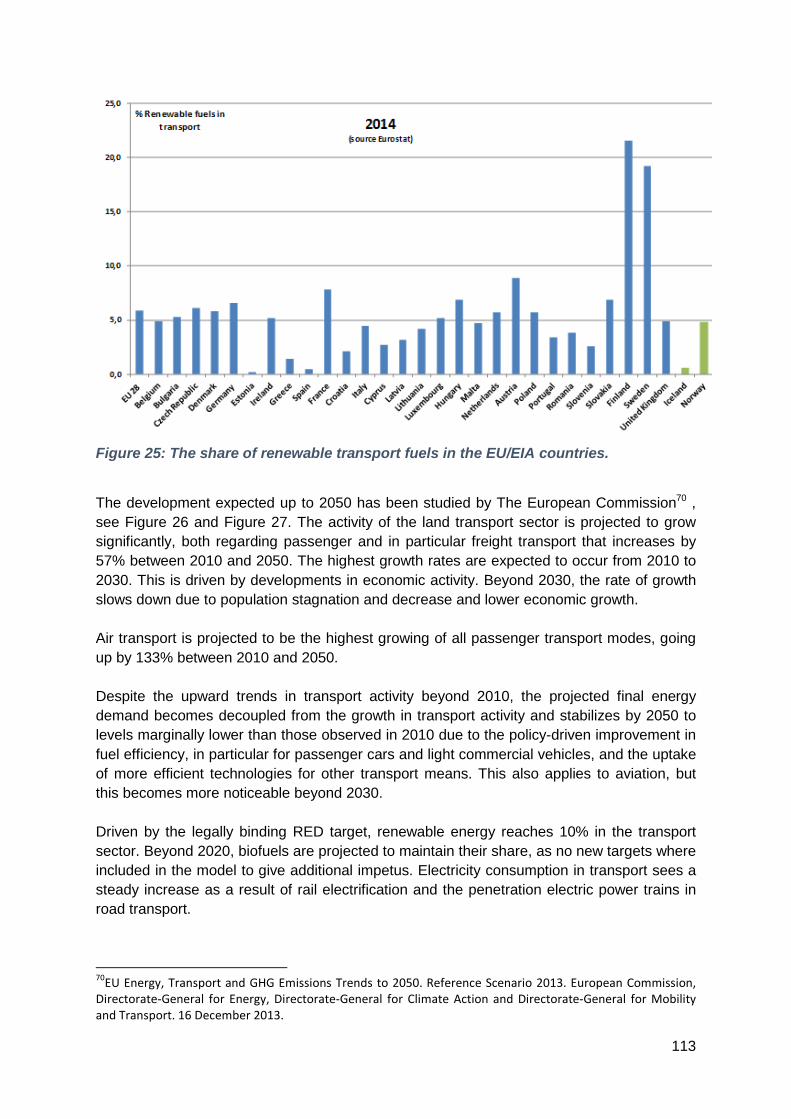
113
Figure 25: The share of renewable transport fuels in the EU/EIA countries.
The development expected up to 2050 has been studied by The European Commission70 , see Figure 26 and Figure 27. The activity of the land transport sector is projected to grow significantly, both regarding passenger and in particular freight transport that increases by 57% between 2010 and 2050. The highest growth rates are expected to occur from 2010 to 2030. This is driven by developments in economic activity. Beyond 2030, the rate of growth slows down due to population stagnation and decrease and lower economic growth. Air transport is projected to be the highest growing of all passenger transport modes, going up by 133% between 2010 and 2050. Despite the upward trends in transport activity beyond 2010, the projected final energy demand becomes decoupled from the growth in transport activity and stabilizes by 2050 to levels marginally lower than those observed in 2010 due to the policy-driven improvement in fuel efficiency, in particular for passenger cars and light commercial vehicles, and the uptake of more efficient technologies for other transport means. This also applies to aviation, but this becomes more noticeable beyond 2030. Driven by the legally binding RED target, renewable energy reaches 10% in the transport sector. Beyond 2020, biofuels are projected to maintain their share, as no new targets where included in the model to give additional impetus. Electricity consumption in transport sees a steady increase as a result of rail electrification and the penetration electric power trains in road transport.
70EU Energy, Transport and GHG Emissions Trends to 2050. Reference Scenario 2013. European Commission, Directorate-General for Energy, Directorate-General for Climate Action and Directorate-General for Mobility and Transport. 16 December 2013.

114
The 2020 target of 10% renewable energy in land transport translates to some 30 Mtoe 2020 compared to the 14 Mtoe of biofuel used 2014, if double counting and use of renewable electricity is not considered.
Figure 26: The development of fuel consumption per transport mode to 2050.

115
Figure 27: The development of fuel consumption to 2050.
Note that this is not the same graph as in Figure 26 above, as a new reference scenario was published in June 2016 after finishing this memo.

116
III.4. International Airlines Group on Sustainable Aviation Fuel71
Existing policy mechanisms in Europe are insufficient to support the development of Sustainable Aviation Fuel (SAF), and some are providing a disincentive for producers to invest in SAF production. Currently the EU Renewable Energy Directive (RED) is creating a significant cost differential in favour of road renewable diesel compared to aviation fuels. As a result, fuel suppliers are incentivised to direct biomass into renewable diesel production rather than into SAF.
With the revision of the EU RED, there is an opportunity to address this inequity: to build opportunities to exploit new low-carbon fuel and economically benefit from the development of a SAF industry. However, we believe that a simple blending mandate that incorporates aviation fuels could be very damaging and has the potential to create significant competitive distortion for EU based airlines.
The International Airlines Group (IAG) supports the introduction of tradable certificates across the EU and believes that within incentive regimes, SAF suppliers should be able to elect to opt in to these mechanisms. This approach would address the need to mandate specific aviation blending volumes. The Netherlands Government and the U.S. Government already provide incentive certificates without the need to include SAF in mandatory blending obligations. This approach should be replicated across Europe. Initially, advanced fuels certificates will need to have a value significantly higher than for conventional fuels to encourage investment and to address the higher capex associated with advanced fuels production.
The EU needs to prioritise advanced fuels research and development that is able to address those sectors that cannot be easily decarbonised. Heavy goods freight and aviation will be reliant on middle distillate fuels for many decades to come. Some advanced technologies can provide highly sustainable low carbon fuels manufactured from low value wastes and residues. It should be a priority of the RED to provide a robust support mechanism to allow these fuels to reach commercial scale.
IAG does not advocate a SAF blending mandate applied only to fuel uplifts in Europe for the following reasons:
• A regional mandate would lead to significant market price distortions by increasing
the cost of jet fuel relative to other parts of the world. Mandates must take account of the international nature of aviation and avoid any competitive distortion effects.
71 Extracts from a Memo prepared by Leigh Hudson, IAG Sustainable Fuels and Carbon Manager, British Airways.

117
• Markets created by government through policy mandates are often not considered stable by banks and may not be useful for securing the necessary capital funding for biojet projects.
• Mandates can lead to environmentally undesirable consequences – for example
leading to indirect impacts associated with some crop based fuels or airlines flying with excess fuel to avoid higher fuel prices in a specific region.
IAG recommends that the EU:
• Ensures that SAF is integral to future fuels policy and that the development of technologies for aviation and other sectors with limited substitution options are prioritised.
• Provides long term policy certainty and financial and risk sharing mechanisms for
new technologies to encourage investment in advanced fuels production. These aspects should be addressed in future EU mechanisms to ensure that the EU is able to exploit future markets for advanced fuels technologies.
• Recognises SAF under the EU RED by including aviation in the incentive regime
provided by REDII, without the need for regional mandatory blending mandates.
• Provides support for the scaling-up and rollout of SAF production capacity through the provision of financial products and services structured in a way to unlock private sector sources of capital.
• Ensures that additional funding is available for R&D that can also help leverage
private sector funding.
International Civil Aviation Organization (ICAO) At the Plenary Session of the UN aviation agency’s 39th Assembly in Montréal, 6 October 2016, an agreement was reached on a new Global Market-Based Measure (GMBM) to control CO2 emissions from international aviation.
ICAO’s Carbon Offsetting and Reduction Scheme for International Aviation (CORSIA) is designed to complement the basket of mitigation measures the air transport community is already pursuing to reduce CO2 emissions from international aviation. These include technical and operational improvements and advances in the production and use of sustainable alternative fuels for aviation.
Implementation of the CORSIA will begin with a pilot phase from 2021 through 2023, followed by a first phase, from 2024 through 2026. Participation in both of these early stages will be voluntary and the next phase from 2027 to 2035 would see all States on board. Some exemptions were accepted for Least Developed Countries (LDCs), Small Island Developing

118
States (SIDS), Landlocked Developing Countries (LLDCs) and States with very low levels of international aviation activity.
119
III.5 ED95 as a solution for decarbonising Heavy Duty Transport72
Ethanol has a high CO2 performance and does not face the same sustainability challenges as biodiesel, and also could replace diesel in heavy duty applications, through the existing neat ethanol fuel ED95 (95% hydrous ethanol + additives). ED95 would be a viable tool to widen the EU mix of biofuels for heavy duty transport, since no biofuel alone could replace fossil diesel. It would also contribute in strengthening EU’s energy security. The ED95 fuel is used in diesel type engines adapted for ED95, with diesel efficiency levels (so a litre of ethanol is used more efficiently as ED95, than if low blended into petrol). ED95 has been used in buses and trucks since 1986, mostly in Scandinavia, but also in France, the UK, Belgium, Poland, Italy and Spain. It is an official EU emission certification fuel1. ED95 is standardized in Sweden and standardization processes are underway in France, India and South Africa.
Proposed actions to speed up the use of ED95 in EU:
Create a common EU fuel standard for ED95, based on the ongoing standard work described above. The standardisation should include a harmonisation of the denaturants used for the hydrous ethanol in ED95.
Set up an EU supported ethanol corridor, similar to the “Blue Corridor” for LNG. This
could demonstrate the viability of ethanol as a HD fuel in EU on a large scale, and kick-start the use of high-blend ethanol fuels like ED95 and E85. The project should include financial incentives for establishing ethanol fuel infrastructure and HD/MD ethanol vehicles.
Regarding the regulations for the E85/ED95 refuelling infrastructure, fuel distribution
and safety, EU regulations also need to be harmonised. We propose to use same regulations for E85/ED95 as for petrol, which is the case in Scandinavia.
Promote common EU policies and actions for speeding up the introduction of high
blend biofuels. Two ways for that can be 1) to promote vehicles running on high-blend sustainable biofuels in public procurement of buses and trucks and 2) to revise the Eurovignette directive to differentiate charging on the basis of fossil (WTW) carbon dioxide emissions.
Recommend MS to tax all fuels according to energy content and fossil carbon
content. Today, tax is generally based on volume, not energy content, which punishes especially high blend biofuels, that often has a lower energy content per litre.
The work on certification of carbon dioxide emissions and fuel consumption of HDVs should allow declaration of reduced emission values (WTW) for vehicles running on sustainable biofuel.
72 Extracts from a Memo prepared by Jonas Strömberg & Wästljung of SCANIA.
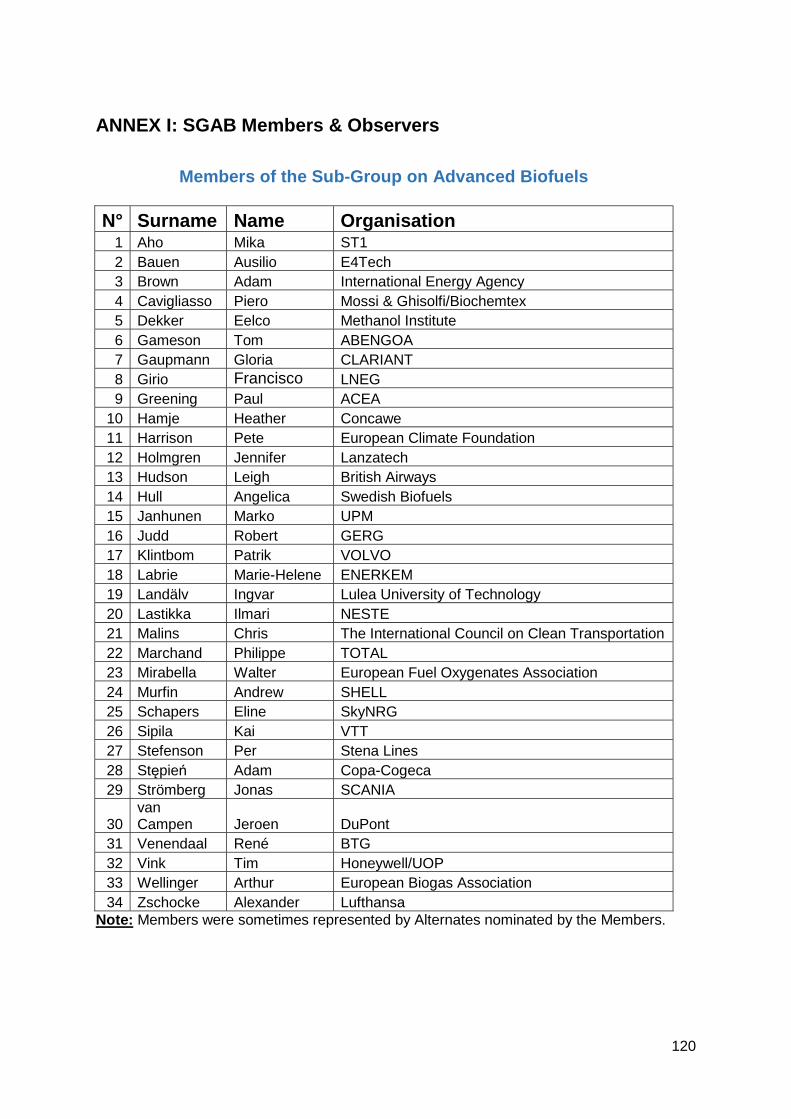
120
ANNEX I: SGAB Members & Observers
Members of the Sub-Group on Advanced Biofuels
N° Surname Name Organisation 1 Aho Mika ST1 2 Bauen Ausilio E4Tech 3 Brown Adam International Energy Agency 4 Cavigliasso Piero Mossi & Ghisolfi/Biochemtex 5 Dekker Eelco Methanol Institute 6 Gameson Tom ABENGOA 7 Gaupmann Gloria CLARIANT 8 Girio Francisco LNEG 9 Greening Paul ACEA
10 Hamje Heather Concawe 11 Harrison Pete European Climate Foundation 12 Holmgren Jennifer Lanzatech 13 Hudson Leigh British Airways 14 Hull Angelica Swedish Biofuels 15 Janhunen Marko UPM 16 Judd Robert GERG 17 Klintbom Patrik VOLVO 18 Labrie Marie-Helene ENERKEM 19 Landälv Ingvar Lulea University of Technology 20 Lastikka Ilmari NESTE 21 Malins Chris The International Council on Clean Transportation 22 Marchand Philippe TOTAL 23 Mirabella Walter European Fuel Oxygenates Association 24 Murfin Andrew SHELL 25 Schapers Eline SkyNRG 26 Sipila Kai VTT 27 Stefenson Per Stena Lines 28 Stępień Adam Copa-Cogeca 29 Strömberg Jonas SCANIA
30 van Campen Jeroen DuPont
31 Venendaal René BTG 32 Vink Tim Honeywell/UOP 33 Wellinger Arthur European Biogas Association 34 Zschocke Alexander Lufthansa
Note: Members were sometimes represented by Alternates nominated by the Members.

121
SGAB Observers of Sustainable Transport Forum
N° Family name First name Ministry - Organisation Country/Organisation
1 Bach Heinz Ministry of Agriculture, Forestry, Environment & Water Management Austria
2 Bernodusson Jón The Icelandic Transport Authority Iceland 3 Buffet Laura Transport & Environment NGO 4 Cluyts Ivo Ministry of Environment Belgium 5 Desplechin Emmanuel ePure European Association 6 Florea Leonard Regulatory Authority for Energy Romania 7 Garofalo Raffaello EBB European Association 8 Gruson Jean-François IFP Energies nouvelles France 9 Hameau Thierry SNCF France
10 Leahy Patrick Department of Transport UK 11 Neeft John Netherlands Enetrprise Agency The Netherlands 12 Nicolau Alexandra General Directorate for Energy & Geology Portugal 13 Pezzaglia Marco Consultant, Ministry of Economic Development Italy 15 Stausbøll Yvonne UPEI European Association 16 Weber Thomas Federal Ministry for the Environment Germany
Note: Observers were sometimes represented by Alternates nominated by the Observers.
SGAB Representations
MEMBERS OBSERVERS
Interest Group Participants Interest Group Participants
Technology Providers
12 Member States 12
Industry associates 7 European Associations
3
Consultants 4 NGO 1
Oil companies 3
Airlines 2
Heavy Duty transport 2
Think tanks 2
Maritime transport 1
IEA 1
Total 34 Total 16

122
ANNEX II: SGAB Deliverables
1. Minutes of Meetings
Date Deliverable / Minutes of meetings Author/Contributor
18/12/2015 Minutes of the 1st Meeting Rapporteurs/Chair
29/01/2016 Minutes of the 2nd Meeting Rapporteurs/Chair
26/02/2016 Minutes of the 3rd Meeting Rapporteurs/Chair
22/04/2016 Minutes of the 4th Meeting Rapporteurs/Chair
08/06/2016 Minutes of the 5th Meeting Rapporteurs/Chair
07/10/2016 Minutes of the 6th Meeting Rapporteurs/Chair
2.Reports
Date Deliverable / Reports Author/Contributor
21/03/2016 Response to the LCF 2030 Questionnaire Rapporteurs/Chair
27/03/2016 RED Consultation response report Rapporteurs/Chair
04/06/2016 List of important references and reports Rapporteurs/Chair
07/06/2016 Terminology, Glossary, abbreviations & conversion factors Rapporteurs/Chair
19/10/2016 Technology status and reliability of the value chains Vice Chair/ Rapporteurs/Chair

123
3.Memos
N° Date Deliverable / Memos Author/Contributor
1 27/01/2016 Business models for introduction of biofuels in aviation
SkyNRG
2 27/01/2016 NER 300 Feedback UPM
3 28/01/2016 Biological fermentation pathways Clariant
4 28/01/2016 Sustainable transportation business model Volvo
5 28/01/2016 NER300 instrument – Remarks and experiences in advanced biofuels area
VTT
6 08/02/2016 Memo on the potential realistic development of 1G and 2G
BTG
7 15/02/2016 Template for possible contributions of Low Carbon Fuels (LCF) by 2030
ENERKEM
8 17/02/2016 Voluntary RED opt-in in The Netherlands: HBEs (bio-tickets) generation with the supply of biokerosene to the national transport market
SkyNRG
9 18/02/2016 Some reflections on PtX as a solution for surplus intermittent (wind, sun) electricity production
Netherlands Energy Agency/John Neeft
10 21/03/2016 NER 300 Initiative and Status of the Selected Bioenergy Projects
Rapporteurs/Chair
11 21/03/2016 Response to the LCF 2030 Questionnaire Rapporteurs/Chair
12 30/03/2016 Capital and Investment Support Systems in the USA Rapporteurs/Chair
13 08/04/2016 A low capital pathway to cellulosic biofuels using RTP™ and FCC co-processing technology
Honeywell - UOP
14 12/04/2016 Potential contribution of MSW-to-Alternative (non-bio) fuel by 2030
ENERKEM
15 15/05/2016 Renewable Fuels and Biofuels mandates and regulations overview
Rapporteurs/Chair
16 30/06/2016 The Current Situation in Transport Fuels Rapporteurs/Chair
17 01/07/2016 Obstacles to achieve an internal market for transportation fuels with bio-components
Rob Vierhout
18 19/08/2016 ED95 as a solution for decarbonising Heavy Duty Transport
SCANIA
19 31/10/2016 Standardization Rapporteurs/Chair
20 04/12/2016 SGAB Renewable Fuel Targets; biofuel quantities and relation to the EU use of energy for transports
Rapporteurs/Chair

124
ANNEX III: Extracts from Memos73
AIII.1. Terminology and Glossary74
In order to facilitate communication between the various stakeholders the SGAB produced a Report on Terminology and Glossary with common abbreviations & conversion factors. This is a monumental work that includes 28 definitions, 137 glossary terms, 101 common abbreviations and the most common factors used for energy and advanced biofuels. The information was assembled from the following sources at the time of writing the Report; April 2016. The sources used are (in alphabetical order):
• American Society of Testing and Materials (ASTM) Standards
• European Union Directives
• European Committee for Standardization (CEN)
• European Union’s Joint Research Center
• European Environmental Agency
• European Union/Eurostat
• International Energy Agency – Bioenergy Implementing Agreement
• International Energy Agency
• International Standardization Organization
• Military Specifications All SGAB Members and Observers contributed to the gathering process and commented on several of the definitions. SGAB is of the opinion that this Repost is an excellent basis for all stakeholders to use the "same language".
73 The full Memos can be found in the SGAB CIRCABC Library. 74 Compiled by Stamatis Kalligeros, Hellenic Naval Academy, Mechanics & Materials Division, Director of Fuels & Lubricants Laboratory, SGAB Reviewer.
125
AIII.2. References and Reports75
In order to create a library of valuable information the SGAB Members & Observers were asked to each recommend 3 reports, studies or publications which in their opinion were of high quality and worth having them highlighted by the SGAB. The Core Team also recommend several reports. This resulted in a list of 144 references and reports that the industry considers of importance. From these:
108 are publically available and directly downloadable reports,
For example: Ahlvik P.: “Well to wheel efficiency for heavy duty vehicles”. Ecotraffic ERD3 AB, 2009. Floragatan 10B, SE-114 31 Stockholm, Sweden. This document is available at: http://www.ecotraffic.se/media/5447/3.__2009__wtw.pdf. Proposed by: VOLVO
19 are directly available in PDF in the CIRCABC (common Space)
For example: Dutch Ministry of Infrastructure and the Environment: “A vision on sustainable fuels for transport. Key findings of the SER vision programme, Towards a sustainable fuel mix for transport in the Netherlands”. PO Box 20901, NL-2500 EX The Hague. June 2014.
SGAB-RP-048 SER - A vision on sustainabl Proposed by: SkyNRG
17 are reports that cannot be archived due to copyright issues.
For Example: FprEN 16723-1:2015, “Natural gas and biomethane for use in transport and biomethane for injection in the natural gas network — Part 1: Specifications for biomethane for injection in the natural gas network”. European Committee for Standardization (CEN), Avenue Marnix 17, B-1000, Brussels 2015. Proposed by: GERG
The SGAB Library is continuously updated with new reports and publications as these become available and are recommended by a Member or Observer or by the Core Team.
75 Compiled by Stamatis Kalligeros, Hellenic Naval Academy, Mechanics & Materials Division, Director of Fuels & Lubricants Laboratory, SGAB Reviewer.

126
AIII.3 On NER 30076
AIII.3.1 Experiences from a NER300 Contractor
UPM-Kymmene Corporation was awarded under NER300 funding programme for its BTL concept in Stracel, France by funding amount of 170 M€. UPM’s BTL project initiative in Rauma, Finland was selected on the reserve list (second-ranked project). After long considerations UPM decided not to execute either of the projects.
Required capacity together with complex new technology resulted in high specific investment. NER 300 funding support was based on production but from investors point it would be better if it would support directly the high investment. If utilized, the overall funding support would also be smaller than in production support scheme.
Future EU support schemes could also include support for the basic design phase. In large and complex biorefineries the money spent in this phase is already significant. In addition, EU should consider promoting funding of a few selected biorefinery technology routes with as high as 60-70 % funding rate. If applicable, the production capacity of the flagship refinery could be limited (lower CAPEX) and be just above the threshold capacity where the EBITDA turns positive. In biofuels field this would speed up the commercialization of the relevant technologies.
Publicity of the funded companies is complicated. On the other hand, it is good that stakeholders are aware which companies will be funded. However, if the funded amount is also public information, the vendors may be tempted to allocate the funding support in their tenders and thus the overall CAPEX will increase. It would be recommended that the companies which receives the funding, could decide mutually with EU which information should not be disclosed.
Along the way NER 300 suffered delays in decision making. For the investor any delays from the original schedule may cause uncertainty and hesitation towards the EU bio policy and the applied funding scheme.
UPM decided not to proceed with the process only in June 2015. Prior to this extensive discussion took place both with the authorities in France and EU Commission. As the process had already been long, we considered some technology changes to be applied to the original project. We are thankful for the authorities both in Paris and Brussels for their readiness to consider such changes.
Finally, a decision was made because the project would not have been able to meet the investment criteria that UPM has set. Additionally, it would have been impossible to make a 76 Extracts from Memo by Marko Janhunen, Vice President, Stakeholder relations, UPM.

127
positive investment decision as European Union regulation on advanced biofuels for pre- and post-2020 was pending.

128
AIII.3.2. Remarks and experiences in advanced biofuels area77
With regard to the NER 300, the role and work load of national contact point was high. There was weak harmonization of the NER300 guidelines with EC/EIB and national contact point for proposers (like reference plant price level, exchange rate, inflation level etc.).
In the evaluation period communication with EC/EIB-NCP-proposers was complicated and time-consuming.
The final evaluation process was too long, typically up to two years to the decision.
In the evaluation phase, the key indicator for funding was measured as X €/MWh. This value was used to compare various value chains in bioenergy, perhaps also in the whole RES area. It would be better to compare and rank only projects in the same value chain area with each other. Also the funding/support could be higher in some high capex value chains. It was positive that upfront payment has been used in high capex projects. There are some companies who would prefer high investment grant support compared to NER300 rules. Low risk options for investors would be MS feed in tariffs or certificate type combinations instead of current NER300 funding scheme.
In the future NER300 type instrument should be continued in EU for catalysing large scale flag ship investment. The EU 2030 targets with 40% GHG reductions will even accelerate the demand for innovative investments in SET-Plan. Several studies have indicated more than 1000 MEURO public risk funding need for investments in 7-8 innovative bioenergy value chains beyond the current NER300 period in the 2020-2030. If other renewable transport fuels than biological origin will also be included, the funding demand can be even up to 1 500 MEURO. New value chains will be opened in PtG Power-to-Gas and e.g. PtG-syngas hybrids.
Current NER300 instrument covered support in both ETS and non ETS sector. In the future NER300 type instrument, it might be constructive to differentiate the public support to ETS and non ETS sectors, not using the same X €/MWh criteria. The innovative wind and solar investments are not often in the same category of high capex advanced biofuels investments, so the evaluation criteria can be different for ETS and non ETS and various value chain areas. Wind farms have got support also by MS feed-in tariffs. In the bioenergy area, the innovative upstream raw material procurement and handling solutions can also be eligible for risk funding.
Lack of EU and national post 2020 policies for meeting the EU climate and energy targets has postponed or halted some large biofuels investments. Additionally, the long lasting iLUC
77 Extracts from a Memo by Kai Sipila, Professor, VTT.

129
directive process, debate on bioenergy sustainability and revision of RED directive has increased the political risk for investors. There must be a long lasting and predictable business environment. There is a low level of harmonization on national incentives and policies of biofuels and renewable energy in transport. The energy tax directive should be updated if large share of advanced biofuels is needed for EU 2030 targets. Especially when introducing drop-in renewable diesel and gasoline products up to 100%.
Without significant EU flag ship funding instrument, there will be no large scale flag ship investments in the area of advanced biofuels. There are positive NER300 bioenergy experiences in industry and industrial support to continue the NER300 type instruments with some improvements. Especially the public and industrial interest is high in those MS where impact assessments on EU 2030 climate policy indicate high share of renewable fuels. The results have indicated that the non ETS high 40% GHG reduction is difficult to reach without deep decarbonisation of transport. All key elements are needed; energy efficiency in vehicles, smart mobility, electrification of transport and sustainable advanced biofuels. In Finland the studies have indicated even up to 30%-40% share of advanced biofuels in road transport by 2030, mainly based on various drop-in renewable diesel and gasoline products on top of ethanol and biogas.

130
AIII.4. State aid rules and industrial investments in the innovation chain78
Key Issues are:
1. Asymmetric allocation of investors risk in the presence of state aid.
In investments with significant technology risks, (such as advanced biofuel technologies, wave/tidal power plants etc.), the investor cannot make anyone else share on the technology risk. Typical investments are in the order of hundreds of millions of euros. The investor may be supported by national investments grants of some percent of the investment or by EU via various schemes.
The investor will take the risk of losing all of the investment if the technology does not work well enough to generate an operating profit. However, according to conditions provided he is not allowed to end up with a profit if things do work well. In that case he is considered “over-compensated” and liable to pay back the profit.
With the condition that an investor may lose all the money invested but not allowed to make a profit, it is not possible to create an investment case for a professional investor. Large scale technologies, as a result, are difficult to be developed in Europe.
2. Regulatory management costs
Preparing a notification on state aid is an expensive and time demanding exercise. In our experience, investments have been delayed by years because of such processes – and investment opportunities have been lost.
Many of the NER-300 projects have now been abandoned due to unclear future conditions or delays in accepting national policies in relation to state aid rules79.
78 Extracts from a Memo by Tomas Kåberger, Industrial Energy Policy, Chalmers University of Technology & Max Jonsson, CEO Chemrec AB. 79 In the case of a wave power project the investor was asked to provide data on the residual value of a wave power installation that had been operated for a certain number of years. As the technology had never been operated before it was not possible to tell whether the plant would be possible to operate after that period. Operating and maintenance costs were not known, nor the value of the electricity possible produced. The cost
Europe’s development of new technologies is hampered by the management of state aid and competition rules. This is hurting the future competitiveness of European industries. Present State-aid and competition rules may result in protecting fossil fuels at the expense of renewables.

131
3. Remaining regulatory risks The complex interaction between European policies and Member State’s policies are difficult to understand for investors as well as for member state civil servants. In the time horizon of the investments the regulations may change. The state aid rules are relying on the idea that any error made by member states will in the end result in the investing company being liable to pay back the aid that at a later stage was considered illegal. These regulatory risks are prohibitive for large, new developments which also entail significant technological risk.
4. Unpredictable decisions of what may constitute state aid
It has been common among companies to believe that obligations and restrictions are not state aid. Companies have likewise believed that a tax on bringing fossil carbon to the atmosphere was not state aid to renewable fuels. The recent decision that Swedish carbon dioxide tax not being levied on biofuels constituted state aid has created new uncertainty discouraging investments.
Distributors of biofuels have found their investments losing all their value as energy and carbon dioxide tax has been put on biofuels to compensate for what the commission considered previous “over compensation”. Unfortunately introduced at the same time as oil prices collapsed making the biofuel businesses loss making and killing off the value of investments made to meet EU targets.
5. Innovation Drain
The Commission's management of state aid rules is confusing for investors and thereby hinder European industries from being competitive actors in the global energy transition. The result is that European research achievements cannot be industrialised in Europe. The technologies are sold to American or more often Chinese companies able to commercialise them in their domestic markets and then export them to Europe.
Some constructive suggestions for the future:
estimate was to be delivered only after it had been certified by an auditor. This value could not be estimated with any reasonable accuracy. No auditor was willing to certify any estimate. And the project was delayed for years.

132
When responding to what is said above, it is not sufficient to claim that we have misunderstood things. Our descriptions are how the decision making actors of the industry understand the system. If it is wrong, this must be made clear beyond doubt by EU institutions. The more constructive interpretation must be fully understood by national governments, authorities as well as the private industries engaged in development. Uncertainty is a barrier in itself.
Where EU sets targets, requiring functioning industrial innovation systems
to reach them, state aid rules should be adjusted to make implementation feasible or investors in innovative first-of-a-kind technologies should be offered a waiver from state-aid and competition rules.
Even when EU policies of support is not provided, possible national policy
opportunities should be posted by the commission.
When a member state asks for acceptance for a state aid, the decision of the commission should be a commitment for a period in time relevant to the investment removing the risk for the investor.
For the energy sector fossil carbon dioxide taxes should clearly not be seen
as state aid and member states allowed introducing them generally also when they may choose to tax facilities already within the EU ETS.
Some of the quantitative easing efforts of the ECB and other central banks,
which today mainly inflate non-productive asset values at the expense of productive and transformational investment, should be redirected to the real economy. Central banks should buy green bonds used to finance projects with a demonstrated large GHG benefit. These bonds should involve risk on the value of renewables over fossil, not merely be branded “green” as is generally the case today.

133
MI-04-17-510-E
N-N
Doi: 10.2832/494620