final report bacteria free water for drinking by silver ... free water for drinking by silver...
TRANSCRIPT

Bacteria Free Water for Drinking by Silver Treatment – KSCST – IISc. – 2013 1
Bacteria Free Water for Drinking by Silver Treatment
(BFWDST) DST File No. DST/TM/WTI/2k10/22/(G) Dated 09/09/2011
Final Report
Submitted to
Department of Science and Technology Government of India, New Delhi
Mr. A. R. Shivakumar Dr. K. Kesava Rao Senior Fellow and Principal Investigator, Professor, Karnataka State Council for Department of Chemical Engineering Science and Technology, Bangalore Indian Institute of Science, Bangalore
Project Associates: ejaswini K. Sowmya Shree S.D. Bhargavi M.P. Prajanya G.P. Navya Shree R.
Karnataka State Council for Science and Technology Indian Institute of Science
Bangalore 560 012.

Bacteria Free Water for Drinking by Silver Treatment – KSCST – IISc. – 2013 2
BFWDST - Table of Contents
1. INTRODUCTION Page No.
1.1. General 1
1.2. Water contamination 2
1.3. Silver susceptibility to coliforms 3
1.4. Objectives 4
2. LITERATURE SURVEY
2.1. Sampling 5
2.2. Standard methods of drinking water treatment 5
2.3. Coliform bacteria 6
2.4. Water quality analysis 9
3. MATERIALS AND METHODOLOGY
3.1. Samples Sources 10
3.1.1. Rain water 10
3.1.2. Open well water 10
3.1.3. Bore well water 11
3.2. Silver sheet immersion method 11
3.3. Methodologies to treat water using silver sheet and to analyze water
for microbial count 12 3.3.1. H2S Vials 12
3.3.2. Heterotrophic Plate Count 13
3.3.3. Multiple Tube Fermentation Technique 16
3.3.4. Reduced flow method 18

Bacteria Free Water for Drinking by Silver Treatment – KSCST – IISc. – 2013 3
4. EXPERIMENTS AND RESULTS
4.1. Analysis of water quality by Silver treatment 22
4.1.1. H2S Vials 25
4.1.2. Heterotrophic Plate Count 26
4.1.3. Multiple Tube Fermentation Technique 31
4.1.4. Reduced flow method 41
4.2. Residual effect of Silver in water treatment 42
4.3. Graphical Representation 43
4.4. Performance of water purifiers bought from market 61
4.4.1. Kent Gold 61 4.4.2. Aqua sure - Kitanu Magnet 65
4.4.3. Pure it from Hindustan UniLever 68
4.5. Verification of results with other Laboratories 73
4.5.1. Mines and Geology Department 73
4.5.2. Essen & Co. 74
5. CONCLUSIONS 75
6. REFERENCES 76 7. ANNEXURES 78 ACKNOWLEDGMENT 82

Bacteria Free Water for Drinking by Silver Treatment – KSCST – IISc. – 2013 4
Chapter 1
INTRODUCTION
1.1. General: “World Health Organization” considers that “drinking-water” should be “suitable for human
consumption and for all usual domestic purposes including personal hygiene.” Diverse regulatory agencies adopt similar definitions. Drinking-water should therefore be suitable for consumption, washing/showering and domestic food preparation. In human health terms, exposure to water and its constituents can occur though ingestion, contact and aerosol inhalation. Drinking-waters should be safe for lifetime use, taking account of differing sensitivities that occur across life stages, but all are not necessarily suitable for individuals suffering from certain specific immune-compromising disorders.
Drinking-waters also include those obtained from non-piped sources, such as from springs and community wells, in bottles and as ice. The control of faecal contamination in drinking-water systems and sources, where it occurs, is of primary importance. Faecal-specific indicator bacteria such as E. coli are the parameters of first importance in monitoring faecal pollution. Piped drinking-water supplies typically involve source abstraction, treatment and distribution. The latter may include ancillary devices at domestic or institutional levels, such as softeners, activated carbon treatment, vending machines, dispensers, etc.
Drinking water Standards:
Table 1.1: Bacteriological quality of drinking water (a) (Indian Standard – Drinking water specification: IS 10500 - Doc: FAD 25(2047) C)
Organisms Guidelines All water intended for drinking : E. coli or thermotolerant coliform bacteria (b, c)
Must not be detectable in any 100 ml sample.
Treated water entering the distribution system : E. coli or thermotolerent coliform Bacteria (b)
Must not be detectable in any 100 ml sample.
Total coliform bacteria Must not be detectable in any 100 ml sample. Treated water in the distribution system : E. coli or thermotolerent coliform Bacteria Total coliform bacteria (d)
Must not be detectable in any 100 ml sample. Must not be detectable in any 100 ml sample. In the case of large supplies, where sufficient samples are examined, must not be present in 95% of samples taken thoughout any 12 month period.
a) Immediate investigative action must be taken if either E.coli or total coliform bacteria are
detected. The minimum action in the case of total coliform bacteria is repeat sampling; if these bacteria are detected in the repeat sample, the cause must be determined by immediate further investigation.
b) Although, E.coli is the more precise indicator of faecal pollution, the count of thermotolerant coliform bacteria is an acceptable alternative. If necessary, proper confirmatory tests must be carried out. Total coliform bacteria are not acceptable indicators of the sanitary quality of rural water supplies, particularly in tropical areas where many bacteria of no sanitary significance occur in almost all untreated supplies.

Bacteria Free Water for Drinking by Silver Treatment – KSCST – IISc. – 2013 5
c) It is recognized that, in the great majority of rural water supplies in developing countries, faecal
contamination is widespread. Under these conditions, the national surveillance agency should set medium-term targets for progressive improvement of water supplies
d) In the remaining five percent sample total coliform bacteria should not exceed 10/100ml.
BIS 10500: 1991
Water in Distribution System Ideally, all samples taken from the distribution system including consumers’ premises, should be free from coliform organisms. In practice, this is not always attainable, and the following standard for water collected in the distribution system is therefore recommended when tested in accordance with IS 1622: 1981.
Throughout any year, 95 percent of samples should not contain any coliform organisms in 100 ml No sample should contain E. Coli in 100ml No sample should contain more than 10 coliform organisms per 100 ml Coliform organisms should not be detectable in 100 ml of any two consecutive samples.
ISI-IS: 2296-1982
No sample should contain E. coli in 100 ml; No sample should contain more than 10 coliform organisms per 100 ml; and Coliform organisms should not be detectable in 100 ml of any two consecutive samples. Bacteriological Standards (http://www.indiawaterportal.org/sites/indiawaterportal.org/files/Drinking%20Water%20Quality%20Standards_BIS_0.pdf) a) For water entering a distribution system, Coliform count in any sample of 100 ml should be zero (0).
b) For water in a distribution system –
(i) E. Coli count in 100 ml of any sample must be zero (0). (ii) Coliform organisms should not be more than 10 per 100 ml in any sample. (iii) Coliform organisms should not be present in 100 ml of any two consecutive samples or
more than 5% of the samples collected for the year [5].
1.2. Water contamination: Water polluted with microorganisms is known as the cause of several water-borne diseases including
typhoid fever, diarrhea, cholera, polio and various respiratory tract diseases. Therefore, in order to assure public health, treatment of microbial contaminated water is very important. Conventional disinfection methods, such as chlorination and ozonation, effectively kill the pathogenic microorganisms; however, the formation of carcinogenic disinfection byproducts limits their potential [12].
The issue of water quality and contamination is touching alarming levels in India. There is a growing concern about increasing level of water contamination and its impact on lives of Indians, which is evident from the water audit. The biggest concern is accessibility to clean and healthy drinking water. A large section of society drinks tap water and risks the contaminants present [Times of India, Bangalore, Thursday, August 22, 2013].
Bacteria Free Water for Drinking by Silver Treatment – KSCST – IISc. – 2013 6
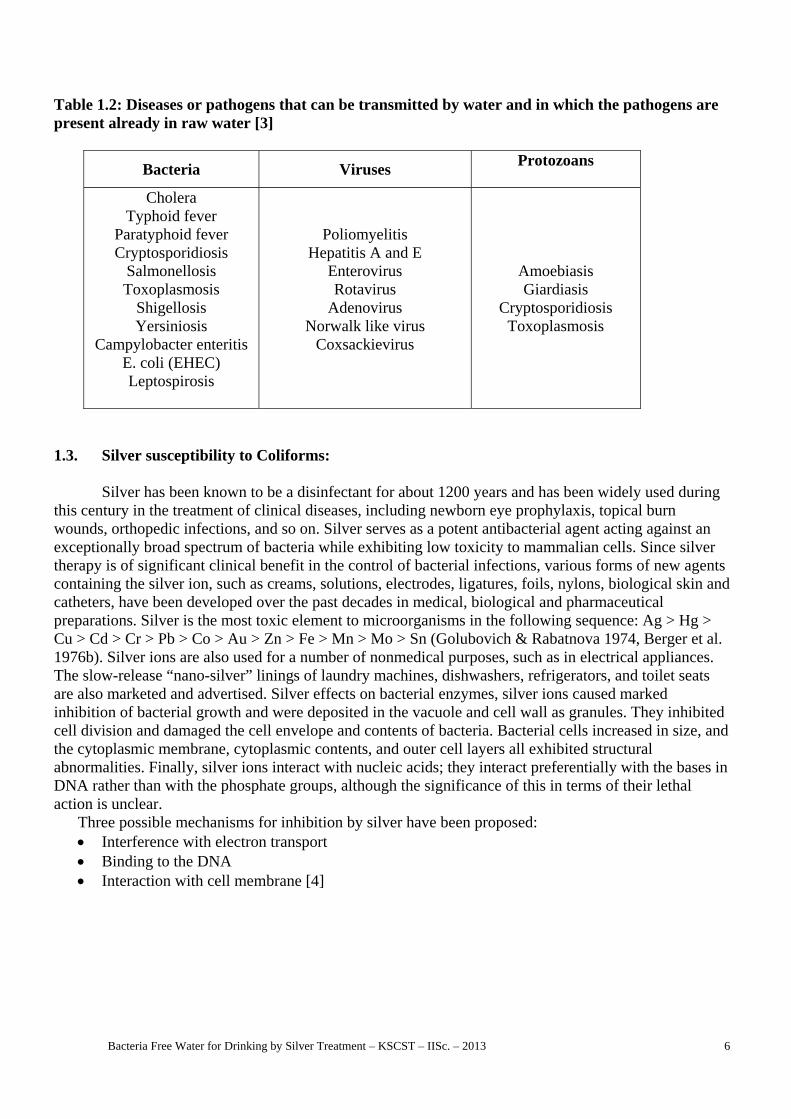
Table 1.2: Diseases or pathogens that can be transmitted by water and in which the pathogens are present already in raw water [3]
Bacteria Viruses Protozoans
Cholera
Typhoid fever Paratyphoid fever Cryptosporidiosis
Salmonellosis Toxoplasmosis
Shigellosis Yersiniosis
Campylobacter enteritis E. coli (EHEC) Leptospirosis
Poliomyelitis Hepatitis A and E
Enterovirus Rotavirus
Adenovirus Norwalk like virus
Coxsackievirus
Amoebiasis Giardiasis
Cryptosporidiosis Toxoplasmosis
1.3. Silver susceptibility to Coliforms:
Silver has been known to be a disinfectant for about 1200 years and has been widely used during this century in the treatment of clinical diseases, including newborn eye prophylaxis, topical burn wounds, orthopedic infections, and so on. Silver serves as a potent antibacterial agent acting against an exceptionally broad spectrum of bacteria while exhibiting low toxicity to mammalian cells. Since silver therapy is of significant clinical benefit in the control of bacterial infections, various forms of new agents containing the silver ion, such as creams, solutions, electrodes, ligatures, foils, nylons, biological skin and catheters, have been developed over the past decades in medical, biological and pharmaceutical preparations. Silver is the most toxic element to microorganisms in the following sequence: Ag > Hg > Cu > Cd > Cr > Pb > Co > Au > Zn > Fe > Mn > Mo > Sn (Golubovich & Rabatnova 1974, Berger et al. 1976b). Silver ions are also used for a number of nonmedical purposes, such as in electrical appliances. The slow-release “nano-silver” linings of laundry machines, dishwashers, refrigerators, and toilet seats are also marketed and advertised. Silver effects on bacterial enzymes, silver ions caused marked inhibition of bacterial growth and were deposited in the vacuole and cell wall as granules. They inhibited cell division and damaged the cell envelope and contents of bacteria. Bacterial cells increased in size, and the cytoplasmic membrane, cytoplasmic contents, and outer cell layers all exhibited structural abnormalities. Finally, silver ions interact with nucleic acids; they interact preferentially with the bases in DNA rather than with the phosphate groups, although the significance of this in terms of their lethal action is unclear.
Three possible mechanisms for inhibition by silver have been proposed: Interference with electron transport Binding to the DNA Interaction with cell membrane [4]

Bacteria Free Water for Drinking by Silver Treatment – KSCST – IISc. – 2013 7
1.4. Objectives of the project: Simple and cost effective method of treating drinking water for removing bacterial contamination has been developed by the Principal Investigator and the concept needs to be evaluated and field tested for varying field conditions. Council in collaboration with Indian Institute of Science will develop a protocol for treating drinking water by using silver metal.
1. Quantification of bacterial removal in drinking water by silver metal treatment 2. Simple, cost effective and field tested products / methods for mass application and comparison
with other methods 3. Documentation and publicizing of the findings
Water quality varies from source to source and place to place. The bacterial contamination of
drinking water is one of the major concerns for both rural and urban population leading to health issues. The established methodology will also be compared with the domestic water purifiers in the market and also in other research laboratories. The target beneficiary is the society and public in general. As the concept is to develop a protocol for water treatment and not a product with commercial interest
A simple concept will be evolved and used both in urban and rural sectors. The product will be developed at individual household level on do-it-yourself basis. Several products may be developed using the same concept and the protocol, so developed for various applications of domestic water treatment.
Bacteria Free Water for Drinking by Silver Treatment – KSCST – IISc. – 2013 8
Chapter 2 LITERATURE SURVEY
2.1. Sampling:
Grab sampling from various sources such as bore well water, open well water, pond water; tap
water and rain water was carried out. The recommended maximum elapsed time between collection and analysis of sample is 8 hours. When analysis cannot begin within 8 h, maintain the sample at a temperature below 40 0C but do not freeze. Maximum elapsed time between collection and analysis must not exceed 24 h (Standard methods for the examination of water and waste water, 21st edition, 2005).
2.2. Standard methods of drinking water treatment:
Water is one of the most commonly used substances on our earth. We need water for all our activities in day-to-day life. Water supply in urban area is always short against the total demand. Surface water is inadequate to meet our demand and we have to depend on ground water. Due to rapid urbanization, infiltration of rainwater into the subsoil has decreased drastically and recharging of ground water has diminished. This scenario requires an alternative source to bridge the gap between demand and supply.
Water from Rainwater collection, open well, bore well, lakes, ponds, rivers and canals can provide water for domestic use. However, all these sources have varying degree of contaminants, rainwater being the purest and the surface water stored in an open pond may be the most contaminated. All the above sources need to be treated for potable purposes.
Rainwater collected from a surface is relatively free from salts and other dissolved impurities compared to ground water from bore well, open well or water from river. However, rainwater collected from the surface had bacteriological contamination. Fecal coliform and E coli are the common and harmful bacteria present in all the above listed sources of water.
Common methods for treating water are
Boiling Chlorination Ozone treatment Ultra Violet light treatment Reverse osmosis Lime treatment Treatment with potassium permanganate
All these treatments are effective in large-scale water treatment and are expensive or beyond
common man’s reach. In addition, all the above methods need either electricity, fuel or chemicals and the water treatment vary with the process and the control mechanism.
New simple and eco-friendly methods for treating water need to be standardized and popularized for
domestic and individual drinking water treatment.

Bacteria Free Water for Drinking by Silver Treatment – KSCST – IISc. – 2013 9
2.3. Coliform bacteria
Coliform bacteria are the Gram-Negative, Non-Spore forming bacilli that ferment Lactose with the production of acid and gas. Escherichia coli are the most extensively studied and best understood bacterium. A large data base exists to which comparisons may be readily made. Moreover, recently E. coli has become a theat to human health because of publicized outbreaks of E. coli. Various concentrations of silver exert bacteriostatic or bactericidal action to a different degree. The group of coliform bacteria as an indicator of other pathogenic micro-organisms, specifically organisms of faecal origin, has much emphasis in all countries. This is due primarily to the fact that the coliform bacteria groups meet many of the criteria for a suitable indicator organism, and are thus a sensitive indicator of faecal pollution: They are abundant in faeces (normal inhabitants of intestinal tract) They are generally found only in polluted waters They are easily detected by simple laboratory tests Can be detected in low concentrations in water The number of indicator bacteria seems to be correlated with the extent of contamination [8].
It is important to remember, however, that not all coliforms emanate from human originate from other mammalian species or from other environmental sources (eg: bird droppings).When coliforms are discharged to the aquatic environment, they will tend to die at a rate which depends, amongst other things, on the temperature and turbidity of the water and the depth to which solar radiation penetrates. Therefore, it is not safe to conclude that the lack of coliforms in water means that it has not been subjected to feacal pollution.
Total Coliforms: The Total coliform group comprises several distinct types (genera) of bacteria. These bacteria have been isolated from the feaces of humans and other warm-blooded animals. Some coliform bacteria are normal inhabitants of soil and water. In testing of coliforms, therefore tests may be run in conjunction to verify their feacel origin. However, this group of bacteria is widely used as a measure of health hazard from feacal contamination. Pathogenic bacteria and viruses causing enteric diseases in humans also originate from feacal discharges of diseased persons. Consequently, water containing coliform bacteria is identified as potentially dangerous. The Total coliform group comprises the aerobic and facultative, gram negative, non-spore forming, rod shaped bacteria that ferment lactose with gas formation within 48 hours at 350C. Feacal Coliforms (Thermo tolerant coliforms): The feacal coliform group of bacteria is indicative of feaces of humans and other warm blooded animals. The specific bacterium Escherichia coli is a part of this group. The test for feacal coliform ia at an elevated temperature, 44.50C, where growth of other non-feacel coliform bacteria is suppressed. Only a small percentage of non-feacal bacteria may also be identified I the feacal coliform test (<5%). Fecal coliform is the standard EPA uses to assure the public of the safety of drinking water, reclaimed water as well as sewage sludge used as biosolids soil amendment and fertilizer. For EPA testing standards, Escherichia coli is the primary fecal coliform. Escherichia coli is the only member species for which standardized data exists."The standard test procedure showing E. coli growth is run at a temperature of 44.5° C. (112.1° F) for 24 hours. On the other hand, the human body will die at an internal temperature of 42.5° C. (108.5° F) and blood is said to coagulate at 42.6° C (108.68° F). The question then becomes, are the test really showing E. coli from the human gut? Any so called study puts public

Bacteria Free Water for Drinking by Silver Treatment – KSCST – IISc. – 2013 10
health at risk by discussing heat inhibited thermotolerant antibiotic resistant, the high heat of the fecal coliform test inactivates many of the bacteria since the optimum growth rate for E. coli (coliform) is 98.6 deg F when incubated for 24 hours. At the optimum temperature E. coli will double every 20 minutes. As an example, if there was only one E. coli bacteria at the start of the test doubling every 20 minutes, in 12 hours the colony would be composed of 68 billion, 719 million, 476 thousand, and 736 hundred bacteria. That would be counted as one most probable number (MPN) colony forming unit (CFU) for the test result and the test still has 12 hours left -- but it would still be counted as one MPN. Organisms have evolved to survive at different temperatures. The fecal coliform test used for drinking water tells us nothing about the E. coli that grows at human body temperature or the changes due to antibiotic treatment for diseases such as Urinary tract infections that may be caused by bathing in contaminated drinking water or dental diseases caused by bacteria not shown in the test. If Total Coliform are the pathogenic entero-bacteriaceae family of enteric bacteria, including E. coli, found in the intestinal tract of animals and humans. E. coli 0157:H7 doesn't show up in the coliform test even when it grows at 44.5° C. Escherichia Coli (E. coli):
This bacterium is a particular member of the feacal coliform group of bacteria; the presence of this organism in water indicates feacal contamination. The bacterium E. coli is exclusively to feacal origin. E. coli reside in human intestinal tracts. They are excreted in large numbers in feaces, averaging about 50 million per gram. Untreated domestic waste water generally contains 5 to 10 million coliforms per 100ml.The degree to which indicator organisms represent the presence of individual pathogens (such as salmonella) has been the subject of continuing investigation. There does seem to be a general correlation between the concentration of Feacal coliform bacteria and the occurrence of salmonella. When feacal coliform numbers is about 1000 per 100ml, salmonella occurrence is about 95% .Relationship between total coliform and individual pathogens is not so quantitative. Thus the test of total coliform is not as effective as an indicator. The Total coliform test is complicated by the presence of non-feacal bacteria. As a general rule, feacal coliform levels are about 20% of total coliform concentrations, although a wide spread exists. Besides being the number one cause of human urinary tract infections, E. coli has been linked to diseases in just about every other part of the body. Pneumonia, meningitis, and traveler's diarrhea are among the many illnesses that pathogenic strains of E. coli can cause. Pathogenic strains of E. coli can cause severe cases of diarrhea in all age groups by producing a powerful endotoxin. [Central America Shigella strain Toxin] Treating E. coli infections with antibiotics may actually place the patient in severe shock which could possibly lead to death. This is due to the fact that more of the bacterium's toxin is released when the cell dies. E. coli strains, tame commercial recombinant Escherichia coli Host strains, and at least 200 0: H E. coil strains such as 0157:H7. E. coli is the primary member of the coliform group with the ability to ferment lactose at 44.5 degree C (112.1°F) within 24 hours. The fermented lactose causes the test sample to change colors. Verification of E. coli is achieved by a color change Yellow = total coliforms, Yellow/fluorescent = E. coli. Twenty-four hours later you can get a most probable number of viable E. coli [8].
Reduction of Coliforms:
Coliform bacteria do not always show up in every sample. They can be sporadic and sometimes seasonal. If coliform bacteria are present, the source of the problem should be identified. Re-sampling from several locations within the system will be helpful. Silver is completely bound to proteins when
Bacteria Free Water for Drinking by Silver Treatment – KSCST – IISc. – 2013 11
applied topically. The ease of formation of insoluble compounds with anions, sulfhydryl groups, and many biological materials such as enzymes, is responsible for the disinfectant activity of silver [11].
Martin noted that silver reacts with ether sulfur, as occurs in methionine. Chang reported that silver
requires a long contact time for disinfection and does not enter the cell. Rather it forms reversible sulfhydryl or histidyl complexes on the cell surface and prevents the dehydrogenation process. He noted further that permissible levels of silver (50 ppb) are too low for any effect. Protein de-naturation is more difficult than oxidation of complexed sulfhydryl groups, which explains why higher residuals are needed for viruses than bacteria.
Rahn and Landry noted that silver can bind phage DNA, increasing the rate of dimerization inside
the phage upon UV radiation. Grier stated that silver can complex with electron donor groups containing sulfur, oxygen or nitrogen. Reversible binding of bases occurs without aggregation or disruption of double helix. Intercalation of silver can lead to increased stability of double helix. Upon entering the cell, the molecule may dissociate where the silver binds the DNA. James reported that all silver salts are bactericidal and the metallic silver dissolves in water to an extent (10-5 g/l) which is toxic to E. coli and Bacillus tryphoses. It is the concentration of silver ions, not their physical nature that is responsible for disinfection capability.
Phillips and Warshowsky noted that finely divided metallic silver presents an excellent oxidative
catalytic surface, which reportedly can complex proteins and nucleic acids. Chambers et al. found that the greatest kill rates occurred at pH 7.5.
Woodard explained that it is the ability of silver to absorb to surfaces which accounts for the
continued germicidal effect after stopping the addition of silver to water. Muller et al. noted that no deterioration in the water quality after the addition of 100ppb of silver to water, which was then, stored 3years in polypropylene containers. During the storage period, nearly all the silver adsorbed on the walls of the container yet continued to prevent bacterial growth. It was reported that, while salmonella is at least as sensitive as E. coli, the cost and slowness of disinfection by silver may limit its use. A bactericidal effect has been reported for both silver salts (acetate, nitrate and sulfate) and electrolytically produced silver, with no significant observed difference when used in water from a public distribution system. Moroz et al. stated that a concentration of 50 to 200ppb silver kills salmonella and E. coli as well as bacteria that are highly resistant to antibiotics [11].
Since ancient times, the silver ion has been known to be effective against a broad range of
microorganisms [13]. Today, silver ions are used to control bacterial growth in a variety of medical applications, including dental work, catheters, and the healing of burn wounds Silver ions are also used for a number of nonmedical purposes, such as in electrical appliances. The slow-release “nanosilver” linings of laundry machines, dishwashers, refrigerators, and toilet seats are also marketed and advertised. It is clear that we are exposed to a wide range of mostly unfamiliar uses of silver containing products intended to function as antimicrobial biocides. Therefore, it is necessary to elucidate the antimicrobial activity of the silver ion, which is widely used in these products.
Bacteria Free Water for Drinking by Silver Treatment – KSCST – IISc. – 2013 12
2.4. Water quality analysis Bacteriological parameters:
The standard test for the coliform group may be carried out either by the Multiple - tube
fermentation technique or presence – absence procedure (though the presumptive-confirmed phases or completed test) described herein, by the membrane filter (MF) technique or by the enzymatic-substrate coliform test. Each technique is applicable within the limitations specified and with due consideration of the purpose of the examination. Production of valid result requires strict adherence to quality control procedures [1].
When multiple tubes are used in the fermentation technique, results of the examination of replicate tubes and dilutions are reported in terms of the Most Probable Number (MPN) of organisms present. This number, based on certain probability formulas, is an estimate of the mean density of coliforms in the sample.
The precision of each test depends on the number of tubes used. The most satisfactory information will be obtained when the largest sample inoculums examined shows gas in some or all of the tubes and the smallest sample inoculum’s shows no gas in all or a majority of the tubes. Bacterial density can be estimated from the table using the number of positive tubes in the multiple dilutions. The number of sample portion selected will be governed by the desired precision of the result. MPN tables are based on the assumption of a Poisson distribution (Random Dispersion). However, if the sample is not adequately shaken before the portions are removed or if clumping of bacterial cells occurs, MPN value will be an underestimate of the actual bacterial density.Mainly concentrating on Bacteriological parameters, Under Multiple tube fermentation technique we have following tests.
Total Coliform Test:
The test for total coliform bacteria is usually conducted using a liquid culture. Enumeration
employing solid culture media is not commonly done in India. The liquid culture ‘multiple tube technique’ consists of 2 stages such as presumptive test and Confirmed test. The presumptive test is based on gas production during fermentation in enrichment medium which contains beef extract, peptone and lactose within 48 hours incubation at 35oC. The confirmed test is used to substantiate or deny the presence of coliforms in a positive presumptive test. A small inoculum from a positive lactose broth is transferred to a tube containing brilliant green lactose bile broth. The green dye and bile salts in this broth inhibit non-coliform growth. The presence of coliform is confirmed by growth and gas production within 48 hours at 35oC. The Most Probable Number (MPN) of total coliform is then calculated from the number of confirmed tubes.
Feacal Coliform Test:
Sometimes a ‘completed test’ may be performed to determine the feacal origin of the coliforms giving positive confirmative test. These tests involve subscribing of positive tubes on solid media and testing for further bio-chemical reactions. Elevated temperature test for the separation of organisms of coliform group into those of faecal and non-faecal origin may also be performed. In this test, transfers from all positive presumptive tubes are made to culture tubes of EC medium which contains Bile slats and sodium chloride as selective agents along with the nutrients. The inoculated tubes are incubated at 44.5+0.2 oC. Gas production within 24 hours is considered a positive reaction indicating coliforms of feacal origin.

Bacteria Free Water for Drinking by Silver Treatment – KSCST – IISc. – 2013 13
Chapter 3 MATERIALS AND METHODOLOGY 3.1. Sample sources:
3.1.1. Rain water:
Rain water is the water that has fallen as rain and contains little dissolved mineral matter. Rain is a major component of the water cycle and is responsible for depositing most of the fresh water on the Earth. The most common hazard in water sources obtained from roof or surface catchments is microbial (biological and microbiological) contamination, especially enteric pathogens. Enteric pathogens are micro-organisms (bacteria, viruses, and protozoa) that cause gastrointestinal illness. These organisms are introduced into drinking water supplies by contamination with faecal material (from human or animal origin) or dead animals and insects (enHealth, 2004). The most important indicator is E-coli. Chemical contamination results from air pollution (industrial and traffic emissions), run-off and leaching of chemical substances (agricultural and human activities) and toxic material use; all these factors can pose a serious a health theat. However, in rural areas of developing countries, these activities are mostly absent or very small- scale (for example: fireplaces near a roof or having a chimney can cause soot to settle on the roof), and are therefore unlikely to cause significant impacts on the quality of the collected rainwater (enHealth, 2004). Physical contamination includes inorganic and organic sediments like sand, silt, clay, or plant material. Physical contamination affects the colour, odour or taste of the water, but it poses no direct health risk. Users can however object to water if its colour, odour and taste are found less attractive [10].
We selected stored rain water as sample for our experiments. We found that the silver treatment for rain water was very efficient and the treated water became potable after 8-24 h as the initial value of the sample obtained was low for MPN/100ml.
3.1.2. Open well water:
Figure 1: Open well

Bacteria Free Water for Drinking by Silver Treatment – KSCST – IISc. – 2013 14
Open well water is underground water that is held in the soil and in pervious rocks. The contaminants in the open well may be bird droppings, leaves and other dust particles.
We selected open well water from IISc Campus and surrounding areas as sample for our experiments. We found that the silver treatment for open well water was efficient and the bacterial count (MPN/100ml) gradually decreased in the treated water up to 24 h.
3.1.3. Bore well water:
Figure 2: Bore well
Bore well water is underground water that is obtained by drilling tube wells. The contaminants differ from place to place. We selected Bore well water samples from different parts of Bangalore city such as Vijaynagar, Rajajinagar, RTNagar, Chandra Layout, Doddabommasandra, Malleshwaram. MPN Values differed from one source to another. We found that the Silver treatment was efficient in reducing bacterial count for a treatment period of 8 to 48 h.
3.2. Silver sheet immersion method:
Silver (99.9%) was tested for its purity and made in to sheet form. The method used for treating water using silver sheet of 0.1mm thickness is as follows:
Fill 1lt of sample into a Stainless Steel container. Pipette out 100ml of sample though a sterilized pipette to a sterilized bottle (sample before
treatment), shake well and close it with the cap. Close the lid of the Stainless steel container. Keep it in the laminar air flow chamber under aseptic conditions under room temperature until
inoculation. Silver sheet of 31 g inserted in to the water sample (silver sheet to be washed and wiped to dry
before immersing in to the water sample). After 2 hours of treatment, sampling is drawn as above. Repeat the process after every 2 hours. Repeat the sampling procedure at 24 hours. Subject the samples for testing using CFU or MPN method. Preserve the silver sheet in water until it is used for the next experiment.

Bacteria Free Water for Drinking by Silver Treatment – KSCST – IISc. – 2013 15
Figure 3: Container with silver sheet immersed inside the water sample
3.3. Methodologies to treat water using silver sheet and to analyze water for microbial
count 3.3.1. H2S vials test
H2S Test kit for microbiological quality of drinking water is a simple device to test the potability
of drinking water in the field. This test does not need any laboratory facility [6]. It is inexpensive, reliable and convenient method of testing a sample of water in the field conditions for its potability. Water borne diseases like Cholera, Typhoid, Diarrhoea, a Jaundice are caused by consumption of polluted water. The change of color of the Test kit medium indicates its fitness for drinking or not. The conventional method of testing the microbiological quality of water test needs a microbiologist and a well equipped laboratory. It is an expensive and lengthy test. Desired result is expected only after almost 72 hours. The conventional method of testing the microbiological quality of water test needs a microbiologist and a well equipped laboratory. It is an expensive and lengthy test. However, H2S Test Kit indicates the desired result within 18 hours and is made available at low cost and most useful in our rural areas in which test can be carried out even by an un-educated person.
Advantage of the test:
It is field test; hence water sample can be directly collected from the tap.
No need to remove the chlorine in chlorinated water, since the content of the bottle is
instantaneously removes it.
No need to measure the volume of water as the level of label indicates it is 20 ml.
The test is simple, rapid and inexpensive.
The test can be even done by uneducated person in the field.
Apparatus used: Stain less steel container, H2S vials, silver foil (0.1mm x 23 cm x 43 cm), 1litre sterilized water bottles (PET).
Bacteria Free Water for Drinking by Silver Treatment – KSCST – IISc. – 2013 16
Procedure: A stain less steel container (11litres capacity) was filled till the rim with the sample and a silver
sheet (23cm x 43cm size, 136.6g) was inserted (silver sheet is washed and wiped to dry) and the container was closed with the lid.
After 2 hours, 22ml of sample was pipette out from the container into the H2S vial (vial shaken and kept for observation).
Again after 4hours 22ml of sample was pipette out from the container into the H2S vial (vial shaken and kept for observation).
Similarly, for every 2 hours sample was pipette out from the container. Experiments were repeated at 2nd, 4th, 6th and 8th hours of the day.
The sample in the container was kept overnight till 24 hours.
3.3.2. Heterotrophic Plate Count Method (HPC):
The Heterotrophic Plate Count (HPC), formerly known as the standard plate count, is a procedure [11] for estimating the number of live heterotrophic bacteria in water and measuring changes during water treatment and distribution or in swimming pools. Colonies may arise from pairs, chains, clusters, or single cells, all of which are included the term “colony-forming units” (CFU). The final count also depends on interaction among the developing colonies; choose the greatest number of colonies within the designated incubation time. To compare data, use the same procedure and medium. Three different media are described. Selection of method out of Pour plate method, Spread plate method, Membrane filtration method is required. The spread plate method causes no heat shock and all colonies are on the agar where they can be distinguished readily from particle bubbles. Colonies can be transferred quickly; however this method is limited by the quantity of sample or diluted sample that can be absorbed on agar; 0.1 to 0.5ml, depending upon the degree to which pre-poured plates have been dried. To use this procedure, we maintain a supply of suitable pre-dried, absorbent agar plates. For counting and recording, Consider only plates having 30 to 300 colonies in determining the plate count. If there is no plate with 30 to 300 colonies, and one or more plates have more than 300 colonies, use the plates having a count nearest 300 colonies. Compute the count using the formula as given below:
CFU/ml = Colonies counted /Actual volume of sample in dish, ml
The term CFU is descriptive of the methods used; therefore report all counts as colony forming units.
If plates from all dilutions of any sample has no colonies, report the count as <1 divided by the corresponding largest sample volume used. If number of colonies per plate far exceeds 300, do not report result as “too numerous to count” (TNTC). If spreading colonies are encountered on the plate selected, count colonies on representative portions only when colonies are well distributed in spreader-free areas and the area covered by the spreader does not exceed one-half the plate area.
When spreading colonies must be counted, count each of the following types as one: a chain of colonies that appears to be caused by disintegration of bacterial clump as agar and sample were mixed; a spreader that develops as a film of growth between agar and the bottom of the Petri dish; and a colony that forms in a film of water at the edge or over the agar surface. The last two types largely develop because of an accumulation of moisture at the point from which the spreader originates. They frequently cover more than half the plate and interfere with obtaining a reliable plate count.
Count as individual colonies similar-appearing growing in close proximity but not touching, provided the distance between them is at-least equal to the diameter of the smallest colony. Count impinging colonies that differ in appearance, such as morphology or color, as individual colonies.

Bacteria Free Water for Drinking by Silver Treatment – KSCST – IISc. – 2013 17
Equipments required are Glass bottle with cap or cotton plugs, Pipette, Petri plates, Test tubes, Glass rod, Stainless steel container and Sterile Gloves.
Preparation of Media is as follows:
2g of Luria Broth was put it in 100ml De-Ionized water or distilled water and mix well until it dissolves completely.
2g of Agar-Agar was put it in to the same bottle of 100ml DI water and mixed well. Sterilization:
Petri plates, test tubes in a plastic bag and pipette, glass rod were wrapped in an autoclavable plastic bag.
By loosening the cap of media bottle, keep it in autoclave with the above mentioned equipments in a beaker.
Autoclaving was done for at 121 0C for 15 minutes of 15 pounds. After autoclaving, all the equipments were kept in refrigerator and the media were kept in
Laminar flow chamber. Dilution of sample:
Keep about 6 sterilized test tubes in an order and name them starting from 100 to 10-5. Take 10ml of sample to be tested in one tube. Put 9ml DI water in to left out tubes. Take 1ml sample and put into 9ml DI water and repeat the same till the last tube. After completion of serial dilution, Pipette 0.1ml of diluted sample though a fresh sterilized tip. Now the sample is ready to inoculate.
Inoculation of sample:
Close the door and Switch on the Ultraviolet light for 10mins before working in Laminar flow chamber.
After switching off the UV light, switch on the blower. Wipe the table and hands with ethanol for maintaining aseptic conditions. Keep the tubes ready to inoculate and Switch on the spirit lamp to avoid any bacteria to enter the
Laminar flow chamber. Keep the Petri plates half open and pour the hot (80 0C) Media into the plates and keep for few
minutes for solidification. Inoculate 0.1 ml of sample on to the solidified media and spread immediately using sterilized
spreader and close the lid and name them. Incubation: Keep the Petri plates upside down in the incubator at 37 0C for 24 h for the bacterial growth.
Counting Colonies: After 24h of incubation
Bacteria Free Water for Drinking by Silver Treatment – KSCST – IISc. – 2013 18
121°C for 20min
37°C for 24h
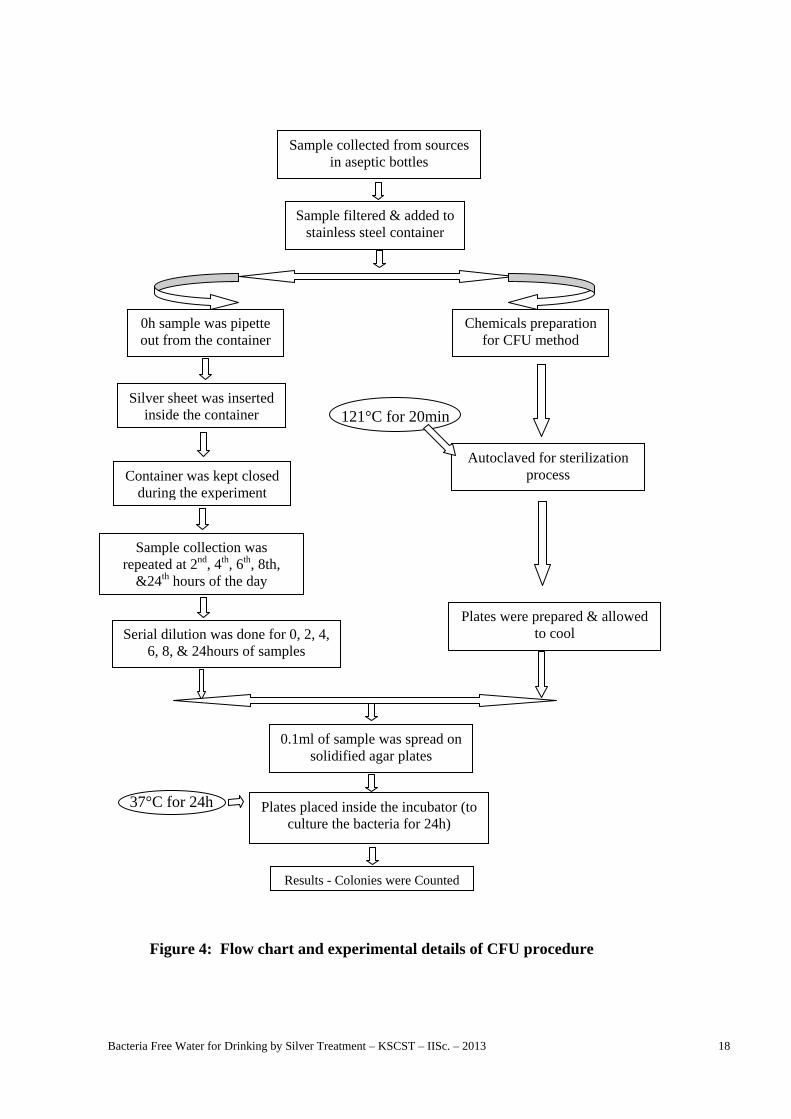
Figure 4: Flow chart and experimental details of CFU procedure
Sample collected from sources in aseptic bottles
Sample filtered & added to stainless steel container
0h sample was pipette out from the container
Chemicals preparation for CFU method
Silver sheet was inserted inside the container
Container was kept closed during the experiment
Sample collection was repeated at 2nd, 4th, 6th, 8th,
&24th hours of the day
Autoclaved for sterilization process
Plates were prepared & allowed to cool Serial dilution was done for 0, 2, 4,
6, 8, & 24hours of samples
0.1ml of sample was spread on solidified agar plates
Plates placed inside the incubator (to culture the bacteria for 24h)
Results - Colonies were Counted

Bacteria Free Water for Drinking by Silver Treatment – KSCST – IISc. – 2013 19
3.3.3. Multiple Tube Fermentation Technique – Most Probable Number (MPN):
This is a standard qualitative analysis of water for the determination of Most Probable Number (MPN) of Coli form Bacteria [10].
Presumptive test Confirmative test Completed test
Materials required are Test tubes, Durham’s tubes, Cotton plugs, Bunsen Burner, Inoculation
Loop, Stainless steel container, Sterile Gloves, Pipettes, Distilled water, Measuring cylinders, Glass rod, Measuring Beaker, Conical Flask, Autoclavable Testube Stands, Autoclavable Covers/Bags.Equipments Required are Weighing Machine, pH meter, Autoclave, Inoculation Chamber with Laminar Air flow, Bacteriological Incubator.Chemicals required are Tryptose, Lactose, Dipotassium Hydrogen Phosphate, Potassium Dihydrogen Phosphate, Sodium Chloride, Sodium Lauryl Sulphate, Bile salts and Sodium Hydroxide Pellets.Types of test Carried Out:
Total Coliforms (TC)
Feacal Coliforms (FC) / (Ecoli)
LST Broth preparation for TC presumptive test:
Tryptose 20 g
Lactose 5 g
Dipotassium Hydrogen Phosphate 2.75 g
Potassium Dihydrogen Phosphate 2.75 g
Sodium Chloride 5 g
Sodium Lauryl Sulphate 0.1 g
Mix all of the above chemicals and put it in 500ml distilled water and shake well to get double strength broth, Check the pH of the broth and it should be 6.8 + 0.20C
Take a series of 10 sterilized Test tubes for each sample and put Durham’s tubes to each tube in the inverted form.
Pour 10ml broth to all the tubes using a sterilized measuring cylinder. Prepare Dilution water by adding 34g of Potassium DiHydrogen phosphate in 500ml distilled
water and add NaOH pellets to Maintain pH of 7.2 Pour the dilution water of 9ml to 10ml broth in the 5 test tubes and pour 9.9ml to 5 tubes and mix
well. Close the tubes with cotton plugs Keep all the tubes for sterilization in the Autoclave for 20 minutes at 1210C.

Bacteria Free Water for Drinking by Silver Treatment – KSCST – IISc. – 2013 20
EC Broth Preparation for FC confirmative test:
Tryptose 20 g
Lactose 5 g
Dipotassium Hydrogen Phosphate 4 g
Potassium Dihydrogen Phosphate 1.5 g
Sodium Chloride 5 g
Bile Salts 1.5 g
Mix all of the above chemicals and put it in 1000ml distilled water and shake well to get single strength broth.
Check the pH of the broth and it should be 6.9 + 0.20C Take a series of 10 sterilized Test tubes for each sample and put Durham’s tubes to each tube. Pour 10ml broth to all the tubes using a sterilized measuring cylinder. Keep all the tubes for sterilization in the Autoclave for 20mins at 1210C Bring down all the tubes to room temperature. Pair each positive presumptive fermentation tube with a fermentation tube containing EC
broth. Mark each EC tube to match its paired presumptive tube. Mark each EC tube to match its paired presumptive tube. Using a sterile transfer loop, transfer a portion of the liquid from each presumptive tube to its
paired EC broth fermentation tube under aseptic condition. Incubate the tubes for 48 hs at 44.5+ 0.50C.
Inoculation of Sample:
Bring down all the tubes to room temperature and put 10ml for 5tubes, 1ml for 3tubes and 0.1ml for 2tubes under aseptic conditions
Mix well the broth and samples and keep it in incubator at 35+0.50C for 48 h Check for positive tubes of acid and gas formation Note down the Number of positive tubes in 10 ml, 1 ml, and 0.1 ml sample tubes and calculate
MPN/100ml of Total Coliforms. Aseptic Conditions:
Working desk and Hands to be rinsed with 95% ethanol before touching any sterilized material Sampling to be done though a sterilized pipette Samples to be collected in a sterilized bottle and mix well before inoculation Sample Inoculation must be carried out in Laminar air flow chamber Flame to be used every time during inoculation and to heat the loop Flame sterilizes metal loops before each transfer or use individual pre-sterilized loops or wood
splints for each transfer. All the glass wears should be washed by 1N Hydrochloric acid.

Bacteria Free Water for Drinking by Silver Treatment – KSCST – IISc. – 2013 21
3.3.4. Reduced Flow Method
Apparatus used: a) Inlet drum (SS) with lid and tap - 10 litres capacity. b) Drip wire (1.5m long and 2mm pipe diameter) connected to Inlet drum. c) Two SS containers coaxial to each other are placed one inside the other with a gap of 3 mm annular
space between the walls of the container for inserting silver sheet. d) Three different sizes of silver sheets with total weight of 156.334g,
a. large size of silver sheet weighing117.305g b. small size of silver sheets weighing 15.730g and 23.296g
Experimental setup:
A total quantity of 7 litres of water was poured in to a stainless steel inlet drum of 10 litres capacity. The water sample was made to flow slowly from inlet drum though drip pipe. Then the water sample was made to flow drop by drop into the outer container at the bottom. A smaller inner container is provided with a small hole at the top for the water to enter into the inner drum. Large size of silver sheet (117.305g) placed between two containers (larger and smaller SS drums).
As the water flows into the outer larger container which has silver sheet, large surface area of the
silver will come in contact with small quantity of slow moving water. Later treated water gets collected in the smaller inner container which has two silver sheets (15.730g and 23.296g) placed in circular form. Water sample is drawn from the inner drum for testing. Grams staining method:
The Gram staining method is named after the Danish bacteriologist Hans Chistian Gram (1853 –1938) who originally devised it in 1882 (but published in 1884), to discriminate between pneumococci and Klebsiella pneumoniae bacteria in lung tissue. (http://www.microrao.com/micronotes/pg/Gram%20stain.pdf)
It is a differential staining method of differentiating bacterial species into two large groups
(Gram-positive and Gram-negative) based on the chemical and physical properties of their cell walls. This reaction divides the eubacteria into two fundamental groups according to their stain ability and is one of the basic foundations on which bacterial identification are built.

Bacteria Free Water for Drinking by Silver Treatment – KSCST – IISc. – 2013 22
Gram staining consists of four components:
Primary stain (Crystal violet, methyl violet or Gentian violet) Mordant (Gram's Iodine) Decolourizer (ethyl alcohol, acetone or 1:1 ethanol-acetone mixture) Counterstain (Dilute carbol fuchsin, safranin or neutral red)
Procedure:
Prepare a thin bacterial smear on a clean glass slide and cover with a few drops of crystal violet stains. The crystal violet stain renders all the bacteria uniformly violet. After a minute of exposure to the staining solution, the slide is washed in water. The smear is treated with few drop of Gram's Iodine and allowed to act for a minute. Gram's iodine serves as a mordant. The slide is again washed in water and then decolorized in absolute ethyl alcohol or acetone. A mixture of ecetone-ethyl alcohol (1:1) can also be used for decolorization. The process of decolorization is fairly quick and should not exceed 30 seconds for thin smears. Acetone is a potent decolorizer and when used alone can decolorize the smear in 2-3 seconds. Decolorization is the most crucial part of Gram staining and errors can occur here. Prolonged decolorization can lead to over-decolorized smear and a very short decolorization period may lead to under-decolorized smear. After the smear is decolorized, it is washed in water without any delay. The smear is finally treated with few drops of counterstain such as dilute carbol fuchsin, neutral red or safranin. The slide is washed in water; excess water is removed using a blotting paper, dried in air and heat fixed before observing under microscope.
Those bacteria that hold on to primary dye-iodine complex and remain violet are called Gram positive and those which get decolorized and subsequently take up counter-stain (pink/red) are called Gram negative. Basic fuchsin (present in dilute carbol fuchsin) stains many Gram negative bacteria more intensely than safranin does, making them easier to see. Some bacteria which are poorly stained by safranin, such as Haemophilus spp., Legionella spp., and some anaerobic bacteria, are readily stained by basic fuchsin. In order to ascertain if the staining procedure was satisfactorily conducted, a control smear of known Gram positive organism (e.g., Staphylococcus aureus) and a known gram negative organism (Escherichia coli) must be stained simultaneously. While the fibrin in a clinical specimen may appear gram positive, the pus cells and epithelial cells are always gram negative. Applications of Gram staining:
Differentiation of bacteria into Gram positive and Gram negative is the first step towards classification of bacteria.
It also the first step towards identification of bacteria in cultures. Observation of bacteria in clinical specimens provides a vital clue in the diagnosis of infectious
diseases. Useful in estimation of total count of bacteria. Empirical choice of antibiotics can be made on the basis of Gram stain’s report. Choice of culture media for inoculation can be made empirically based on Gram’s stain report.
Bacteria Free Water for Drinking by Silver Treatment – KSCST – IISc. – 2013 23
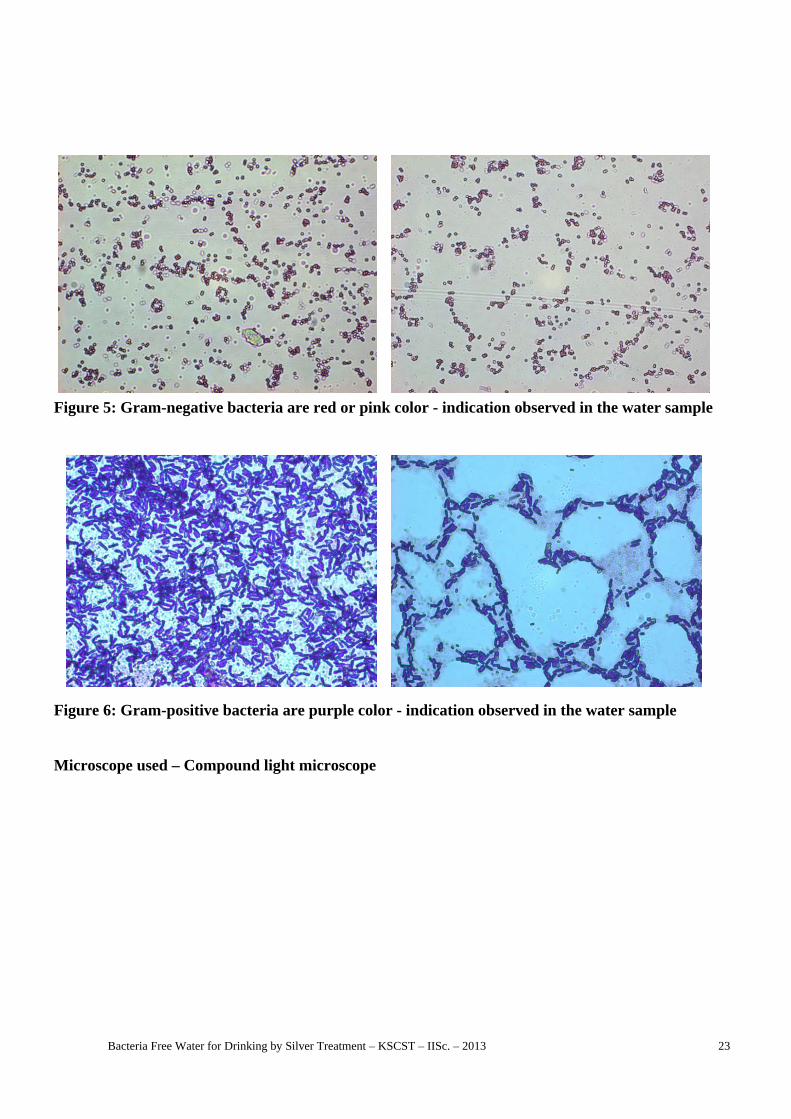
Figure 5: Gram-negative bacteria are red or pink color - indication observed in the water sample
Figure 6: Gram-positive bacteria are purple color - indication observed in the water sample
Microscope used – Compound light microscope

Bacteria Free Water for Drinking by Silver Treatment – KSCST – IISc. – 2013 24
Washed in water
Washed in water
Washed in water
Washed in water
Figure 7: Flow chart on grams staining procedure
Prepared thin bacterial smear on a glass slide
Covered with few drops of crystal violet
Dried in air & heat fixed
Covered with few drops of grams iodine
Added decolorize (95% of Ethyl alcohol)
Covered with few drops of safranin
Finally washed with water, dried in air, heat fixed and observed
using a microscope
Allowed for one minute
Allowed for one minute
Allowed for 30 seconds
Allowed for one minute

Bacteria Free Water for Drinking by Silver Treatment – KSCST – IISc. – 2013 25
Chapter 4
EXPERIMENTS AND RESULTS
4.1. Analysis of water quality by silver treatment
Quantity of water:
Water samples of 1, 2, 4 and 11litres were collected to examine the efficiency of silver treatment for different types of bacteria. Samples were drawn from different sources such as bore well water, rain water, pond water and open well water. Experiments were conducted in Three methods (H2S vials, CFU, and MPN methods) to identify the presence of coliform bacteria.
Quantity of silver sheet:
Silver (99.9%) was tested for its purity and made in to sheet form. Following are the different sizes and weight of silver sheets used in the treatment:
o Sheet 1 – 23cm x 43cm, 136.600 gram (g) o Sheet 2 – 22cm x 48cm, 156.507 g o Sheet 3 – 3cm x 32cm, 14.004 g o Sheet 4 – 5cm x 21cm, 15.730 g o Sheet 5 – 9.9cm x 21cm, 23.146 g o Sheet 6 – 10cm x 21cm, 23.295 g o Sheet 7 – 15cm x 21cm, 31.345 g o Sheet 8 –117.305 g o 287.759 g (total weight of all silver sheets)
Container sizes:
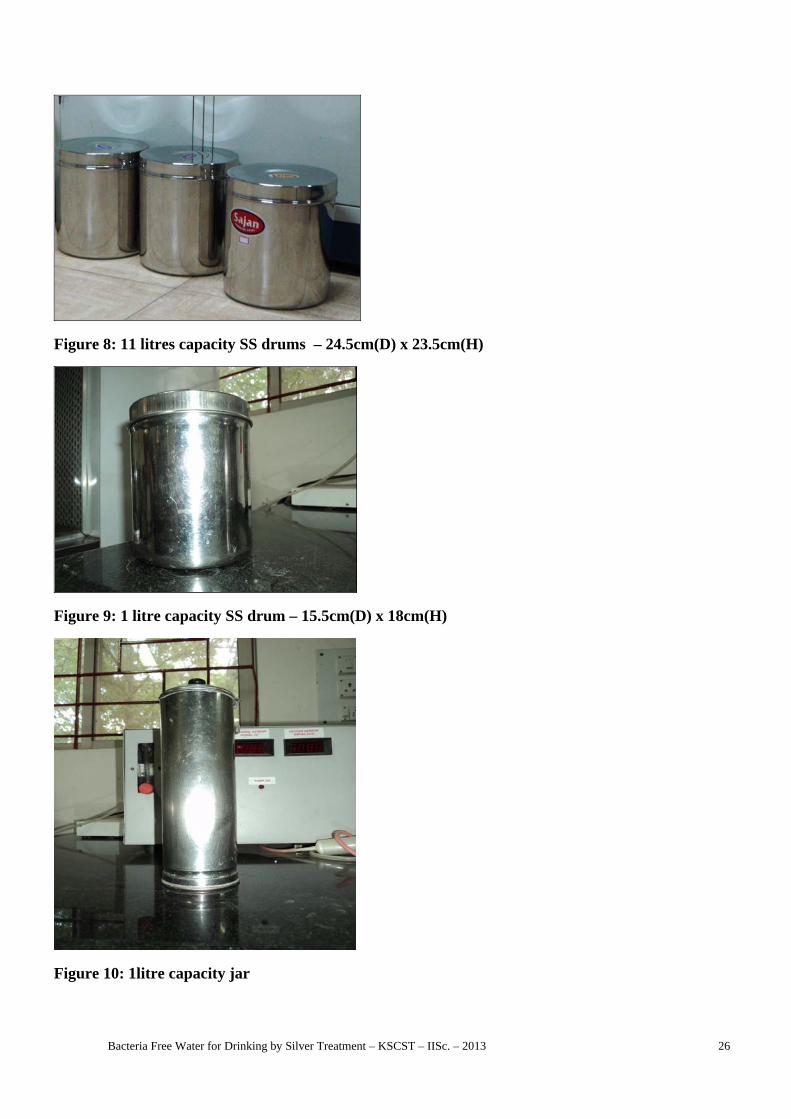
The stainless steel containers were selected for the standard silver sheet immersion test method. Following are the different capacity of the containers (Figures 8 to 10).
Bacteria Free Water for Drinking by Silver Treatment – KSCST – IISc. – 2013 26
Figure 8: 11 litres capacity SS drums – 24.5cm(D) x 23.5cm(H)
Figure 9: 1 litre capacity SS drum – 15.5cm(D) x 18cm(H)
Figure 10: 1litre capacity jar

Bacteria Free Water for Drinking by Silver Treatment – KSCST – IISc. – 2013 27
Methods of water sampling: Samples were collected from a sterile Schott test bottle under aseptic conditions. The different methods of sampling:
o Pipette o Pouring o Direct insertion of Schott bottle inside the sample container
Samples of about 100ml were taken out from SS container every time after specified duration of treatment for the test.
Duration of treatment: o A raw sample without any treatment was collected as one sample (0hours). o After every two hours, sample was taken. o In the later stages of experiment, 0, 8, 24 hours became the standard sampling duration. o Control - a sample kept in the SS container without any treatment with lid closed. Silver
sheet was not immersed in this sample. The samples from control container were taken at the same time as that of the treated water.
o For more accuracy of results, 24, 32 and 48 hours of treated samples were also taken for few samples.
Stirring and mixing: Samples in SS container were mixed by stirring several specified number of rotations using
sterile glass rod before pipette the sample. For few samples mixing was tried with following:
Every 2 hours sample mixed for 5 rounds clock wise and 5 rounds anti clock wise, rotated with sterilized glass rod.
Every 1 hour sample mixed for 10 rounds clock wise and 10 rounds anti clock wise, rotated with sterilized glass rod.
Sample collected 0 h, 8 h, 24 h and 24C h were mixed for 5 rounds clock wise and 5 rounds anti clock wise, rotated with sterilized glass rod.
In the later stages an electronic blender was used for stirring the sample to achieve uniform mixing for reduced flow method

Bacteria Free Water for Drinking by Silver Treatment – KSCST – IISc. – 2013 28
4.1.1. H2S Vials
Experiments were conducted using H2S vials, Bore well water sample collected from Vijaynagar was tested using H2S vials procedure as mentioned in chapter 3 (3.3.1). Silver sheet 1 was inserted in 11liters of water sample (before inserting silver sheet, 0 h sample was drawn) and the sample collection was repeated (every time 22ml of sample was collected) at 2nd, 4th, 6th, and 8th hours of treatment. The sample was transferred to the H2S vials. After 24 hours the H2S vials were examined. The vials in the solution was black were deemed to have nonpotable water. Conversely, the water was deemed to be potable if the solution remained collarless. The experimental results are tabulated below.
Table 3: Experimental results of H2S vials test
SAMPLE – Bore well water, Vijayanagar Treatment Time in hours
Sample color in vial / Coliform Count Result
0 TC – 110 MPN/100ml, FC – 70 MPN/100ml Contaminated, Non Potable 2 Black Contaminated, Non Potable 4 Colorless Non Contaminated 6 Black Contaminated, Non Potable 8 Colorless Non Contaminated 24 Colorless, TC – 10 MPN/100ml Non Contaminated, Potable
Figure 11: Change in color of H2S vials, color less vials indicate non-contaminant water black color indicate contaminated water
Figure 12: Sample kept in stain less steel container with silver sheet

Bacteria Free Water for Drinking by Silver Treatment – KSCST – IISc. – 2013 29
4.1.2. Heterotrophic Plate Count method:
Bore well water was used for Plate Count Method of water analysis. Silver sheets were washed with a Modi-Care solution. Sterile pipettes were used for sampling. Water was stirred before collecting sample using a sterile glass rod. Raw & treated samples were given for Physico-chemical & bacteriological analysis at 1. Mines & Geology Department and 2. Essen & Co. Lab. DI - Water was taken as one sample for comparison. Sheet 4 was taken in a 1lt SS cointainer. SS container was filled with the sample till the rim and silver sheet was inserted (silver sheet was washed and wiped to dry before inserting in to water). The container was closed with the lid.
Figure 13: Media Preparation for CFU method The details of test procedure are given below:
In this method samples from different sources (Rainwater and Borewell water) were collected. 11L of water sample was taken in a stainless steel container to which silver sheet-1 (as mentioned
above 4.1) was inserted. From which 100 mL of raw water sample was pipetted out into a sterilized Schoot duran bottles
before inserting the silver sheet. After 2, 4, 6, 8 and 24h of treatment the water sample was pipetted to a sterilized schoot duran
bottle and placed it inside the laminar air flow chamber. Procedure used: (as per the standard methods) here 0.1 mL of sample from raw water sample and
2, 4, 6, 8 and 24h treated water sample was also pipetted out and spread on a solidified agar plates inside the laminar flow chamber aseptically maintained.
Agar plates were placed inside the incubator invertedly for 24h at a temperature of 37°C. Similar procedure was followed using Rainwater sample.
.

Bacteria Free Water for Drinking by Silver Treatment – KSCST – IISc. – 2013 30
Figure 14: Auto clave for sterilization of equipments, De-ionised water and media
Figure 15: Laminar air flow chamber for keeping the samples aseptically

Bacteria Free Water for Drinking by Silver Treatment – KSCST – IISc. – 2013 31
Figure 16: (a) Agar media plates kept for cooling aseptically inside the laminar air flow chamber (b) Diluted water sample for inoculation - 0.1mL
(c) Water sample of 0.1mL being added to agar media (d) Water sample being spread on agar media plates (aseptically maintained)
Figure 17: Inoculated samples are kept for incubation for 24 hours at 37°C
(a) (b)
(c) (d)

Bacteria Free Water for Drinking by Silver Treatment – KSCST – IISc. – 2013 32
Figure 18: Bacteria growth observed after 24 h of incubation (a) Growth of too many bacterial colonies in raw water
(b) Reduced bacterial colonies after treating water with silver sheet for 24h
Table 4.1.2: Experimental results of HPC (CFU) method
Sl.No Sample CFU / 100ml Source Quantity Silver size 0 h 2 h 4 h 6 h 8 h 10 h 24 h 1 Bore well 11 lts 23cm x 43cm - 26 20 125 80 - - 2 Bore well 11 lts 23cm x 43cm 28 20 14 8 6 - 127 3 Bore well 11 lts 23cm x 43cm 5 10 14 18 - - TNTC
4 Bore well 11 lts 23cm x 43cm TNTC 7 3 0 - - - 11 lts 22 cm x 48cm TNTC 4 0 0 - - -
5 Bore well 11 lts 23cm x 43cm 4 5 3 2 0 - 0 11 lts 22 cm x 48cm 4 10 8 6 3 - 1
6 Bore well 11 lts 23cm x 43cm 22 22 15 12 9 - - 11 lts 22 cm x 48cm 4 5 3 2 11 - -
7 Bore well 11 lts 23cm x 43cm 90 _ 3 0 - - 0 11 lts 22 cm x 48cm 90 _ 9 5 - - 4
8 Bore well 11 lts 23cm x 43cm 16 9 2 2 2 0 1 11 lts 22 cm x 48cm 16 86 59 15 3 1 1
9 Bore well 11 lts 23cm x 43cm 49 32 13 9 0 0 - 11 lts 22 cm x 48cm 49 40 27 18 3 3 -
10 Bore well 11 lts 23cm x 43cm 76 56 67 29 5 0 - 11 lts 22 cm x 48cm 76 51 55 31 7 0 53
11 Bore well 11 lts 23cm x 43cm 63 38 28 3 0 0 - 11 lts 22 cm x 48cm 63 28 43 4 0 1 -
12 Bore well 11 lts 23cm x 43cm 12 12 0 0 0 0 - 11 lts 22 cm x 48cm 12 14 0 0 0 0 -
13 Bore well 11 lts 23cm x 43cm 72 0 0 0 0 0 - 11 lts 22 cm x 48cm 72 2 0 0 0 0 -
14 Bore well 11 lts 23cm x 43cm 15 18 11 26 26 12 18 11 lts 22 cm x 48cm 33 28 25 43 32 30 28
15 Bore well 11 lts 23cm x 43cm 1 1 0 - - 0 - 11 lts 22 cm x 48cm 1 0 0 2 12 0 -
16 Bore well 11 lts 23cm x 43cm TNTC TNTC TNTC TNTC TNTC TNTC TNTC 11 lts 22 cm x 48cm TNTC TNTC TNTC TNTC TNTC TNTC TNTC
17 Bore well 11 lts 23cm x 43cm 1 15 42 _ 23 6 40 11 lts 22 cm x 48cm 1 TNTC 7 _ 30 11 35
18 Bore well 11 lts 23cm x 43cm TNTC TNTC TNTC TNTC TNTC TNTC TNTC 11 lts 22 cm x 48cm TNTC TNTC TNTC TNTC TNTC TNTC TNTC
19 Bore well 11 lts 23cm x 43cm TNTC 5 20 14 5 6 _ 11 lts 22 cm x 48cm TNTC _ 6 22 7 5 42
20 Bore well 11 lts 23cm x 43cm _ 41 23 25 27 25 25 11 lts 22 cm x 48cm 63 _ 20 25 17 22
21 Bore well 11lts 23cm x 43cm 15 17 _ 0 0 - 10 11lts 22 cm x 48cm 15 14 _ 0 0 - 7
22 Bore well 11lts 23cm x 43cm 11 20 22 18 20 21 - 11lts 22 cm x 48cm 16 18 14 23 21 18 -
(a) (b)

Bacteria Free Water for Drinking by Silver Treatment – KSCST – IISc. – 2013 33
Sl.No Sample CFU / 100ml
Source Quantity Silver size 0 h 2 h 4 h 6 h 8 h 10 h 24 h 23 Bore well 11lts 23cm x 43cm 1 63 0 0 _ - 23 24 Bore well 11lts 22 cm x 48cm 1 1 0 0 0 - 13,16 25 Bore well 11lts 23cm x 43cm 21,30 24 44 48 66 - 0 26 Bore well 11lts 23cm x 43cm 3 27 _ _ 0 - - 27 Bore well 11lts 23cm x 43cm _ _ _ 0 0 - - 28 Bore well 11lts 22 cm x 48cm 1 1 1 0 0 - 3 29 Bore well 11lts 23cm x 43cm 60 30 26 20 16 - TNTC 30 Bore well 11lts 23cm x 43cm 60 45 27 25 58 - TNTC 31 Bore well 11lts 23cm x 43cm TNTC TNTC TNTC TNTC TNTC TNTC TNTC
32 Rain water 11lts 23cm x 43cm 37 9 4 23 40 - - 11lts 22 cm x 48cm 70 _ _ _ 55 - -
33 Rain water 11lts 23cm x 43cm 48 TNTC 50 70 TNTC - - 11lts 22 cm x 48cm 56 _ _ _ TNTC - -
34 Rain water 11lts 23cm x 43cm TNTC TNTC TNTC TNTC TNTC TNTC TNTC 11lts 22 cm x 48cm TNTC TNTC TNTC TNTC TNTC TNTC TNTC
35 Rain water 11lts 23cm x 43cm 40,42 38,40 32,35 35,40 60,52 - 21 11lts 22 cm x 48cm 40,42 _ _ 30 25 - 21
36 Rain water 11lts 23cm x 43cm TNTC 132,138 1,2 28,20 172,125 - - 11lts 22 cm x 48cm TNTC _ _ _ 37,33 - -
37 Rain water 11lts 23cm x 43cm 11,9 3 3 6 7 - - 38 Bore well 11lts 22 cm x 48cm 67,51 42,32 35,31 65,53 120,156 - - 39 Bore well 11lts 23cm x 43cm TNTC TNTC TNTC TNTC TNTC - - 40 Bore well 11lts 23cm x 43cm 43,36 10,4 4,2 2 2 25,28 - 41 Bore well 11lts 23cm x 43cm TNTC TNTC TNTC TNTC TNTC TNTC - 42 Bore well 11lts 23cm x 43cm 10 42 88 TNTC TNTC TNTC - 43 Pure culture 1lt 5cm x 21cm 4 30 27 45 _ - 20 44 Pure culture 1lt 5cm x 21cm 125 110 100 100 96 - - 45 Bore well 1lt 5cm x 21cm _ 52 50 50 50 - -
46 Bore well 1lt 5cm x 21cm 2 3 5 1 2 - - 2lts 10cm x 21cm 2 2 2 1 5 - -
47 Bore well 1lt 5cm x 21cm 1 TNTC 72 63 TNTC - - 2lts 10cm x 21cm TNTC TNTC TNTC TNTC TNTC - -
48 Bore well 1lt 5cm x 21cm 42 TNTC TNTC TNTC TNTC - - 2lts 10cm x 21cm 42 TNTC TNTC TNTC TNTC - -

Bacteria Free Water for Drinking by Silver Treatment – KSCST – IISc. – 2013 34
4.1.3. Multiple Tube Fermentation Technique (MPN Method):
In this method samples (source-Bore well) were collected from Vijaynagar, 1litre of sample was taken in a SS container and silver sheet 4 (as mentioned above 4.1) was inserted. Presumptive test was conducted for 0h, 2h, 4h, 6h, and 8h of treatment. Here 10 tubes were used out of which 5 tubes for 10mL, 3 tubes for 1mL and 2 tubes for 0.1mL. This experiment was continued for about 20 days, the values obtained were not consistent (because of some contamination problem and also incubator could not reach constant temperature of 35°C). Hence, small changes were made in this experimental set up; Change 1: here we used 11 lts of rain water sample, silver sheet 1 (as mentioned above 4.1) was immersed inside the sample, Same procedure was followed with different volume of samples and number of tubes (5 tubes for 10mL, 5 tubes for 1mL, and 5 tubes for 0.1mL). Change 2: For 1lt of rain water sample, Sheet 7 (as mentioned above 4.1) was immersed, experiments were continued using sheet 4 (as mentioned above 4.1), Here we got some consistent values and thus we continued the same procedure and same experimental set up for about 30 tests. Change 3: In the later stage, the bore well water (Magdi road) was used in the experiment for accurate results. Same procedure was followed for number of tests. Change 4: Later for every one hour before sampling, sample was mixed (by manual stirring) for 30 secs clock wise and anti clock wise with sterilized glass rod. Change 5: Samples collected for every 2 hours were stirred for 5 times in clock wise and 10 times anti clock wise direction. Change 6: The samples were collected at 0, 8, 24 hours and 24C (Control - without silver sheet) test was conducted for the sample after 24 hours. Change 7: Tests were conducted for different water samples from different sources from different areas in Bangalore city, such as bore well water from Vijayanagar, rain water from Vijayanagar, pond water from Vijayanagar, bore well water from Nandini lay out, bore well water from Rajajinagar, bore well water from Magadi road, bore well water from Malleswarum, open well water from Malleswarum, and open well water from Indian Institute of Science Campus. Here above mentioned MPN test experimental procedure was followed, In which changes with respect to the size of silver sheet and quantity of water samples was carried out to get more accurate values. The standard procedure of MTFT was followed as mentioned in chapter 3 (3.3.3) and the results are tabulated.
Figure 19: Known quantity of water sample inoculated in sterilized test tubes and kept aseptically inside the laminar air flow chamber

Bacteria Free Water for Drinking by Silver Treatment – KSCST – IISc. – 2013 35
Figure 20: (a) Test tubes observed - all 5 positive tubes – raw water 10mL sample (b) Test tubes observed - 4 positive tubes – raw water 1mL sample
(c) Test tubes observed - 4 positive tubes – raw water 0.1mL sample Positive 5 – 4 – 4 tubes indicate 350MPN/100mL
(a) (b)
(c)

Bacteria Free Water for Drinking by Silver Treatment – KSCST – IISc. – 2013 36
Figure 21: (a) Test tubes observed - 3 positive tubes –water treated for 24 h 10mL sample (b) Test tubes observed - all negative tubes – water treated for 24 h 1mL sample
(c) Test tubes observed - all negative tubes – water treated for 24 h 0.1mL sample Positive 3 – & 0 – 0 tubes indicate 9MPN/100mL - water potable
(a) (b)
(c)

Bacteria Free Water for Drinking by Silver Treatment – KSCST – IISc. – 2013 37
Table 4.1.3: Experimental results of MTFT (MPN) method
Sample No.
Source Quantity Silver size
MPN/100 ml Control
0 h 2 h 4 h 6 h 8 h 16 h 24 h 32 h 48 h 24 h
1 Bore well 1lt 5cm x 21cm
460 240 240 240 210 -
2 Bore well 1lt 5cm x 21cm
<3 <3 <3 <3 _ -
3 Rain water
1lt 5cm x 21cm
9.1 <3 3 7.3 11 -
4 Rain water
1lt 5cm x 21cm
9.1 3.6 7.3 <3 <3 -
5 Rain water
1lt 5cm x 21cm
93 39 9.1 9.1 9.1 -
6 Rain water
1lt 5cm x 21cm
<3 <3 <3 <3 <3 -
7a Rain water
1lt 5cm x 21cm
9.1 3.6 <3 <3 <3 15
7b Rain water
1lt 5cm x 21cm
7.3 _ _ _ <3 -
7c Rain water
1lt 5cm x 21cm
3.6 <3 <3 <3 <3 -
8 Rain water
1lt 5cm x 21cm
9.2 9.2 6.6 6.9 3.6 -
9 Rain water
1lt 5cm x 21cm
2 30 23 8 4 -
10 Rain water
1lt 5cm x 21cm
2 23 7 13 8 -
11a Rain water
1lt 5cm x 21cm
140 _ 30 _ 23 -
11b Rain water
1lt 5cm x 21cm
140 90 90 90 70 -
12a Rain water
1lt 5cm x 21cm
80 110 50 50 110 -
12b Rain water
1lt 5cm x 21cm
80 _ 80 _ 23 -
13a Rain water
1lt 5cm x 21cm
30 22 30 23 23 -
13b Rain water
1lt 5cm x 21cm
23 23 23 23 13 -
14a Rain water
1lt 5cm x 21cm
2 4 2 2 2 -
14b Rain water
1lt 5cm x 21cm
2 <2 <2 <2 <2 -
15a Rain water
1lt 5cm x 21cm
110 80 70 50 30 -
15b Rain water
1lt 5cm x 21cm
110 80 70 50 30 -
15c Rain water
1lt 5cm x 21cm
110 80 50 33 49 -
16a Rain water
1lt 5cm x 21cm
140 140 140 110 30 -
16b Rain water
1lt 5cm x 21cm
140 90 90 90 70 -

Bacteria Free Water for Drinking by Silver Treatment – KSCST – IISc. – 2013 38
Sample
No. Source Quantity
Silver size
MPN/100 ml Control
0 h 2 h 4 h 6 h 8 h 16 h 24 h 32 h 48 h 24 h
17 Rain water
1lt 5cm x 21cm
50 13 17 17 17 -
18 Rain water
1 lt 10cm x 21cm
23 13 8 4 2 -
19a Rain water
1lt 10cm x 21cm
4 13 2 2 4 -
19b Rain water
1lt 10cm x 21cm
4 2 <2 <2 <2 -
20 Rain water
1lt 10cm x 21cm
8 _ <2 <2 2 -
21a Rain water
1lt 10cm x 21cm
80 40 30 12 6 -
21b Rain water
1lt 10cm x 21cm
80 _ 50 _ 30 -
21c Rain water
1lt 10cm x 21cm
50 _ 30 13 4 -
21d Rain water
1lt 10cm x 21cm
50 _ 23 _ 4 -
22a Rain water
1lt 10cm x 21cm
13 _ 8 _ 4 -
22b Rain water
1lt 10cm x 21cm
8 _ 8 _ 2 -
23a Rain water
1lt 10cm x 21cm
170 _ 140 _ 140 -
23b Rain water
1lt 10cm x 21cm
1600 _ 900 _ 90 -
23c Rain water
1lt 10cm x 21cm
110 _ _ _ 110 -
23d Rain water
1lt 10cm x 21cm
23 _ _ _ 13 -
24a Rain water
1lt 10cm x 21cm
30 _ 13 _ 8 -
24b Rain water
1lt 10cm x 21cm
13 _ 4 _ 2 -
25a Rain water
1lt 10cm x 21cm
>1600 _ _ _ 1600 -
25b Rain water
1lt 10cm x 21cm
>1600 _ >160
0 _ >1600 -
26a Rain water
1lt 10cm x 21cm
>1600 _ >160
0 _ >1600 -
26b Rain water
1lt 10cm x 21cm
>1600 - - - 383 -
27 Rain water
1lt 10cm x 21cm
84 - - - 60 -
28 Bore well 1lt 10cm x 21cm
2 - 4 - 2 -
29a Rain water
1lt 10cm x 21cm
50 - 30 - 23 -
29b Rain water
1lt 10cm x 21cm
23 - 17 - 8 0

Bacteria Free Water for Drinking by Silver Treatment – KSCST – IISc. – 2013 39
Sample No.
Source Quantity Silver size
MPN/100 ml Control
0 h 2 h 4 h 6 h 8 h 16 h 24 h 32 h 48 h 24 h
30b Rain water
1lt 10cm x 21cm
240 - - - 240 -
31a Rain water
1lt 10cm x 21cm
4 - 4 2 -
31b Rain water
1lt 10cm x 21cm
4 - - - 2 -
32 Bore well-
N L 1lt
10cm x 21cm
540 - - - 49 -
33 Pond Water
1lt 10cm x 21cm
60 - 11 - 4 -
34 Bore well-
N L 1lt
10cm x 21cm
>1600 - >160
0 - 280 -
35 Bore
Well-R N 1lt
10cm x 21cm
350 - - - 220 79
36 Bore
Well-R N 1lt
10cm x 21cm
170 - 80 - 50 4
37 Bore
Well-R N 1lt
10cm x 21cm
17 - 13 - 2 0
38 Bore
Well-R N 1lt
10cm x 21cm
94 - - - 17 4
39 Bore
Well-R N 1lt
10cm x 21cm
>1600 - - - 280 >1600
40 Bore
Well-R N 1lt
10cm x 21cm
130 - - - 46 13
41 Bore
Well-R N 1lt
10cm x 21cm
>1600 - - - 280 8 >1600
42 Bore
Well-R N 1lt
10cm x 21cm
140 - - - 46 4
43 Bore
Well-R N 1lt
10cm x 21cm
30 - - - 13 2
44 Bore
Well-R N 1lt
10cm x 21cm
>1600 - - - 30 8
45a Bore
Well-R N 1lt
10cm x 21cm
46 - - - 23 2
45b Bore
Well-R N 1lt
10cm x 21cm
130 - - - 23 2
_
Bore Well-R N, NL, VN,
Pond water, Rain water
_ 10cm x 21cm
70,94,4,110,23
- - - - - -
46 Bore
Well-R N 1lt
10cm x 21cm
>1600 - - - 920 220 >1600
47 Bore
Well-R N 1lt
10cm x 21cm
110 - - - 30 110
48 IISc
kaveri water
1lt 10cm x 21cm
0 - - - 0 0 0
49
Bore Well-R N
+ Pond water
1lt (1:1) 10cm x 21cm
240 - - - 30 13 23
50a Bore
Well-R N 1lt
10cm x 21cm
>1600 - - - >1600 >1600 >1600

Bacteria Free Water for Drinking by Silver Treatment – KSCST – IISc. – 2013 40
Sample
No. Source Quantity
Silver size
MPN/100 ml Control
0 h 2 h 4 h 6 h 8 h 16 h 24 h 32 h 48 h 24 h
50b Bore
Well-R N 1lt
10cm x 21cm
>1600 - - - >1600 >1600 >1600
51 Bore
Well-R N 1lt
10cm x 21cm
>1600 - - - 280 >1600
52 Bore
Well-R N 1lt
10cm x 21cm
>1600 - - - 1600 280 920
53
Bore Well-R N
+ Pond water
1lt(1:1) 10cm x 21cm
280 - - - 240 110 240
54
Bore Well-R N
+ Pond water
2lts(500ml+1500
ml)
10cm x 21cm
170 - - - 79 49 130
55
Bore Well-R N
+ Pond water
4lts (500ml+3
500ml)
10cm x 21cm
240 - - - 30 23 130
56
Bore Well-R N
+ Pond water
4lts (2000ml+1750ml+250ml)
10cm x 21cm
17 - - - 7 4 7 7
57a
Pond Water +
Bore Well-R N
2lts (500ml + 1500ml)
10cm x 21cm
70 - - - 13 >1600 4 240 70
57b
Pond Water +
Bore Well-R N
2lts (500ml + 1500ml)
10cm x 21cm
30 - - - 23 2 49
57c Bore
Well-R N 1lt
10cm x 21cm
49 - - - 13 <2 49
58 Pond water, IISc
1lt 10cm x 21cm
79 - - - 49 26 23 <2 130
59 Bore
Well-R N 1lt
10cm x 21cm
30 - - - 23 <2 2 _ 30
60 Bore
Well-R N 1lt
10cm x 21cm
79 - - - 13 8 46
61 Borewell-Magadi Road
1lt 10cm x 21cm
>1600 - - - 1600 220 170 140 1600
62a Borewell-Magadi Road
1lt 10cm x 21cm
920 - - - 540 49 33 350
62b
Borewell-Magadi
Road(Tank)
1lt 10cm x 21cm
540 - - - 79 23 13 350
63a
Borewell-Magadi
Road(Direct)
1lt 10cm x 21cm
23 - - - 13 8 23
63b
Borewell-Magadi
Road(Direct)
1lt 10cm x 21cm
2 - - - 2 2

Bacteria Free Water for Drinking by Silver Treatment – KSCST – IISc. – 2013 41
Sample No.
Source Quantity Silver size
MPN/100 ml Control
0 h 2 h 4 h 6 h 8 h 16 h 24 h 32 h 48 h 24 h
64
Borewell-Magadi
Road(Tank)
1lt 10cm x 21cm
540 - - - 170 140 70 49
_ Bore well (Tank) RT
nagar 1lt _ 1200
65 RT nagar
(T W) 1lt
10cm x 21cm
170 49 0 0 0
66a RT nagar
(T W) 1lt
10cm x 21cm
170 79 33 0 0
66 b RT nagar
(T W) 1lt
10cm x 21cm
33 13 0 27
67 Magadi Road (T
W) 1lt
10cm x 21cm
170 110 8 5
68 Magadi Road (T
W) 1lt
10cm x 21cm
>1600 >1600 350 240 23 >1600
69 Shankar Mut (T
W) 1lt
10cm x 21cm
8 0 0 0
70 a Magadi Road (T
W) 1lt
10cm x 21cm
>1600 23 5 5 0
70 b Magadi Road (T
W) 1lt
10cm x 21cm
13 2
71 Magadi Road (T
W) 1lt
10cm x 21cm
920 540 79 33 13
72 Magadi Road (T
W) 1lt
10cm x 21cm
>1600 >1600 >1600
73
Well Water,17th cross,
Malleswaram
1lt 10cm x 21cm
>1600 >1600 >1600 >1601
74
Well Water,4th main 15th cross, S1
1lt 10cm x 21cm
>1600 >1600 1600
75 IISc well
water 1lt
10cm x 21cm
280 180 79 13 49
76 IISc well
water 1lt
10cm x 21cm
110 - 79 8 0 110
77 IISc well
water 1lt
10cm x 21cm
920 540
78 IISc well
water 1lt
10cm x 21cm
>1600 >1600 >1600 >1600 140 >1600
79 IISc well
water 1lt
10cm x 21cm
350 240 79 2
80 IISc well
water 1lt
10cm x 21cm
>1600 180 22
81 IISc well
water 1lt
10cm x 21cm
>1600 280 0 0 0
82 IISc well
water 1lt
10cm x 21cm
170 79 23 5

Bacteria Free Water for Drinking by Silver Treatment – KSCST – IISc. – 2013 42
Sample
No. Source Quantity
Silver size
MPN/100 ml Control
0 h 2 h 4 h 6 h 8 h 16 h 24 h 32 h 48 h 24 h
83 IISc well
water 1lt
10cm x 21cm
920 23 5 240
84 IISc well
water 1lt
10cm x 21cm
350 240 79 32 13 22
85 IISc well
water 1lt
10cm x 21cm
1600 350 240 240
86 IISc well
water 1lt
10cm x 21cm
920 540 350
87 IISc well
water 1lt
10cm x 21cm
>1600 920 540 920
88 IISc well
water 1lt
10cm x 21cm
1600 920 920
89 IISc well
water 1lt
10cm x 21cm
>1600 >1600 >1600
90 IISc well
water 1lt
10cm x 21cm
1600 920 350
91 IISc well
water 1lt
10cm x 21cm
170 110 33 350
92 IISc well
water 1lt
10cm x 21cm
170 130 49
93 IISc well
water 1lt
10cm x 21cm
140 130 79 130
94 IISc well
water 1lt
10cm x 21cm
>1600 280 23
95 IISc well
water 1lt
10cm x 21cm
>1600 >1600 >1600 1600
96 IISc well
water 1lt
10cm x 21cm
920 540 350 350
97 IISc well
water 1lt
10cm x 21cm
>1600 1600 70 540
98 IISc well
water 1lt
10cm x 21cm
540 23 8 170
99 IISc well
water 1lt
10cm x 21cm
920 540 280 540
100 IISc well
water 1lt
10cm x 21cm
540 140 33 110
101 IISc well
water 1lt
10cm x 21cm
220 79 23 220
102 IISc well
water 1lt
10cm x 21cm
920 280 280 920
103 IISc well
water 1lt
10cm x 21cm
1600 350 34 920
104 IISc well
water 1lt
10cm x 21cm
>1600 920 240 920
105 IISc well
water 1lt
10cm x 21cm
1600 280 140 180
106 IISc well
water 1lt
10cm x 21cm
280 170 130 920
107 IISc well
water 1lt
10cm x 21cm
1600 49 13 920

Bacteria Free Water for Drinking by Silver Treatment – KSCST – IISc. – 2013 43
Sample No.
Source Quantity Silver size
MPN/100 ml Control
0 h 2 h 4 h 6 h 8 h 16 h 24 h 32 h 48 h 24 h
108 IISc well
water 1lt
10cm x 21cm
540 130 79 350
109 IISc well
water 1lt
10cm x 21cm
280 170 49 220
110 IISc well
water 1lt
10cm x 21cm
170 49 23 110
111 IISc well
water 1lt
10cm x 21cm
170 130 130 540
112 IISc well
water 1lt
10cm x 21cm
540 350 70 130
113 IISc well
water 1lt
10cm x 21cm
540 140 17 49
114 IISc well
water 1lt
10cm x 21cm
180 13 4
115 IISc well
water 1lt
10cm x 21cm
220 49 30
116 IISc well
water 1lt
10cm x 21cm
540 350 49 920
117 IISc well
water 1lt
10cm x 21cm
540 240 70 110
118 IISc well
water 1lt
10cm x 21cm
920 - 49
119 IISc well
water 1lt
10cm x 21cm
540 220 170 350
120 IISc well
water 1lt
10cm x 21cm
>1600 >1600 1600 1600
121 IISc well
water 1lt
10cm x 21cm
1600 1600 540 920
122 IISc well
water 1lt
10cm x 21cm
920 240 130 540
123 IISc well
water 1lt
10cm x 21cm
1600 920 170 920
124 IISc well
water 1lt
10cm x 21cm
140 49
125 IISc well
water 1lt
10cm x 21cm
1600 920 920
126 IISc well
water 10lt
10cm x 21cm
1600 220 17
127 IISc well
water 10lt
10cm x 21cm
1600 300 30 50

Bacteria Free Water for Drinking by Silver Treatment – KSCST – IISc. – 2013 44
4.1.4. Reduced flow method:
The open well water was taken as the sample to this method. The quantity of water sample was 7 liters. The experimental procedure was followed as mentioned in 3.3.4 of chapter 3 and the results are tabulated below:
Table 4.1.4: Experimental results of Reduced flow method
MPN /100mL Control Sample
NO. Silver
Weight 0 h 8 h 16 h 24 h 48 h 24 h
1 131.32 >1600 1600 920 2 131.32 1600 110 180 3 131.32 280 350 920 4 131.32 1600 240 920 5 131.32 540 79 350 6 131.32 280 13 220 7 131.32 1600 540 170 110 8 131.32 170 130 9 156.455 170 130 23 540 10 156.455 540 180 130 11 156.455 540 350 13 49 12 156.455 220 30 13 13 156.455 14 156.455 540 79 920 15 156.455 540 130 110 16 156.455 920 23 17 156.455 540 130 350 18 156.455 >1600 1600 1600 19 156.455 1600 540 920 20 156.455 920 79 540 21 156.455 1600 130 920

Bacteria Free Water for Drinking by Silver Treatment – KSCST – IISc. – 2013 45
4.2. Residual effect of Silver in water treatment
IS 10500 standards: Maximum acceptable limit of Silver as Ag in drinking water - 0.1mg/l
The World Health Organization’s (WHO) guidelines for drinking water quality indicate that there are no adequate data with which to derive a health-based value for silver in drinking water. These guidelines state that, “where silver salts are used to maintain the bacteriological quality of drinking-water, levels of silver up to 0.1 mg/litre can be tolerated without risk to health”. Silver is regulated by US Environmental Protection Agency (EPA) National Secondary Drinking Water Regulations.
The WHO does not describe any health effects associated with the ingestion of silver other than a condition called Argyria, which causes discolouration of the skin and hair. This is considered a cosmetic effect and does not impair body function.
During the experiment of silver treatment of water for drinking, silver sheets were immersed in water. The silver ions will be released in to water to reduce the bacterial activity. Equipment and method used for testing: Equipment: Induction Coupled Plasma – Atomic Emission Spectrometer (ICP – AES) Method: Water treated by dipping silver sheet was tested for residual silver and values are as follows:
Sl. No. Treatment Time in hours Silver in water (mg/l)
1 4 0.0027
2 6 0.0031 3 24 0.0065
The above values show very low level of silver in treated water which is far below the acceptable limit as per WHO and IS acceptable standards and has no health effects on humans.
Purity of Silver sheet used in the project:
Silver sheet tested for purity at Mahalakshmi Refinery, C T Street, Bangalore 560 002 and the results showed the silver purity of 99.99%.
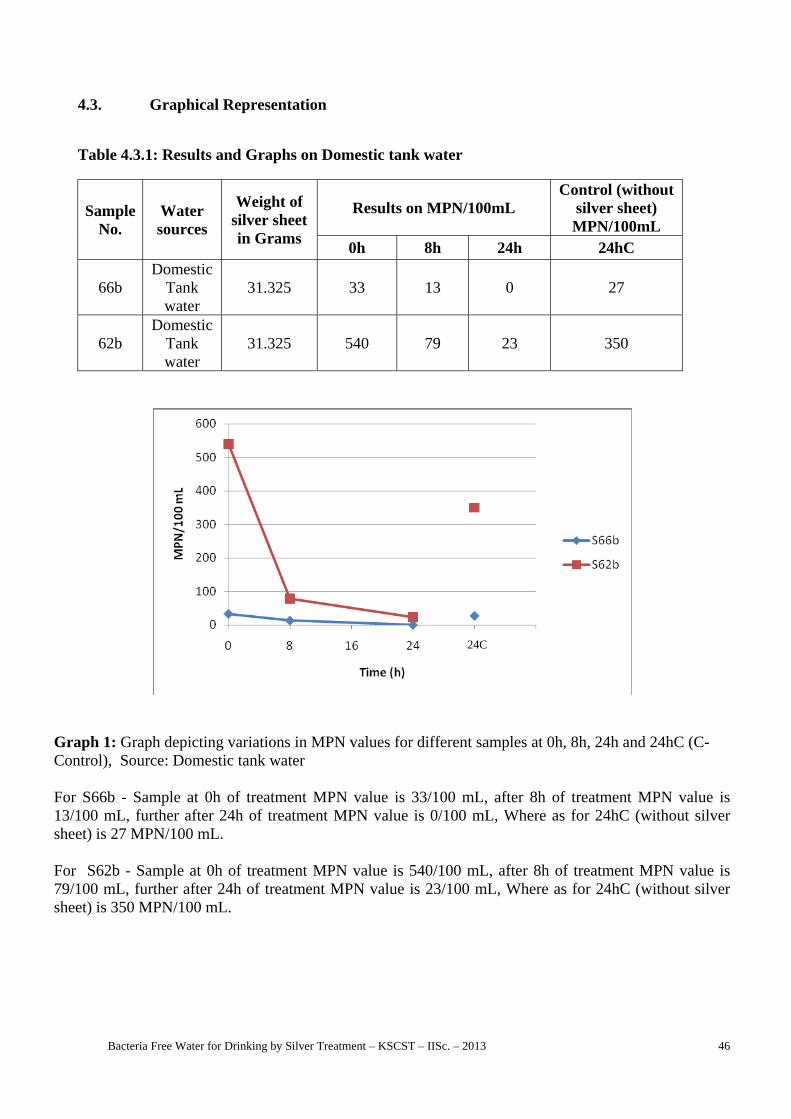
Bacteria Free Water for Drinking by Silver Treatment – KSCST – IISc. – 2013 46
4.3. Graphical Representation
Table 4.3.1: Results and Graphs on Domestic tank water
Sample No.
Water sources
Weight of silver sheet in Grams
Results on MPN/100mL Control (without
silver sheet) MPN/100mL
0h 8h 24h 24hC
66b Domestic
Tank water
31.325 33 13 0 27
62b Domestic
Tank water
31.325 540 79 23 350
Graph 1: Graph depicting variations in MPN values for different samples at 0h, 8h, 24h and 24hC (C- Control), Source: Domestic tank water For S66b - Sample at 0h of treatment MPN value is 33/100 mL, after 8h of treatment MPN value is 13/100 mL, further after 24h of treatment MPN value is 0/100 mL, Where as for 24hC (without silver sheet) is 27 MPN/100 mL. For S62b - Sample at 0h of treatment MPN value is 540/100 mL, after 8h of treatment MPN value is 79/100 mL, further after 24h of treatment MPN value is 23/100 mL, Where as for 24hC (without silver sheet) is 350 MPN/100 mL.
24C
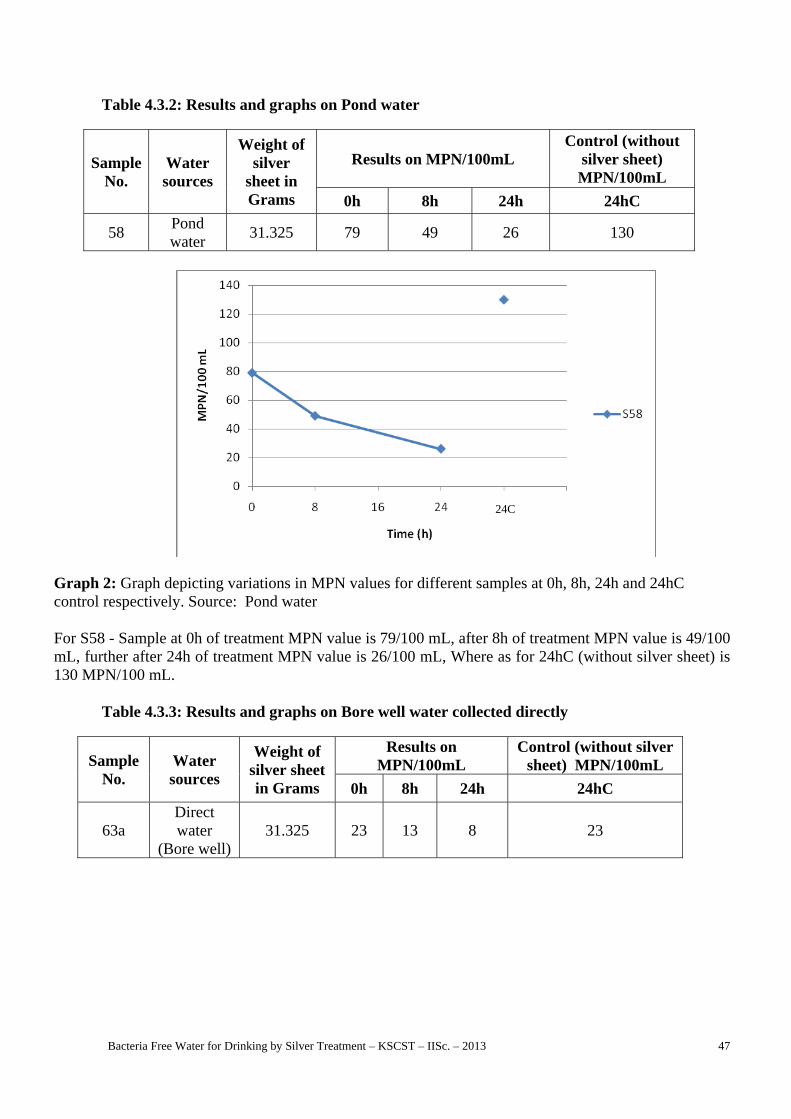
Bacteria Free Water for Drinking by Silver Treatment – KSCST – IISc. – 2013 47
Table 4.3.2: Results and graphs on Pond water
Sample No.
Water sources
Weight of silver
sheet in Grams
Results on MPN/100mL Control (without
silver sheet) MPN/100mL
0h 8h 24h 24hC
58 Pond water
31.325 79 49 26 130
Graph 2: Graph depicting variations in MPN values for different samples at 0h, 8h, 24h and 24hC control respectively. Source: Pond water For S58 - Sample at 0h of treatment MPN value is 79/100 mL, after 8h of treatment MPN value is 49/100 mL, further after 24h of treatment MPN value is 26/100 mL, Where as for 24hC (without silver sheet) is 130 MPN/100 mL. Table 4.3.3: Results and graphs on Bore well water collected directly
Sample No.
Water sources
Weight of silver sheet in Grams
Results on MPN/100mL
Control (without silver sheet) MPN/100mL
0h 8h 24h 24hC
63a Direct water
(Bore well) 31.325 23 13 8 23
24C

Bacteria Free Water for Drinking by Silver Treatment – KSCST – IISc. – 2013 48
Graph 3: Graph depicting the variations in MPN values for different samples at 0h, 8h, 24h and 24hC respectively. Source: Bore well water collected directly, (---------): indicates values which are portable.
For S63a: Sample at 0h of treatment MPN value is 23/100 mL, after 8h of treatment MPN value is 13/100 mL, further after 24h of treatment MPN value is 8/100 mL, Where as for 24hC (without silver sheet) is 23 MPN/100 mL.
Table 4.3.4: Results and Graphs on Water collected from multiple sources
Sample No.
Water sources
Weight of silver sheet in Grams
Results on MPN/100mL Control (without
silver sheet) MPN/100mL
0h 8h 24h 24hC
56 Multiple source
31.325 17 7 4 7
57b Multiple source
31.325 30 23 2 49
54 Multiple source
31.325 170 79 49 130
49 Multiple source
31.325 240 30 13 23
55 Multiple source
31.325 240 30 23 130
53 Multiple source
31.325 280 240 110 240
24C
Bacteria Free Water for Drinking by Silver Treatment – KSCST – IISc. – 2013 49
Graph 4: Graph depicting the variations in MPN values for different samples at 0h, 8h, 24h and 24hC respectively. Source: Water collected from multiple sources, S1, S2, S3, S4, S5, and S6: Sample numbers, (---------): Indicates values which are portable.
For S56: Sample at 0h of treatment MPN value is 17/100 mL, after 8h of treatment MPN value is 7/100 mL, further after 24h of treatment MPN value is 4/100 mL, Where as for 24hC (without silver sheet) is 7 MPN/100 mL.
For S57b: Sample at 0h of treatment MPN value is 30/100 mL, after 8h of treatment MPN value is 23/100 mL, further after 24h of treatment MPN value is 2/100 mL, Where as for 24hC (without silver sheet) is 49 MPN/100 mL.
For S54: Sample at 0h of treatment MPN value is 170/100 mL, after 8h of treatment MPN value is 79/100 mL, further after 24h of treatment MPN value is 49/100 mL, Where as for 24hC (without silver sheet) is 130 MPN/100 mL.
For S49: Sample at 0h of treatment MPN value is 240/100 mL, after 8h of treatment MPN value is 30/100 mL, further after 24h of treatment MPN value is 13/100 mL, Where as for 24hC (without silver sheet) is 23 MPN/100 mL.
For S55: Sample at 0h of treatment MPN value is 240/100 mL, after 8h of treatment MPN value is 30/100 mL, further after 24h of treatment MPN value is 23/100 mL, Where as for 24hC (without silver sheet) is 130 MPN/100 mL.
24C

Bacteria Free Water for Drinking by Silver Treatment – KSCST – IISc. – 2013 50
For S53: Sample at 0h of treatment MPN value is 280/100 mL, after 8h of treatment MPN value is 240/100 mL, further after 24h of treatment MPN value is 110/100 mL, Where as for 24hC (without silver sheet) is 240 MPN/100 mL.
Table 4.3.5: Results and graphs on Bore well water
Sample No.
Water sources
Weight of silver sheet in Grams
Results on MPN/100mL Control (without
silver sheet) MPN/100mL
0h 8h 24h 24hC
53 Bore well water
31.328 280 240 110 240
60 Bore well water
31.328 79 13 8 46
Graph 5: Graph depicting the variations in MPN values for different samples at 0h, 8h, 24h and 24hC respectively. Source: Bore well water, S1, S2: Sample numbers, (---------): Indicates values which are portable.
For S53: Sample at 0h of treatment MPN value is 280/100 mL, after 8h of treatment MPN value is 240/100 mL, further after 24h of treatment MPN value is 110/100 mL, Where as for 24hC (without silver sheet) is 240 MPN/100 mL.
For S60: Sample at 0h of treatment MPN value is 79/100 mL, after 8h of treatment MPN value is 13/100 mL, further after 24h of treatment MPN value is 8/100 mL, Where as for 24hC (without silver sheet) is 46 MPN/100 mL.
24C
Bacteria Free Water for Drinking by Silver Treatment – KSCST – IISc. – 2013 51
Table 4.3.6: Results and graphs on Open well water
Sample No.
Water sources Weight of
silver sheet in Grams
Results on MPN/100mLControl (without
silver sheet) MPN/100mL
0h 8h 24h 24hC
93 Open well
water 31.325 140 130 79 130
91 Open well
water 31.325 170 113 33 350
110 Open well
water 31.325 170 49 23 110
111 Open well
water 31.325 170 130 130 540
101 Open well
water 31.325 220 79 23 220
75 Open well
water 31.325 280 180 79 49
106 Open well
water 31.325 280 170 130 920
109 Open well
water 31.325 280 170 49 220
84 Open well
water 31.325 350 240 79 22
100 Open well
water 31.325 540 140 33 110
108 Open well
water 31.325 540 130 79 350
112 Open well
water 31.325 540 350 70 130
113 Open well
water 31.325 540 140 17 49
116 Open well
water 31.325 540 350 49 920
117 Open well
water 31.325 540 240 70 110
96 Open well
water 31.325 920 540 350 350
99 Open well
water 31.325 920 540 280 540
102 Open well
water 31.325 920 280 280 920
122 Open well
water 31.325 920 240 130 540

Bacteria Free Water for Drinking by Silver Treatment – KSCST – IISc. – 2013 52
103 Open well
water 31.325 1600 350 34 920
107 Open well
water 31.325 1600 49 13 920
121 Open well
water 31.325 1600 1600 540 920
123 Open well
water 31.325 1600 920 170 920
Graph 6: Graph depicting the variations in MPN values for different samples at 0h, 8h, 24h and 24hC respectively. Source: Well water, S1, S2, S3…: Sample numbers.
For S93: Sample at 0h of treatment MPN value is 140/100 mL, after 8h of treatment MPN value is 130/100 mL, further after 24h of treatment MPN value is 79/100 mL, Where as for 24hC (without silver sheet) is 130 MPN/100 mL. For S91: Sample at 0h of treatment MPN value is 170/100 mL, after 8h of treatment MPN value is 113/100 mL, further after 24h of treatment MPN value is 33/100 mL, Where as for 24hC (without silver sheet) is 350 MPN/100 mL. For S110: Sample at 0h of treatment MPN value is 170/100 mL, after 8h of treatment MPN value is 49/100 mL, further after 24h of treatment MPN value is 23/100 mL, Where as for 24hC (without silver sheet) is 110 MPN/100 mL.
Sample No.
Water sources Weight of
silver sheet in Grams
Results on MPN/100mLControl (without
silver sheet) MPN/100mL
0h 8h 24h 24hC
24C

Bacteria Free Water for Drinking by Silver Treatment – KSCST – IISc. – 2013 53
For S111:Sample at 0h of treatment MPN value is 170/100 mL, after 8h of treatment MPN value is 49/100 mL, further after 24h of treatment MPN value is 23/100 mL, Where as for 24hC (without silver sheet) is 110 MPN/100 mL. For S101: Sample at 0h of treatment MPN value is 220/100 mL, after 8h of treatment MPN value is 79/100 mL, further after 24h of treatment MPN value is 23/100 mL, Where as for 24hC (without silver sheet) is 49 MPN/100 mL.
For S75: Sample at 0h of treatment MPN value is 280/100 mL, after 8h of treatment MPN value is 180/100 mL, further after 24h of treatment MPN value is 79/100 mL, Where as for 24hC (without silver sheet) is 49 MPN/100 mL.
Graph 7: Graph depicting the variations in MPN values for different samples at 0h, 8h, 24h and 24hC respectively. Source: Well water, S1, S2, S3…: Sample numbers.
For S106: Sample at 0h of treatment MPN value is 280/100 mL, after 8h of treatment MPN value is 170/100 mL, further after 24h of treatment MPN value is 130/100 mL, Where as for 24hC (without silver sheet) is 920 MPN/100 mL. For S109: Sample at 0h of treatment MPN value is 280/100 mL, after 8h of treatment MPN value is 170/100 mL, further after 24h of treatment MPN value is 49/100 mL, Where as for 24hC (without silver sheet) is 220 MPN/100 mL. For S84: Sample at 0h of treatment MPN value is 350/100 mL, after 8h of treatment MPN value is 240/100 mL, further after 24h of treatment MPN value is 79/100 mL, Where as for 24hC (without silver sheet) is 22 MPN/100 mL. For S100: Sample at 0h of treatment MPN value is 540/100 mL, after 8h of treatment MPN value is 140/100 mL, further after 24h of treatment MPN value is 33/100 mL, Where as for 24hC (without silver sheet) is 110 MPN/100 mL.
24C

Bacteria Free Water for Drinking by Silver Treatment – KSCST – IISc. – 2013 54
For S108: Sample at 0h of treatment MPN value is 540/100 mL, after 8h of treatment MPN value is 130/100 mL, further after 24h of treatment MPN value is 79/100 mL, Where as for 24hC (without silver sheet) is 350 MPN/100 mL. For S112: Sample at 0h of treatment MPN value is 540/100 mL, after 8h of treatment MPN value is 350/100 mL, further after 24h of treatment MPN value is 70/100 mL, Where as for 24hC (without silver sheet) is 130 MPN/100 mL.
Graph 8: Graph depicting the variations in MPN values for different samples at 0h, 8h, 24h and 24hC respectively. Source: Well water, S1, S2, S3…: Sample numbers.
For S113: Sample at 0h of treatment MPN value is 540/100 mL, after 8h of treatment MPN value is 140/100 mL, further after 24h of treatment MPN value is 17/100 mL, Where as for 24hC (without silver sheet) is 49 MPN/100 mL. For 116: Sample at 0h of treatment MPN value is 540/100 mL, after 8h of treatment MPN value is 350/100 mL, further after 24h of treatment MPN value is 49/100 mL, Where as for 24hC (without silver sheet) is 920 MPN/100 mL. For S117: Sample at 0h of treatment MPN value is 540/100 mL, after 8h of treatment MPN value is 240/100 mL, further after 24h of treatment MPN value is 70/100 mL, Where as for 24hC (without silver sheet) is 110 MPN/100 mL. For S96: Sample at 0h of treatment MPN value is 920/100 mL, after 8h of treatment MPN value is 540/100 mL, further after 24h of treatment MPN value is 350/100 mL, Where as for 24hC (without silver sheet) is 350 MPN/100 mL. For S99: Sample at 0h of treatment MPN value is 920/100 mL, after 8h of treatment MPN value is 540/100 mL, further after 24h of treatment MPN value is 280/100 mL, Where as for 24hC (without silver sheet) is 540 MPN/100 mL.
24C
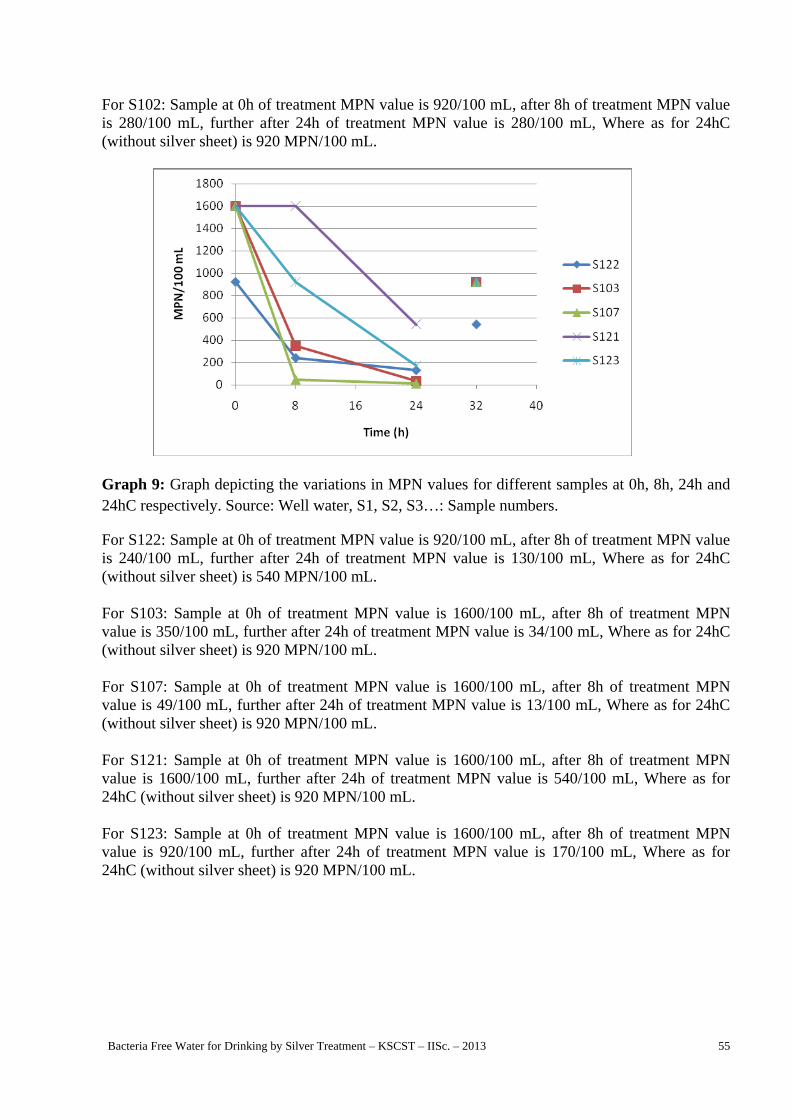
Bacteria Free Water for Drinking by Silver Treatment – KSCST – IISc. – 2013 55
For S102: Sample at 0h of treatment MPN value is 920/100 mL, after 8h of treatment MPN value is 280/100 mL, further after 24h of treatment MPN value is 280/100 mL, Where as for 24hC (without silver sheet) is 920 MPN/100 mL.
Graph 9: Graph depicting the variations in MPN values for different samples at 0h, 8h, 24h and 24hC respectively. Source: Well water, S1, S2, S3…: Sample numbers.
For S122: Sample at 0h of treatment MPN value is 920/100 mL, after 8h of treatment MPN value is 240/100 mL, further after 24h of treatment MPN value is 130/100 mL, Where as for 24hC (without silver sheet) is 540 MPN/100 mL. For S103: Sample at 0h of treatment MPN value is 1600/100 mL, after 8h of treatment MPN value is 350/100 mL, further after 24h of treatment MPN value is 34/100 mL, Where as for 24hC (without silver sheet) is 920 MPN/100 mL. For S107: Sample at 0h of treatment MPN value is 1600/100 mL, after 8h of treatment MPN value is 49/100 mL, further after 24h of treatment MPN value is 13/100 mL, Where as for 24hC (without silver sheet) is 920 MPN/100 mL. For S121: Sample at 0h of treatment MPN value is 1600/100 mL, after 8h of treatment MPN value is 1600/100 mL, further after 24h of treatment MPN value is 540/100 mL, Where as for 24hC (without silver sheet) is 920 MPN/100 mL. For S123: Sample at 0h of treatment MPN value is 1600/100 mL, after 8h of treatment MPN value is 920/100 mL, further after 24h of treatment MPN value is 170/100 mL, Where as for 24hC (without silver sheet) is 920 MPN/100 mL.
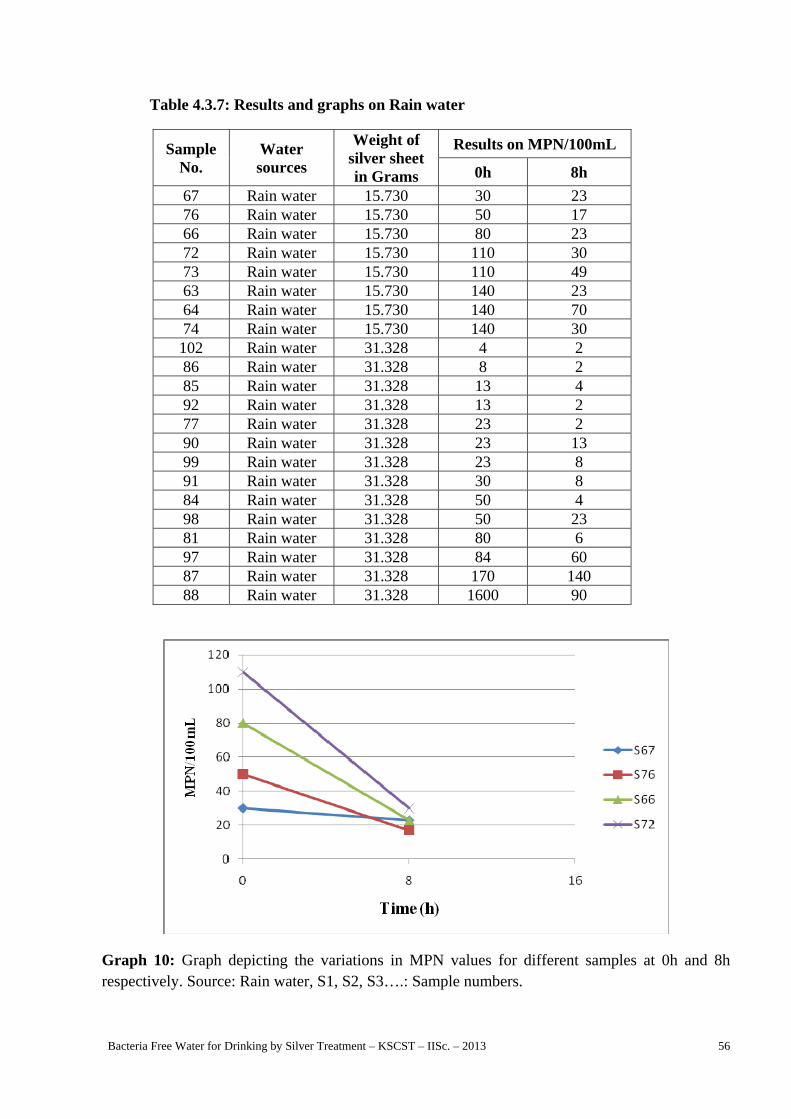
Bacteria Free Water for Drinking by Silver Treatment – KSCST – IISc. – 2013 56
Table 4.3.7: Results and graphs on Rain water
Sample No.
Water sources
Weight of silver sheet in Grams
Results on MPN/100mL
0h 8h
67 Rain water 15.730 30 23 76 Rain water 15.730 50 17 66 Rain water 15.730 80 23 72 Rain water 15.730 110 30 73 Rain water 15.730 110 49 63 Rain water 15.730 140 23 64 Rain water 15.730 140 70 74 Rain water 15.730 140 30 102 Rain water 31.328 4 2 86 Rain water 31.328 8 2 85 Rain water 31.328 13 4 92 Rain water 31.328 13 2 77 Rain water 31.328 23 2 90 Rain water 31.328 23 13 99 Rain water 31.328 23 8 91 Rain water 31.328 30 8 84 Rain water 31.328 50 4 98 Rain water 31.328 50 23 81 Rain water 31.328 80 6 97 Rain water 31.328 84 60 87 Rain water 31.328 170 140 88 Rain water 31.328 1600 90
Graph 10: Graph depicting the variations in MPN values for different samples at 0h and 8h respectively. Source: Rain water, S1, S2, S3….: Sample numbers.
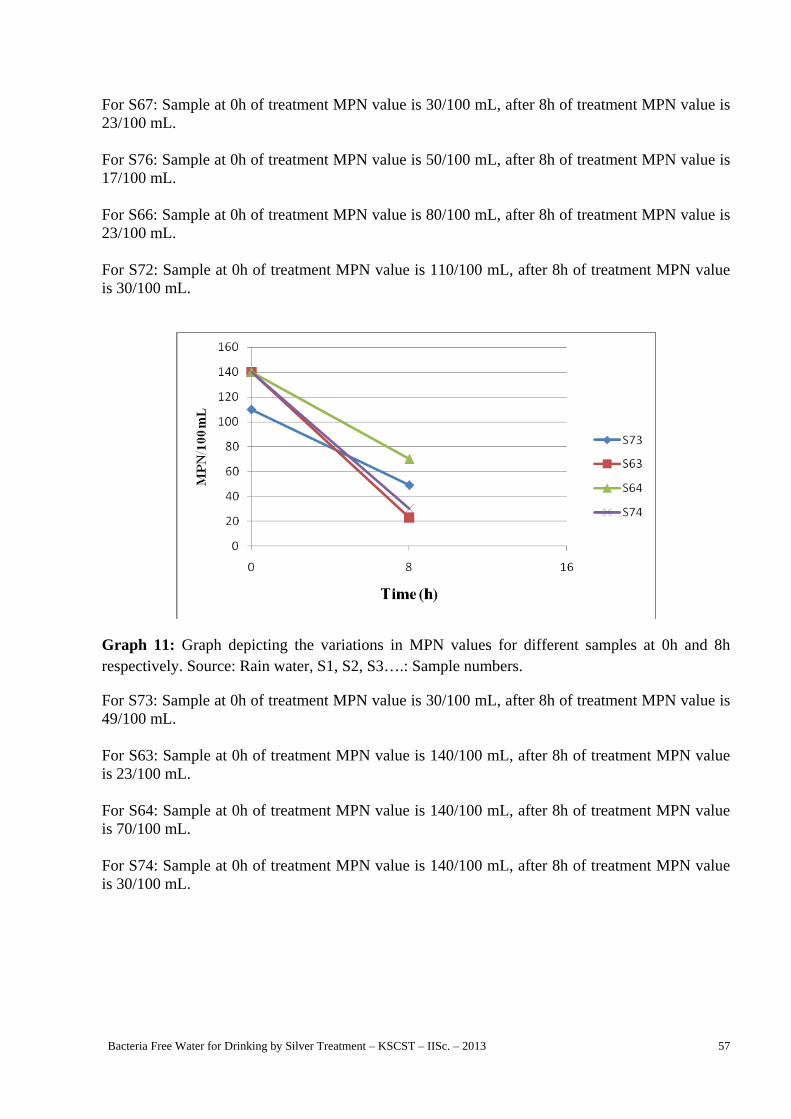
Bacteria Free Water for Drinking by Silver Treatment – KSCST – IISc. – 2013 57
For S67: Sample at 0h of treatment MPN value is 30/100 mL, after 8h of treatment MPN value is 23/100 mL. For S76: Sample at 0h of treatment MPN value is 50/100 mL, after 8h of treatment MPN value is 17/100 mL.
For S66: Sample at 0h of treatment MPN value is 80/100 mL, after 8h of treatment MPN value is 23/100 mL.
For S72: Sample at 0h of treatment MPN value is 110/100 mL, after 8h of treatment MPN value is 30/100 mL.
Graph 11: Graph depicting the variations in MPN values for different samples at 0h and 8h respectively. Source: Rain water, S1, S2, S3….: Sample numbers.
For S73: Sample at 0h of treatment MPN value is 30/100 mL, after 8h of treatment MPN value is 49/100 mL. For S63: Sample at 0h of treatment MPN value is 140/100 mL, after 8h of treatment MPN value is 23/100 mL. For S64: Sample at 0h of treatment MPN value is 140/100 mL, after 8h of treatment MPN value is 70/100 mL. For S74: Sample at 0h of treatment MPN value is 140/100 mL, after 8h of treatment MPN value is 30/100 mL.

Bacteria Free Water for Drinking by Silver Treatment – KSCST – IISc. – 2013 58
Graph 12: Graph depicting the variations in MPN values for different samples at 0h and 8h respectively. Source: Rain water, S1, S2, S3….: Sample numbers.
For S102: Sample at 0h of treatment MPN value is 4/100 mL, after 8h of treatment MPN value is 2/100 mL. For S86: Sample at 0h of treatment MPN value is 8/100 mL, after 8h of treatment MPN value is 2/100 mL. For S85: Sample at 0h of treatment MPN value is 13/100 mL, after 8h of treatment MPN value is 4/100 mL. For S92: Sample at 0h of treatment MPN value is 13/100 mL, after 8h of treatment MPN value is 2/100 mL. For S77: Sample at 0h of treatment MPN value is 23/100 mL, after 8h of treatment MPN value is 2/100 mL. For S90: Sample at 0h of treatment MPN value is 23/100 mL, after 8h of treatment MPN value is 13/100 mL. For S99: Sample at 0h of treatment MPN value is 23/100 mL, after 8h of treatment MPN value is 8/100 mL.

Bacteria Free Water for Drinking by Silver Treatment – KSCST – IISc. – 2013 59
Graph 13: Graph depicting the variations in MPN values for different samples at 0h and 8h respectively. Source: Rain water, S1, S2, S3….: Sample numbers.
For S91: First sample at 0h of treatment MPN value is 30/100 mL, after 8h of treatment MPN value is 8/100 mL. For S84: Sample at 0h of treatment MPN value is 50/100 mL, after 8h of treatment MPN value is 4/100 mL. For S98: Sample at 0h of treatment MPN value is 50/100 mL, after 8h of treatment MPN value is 23/100 mL. For S81: Sample at 0h of treatment MPN value is 80/100 mL, after 8h of treatment MPN value is 6/100 mL. For S97: Sample at 0h of treatment MPN value is 84/100 mL, after 8h of treatment MPN value is 60/100 mL. For S87: Sample at 0h of treatment MPN value is 170/100 mL, after 8h of treatment MPN value is 140/100 mL

Bacteria Free Water for Drinking by Silver Treatment – KSCST – IISc. – 2013 60
Graph 14: Graph depicting the variations in MPN values for different samples at 0h and 8h respectively. Source: Rain water, S1, S2, S3….: Sample numbers.
For S88: Sample at 0h of treatment MPN value is 1600/100 mL, after 8h of treatment MPN value is 90/100 mL. Table 4.3.8a: Results and graphs on Reduced flow method
Sample No.
Water sources
Weight of silver
sheet in Grams
Results on MPN/100mL
Control (without silver sheet) MPN/100mL
0h 8h 24h C
3 Open well water
131.32 280 350 920
5 Open well water
131.32 540 79 350
4 Open well water
131.32 1600 240 920
7 Open well water
131.32 1600 540 110
9 Open well water
156.455 170 130 540
11 Open well water
156.455 540 350 49

Bacteria Free Water for Drinking by Silver Treatment – KSCST – IISc. – 2013 61
Graph 15a(1): Graph depicting the variations in MPN values for different samples at 0h, 8h and 24hC (C-control), Source: Open well water, S1, S2, S3….: Sample numbers.
For S3: Sample at 0h of treatment MPN value is 280/100 mL, after 8h of treatment MPN value is 350/100 mL, Where as for 24hC (without silver sheet) is 920 MPN/100 mL. For S5: Sample at 0h of treatment MPN value is 540/100 mL, after 8h of treatment MPN value is 79/100 mL, Where as for 24hC (without silver sheet) is 350 MPN/100 mL. For S4: Sample at 0h of treatment MPN value is 1600/100 mL, after 8h of treatment MPN value is 240/100 mL, Where as for 24hC (without silver sheet) is 920 MPN/100 mL. For S7: Sample at 0h of treatment MPN value is 1600/100 mL, after 8h of treatment MPN value is 540/100 mL, Where as for 24hC (without silver sheet) is 110 MPN/100 mL.
24C

Bacteria Free Water for Drinking by Silver Treatment – KSCST – IISc. – 2013 62
Graph 15a(2): Graph depicting the variations in MPN values for different samples at 0h, 8h and 24hC (C-control), Source: Open well water, S1, S2, S3….: Sample numbers.
For S9: Sample at 0h of treatment MPN value is 170/100 mL, after 8h of treatment MPN value is 130/100 mL, Where as for 24hC (without silver sheet) is 540 MPN/100 mL. For S11: Sample at 0h of treatment MPN value is 540/100 mL, after 8h of treatment MPN value is 350/100 mL, Where as for 24hC (without silver sheet) is 49 MPN/100 mL.
Table 4.3.8b: Results and graphs on Reduced flow method
Sample No.
Water sources
Weight of silver sheet in Grams
Results on MPN/100mL
0h 8h 24h
11 Open well
water 28 540 350 13
12 Open well
water 156.455 220 30 13
24C
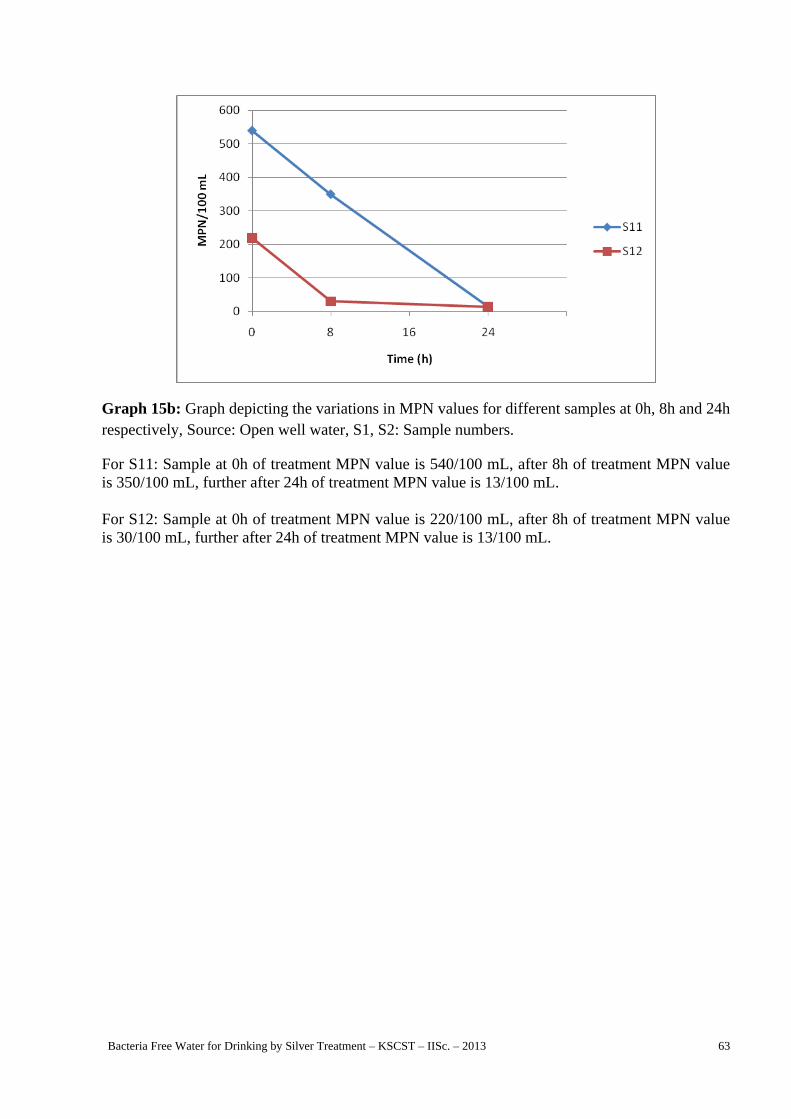
Bacteria Free Water for Drinking by Silver Treatment – KSCST – IISc. – 2013 63
Graph 15b: Graph depicting the variations in MPN values for different samples at 0h, 8h and 24h respectively, Source: Open well water, S1, S2: Sample numbers.
For S11: Sample at 0h of treatment MPN value is 540/100 mL, after 8h of treatment MPN value is 350/100 mL, further after 24h of treatment MPN value is 13/100 mL. For S12: Sample at 0h of treatment MPN value is 220/100 mL, after 8h of treatment MPN value is 30/100 mL, further after 24h of treatment MPN value is 13/100 mL.
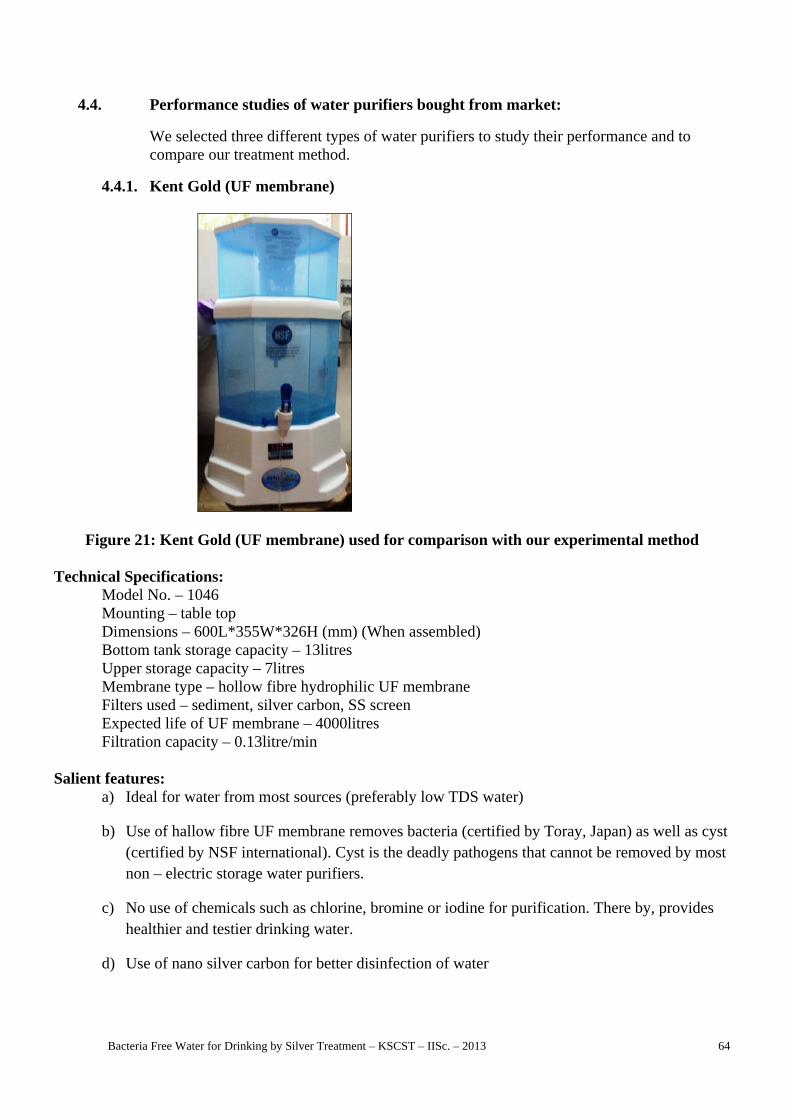
Bacteria Free Water for Drinking by Silver Treatment – KSCST – IISc. – 2013 64
4.4. Performance studies of water purifiers bought from market:
We selected three different types of water purifiers to study their performance and to compare our treatment method.
4.4.1. Kent Gold (UF membrane)
Figure 21: Kent Gold (UF membrane) used for comparison with our experimental method
Technical Specifications: Model No. – 1046 Mounting – table top Dimensions – 600L*355W*326H (mm) (When assembled) Bottom tank storage capacity – 13litres Upper storage capacity – 7litres Membrane type – hollow fibre hydrophilic UF membrane Filters used – sediment, silver carbon, SS screen Expected life of UF membrane – 4000litres Filtration capacity – 0.13litre/min Salient features:
a) Ideal for water from most sources (preferably low TDS water)
b) Use of hallow fibre UF membrane removes bacteria (certified by Toray, Japan) as well as cyst (certified by NSF international). Cyst is the deadly pathogens that cannot be removed by most non – electric storage water purifiers.
c) No use of chemicals such as chlorine, bromine or iodine for purification. There by, provides healthier and testier drinking water.
d) Use of nano silver carbon for better disinfection of water

Bacteria Free Water for Drinking by Silver Treatment – KSCST – IISc. – 2013 65
e) Very high storage capacity of 20litres (13litres in bottom tank and 7litres in the top tank), which makes purified water available on demand.
f) Food grade, plastic construction for trouble free maintains and long life.
Filtration process:
This particular filter works on the basis of 3 steps of filtration a) Removal of suspended particles
b) Removal of organic or chemical impurities
c) Removal of disinfection
Water from more sources (preferably low TDS water) is filled from the top tank which passes though sediment filter which removes the suspended particles. Removal of organic / chemical impurities such as chlorine, bad taste and odor is done by passing though the silver impregnated carbon granules. Water from the top tank flows down to the bottom tank though Ultra Filtration membrane, in this process the bacteria and cyst have been removed and thus purified water collects in the bottom tank, from where it can be dispensed for drinking.

Bacteria Free Water for Drinking by Silver Treatment – KSCST – IISc. – 2013 66
Table 4.4.1: Results and graphs on Purifiers (Kent)
Sample No.
Water sources
Results on MPN/100mL
Control (without silver
sheet) MPN/100mL
0h 8h 24h C
12 Open well
water 540 0 170
14 Open well
water 540 0 110
20 Open well
water 540 31 130
22 Open well
water 540 119 110
10 Open well
water 920 0 350
13
Open well water
920 0 540
9 Open well
water 1600 0 1600
25 Open well
water 1600 0 920
Graph 16: Graph depicting the variations in MPN values for different samples at 0h, 8h and 24hC respectively, Source: Open well water, S1, S2: Sample numbers.
For 12: Sample at 0h of treatment MPN value is 540/100 mL, after 8h of treatment MPN value is 0/100 mL, Where as for 24hC (without silver sheet) is 170 MPN/100 mL.
24C

Bacteria Free Water for Drinking by Silver Treatment – KSCST – IISc. – 2013 67
For S14: Sample at 0h of treatment MPN value is 540/100 mL, after 8h of treatment MPN value is 0/100 mL, Where as for 24hC (without silver sheet) is 110 MPN/100 mL. For S20: Sample at 0h of treatment MPN value is 540/100 mL, after 8h of treatment MPN value is 31/100 mL, Where as for 24hC (without silver sheet) is 130 MPN/100 mL. For S22: Fifteenth sample at 0h of treatment MPN value is 540/100 mL, after 8h of treatment MPN value is 119/100 mL, Where as for 24hC (without silver sheet) is 110 MPN/100 mL. For S10: Sample at 0h of treatment MPN value is 920/100 mL, after 8h of treatment MPN value is 0/100 mL, Where as for 24hC (without silver sheet) is 350 MPN/100 mL. For S13: Sample at 0h of treatment MPN value is 920/100 mL, after 8h of treatment MPN value is 0/100 mL, Where as for 24hC (without silver sheet) is 540 MPN/100 mL.
Graph 17: Graph depicting the variations in MPN values for different samples at 0h, 8h and 24hC respectively, Source: Open well water, S1, S2: Sample numbers.
For S9: Sample at 0h of treatment MPN value is 1600/100 mL, after 8h of treatment MPN value is 0/100 mL, Where as for 24hC (without silver sheet) is 1600 MPN/100 mL.
For S25: Sample at 0h of treatment MPN value is 1600/100 mL, after 8h of treatment MPN value is 0/100 mL, Where as for 24hC (without silver sheet) is 920 MPN/100 mL.
24C
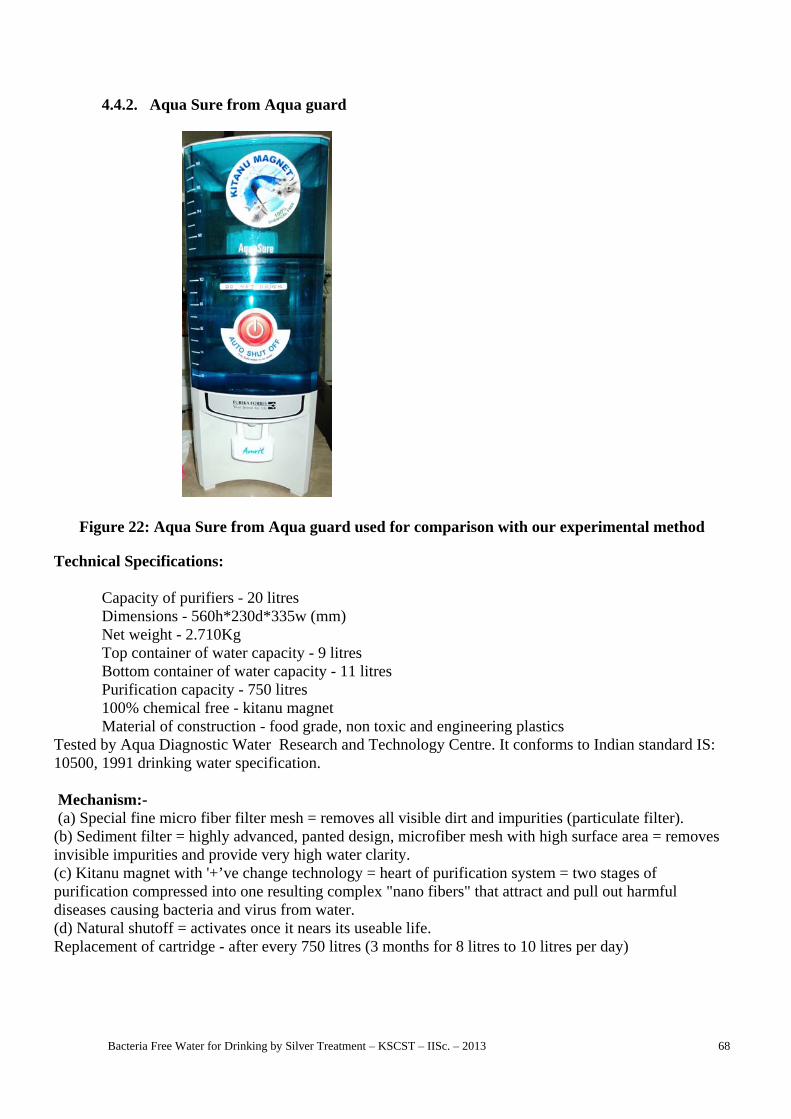
Bacteria Free Water for Drinking by Silver Treatment – KSCST – IISc. – 2013 68
4.4.2. Aqua Sure from Aqua guard
Figure 22: Aqua Sure from Aqua guard used for comparison with our experimental method
Technical Specifications: Capacity of purifiers - 20 litres Dimensions - 560h*230d*335w (mm) Net weight - 2.710Kg Top container of water capacity - 9 litres Bottom container of water capacity - 11 litres Purification capacity - 750 litres 100% chemical free - kitanu magnet Material of construction - food grade, non toxic and engineering plastics Tested by Aqua Diagnostic Water Research and Technology Centre. It conforms to Indian standard IS: 10500, 1991 drinking water specification. Mechanism:- (a) Special fine micro fiber filter mesh = removes all visible dirt and impurities (particulate filter). (b) Sediment filter = highly advanced, panted design, microfiber mesh with high surface area = removes invisible impurities and provide very high water clarity. (c) Kitanu magnet with '+’ve change technology = heart of purification system = two stages of purification compressed into one resulting complex "nano fibers" that attract and pull out harmful diseases causing bacteria and virus from water. (d) Natural shutoff = activates once it nears its useable life. Replacement of cartridge - after every 750 litres (3 months for 8 litres to 10 litres per day)
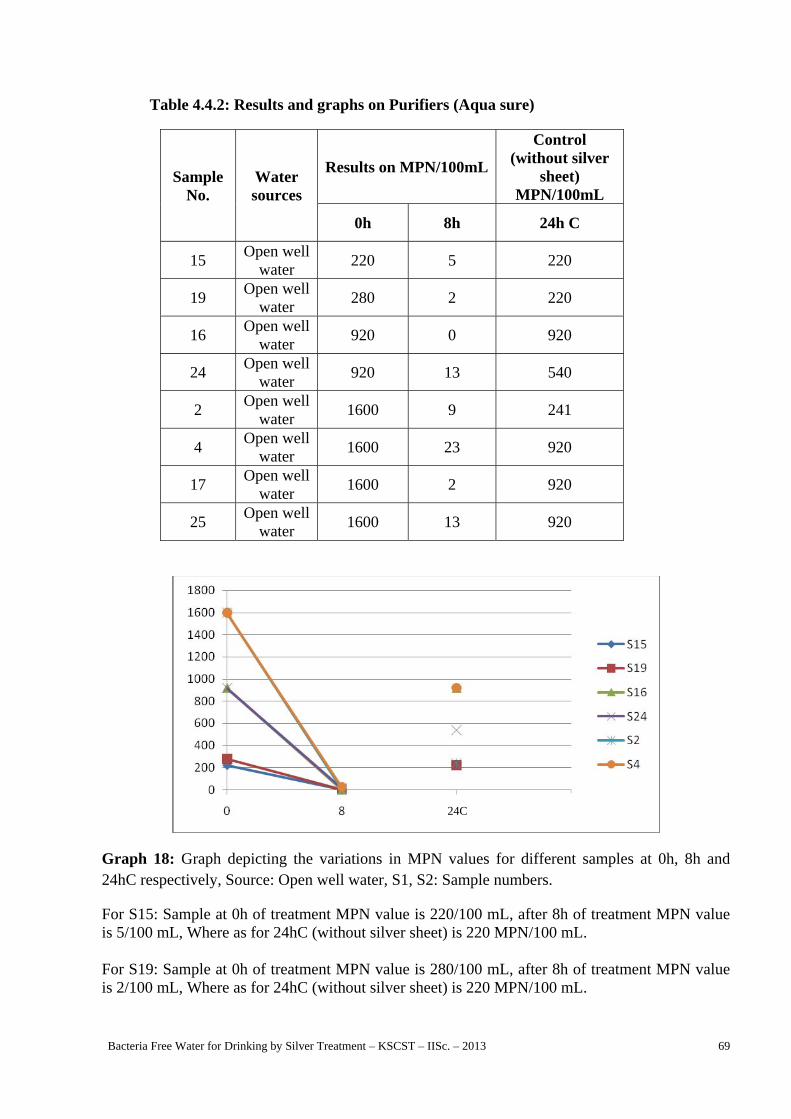
Bacteria Free Water for Drinking by Silver Treatment – KSCST – IISc. – 2013 69
Table 4.4.2: Results and graphs on Purifiers (Aqua sure)
Sample No.
Water sources
Results on MPN/100mL
Control (without silver
sheet) MPN/100mL
0h 8h 24h C
15 Open well
water 220 5 220
19 Open well
water 280 2 220
16 Open well
water 920 0 920
24 Open well
water 920 13 540
2 Open well
water 1600 9 241
4 Open well
water 1600 23 920
17 Open well
water 1600 2 920
25 Open well
water 1600 13 920
Graph 18: Graph depicting the variations in MPN values for different samples at 0h, 8h and 24hC respectively, Source: Open well water, S1, S2: Sample numbers.
For S15: Sample at 0h of treatment MPN value is 220/100 mL, after 8h of treatment MPN value is 5/100 mL, Where as for 24hC (without silver sheet) is 220 MPN/100 mL.
For S19: Sample at 0h of treatment MPN value is 280/100 mL, after 8h of treatment MPN value is 2/100 mL, Where as for 24hC (without silver sheet) is 220 MPN/100 mL.
24C

Bacteria Free Water for Drinking by Silver Treatment – KSCST – IISc. – 2013 70
For S16: Sample at 0h of treatment MPN value is 920/100 mL, after 8h of treatment MPN value is 0/100 mL, Where as for 24hC (without silver sheet) is 920 MPN/100 mL.
For S24: Sample at 0h of treatment MPN value is 920/100 mL, after 8h of treatment MPN value is 13/100 mL, Where as for 24hC (without silver sheet) is 540 MPN/100 mL.
For S2: Sample at 0h of treatment MPN value is 1600/100 mL, after 8h of treatment MPN value is 9/100 mL, Where as for 24hC (without silver sheet) is 241 MPN/100 mL.
For S4: Sample at 0h of treatment MPN value is 1600/100 mL, after 8h of treatment MPN value is 23/100 mL, Where as for 24hC (without silver sheet) is 920 MPN/100 mL.
Graph 19: Graph depicting the variations in MPN values for different samples at 0h, 8h and 24hC respectively, Source: Open well water, S1, S2: Sample numbers.
For S17: Sample at 0h of treatment MPN value is 1600/100 mL, after 8h of treatment MPN value s 13/100 mL, where as for 24hC (without silver sheet) is 920 MPN/100 mL.
For S25: Sample at 0h of treatment MPN value is 1600/100 mL, after 8h of treatment MPN value is 13/100 mL, Where as for 24hC (without silver sheet) is 920 MPN/100 mL.
24C

Bacteria Free Water for Drinking by Silver Treatment – KSCST – IISc. – 2013 71
4.4.3 Pure it:
Figure 23: Pure it used for comparison with our set up of experimental method Technical Specifications: Capacity of purifier - 14 litres Dimension - 49h*25.3d*24.7w in cm Net weight - 2.4 Kg Water storage capacity - 5 litres Material of construction - food safe, non toxic and engineering plastics
Purification capacity - The germ kill kit has been designed to typically give 1250 liters of water at a temperature to 25° C, in moderate humidity conditions. Germ kill performance standard - meets stringent international criteria of the Environmental Protection Agency (EPA), USA, for harmful viruses and bacteria removal.
Filtration process: In this filter, as the water fed to it passes though the micro fibre mesh where the physical/visible contaminants, sediments have been removed and then with the help of activated carbon and the germkill kit processor the invisible, harmful bacteria, viruses and pesticides have been removed, this is the main filtration unit it also has an indicator to know the condition of the germkill kit. Though the batching chamber water flows though the polisher which helps in the removal of chlorine and other contaminants to make water clear, odourless and natural tasting. Then the clean water is collected in the cleansing collection chamber, from that the clean water is dispensed for drinking.

Bacteria Free Water for Drinking by Silver Treatment – KSCST – IISc. – 2013 72
Table 4.4.3: Results and graphs on Purifiers (Pure it)
Sample No.
Water sources
Results on MPN/100mL
Control (without silver sheet) MPN/100mL
0h 8h 24h C
5 Open well water 170 0 350 6 Open well water 170 2 130 7 Open well water 140 0 130 18 Open well water 1600 79 180 25 Open well water 1600 0 920
Graph 20: Graph depicting the variations in MPN values for different samples at 0h, 8h and 24hC respectively, Source: Open well water, S1, S2: Sample numbers. For S5: Sample at 0h of treatment MPN value is 170/100 mL, after 8h of treatment MPN value is 0/100 mL, Where as for 24hC (without silver sheet) is 350 MPN/100 mL. For S6: Sample at 0h of treatment MPN value is 170/100 mL, after 8h of treatment MPN value is 2/100 mL, Where as for 24hC (without silver sheet) is 130 MPN/100 mL. For S7: Sample at 0h of treatment MPN value is 140/100 mL, after 8h of treatment MPN value is 0/100 mL, Where as for 24hC (without silver sheet) is 130 MPN/100 mL.
For S18: Sample at 0h of treatment MPN value is 1600/100 mL, after 8h of treatment MPN value is 79/100 mL, Where as for 24hC (without silver sheet) is 180 MPN/100 mL. For S25: Sample at 0h of treatment MPN value is 1600/100 mL, after 8h of treatment MPN value is 0/100 mL, Where as for 24hC (without silver sheet) is 920 MPN/100 mL.
24C

Bacteria Free Water for Drinking by Silver Treatment – KSCST – IISc. – 2013 73
Table 4.4: Comparison between silver treatment and other three brands of water purifiers available in the market Detail of water purification for four types of process:
Sl.No Purifier Name
Silver sheet Kent Gold - B Pure it - A Aqua Sure - C
1 Source of sample
Open well, Bore well, Rain water
Water with low TDS value
Chlorinated water Chlorinated water
2 Container Capacity
1lt 20 lts 14 lts 20 lts
3 Material of construction
Stainless Steel and Tupper wear
Food grade plastic
Food grade, Non toxic Engineering plastics
Food grade, Non toxic Engineering plastics
4 Filter Element
99.9% pure silver sheet metal
Sediment and silver impregnated carbon granules, UF membrane
Microfibre mesh filter, activated carbon, germ kill kit
Particulate filter which is a Fine Micromesh, Sediment filter, Kitanu Magnet with Positive charge Technology
5 Treatment Time
8-24 hours 8 hours 3 hours 3 hours
6 Bacteria removal efficiency
Bacteria free water
Removes chlorine, bad taste and odour, most of the bacteria and 99.99% cysts
Removes harmful virus and bacteria, Pesticides, chlorine
Removes Particulate matter like visible dirt and impurities,
7 Life of purifier
Life time Upto 4000 lts Upto 1250 lts 5 years
8 Total sample purification capacity
1lt of water = 30g of silver
4000 lts 1250 lts 750 lts
9 Advantage Eco friendly, Chemical free, Self fabrication, Portable, Treats without change in colour, odour, taste
Chemical free as safe as boiled water without the hassles of boiling
100% chemical free, Attracts Bacteria, Virus and Cysts, Drugs and pesticide removal, crystal clear Sweet tasting water

Bacteria Free Water for Drinking by Silver Treatment – KSCST – IISc. – 2013 74
Sl.No Purifier Name
Silver sheet Kent Gold Pure it Aqua Sure
10 Disadvantage Takes longer time to treat water
Microbiologically unsafe water cannot be used
Microbiologically unsafe water cannot be used
Slime growth may occur at the bottom of the container
11 Treatment efficiency
1600 MPN/100mL to 13 MPN/100mL
1600 MPN/ 100mL to NIL
1600 MPN/100mL to 79 MPN/100mL
1600 MPN/100mL to 2 MPN/100mL
12 Cost Rs 1500/- Rs 2550/- Rs 2800/- Rs 2390/- 13 Certified by Mines and
Geology Department, GOK
NSF International, Toray and Japan
EPA, USA IS: 10500, 1991 Drinking water specification
Test results of water purifiers:
Sample No.
Raw sample Silver sheet
method Brand - A Brand - B Brand - C
MPN/100ml Results at 8 hours of treatment MPN/100ml
87 >1600 920 0
88 1600 920 9
90 1600 920 23
91 170 110 0
92 170 130 2
93 140 130 0
94 >1600 280 94
96 920 540 0
98 540 8 (after 24h) 0
99 920 540 0
100 540 140 0
101 220 79 5
102 920 280 0
103 1600 350 2
105 1600 140 (after 24h) 79
109 280 170 2
112 540 350 31
114 180 13 0
117 540 240 119
122 920 240 13
125 1600 920 (after 24h) 0 0 13 125 - Test at Mines and Geology
1600 110 (after 24h) 0 23 23
Bacteria Free Water for Drinking by Silver Treatment – KSCST – IISc. – 2013 75
As per the above table the MPN values for 87th sample at 0hours of treatment is >1600 MPN /100
mL, after 8hours of treatment using Silver sheet as treatment media the MPN value is 920 MPN/100 mL. In comparison with the commercially available purifiers (C) after 8 hours of treatment for 8liters of water sample MPN value is found to be 0 MPN/100 mL.
For 90th sample the MPN values at 0 hours of treatment are found to be 1600 MPN/100 mL after 8 hours of treatment using silver sheet as treatment media the MPN value is 920 MPN/100 mL. In comparison with the commercially available purifiers (C) after 8 hours of treatment for 32liters of water sample MPN value is found to be 23 MPN/100 mL.
For 91st Sample the MPN values at 0 hours of treatment are found to be 170 MPN/100 mL after 8 hours of treatment using silver sheet as treatment media the MPN value is 110 MPN/100 mL. In comparison with the commercially available purifiers (A) after 8 hours of treatment for 20 liters of water sample MPN value is found to be 0 MPN/100 mL.
For 94th Sample the MPN values at 0 hours of treatment is found to be >1600 MPN/100 mL after 8 hours of treatment using silver sheet as treatment media the MPN value is 280/100 mL. In comparison with the commercially available purifiers (A) after 8 hours of treatment for 36 liters of water sample MPN value is found to be 94 MPN/100 mL.
For 112th Sample the MPN values at 0 hours of treatment are found to be 540 MPN/100 mL after 8 hours of treatment using silver sheet as treatment media the MPN value is 350/100 mL. In comparison with the commercially available purifiers (B) after 8 hours of treatment for 30 liters of water sample MPN value is found to be 0 MPN/100 mL.
For 117th Sample the MPN values at 0 hours of treatment are found to be 540 MPN/100 mL after 8 hours of treatment using silver sheet as treatment media the MPN value is 240/100 mL. In comparison with the commercially available purifiers (B) after 8 hours of treatment for 80 liters of water sample MPN value is found to be 119 MPN/100 mL.
For 125th Sample the MPN values at 0 hours of treatment are found to be 1600 MPN/100 mL after 24 hours of treatment using silver sheet as treatment media, the MPN value is 110/100 mL. In comparison, the commercially available purifiers (A) - MPN value of 0/100 mL (B) - MPN value of 23/100 mL (C) MPN value of 23/100 mL.
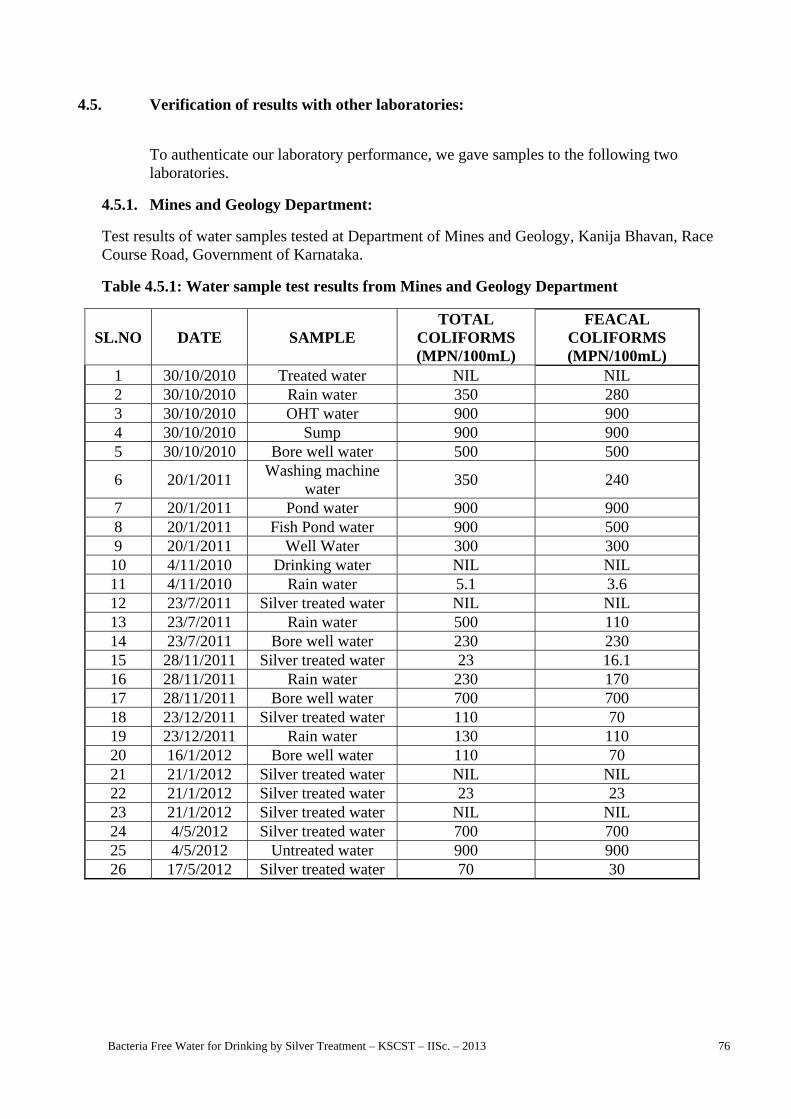
Bacteria Free Water for Drinking by Silver Treatment – KSCST – IISc. – 2013 76
4.5. Verification of results with other laboratories:
To authenticate our laboratory performance, we gave samples to the following two laboratories.
4.5.1. Mines and Geology Department:
Test results of water samples tested at Department of Mines and Geology, Kanija Bhavan, Race Course Road, Government of Karnataka.
Table 4.5.1: Water sample test results from Mines and Geology Department
SL.NO DATE SAMPLE TOTAL
COLIFORMS (MPN/100mL)
FEACAL COLIFORMS (MPN/100mL)
1 30/10/2010 Treated water NIL NIL 2 30/10/2010 Rain water 350 280 3 30/10/2010 OHT water 900 900 4 30/10/2010 Sump 900 900 5 30/10/2010 Bore well water 500 500
6 20/1/2011 Washing machine
water 350 240
7 20/1/2011 Pond water 900 900 8 20/1/2011 Fish Pond water 900 500 9 20/1/2011 Well Water 300 300 10 4/11/2010 Drinking water NIL NIL 11 4/11/2010 Rain water 5.1 3.6 12 23/7/2011 Silver treated water NIL NIL 13 23/7/2011 Rain water 500 110 14 23/7/2011 Bore well water 230 230 15 28/11/2011 Silver treated water 23 16.1 16 28/11/2011 Rain water 230 170 17 28/11/2011 Bore well water 700 700 18 23/12/2011 Silver treated water 110 70 19 23/12/2011 Rain water 130 110 20 16/1/2012 Bore well water 110 70 21 21/1/2012 Silver treated water NIL NIL 22 21/1/2012 Silver treated water 23 23 23 21/1/2012 Silver treated water NIL NIL 24 4/5/2012 Silver treated water 700 700 25 4/5/2012 Untreated water 900 900 26 17/5/2012 Silver treated water 70 30

Bacteria Free Water for Drinking by Silver Treatment – KSCST – IISc. – 2013 77
4.5.2. Essen & Co:
Test results from Essen & Co., private testing and analysis laboratory, 8th Main Road, Malleshwaram, Bangalore.
Table 4.5.2: Water sample test results from Essen & Co.
SL.NO DATE SAMPLE TOTAL
COLIFORMS (MPN/100mL)
FEACAL COLIFORMS (MPN/100mL)
E.coli
1 1/6/2012 Untreated Rainwater 541 Absent Absent 6hs Treated water 46 Absent Absent 2 1/6/2012 Drinking water NIL Absent Absent 3 28/6/2012 Untreated Borewell water 21 Absent Absent 2hs Treated water 9 Absent Absent 4hs Treated water 5 Absent Absent 6hs Treated water NIL Absent Absent 8hs Treated water NIL Absent Absent 4 1/7/2012 Untreated water 148 Absent Absent 1lt - 8hs Treated water 94 Absent Absent 2lts - 8hs Treated water 6 Absent Absent 5 9/10/2012 Untreated water 345 Absent Absent Treated drinking water 221 Absent Absent 6 27/11/2012 Untreated water 94 Present Present 8hs Treated water 46 Present Present

Bacteria Free Water for Drinking by Silver Treatment – KSCST – IISc. – 2013 78
CONCLUSIONS
Dipping Silver sheet inside water for few hours will decrease bacterial count.
Water purification for bacterial contamination using silver sheet has been established through experiments. The test results have been verified through water sample analysis after and before treating bacteriological contaminated water with silver sheet at:
o Indian Institute of Science o Mines and Geology Department, Government of Karnataka o Ms Essen & Co Labs, Bangalore
Immersion of silver sheet inside drinking water will not leave residual silver in the treated water (Silver treated water is not harmful to human health).
Water samples from different locations of Bangalore were treated with silver sheet and the bacterial count reduced considerably with time and size of silver sheet. Samples were collected from following sources:
o Rainwater o Open well water o Bore well water o Tap water o Open pond water
A total of 220 water quality tests using MPN method and 50 water quality tests using CFU method from 172 water samples for bacterial contamination have been conducted in the laboratory of Indian Institute of Science:
o Rainwater samples 50 o Open well samples 61 o Borewell water samples 46 o Tap water 11 o Open Pond water 4
Bacterial count of over 1600 MPN/100ml was recorded from water samples collected for treatment.
Water sample (sample no.70a) collected from one of the residence in Magadi Road, Bangalore (tap water from multiple sources = city supply + borewell) had bacterial contamination of over 1600 MPN/100ml and when treated with silver sheet for 8 hours, the bacterial count reduced to 23 MPN/100ml and the water was potable in 24 hours of treatment and the bacterial count reduced to 5 MPN/100ml. The 48 hours treatment recorded Zero bacterial activity.
Water samples treated for 8 hours by dipping silver sheet had the effect of removing bacterial contamination as follows – total samples 224:
o Bacteria removal up to 90% was achieved in 12 samples o Bacteria removal up to 75% was achieved in 36 samples o Bacteria removal up to 50% was achieved in 71 samples o Bacteria removal up to 25% was achieved in 97 samples o Bacteria removal of less than 25% was observed in 8 samples
Comparison of water treatment by dipping silver sheet against three commercially available water purifiers

Bacteria Free Water for Drinking by Silver Treatment – KSCST – IISc. – 2013 79
REFERENCES
1. Andrew D. Eaten, Lenose S. Clesceri, Eugene W. Rice, Arnold E. Greenberg, 21st Editon, 2005, Standard Methods for the Examination of water and waste water, (pg.no9-48).
2. Andrew D. Eaten, Lenose S. Clesceri, Eugene W. Rice, Arnold E. Greenberg, 21st Editon, 2005, Standard Methods for the Examination of water and waste water, (pg.no9-34).
3. D. Schoenen* Hygiene-Institut, University atsklinikum Bonn, Sigund-Freud-Stra_e 25, 53105
Bonn (Venusberg), 12 February 2002. Role of disinfection in suppressing the spread of pathogens with drinking water.
4. Guojing Zhao & S. Edward Stevens, 17 September 1997. Multiple parameters for the
comprehensive evaluation of the susceptibility of Escherichia coli to the silver ion. Jr Department of Microbiology and Molecular Cell Sciences, The University of Memphis, Memphis,TN 38152.
5. Indian Standard DRINKING WATER — SPECIFICATION (First Revision) (Incorporating
Amendment No. 1) UDC 628.1.033 IS 10500: 1991Edition 2.1(1993-01) B U R E A U O F I N D I A N S T A N D A R D S Manak Bhavan, 9 Bahadur Shah Zafar Marg New Delhi 110002.
6. ISO (international organization of standardization) 9001, H2S Test Vials (Microbiological Quality
of Drinking Water) H.S. INDUSTRIES.
7. J. Bartram, J. Cotruvo, M. Exner, C. Fricker, A.Glasmacher, Heterotrophic Plate Counts and Drinking-water Safety - The Significance of HPCs for Water Quality and Human Health.
8. January 2001, Multiple Tube Fermentation Technique for Members of the Coliform Group – Design Manual – Water Quality Analysis. (Page 61, volume-7) (Source from NEERI & Pollution control board).
9. MPN Index and 95% confidence limits for various combinations of positive results for Methods 9221B and 9221E: Multiple-Tube Fermentation Technique for Fecal Coliforms (EC Medium) and Standard Total Coliform Fermentation Technique where five tubes per dilution are used (10 mL, 1.0 mL and 0.1 mL sample portions).
10. RAIN Water Quality Guidelines, Version 1, 15-07-2008 - Guidelines and practical tools on rainwater quality – Rain Water Harvesting Implementation Network (RAIN) Foundation www.rainfoundation.org. email: [email protected]
11. Robert B. Thurman, Environmental Research laboratory, Charles P. Gerba, The molecular
mechanism of copper and silver ion disinfection of bacteria, Volume 18, Issue 4 198 (pg.no 303).

Bacteria Free Water for Drinking by Silver Treatment – KSCST – IISc. – 2013 80
12. Sontakke Sharad, January, 2012. Inactivation of Microorganisms by Photocatalysis, M.Department of Chemical EngineeringIndian institute of ScienceBangalore – 560012 (INDIA), (pg no. 36).
13. Woo Kyung Jung, 1† Hye Cheong Koo, 1, 2* Ki Woo Kim, 3 Sook Shin, 1So Hyun Kim, 1 and
Yong Ho Park1. 21 January 2008, Antibacterial Activity and Mechanism of Action of the Silver Ion in Staphylococcus aureus and Escherichia coli, *Department of Microbiology1 and KRF Zoonotic Disease Priority Research Institute, College of Veterinary Medicine and BK21 Program for Veterinary Science,2 and National Instrumentation Center for Environmental Management.

Bacteria Free Water for Drinking by Silver Treatment – KSCST – IISc. – 2013 81
ANNEXURES
Annexure I Abbreviations: H – Himedia M – Merck H2S – Hydrogen Sulphide HPC – Heterotrophic Plate Count CFU – Colony Forming Unit MPN – Most Probable Number MTFT – Multiple Tube Fermentation Technique IS – Indian Standard BIS – Bureau of Indian Standard CPCB – Central Pollution Control Board EPA - Environmental Protection Agency UF - Ultra Filtration NSF - National Science foundation GOK - Government of Karnataka Annexure II Silver sheet size and weight:
Sheet 1 – 23cm x 43cm, 136.600 g
Sheet 2 – 22cm x 48cm, 156.507 g Above sheets were cut to the following sizes for experiments:
Sheet 3 – 3cm x 32cm, 14.004 g
Sheet 4 – 5cm x 21cm, 15.730 g
Sheet 5 – 9.9cm x 21cm, 23.146 g
Sheet 6 – 10cm x 21cm, 23.295 g
Sheet 7 – 15cm x 21cm, 31.345 g
Sheet 8 – 19.5cm x 43cm, 117.305 g

Bacteria Free Water for Drinking by Silver Treatment – KSCST – IISc. – 2013 82
Annexure III Details of Chemicals used in different methods of water testing:
Chemicals used in CFU method 1) Luria broth from Himedia – 500g 2) Agar Agar type – 1 from Himedia – 500g
Stains used in gram staining method 1) Grams crystal violet staining solution 2) Grams iodine stating solution 3) Grams safranine staining solution
Chemicals used in MPN method 1) Lactose monohydrate – RM565 – 500g – (H) 2) Sodium chloride / GR – 500g – (M) 3) Di - potassium hydrogen phosphate / GR – 500g – (M) 4) Potassium di hydrogen phosphate / GR – 500g – (M) 5) Tryptose – RM030 – 500g – (H) 6) Hydrochloric acid CR / SD’s – 500mL 7) Ethanol – AR – 99.9 %
Source of Chemicals: M/S Mahajan chemicals 32, 1st floor, 2nd cross, sirur park road junction, Malleshwaram, Bangalore – 560 003 Go down: No. 19, 4th main road, D.D.T.T. Ltd., industrial suburb, 2nd stage, yeshwanthpur, Bangalore – 560 022 Tel: 41686930, 41223063 Fax: 23465459 M/S Lab supplies India pvt. Ltd (Formerly laboratory supplies Co. Estd. 1925) 14, 21st cross, cubbonpet, Bangalore – 560 002 Tel: 22212256, 22485257 Fax: 22292848 M/S Lab Needs No. 49, 7th main road, opp: lakshminarasimha temple, 3rd block, thyagaraja nagar, Bangalore – 560 028 Tel Fax: 26772200, Mob: 9886401900

Bacteria Free Water for Drinking by Silver Treatment – KSCST – IISc. – 2013 83
Annexure IV MPN table: MPN Index and 95% confidence limits for various combinations of positive results for Methods 9221B and 9221E: Multiple-Tube Fermentation Technique for Fecal Coliforms (EC Medium) and Standard Total Coliform Fermentation Technique where five tubes per dilution are used (10 mL, 1.0 mL and 0.1 mL sample portions).
Combination
of positive tubes
MPN/100 mL
95% Confidence Limit Combination of positive
tubes
MPN/100 mL
Lower
95% Confidence Limit
Lower Upper Lower Upper 0-0-0 <2 1.0 10 4-2-0 22 9.0 560-0-1 2 1.0 10 4-2-1 26 12 650-1-0 2 1.0 14 4-3-0 27 12 670-2-0 4 4-3-1 33 15 77
4-4-0 34 16 80
1-0-0 2 1.0 11 5-0-0 23 9.0 861-0-1 4 1.0 15 5-0-1 30 10 1101-1-0 4 1.0 15 5-0-2 40 20 1401-1-1 6 2.0 18 5-1-0 30 10 1201-2-0 6 2.0 18 5-1-1 50 20 150
5-1-2 60 30 180
2-0-0 4 1.0 17 5-2-0 50 20 1702-0-1 4 2.0 20 5-2-1 70 30 2102-1-0 7 2.0 21 5-2-2 90 40 2502-1-1 9 3.0 24 5-3-0 80 30 2502-2-0 9 3.0 25 5-3-1 110 40 3002-3-0 12 5.0 29 5-3-2 140 60 360
3-0-0 8 3.0 24 5-3-3 170 80 4103-0-1 11 4.0 29 5-4-0 130 50 3903-1-0 11 4.0 29 5-4-1 170 70 4803-1-1 14 6.0 35 5-4-2 220 100 5803-2-0 14 6.0 35 5-4-3 280 120 6903-2-1 17 7.0 40 5-4-4 350 160 820
4-0-0 13 5.0 38 5-5-0 240 100 9404-0-1 17 7.0 45 5-5-1 300 100 13004-1-0 17 7.0 46 5-5-2 500 200 20004-1-1 21 9.0 55 5-5-3 900 300 29004-1-2 26 12 63 5-5-4 1600 600 5300
5-5-5 >1600

Bacteria Free Water for Drinking by Silver Treatment – KSCST – IISc. – 2013 84
Annexure V Equipment Details Autoclave:
PSM vertical type Temperature – Digital display, Pressure set – 1400C, 15pounds Heater – on/off Temperature up to 1250C
Incubator:
Bacteriological type 30tubes capacity Length = 28cm. Width = 13.5cm Temperature up to 500C (0.3+ or - variation) Digital display, 230v
PH meter:
Calibrate the instrument every time during PH check Order of the calibrating standard solutions is 4, 10, and 7 Digital, PH tutor
Weighing machine:
Digital display, DC – 10v, 0.3A Electronic Balance d=0.001g, Max=310g (AFCOSET)
Laminar Air Flow Chamber:
Horizontal airflow chamber Motor ¼ HP, 1440rpm, HEPA: 3”*2”
Hot Air Oven:
Non digital display Temperature – 1400C
Bacteria Free Water for Drinking by Silver Treatment – KSCST – IISc. – 2013 85
Acknowledgement
The financial assistance was provided by the Department of Science & Technology, Government of India New Delhi to implement this project “Bacteria Free Water for Drinking by Silver Treatment (BFWDST)”.
I sincerely thank Secretary KSCST Prof M.S. Mohan Kumar and Executive Secretary Dr M. Prithviraj for their continued support and guidance, from conceptualization of the project to successful implementation, and constant encouragement provided at various levels for successful completion of the project. My special thanks are to Dr. Sanjay Bajpai, Dr. Neelima Alam and Mr. Vineet Saini, DST GOI for their encouragement and support. This Project has the unique distinction of having Karnataka State Council for Science & Technology and Chemical Engineering Department of Indian Institute of Science, Bangalore collaborating for research project on water purification. Chemical Engineering Department of Indian Institute of Science played the key role in providing the infrastructure for the research activities and also providing technical guidance. The tireless team of Project associates Tejaswini K, Sowmya Shree S.D, Bhargavi M.P, Prajanya G.P and Navya Shree R. carried out various aspects of the project at different period of the project duration. My sincere thanks are due to them. This programme is the result of collective efforts of KSCST, RWH Team at KSCST, Chemical Engineering Department of IISc and many institutions and individuals who had the sprit to respect water conservation and treating water using simple methods. I acknowledge the commitment and cooperation of each and every one who made this project a success. I acknowledge the guidance provided by Ms Shashirekha, Former Chief Chemist, Mines and Geology Department, Government of Karnataka. My earnest thanks to KSCST for providing this opportunity and to all my colleagues at KSCST for their support in implementing this Project. Project Co Investigator Prof. K. Kesava Rao was an inspiration and a bank of information who relentlessly guided the project team for the successful implementation. I thank him for the partnership. A. R. Shivakumar Principal Investigator