final report analytical and experimental evaluation of an aluminum bridge deck … ·...
TRANSCRIPT

FINAL REPORT
ANALYTICAL AND EXPERIMENTAL EVALUATION OF AN ALUMINUM BRIDGE DECK PANEL
PART II: FAILURE ANALYSIS
Jeffrey M. Dobmeier Graduate Research Assistant
Furman W. Barton, Ph.D., P.E.
Faculty Research Scientist
José P. Gomez, Ph.D., P.E. Senior Research Scientist
Peter J. Massarelli, Ph.D.
Faculty Research Associate
Wallace T. McKeel, Jr., P.E. Research Manager
INTRODUCTION
Aluminum bridge decks may prove to be an alternative to concrete decks for improving the performance of structural bridge systems. Combining excellent corrosion resistance with extremely low density, aluminum decks can prolong surface life, facilitate the construction process, and expand rehabilitation capabilities. Reynolds Metals Company (Reynolds) believes that transportation organizations are interested in these advantages, and, as a result, they have invested considerable resources to develop a proprietary aluminum deck system.
The Virginia Department of Transportation agreed to employ the Reynolds’ deck system
in two projects. A single-span bridge located on U.S. Route 58 was chosen for this first project. Using the aluminum deck, the bridge was widened by 1.83 m (6 ft) to remove it from the functionally obsolete list (New Aluminum Decks, 1996). Originally, the Virginia Department of Transportation planned that the second project would involve a continuous span bridge on Virginia’s Smart Highway, the state test bed for intelligent transportation systems. However, recent complications with fabrication of the second deck have delayed initiation of the second project.
Using Federal Highway Administration sponsorship, the Virginia Transportation
Research Council initiated a three-phase study to evaluate the aluminum deck system. The first phase of this project analyzed the static response of a 2.74 m x 3.66 m (9 ft x 12 ft) deck panel.
2
Seven service-load tests and two ultimate-load (failure) tests were performed on the panel. This phase of the study was completed at the Turner-Fairbank Structural Laboratory in the fall of 1996. The experimental and analytical evaluation of the static service load tests on the aluminum panel has been completed and the results have been published (Dobmeier, et al., 1999). An evaluation of the ultimate load static tests is the subject of this report.
The performance under ultimate loads is of great interest, because very few bridges
employ aluminum decks and little is known about their maximum capacity. Additionally, this report also assessed the ability of finite element models to accurately predict failure loads and failure mechanisms. Use of these predictive models was a secondary, yet important benefit of this study.
Phase two of this study focused on a field evaluation of a constructed bridge and will be
covered in an upcoming report. The final phase (Phase III) of the project will examine the fatigue strength of the deck system and the longevity of the wearing surface.
PURPOSE AND SCOPE
The main objective of this study was to examine and evaluate the behavior of an aluminum deck panel when loaded to failure. A specific objective was to develop accurate finite element models of the deck panel that would predict behavior of the panel as loads approached the failure load. This predicted response could then be compared with experimental response information obtained from two ultimate-load laboratory tests.
This report documents the findings from the ultimate load simulations. Results from the
service-load tests are contained in the previous report, “Analytical and Experimental Evaluation of an Aluminum Bridge Deck Panel Part I: Service Load Performance” (Dobmeier, et al., 1999).
METHODOLOGY
Deck System
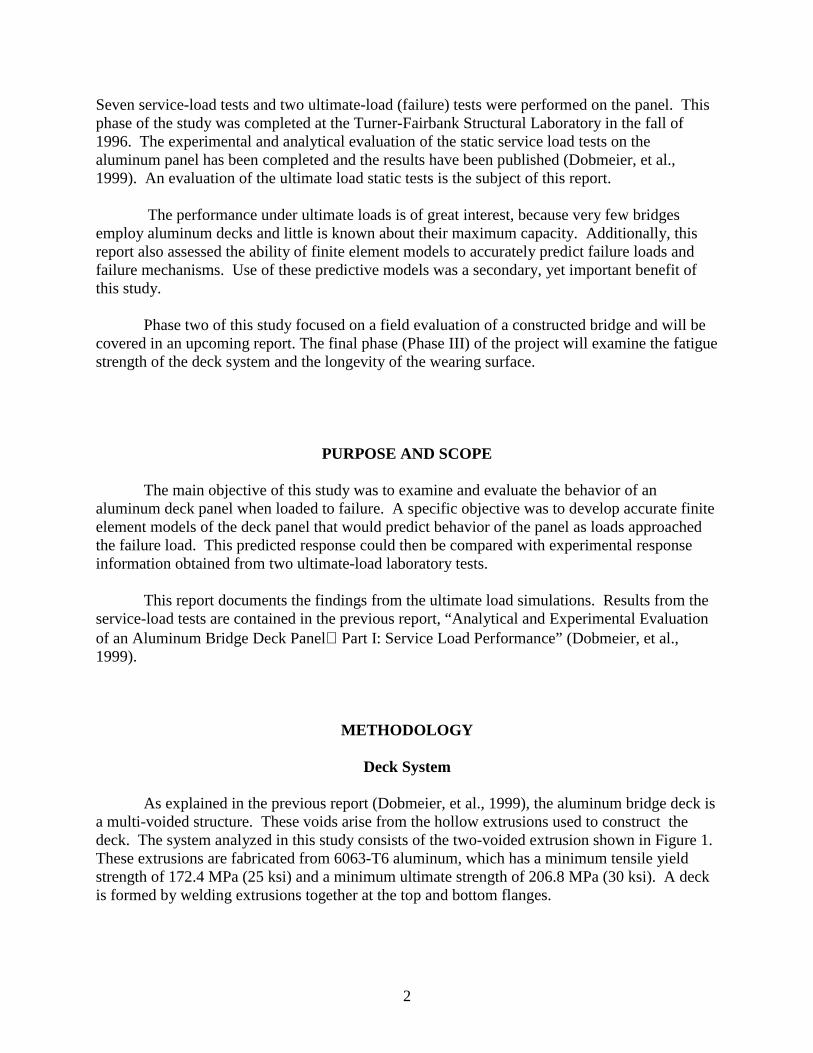
As explained in the previous report (Dobmeier, et al., 1999), the aluminum bridge deck is a multi-voided structure. These voids arise from the hollow extrusions used to construct the deck. The system analyzed in this study consists of the two-voided extrusion shown in Figure 1. These extrusions are fabricated from 6063-T6 aluminum, which has a minimum tensile yield strength of 172.4 MPa (25 ksi) and a minimum ultimate strength of 206.8 MPa (30 ksi). A deck is formed by welding extrusions together at the top and bottom flanges.
3
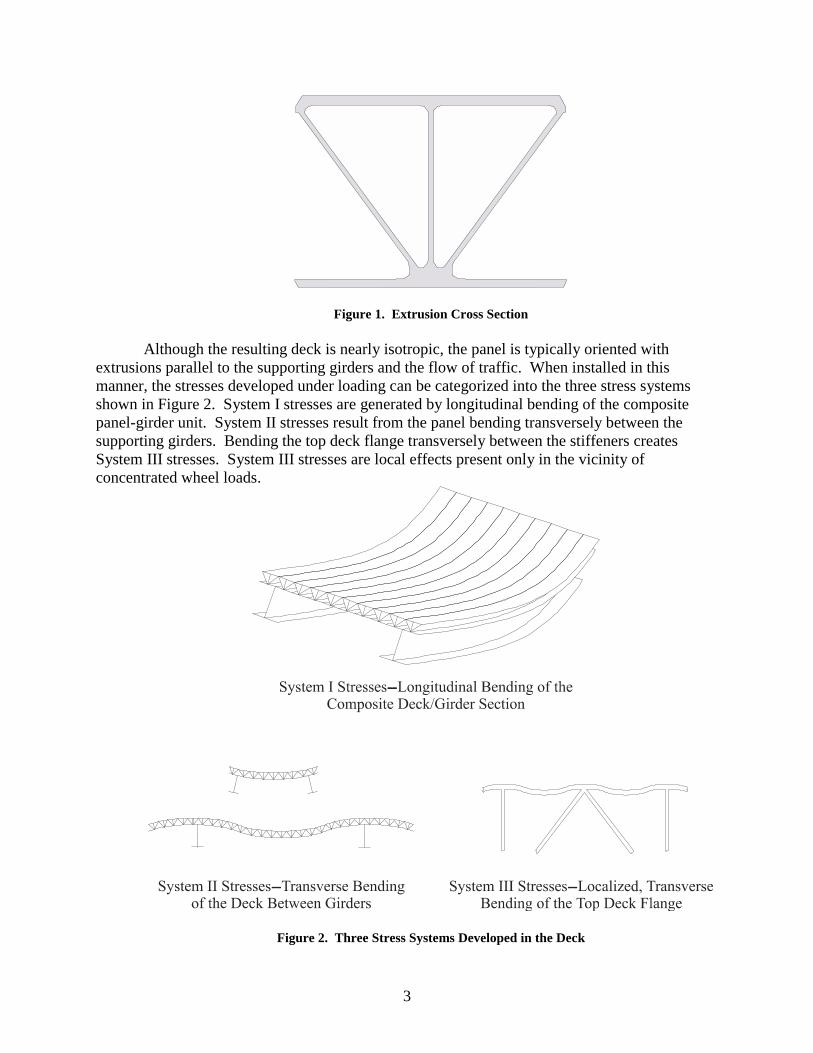
Figure 1. Extrusion Cross Section Although the resulting deck is nearly isotropic, the panel is typically oriented with
extrusions parallel to the supporting girders and the flow of traffic. When installed in this manner, the stresses developed under loading can be categorized into the three stress systems shown in Figure 2. System I stresses are generated by longitudinal bending of the composite panel-girder unit. System II stresses result from the panel bending transversely between the supporting girders. Bending the top deck flange transversely between the stiffeners creates System III stresses. System III stresses are local effects present only in the vicinity of concentrated wheel loads.
Figure 2. Three Stress Systems Developed in the Deck

4
Experimental Evaluation
The ultimate-load tests were conducted on the same deck panel used in the service-load tests. This panel consisted of nine extrusions, each measuring 0.30 m (1ft ) wide and 3.66 m (12 ft) long. These extrusions were welded together at the top and bottom flanges to form a deck section 2.74 m (9 ft) wide and 3.66 m (12 ft) long. An illustration of the system is provided in Figure 3.
Figure 3. Dimensions of the Panel Tested in the Laboratory The same instrumentation plan developed for the service load tests was also used for the
ultimate load tests. Sixteen strain rosette gages were installed at strategic locations on the bottom surface of the panel. A rosette consists of three individual gages oriented at 0, 45 and 90 degrees, and each gage measures a specific uniaxial strain. The rosettes were oriented such that the orthogonal elements were parallel with the panel centerlines. To record the data, each element of the rosette was assigned a channel number in the data acquisition system. These channel numbers are related to the rosette numbers by the mapping scheme given in Figure 4. This figure also shows the location of the rosettes, with dimensions representing the distance to the origin of the rosettes.
Twenty-eight rosette gages were installed on the top surface of the panel. Additional
gages were used on the upper surface due to the presence of the load patch, which was expected to introduce localized (System III stresses) phenomena. The purpose of installing extra gages was to capture this response. Rosettes were numbered consecutively, continuing where the bottom panel stopped. The same mapping scheme was used to assign channel numbers to the elements of the rosettes. Figure 5 illustrates the layout of the gages on the top deck surface.

5
Figure 4. Location of Rosettes on the Bottom Deck Surface
Figure 5. Location of Rosettes on the Top Deck Surface

6
In addition to recording strain data, displacement and rotation data were also obtained. Seven deflection gages were connected to the bottom of the panel to record displacement data. The locations of these gages varied with each test. Four tiltmeters were also mounted on the top deck surface. Combined with the strain rosettes, this instrumentation plan required 144 discrete channels to record the data.
First Ultimate-Load Test
The first ultimate-load test of the panel used the support conditions and loading configuration similar to that expected in the field. The panel was simply supported along the two 3.66 m (12 ft) sides and loaded in the center of the panel. Figure 6 illustrates the experimental setup. The applied load was distributed over a 50.80 cm x 21.59 cm (20 in x 8.5 in) neoprene patch, which was intended to simulate the contact area of dual tires on an AASHTO HS-20 truck. The load was initially applied at a rate of 222.41 N (50 lb) per second with gage readings taken every 4.45 kN (1 kip). Once the magnitude reached the 94.75-kN (21.3-kip) mark, the loading rate was increased to 444.82 N (100 lb) per second, and gage readings were taken approximately every 22.24 kN (5 kips). At a load of 556.03 kN (125 kips), loading was suspended while the load frame was stiffened, and then the testing was resumed. At a load of approximately 831.82 kN (187 kips), deck compliance changed, and the sustainable load dropped to 814.02 kN (183 kips). Testing was temporarily discontinued because a closer inspection revealed that the stiffeners near the load patch had buckled.
Figure 6. Experimental Setup for the First Ultimate-Load Test

7
To determine if the deck possessed additional capacity, loading was continued, and the load was immediately taken back to 800.68 kN (180 kips). From this value, loading increased at a rate of approximately 222.41 N (50 lb) per second, with data recorded every 4.45 kN (1 kip). The deck finally achieved a maximum load of 871.85 kN (196 kips), at which point local yielding occurred and the load patch began to punch through the top deck surface. The complete load history of the panel is given in Figure 7.
Figure 7. Load History of the First Ultimate Load-Test The punching mode of failure was not what would have been expected under vehicle
loads. Due to the reduction of mechanical properties in the heat-affected zone, failure was expected to occur at or near a weld. To further investigate the failure mechanism, a second ultimate-load test was conducted. This second test was similar to the first; however, two load patches were used to apply the load. This allowed the total panel load to increase while simultaneously decreasing the local force in each load patch. Additionally, dual load patches could also be strategically positioned to create large stresses in the welds.
Second Ultimate-Load Test
For the second ultimate-load test, the experimental procedure was similar to that of the first ultimate-load test. Figure 8 shows the configuration of the second test, which developed large stresses perpendicular to the welds. Each hydraulic jack increased the load at a rate of 556.03 N (125 lb) per second. Thus, the total deck load was applied at a rate of 1.11 kN (250 lb) per second. Data was recorded at every 44.48-kN (10-kips) increment of total deck load. A complete load history of the panel for this test is given in Figure 9.

8
Figure 8. Experimental Setup for the Second Ultimate-Load Test
Figure 9. Load History of the Second Ultimate-Load Test
9
In the first ultimate-load test, the load frame experienced visible deformation during the test and had to be reinforced. Although this reinforcement limited deformation, the frame continued to experience some out-of-plane sway. In the second ultimate-load test, the only problem was that several rosettes near the load patch were damaged during the first ultimate-load test, and therefore, no data were obtained from these transducers. As a result, the strain data for the second ultimate-load test was incomplete.
Analytical Evaluation
Models for the two ultimate load tests were developed using the large-scale, general-purpose finite element code ABAQUS. Finite element models developed for the service-load tests could be used for the ultimate-load tests with only slight modifications. The finite element model chosen for the ultimate-load study employed a mesh that discretized the deck surfaces into 5.08-cm (2-in) squares and divided the stiffeners into four rows of elements per stiffener height. Based upon findings from an earlier validation process, models using the 2 x 2 mesh should yield more accurate results, and the finer discretization should also capture the steeper gradients generated in these simulations.
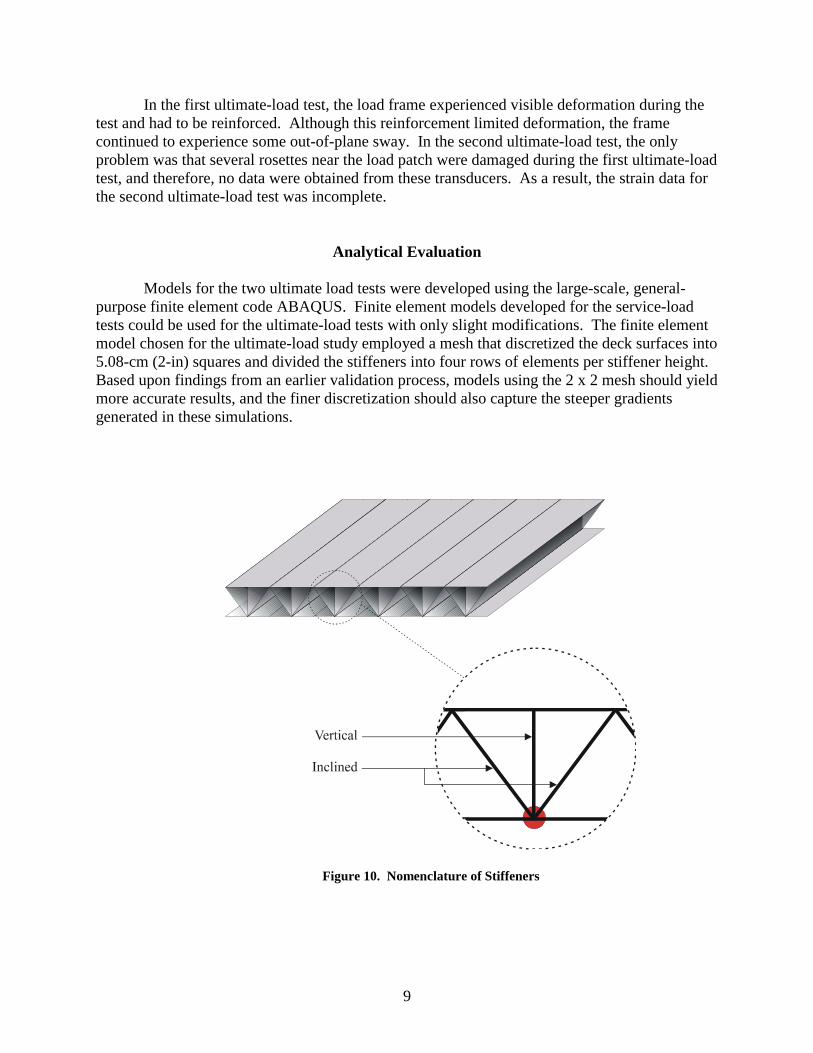
Figure 10. Nomenclature of Stiffeners

10
Figure 11. Nomenclature of Top and Bottom Deck Surfaces To facilitate discussion, the following terminology is used to identify structural members
and directions on the panel. The web stiffeners are classified by their orientation. The stiffeners with no incline are called vertical stiffeners, whereas the inclined stiffeners are identified as simply inclined stiffeners. Figure 10 illustrates this notation. Another identification scheme is used to identify the top and bottom plates that bound the stiffeners. The top member is referred to as the top deck surface or the top chord, and the bottom member is called the bottom deck surface or the bottom chord. These designations arise from the truss-style design of each extrusion. Figure 11 depicts the various members and their locations.
Directions on the panel are specified with respect to two mutually perpendicular axes
where the origin coincides with the geometric center of the panel. Regardless of the support conditions, the direction parallel to the extrusions is called the longitudinal direction and the direction perpendicular to the extrusions is referred to as the transverse direction. This convention system arises from the orientation of the panel in an actual bridge. The illustration in Figure 12 clarifies this directional system.
Figure 12. Direction Nomenclature

11
First Ultimate-Load Test Model
The loading configuration and boundary conditions of the first ultimate-load test were the same as those used in load case 7 of the service-load tests (Dobmeier et al., 1999). Therefore, the mesh and shell elements used in the service load simulation are still applicable. A sketch of the model is shown in Figure 13. Because the stresses developed during this simulation will easily exceed the yield stress of aluminum, the constitutive theory had to be modified to account for inelastic behavior.
Figure 13. Model Used to Simulate the First Ultimate-Load Test
To accurately simulate this more complex response, the model used a combination of
elastic and plastic properties. Response is assumed linearly elastic up to the user specified yield stress and is again defined by the nominal values of Young’s modulus of 68.95 GPa (10,000 ksi) and a Poisson’s ratio of 0.3. Beyond the yield stress, behavior is characterized by classical metal plasticity with isotropic hardening. To implement this response in the computer model, the user is required to simply input appropriate stress-strain data that define the constitutive relationship.
The stress-strain data points used to define this plastic response were obtained from a
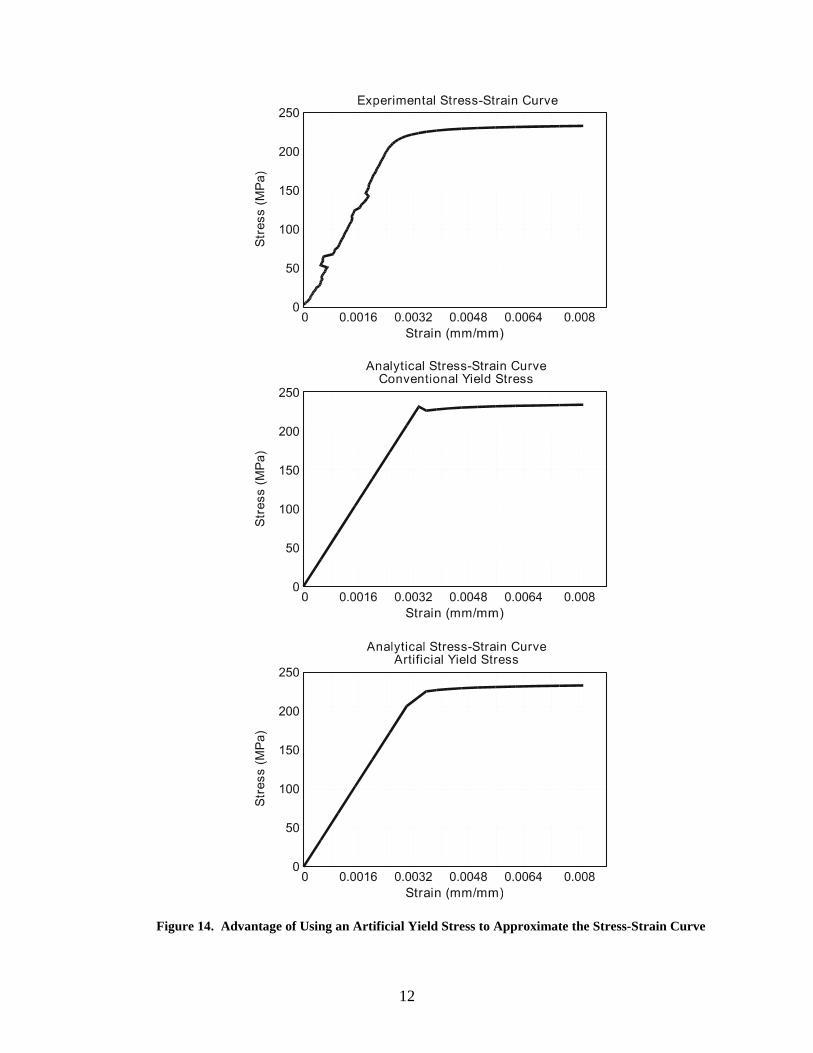
uniaxial tension test conducted by Reynolds. The constitutive relationship for the model assumed a yield stress of 206.84 Mpa (30 ksi). Beyond this point, fifty-nine data pairs of stress and strain were used to define material behavior. The last pair that was inputted corresponded to the maximum engineering stress, beyond which ABAQUS assumed prefect plasticity. The experimental data, together with the analytical stress-strain curve, are shown in Figure 14.
12
Figure 14. Advantage of Using an Artificial Yield Stress to Approximate the Stress-Strain Curve
13
Second Ultimate-Load Test Model
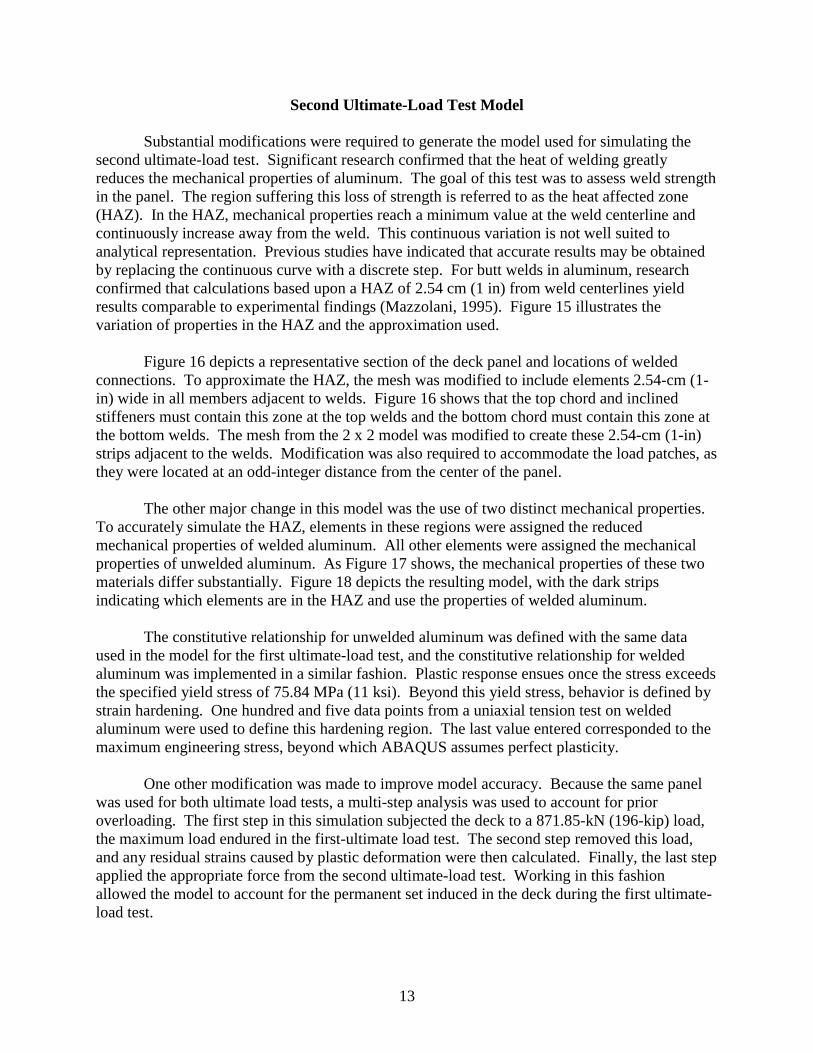
Substantial modifications were required to generate the model used for simulating the second ultimate-load test. Significant research confirmed that the heat of welding greatly reduces the mechanical properties of aluminum. The goal of this test was to assess weld strength in the panel. The region suffering this loss of strength is referred to as the heat affected zone (HAZ). In the HAZ, mechanical properties reach a minimum value at the weld centerline and continuously increase away from the weld. This continuous variation is not well suited to analytical representation. Previous studies have indicated that accurate results may be obtained by replacing the continuous curve with a discrete step. For butt welds in aluminum, research confirmed that calculations based upon a HAZ of 2.54 cm (1 in) from weld centerlines yield results comparable to experimental findings (Mazzolani, 1995). Figure 15 illustrates the variation of properties in the HAZ and the approximation used.
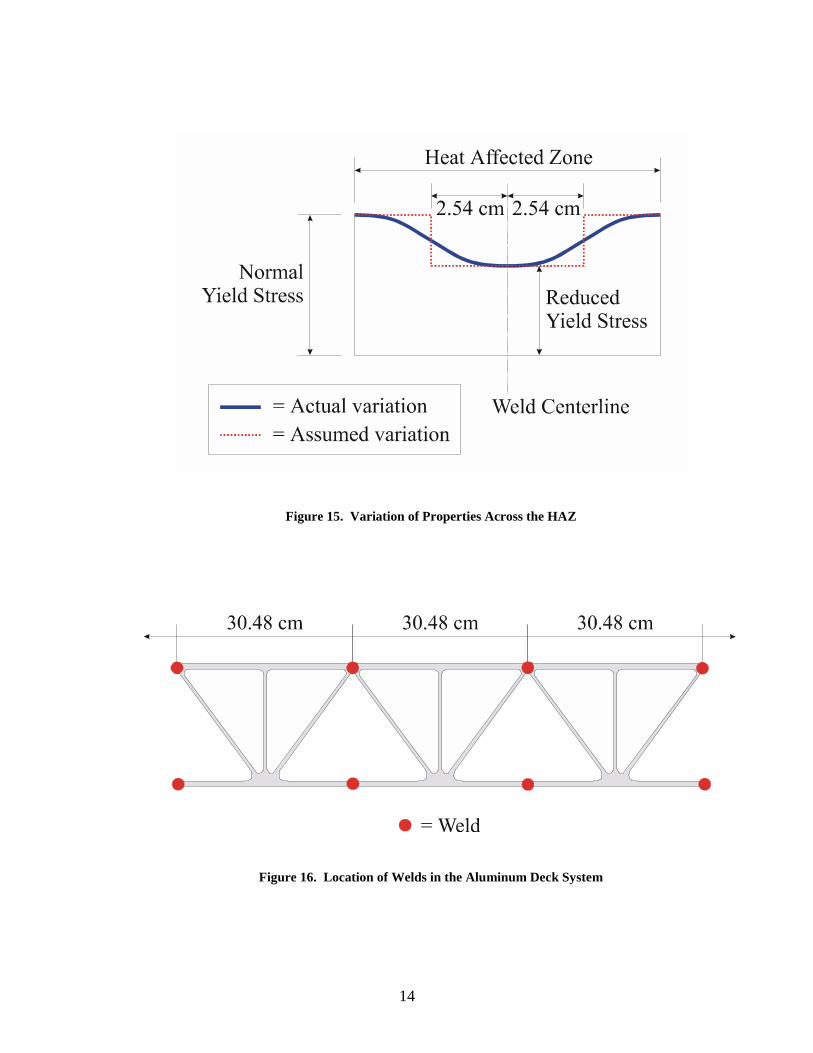
Figure 16 depicts a representative section of the deck panel and locations of welded
connections. To approximate the HAZ, the mesh was modified to include elements 2.54-cm (1-in) wide in all members adjacent to welds. Figure 16 shows that the top chord and inclined stiffeners must contain this zone at the top welds and the bottom chord must contain this zone at the bottom welds. The mesh from the 2 x 2 model was modified to create these 2.54-cm (1-in) strips adjacent to the welds. Modification was also required to accommodate the load patches, as they were located at an odd-integer distance from the center of the panel.
The other major change in this model was the use of two distinct mechanical properties.
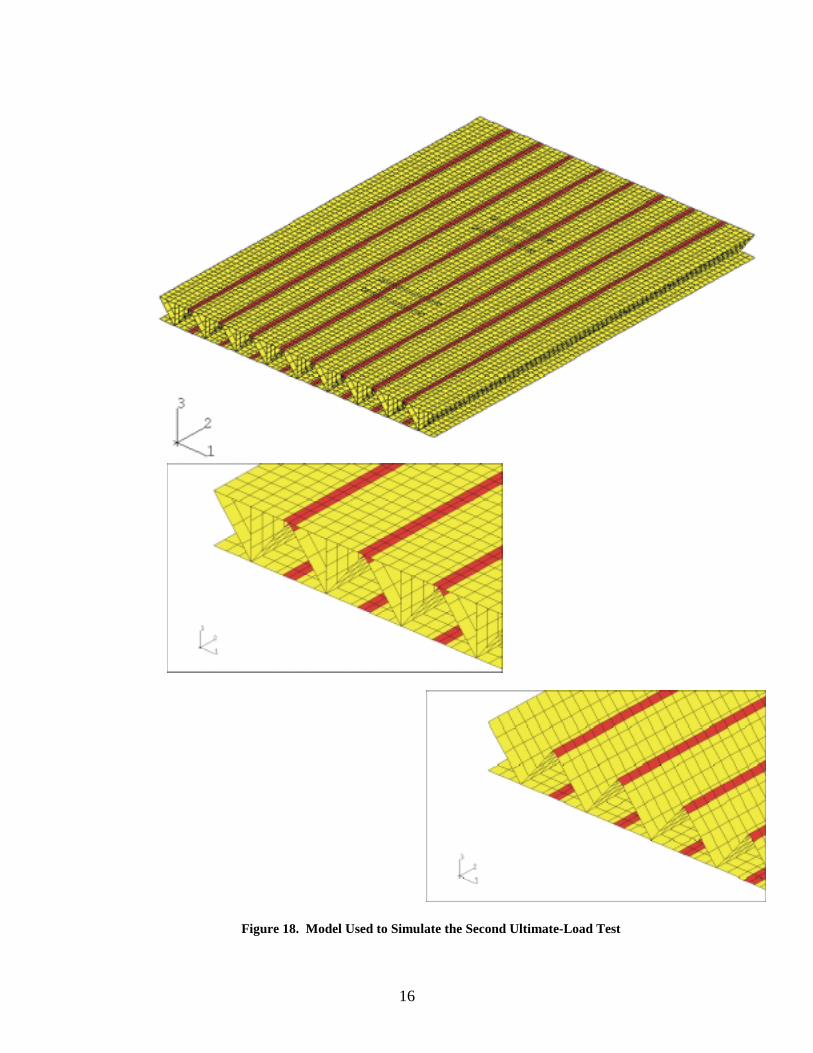
To accurately simulate the HAZ, elements in these regions were assigned the reduced mechanical properties of welded aluminum. All other elements were assigned the mechanical properties of unwelded aluminum. As Figure 17 shows, the mechanical properties of these two materials differ substantially. Figure 18 depicts the resulting model, with the dark strips indicating which elements are in the HAZ and use the properties of welded aluminum.
The constitutive relationship for unwelded aluminum was defined with the same data
used in the model for the first ultimate-load test, and the constitutive relationship for welded aluminum was implemented in a similar fashion. Plastic response ensues once the stress exceeds the specified yield stress of 75.84 MPa (11 ksi). Beyond this yield stress, behavior is defined by strain hardening. One hundred and five data points from a uniaxial tension test on welded aluminum were used to define this hardening region. The last value entered corresponded to the maximum engineering stress, beyond which ABAQUS assumes perfect plasticity.
One other modification was made to improve model accuracy. Because the same panel
was used for both ultimate load tests, a multi-step analysis was used to account for prior overloading. The first step in this simulation subjected the deck to a 871.85-kN (196-kip) load, the maximum load endured in the first-ultimate load test. The second step removed this load, and any residual strains caused by plastic deformation were then calculated. Finally, the last step applied the appropriate force from the second ultimate-load test. Working in this fashion allowed the model to account for the permanent set induced in the deck during the first ultimate-load test.
14
Figure 15. Variation of Properties Across the HAZ
Figure 16. Location of Welds in the Aluminum Deck System

15
Figure 17. Differences in Mechanical Properties of Welded and Unwelded Aluminum
Failure Theory
For both ultimate load tests, a criterion defining failure had to be established in order to
simulate panel failure in the analytical models. This, in turn, required a theory capable of characterizing the complex three-dimensional state of stress experienced by the panel. Based on the material properties of aluminum, the von Mises criterion was chosen as the failure theory. This theory has considerable experimental support for problems involving ductile materials and plane stress states (Ugural and Fenster, 1981), both of which are characteristics of the models used in this study. Past work on aluminum structures has also employed the von Mises criterion successfully (Mazzolani, 1995). Coupled with ABAQUS' ability to output the von Mises stress, this theory is well suited for the models used in this project.
Von Mises theory states that failure occurs when the von Mises stress exceeds the yield
stress obtained from a uniaxial tension test or when the ratio of the von Mises stress to the yield stress exceeds 1.0. For ductile materials, the initiation of failure usually coincides with the onset of plastic deformation. The yield stress used to define failure in these models was derived from the test data supplied by Reynolds. Using the 0.2 percent offset method, a yield stress of 230.97 MPa (33.50 ksi) was computed.
The Von Mises theory was also used in the second ultimate load test. Although weld
failure is typically associated with brittle fracture, the von Mises theory is still commonly accepted as a failure criterion for butt welds (Mazzolani, 1995). Since this model used two specific material properties, two different yield stresses were required to define the failure points. For elements in the HAZ, failure occurs when the von Mises stress exceeds 87.56 MPa (12.70 ksi). This yield stress was computed by applying the 0.2 percent offset method to data from the test of a welded aluminum coupon. For elements outside of the HAZ, the previously computed yield stress of 230.97 MPa (33.50 ksi) was used.
16
Figure 18. Model Used to Simulate the Second Ultimate-Load Test

17
RESULTS AND DISCUSSION
First Ultimate-Load Test
Simulation
Accuracy of the finite element models was verified by comparing analytical data to experimental data. Analytical strains on both the top and bottom deck surfaces were compared to the corresponding experimental values. Deflection data were also compared at six discrete locations. These comparisons showed that the model was performing satisfactorily.
After validating the models, the graphical post-processor was used to identify the onset
and progression of failure by analyzing the von Mises stress throughout the model. Specific element sets were analyzed one at a time to ensure that the maximum values were successfully located. This graphical evaluation showed that only elements on the top deck surface in the vicinity of the load patch were experiencing von Mises stresses greater than the yield stress. With this knowledge, when analyzing the panel, one could concentrate on a small region of the top surface. Examination of the output files indicated that a rectangular region centered on the load patch would provide the data necessary to analyze panel failure. This rectangle is illustrated in Figure 19.
Figure 19. Region of the Panel Analyzed in the First Ultimate-Load Test
18
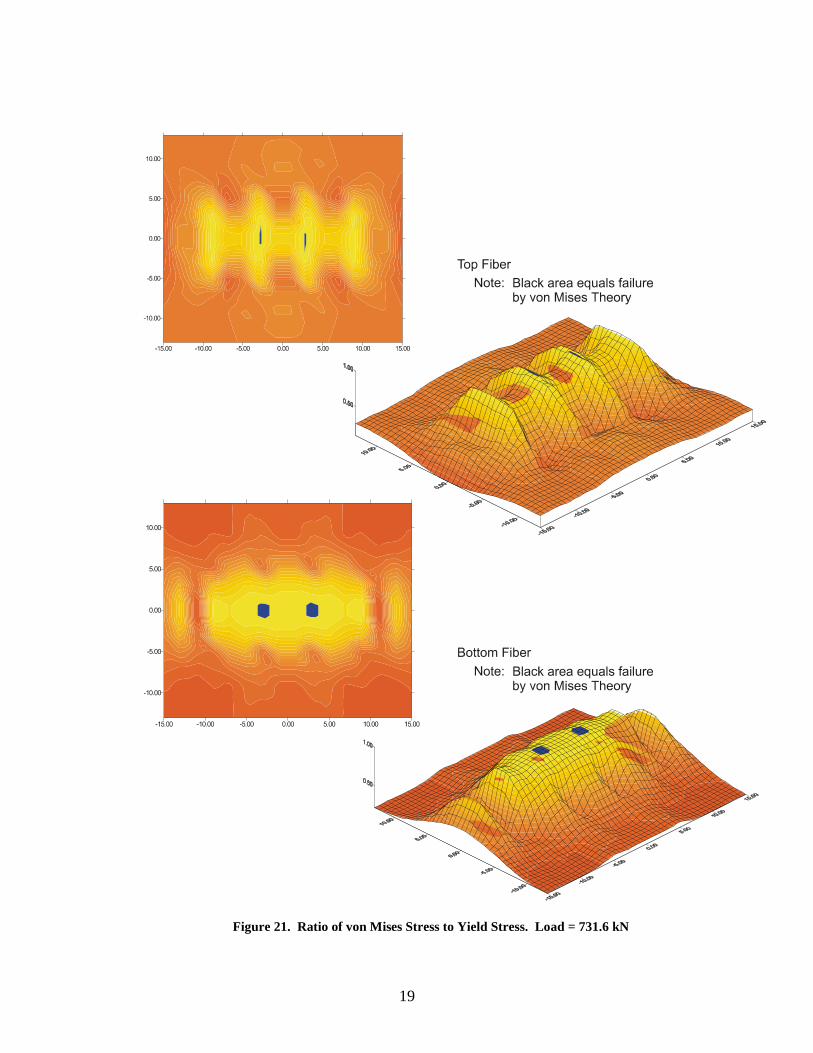
The von Mises failure theory was employed to visually analyze the failure of the panel. Von Mises stress values were obtained from all elements in the 81.28-cm x 71.12-cm (32-in x 28-in) rectangle and divided by the yield stress. The resulting ratio was graphed with contour plots and surface plots. Areas where the value exceeds 1.0 correspond to predicted element failure.
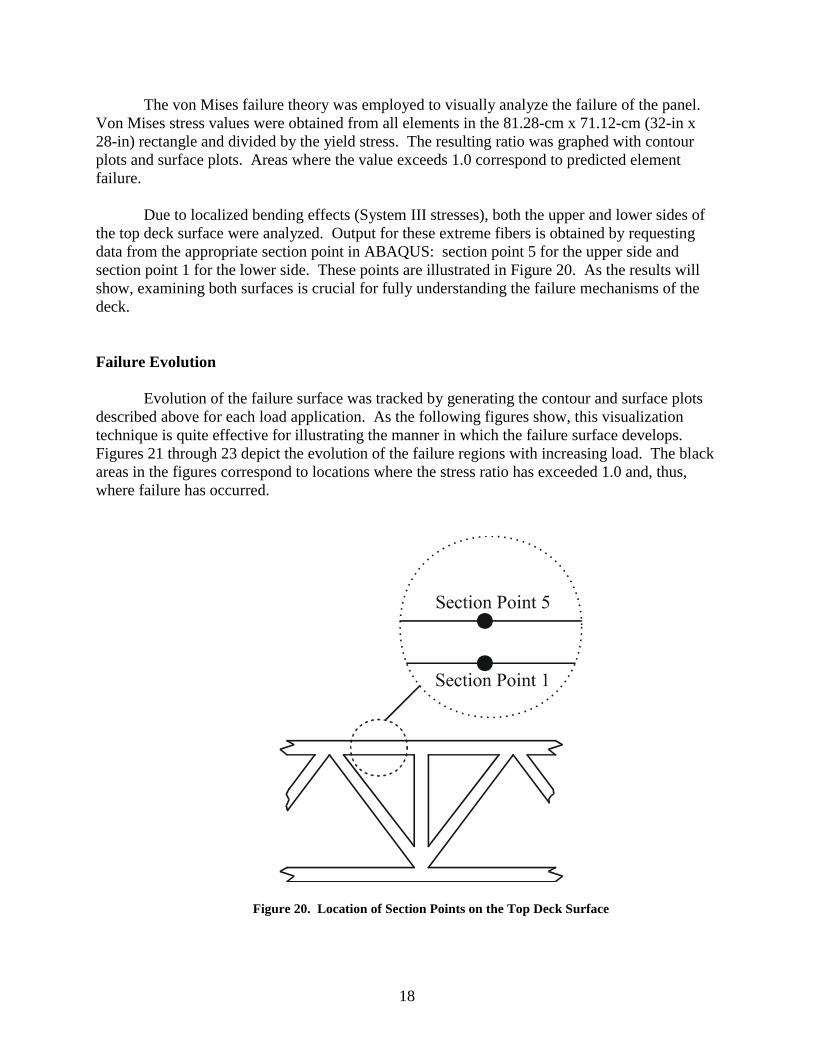
Due to localized bending effects (System III stresses), both the upper and lower sides of
the top deck surface were analyzed. Output for these extreme fibers is obtained by requesting data from the appropriate section point in ABAQUS: section point 5 for the upper side and section point 1 for the lower side. These points are illustrated in Figure 20. As the results will show, examining both surfaces is crucial for fully understanding the failure mechanisms of the deck.
Failure Evolution
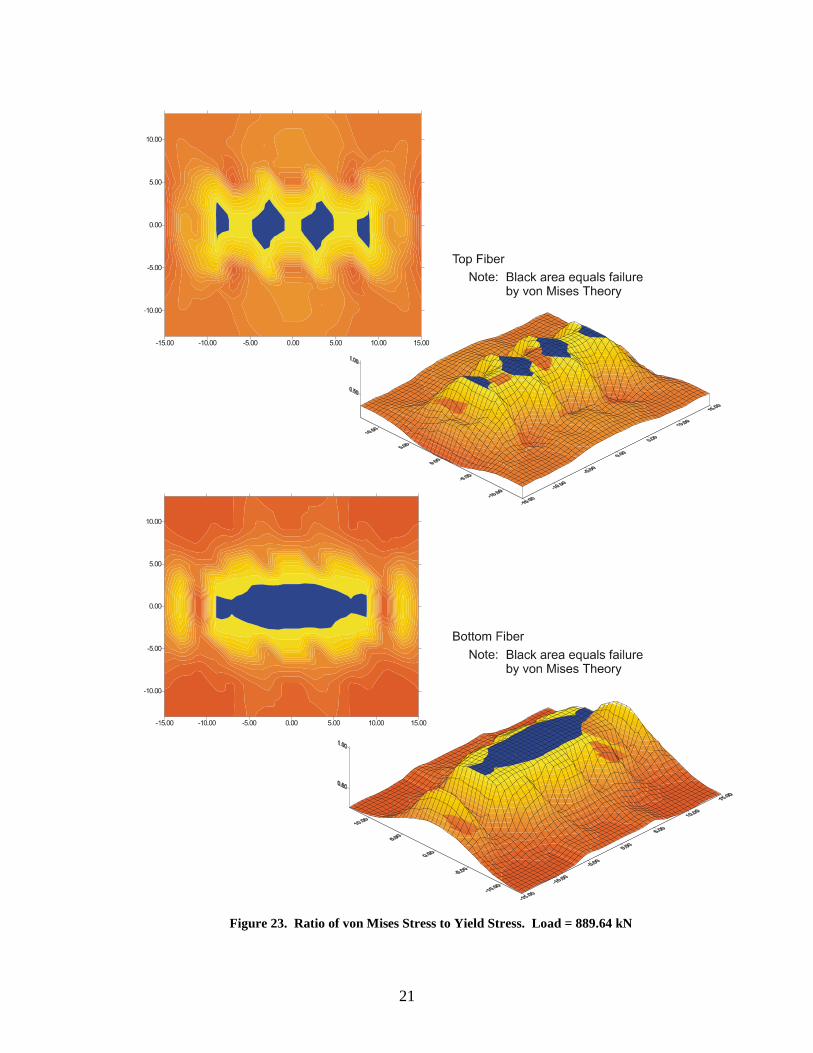
Evolution of the failure surface was tracked by generating the contour and surface plots described above for each load application. As the following figures show, this visualization technique is quite effective for illustrating the manner in which the failure surface develops. Figures 21 through 23 depict the evolution of the failure regions with increasing load. The black areas in the figures correspond to locations where the stress ratio has exceeded 1.0 and, thus, where failure has occurred.
Figure 20. Location of Section Points on the Top Deck Surface
19
Figure 21. Ratio of von Mises Stress to Yield Stress. Load = 731.6 kN

20
Figure 22. Ratio of von Mises Stress to Yield Stress. Load = 822.34 kN
21
Figure 23. Ratio of von Mises Stress to Yield Stress. Load = 889.64 kN

22
Based upon the sizes of the failure regions, predictions on failure load were made. At a load of 889.64 kN (200 kips), 20 of the 40 elements in the load patch were failing on the top fiber. Simultaneously, 28 of the 40 elements were failing on the bottom fiber. At a load of 911.89 kN (205 kips), 28 of the 40 elements were failing at both extreme fibers. Based on this behavior, the panel was considered to have failed by yielding under the load patch at a load of 911.89 kN (205 kips).
Second Ultimate-Load Test Simulation Process
In the second ultimate load test, the panel was loaded incrementally until failure occurred
in the same manner as in the first ultimate-load test. As the load history in Figure 9 illustrates, the deck successfully supported a total load of 1512.40 kN (340 kips). The stiffeners began to distort at 622.75 kN (140 kips) of total deck load. At 1512.40 kN (340 kips), a “pop” was heard as a weld on the bottom surface began to fracture. The total deck load immediately dropped to 1387.85 kN (312 kips). Although the deck was damaged, it still possessed substantial capacity. Loading of the structure continued from the 1387.85-kN (312 kip) plateau. At 1441.22 kN (324 kips) of total deck load, another loud “pop” was heard as a bottom weld fractured completely, resulting in total deck failure.
To predict failure with the finite element models, loads were applied in steps
corresponding to the load increments employed in the experimental test. At each stage of the loading, strains and displacements predicted by the model were compared with experimental data to further validate the model reliability. The graphical post-processor was then used to analyze the von Mises stresses in the deck. Element sets were analyzed one at a time in order to successfully locate the extreme values in each component. This graphical evaluation showed that von Mises stresses in the various stiffeners were well below the failure point. Based upon this finding, a detailed analysis of output data focused only on the top and bottom deck surfaces.
The failure analysis was again performed by plotting the ratio of von Mises stress to the
appropriate yield stress. Plots were generated for both the top and bottom deck surfaces. Data from elements on the bottom deck surface were obtained from the bottom section points, whereas values on the top deck surface were acquired at the top section points. These section points correspond to the extreme fibers and should be capable of characterizing the failure mode. Although failure was expected to occur at a weld on the bottom deck surface, data were monitored on the top deck surface to ensure that the previously encountered localized failure mechanisms did not occur.

23
Failure Evolution
The general characteristics of panel response during lower loads are illustrated by the plots in Figure 24 that correspond to a load of 757.64 kN (170 kips). Again, black areas correspond to regions where failure is occurring. One interesting feature of these plots is the series of parallel ridges running in the longitudinal direction. These eight ridges, present in graphs of both the top and bottom deck surfaces, correspond in location to the eight welds in the deck panel. The factors creating these ridges will be explained in the next section. The graph for the top deck surface contains two small failure zones in the center of the panel, which occur in elements in the HAZ.
Figure 24. Ratio of von Mises Stress to Yield Stress. Load = 757.64 kN
24
Failure of these two small zones is caused by the stresses developed during the first ultimate-load test. The 872.07-kN (196-kip) load applied to the deck during this test creates extremely high stresses in elements under the load patch using weld-affected properties. Even after the load is removed, the residual value of the von Mises stress still exceeds the failure stress. Examination of the von Mises data from the second step of the analysis verifies this. Thus, before any loads are even applied from the second ultimate-load test, two small failure zones already exist.
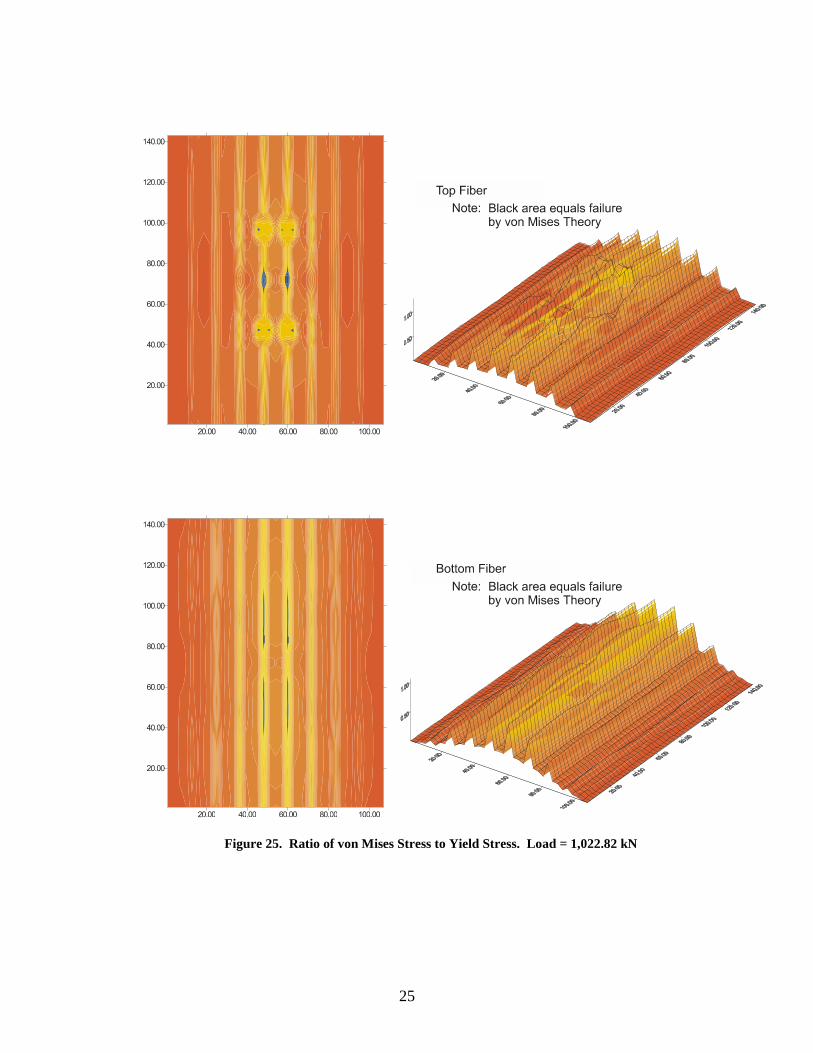
Failure zones created by loads applied during the second ultimate-load test initially occur
on the bottom deck surface at a total deck load of 1022.82 kN (229.94 kips). As Figure 25 shows, four tiny failure zones developed on the bottom deck surface. These four failure regions develop in the HAZ at points located below the load patches. The plots of the top deck surface are essentially the same as the residual values that are still causing zones of failure.
Further increase in load caused the four failure zones on the bottom deck surface to grow
in the longitudinal direction. Additionally, new regions of failure were created on the top deck surface. These new failure zones are directly under the load patches and occur in elements unaffected by the welding process.
The four individual failure zones on the bottom surface connect when the deck is
subjected to a total load of 1198.31 kN (269.39 kips). As depicted in Figure 26, the two resulting strips are approximately 2.13 m (84 in) in length. This length implies that nearly 60 percent of the two welds are failing. On the top deck surface, additional stresses have caused the failure zones between the load patches to grow in the longitudinal direction. The widths of the failure areas under the load patches have also increased in the transverse direction because local bending stresses continue to rise.
Under a total deck load of 1373.17 kN (308.70 kips), failure zones on the bottom deck
surface have reached critical levels. As depicted in Figure 27, the two failure strips now extend the entire length of the deck. A closer examination of model output shows that all of the elements on both sides of the weld centerlines have failed. This response indicates total weld failure and failure of the deck structure. To ensure that this was the first mode of failure produced, top data were checked as well. Although the longitudinal failure zones elongated, a critical state still was not attained. Locally driven failure zones also increased in size; however, they did not correspond to the sizes of the load patches. Thus, the deck failed by fracture of the bottom two welds.
Discussion of the Failure Process
The manner in which failure regions develop in the panel may be better understood by considering the distribution and continuity of strain and stress throughout the panel. For example, strains are continuous, whereas stresses are not. Strain continuity results from the geometry of deformation and the kinematic relationships that are employed to compute strain. Strain continuity is also independent of material properties. Stress, on the other hand, is directly related to material properties, specifically the modulus of elasticity. On the top and bottom deck surfaces, the presence of welds results in regions with different material properties, resulting in
25
Figure 25. Ratio of von Mises Stress to Yield Stress. Load = 1,022.82 kN

26
Figure 26. Ratio of von Mises Stress to Yield Stress. Load = 1,198.31 kN

27
Figure 27. Ratio of von Mises Stress to Yield Stress. Load = 1,373.17 kN

28
stress discontinuities across the material interface. For strain values beyond the proportional limit of welded aluminum, the corresponding stresses developed in unwelded aluminum are greater than the corresponding stresses developed in welded aluminum. However, the yield stress of the welded aluminum is much lower. Thus, for strain values greater than the yield strain of the welded material, welded aluminum will yield, whereas unwelded aluminum remains elastic. Thus, although an unwelded element may develop a larger stress than the welded element, because of lower yield stress, the von Mises stress in the welded element is higher and is thus closer to failure.
Plotting the ratio of von Mises stress to yield stress is an efficient way to illustrate this
concept. At the welds, the von Mises stress is lower in magnitude, yet it is very close to the yield stress of welded aluminum. Away from the welds, the von Mises stress has a larger magnitude; however, it represents a smaller portion of unwelded aluminum’s yield stress. This accounts for the eight ridges present in the surface plots shown in Figure 24.
Failure zones should first develop in welded regions with the highest stresses. Barring
any localized effects, both transverse and longitudinal stresses increase toward the center of the panel. Thus, welds closest to the center of the panel should begin to fail first.
As previous plots have indicated, failure regions created by loads applied during the
second ultimate-load test first appeared in the two welds on the bottom deck surface adjacent to the transverse centerline. Both welds are equidistant from the transverse centerline and develop symmetric failure zones as expected. Unexpectedly, however, it was observed that failure initiated at regions away from the longitudinal centerline. There was no evidence of failure in the two welds on the top deck surface.
The absence of failure on the top deck surface is the result of localized stresses produced
by the two load patches. However, when failure zones eventually develop on the top deck surface from loads applied during the second ultimate-load test, they develop as expected. Both welds adjacent to the transverse centerline begin to fail from the longitudinal center outward.
Localized effects also explain the discrepancy on the bottom deck surface. In the absence
of local effects, weld failure in the bottom two welds should have emanated from the longitudinal center of the welds. As the results indicate, failure regions first appeared away from the center of the welds. Closer examination demonstrates that these zones are located at the same distance from the center of the panel because the load patches suffer from localized effects.
Behavior of the finite element model corresponded to mechanisms witnessed in the
laboratory. The initial fracture in the laboratory test occurred in a weld adjacent to the transverse centerline of the panel on the bottom deck surface. Additional loading eventually caused the entire weld to “unzip” in the longitudinal direction. Although both welds adjacent to the panel centerline were damaged, only one completely failed. This failure occurred at a total deck load of 1441.22 kN (324 kips). The photograph in Figure 28 shows the fractured weld.

29
Figure 28. Weld Fracture in the Laboratory Test Failure regions in the analytical model develop in exactly the same manner. Failure is
first witnessed in welds adjacent to the transverse centerline of the panel on the bottom deck surface. Application of higher loads causes these regions to grow in the longitudinal direction. Eventually, the entire weld unzips and the panel fails. Due to the symmetry of the model, both welds adjacent to the centerline failed in the same fashion. Complete failure occurred at a total deck load of 1370.05 kN (308 kips). This corresponds to 95.3 percent of the load required to fail the panel in the experimental test.
CONCLUSIONS
♦ Finite element models that were developed were able to reliably predict deck panel
behavior and were surprisingly capable of simulating the failure process. The models were also able to predict the ultimate failure loads with great accuracy.
♦ Specifying the constitutive relationship of a material using actual experimental data is a
valid method for defining the response. Even with the use of an artificial yield stress, the model yielded good results.
♦ Results from this study indicated that the von Mises failure theory was an accurate failure criterion for use with the aluminum deck. Results confirm its validity for use with ductile materials in a state of plane stress.

30
♦ Approximating the HAZ with one-inch wide zones adjacent to weld centerlines was an accurate way to account for the weaker mechanical properties of welded aluminum. This material discontinuity did not create any numerical problems in the analytical simulation.
♦ The stress state under the load patch is significantly influenced by localized bending.
This influence is so strong that evolution of the failure regions is ultimately determined by these local effects.
♦ Plotting the ratio of von Mises stress to yield stress is an effective means for visualizing
the evolution of the failure surface and for tracking failure regions. Not only does this process provide the designer with a better knowledge for what is happening, but additionally, the data presented are considerably more relevant than merely examining raw stress data.
♦ Growth of the failure zones was successfully simulated with these models. Weld failure
was initiated in the middle portion of the welds and grew longitudinally as the load was increased. This unzipping of the welds agrees with the failure mode observed in the laboratory.
♦ The welds are potential weak points in the aluminum bridge deck. Strength in the HAZ is significantly reduced by the heat of welding, and fracture may occur if the deck is overloaded in certain configurations.
♦ Results from this study clearly demonstrate that aluminum bridge decks are a feasible
alternative to reinforced concrete decks from the standpoint of strength and serviceability.
REFERENCES
Dobmeier, J.M., Barton, F.W., Gomez, J.P., Massarelli, P.J., and McKeel, W.T., Jr. (1999).
Analytical and Experimental Evaluation of an Aluminum Bridge Deck Panel Part I: Service Load Performance (VTRC Report No. 99-R22). Charlottesville, VA: Virginia Transportation Research Council.
Hibbitt, Karlsson, and Sorensen, Inc. (1996). ABAQUS/Standard User’s Manual; Version 5.6
(Vol. I-III). Rhode Island. Hibbitt, Karlsson, and Sorensen, Inc. Mazzolani, F.M. (1995). Aluminium Alloy Structures (2nd ed.). London: E & FN Spon. New Aluminum Decks Cut Loads, Add Life. (1996). ASCE Civil Engineering, 66, No. 8, p. 12. Ugural, A.C. and Fenster, S.K. (1981). Advanced Strength and Applied Elasticity: The SI
Version. New York: Elsevier.