final report
DESCRIPTION
Texoma Grown Final ReportTRANSCRIPT

University of Dallas Capstone
2011
Texoma GrownProject for the Texoma Council of Governments on local agricultural businesses in North Texas organized under the name Texoma Grown.
AuthorsLisa Reed
Patrick WrightBridgette PorterMatt StenslandSandra Sinatora
John EckerleStacy Spann
Advisor: Dr. Sandra Blanke

Table of Contents
Section PageExecutive Summary 3
Purpose 4
Planning & Process 5
Survey 9 Scope Methodology Validation Communication Process
Survey Results 12
Analysis 31
Recommendations 34
Challenges 38
Concluding Summary 40
Resources 41
Acknowledgements 43
UD Student Biographies 44
Appendix Directory 46
Texoma Grown Directory A
Statement of Work B
Agricultural Research C
Research on Local Growers Associations D
Survey Dialogue E
Survey F
Data Spreadsheets G
Presentation H
2 | P a g e

Business Database I
Texoma Grown Member Logos J
Executive Summary
The Texoma Council of Governments (TCOG) through Katy Cummins, Community Development
Planner, requested that the University of Dallas (UD) create a marketing Capstone project on
behalf of Lisbeth Echeandia, representative for local farmers and food producers organized
under the name Texoma Grown. Initially, the project entailed Capstone students researching
the local agricultural market in the areas serviced by TCOG: Cooke, Grayson, and Fannin
counties.1
Using this information, the Capstone students researched survey design and validation methods
that would be most appropriate to survey this group of businesses. They determined the most
effective survey type, scope, methodology, and means for communication. The members of the
Texoma Grown directory were then asked to participate in this student-developed survey
designed to gain information about the local agricultural producers on a variety of issues
involving business development, marketing efforts, branding, and Texoma Grown
representation in the community.
The Capstone students analyzed the data and provided a number of conclusions based on the
results from the survey questions. The recommendations for actions and changes will provide
several points to help Texoma Grown develop as a more formal organization to potentially
become more effective in the way it promotes itself and to provide assistance to the businesses
represented by the group. There are a number of potential future projects that could further
address branding and other marketing efforts needed to promote the local region's agricultural
businesses once the initial challenges highlighted by these survey results have been addressed.
1 http://www.texoma.cog.tx.us/
3 | P a g e

Purpose
This project was intended to help Texoma Grown learn more about the businesses they
represent in order to develop ways they could provide assistance in the branding and
promotion of local food producers and growers in the area. The project directive was to design
a survey, analyze the results, and provide recommendations to the Texoma Council of
Governments and Texoma Grown.
The first part of the project was to develop a solid survey design to capture the opinions and
demographic information of the 40 businesses listed in the Texoma Grown Directory.2 Once
survey administration was complete, the data was to be reviewed and analyzed with the hope
that it would construct a story about who the growers really are and what they need to
potentially gain market share and grow their existing businesses. The results from this sampling
of growers/producers will provide information to Texoma Grown about its members: what
products they sell and to whom, how they market their businesses, and their general
perception of Texoma Grown as an organization.
The final step in this project was to provide recommendations from the analysis of the
participant data on ways that Texoma Grown or TCOG could help leverage resources to
promote these local businesses. These recommendations should help facilitate a better
understanding of the working of the businesses and ways that Texoma Grown can provide
better assistance to those they represent.3
22 http://www.texomacore.org/Texoma-Grown-Directory.html (See Appendix A)
3
4 | P a g e

Planning & Process
Outlining the required deliverables and the work necessary to complete them allowed the team
to create a project plan to help with getting and staying organized, thus focusing on developing
a quality deliverable for the client. The group used a conference line to hold weekly meetings to
organize and distribute the work fairly, following an agenda to make sure all relevant items
were addressed. The calls efficiently covered all relevant current issues and averaged one hour
per week, followed up with minutes. The team met bi-monthly with advisor, Dr. Sandra Blanke,
who utilized Microsoft Office® Live Meeting to provide guidance and assistance on any issues
that arose. As a result, the planning process, which is detailed below, became the most
important part of the project as it provided the road map from start to finish.
Step One
Given the demographics of the team (DFW area, Michigan, Utah, Georgia), all team meetings
were conducted through conference calls to accommodate group members located outside of
the Dallas-Fort Worth area. After looking at the different work elements needed, the group
took into consideration the fact that each step needed a task owner, start dates, and due dates.
The team then further examined the different deliverables to break them into the smaller tasks
required to move the project forward to the end result of creating a number of solid
recommendations. To get better organized, the group took all the pieces of the project and
detailed them in a Microsoft Excel® work plan. Every member of the team possessed different
expertise and contributions to each deliverable were tailored to build upon each individual’s
background and knowledge.
Step Two
In order for the planning of the project to be successful, the group met with Katy Cummins, the
Texoma Council of Governments Community Development Planner, to clarify her expectations
and to provide us the opportunity to ask questions. After gaining insight into this region, the
directive was to create a survey to learn more about the businesses that Texoma Grown
represents. We were to analyze the data and provide recommendations to help the
5 | P a g e

growers/producers market themselves more effectively, including the possibility of creating a
Texoma Grown brand.
Step Three
After the meeting with Ms. Cummins, the team put together a Statement of Work (SOW) 4 to
serve as a written contract between Ms. Cummins, representing the Texoma Council of
Governments, and the Capstone project group. The SOW contained a detailed introduction,
project description, communication strategy, required deliverables, client responsibility, and
project work plan. This agreement ensured that both Ms. Cummins and the Capstone group
were pursuing the same goals. This document was signed by Ms. Cummins and each of the
Capstone team members.
Step Four
Once the SOW was put into place, extensive research was conducted by the team members.
The goal was to learn more about the Texoma agricultural region5 in particular and local
growers associations in general6 in order to formulate appropriate survey questions. The team
also embarked on researching several survey techniques that helped address how questions
should be worded and how the survey could be validated. This was important to ensure
successful and beneficial responses. Demographics, considerations for the individual
businesses, and the industry of interest as a whole were all taken into consideration during this
process. The team discovered that open-ended questions were as important as basic multiple
choice questions and that they were perhaps more informative.
Step Five
The team began brainstorming about different types of questions that would be required. We
found that in order to obtain as much information as possible, we had to ask several questions
regarding demographics, business operations, and current promotional efforts. During this
time, the team was able to determine how they wanted to administer this local market survey. 4 Statement of Work (See Appendix B)5 Agricultural Research (See Appendix C)6 Research on Local Growers Associations (See Appendix D)
6 | P a g e

It was agreed that the initial contact with the businesses would be by phone (when possible)
using an established survey dialogue7 and that the survey would be offered by phone (either at
that time or during a later appointment) or through the internet at their convenience. Once a
draft of the questions was created, we followed up with Ms. Cummins to make sure that
nothing was left out. The survey was validated by administering it to the Capstone students’
friends, families, and colleagues in order to ensure that the questions could be easily
understood and answered. The finalized questions were loaded into the survey application tool
called Survey Monkey. ®8
Step Six
In order to get a high response rate, we divided up the 41 businesses listed on the Texoma
Grown Directory between the team members and reached out to them. Each team member
researched their group of businesses to find effective ways through phone calls and/or emails
to publicize the survey and to gather responses. The team took two weeks to get as many
members to participate as possible.
Step Seven
After the deadline to gather responses passed, the team downloaded the data from Survey
Monkey and began working on the analysis.9 We looked at the survey participation rate in
anticipation that it would be over 30%, which it was. Then, the team reviewed each question's
responses in detail to begin working toward developing a bigger picture of businesses in the
area. Charts were created to visually display the data.10
Step Eight
After organizing the data, the team looked at each question and began providing the analytics
to determine the types of businesses represented in the sample data, their capacity to grow,
their marketing techniques, future goals, and information that provided an understanding of
7 Survey Dialogue (See Appendix E)8 Survey (See Appendix F)9 Data Spreadsheets (See Appendix G)10 See the Results Section
7 | P a g e

Texoma Grown as an organization in the community. The analytics became the foundation for
the recommendations in step nine.11
Step Nine
The team came up with 5 core conclusions and 5 core recommendations based on the data
reported. The recommendations are a starting point for Texoma Grown to become a more
formal organization that will be able to better serve those they represent.12
Step Ten
After the survey, analysis, and recommendations were completed, it was important for the
team to detail the process through a report, build a marketing presentation outlining our
Capstone experience for the University, and create presentation materials for the client. The
complete project is to be presented on April 4, 2011 at the Texoma Council of Government’s
offices in Sherman, Texas.13
Survey
11 See the Analysis Section12 See the Recommendations Section 13 Presentation (See Appendix H)
8 | P a g e

Scope
Using a predefined list of growers/producers from the Texoma Grown Directory, the scope of
the survey the team created included understanding the growers’/producers’ capacity to grow
their businesses, their current distribution strategies, their current and future marketing
strategies, their ideal target market, along with their business goals for the next five years.
Questions ranged from the basic demographics of the business to a discussion of Texoma
Grown and the possibility of a shared Texoma Grown brand. The types of questions asked were
a mixture of yes/no, multiple choice, scaled, and open-ended questions. The team had to make
sure that the questions asked were valid and would provide sufficient data to give strong,
pertinent analysis to better assist Texoma Grown's goal to learn more about those that they
support.
Methodology
The team created a web-based survey using Survey Monkey®. The growers and producers were
made aware that their individual survey results would be kept confidential and that only
aggregate survey results would be made available to TCOG and Texoma Grown. The online tool
was made directly available via email link for those choosing to participate electronically and
individual team members entered in the data for businesses choosing to participate over the
phone. This tool provided resources for data summarization and analytics that were much
easier to use than basic spreadsheets.
Validation
The survey was validated by testing it on a group of 14 people of various backgrounds including
associates, family, and friends from different professions and levels of education.14
During the sample survey, the team looked for any questions that were confusing to the
respondent and the team watched or listened for areas when the respondent got stuck or did
14Clark, Le Anna & Watson, David. Basic Issues in Objective Scale Development. http://homepage.psy.utexas.edu/homepage/class/Psy394Q/Research%20Methods/oldSticeArticles/Clark_and_Watson.PDF
9 | P a g e

not understand a question.15 When each team member reviewed this, they were able to report
whether or not the test group was getting hung up on one question. If so, then the question
was reworded or removed. Other means of validation included verbally asking the questions to
the peer group in order to see if some of the questions were not understandable. Again,
adjustments were made in order to prevent inconsistencies and clarify responses. This was
done repeatedly until the team was confident with the feedback that was received from the
validation process. We also did a quality check on the multiple choice questions to make sure
that the responses were detailed enough to gather the best information. 16 An example of this
was the radius in which the businesses sell to.
The following questions were asked:
Where did you get stuck on the survey?
Were there things that you didn't understand or were unclear about?
Do you have any feedback to make this more effective?
Was the appearance of the survey professional?
Did you encounter any glitches trying to use Survey Monkey?
Communication
Each team member was assigned 5 or 6 growers/producers that they “owned” for the survey
process. The initial contact was via telephone, when possible, and the team members followed
an outlined “dialogue”17 to start the conversation and survey. The team agreed to take
extensive notes during each conversation with the growers and record the information into the
database for future use. The growers were asked for a convenient time and method to take the
survey, the team documented this information, and conducted the survey on the advised date
when appropriate. The growers/producers were given the choice to take the survey by phone
or email. The survey respondents overwhelmingly chose to utilize the online tool (10
respondents) versus taking the survey over the phone (3 respondents).
15 Source: http://www.dss.mo.gov/mhd/mc/pdf/p-surveyadmin.pdf16 Source: http://www.evensenwebs.com/validity.html17 Survey Dialogue (See Appendix E)
10 | P a g e

11 | P a g e

Survey Results 18
Participation Rate
Out of 41 different growers listed on the Texoma Grown Directory,19 13 organizations
responded, thus providing a 35% participation rate for the survey. One grower indicated that
what they do is just a hobby, so it was not included in the 35% statistic. The responses to the
survey questions are based off of this participation rate.
Business Profiles for Members of Texoma Grown
A total of 100% of the organizations that submitted to the survey have 1-5 employees. This
indicates that the majority of the growers/producers qualify as small businesses.
The majority (61.5%) have been in business less than 5 years, with 30.8% in business for 5-10
years. Only one organization (7.1%) has operated for over 25 years.
See chart below for the breakdown.
18 Data Spreadsheets (See Appendix G)19 Texoma Grown Directory (See Appendix A)
12 | P a g e

Radius to Which Products Are Sold
The majority of those surveyed sell their products locally: 69.2% sell their products within 0-75
miles and 30.8% sell to customers greater than 75 miles away from the business. Two
organizations sell to customers in Kansas, Kentucky, and the Midwest.
See chart below for the breakdown.
13 | P a g e

Revenue Breakdown
The majority of respondents (53.8%) estimate their yearly revenue to be under $20,000. A total
of 38.5% disclosed that yearly revenues are $21,000 to $60,000, with only one respondent
making over $100,000 annually.
See chart below for the breakdown.
14 | P a g e

Types of Products Being Sold
The respondents of this survey sell a variety of products including fruits, vegetables, meats,
dairy and other specialty products like pecans, breads, sauces, pies and chocolate. The most
common product sold is vegetables.
See chart below for the breakdown.
15 | P a g e

Seasons in Which the Business Operates
Only 7 of 13 (54%) surveyed function year round (all 4 seasons), 3 organizations are working for
three seasons (23%) and 3 for only one season (23%). This indicates that many of the products
sold can be produced year round. Some products are rotated depending on the appropriate
growing season and some products are produced seasonally depending on customer demand.
Some businesses producing fresh produce see spring and summer as peak demand periods;
whereas others see the holidays including Thanksgiving and Christmas as their peak demand
times.
See chart below for the breakdown.
16 | P a g e

The Purchasers/Distributors of Texoma Grown Products
The majority of businesses sell primarily in farmers’ markets (61.5%) and many chose “other” in
the survey (53.8%). The “other” category includes local restaurants, food distributors, CSAs
(Community Supported Agriculture), and holiday gifts and handouts. The next leader is “on-
site” sales with 30.8%.
See chart below for the breakdown.
17 | P a g e

Perceived Competitive Advantage of Being Locally Grown
When asked if they had a competitive advantage from being a local grower, the majority of the
respondents (61.5%) believed that their status as a local grower could be used as a selling point
to organize and market products. Only 23.1% do not believe that being a local grower helps
with business and 15.4% were uncertain in their opinion.
See chart below for the breakdown.
18 | P a g e

Current Marketing Efforts and Future Business Goals of Texoma Grown
The majority, (92.3%) described several goals for the next 5-10 years to grow their businesses.
Overall, the most common answers were acquiring new land to grow products or raise more
animals which produce different types of products. Below is a listing of the frequency of goals
among the businesses.
See chart below for the breakdown.
19 | P a g e

Operations at Full Capacity
Most respondents (69.2%) reported that they do not operate at full capacity; thus, having
capacity to produce on a larger scale. A total of 30.8% said that they are operating at full
capacity.
The reasons respondents gave for why operations are not at full capacity are:
Part time activity
Lack of adequate local market options
Lack of local media
The competition for vendors is fierce
Meeting capacity varies according to weather and crops available
Limitation on equipment
Minimal internet utilization
Lack of formal advertising.
See chart below for the breakdown.
20 | P a g e

Potential Customers to Gain Next Year
When looking at increasing business, it is important to ask about the type of customers one is
looking to gain in the next few years. When respondents were posed this question, the majority
reported that they are looking for more “direct to public sales” including local residents willing
to “pick your own.” It appears that some businesses may go after the “wholesale” and
“restaurant” markets. The “other” category includes direct sales to grocery chains.
See chart below for the breakdown.
Do You Have A Logo?
21 | P a g e

Part of growing any business is self-identification. When asked if they had a logo/brand, 69.2%
said yes. When asked to describe the logo, many stated that they utilize the types of products
they sell in the logo. Examples of logos used by businesses in the Texoma Grown directory can
be found in Appendix J. Overall, the majority already have a unique brand which works for
them.
See chart below for the breakdown.
Current Marketing Channels Used By Texoma Grown Members
22 | P a g e

The respondents indicated that they do some marketing and advertising. Below is a
compilation of the types of marketing activities. A total of 61.5% use a website and word of
mouth for marketing activities while 15.4% do not do any marketing activities. This may indicate
the reason why they are unable to grow their business and/or obtain the necessary customers
to generate higher revenues. The 30.8% in the other category which includes newsletters,
posters, and networking
There is minimal use of social networking like Twitter and only 15.4% use Facebook. Traditional
marketing media is still being used; 38.5% still use print ads as a marketing tool.
See chart below for the breakdown.
Future Marketing Channels
23 | P a g e

In terms of future marketing strategy, only 30.8% aren't planning on adding any new marketing
avenues in the following year. A relatively large percentage, 15.4% of respondents, indicated
that they will use “other” future marketing channels but stated that they were “not sure” which
future marketing channels they would use.
See chart below for the breakdown.
The Relationship between Texoma Grown and Its Member Business
24 | P a g e

The respondents were asked if Texoma Grown has helped them with their businesses. A
percentage of 77% said no and responded that they have very little knowledge of the value
Texoma Grown brings and little to no contact with them. A total of 23% answered yes, saying
that Texoma Grown has helped them by promoting local growers and listing the businesses in a
directory on its website.
See chart below for the breakdown.
Perceived Help Offered by Texoma Grown
25 | P a g e

With a rating of 1.54 out of 5, it appears that Texoma Grown is perceived as currently doing
little to nothing for the local growers.
See chart below for the breakdown.
Question Does not
help me at all
Helps me only
slightly
No opinion
Helps me a little bit
Helps me a lot
Rating Average
Texoma Grown helps with Business Overall
9 2 1 1 0 1.54
Texoma Grown helps with Marketing Products
8 4 0 1 0 1.54
The Presence of Texoma Grown
26 | P a g e

When asked about Texoma Grown’s presence in the community, 69.2 % responded that they
did not know what Texoma Grown actually does and 30.8% were uncertain if they were well-
known. It should be emphasized here that not one respondent answered “yes” when asked if
Texoma Grown is well known in the community.
See chart below for the breakdown.
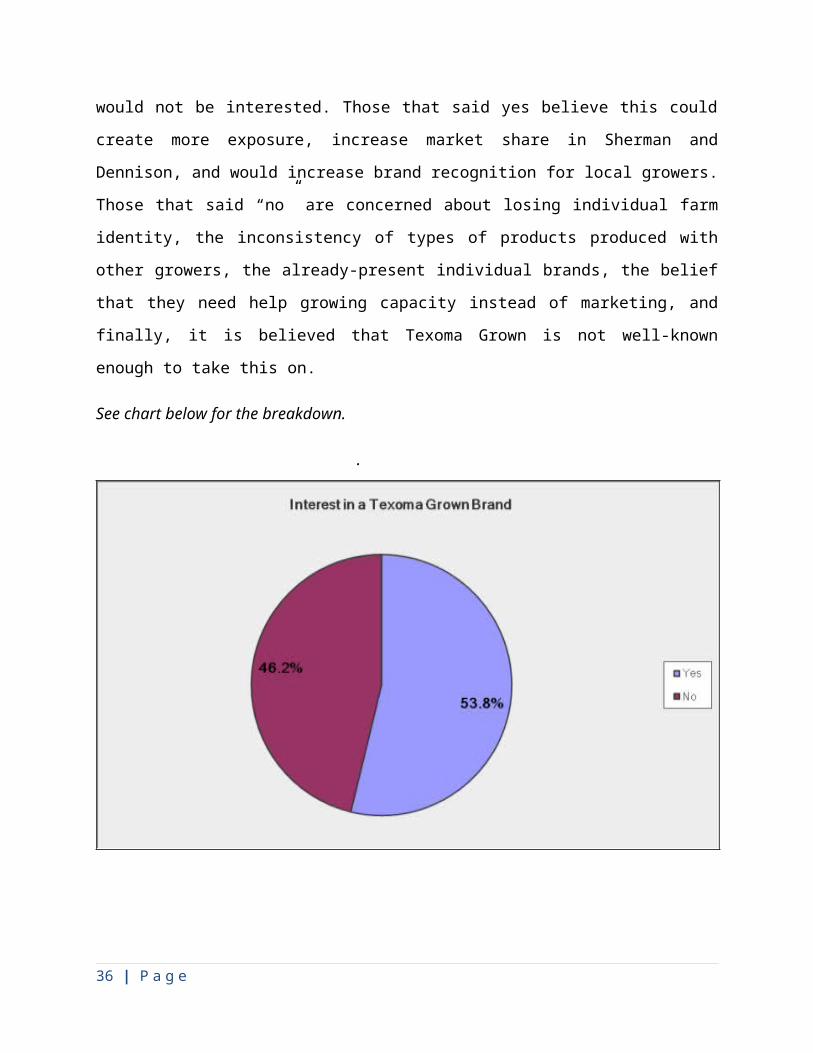
Interest in Texoma Grown Brand
27 | P a g e

There was almost a split of respondents when they were asked if they were interested in
uniting with other growers through a Texoma Grown brand. From the results, 53.8% said “yes”
when asked if they would be interested in uniting and 46.2% said they would not be interested.
Those that said yes believe this could create more exposure, increase market share in Sherman
and Dennison, and would increase brand recognition for local growers. Those that said “no” are
concerned about losing individual farm identity, the inconsistency of types of products
produced with other growers, the already-present individual brands, the belief that they need
help growing capacity instead of marketing, and finally, it is believed that Texoma Grown is not
well-known enough to take this on.
See chart below for the breakdown.
.
Willingness to Pay For a Unified Brand
28 | P a g e

An overwhelming 84.6% said "no" when asked if they would be willing to pay for a unified
brand; 15.4% said “yes.”
Recommendations for Texoma Grown To Help Improve Their Business
29 | P a g e

The respondents provided recommendations on ways Texoma Grown could help them market
their products. Ideas included website referrals, developing closer farmers’ markets, educating
the community about the fact that the businesses exist, advertising with local venues, and
helping the businesses become more effective in advertising. The respondents believe that any
help getting the word out is the most effective way.
When asked about how Texoma Grown could help improve the respondents’ business, many
were unsure. Below are some ideas disclosed by the respondents. A total of 41.6% are still
unsure of how Texoma Grown can help them.
Analysis
When ultimately looking at the data provided in the survey, several key ideas came to light.
These topics describe the vital areas that need to be addressed by the client in order to provide
success for the agricultural businesses participating in Texoma Grown. The analysis is broken
into five different sections which will correlate to the five different recommendations that are
intended to answer the following questions outlined in the SOW.20
20 See Recommendations Section
30 | P a g e
What could Texoma Grown do to help you improve your business? # Responses
Not Sure 5
Educate the community 2
Venue to explain what they need 1
Help with the hiring of employees 1
Create one place to contact other growers/producers 1
Help with the creation of new assets in order to produce more 1
Marketing 1

How can the Texoma Council of Governments/CORE help the local growers increase
their market share?
Would an improved “branding” of Texoma Grown accomplish significant results?
How does the local farming community perceive Texoma Council of Governments and
the value they offer?
How can the Texoma Council of Governments improve the value to Texoma Grown?
Can the gathering of information be summarized to help Texoma Grown become a
better organized, cohesive group?
Conclusion #1
The Texoma Grown brand has not created any traction in the community. There is very little
knowledge among its members as to how Texoma Grown has helped them or how it could
potentially help them.
76.9% of growers stated Texoma Grown does not help their business AT ALL.
0% of growers stated Texoma Grown helps them a lot.
69% of growers stated Texoma Grown is not well known in community.
0% said they were well known.
Conclusion #2
The members of Texoma Grown are relatively new small businesses with limited access to
resources that could help expand their businesses. The Texoma Council of Governments/CORE
should partner with the local agricultural businesses to help them understand the current
marketplace and how to position themselves to more effectively market their products. This
helps support the goal of the Texoma Council of Governments to decrease duplicate efforts and
increase cooperation and efficiency based on economies of scale.
31 | P a g e

62% of growers are new business (<5 years old)
54% of growers make < $20K annually (not financially strong)
Conclusion #3
It is believed that websites for local businesses will aid in marketing efforts. The majority of the
members already have their own websites, but Texoma Grown should strive to enhance its
website to increase leverage about members’ products outside of the area where they are
produced. Texoma Grown, along with each of the businesses, needs to develop better means of
communication with potential customers by using websites and social networking sites like
Twitter and Facebook for advertising. This will help businesses to reach potential customers
who are used to using the internet and will provide an opportunity to learn more about them
and their needs.
Conclusion #4
Based on the demographic information, the businesses that responded to the survey could
potentially grow their organizations to meet their full current capacity and many are
considering expanding their capacity above current levels.
The majority of the businesses feel that they are not meeting capacity for a variety of reasons.
While some of the reasons for under-capacity have to be dealt with by each business on an
individual level, there are some avenues that Texoma Grown can explore to help with capacity
growth.
The respondents primarily believed that access to more capital including land and/or animals is
necessary to produce more, to gain market share, and to grow their businesses.
69% are underutilized (have excess capacity)
74% of growers want to increase resources or capacity in the coming years
Conclusion #5
32 | P a g e

The organizations are split on the idea of having a Texoma Grown brand. This could be due to
lack of education as to what a potentially successfully brand could do for them. Leveraging a
unified brand could create more exposure for the individual businesses, providing an awareness
of Texoma Grown agricultural products that is currently lacking in this community.
A total of 62% of members believe there is a competitive advantage in being a local
grower.
Only 53.8% of the Texoma Grown members are interested in the creation of a unified
logo for the group.
Recommendations
Below, the team will describe 5 recommendations based on the survey data to help Texoma
Grown better serve its members. The first steps are organizing Texoma Grown to function more
like an organization, develop a more attractive website, gain the support of the community, and
33 | P a g e

ultimately look at developing a brand that would prove to be effective for promotional efforts.
Without organizational and member support, the brand will not be successful.
Recommendations #1
When analyzing the survey, we found that the growers in general did not know who Texoma
Grown was and were not sure how they could be of help, suggesting that the most important
thing Texoma Grown can do is to nurture the relationships with each and every member. They
need to identify those members who are still interested in the group and give consideration as to how
the members who feel negatively toward the organization could hinder its purposes or downgrade its
image in the community. In doing this, Texoma Grown will have the opportunity to update its
member rolls and ensure it has accurate and complete contact information for everyone.
The remaining members need to establish regular “town hall” monthly meetings, with the first
order of business being to establish the mission of Texoma Grown and its goals so that there is
an agreed-upon unifying idea behind the organization. The Texoma Grown organization and
brand should be owned by the organization itself, much like a homeowners’ association would
be. To this end, they should create a board which consists of its members and establish bylaws.
It may also be worthwhile to pursue grants or other funding that would facilitate covering the
infrastructure costs incurred during the creation of a more formal organization.
Texoma Grown also needs to establish a plan to increase their presence in the community if
they are going to effectively market themselves locally, maintain the confidence of current
members, and recruit new members that have an interest in joining forces with others.
Recruiting efforts could utilize the town hall meetings (mentioned above) in order to
disseminate educational materials to potential member businesses outlining the benefits of
uniting with each other and what Texoma Grown can do for them. Perhaps one or two growers
that have benefited from the relationship can share their experiences. Increasing membership
creates a positive feedback loop – the more members there are, the more customers are being
exposed to Texoma Grown through contact with the member organizations, the greater the
34 | P a g e

awareness of the group in the community, and the more interest there will be from new
members wanting to join.
Texoma Council of Governments and CORE may be able to assist in an annual survey of the
Texoma Grown business members to rate their satisfaction with the organization. This survey
will accomplish two objectives: to help Texoma Grown to build a better local reputation by
seeing where they are succeeding in order to adjust their actions accordingly and to show
member businesses that Texoma Grown is committed to them and the goals of the
organization. Hopefully, the survey results can be presented at the regular meetings to
continue the process of the businesses getting to know each other and discuss ways to assist
the member organizations in expanding their businesses and marketing their products, perhaps
through the creation of a Texoma Grown logo to complement the brand that is being built.
Recommendation #2
Texoma Grown as an organization needs to become more of an outlet for its members to learn
more about business best practices including effective marketing strategies. As a starting point,
the members of Texoma Grown need to identify each other’s business strengths and pool their
knowledge. For example, the members with different marketing resources could help teach
each other things like using print ads effectively, building a website, etc.
The Texoma Council of Governments/CORE could help establish a more interactive web site for
Texoma Grown, which could include a “members only” section. The website could contain links
containing information on applying for agricultural funding/small business loans, applications to
be certified Go Texan or Texas organic, access to professional market analysis data, and other
links of use to members in helping them to grow and market their businesses. In addition,
Texoma Grown should hold an informational seminar for its members once per month. These
meetings would last about three hours and would present knowledge on how to market
products using Facebook and Twitter, how to access low cost advertising, meeting small
business regulations regarding employee benefits, etc.
35 | P a g e
Another suggestion would be for Texoma Grown to formulate and present a marketing plan to
the growers/producers designed to increase awareness of the group within the community.
This plan would take into account the needs of the members and how best to help market their
products using a Texoma Grown brand. Research around best practices is always helpful and
can provide education around how to develop an idea into a creative marketing technique.
Recommendation #3
Texoma Grown needs to create a dynamic website that details the purpose and mission of the
organization, contains a current list of members, and provides links to related sites (i.e., sites
outlining the benefits of local and/or organic foods, lists of local farmers’ markets, etc.). The
website could be marketed to local grocery stores and the community at large in order to raise
awareness of the organization in the minds of the public and to educate consumers on the
advantages of locally-grown products.
The website can be an avenue to check incoming traffic and ultimately direct traffic back to the
growers. Looking at social media and other PR efforts can help increase more awareness which
hopefully would lead to stronger sales. When addressing other marketing strategies, cost can
be an issue. There are many ways that the growers can combat the extra costs and start
producing more traffic for their products such as human interest stories through the local
media.
Recommendation #4
Lack of advertising can be a main culprit of underutilization of capacity.21 Texoma Grown
should create a hardcopy directory listing its members’ business names, locations, web
addresses, phone numbers and a short description of their products. These directories could be
distributed at local farmers’ markets, grocery stores and through local newspapers.
The Texoma Council of Governments and/or CORE could develop programs that would help
Texoma Grown members expand their operations. Some examples include government
21 Source: http://www.businessihub.com/problems-of-small-scale-industries/
36 | P a g e

subsidies or even low cost loan programs. Some businesses are already selling at their current
capacity, but want to produce more. On a related note, Texoma Grown could provide its
members with information regarding government resources available to agricultural and/or
small businesses that are designed to help expand capacity and to create jobs.
Recommendation #5
The organization should research other successful community brands like Go Texan in order to
get ideas for their own brand and to observe real-world results.22 Texoma Grown needs to
develop a prototype logo and present it to the businesses to get their reactions and to see if
they are interested in having the brand on their products. The successful history of other
brands could be presented to the growers to help promote the idea of a unified brand.
The organization should also create and display the Texoma Grown unified logo on its website
and establish criteria which businesses would have to meet in order to apply for use of the logo.
Texoma Grown could do further market research with the local public to gauge reaction to the
brand; this would also help to promote the idea of a brand to members if consumer reaction
was positive.
The brand would not replace individual brands, but would supplement them. In order to build
brand awareness, it is important to make the brand appealing, but it also has to demonstrate a
return. If the brand means "organic" or "quality," it may be much easier to sell to the business
owners, build presence in the community, and ultimately could create market loyalty if the
products represented under the brand provide a competitive advantage. The idea is that being
local sets this group apart, but it may not be enough to leverage the brand into the
marketplace.
Challenges
22 Source: http://managementhelp.org/quality/bnchmrkg/bnchmrkg.htm
37 | P a g e

As with any project, it is important to address the challenges the team faced during project
completion.
The first issue was the apparent lack of understanding of what Texoma Grown was supposed to
be and what role CORE played in its development. A question that came up many times during
the project was “is Texoma Grown a brand or an organization?” As concluded in the summary
and recommendations section of the paper, the purpose of Texoma Grown and the roles that
CORE and possibly TCOG might play in it must be clearly stated and communicated to the
businesses to relieve some of this confusion. This ambiguity created a challenge in designing
recommendations. It was sometimes hard to determine if Texoma Grown, CORE, or TCOG
should be involved in certain actions.
Another challenge was contacting the businesses on the Texoma Grown Directory. Under the
advisement of Ms. Cummins, it was understood that what was posted in the directory was all
the available contact information. Upon the initial contact, the team came across some
businesses with disconnected numbers, businesses that were no longer in operation,
businesses that had changed ownership, and businesses that had changed names. At this point,
the team attempted to find the correct contact numbers and business information. If they
were successful, they updated the business database with the new contact information that the
team had on file.23
The final challenge the team faced was that there were some businesses that were reluctant to
take the survey and there were some businesses that were vehemently opposed to the survey
due to past occurrences with either CORE or Texoma Grown. As seen in the survey results, the
team concluded that most of the contacts that were reluctant to take the survey were not
educated on Texoma Grown and the possible benefits of being listed as a member in the
directory.
Overall, these challenges did affect the survey results with a 35% participation rate, but the
sample of data that was presented above does create a picture of possible projects CORE can
do to provide support for Texoma Grown.
23 Business Database (See Appendix I )
38 | P a g e

Concluding Summary
In concluding this project, the team was able to undertake a successful process to provide
TCOG, CORE, and Texoma Grown with an outline of the types of businesses that are listed in the
39 | P a g e

Texoma Grown Directory and ways in which they can help support them. By creating the
survey, administering it, analyzing the results, and providing recommendations, the team was
able to understand the process it takes to gather data, how to organize and analyze the data to
gain the most information from it, and how to use this information to assess a current situation
and suggest strategic actions to be taken. By doing research on how other growers associations’
work and the local agricultural market in north Texas, we were able to understand the
challenges that the local businesses face.
We recommended that the first steps should be organizing the Texoma Grown organization and
involving the local growers in its reorganization. After organizing, it is important that any
branding that is developed will be able to compete in the market and tell the story about this
unified group. The businesses need to be involved for successful implementation of a brand.
When this does occur, then we believe that Texoma Grown will be more recognized in the
community.
Unifying through a centralized Texoma brand would create the possibility for these businesses
to leverage their products into different markets and see the benefits of brand awareness and
recognition.
Resources
Texoma Council of Governments Webpage
Texoma Council of Governments. http://www.texoma.cog.tx.us/
40 | P a g e

Texoma Grown Directory
See Texoma-Grown Directory. http://www.texomacore.org/Texoma-Grown-Directory.html
Source for how to validate a survey
Evensen Wed Design (2002-2007). http://www.evensenwebs.com/validity.html
Trochim, M.K., (10/20/2006). Research Methods Knowledge Base. Center for Social Research Methods. http://www.socialresearchmethods.net/kb/qualdeb.php.
eSurveysPro.com (2011). http://www.esurveyspro.com/Survey.aspx?id=ae3616e7-abda-4fbc-b5d2-40b78fc1e5ed
Quantitative Marketing Research. http://drho.ro/quantitative-marketing-research/ Dr. Horowitz Marketing
Clark, Le Anna & Watson, David. Basic Issues in Objective Scale Development. http://homepage.psy.utexas.edu/homepage/class/Psy394Q/Research%20Methods/oldSticeArticles/Clark_and_Watson.PDF
Sources for Recommendations
Problems of Small Scale Industries. http://www.businessihub.com/problems-of-small-scale-industries/. Submitted on September 24, 2010 by pooja gogia.
Overview of Benchmarking: About page at Free Management Library. http://managementhelp.org/quality/bnchmrkg/bnchmrkg.htm
Agricultural Research Summary24
USDA: The Census of Agriculture: 2007 Census Publications: Texas.
http://www.agcensus.usda.gov/Publications/2007/Full_Report/Census_by_State/Texas/index.asp
TX Hometown Locator (2011). http://texas.hometownlocator.com/counties/
Go Texan (2009). http://www.gotexan.org/gt/jumppage/0,1486,1670_0_0_0,00.html
TDA Certified Organic Businesses from the Department of Agriculture Texas (2/13/2009). http://www.agr.state.tx.us/vgn/tda/files/1848/15574_TDA%20Certified%20Organic%20Businesses.pdf
TDA Certified Organic Businesses By Crop from the Department of Agriculture Texas. http://www.agr.state.tx.us/vgn/tda/files/1848/17484_TDA%20Organic%20Farms%20by%20Crop%2010-07.pdf
TDA Certified Organic Livestock Farm from the Department of Agriculture Texas (2/13/2009).http://www.agr.state.tx.us/vgn/tda/files/1848/17486_TDA%20Organic%20Livestock%20Farms.pdf
Environmental Working Group (2007-2010). http://farm.ewg.org/region.php?fips=48000
Tools
Survey Monkey®
24 Agricultural Research (See Appendix C)
41 | P a g e

Free Conference Call.Com®
Microsoft Windows Live Meeting®
Google Doc Sharing® (For Project Plan)
Information about marketing local growers25
Levy, Ken (1/18/2010). Organic Farmers Rely on New Markets, Innovation to Aid Profitability. The Idaho Business Review. https://dbproxy.udallas.edu/login?url=http://proquest.umi.com/pqdweb?did=1947318021&Fmt=3&clientId=27993&RQT=309&VName=PQD
Georgia Fruit and Vegetable Growers Association (2009). http://gfvga.org/georgia-grown/.
Georgia Fruit and Vegetable Growers Association Members (2009). http://gfvga.org/membership/
Maine Department of Agriculture (2011). Get Real Get Maine! http://www.getrealmaine.com/
Maine Department of Agriculture (2011). About Department of Agriculture. http://www.getrealmaine.com/index.cfm/fuseaction/home.showpage/pageID/7/index.htm.
Eastwood, David, John Brooker, Charles Hall, Alice Rhea (March 2004). Small Produce Growers' Marketing Behaviors: A Case Study of Tennessee. http://ageconsearch.umn.edu/bitstream/27138/1/35010057.pdf
25Research on Local Growers Associations (See Appendix D)
42 | P a g e
Acknowledgements
Dr. Sandra Blanke
Thank you for providing guidance on this Capstone project for our team. You were instrumental
is providing us with the direction to take on this project. Your expertise on survey techniques
was valuable and we appreciate you taking the time to meet with us bi-monthly to help us
better prepare to serve the needs of our client.
Katy Cummins
Thank you for allowing our group to learn more about the Texoma Council of Governments and
the important role you play in unifying counties on different issues. We appreciate you taking
the extra time to meet with us and for providing us with this valuable learning experience. This
project gives the student the understanding of how to create market surveys to gather
information and also provides the student with the insight that business is not always
documented in a textbook and real world experience is valuable.
Lisbeth Echeandia
We appreciate you bringing this project to the Texoma Council of Governments so that we
could work a real life project and learn all the facets that its takes to understand a local market
and its needs.
43 | P a g e

University of Dallas Student Biographies
44 | P a g e
Sandra Sinatora
Role: Marketing Presentation, Survey Development
MBA Concentration: Marketing
New Product Development Coordinator, Unilever
Dallas, TX
Live
Lisa Reed
Role: Meeting coordinator, Client Contact, Final Presentation
MBA Concentration: Health Services Management
Pathology Technical Coordinator for Methodist Dallas Med. Cent.
Richardson, TX
Patrick Wright
Role: Survey, Weekly Project Plan, Final Presentation
MBA Concentration: Interdisciplinary
Sales Vice President, AdvoCare
Orem, Utah
Matt Stensland
Role: Growers Database, Survey, Analysis, Minute Taker
MBA Concentration: Health Services Management
Senior Compensation Analyst, Tenet Healthcare Corporation
Dallas, Texas

No Image Available
45 | P a g e
Bridgette Porter
Role: Growers Database, Professor Contact, Final Paper
MBA Concentration: Interdisciplinary
2nd Grade Teacher, Cornerstone Private School
Frisco, Texas
John Eckerle
Role: Statement of work, Survey Result Analysis
MBA Concentration: Supply Chain Management
Purchasing Manager, Chem-Trend Limited Partnership
Michigan
Stacy Spann
Role: Compiling Survey, Survey Monkey survey, weekly status report, final marketing report
Credentialing Services Specialist, Billing Consultants, LLC
Athens, Georgia

Appendix
Appendix 46 Texoma Grown Directory A Statement of Work B Agricultural Research C Research on Local Growers Associations D Survey Dialogue E Survey F Data Spreadsheets G Presentation H Business Database I Texoma Grown Member Logos J
46 | P a g e