final project report clean beaches initiative project · pdf filefinal project report for the...
TRANSCRIPT
FINAL PROJECT REPORT
FOR THE AVENUE I
LOW-FLOW DIVERSION (LFD) PROJECT
Clean Beaches Initiative Project No. 106 Agreement Number: 02-222-550-0
Project No. 569
February 2008
Prepared for
State Water Resources Control Board
Prepared By
LOS ANGELES COUNTY FLOOD CONTROL DISTRICT
Project 569 LFD Final Project Report February 2008
2
1) Table of Contents
1) Table of Contents .....................................................................................................2 2) Introduction...............................................................................................................3 3) Data..........................................................................................................................4
3.1) Low Flow Diversion Monitoring Data....................................................................6 3.2) Flow Data and Estimated Loading .......................................................................9 3.3) Beach Mile Days ..................................................................................................9 3.4) Summer Beach Report Card Grades ..................................................................10 3.5) Shoreline Bacteria Monitoring ............................................................................11
4) Conclusions and Recommendations ......................................................................13 4.1) Bacteria and Flow Monitoring.............................................................................14 4.2) Siting..................................................................................................................14 4.3) Design and Maintenance ...................................................................................15
5) Contact Information ................................................................................................15 6) References .............................................................................................................16 Appendix A Bacterial Monitoring Data ..........................................................................17 Appendix B Chains of Custody and Field Data Sheets.................................................18 Appendix C Beach Report Cards..................................................................................19 Appendix D Grant Documents and Project Photos.......................................................20 Appendix E Shoreline Monitoring Results.....................................................................21
List of Figures Figure 1) Project Location…………………………………………………………………………3 Figure 2) Shoreline Monitoring Sites..……………………………………………………………6 Figure 3) Total Coliform Concentrations Diverted to Sewer at Avenue I LFD......................5 Figure 4) Fecal Coliform Concentrations Diverted to Sewer at Avenue I LFD……...………7 Figure 5) Fecal Enterococcus Concentrations Diverted to Sewer at Avenue I LFD..……...7 Figure 6) Shoreline Monitoring of Total Coliform at Avenue I Storm Drain……………...….8 Figure 7) Shoreline Monitoring of E. Coli at Avenue I Storm Drain………………………...12 Figure 8) Shoreline Monitoring of Fecal Enterococcus at Avenue I Storm Drain…………13 List of Tables Table 1) Table of Items for Review ………………………………………………………….….4 Table 2) Flow Volume and Estimated Bacterial Loads to Sanitary Sewer
During the 2007 AB411 year………………………………………………………….9 Table 3) Beach Mile Days……………………………………………………..……..………...10 Table 4) Heal The Bay Summer Dry Beach Report Card Grades…………..…..…………11
Project 569 LFD Final Project Report February 2008
3
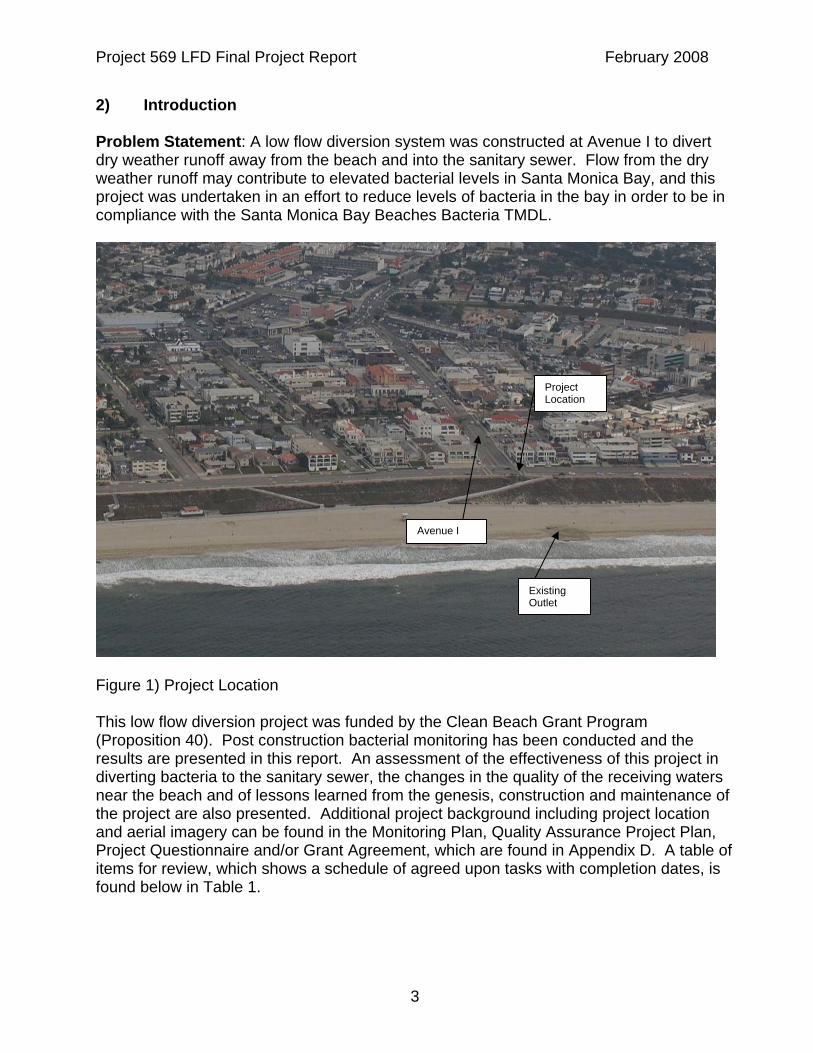
2) Introduction Problem Statement: A low flow diversion system was constructed at Avenue I to divert dry weather runoff away from the beach and into the sanitary sewer. Flow from the dry weather runoff may contribute to elevated bacterial levels in Santa Monica Bay, and this project was undertaken in an effort to reduce levels of bacteria in the bay in order to be in compliance with the Santa Monica Bay Beaches Bacteria TMDL.
Figure 1) Project Location This low flow diversion project was funded by the Clean Beach Grant Program (Proposition 40). Post construction bacterial monitoring has been conducted and the results are presented in this report. An assessment of the effectiveness of this project in diverting bacteria to the sanitary sewer, the changes in the quality of the receiving waters near the beach and of lessons learned from the genesis, construction and maintenance of the project are also presented. Additional project background including project location and aerial imagery can be found in the Monitoring Plan, Quality Assurance Project Plan, Project Questionnaire and/or Grant Agreement, which are found in Appendix D. A table of items for review, which shows a schedule of agreed upon tasks with completion dates, is found below in Table 1.
Existing Outlet
Avenue I
Project Location
Project 569 LFD Final Project Report February 2008
4
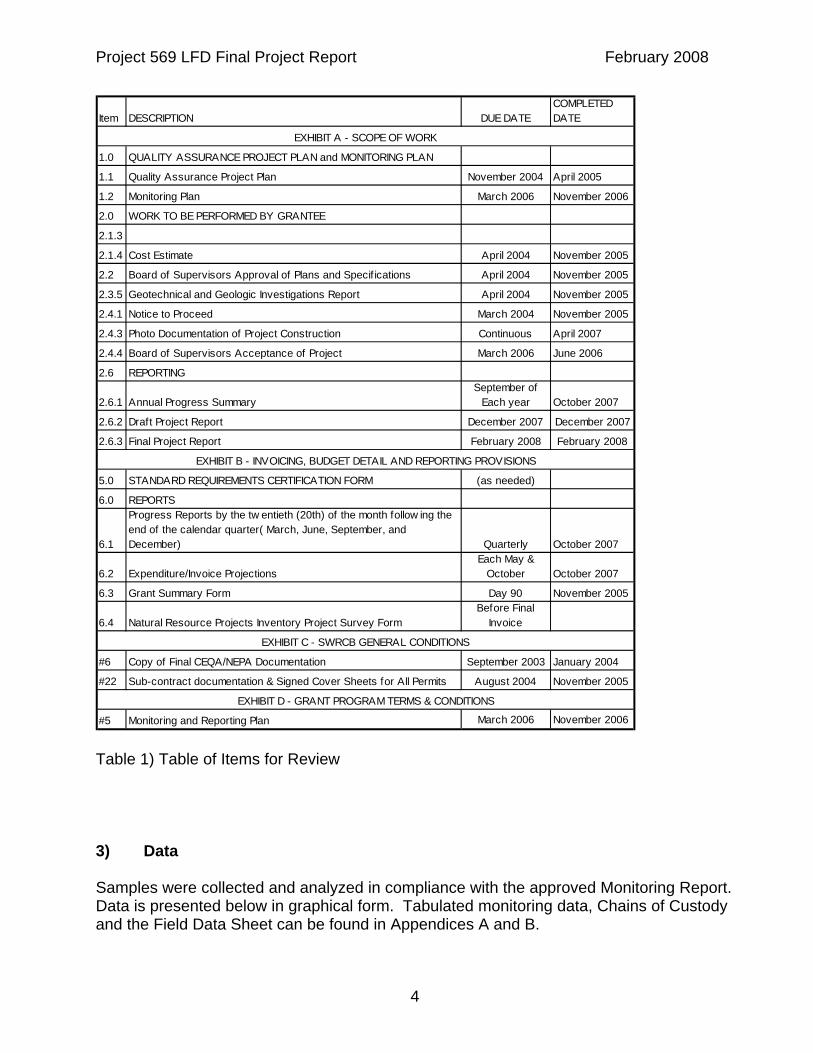
Table 1) Table of Items for Review 3) Data Samples were collected and analyzed in compliance with the approved Monitoring Report. Data is presented below in graphical form. Tabulated monitoring data, Chains of Custody and the Field Data Sheet can be found in Appendices A and B.
Item DESCRIPTION DUE DATECOMPLETED DATE
1.0 QUALITY ASSURANCE PROJECT PLAN and MONITORING PLAN
1.1 Quality Assurance Project Plan November 2004 April 2005
1.2 Monitoring Plan March 2006 November 2006
2.0 WORK TO BE PERFORMED BY GRANTEE
2.1.3
2.1.4 Cost Estimate April 2004 November 2005
2.2 Board of Supervisors Approval of Plans and Specif ications April 2004 November 2005
2.3.5 Geotechnical and Geologic Investigations Report April 2004 November 2005
2.4.1 Notice to Proceed March 2004 November 2005
2.4.3 Photo Documentation of Project Construction Continuous April 2007
2.4.4 Board of Supervisors Acceptance of Project March 2006 June 2006
2.6 REPORTING
2.6.1 Annual Progress SummarySeptember of
Each year October 2007
2.6.2 Draft Project Report December 2007 December 2007
2.6.3 Final Project Report February 2008 February 2008
5.0 STANDARD REQUIREMENTS CERTIFICATION FORM (as needed)
6.0 REPORTS
6.1
Progress Reports by the tw entieth (20th) of the month follow ing the end of the calendar quarter( March, June, September, and December) Quarterly October 2007
6.2 Expenditure/Invoice ProjectionsEach May &
October October 2007
6.3 Grant Summary Form Day 90 November 2005
6.4 Natural Resource Projects Inventory Project Survey FormBefore Final
Invoice
#6 Copy of Final CEQA/NEPA Documentation September 2003 January 2004
#22 Sub-contract documentation & Signed Cover Sheets for All Permits August 2004 November 2005
#5 Monitoring and Reporting Plan March 2006 November 2006
EXHIBIT A - SCOPE OF WORK
EXHIBIT B - INVOICING, BUDGET DETAIL AND REPORTING PROVISIONS
EXHIBIT C - SWRCB GENERAL CONDITIONS
EXHIBIT D - GRANT PROGRAM TERMS & CONDITIONS
Project 569 LFD Final Project Report February 2008
5
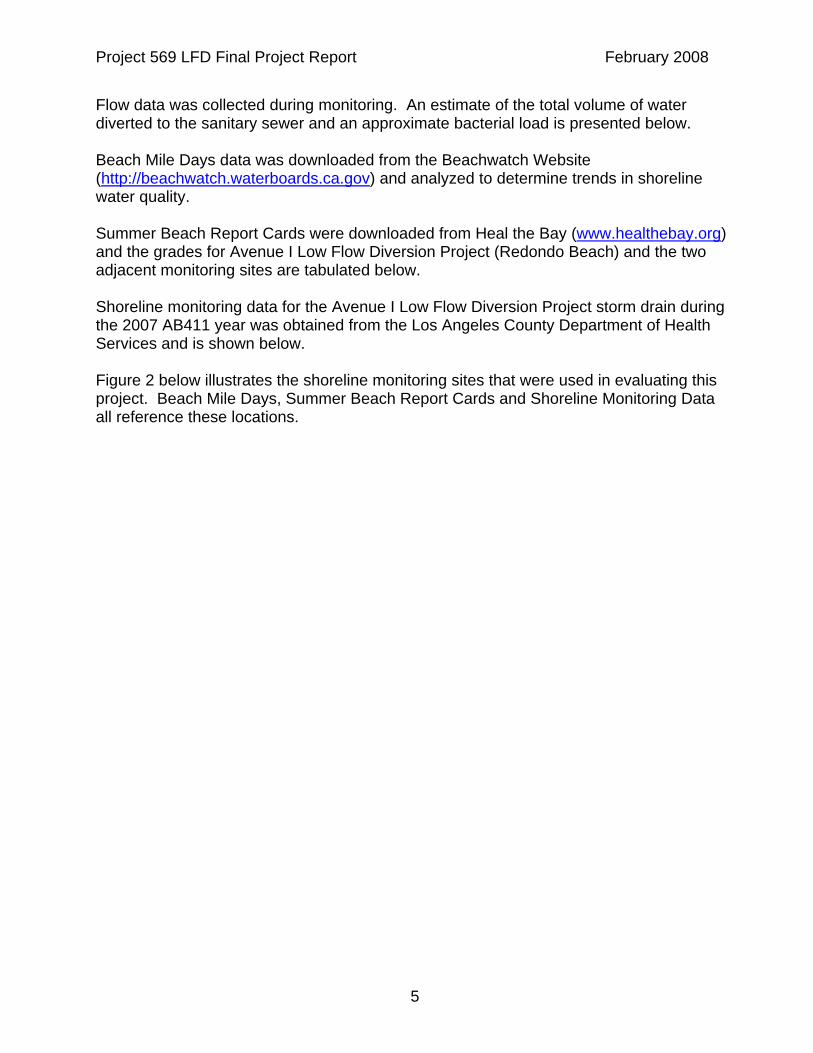
Flow data was collected during monitoring. An estimate of the total volume of water diverted to the sanitary sewer and an approximate bacterial load is presented below. Beach Mile Days data was downloaded from the Beachwatch Website (http://beachwatch.waterboards.ca.gov) and analyzed to determine trends in shoreline water quality. Summer Beach Report Cards were downloaded from Heal the Bay (www.healthebay.org) and the grades for Avenue I Low Flow Diversion Project (Redondo Beach) and the two adjacent monitoring sites are tabulated below. Shoreline monitoring data for the Avenue I Low Flow Diversion Project storm drain during the 2007 AB411 year was obtained from the Los Angeles County Department of Health Services and is shown below. Figure 2 below illustrates the shoreline monitoring sites that were used in evaluating this project. Beach Mile Days, Summer Beach Report Cards and Shoreline Monitoring Data all reference these locations.
Project 569 LFD Final Project Report February 2008
6
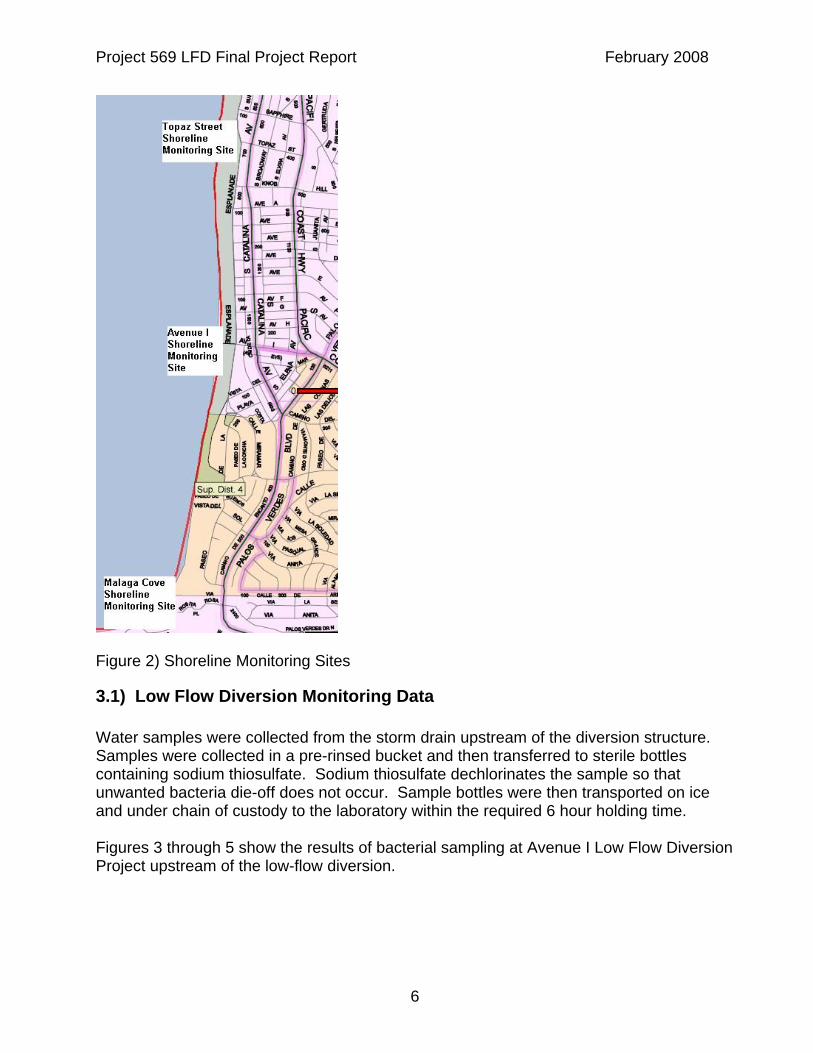
Figure 2) Shoreline Monitoring Sites
3.1) Low Flow Diversion Monitoring Data Water samples were collected from the storm drain upstream of the diversion structure. Samples were collected in a pre-rinsed bucket and then transferred to sterile bottles containing sodium thiosulfate. Sodium thiosulfate dechlorinates the sample so that unwanted bacteria die-off does not occur. Sample bottles were then transported on ice and under chain of custody to the laboratory within the required 6 hour holding time. Figures 3 through 5 show the results of bacterial sampling at Avenue I Low Flow Diversion Project upstream of the low-flow diversion.
Project 569 LFD Final Project Report February 2008
7
Total Coliform Concentrations Diverted to Avenue I Low Flow Diversion
110
1001000
10000100000
100000010000000
03/19/2007 04/28/2007 06/07/2007 07/17/2007 08/26/2007 10/05/2007 11/14/2007
Tota
l Col
iform
[MPN
/100
mL]
AB 411 Limit
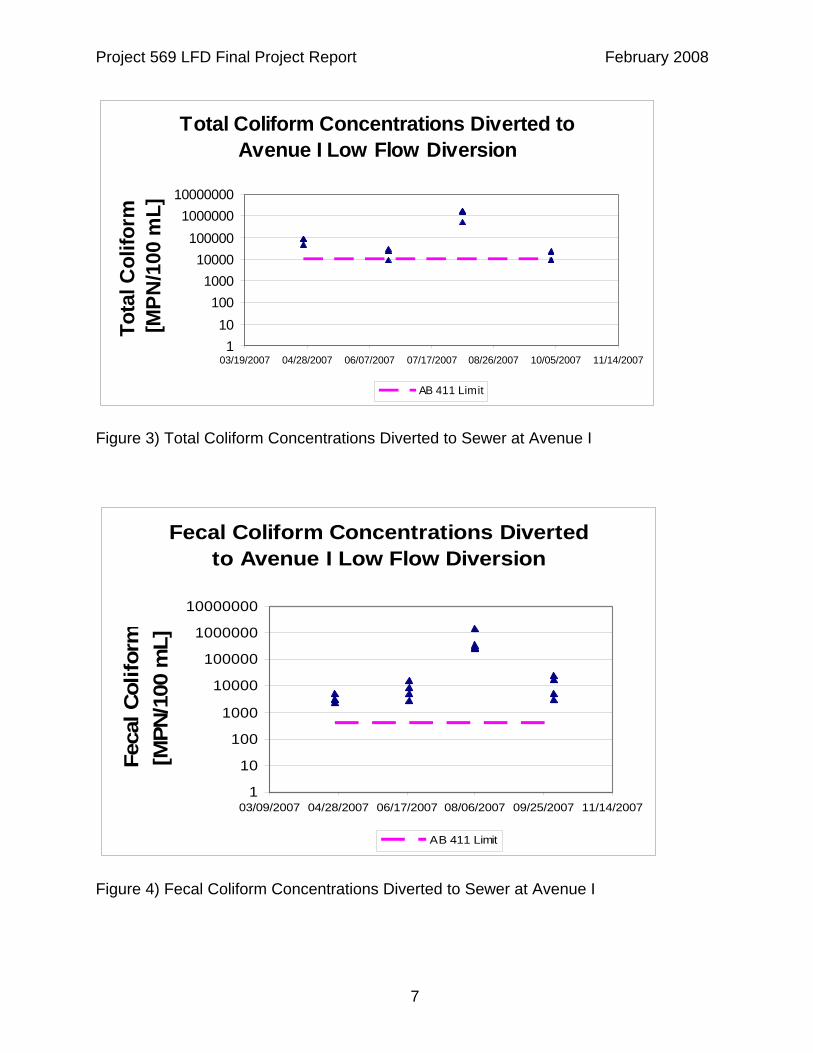
Figure 3) Total Coliform Concentrations Diverted to Sewer at Avenue I
Fecal Coliform Concentrations Diverted to Avenue I Low Flow Diversion
1
10
100
1000
10000
100000
1000000
10000000
03/09/2007 04/28/2007 06/17/2007 08/06/2007 09/25/2007 11/14/2007
Feca
l Col
iform
[MPN
/100
mL]
AB 411 Limit
Figure 4) Fecal Coliform Concentrations Diverted to Sewer at Avenue I
Project 569 LFD Final Project Report February 2008
8
Fecal Enterococcus Concentrations Diverted to Avenue I Low Flow Diversion
1
10
100
1000
10000
100000
1000000
03/19/2007 04/28/2007 06/07/2007 07/17/2007 08/26/2007 10/05/2007 11/14/2007Feca
l Ent
eroc
occu
s [M
PN/1
00 m
L]
AB 411 Limit
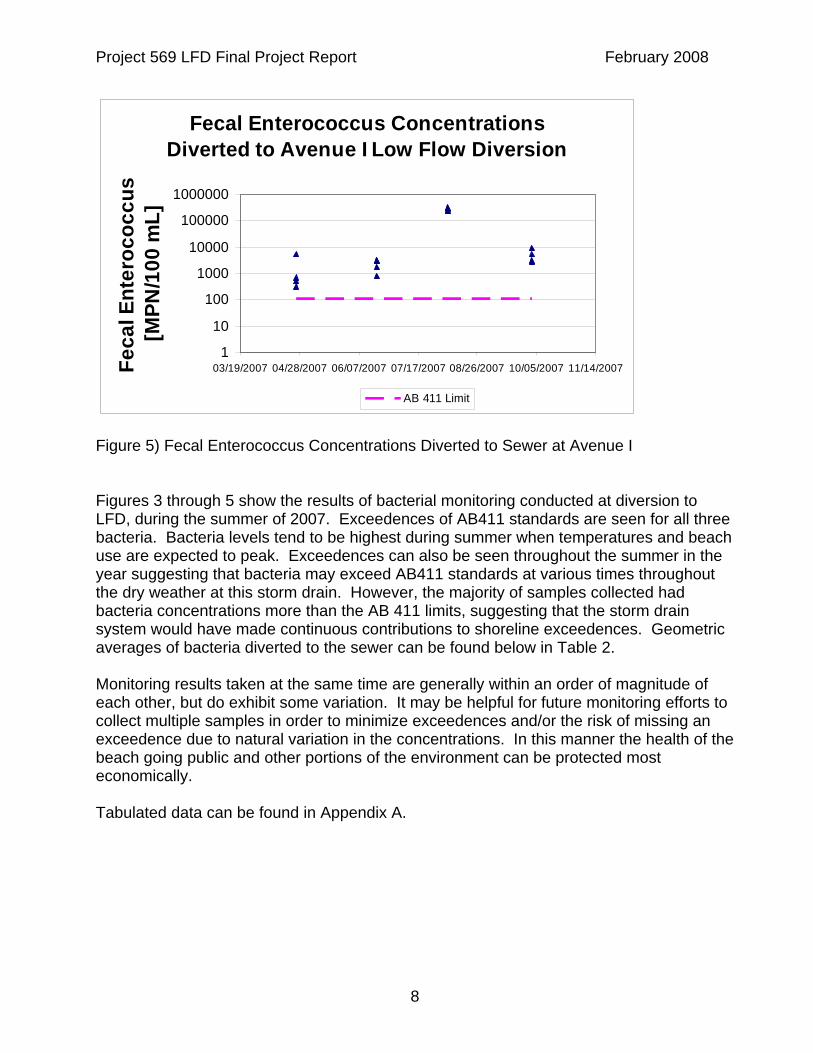
Figure 5) Fecal Enterococcus Concentrations Diverted to Sewer at Avenue I Figures 3 through 5 show the results of bacterial monitoring conducted at diversion to LFD, during the summer of 2007. Exceedences of AB411 standards are seen for all three bacteria. Bacteria levels tend to be highest during summer when temperatures and beach use are expected to peak. Exceedences can also be seen throughout the summer in the year suggesting that bacteria may exceed AB411 standards at various times throughout the dry weather at this storm drain. However, the majority of samples collected had bacteria concentrations more than the AB 411 limits, suggesting that the storm drain system would have made continuous contributions to shoreline exceedences. Geometric averages of bacteria diverted to the sewer can be found below in Table 2. Monitoring results taken at the same time are generally within an order of magnitude of each other, but do exhibit some variation. It may be helpful for future monitoring efforts to collect multiple samples in order to minimize exceedences and/or the risk of missing an exceedence due to natural variation in the concentrations. In this manner the health of the beach going public and other portions of the environment can be protected most economically. Tabulated data can be found in Appendix A.
Project 569 LFD Final Project Report February 2008
9
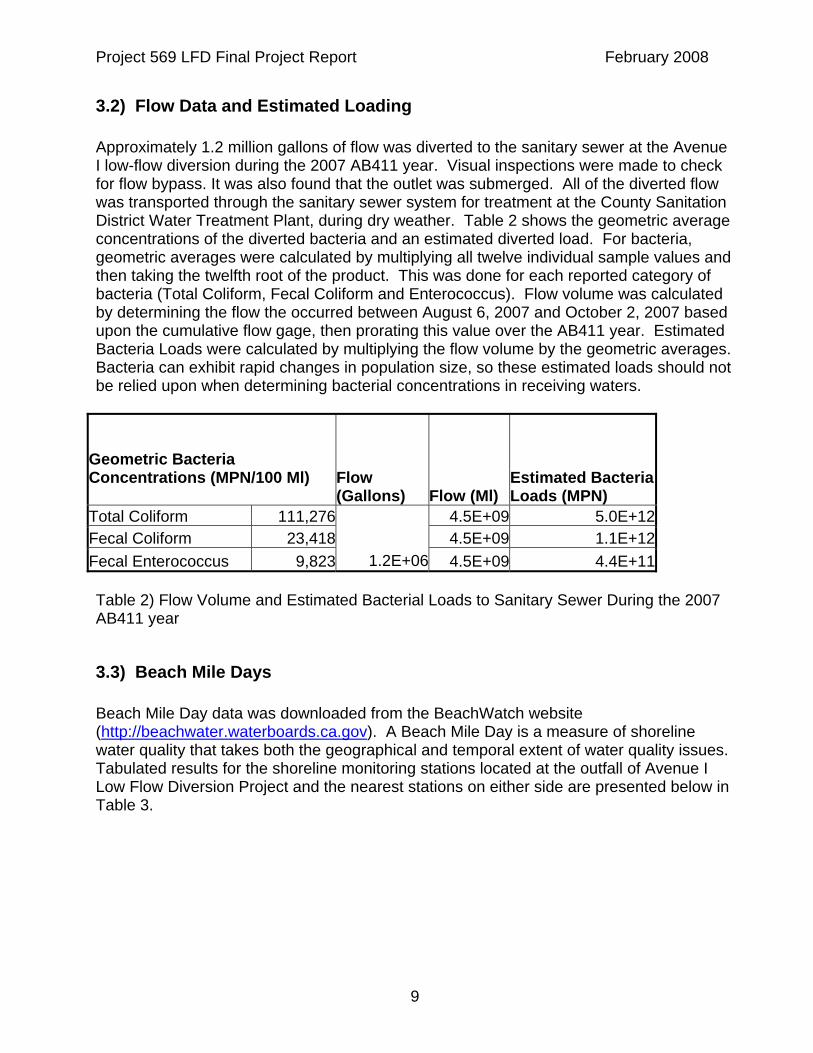
3.2) Flow Data and Estimated Loading Approximately 1.2 million gallons of flow was diverted to the sanitary sewer at the Avenue I low-flow diversion during the 2007 AB411 year. Visual inspections were made to check for flow bypass. It was also found that the outlet was submerged. All of the diverted flow was transported through the sanitary sewer system for treatment at the County Sanitation District Water Treatment Plant, during dry weather. Table 2 shows the geometric average concentrations of the diverted bacteria and an estimated diverted load. For bacteria, geometric averages were calculated by multiplying all twelve individual sample values and then taking the twelfth root of the product. This was done for each reported category of bacteria (Total Coliform, Fecal Coliform and Enterococcus). Flow volume was calculated by determining the flow the occurred between August 6, 2007 and October 2, 2007 based upon the cumulative flow gage, then prorating this value over the AB411 year. Estimated Bacteria Loads were calculated by multiplying the flow volume by the geometric averages. Bacteria can exhibit rapid changes in population size, so these estimated loads should not be relied upon when determining bacterial concentrations in receiving waters.
Geometric Bacteria Concentrations (MPN/100 Ml)
Flow (Gallons) Flow (Ml)
Estimated Bacteria Loads (MPN)
Total Coliform 111,276 4.5E+09 5.0E+12Fecal Coliform 23,418 4.5E+09 1.1E+12Fecal Enterococcus 9,823 1.2E+06 4.5E+09 4.4E+11 Table 2) Flow Volume and Estimated Bacterial Loads to Sanitary Sewer During the 2007 AB411 year
3.3) Beach Mile Days Beach Mile Day data was downloaded from the BeachWatch website (http://beachwater.waterboards.ca.gov). A Beach Mile Day is a measure of shoreline water quality that takes both the geographical and temporal extent of water quality issues. Tabulated results for the shoreline monitoring stations located at the outfall of Avenue I Low Flow Diversion Project and the nearest stations on either side are presented below in Table 3.
Project 569 LFD Final Project Report February 2008
10
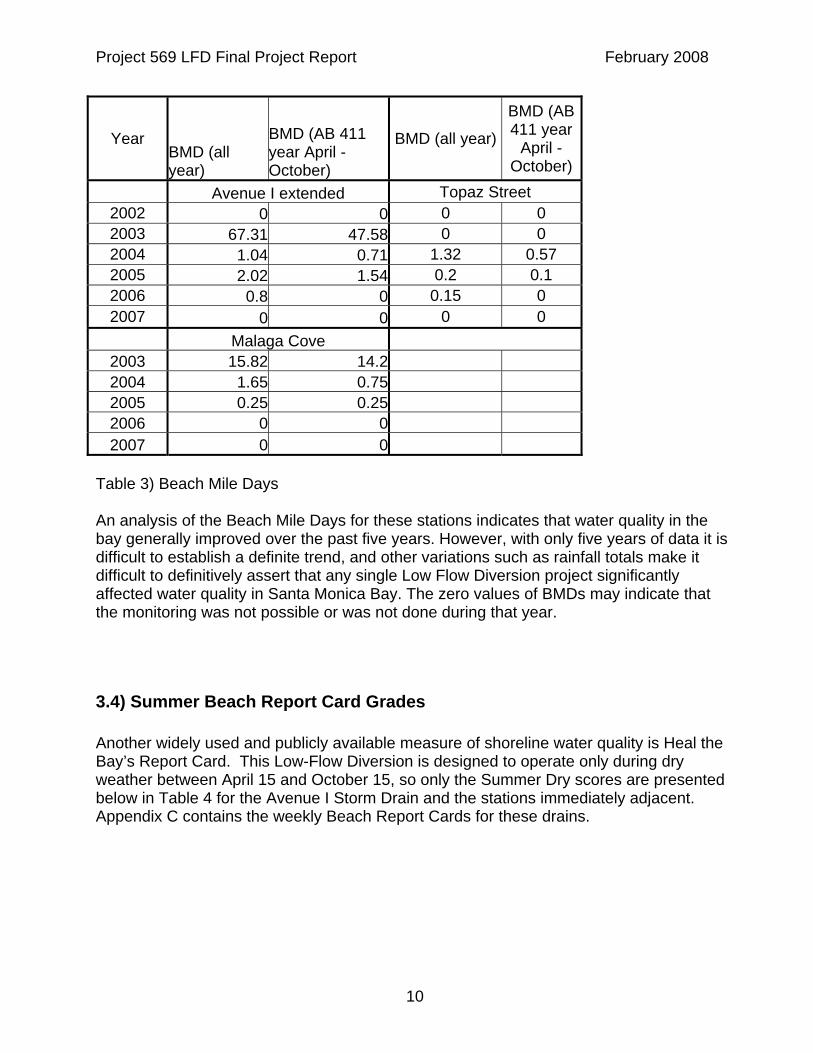
Table 3) Beach Mile Days An analysis of the Beach Mile Days for these stations indicates that water quality in the bay generally improved over the past five years. However, with only five years of data it is difficult to establish a definite trend, and other variations such as rainfall totals make it difficult to definitively assert that any single Low Flow Diversion project significantly affected water quality in Santa Monica Bay. The zero values of BMDs may indicate that the monitoring was not possible or was not done during that year.
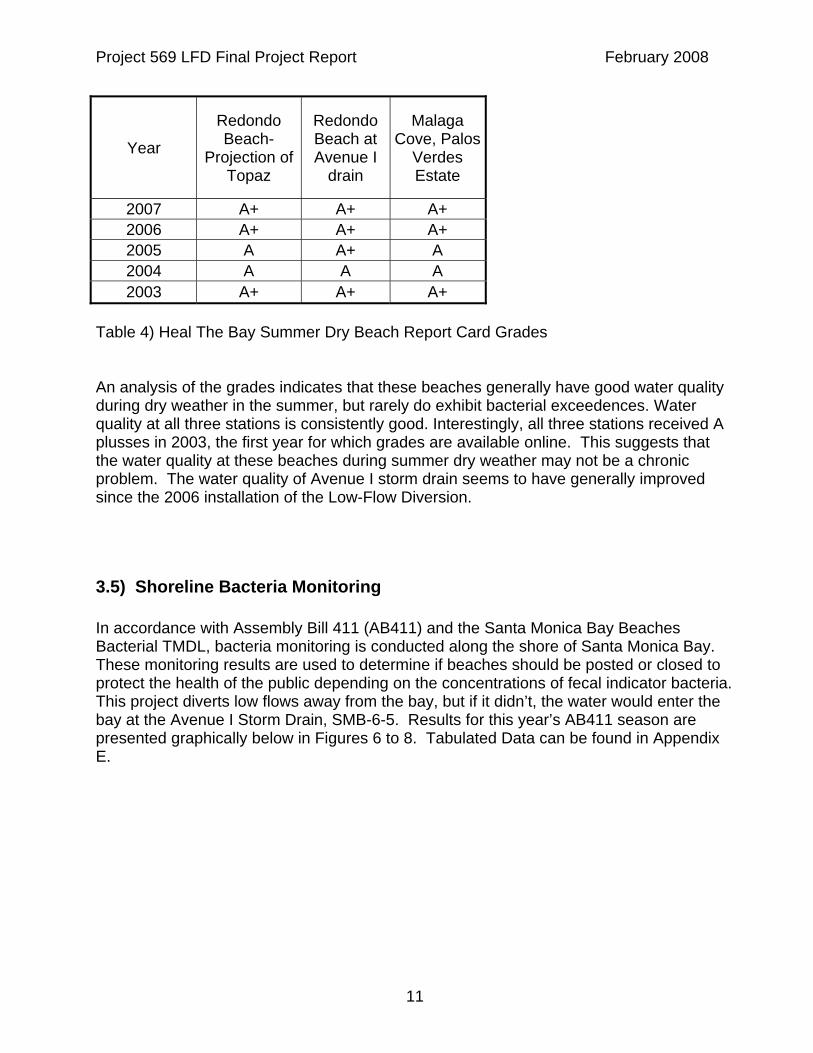
3.4) Summer Beach Report Card Grades Another widely used and publicly available measure of shoreline water quality is Heal the Bay’s Report Card. This Low-Flow Diversion is designed to operate only during dry weather between April 15 and October 15, so only the Summer Dry scores are presented below in Table 4 for the Avenue I Storm Drain and the stations immediately adjacent. Appendix C contains the weekly Beach Report Cards for these drains.
Year BMD (all year)
BMD (AB 411 year April - October)
BMD (all year)
BMD (AB 411 year
April - October)
Avenue I extended Topaz Street 2002 0 0 0 0 2003 67.31 47.58 0 0 2004 1.04 0.71 1.32 0.57 2005 2.02 1.54 0.2 0.1 2006 0.8 0 0.15 0 2007 0 0 0 0
Malaga Cove 2003 15.82 14.2 2004 1.65 0.75 2005 0.25 0.25 2006 0 0 2007 0 0
Project 569 LFD Final Project Report February 2008
11
Year
Redondo Beach-
Projection of Topaz
Redondo Beach at Avenue I
drain
Malaga Cove, Palos
Verdes Estate
2007 A+ A+ A+ 2006 A+ A+ A+ 2005 A A+ A 2004 A A A 2003 A+ A+ A+
Table 4) Heal The Bay Summer Dry Beach Report Card Grades An analysis of the grades indicates that these beaches generally have good water quality during dry weather in the summer, but rarely do exhibit bacterial exceedences. Water quality at all three stations is consistently good. Interestingly, all three stations received A plusses in 2003, the first year for which grades are available online. This suggests that the water quality at these beaches during summer dry weather may not be a chronic problem. The water quality of Avenue I storm drain seems to have generally improved since the 2006 installation of the Low-Flow Diversion.
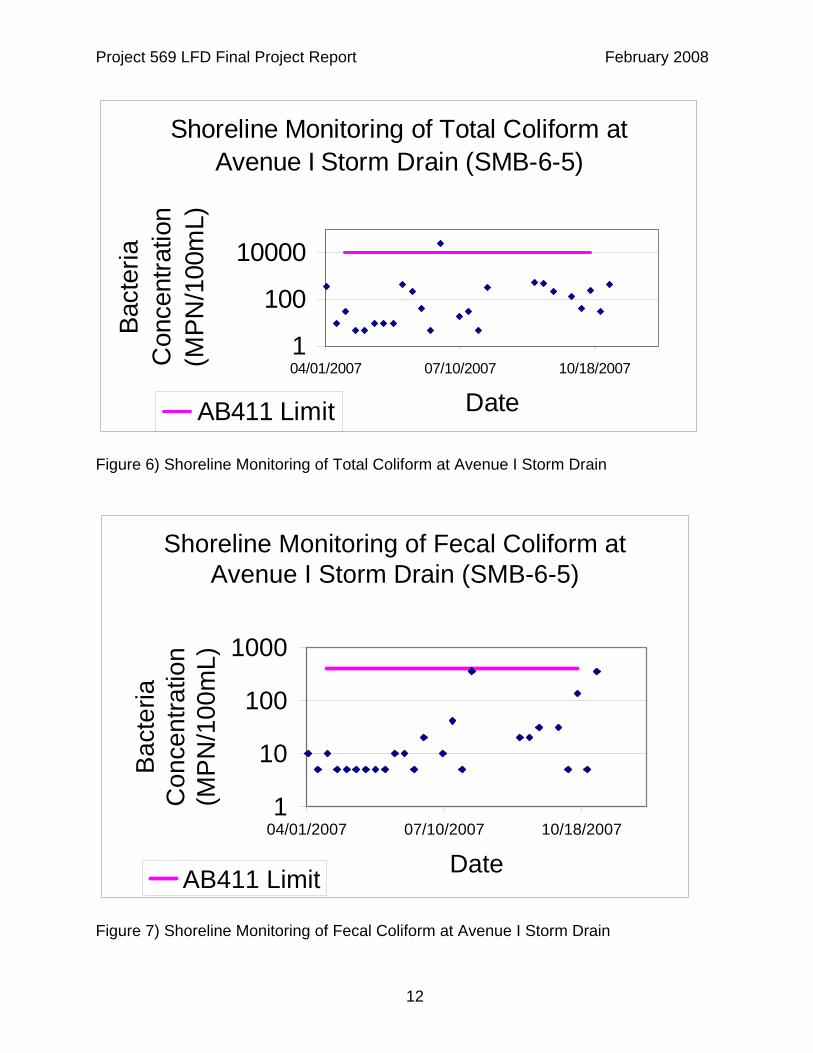
3.5) Shoreline Bacteria Monitoring In accordance with Assembly Bill 411 (AB411) and the Santa Monica Bay Beaches Bacterial TMDL, bacteria monitoring is conducted along the shore of Santa Monica Bay. These monitoring results are used to determine if beaches should be posted or closed to protect the health of the public depending on the concentrations of fecal indicator bacteria. This project diverts low flows away from the bay, but if it didn’t, the water would enter the bay at the Avenue I Storm Drain, SMB-6-5. Results for this year’s AB411 season are presented graphically below in Figures 6 to 8. Tabulated Data can be found in Appendix E.
Project 569 LFD Final Project Report February 2008
12
Shoreline Monitoring of Total Coliform at Avenue I Storm Drain (SMB-6-5)
1
100
10000
04/01/2007 07/10/2007 10/18/2007
Date
Bact
eria
C
once
ntra
tion
(MPN
/100
mL)
AB411 Limit
Figure 6) Shoreline Monitoring of Total Coliform at Avenue I Storm Drain
Shoreline Monitoring of Fecal Coliform at Avenue I Storm Drain (SMB-6-5)
1
10
100
1000
04/01/2007 07/10/2007 10/18/2007
Date
Bac
teria
C
once
ntra
tion
(MP
N/1
00m
L)
AB411 Limit
Figure 7) Shoreline Monitoring of Fecal Coliform at Avenue I Storm Drain
Project 569 LFD Final Project Report February 2008
13
Shoreline Monitoring of Enterococcus at Avenue I Storm Drain (SMB-6-5)
1
10
100
1000
04/01/2007 07/10/2007 10/18/2007
Date
Bac
teria
C
once
ntra
tion
(MP
N/1
00m
L)
AB411 Limit
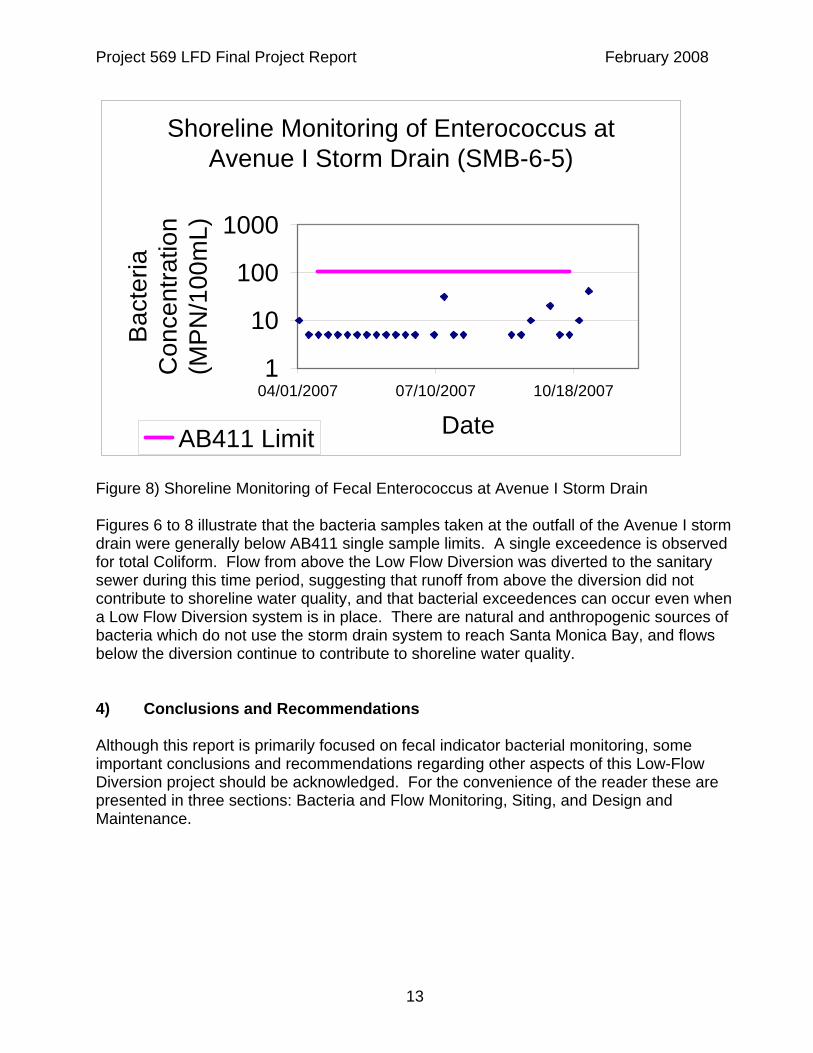
Figure 8) Shoreline Monitoring of Fecal Enterococcus at Avenue I Storm Drain Figures 6 to 8 illustrate that the bacteria samples taken at the outfall of the Avenue I storm drain were generally below AB411 single sample limits. A single exceedence is observed for total Coliform. Flow from above the Low Flow Diversion was diverted to the sanitary sewer during this time period, suggesting that runoff from above the diversion did not contribute to shoreline water quality, and that bacterial exceedences can occur even when a Low Flow Diversion system is in place. There are natural and anthropogenic sources of bacteria which do not use the storm drain system to reach Santa Monica Bay, and flows below the diversion continue to contribute to shoreline water quality. 4) Conclusions and Recommendations Although this report is primarily focused on fecal indicator bacterial monitoring, some important conclusions and recommendations regarding other aspects of this Low-Flow Diversion project should be acknowledged. For the convenience of the reader these are presented in three sections: Bacteria and Flow Monitoring, Siting, and Design and Maintenance.
Project 569 LFD Final Project Report February 2008
14
4.1) Bacteria and Flow Monitoring This project successfully diverted 1.2 million gallons of water to the sanitary sewer for treatment. The geometric seasonal average concentration of all indicator bacteria exceeded AB411 standards for the diverted water. Water quality in Santa Monica Bay seems to have generally improved during the summer dry weather in the last five years. Water quality at Avenue I Storm Drain generally seems to have been good for as long as records are available online, although occasionally exceedeences of AB 411 limits occur. These can most likely be attributable to a change in the watershed which may be transitory (construction, spill, tide borne fecal indicator bacteria of marine origin, etc.). This Low-Flow Diversion Project successfully diverts water that often contains bacteria in excess of public health standards into the sanitary sewer for treatment. However, it is difficult to determine if this has a significant effect on the water quality in Santa Monica Bay since the shoreline water quality near this project is improved but not significantly compared to the shoreline water quality before the project’s inception. Also, the drain is sanded in at the beach. Summer dry weather water quality near the Avenue I Storm Drain has been good since the completion of this project. However, steps should still be taken to prevent the degradation of current conditions including conducting source identification studies similar to the North Santa Monica Bay Source Identification Study conducted by the Los Angeles County Department Of Public Works and partnership with the Los Angeles County Department of Public Health, Heal the Bay and the Southern California Coastal Waters Research Program in the event that an exceedence is detected. Rapid identification of bacteria sources will allow for quick assessment of the threat and for the proper remedial measures to be taken.
4.2) Siting The Avenue I LFD is located near the intersection of Avenue I and Esplanade, in the city of Redondo Beach. Samples are collected from the manhole located on the southeast corner of the intersection, and the electrical panel is located on the northeast side of Avenue I. This project is in an urban area, near the beach. It is found in the right-of-way, however it is in a street parking zone, which facilitated maintenance and sampling. Working in traffic poses risks and hardships to maintenance staff and the traveling public that are both largely avoided in this project. An additional benefit is the avoidance of interagency red-tape which may delay access. The Avenue I LFD is typical of other nearby LFD projects. The nature of the watershed results in bacterial and sediment loads that are similarly characteristic of typical urban
Project 569 LFD Final Project Report February 2008
15
runoff. The outlet to the drain was again sanded in this year. These all tie into conclusions about the bacterial monitoring and design and maintenance. Although the water quality effects for this project are hard to determine, the siting of this project yielded some important lessons.
4.3) Design and Maintenance Construction of the LFD was completed in February 2006 and was operational February 16, 2006. The pumps were replaced in March of 2007. Other modifications have not been made since that time. The Avenue I LFD operates from April 1 until October 31, yearly, only during dry weather. There have been some rain gauge issues, because the gauge is located beneath a residential balcony. When water runs off this balcony, due to irrigation, cleaning, etc., the rain gauge is artificially triggered. This shuts the LFD pumps off, which have to be manually reset each time or the rain gauge will purge and reset the system, with time. Other than this, the LFD functions very well. Presently, inspection is performed on a weekly basis. Routine cleaning is done on an as needed basis to maintain the low flow diversion. Storm drain and well water sampling is done during the dry season, on a quarterly basis. If the system does not operate properly and at peak performance it will not comply with NPDES standards because of failure of telemetry, pumps, or electric control mechanisms, so equipment must be replaced or repaired if problems arise. Recalibration of flow meters is conducted annually. It has been observed that the electrical control panels are different on most every LFD installed by the County of Los Angeles. This makes it difficult to operate and maintain these systems since each LFD requires the development of specific training. This is a time intensive process which saps the resources of the Flood Control District. It is recommended that Design Division coordinate with Flood Maintenance and Operational Services Divisions at the field supervisor level to develop a single control panel system for use in all LFDs. This will streamline the design, construction and maintenance processes, saving time and taxpayer dollars. 5) Contact Information For questions regarding the Avenue I Storm Drain Pump Plant Low-Flow Diversion Project, please contact Mr. Mark Lombos, Associate Civil Engineer, of the Los Angeles County Department of Public Works, at 626 458 5197 or [email protected]. Questions specifically regarding the content of this monitoring report may be directed to Mr. John Merrifield, Associate Civil Engineer, of the Los Angeles County Department of Public Works, at 626 458 4361 or [email protected].
Project 569 LFD Final Project Report February 2008
16
6) References BeachWatch Beach Mile Days Reports, http://beachwatch.waterboards.ca.gov, accessed 10/14/2007. Heal the Bay Summer Report Cards, http://healthebay.org/brc/summer/default.asp, accessed 10/23/2007.
Project 569 LFD Final Project Report February 2008
17
Appendix A Bacterial Monitoring Data

Project 569 LFD Final Project Report February 2008
18
Appendix B Chains of Custody and Field Data Sheets
Project 569 LFD Final Project Report February 2008
19
Appendix C Beach Report Cards
Project 569 LFD Final Project Report February 2008
20
Appendix D Grant Documents and Project Photos
Project 569 LFD Final Project Report February 2008
21
Appendix E Shoreline Monitoring Results