final project report - caltrans - california department of · pdf file ·...
TRANSCRIPT

FinalProjectReportSJCOG2010‐11/2011‐12TransitInternshipGrant
We wish to acknowledge the support of the Federal Transit Administration, whose financial participation was essential to the success of this project. We also wish to acknowledge the support and assistance of Caltrans District 10 staff throughout this project.
TABLE OF CONTENTS
INTRODUCTION 1
ORGANIZATIONAL BENEFITS 2
INTERN BENEFITS 2
PROGRAM GOALS 3
SCOPE OF WORK 3
PROJECT OBJECTIVES AND ACCOMPLISHMENTS 3
COMPLETED TASKS AND DELIVERABLES 5
BEST PRACTICES AND LESSONS LEARNED 6
INTERN EVALUATION 7
INTERNSHIP WORK PRODUCTS APPENDIX A

1
SJCOG STUDENT INTERN REPORT
INTRODUCTION The San Joaquin Council of Government's (SJCOG) Internship Program provides invaluable transit planning experience and a first‐hand look into the professional atmosphere and broad‐range of planning activities undertaken. SJCOG’s Internship program readies students by integrating them into public outreach and consensus building efforts, research and analysis, report and grant preparation, and various Federal Transit Administration requirements. San Joaquin County is a rich and diverse region encompassing 1,489 square miles with seven incorporated cities and a total population of 689,480. San Joaquin County has been an attractive location for residents and businesses due to its affordability, strong agricultural and manufacturing industry, and an established goods movement system. San Joaquin County’s population is very ethnically and economically diverse and includes 181,629 households. Of those households, 134,768 are family homes, 40.5 percent of those had children under the age of 18 living with them, and 14.0 percent had a female householder with no husband present. Population density in SJC is 403 people/square mile; compared to the California average of 217.4 people/square mile. The racial makeup of the county is reasonably consistent with the statewide blend and includes numerous cultures with varying degrees of English proficiency and education. These factors coupled with the proximity to the larger job markets in the San Francisco Bay area and Sacramento results in approximately 31 percent of residents commuting to destinations external to the county. According to the 2000 Census Summary, approximately 21 percent of residents commute by non‐single occupant vehicle, including two percent by public transit. San Joaquin Regional Transit District remains the regional public transportation provided in San Joaquin County, but additional transit operators have begun or expanded service since the 2000 Census. Specifically, the Altamont Commuter Express (ACE) Rail added additional trains in 2001 for a total of three trains running between Stockton and San Jose; Manteca Transit initiated a two bus route system plus complimentary Paratransit service in 2006 and added a third route in 2010; and the City of Tracy initiated the Tracer fixed route service and Tracer Paratransit in 2001. As of 2008, transit ridership in San Joaquin County surpassed 6.7 million annual riders. The City of Lodi continues to operate the Grapeline fixed route system and Vineline dial‐a‐ride systems. The City of Escalon operates a single fixed route and complementary paratransit service.
1

2
ORGANIZATIONAL BENEFITS As the number of single occupant vehicles has increased, so has the transportation paradigm. Smart Growth development, sustainable transportation systems, and improved transit bus engine technology is paving the way for the new transportation paradigm. The public transit provider will play a significant role in the county’s future development. In order for the transit agencies to fulfill that role the availability of experienced professional planners is essential. Internship programs such as the SJCOG Internship program introduces the next generation of transit planners to the career opportunities in the field. Transit agencies in California have a difficult time recruiting experienced planning professionals. Additionally, we expect to be confronted with increased planner retirements within the next few years. Employment growth and increased population in San Joaquin County will continue to generate substantial travel. As a result, the region needs to employ adequately trained and experienced staff to improve efficiency and safety, to increase ridership and to expand transit services in an economical and efficient manner Internship programs have the propensity to provide a return in experienced planners joining agencies in which they performed internships. The SJCOG internship program has successfully transitioned interns into full‐time hires following graduation.
INTERN BENEFITS The SJCOG Internship Program provides college level candidates the opportunity to gain invaluable work experience with Regional Transportation Planning Agency. College curriculum often prepares students with the philosophical side of transportation planning, such as: of smart growth planning, sustainability, and climate change; but does not engage the student in day‐to‐day planning activities. The internship program expands the students’ knowledge base by integrating them into the day‐to‐day planning activities including, but not limited to: federal, state, and programming and funding requirements; Transportation Development Act requirements for transit; coordination between local and regional entities; and the interrelationship between land use and transportation planning at a regional level. The SJCOG Internship Program targets the University of the Pacific, San Joaquin Delta College, CSU Sacramento, CSU Stanislaus, and the University of California, Davis student bodies for potential candidates. With this grant, SJCOG hired two (2) part‐time equivalent interns (one each year) over the two‐year program schedule to gain on‐the‐job training and assist SJCOG staff in day‐to‐day planning duties. The interns completed a total of approximately 1,040 hours over the course of the internship. SJCOG solicits interest from students with major course work in the areas that typically become planners, such as: City Planning, Public Administration, Geography, Environmental sciences.

3
PROGRAM GOALS Internships emphasize the importance of Environmental Justice and Public Participation, preparing the interns to recognize that no group receives disproportionate burdens or benefits from transportation investment decisions, that the transportation system allows everyone to participate fully in society and assure that all communities have access to the region’s resources and that all communities have access to the region’s resources and that all residents have an equal opportunity to participate in the process. Student interns play a vital role in the outreach efforts as SJCOG does not have staff dedicated solely for the purposes of conducting outreach. All employees are cross‐trained in public speaking and generating consensus among interest groups.
SCOPE OF WORK Activities and deliverables prepared by the intern are incorporated in a variety of staff reports, planning studies, funding and policy making decisions. For example, the interns played a key role in the public outreach efforts for the FYs 2012/2013 and 2013/14 Unmet Transit Needs Process. The data gathered through the effort were presented to the SSTAC and Board through a written document, all of which the intern participated in.
PROJECT OBJECTIVES AND ACCOMPLISMENTS Task 1: Project Start‐Up
Objective: Develop intern selection criteria, form interview committee, establish candidate
mentors for intern, and develop work assignments.
Meet with Caltrans to review application
Distribute Job Announcement
Prepare meeting minutes from Candidate mentor and Work Assignment meetings
Task 2: Hire and Orient Interns
Objective: Develop intern selection criteria, form interview committee, establish candidate
mentors for intern, and develop work assignments.
Review Applications
Interview and select Intern
Intern orientation minutes

4
Task 3: Intern Program
Objective: Engage the Intern in a variety of professional planning activities related to public
outreach, transit planning and administration, regional coordination, federal
programming and funding requirements.
Participate in Unmet Transit Needs Outreach
Prepare FTA Concurrence Letters
Participate in Federal and State Programming Activities
Data Collection and Research
Prepare material and attend SJCOG Committee Meetings
Task 4: Final Evaluation
Objective: Assess the internship program framework and learning experience of the intern
Conduct Exit Interview
Assessment of Intern Performance
Intern orientation minutes
Task 5: Project Administration
Objective: Complete required contract management, grants administration, fiscal management/billing, and milestone reporting.
Executed Standard Agreement
Billing Requests/ Financial Reports
Quarterly milestone progress reports sent to Caltrans District Contract Manager
Task 6: Final Program Report
Objective: Document the SJCOG Internship Program framework, tasks and duties assigned to intern, benefit gained by intern and SJCOG staff, and lessons learned.
Final Program Report

5
PROJECT TASKS AND DELIVERABLES Transit Planning, Programming and Modeling The internship program expands the students’ knowledge base by integrating them into the
day‐to‐day planning activities including, but not limited to: federal, state, and programming and
funding requirements; Transportation Development Act requirements for transit; coordination
between local and regional entities; and the interrelationship between land use and
transportation planning at a regional level. SJCOG interns actively participated in a variety of
SJCOG transit planning efforts. A sample of the completed internship program deliverables are
contained in Appendix A: Internship Work Products. In addition, examples of the project work
tasks and efforts are listed below.
FYs 12/13 and 13/14 Unmet Transit Needs (UTN) Process
Intern researched and updated relevant sections of the UTN Report, including demographics, transit operator profiles and public hearing schedule.
Intern verified point of contact information for San Joaquin County Community Based
Organizations (CBOs), then developed and distributed UTN flyers alerting CBOs of the
UTN Outreach Process.
Intern prepared public outreach materials (flyers, handouts and invitation letters).
Intern collected, analyzed, and updated 2010 Census demographic for the UTN reports.
Data sets included employment, disability, income, availability of vehicles, and transit
dependent populations in San Joaquin County.
Intern updated narrative sections of the reports by reviewing and compiling comments
received during UTN Public Outreach Process
Transit Funding and Air Quality Programs
The intern collected and analyzed ten years of TDA claim data for six transit operators into an Excel database for ease of records retention. Information in the database consisted ridership, fare revenue, revenue miles, operating cost, and compliance with TDA performance measures.

6
Intern researched and compiled demographic and economic data to assist the City of
Stockton in applying of a San Joaquin Valley Air Pollution Control District grant.
Intern compiled five years of programmed projects and eligible funding sources from
transit operator to aid in the distribution of Prop 1B TSSSDRA funds.
Intern provided assistance in data collection for the transit chapter of the 2013 Regional
Transportation Plan (RTP) update. Efforts included updating transit capital and
operating projects, collecting 2010 Census demographic data, and updating descriptions
of the existing transit system.
Transit Modeling and Data Analysis
Intern analyzed existing SJCOG Travel Model to identify challenges and develop
solutions in related to modeling regional transit and travel activity.
Intern assisted in development of 2013 RTP draft growth scenarios; data collection and
research, transit and traffic modeling, and compiling transit capital and operating
projects.
Intern assisted staff with 2013 RTP Update public outreach process. Attended ad‐hoc
and SJCOG standing committee meetings to assist in presentation of public outreach
results.
Intern completed a project evaluation report detailing the process of analyzing the
existing SJCOG travel and transit model; report includes identification of existing
challenges in the model and provides solutions for more effective transit and travel
analysis.
BEST PRACTICES AND LESSONS LEARNED
The SJCOG internship program provided the students with valuable hands‐on work experience
with a Regional Transportation Agency. During their internship with SJCOG, the students were
actively engaged in the day‐to‐day activities related to planning, programming and

7
transportation modeling. Throughout the course of this project, a variety of best practices and
program tools were identified. These “lessons learned” were integrated as part of the project
training and education and further established as best practices for future SJCOG internship
programs. Examples of these practices include:
Task and Project Ownership—allowing the interns the opportunity to play a key role in the
development and delivery of their working projects provided learning opportunities in project
leadership, interagency coordination, and effective management of competing deadlines.
Ongoing Active Communication—the project highlighted the value of actively seeking feedback
and input from the interns regarding their roles and responsibilities. This practice kept the
interns actively engaged in their projects and encouraged them to take a leadership role in
moving their projects forward. It also served as a valuable coaching and mentoring tool when
projects were subject to challenges and delays.
Continuing Education and Training—the interns were exposed to education and training
opportunities throughout the course of this project. This served as a valuable tool that allowed
the interns to gain important real‐world work experience that will further their professional
development. Training included public speaking, interpersonal communication skills, creating
dialogues with a diversity of community groups, public outreach and group presentations, and
generating consensus among interest groups. The interns also were presented with valuable
training in program task management, budgeting, task schedules and deadlines, and
overcoming challenges to project completion.
Mentoring—one of the most valuable lessons of this project was the importance of mentoring
and professional development. SCJOG project staff served as mentors for the interns, providing
valuable training in professional development while fostering a positive work atmosphere for
both personal and professional goal achievement. This served as a learning opportunity for
both the interns and SJCOG staff.
INTERN EVALUATION
As part of the completion of the SJCOG transit internship program interns are required to
provide feedback to SJCOG on their overall experience including highlights of benefits gained
and areas of opportunity for continued development. The feedback provided by both of
SJCOG’s transit interns noted that the experience at SJCOG as an intern broadened their view of
what a Metropolitan planning organization (MPO) really does as a public agency. Though their
scholastic backgrounds were focused on civil engineering, the interns found that there were
8
many similarities as well as differences in the world of an MPO. The traffic modeling aspect
was recognized as very similar to the design programs that most engineers are trained under
such as AutoCAD. This included the fact that a lot of time and precision goes into designing
scenarios and modifying the model in order to get the results that are desirable and accurate.
During one internship, a large amount of the intern’s focus stayed within the transit modeling
area in order to be able to assist with the design of the Regional Transportation Plan (RTP). This
included but was not limited to incorporating current and future transit projects that would be
implemented within the next 30 years, working with the Regional Transit District (RTD) in order
to update current transit lines and future routes into the model, as well working with the
models outputs in order to determine the sensitivity of the model’s Green House Gases (GHG).
Overall, the interns noted that the internship proved to be one of the best and most
informative experiences of their current professional development. This experience was
enough to influence one intern to switch their career focus as a civil engineer to a regional
planner.
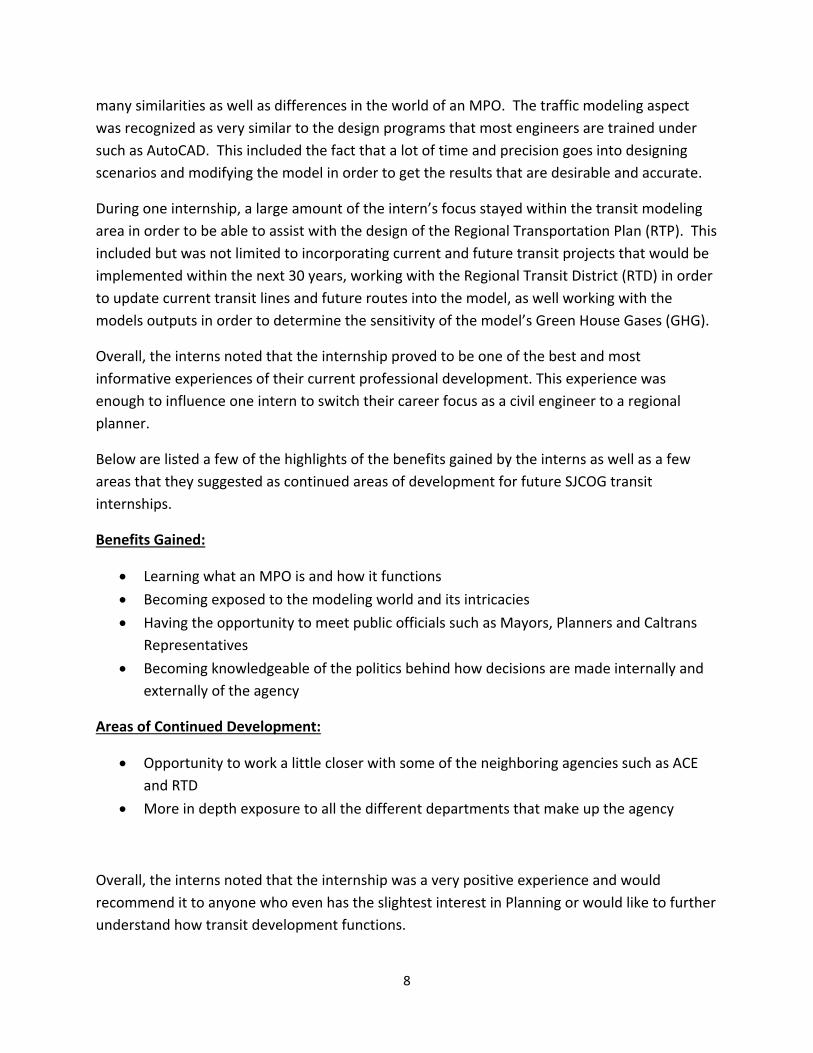
Below are listed a few of the highlights of the benefits gained by the interns as well as a few
areas that they suggested as continued areas of development for future SJCOG transit
internships.
Benefits Gained:
Learning what an MPO is and how it functions
Becoming exposed to the modeling world and its intricacies
Having the opportunity to meet public officials such as Mayors, Planners and Caltrans
Representatives
Becoming knowledgeable of the politics behind how decisions are made internally and
externally of the agency
Areas of Continued Development:
Opportunity to work a little closer with some of the neighboring agencies such as ACE
and RTD
More in depth exposure to all the different departments that make up the agency
Overall, the interns noted that the internship was a very positive experience and would
recommend it to anyone who even has the slightest interest in Planning or would like to further
understand how transit development functions.

APPENDIX A:
INTERNSHIP WORK PRODUCTS

FY 12‐13 Unmet Transit Needs Report
Chapters 1, 2 and 4

CHAPTER 1 INTRODUCTION
3BRequirements
Each year, pursuant to state law, the San Joaquin Council of Governments (SJCOG) must identify
any unmet transit needs that may exist anywhere in San Joaquin County. If needs are found, a
further determination must be made as to whether or not those needs are reasonable to meet.
State law, as presented in the Transportation Development Act (TDA)F
1F, requires SJCOG to ensure
that reasonable needs are met before Local Transportation Funds (LTF) are allocated for non-
transit purposes.
In conducting the annual transit needs assessment, SJCOG's role is to perform the following:
1. Ensure that several factors have been considered in the planning process, including size
and location of groups likely to be dependent on transit, adequacy of existing services,
and potential alternative services and service improvements that could meet all or part of
the travel demand.
2. Hold a public hearing to receive testimony on unmet needs.
3. Determine definitions for "unmet transit needs" and "reasonable to meet."
4. Adopt a finding regarding unmet transit needs and allocate funds to address those needs,
if necessary, before street and road allocations.
The required information must be documented and submitted to the State Department of
Transportation. It is the intent of this report to provide evidence that SJCOG complied with the
actions required by law.
19BBackground: UUnmetU Transit Needs History
Unmet transit needs became a consideration in 1978 when the TDA was changed to require a
specific transit finding before allocation of local TDA funds for other non-transit purposes. Since
that time, SJCOG has conducted surveys, presentations, mailers, studies, and annual hearings to
identify needs, and to determine the reasonableness of funding new or alternative services.
Even though SJCOG's Unmet Transit Needs findings are made on an annual basis, the assessment
process is ongoing. To further the public participation process, SJCOG requests that each
member agency hold at least one public hearing on transit needs. The San Joaquin Regional
Transit District (RTD) sponsors a series of public hearings throughout the Stockton Metropolitan
Area and unincorporated areas of San Joaquin County.
SJCOG has adopted definitions regarding "Unmet Transit Needs" and "Reasonable to Meet"
unmet transit needs. Refer to Appendix B for minutes from the October 26, 2006 SJCOG Board 1 Transportation Development Act, Statutes and California Codes of Regulations, California Department of
Transportation Division of Mass Transportation, March 2009

of Directors meeting documenting the approval of changes to the Unmet Transit Need Definitions.
20BDetermination of Reasonable to Meet UUnmetU Transit Needs
Currently, there are two (2) tests that need to be applied before the SJCOG Board of Directors
can determine that an Unmet Transit Need is considered reasonable to meet. First, the Board has
to make a finding that there is indeed an unmet transit need, regardless of what means are
necessary to meet it. Second, once the need is identified, a quantifiable assessment of reason-
ableness must be performed.
The assessment involves applying the potential transit service to the set of criteria included in the
“Reasonable to Meet” definition. The assessment involves comparing the additional service to
existing services provided by the transit operator. If the additional service meets all of the
criteria identified in the reasonable to meet definition, the unmet transit need would be deemed
reasonable to meet. TDA funds for that jurisdiction would need to be set aside to meet that need.
21BDefinitions
The TDA does not clearly define "Unmet Transit Needs" and "Reasonable to Meet." However, the
Transportation Development Act does state, "The fact that an identified transit need cannot be
fully met based on available resources shall not be the sole reason for finding that a transit need
is not reasonable to meet."
The following definitions were approved by the SJCOG Board of Directors at their October 26,
2006 Board Meeting. The definitions were developed by a subcommittee composed of members
from the Social Services Transportation Advisory Committee (SSTAC). The SSTAC felt the prior
definitions, which were adopted in 2005, did not completely serve the transit dependent
community, and that the new definitions accommodate the transit dependent more efficiently.
50BDefinition of Unmet Transit Needs
The following definition was approved by the SJCOG Board in October 2006:
UNMET TRANSIT NEEDS are defined as transportation services not currently provided to those
residents who use or would use public transportation regularly, if available, to meet their life
expectations. This includes, but is not limited to: trips for medical and dental services, shopping,
employment, personal business, education, social services, and recreation.
Persons representing various social service agencies with additional input from transit operators
first developed the framework of this definition. The definition was then modified and approved
in October 2006, after a recommendation was made by the Social Services Transportation
Advisory Committee. The committee felt that this modified version would better serve the transit
dependent community.

51BDefinition of “Reasonable to Meet” Unmet Transit Need
Parameters for “reasonable to meet” were identified in a similar manner. Social service agency
representatives, transit operators and public officials felt that:
1. Persons should have an equal opportunity to provide themselves with the necessities to
sustain life;
2. Any transportation system should be based on the feasibility of a continuing service;
3. Any transportation system must enjoy some degree of community acceptance;
4. A transportation system must not prove excessive in capital and operating costs;
5. A transportation system should be provided when a need is demonstrated; and,
6. Any service provided should be able to be funded on both a short and long-term basis.
System performance, economy, equity, and available funding are considered when defining
"reasonable to meet," as noted in the above statements. Any of these factors may be used to
support or deny a finding of "reasonable to meet." If, based on these factors, reasonable needs
are suspected; then SJCOG's formally adopted definition is employed:
An unmet transit need that meets the definition above [definition of unmet transit need] and meets
all of the following criteria shall be considered reasonable to meet:
1. Community Acceptance – There should be a demonstrated interest of citizens in the new
or additional transit service (i.e. multiple comments, petitions, etc.).
2. Equity – The proposed new or additional service will benefit the general public, residents
who use or would use public transportation regularly, the elderly population, and persons
with disabilities.
3. Potential Ridership – The proposed transit service will maintain new service ridership
performance measures, as defined by the Social Services Transportation Advisory
Committee (SSTAC).
4. Cost Effectiveness – The proposed new or additional transit service will not affect the
ability of the overall system to meet the applicable Transit Systems Performance
Objectives or state farebox ratio requirement after exemption period, if the service is
eligible for the exemption. The Transit Systems Performance Objectives are defined as 1)
operating cost per revenue hour, 2) passengers per revenue hour, and 3) subsidy per
passenger. If the exemption is not used, the service must meet minimum applicable Transit
Systems Performance Objectives or farebox ratio return requirements as stated in the TDA
statutes. Cost effectiveness is not applicable to transit services operating within an
exemption period.
5. Operational Feasibility – The system can be implemented safely and in accordance with
local, state, and federal laws and regulations.
6. Funding – The imposed service would not cause the claimant to incur expenses in excess

of the maximum allocation of TDA funds.
Within the definition, an unmet transit need cannot be found unreasonable solely based upon
economic feasibility.
If the unmet need is indeed found reasonable to meet, then the unmet transit need shall be funded
before any allocation is made for streets and roads within the jurisdiction.
Within these parameters, the seven presently operating TDA-subsidized public transit systems in
San Joaquin County fall into seven categories defining transit system types as shown in Table 1.
Table 1 Transit Systems in San Joaquin Region, By System Type
System Type
Public Transit System
1) Interregional Transit
San Joaquin Regional Transit District (RTD)
2) Intercity Transit
RTD
3) Urban Fixed Route
RTD
4) Small Urban (population 50,000 -
200,000)
Lodi GrapeLine Lodi Dial-A-Ride Tracy Tracer Tracy Tracer Paratransit Manteca Transit Manteca Transit Dial-A-Ride
6) Rural
Escalon eTrans Ripon RTD - General Public Dial-a-Ride
7) Non-Taxi Paratransit (not general public) Dial-A-Ride
RTD - SMA ADA Dial-a-Ride Lodi VineLine
22B
Allocation Process
The SJCOG Board of Directors must adopt a finding for the area of each Local Transportation
Fund claimant, after consideration of all available information, including information presented at
the public hearings. This finding can have three outcomes:
1. There are no unmet transit needs;
2. There are unmet transit needs that are considered not reasonable to meet; or,
3. There are unmet transit needs that are considered reasonable to meet.
Reference must be made to the definitions adopted and the efforts undertaken in the planning
process to identify transit dependent groups and service improvements. In addition, these needs

are not to be compared with transit system operational issues and street and road needs when
making a determination of transit needs that are reasonable to meet.
After the determination is made for the area of each claimant, SJCOG may allocate funds to the
claimant based on the following:
1. Some or all for transit purposes;
2. Some or all to be held in reserve; or,
3. Some or all for roads, streets, and other purposes.
These allocation options depend upon the specific determination made for each claimant area. If
a finding is made that a need exists and that it is reasonable to meet, some funds must be
allocated for transit before any funds are allocated for streets and roads.

CHAPTER 2 DEMOGRAPHIC INFORMATION
4BTransit Dependent Groups
Per the Transportation Development Act, Unmet Transit Needs findings must include an annual
assessment of the size and location of identifiable groups likely to be transit dependent. Including
but not limited to, the elderly, the disabled, including individuals eligible for paratransit and other
special transportation services pursuant to Section 12143 of Title 42 of the United States Code,
and persons of limited means, including, but not limited to, recipients under the CalWORKs
program.
For the purposes of this document:
Elderly are considered to be individual’s age 65 years old and older.
The terms "disability" refers to persons who because of physical or mental impairment are
unable to drive automobiles or use public transit which is not specifically tailored to meet
their needs.
Persons of limited means are considered having incomes below the poverty threshold as
defined by the federal government.
23BDemographic Data - Charts and Highlights
The determination of the size and location of identifiable groups likely to be “transit dependent”
is based on 2010 Census data, where available, the American Community Surveys, 2000 Census,
and other pertinent data. The demographic data relevant to determining unmet transit needs in
San Joaquin County is presented in the form of tables and maps.
The American Community Survey replaced the decennial census long form in 2010. The long-form
previously collected decennially, will now collect detailed questions about socioeconomic and
housing characteristics on an annual basis. The function of the decennial census will be to provide
counts of people for the purpose of congressional apportionment and legislative redistricting. The
primary purpose of the ACS is to measure the changing social and economic characteristics of the
U.S. population. The use of the ACS data in this chapter will provide “snapshots” of our region’s
socioeconomic characteristics. The decision to select one-year, three-year, or five-year ACS
“snapshots” is dependent on whether the intent is to reflect the most current data (e.g., one-year
ACS) or a statistically more accurate “snapshot” (e.g., lower margin of error) over a larger period
of time.
In this chapter, Tables 2 and 3 present an overview of population growth in San Joaquin County.
Figure 1 illustrates graphically how the population is dispersed throughout the incorporated and
unincorporated areas in San Joaquin County.

The most rapid population increases between the 2000 and 2010 Census have occurred primarily
in the southern portion of San Joaquin County in proximity to the I-205 and SR-120 corridors. The
City of Lathrop experienced a 72% increase in population from 2000 to 2010 while the Cities of
Manteca, Ripon, and Tracy experience growth of approximately 40% during the same period.
Not evident from the data, but important in terms of eligibility for receiving Federal Transit
Administration (FTA) 5307 funding, the cities of Tracy and Lodi exceeded 50,000 people in FY
02/03. The City of Manteca exceeded 50,000 in FY 04/05. As a result, each of these cities are
now considered an urbanized area and are eligible for (FTA) 5307 funds for planning, capital,
and operating assistance for their public transit system.
Population forecasts suggest that the Tracy and Manteca Planning Area populations will exceed
100,000 by the year 2020 and 2030, respectively. Pursuant to Senate Bill 716 (enacted 2009),
cities with a population of 100,000 or more within a county that has a population of 500,000 or
more will be required to expend 100% of the Local Transportation Funds (LTF) apportionment for
public transit purposes. The California Department of Finance annual city and county population
estimates will be used to identify when the population threshold has been met. SB 716 represents
a fundamental change in the manner in which public transit will be financed in the future.
Table 2
Total Population and Percent Change
Sources: 1 2000 and 2010 U.S. Census Bureau
Planning
Area
Pop.
20001
Pop.
20101
% Change 2000-2010
% Annual Change
2000-2010 Stockton City 243,771 291,707 19.7% 2.0% Lodi City 56,999 62,134 9.0% 0.9% Manteca City 49,258 67,096 36.2% 3.6% Tracy City 56,929 82,922 45.7% 4.6% Escalon City 5,963 7,132 19.6% 2.0% Ripon City 10,146 14,297 40.9% 4.1% Lathrop City 10,445 18,023 72.6% 7.3% Total Incorp. 433,511 543,311 25.3% 2.5% Total Unincorp. 130,087 141,995 9.1% 0.9% County Total 563,598 685,306 21.59% 2.2%
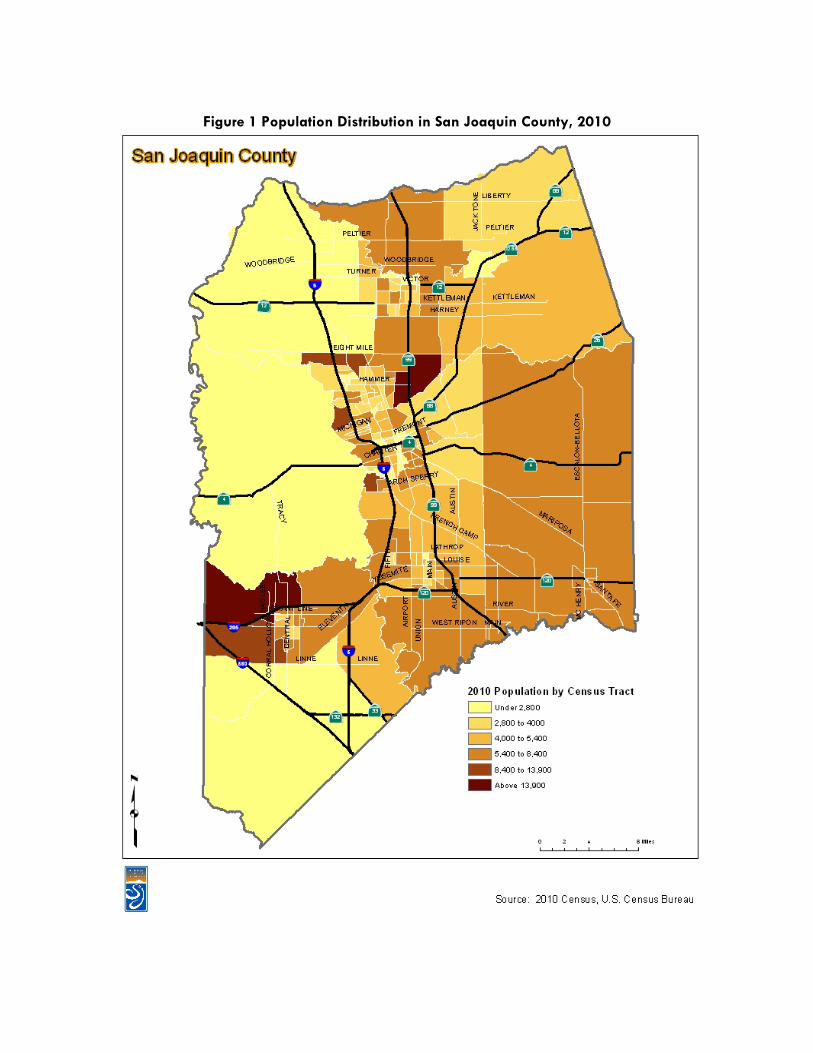
Figure 1 Population Distribution in San Joaquin County, 2010
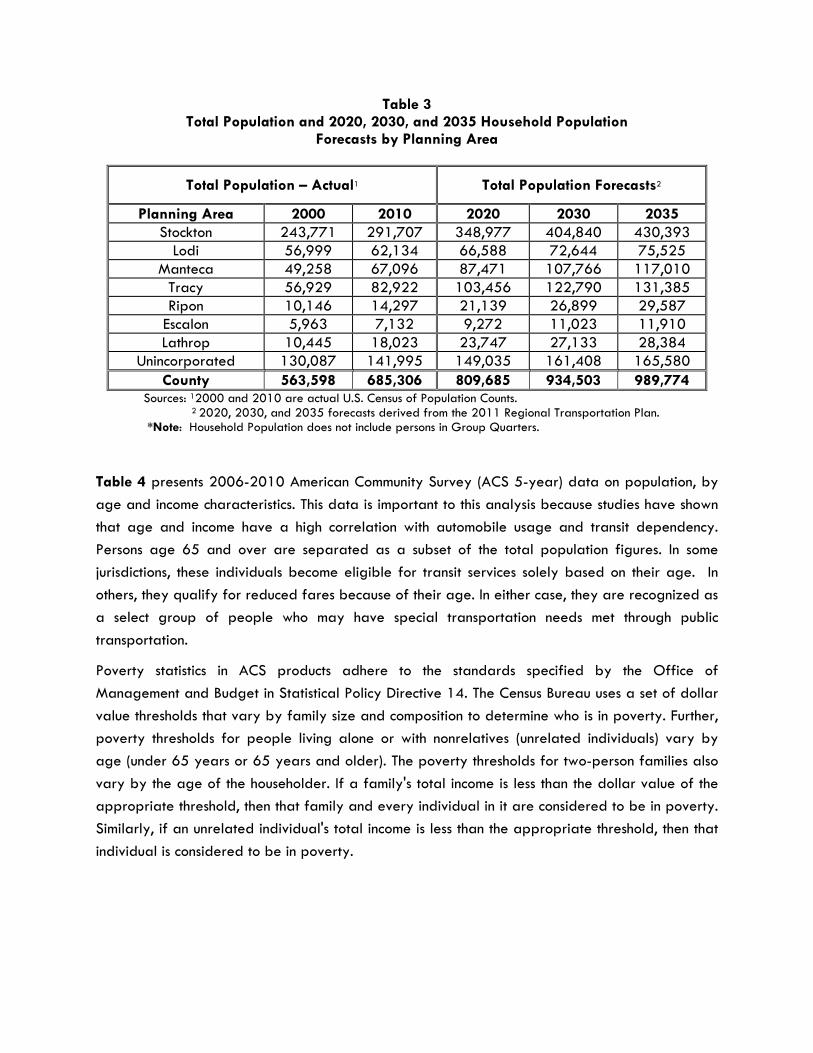
Table 3 Total Population and 2020, 2030, and 2035 Household Population
Forecasts by Planning Area
Total Population – Actual1 Total Population Forecasts2
Planning Area 2000 2010 2020 2030 2035 Stockton 243,771 291,707 348,977 404,840 430,393
Lodi 56,999 62,134 66,588 72,644 75,525 Manteca 49,258 67,096 87,471 107,766 117,010
Tracy 56,929 82,922 103,456 122,790 131,385 Ripon 10,146 14,297 21,139 26,899 29,587
Escalon 5,963 7,132 9,272 11,023 11,910 Lathrop 10,445 18,023 23,747 27,133 28,384
Unincorporated 130,087 141,995 149,035 161,408 165,580 County 563,598 685,306 809,685 934,503 989,774
Sources: 12000 and 2010 are actual U.S. Census of Population Counts. 2 2020, 2030, and 2035 forecasts derived from the 2011 Regional Transportation Plan.
*Note: Household Population does not include persons in Group Quarters.
Table 4 presents 2006-2010 American Community Survey (ACS 5-year) data on population, by
age and income characteristics. This data is important to this analysis because studies have shown
that age and income have a high correlation with automobile usage and transit dependency.
Persons age 65 and over are separated as a subset of the total population figures. In some
jurisdictions, these individuals become eligible for transit services solely based on their age. In
others, they qualify for reduced fares because of their age. In either case, they are recognized as
a select group of people who may have special transportation needs met through public
transportation.
Poverty statistics in ACS products adhere to the standards specified by the Office of
Management and Budget in Statistical Policy Directive 14. The Census Bureau uses a set of dollar
value thresholds that vary by family size and composition to determine who is in poverty. Further,
poverty thresholds for people living alone or with nonrelatives (unrelated individuals) vary by
age (under 65 years or 65 years and older). The poverty thresholds for two-person families also
vary by the age of the householder. If a family's total income is less than the dollar value of the
appropriate threshold, then that family and every individual in it are considered to be in poverty.
Similarly, if an unrelated individual's total income is less than the appropriate threshold, then that
individual is considered to be in poverty.

Table 4 Age and Income, Year 2010
Planning Areas
Population 20101
Persons: age 65+
% total population
Persons: Low Income2
% total population
Persons: age 65+ &
Low Income2 %
Stockton 281,231 25,838 9.19 55,807 19.84 2,699 0.96 Lodi 61,630 8,796 14.27 9,762 15.84 1,231 2.00
Manteca 64,600 5,600 8.67 5,897 9.13 284 0.44 Tracy 78,802 4,815 6.11 8,170 10.37 411 0.52
Escalon 7,054 942 13.35 633 8.97 119 1.69 Ripon 13,769 1,486 10.79 1,472 10.69 78 0.57
Lathrop 16,922 1,107 6.54 1,406 8.31 151 0.89
Total Incorp. 524,008 48,584 9.27 83,147 15.87 4,973 0.95
Total Unincorp. 133,586 16,782 12.56 22,355 16.73 1,332 1.00
County Total/Average 657,594 65,366 9.94 105,502 16.04 6,305 0.96
Source: 1 U.S. Census Bureau, 2006-2010 American Community Survey. 2 Poverty status is determined by comparing annual income to a set of dollar values called poverty thresholds that vary by family size, number of children and age of householder. If a family's before tax money income is less than the dollar value of their threshold, then that family and every individual in it are considered to be in poverty. For people not living in families, poverty status is determined by comparing the individual's income to his or her poverty threshold. The poverty thresholds are updated annually to allow for changes in the cost of living using the Consumer Price Index (CPI-U). They do not vary geographically.
The 2006-2010 ACS data reflects that approximately 10 percent of San Joaquin residents are
over 65, approximately 16 percent of residents are of low income, and that approximately one
percent of all residents are over 65 and of low income. 53 percent of San Joaquin County
residents age 65 years or older live in either the Stockton or Lodi planning areas, while 27
percent live in the unincorporated areas of the county. In 2010, the following represents the
percentage of people age 65 or older in each planning area in relationship to the County total
population of people age 65 or older:
1. Stockton City 39.5% 2. Lodi City 13.5% 3. Manteca City 8.6% 4. Tracy City 7.4% 5. Escalon City 1.4% 6. Ripon City 2.3% 7. Lathrop City 1.7% 8. Unincorporated Area 25.7%
Figure 2 illustrates graphically how the 65 and older population is dispersed through the incorporated and unincorporated areas of San Joaquin County.

Table 4 also indicates that the Cities of Lodi, Escalon, and Ripon have the largest percentage of residents 65 and older in relationship to the jurisdictions total population.
1. Stockton City 9.2% 2. Lodi City 14.3% 3. Manteca City 8.7% 4. Tracy City 6.1% 5. Escalon City 13.4% 6. Ripon City 10.8% 7. Lathrop City 6.5% 8. Unincorporated Area 9.3%
While the 65 and above population in the cities of Lodi, Escalon, Ripon represent only 17 percent of the elderly population, the elderly population within these cities comprises approximately 39 percent of their elderly population. The 2006-2010 ACS data also reflects, over 62% of all low income people live in either the Stockton or Lodi planning areas while 21% live in unincorporated areas of the county. In 2010, the following represents the percentage of low income people within each planning area in relationship to the County low income population total:
1. Stockton City 52.9% 2. Lodi City 9.3% 3. Manteca City 5.6% 4. Tracy City 7.7% 5. Escalon City 0.6% 6. Ripon City 1.4% 7. Lathrop City 1.3% 8. Unincorporated Area 21.2%
There are 2,699 low-income seniors living in Stockton. This represents 42.8% of all low-income seniors in San Joaquin County. Outside of Stockton, there is a relatively high concentration of low-income seniors in the unincorporated areas of the county (21.1%) and the City of Lodi (19.5%). The countywide average percentage of low-income seniors is 0.96%. Figure 3 presents population pyramids for each jurisdiction within San Joaquin County. Figure 3a, San Joaquin County Age by Gender (2010) provides a reference point for jurisdictional comparison.

Figure 2 San Joaquin County Population 65+
Manteca
Lathrop

Figure 3 Age By Gender Source: 2010 U.S. Census
8.53%8.45%8.74%9.02%
7.49%6.95%6.50%6.53%6.73%6.85%6.32%5.21%4.23%2.88%2.02%1.48%1.11%0.97%
7.78%7.89%8.00%8.28%
6.97%6.73%6.62%6.70%6.63%6.84%6.30%
5.49%4.46%
3.30%2.40%1.97%1.70%1.93%
‐10 ‐9 ‐8 ‐7 ‐6 ‐5 ‐4 ‐3 ‐2 ‐1 0 1 2 3 4 5 6 7 8 9 10
0‐45‐9
10‐1415‐1920‐2425‐2930‐3435‐3940‐4445‐4950‐5455‐5960‐6465‐6970‐7475‐7980‐8485+
Percent of Population
Age
San Joaquin County, CA Population by Age & Gender (2010)
% Female
% Male


Table 5 provides data on individuals with disabilities by gender and age. This information is
from the 2008-2010 ACS data includes non-institutionalized persons, age 5 and older, who have
a "disability." Individuals were asked if they, or others in the household, had a health condition
that has lasted for 6 or more months which makes it difficult to go outside of the home alone.
Persons that have such a difficulty as a result of a health condition are said to have a mobility
limitation. Increased public transportation would be an asset to those who have a mobility
limitation.
Table 5 Gender By Age By Disability
San Joaquin County Estimate % over
total San Joaquin
County Estimate % over
total Total: 667,821 Total: 667,821
Male: 329,255 49.3 Female: 338,566 50.7
Under 5 years: 28,048 8.52 Under 5 years: 26,562 7.85
With a disability 233 0.04 With a disability 135 0.02
No Disability 27,815 4.17 No Disability 26,427 3.96
5 to 17 years: 74,782 22.7 5 to 17 years: 71,000 18.3
With a disability 3,799 0.57 With a disability 2,910 0.44
No Disability 70,983 10.6 No Disability 68,090 10.2
18 to 64 years 197,076 59.9 18 to 64 years 202,653 59.0
With a disability 22,838 3.42 With a disability 22,036 3.30
No Disability 175,238 26.2 No Disability 180,617 27.0
65+ 29,349 8.91 65+ 38,351 11.33
With a disability 11,446 1.71 With a disability 16,630 2.49
No Disability 17,903 2.68 No Disability 21,721 3.25
Total Male Population with Disability*
21,038 6.39 Total Female Population with Disability*
22,036 6.51
Total Population with Disability*
43,874 6.67
Source: U.S. Census Bureau 2008-2010 American Community Survey-3 Year *Totals of age 18 to 64.

Table 6 expands on the number of individuals in San Joaquin County between the ages of 18 and 64 by their disability and employment status. The 2008-2010 ACS data identifies that 399,729 residents are between the ages of 18 and 64 and that approximately 43,874 (11 percent) have a disability. Of those with a disability, 28 percent are employed, 10 percent are unemployed, and 62 percent are not in the workforce. Those residents without a disability make up 89 percent of those between the ages of 18 and 64. Of this group 69 percent are employed, 11 percent are unemployed, and 10 percent are not in the workforce.
Table 6 Employment Status By Disability
Total
Population 18 to 64 years 399,729 With a Disability 43,874
Employed 12,631 Unemployed 4,235 Not in Labor Force 27,008
No Disability 355,855 Employed 246,306 Unemployed 39,488 Not in Labor Force 70,063
Source: U.S. Census Bureau 2008-2010 American Community Survey-3 Year
SJCOG's definition of transit dependent focuses on individuals who, by virtue of their age,
income, or disability, are not adequately served by the automobile. Information from the last
available version of a summary from Caltrans entitled “Travel and Related Factors in California”
was used as a foundation for identifying the incidence of individuals that are transportation-
dependent.
According to the California Department of Motor Vehicles (DMV), in 2000 there were 331,333
driver licenses issued to San Joaquin County. This number represents approximately 81 percent
of the population age 16 years and older. This means that approximately 19 percent of eligible
drivers in San Joaquin County did not have a driver's license. In 2010, there were 401,985
licensed drivers, approximately 79 of the population 16 and older. The percentage of eligible
drivers that do not have driver’s licenses increased from 19 percent in 2000 to 21 percent in
2010. This differs from the 1990 to 2000 trend in which the number of eligible drivers that did
not have a driver’s license decreased from 27 percent to 19 percent. The information is outlined
in Tables 7 and 8 and Figures 4 and 5 displays this trend.
Overall, this information reflects the slight decrease in licensed drivers. The decrease could be
contributed to many factors such as birth and death rate, changes in family income, disabled
individuals, migration of residents in or out of the county, or the availability of public
transportation. Ultimately, the need for more public transportation continues to be necessary.

Table 7 Licensed Drivers in San Joaquin County
Age 2000
Population1 Number of
Drivers Licenses2
Percent of Population
2010 Population3
Number of Drivers
Licenses4
Percent of Population
0 – 15 155,044 0 0.0% 178,128 0 0.0% 16 + 408,554 331,333 81.1% 507,178 401,985 79.9% All 563,598 331,333 58.8% 685,306 401,985 58.7%
Source: 1 2000 Census of Population for age groups. 2 Community Indicators of Alcohol and Drug Abuse Risk, San Joaquin County 2004, Center for Applied
Research Solutions (CARS), Inc. 3 2010 U.S. Census Bureau 4 Drivers License Outstanding by County as of December 31, 2010, California Department of Motor
Vehicles
Table 8 Estimate of San Joaquin Residents without a Driver’s License Year 2010
Population of San Joaquin County 685,306 Percent of County Number of drivers licenses1 401,985 58.7% Population under the age of 162 178,128 25.9% Population remaining w/out drivers licenses
105,193 15.3%
Source: 1 Drivers License Outstanding by County as of December 31, 2010, California Department of Motor Vehicles 2 2010 U.S. Census Bureau
Figure 4 Eligibility for Drivers Licenses in San Joaquin County
Figure 4 As shown by the above graph, approximately 15% of the population potentially needs
public transit services while 59% of San Joaquin’s population has a driver’s license and would
potentially use transit if it was available and convenient. This percentage does not include those
people who have a license but share a car and sometimes are in need of public transit.
25.9%
58.7%
15.3%
Population under the age of 16
Population with drivers licenses
Population eligible for drivers licenses

Figure 5 San Joaquin County Population without a Car

Table 9 displays the amount of occupied households in San Joaquin County, the average amount
of occupants in each household, and the average number of vehicles per household.
Table 9
Occupied Household / Vehicles in San Joaquin County, Year 2010
Source: 1 Occupied Households: 5-year ACS 2 Estimated Vehicles Registered by County for the Period of January 1 through December 31,
2010California Department of Motor Vehicles
Jurisdiction Occupied Households
Percent of Occupied Households
Stockton 90,375 42.2 Lodi 21,548 10.1 Manteca 21,609 10.1
Tracy 23,605 11.1 Escalon 2,657 1.2 Ripon 4,364 2.0 Lathrop 4,660 2.2 Unincorporated 44,087 20.7
Total Occupied Households1 212,905 Average # of Occupants 3.19
No. of Vehicles in San Joaquin County2 353,644 Average # of Vehicles per Household 1.64 Average # of Drivers per Household 1.87

CHAPTER 3 COMMUNITY OUTREACH & PUBLIC COMMENT
5BPublic Hearings
SJCOG requests that each member government agency hold at least one public hearing on unmet
transit needs in the area under its jurisdiction. The public hearing must be held at a time and a
place that is convenient and accessible for the elderly, transit dependent, and physically chal-
lenged. The San Joaquin Regional Transit District is responsible for the Stockton Metropolitan
Area Intracity, Intercity, Interregional, and Rural Transit services. As such, the District is required to
hold unmet transit needs hearings in Stockton and throughout unincorporated San Joaquin County.
In addition, SJCOG holds a final unmet transit need public hearing before its SSTAC. There were
14 public hearing held between the RTD, local jurisdictions, and SJCOG to solicit public comments
on unmet transit needs and an 15th meeting was held to review the Draft Report. The SJCOG
made an informational presentation to the California Valley Miwok Tribe. Table 10 outlines
dates, times and locations of hearings held throughout the region. Proof of publication of hearings
and minutes if testimony was provided can be found in Appendix C.
Table 10
FY 2012-2013 Community Outreach Schedule
Date of Hearing
Location of Hearing
Sponsoring Jurisdiction
Time of Hearing
October 17, 2011 Escalon Library Escalon 7:00 PM October 18, 2011 City Hall Ripon 7:00 PM October 18, 2011 Tracy Transit Station Tracy 1:30 PM October 18, 2011 City Hall Tracy 7:00 PM November 1, 2011 City Hall Manteca 7:00 PM November 16, 2011 Carnegie Forum Lodi 7:00 PM November 16, 2011 Margaret Troke Library SJRTD 1:00 PM November 16, 2011 Delta College, Mountain House Campus SJRTD 6:00 PM November 17, 2011 San Joaquin RTD Downtown Transit SJRTD 5:30 PM November 21, 2011 Mokelumne Rural Fire Department SJRTD 6:00 PM November 21, 2011 City Hall Lathrop 7:00 PM November 28, 2011 Linden High School SJRTD 6:00 PM November 29, 2011 San Joaquin RTD Downtown Transit SJRTD 3:00 PM December 7, 2011 SJCOG Board Room SJCOG 3:00 PM March 7, 2012 SJCOG Board Room SJCOG 2:00 PM
24BCommunity Outreach Efforts
A wide variety of community outreach efforts were employed that went beyond the public
hearing process to gain public input. These efforts intended to promote other opportunities for

the public to communicate their unmet transit needs (e.g., email, SJCOG website, survey, phone,
and letter). Examples of this effort include:
Distribution of brochures and flyers to public/private/non-profit agencies throughout San Joaquin County.
Use of the City of Lathrop’s utility bill mailing to distribute flyers to its citizenship. An online survey was posted on the SJCOG a website.
Refer to Appendix D for examples of community outreach materials that were developed and
distributed.
25BAnalysis of Comments Received
The outreach efforts produced input from 71 individuals totaling 102 comments. Of the 102
comments, 50 did not identify a deficiency within the existing transit system. Of the remaining 52
comments; 16 are considered operational in nature, 13 are addressed by existing transit system,
and 23 were considered unmet transit needs.

TDA FY 11‐12 Transit Systems Performance Objectives

STAFF REPORT
SUBJECT: Revised Transit Systems Performance Objectives for FY 2011-2012
RECOMMENDED ACTION: Motion: To Accept and Recommend Adoption of the Revised Transit System Performance Objectives for FY 2009/10 through 2011/12
BACKGROUND: The San Joaquin Council of Governments (SJCOG) Board adopted the Transit Systems Performance Objectives in September 2009. The Transit Systems Performance Objectives replaces the 1983 SJCOG Board approved Operating Cost per Passenger Objective for transit agencies that contract out their transit services. Section 99405 of the Transportation Development Act (TDA), allows the transportation planning agency to adopt alternative performance measures for certain transit operators to replace the standard farebox recovery ratio. The performance measure is also used in the determination of the “reasonable to meet” in the upcoming FY 2011-2012 Unmet Transit Needs (UTN) Process. The transit operators subject to this section are the Cities of Escalon, Lodi, Manteca, and Tracy. The approved Transit Systems Performance Objectives methodology replaces the single annual performance measure (operating cost per passenger objective) with the following three indicators that are measured over a three year period:
1. Operating Cost / Revenue Hour – highlights the cost effectiveness of providing service 2. Passengers / Revenue Hour – highlights the utilization of the service 3. Subsidy (Operating Cost – Fare Revenue) / Passenger – is a comprehensive indicator
measuring operating cost, fare revenue, and ridership The three-year performance indicators adopted by the SJCOG Board were developed based on unaudited FY 2008/09 TDA data and were contingent upon receipt and review of actual TDA audits. SJCOG has since received the TDA audits and coordinated the review of the unaudited and audited data with each agency. The performance indicators are calculated based on the audited FY 08/09 data by forecasting the future operating cost, ridership, and farebox revenue, holding constant revenue hours, to identify two interim and a three-year target for each indicator. A three-year maximum range of five percent for the Cost/Hour and Subsidy/Passenger and a minimum five percent range for Passenger/Hour is calculated.

The three indicators are intended to assess the transit operator’s performance within a maximum or minimum (+/- 5 percent) range at the end of the three year period. The interim targets are established to gauge the performance of the system and promote improvements. Any performance within the specified range is considered acceptable and would enable the operator to get their full allocation of TDA funds. Performance outside the range would result in a warning and a request for an action plan to get back on track. The approved methodology allows for annual updates due to planned service changes and/or unpredictable or uncontrollable factors. Planned service changes can occur through an extension/reduction of service, new service, additions of geographical areas, frequency improvements, new days of service, or a restructuring of services as indicated in the TDA Statute and California Codes of Regulations, (March 2009). In this instance, SJCOG would update the operator’s three-year indicator targets when a modification to service in excess of 25 percent occurs. Additionally, the operator would not be subject to the revised targets until two years after the end of the fiscal year in which the change in service was put into operation. For example, the City of Lodi reduced services by approximately 25% in November 2009 and raised fares by 25 percent and 33 percent for fixed route and dial-a-ride services as of January 2010. These changes were in response to the decline in operating revenues and were essential to remaining revenue neutral. A secondary result of the decreased services led to an increase in contractual operating costs. The City of Escalon experienced a decrease in service area from 25 to 2.2 square miles when transitioning to a new service provider. Because these changes occurred after FY 2008/09, the transit performance objectives in Table 1 will exceed the minimum and maximum thresholds for the respective years. Therefore, SJCOG will need to recalculate the three-year transit performance objectives upon receiving audited TDA data for the FY that the changes occurred. Under TDA Section 99268.8, the transit operator would not be subject to the revised targets until two years after the end of the FY in which the changes occurred. This allows time for the transit operator to refine service operations and stabilization of the system to occur. Table 1 presents the revised three-year performance objectives, based on audited data, for the Cities of Escalon, Lodi, Manteca, and Tracy. Recommendation Based on the development and review process, SJCOG staff recommends that the Board accept and adopt the revised Transit System Performance Objectives for FY 2009/2010 through 2011/2012.

Claimant
Cost / Hour
Targets2
2008/09 Baseline5
2009/10 2010/11 2011/12
2011/12
Maximum (+5%)
Escalon $39.03 $39.98 $41.09 $42.39 $44.51
Lodi $76.86 $78.72 $80.91 $83.46 $87.64
Manteca $70.76 $72.48 $74.49 $76.84 $80.69
Tracy $46.20 $47.32 $48.63 $50.17 $52.68
Passengers / Hour
Targets3
2008/09 Baseline5
2009/10 2010/11 2011/122011/12
Minimum (-5%)
2.3 2.4 2.4 2.5 2.4
6.2 6.2 6.3 6.4 6.1
4 3.8 3.9 4.1 3.9
6.5 6.8 7.2 7.5 7.1
Subsidy / Passenger Targets4
2008/09 Baseline5
2009/10 2010/11 2011/12Maximum
(+5%)
$8.41 $8.45 $8.55 $8.71 $9.15
$7.61 $7.72 $7.87 $8.07 $8.48
$5.64 $5.57 $5.57 $5.64 $5.92
$1.35 $1.30 $1.28 $1.29 $1.35

TRANSIT MODELING AND TRAVEL ANALYSIS

Technical Traffic Model Research and Analysis:
Employment Category Consolidation, Model Filing Organization, and Transit Network Editing
Written by: Daniel Meza Traffic Modeling Intern
San Joaquin Council of Governments
Created: 07/11/2013

Table of Contents
1. Employment Category Consolidation…………………………………….............................................1
2. Model Filing Organization…………………………………………………………………………………………………4
3. Transit Network Editing…………………………………………………………………………………………………….7
4. Appendix A……………………………………………………………………………………………………………………….9

Chapter1:EmploymentCategoryConsolidation
Chapter 1: Employment Category Consolidation
INTRO: Envision develops the employment information in only nine categories. The COG traffic model however requires 21 categories for employment. This causes a transition problem which would ultimately end in the traffic model not properly functioning.
PROBLEM: In order to make the process between Envision and the model smoother, it was decided to change the current 21 categories in employment to a consolidated 9 categories. Since the model input process was currently set up to run 21 categories, changes had to be made to all currently created years. A very well defined process to the transition was also to be needed in case more future years needed to be developed, converted and analyzed. The input process is specifically relevant to a spreadsheet called the Standard Parameters Worksheet. This worksheet develops and calculates a large amount of the inputs that are required for the COG model to run. The changes that would need to be addressed would directly affect one of the calculating tab named LandUse Inputs.
SOLUTION: Develop Interpolation Excel Sheet: Create a worksheet which would simply allow interpolation between all conformity years. This sheet can also help develop other possible future analytical years which can help in the RTP process. Develop Consolidation Conversion Excel Sheet: This sheets purpose would be to consolidate between COGS 21 categories and Envisions 9 categories, thereby getting rid of the gap. This would allow further analysis on existing 21 category Standard Parameter Worksheets. Modify Existing Standard Parameter Worksheets: Once the 9 category consolidation has taken place, that information needs to be transferred into the Standard Parameter Worksheet. Modifications need to be done in order to properly accommodate the category decrease.
PROCESS: The following process only pertains to the creation of a new 9 Category Standard Parameter Worksheet. Interpolation Worksheet: Created to interpolate between conformity years (2012, 2014, 2017, 2020, 2023, 2035, and 2040) in order to develop any other necessary analysis years.
1) INTERPOL #s holds every year’s values by its category. Cut and paste each column that corresponds to the year that needs to be generated into a new tab.
2) Once all categories have been separated by their corresponding year, save the document and copy it into the Consolidation Worksheet.
Consolidation Worksheet: Created in order to bring the 21 employment categories together into 9 categories.
Page 1 of 14

Chapter1:EmploymentCategoryConsolidation
1) Create a new tab and label it LandUse_Inputs_XXXX (The year you are creating) 2) Paste the values that were generated from the Interpolation Worksheet into this tab. 3) Copy one of the Tabs labeled C_Landuse_Inputs_XXXX (It does not matter which one) 4) Change the name so the XXXX corresponds to the year you are creating 5) The information in this tab should reflect formulas which point to the wrong sheet. Simply
replace B2 ‐>I2 formulas so that they point to your LandUse_Inputs_XXXX file that was created earlier).
6) Make this change become relevant to the rest of the values by double clicking on the bottom right hand corner of each cell.
Standard Parameter Worksheet: Some modifications need to made to this worksheet in order for it to produce the correct inputs.
1) Open one of the existing years Standard Parameter Worksheets that have already been consolidated.
2) Save As to represent your new year. This also includes changing the name. 3) Copy and special paste the values from the C_Landuse_Inputs_XXXX that you created in the
Consolidation Worksheet to their appropriately labeled columns in the Standard Parameter Worksheet you have created under the LandUse tab.
4) Make sure that the last row in your LandUse Tab has summation formulas which represent the column above them. (This is important if you need to check your work later on).
5) You will now need to open the Interregional Excel sheet which is located in the same folder as all the existing Standard Parameter Worksheets.
6) On the first tab, change the year to the year which matches your spreadsheet. Then hit F9. NOTE: Allow the excel sheet to fully calculate the values on the bottom right had corner
7) Copy the tabs labeled Gateways and Through Trips as Values into the tabs located in your Standard Parameter Worksheet.
8) Save everything and you have successfully created your new 9 Employment Category Standard Parameter Worksheet.
CHALLENGES: User Errors: The amount of information being converted and manipulated is vast which can cause unintentional errors if the spreadsheets are not properly developed. Some errors encountered included: ‐Formulas being accidently removed or deleted ‐Issues with copying such large quantities of values at one time causing the computer to freeze or crash ‐Accidently skipping information that needed to be copied or pasted ‐Copying the wrong years values into the non‐correspondent year Inaccurate Model Results: After creating and adjusting all of the spreadsheets so that they would generate the proper inputs, the traffic model ran generating outputs for each year. Although, through some analysis and comparison, it was obvious that some of the years were either reflecting incorrect amounts values or generating the same values as some of the other years. This lead to a deep investigation within the Standard Parameter Worksheets. The faults mentioned above were many of the reasons that the numeric values had been skewed.
Page 2 of 14
Chapter1:EmploymentCategoryConsolidation
Another issues involved some of the other tabs having formulas that pointed to tabs that had originally not been acknowledged as being affected by the changes. Modifications to tabs within the Standard Parameter Worksheets were done accommodating the carried over formulas by the employment category consolidation. Export Difficulties: The Standard Parameter Worksheet has a Macro function built in which allows it to export its individual tabs as singular excel files. These files are normally placed into a folder where the model can access them and use them to create its outputs. This function became disabled causing the export buttons to no longer work. The issue turned out to be that the excel export button only works in Excel 2010. If any other version of Excel accesses this file, it can lead the file to corruption and disable its Macros, which is what the export function is. Since someone who has not read this document could easily cause this, a secondary updated “Break in case of Emergency” file was created to accommodate the possible corruption of these files. It is to reside within the Standard Parameter Worksheet folder where it can be easily accessed if needed.
RESULTS: The purpose of this exercise was to create a modification to the current 21 employment categories so that they could better fit with Envisions 9 employment categories. All the necessary years for analysis were properly converted into a nine category employment form which could be read and used as an input for the model.
ADDITIONAL RESULTS: A defined process: Since it was likely that other possible future years would be developed, a process for the creation of the interpolation/consolidation of each year was at best interest. Instructions on how to re‐construct a new scenario year from scratch has been incorporated into this document in the PROCESS section. This includes easy to use spreadsheets which only require minimal data entry and manipulation.
Page 3 of 14

Chapter2:ModelFilingOrganization
Chapter 2: Model Filing Organization
INTRO: The COG traffic model produces over 200 input files as well as 2,000 output files after it has run. The original file names that are created in the CUBE program carry over all the way through the model once it has run producing new files that begin with that same name. If a model run is not properly named or correctly archived, it can make it nearly impossible to locate, rendering the 8‐10 hour run obsolete. The set up consisted of one group of folders which held the input files, output files and temporary files created by the model.
PROBLEM: Constant confusion in regards to accessing the old model runs was becoming an issue due to inconsistent naming or indistinguishable naming to model runs. This would make the process that should take no longer than five minutes take hours, even days. This would be under the assumption that the correct file had been located. If the incorrect name had been applied to the run, further tests would be run on the incorrect files leading to incorrect results and an overall waste of valuable time. The next issue at hand was that there were currently two super computers on separate networks which held their own set of input and output files. This would lead to confusion if multiple runs were created on both computers with the same name causing confusion on where files were located as well which model run was most recent. Lastly, since such a large amount of files are created throughout the entire modeling process, gaining a further understanding to what files are produced as well as their locations was necessary.
SOLUTION: Create a naming convention which will properly identify each model run: This name convention would be applied in the very beginning of any model process and carried through all the way until the output files have been archived. Design a filing system for both the input and output files accessible to both super computers: Creating a filing system which would be accessible via the M drive (main drive which connects all the computers at COG) would help organize all files that were directly related to inputs as well as outputs. This would make the input files easier to update thereby more dependable. Prevention of Duplicate model runs: Since there were two computers that the model runs on, it needs to be established that future runs will never repeat on both computers. For example, if Model A runs on Kim’s Super Computer, Model A can no longer be run on Danny’s Super Computer. This would prevent the duplication of runs. If another run was created due to flawed information or a failed run, it is to replace the failed run on the same corresponding computer. Designing a folder map along with a brief description for each file: Understanding the model to its full potential is essential to the mastery of modeling. A document with the location as well as short
Page 4 of 14

Chapter2:ModelFilingOrganization
descriptions can be helpful in the future when trying to locate certain information pertaining to model runs.
PROCESS: The following description goes into further depth on the functionality of both the filing system and the naming convention. Filing and Naming Convention Firstly, anything model related has been saved to the Model Components Folder and subcategorized as pre and post organization which generally coincides with the last week of August 2012. The Pre‐Organization folder contains Combined Roadway Summaries, Standard Parameters and Transportation Data Templates. The reason for keeping these runs in that format is to avoid the need to go back and match all the files and confirm naming changes. In the Post‐Organization, you will find that the folders are organized by Scenario. Each Scenario should contain folders for the following: Combined Roadway Summary, Standard Parameters, Transportation Data Templates and EMFAC. The naming convention for these folders will be the date XX_XX_XX = Month_Day_Year followed by a short scenario name. If there is any question of what this scenario is, you can check the Standard Parameters WS under the SUMMARY tab. For an example refer to M:\Transportation Planning and Programming\3 County Model\1_MODEL COMPONENTS\Post Organization\00_XXXX_XX_XX_TEMPLATE (Note: When creating a new Scenario run, simply copy the 00_XXXX_XX_XX_TEMPLATE folder and rename it so that it properly describes the scenario. Also, the naming convention for now on starting from Kim A. will follow the following convention: i.e.: XXXX_XX_XX = Year_Month_Day followed by a short scenario name (NOTE: This name is to carry on through the model run so that the output is the same and can be placed in the according folder) The location that you would be placing Standard Parameter WS would be in the following location: M:\Transportation Planning and Programming\3 County Model\1_MODEL COMPONENTS\Post Organization Folder Map and Descriptions for Model In terms of the inputs for the model, all this information along with short summaries can be found in any Standard Parameter Worksheet under the Summary tab. For further information on details about the other files created which include but are not limited to temporary files and output files, please refer to the documents located in
Page 5 of 14
Chapter2:ModelFilingOrganization
M:\Transportation Planning and Programming\3 County Model\DOCUMENTATION\WHITES PAGES
CHALLENGES: Dealing with existing folders: The pre‐organization folder was created for the purpose of holding older runs in case some information needed to be retrieved from past runs. It was acknowledged that the future scenarios would no longer need the older model runs but were still saved for archival purposes. User adaption to new system: Though this system was adopted when creating model runs, it still took some refining. A close eye was kept to all future folders created and was strictly addressed when created incorrectly to prevent future repetition of issues. Some files were undefinable: Not all the files located during the inspection for the folder map and descriptions were necessarily of much use. Some consisted of numeric values with little to no definition. This is due to equations and formulas which happen in intermediate steps during the model runs.
RESULTS: The purpose of this exercise was to create a more organized and elaborate naming system which would allow current staff and future staff to find past model runs without feeling overwhelmed by the significant amount of folders and files currently existing. A new filing and naming system was established to allow more clarity when searching for information based on the traffic model. This has proved most helpful and allowed even staffs that are not necessarily familiar with the modeling filing convention to access requested files or information.
ADDITIONAL RESULTS: A defined process: A process in which the model’s file development (Beginning with the input file creation) can be understood and used not only for simple organization, but for understanding how the model itself functions.
Page 6 of 14

Chapter3:TransitNetworkEditing
Chapter 3: Transit Network Editing
INTRO: The traffic model runs on two basic networks: The Highway Network and the Transit Network. The Highway Network allows the model to run calculations on Census data which includes population of households, ownership of vehicles, commuting, etc. The Transit Network also using Census data and current ridership data supplied by the Regional Transit District (RTD) allows the model to calculate population movement via transit vehicles such as buses and trains.
PROBLEM: After the model was presented to COG by Fehr and Peers, editing commenced in order to update some of the projects currently in the traffic model. These edits were included but were not limited to: updating projects, removing projects that were no longer current, and changing the year in which certain projects had been moved to. Once these edits were finished, running the traffic model was essential to see the results and effects of the recent changes. After incorporating the new network changes and setting off the model, it came to a halt due to a “Transit Network Error”. This error needed to be addressed in order for the model to even begin functioning. After a series of email exchanges with Mike Wallace from Fehr and Peers, it became evident that the issue had arisen from editing the Traffic Network without having the Transit Network open. The two Networks work in par with each other when it comes to editing. For example, if an edit which removes or adds a road to the Highway Network occurs while the transit network is open, the transit network will take these changes into acknowledgement and change any bus routes currently on those roads. But if only the Highway Network is open, the Transit Network will still have the bus routes existing even if there are no roads, causing the model to crash.
SOLUTION: Learn how to Edit Transit Lines in Transit Network: Since the model is new and not a lot of modelers have enough experience using it, changing/editing the Transit Networks would need to be a self‐taught task in order to continue the model runs. Develop techniques that make the editing process smoother: Learning and gaining a good understanding of how to edit Transit Networks was essential so that these skills can be taught to other modelers in the future.
PROCESS: Transit Lines: This is the basis to the foundation of what Transit Networks consist of. They hold information on the routes that buses take within the county. They normally appear by a certain color which may define which bus or route they represent. These lines also visually represent where the stops are located for each route as well as where the final stops are.
Page 7 of 14

Chapter3:TransitNetworkEditing
Transit Stops: Within the model they appear as large dots between intersections, while in text they appear as negative numbers instead of positive numbers. While exploring these stops, it was discovered that edits and replications can be created for each transit network simply by copying and pasting the numeric form to the other Transit Network text files. This saves a large amount of time when dealing with more than one year. For more information on how to edit Transit Networks, please refer to Appendix A.
CHALLENGES: Obtaining knowledge from other Modelers: Due to the model being a newly updated program, not all the modelers using the CUBE interface (modeling program) were necessarily up to date with new strategies or techniques on how to edit Transit Networks. After a series of calls and emails, it came down to modelers from Fresno COG who had recently come across a similar issue. Self‐teaching and learning Transit Networks: Though Fresno COG supplied many bits of valuable information, there were still many details that needed to be understood about the Transit Network. Many of which were from trial and error. This included learning that Transit Lines are directional when established, discovering how the Transit Networks are carried via a text format when removed from the model, as well as understanding that each year required a different or updated Transit Network.
RESULTS: A full description on how to edit Transit Networks was created. This file can be found in Appendix A. A full understanding behind the methodology of how Transit Lines function was also established.
ADDITIONAL RESULTS: Quick edits and replications of Transit Lines: Time is always an important factor in modeling. If time can be saved in any manner, then it is a skill well learned. Being able to replicate and edit lines simply by using the text format of the Transit Networks saves the effort of going into the model. It also allows the use of simple cut and paste so that all the future years still hold the information of the current lines. This knowledge was based off help from Fresno Council of Governments.
Page 8 of 14

AppendixA
APPENDIX A Editing a Transit Network
1. Save file as a different name
While having network editing open
Click on the layer control
Check the box next to the bus labeled Transit. This will bring up another box in which you click on
“Browse” to the right of “File Name”
This will bring up your file directory in which you can place whichever transit network (off peak
or peak) you have saved (NOTE: THIS MUST BE DONE FOR BOTH OFF PEAK AND PEAK FILES!!!)
After selecting the file a confirmation box will pop up asking about certain nodes with no
coordinates. Click “No”
Then click “All Done”. This will turn on your transit network.
Page 9 of 14

AppendixA
Before you can edit your transit network, you must go back to the layer control box and push the
transit layer to top. To do this, simply highlight your TRN, and then hit the red arrow pointing up
with the line above it.
(NOTE: You can only edit whichever layer is first on the list)
Editing Transit Route
Click on the route which you intend to edit using the “Pointer”. This will bring forward the Transit
Route attribute box.
Click on the edit button which is on the Transit Route attribute box and looks like a square, circle,
triangle looping.
Page 10 of 14

Appendix
D
be
no
tr
ta
EX
A
th
xA
Doing this will
eginning nod
ode which is w
ransit networ
ake a differen
XAMPLE:
ssume you w
he yellow arro
now turn you
de of your edit
where the rou
rk when editin
nt route!!!) [e.
ant to change
ow follows.
ur cursor into
t. After clickin
ute edit will e
ng. It will only
.g. one way li
e the current
a cross‐hair.
ng on the beg
end. (NOTE: B
y edit as if you
inks must be
route that th
. This cross ha
ginning node,
Be wary of the
u were driving
taken into co
he red arrows
air allows you
you can now
e direction of
g the vehicle
onsideration])
s follow into t
u to pick the
w select the en
traffic on you
and decided
)
he route whic
nd
ur
to
ch
Page 11 of 14

AppendixA
FOLLOW THE ABOVE INSTRUCTIONS TO THE POINT WHERE YOU HAVE THE CROSS‐HAIR
Click the cross‐hair on the corner where the route goes from horizontal to 45° (NOTE: You’ll
notice that the entire route will change color up to where you clicked it and the remaining part of
the route will change to a different color. This is just informing you of your current edit
parameters.)
Now click on where you want the route to actually go. Which in this case is the end of the route.
(NOTE: Notice how the route changed colors. Green shows the original route and purple implies
the new route.)
Page 12 of 14

AppendixA
From this point on, you can continue adding to the current edited route by clicking on new nodes
where you want the route to follow.
Once you are finished editing, hit “Esc” on your keyboard, then the “Green Check” located on the
top left hand corner on the Transit Route attribute box (NOTE: Your route will turn yellow and
the original green route will dissapear.)
SITUATIONAL EDITS:
The instructions above are all assuming that both your Highway and Transit Networks are syncronized
and functioning properly.
During your time editing Highway and Transit Networks, you may encounter situations in which you only
need to edit the Highway Network or the Transit Network.
Example1:
Your Transit Network may have a route on a road that no longer exist causing the model to crash. This
route either needs to be edited in order to comply with the Highway Network, or the Highway Network
needs to have that road re‐placed and recoded correctly. In doing so, you must only open the Network
that needs to be edited since they are meant to be syncronized until corrected.
Example2:
Another example would be sometimes alignments are changed from perpendicular intersections to more
complex designs (such as a diamond intersection or a spiral) on the Highway Network. This can cause the
Transit Network to no longer understand the change if it has not been edited in syncornization with the
Page 13 of 14

AppendixA
Highway Network. The Transit Network would need to be properly coded alone in order to take into
account of the new route that has been established.
Example 3:
Missing node numbers in your Transit Network can also cause the model to crash due it heavy
dependence on nodes for its stops and pivital points. Nodes are essentially the guidance system for the
Transit Network. The Transit Network would then be able to follow the corresponding links on the
Highway Network.
Example 4:
Highway links in your Highway Network must be appropriately coded in order for the Transit Network to
function correctly. Having an incorrect project year, number of lanes or an inccorect Facility Type can
adversly affect the results of the Transit Network. For instance, having a Facility Type of “0” when it
actually requires it to be of a numeric value can cause a missing link in the model.
Page 14 of 14