final progress report for research projects funded …tju...final progress report for research...
TRANSCRIPT
Final Progress Report for Research Projects Funded by Health Research Grants Instructions: Please complete all of the items as instructed. Do not delete instructions. Do not leave any items blank; responses must be provided for all items. If your response to an item is “None”, please specify “None” as your response. “Not applicable” is not an acceptable response for any of the items. There is no limit to the length of your response to any question. Responses should be single-spaced, no smaller than 12-point type. The report must be completed using MS Word. Submitted reports must be Word documents; they should not be converted to pdf format. Questions? Contact Health Research Program staff at 717-783-2548. 1. Grantee Institution: Thomas Jefferson University 2. Reporting Period (start and end date of grant award period): 1/1/2009-12/31/2012 3. Grant Contact Person (First Name, M.I., Last Name, Degrees): Theodore Taraschi, Ph.D. 4. Grant Contact Person’s Telephone Number: 215-955-3900 5. Grant SAP Number: 4100047652 6. Project Number and Title of Research Project: 6 - Mechanisms for Metastasis
Suppression through Kisspeptin Regulation of the Microenvironment 7. Start and End Date of Research Project: 01/01/2009 - 12/31/2012 8. Name of Principal Investigator for the Research Project: Stephen C. Peiper, MD 9. Research Project Expenses. 9(A) Please provide the total amount of health research grant funds spent on this project for the entire duration of the grant, including indirect costs and any interest earned that was spent:
$ $786,147.01
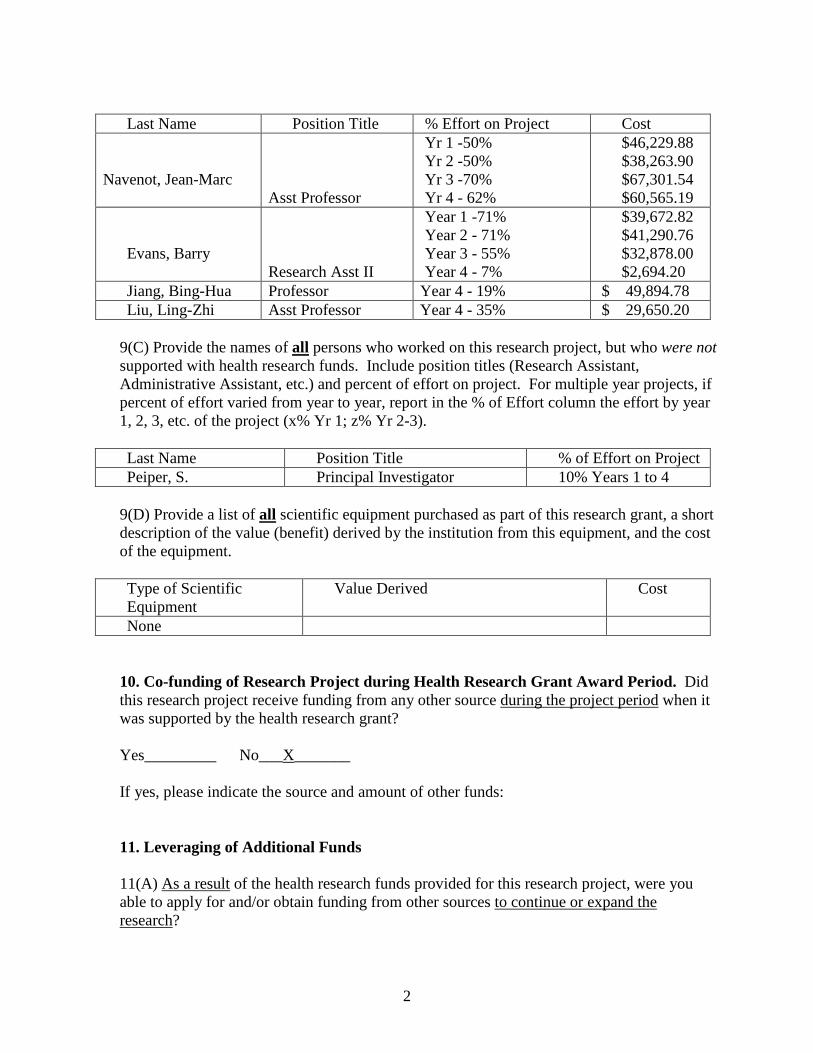
9(B) Provide the last names (include first initial if multiple individuals with the same last name are listed) of all persons who worked on this research project and were supported with health research funds. Include position titles (Principal Investigator, Graduate Assistant, Post-doctoral Fellow, etc.), percent of effort on project and total health research funds expended for the position. For multiple year projects, if percent of effort varied from year to year, report in the % of Effort column the effort by year 1, 2, 3, etc. of the project (x% Yr 1; z% Yr 2-3).
2
Last Name Position Title % Effort on Project Cost
Navenot, Jean-Marc
Asst Professor
Yr 1 -50% Yr 2 -50% Yr 3 -70% Yr 4 - 62%
$46,229.88 $38,263.90 $67,301.54 $60,565.19
Evans, Barry Research Asst II
Year 1 -71% Year 2 - 71% Year 3 - 55% Year 4 - 7%
$39,672.82 $41,290.76 $32,878.00 $2,694.20
Jiang, Bing-Hua Professor Year 4 - 19% $ 49,894.78 Liu, Ling-Zhi Asst Professor Year 4 - 35% $ 29,650.20
9(C) Provide the names of all persons who worked on this research project, but who were not supported with health research funds. Include position titles (Research Assistant, Administrative Assistant, etc.) and percent of effort on project. For multiple year projects, if percent of effort varied from year to year, report in the % of Effort column the effort by year 1, 2, 3, etc. of the project (x% Yr 1; z% Yr 2-3). Last Name Position Title % of Effort on Project Peiper, S. Principal Investigator 10% Years 1 to 4
9(D) Provide a list of all scientific equipment purchased as part of this research grant, a short description of the value (benefit) derived by the institution from this equipment, and the cost of the equipment.
Type of Scientific Equipment
Value Derived Cost
None 10. Co-funding of Research Project during Health Research Grant Award Period. Did this research project receive funding from any other source during the project period when it was supported by the health research grant? Yes_________ No___X_______ If yes, please indicate the source and amount of other funds: 11. Leveraging of Additional Funds 11(A) As a result of the health research funds provided for this research project, were you able to apply for and/or obtain funding from other sources to continue or expand the research?

3
Yes_________ No__X________ If yes, please list the applications submitted (column A), the funding agency (National Institutes of Health—NIH, or other source in column B), the month and year when the application was submitted (column C), and the amount of funds requested (column D). If you have received a notice that the grant will be funded, please indicate the amount of funds to be awarded (column E). If the grant was not funded, insert “not funded” in column E. Do not include funding from your own institution or from CURE (tobacco settlement funds). Do not include grants submitted prior to the start date of the grant as shown in Question 2. If you list grants submitted within 1-6 months of the start date of this grant, add a statement below the table indicating how the data/results from this project were used to secure that grant. A. Title of research project on grant application
B. Funding agency (check those that apply)
C. Month and Year Submitted
D. Amount of funds requested:
E. Amount of funds to be awarded:
Reactive Oxygen Species-Induced CXCL8 in Ovarian Cancer
NIH Other federal (specify:_______) Nonfederal source (specify:_)
April 2013 $ 275,000 $
11(B) Are you planning to apply for additional funding in the future to continue or expand the research? Yes_________ No__X________ If yes, please describe your plans: 12. Future of Research Project. What are the future plans for this research project? The future of the research project will be determined by the results of the ongoing research conducted on ovarian cancer. If a role for KISS1 and GPR54 is found in that context, the project will be included in a grant application. 13. New Investigator Training and Development. Did students participate in project supported internships or graduate or post-graduate training for at least one semester or one summer? Yes_________ No___X_______ If yes, how many students? Please specify in the tables below:

4
Undergraduate Masters Pre-doc Post-doc Male Female Unknown Total
Undergraduate Masters Pre-doc Post-doc Hispanic Non-Hispanic
Unknown Total
Undergraduate Masters Pre-doc Post-doc White Black Asian Other Unknown Total 14. Recruitment of Out-of–State Researchers. Did you bring researchers into Pennsylvania to carry out this research project? Yes_________ No___X_______ If yes, please list the name and degree of each researcher and his/her previous affiliation: 15. Impact on Research Capacity and Quality. Did the health research project enhance the quality and/or capacity of research at your institution? Yes_________ No___X_______ If yes, describe how improvements in infrastructure, the addition of new investigators, and other resources have led to more and better research. 16. Collaboration, business and community involvement. 16(A) Did the health research funds lead to collaboration with research partners outside of your institution (e.g., entire university, entire hospital system)? Yes_________ No___X_______

5
If yes, please describe the collaborations: 16(B) Did the research project result in commercial development of any research products? Yes_________ No___X_______ If yes, please describe commercial development activities that resulted from the research project: 16(C) Did the research lead to new involvement with the community? Yes_________ No___X_______ If yes, please describe involvement with community groups that resulted from the research project: 17. Progress in Achieving Research Goals, Objectives and Aims. List the project goals, objectives and specific aims (as contained in the grant agreement). Summarize the progress made in achieving these goals, objectives and aims for the period that the project was funded (i.e., from project start date through end date). Indicate whether or not each goal/objective/aim was achieved; if something was not achieved, note the reasons why. Describe the methods used. If changes were made to the research goals/objectives/aims, methods, design or timeline since the original grant application was submitted, please describe the changes. Provide detailed results of the project. Include evidence of the data that was generated and analyzed, and provide tables, graphs, and figures of the data. List published abstracts, poster presentations and scientific meeting presentations at the end of the summary of progress; peer-reviewed publications should be listed under item 20. This response should be a DETAILED report of the methods and findings. It is not sufficient to state that the work was completed. Insufficient information may result in an unfavorable performance review, which may jeopardize future funding. If research findings are pending publication you must still include enough detail for the expert peer reviewers to evaluate the progress during the course of the project. Health research grants funded under the Tobacco Settlement Act will be evaluated via a performance review by an expert panel of researchers and clinicians who will assess project work using this Final Progress Report, all project Annual Reports and the project’s strategic plan. After the final performance review of each project is complete, approximately 12-16 months after the end of the grant, this Final Progress Report, as well as the Final Performance Review Report containing the comments of the expert review panel, and the grantee’s written response to the Final Performance Review Report, will be posted on the CURE Web site.
6
There is no limit to the length of your response. Responses must be single-spaced below, no smaller than 12-point type. If you cut and paste text from a publication, be sure symbols print properly, e.g., the Greek symbol for alpha (α) and beta (ß) should not print as boxes () and include the appropriate citation(s). DO NOT DELETE THESE INSTRUCTIONS. Numerous studies over the past decade have demonstrated that, in many cases, the emergence of cancer as a clinical event (as opposed to the mere presence of clinically silent cancer cells) requires not only genomic and phenotypic modifications in the cancer cells (activation of oncogenes and loss of activity of tumor suppressor genes) but also contribution from the microenvironment of these tumor cells. For example, chronic inflammation (with infiltration and activation of immune cells, presence of pro-inflammatory cytokines, modification of the extracellular matrix components) has been characterized as fertile ground for the development of tumors and neo-angiogenesis. Most notably, the presence of cancer associated fibroblasts (CAF) or myofibroblasts noted in the stroma of many tumors led to the identification of these cells as major contributors of tumor growth. These modifications of the microenvironment of tumor cells necessary to provide support to tumor cells for their expansion in primary tumors is likely even more critical for metastasis in which disseminated tumor cells must adapt to a new environment. In fact, it was shown that tissue remodeling occurred in organs distant from the primary tumor even before tumor cells started to spread. Metastasis suppressors are a recently described class of molecules that specifically affect the capacity of tumor cells to metastasize to distant organs but do not inhibit primary tumor growth. Their action can target any step of the metastatic cascade, from local invasion of the primary tumor microenvironment to survival and expansion in distant organs. The soluble protein KISS1 and its derived polypeptides (kisspeptins or KP, including the most active decapeptide KP10) were shown to act as metastasis suppressors in mouse models of melanoma and breast cancer. When metastatic tumor cell lines were modified by transfection to express KISS1, their metastatic potential was dramatically reduced in xenograft experiments whereas their capacity to form orthotopic primary tumors was unchanged compared to their parental countertype. Most interestingly, the anti-metastatic activity was shown to be post-migratory: When transfected variants of the human melanoma cell line C8161.9 expressing KISS1 and EGFP, (C8161.9-KFM) were injected intravenously to nude mice, they were found to colonize their target organs (lung, bones, eyes, kidneys) but the vast majority remained dormant for an extended period of time, so that only single cells, very small clusters and only a few sizable metastatic lesions (Nash et al., 2007). However, the same transfected cells were capable of establishing orthotopic primary tumors when injected subcutaneously. The anti-metastatic activity of KiSS1 in a number of human cancers is also supported by the observation in clinical studies that tumors with absent or decreased expression of KiSS1 have higher metastasis and worse outcome than those expressing normal levels. KISS1 is the ligand for a G protein-coupled receptor (GPR54) and we showed previously that the activation of GPR54 by KP10 can suppress the signaling of chemokine receptors (such as
7
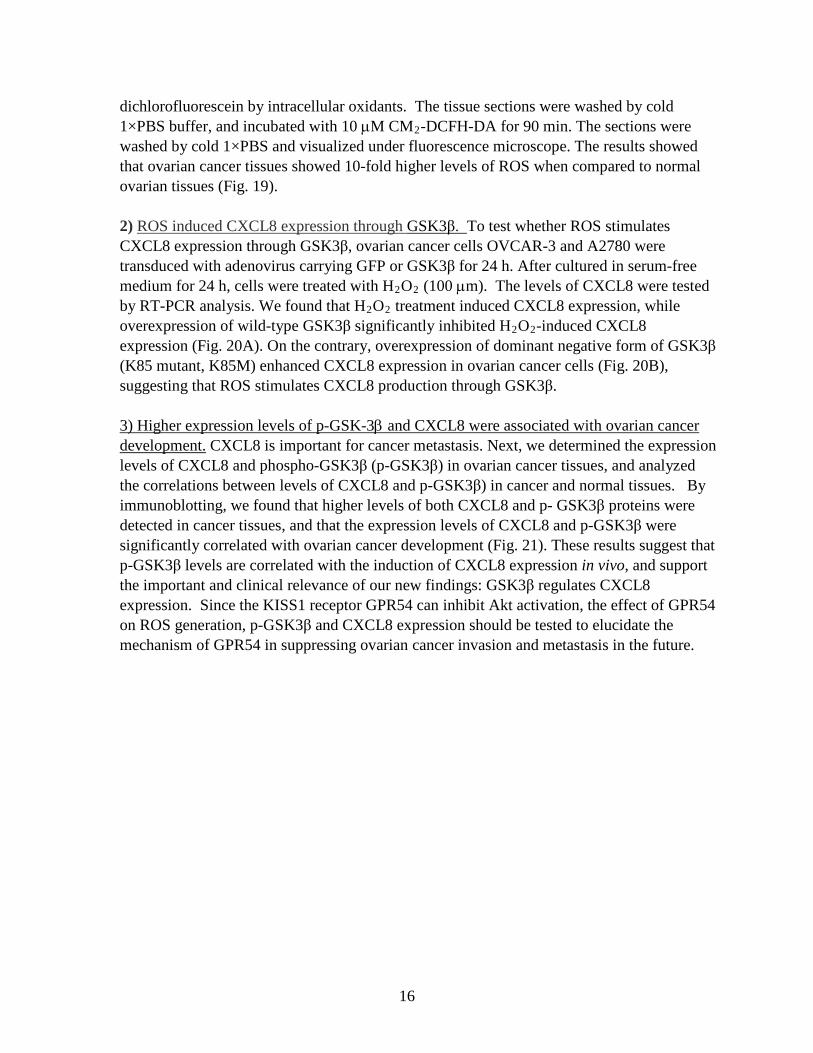
CXCR4 and CCR5) as well as receptor tyrosine kinases (EGFR, insulin receptor) at least in part through inhibition of Akt activation. These findings provide a valid explanation for the anti-metastatic activity of the KISS1-GPR54 axis in tumor cells expressing both ligand and receptor, however we found that C8161.9 cells do not express GPR54. This crucial observation combined with the post-migratory action of KISS1 in that model led us to hypothesize that KISS1 exerted its action of the microenvironment rather than directly on tumor cells. The changes observed in the tumor stroma during tumor growth and metastasis mimic what is observed in tissue repair events such as wound healing lung fibrosis. These two patho-physiological phenomena were chosen as models of stomal modification to study the anti-metastatic effect of KISS1. In the designed experimental models, we proposed to study the effect of injections of KP10 or synthetic analogs as substitute to expression of KISS1 by tumor cells three objectives: 1) measure the impact of KISS1 on the physiopathological process investigated, 2) detect the presence of GPR54 in the remodeled tissues and 3) identify the cells expressing GPR54. We first focused on establishing the experimental conditions for the execution and analysis of the wound healing experiments. Validation of reagents TOM80, a synthetic KP10 analog with improved resistance to proteolytic degradation was tested in vitro after being prepared for the animal experiments. TOM80 was dissolved at 5 mM in 1:1 sterile PBS:sterile DMSO, diluted to 500 uM in PBS, sterile filtered (0.2 um) and finally diluted in sterile PBS to the working concentration of 50 uM. The biological activity of this preparation was tested against the similarly prepared reference solution of KP10. HEK-293 cells transfected with human GPR54 were seeded overnight into tissue culture dishes containing complete medium, starved for 16 hours and exposed for 5 minutes to concentrations of KP10 or TOM80 ranging from 1 nM to 100 nM. Whole cell lysates were made in SDS lysis buffer. Since ERK MAP kinase was shown to be a signaling pathway activated upon GPR54 stimulation, phosphorylation of ERK was assessed by western blotting using antibodies to total ERK and phospho-ERK detected by secondary antibodies labeled with infrared dyes. An infrared scanner (LI-COR) was used to analyze the membranes. Results show that KP10 and TOM80 activate GPR54 with an identical potency (Figure 1). Detection of GPR54 expression in tissues In the absence of available antibodies specific for mouse GPR54, the proposed method of detection of cells expressing GPR54 was in-situ hybridization (ISH). Sense and antisense RNA probes were prepared for human and mouse GPR54 using incorporation of digoxigenin-labeled UTP as indicated by the protocol (Roche). Probes corresponding to the full-length GPR54 and probes corresponding to the C-terminal tail (which is the most divergent region of the receptor between species) were synthesized. Probes specific for human GPR54 were generated in order to use the transfected cell lines available in the laboratory to establish the experimental conditions. The experiments performed and the
8
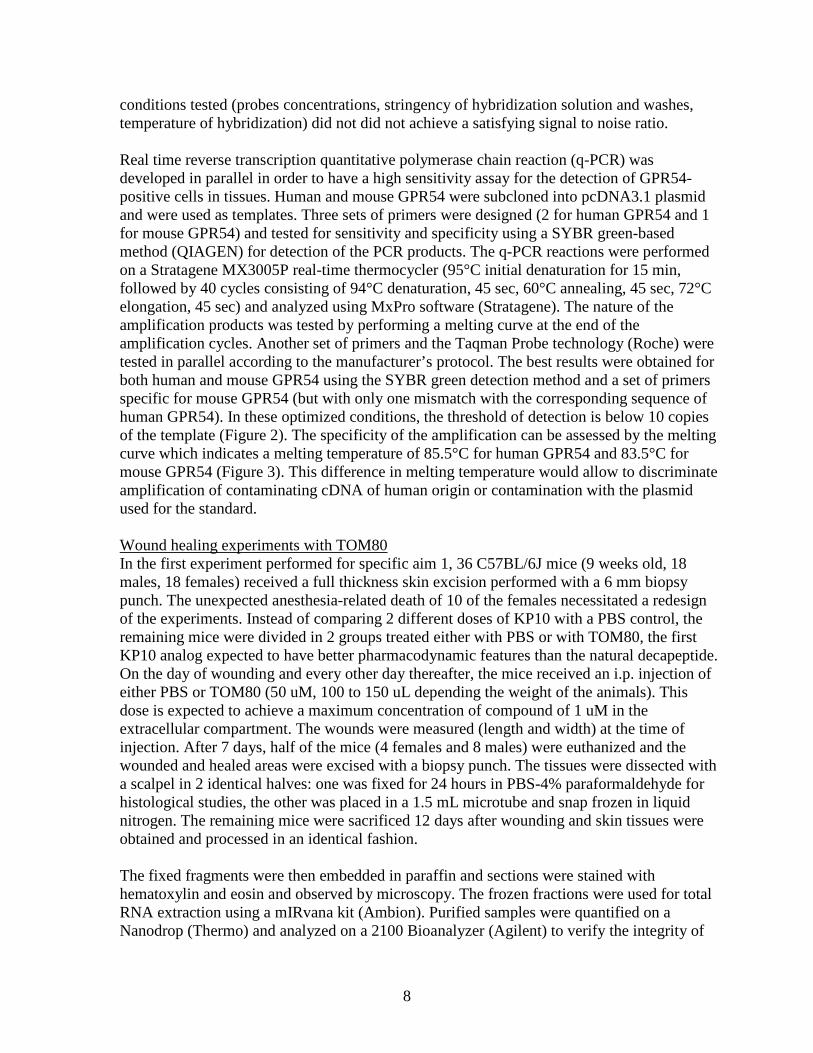
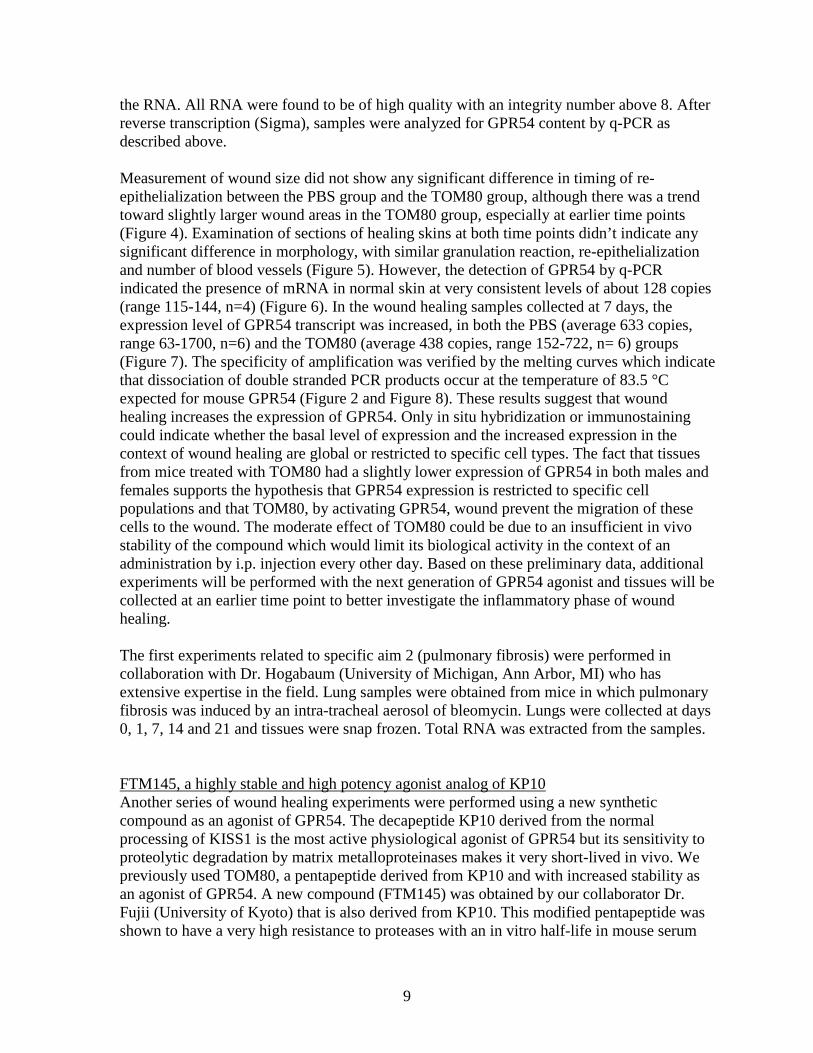
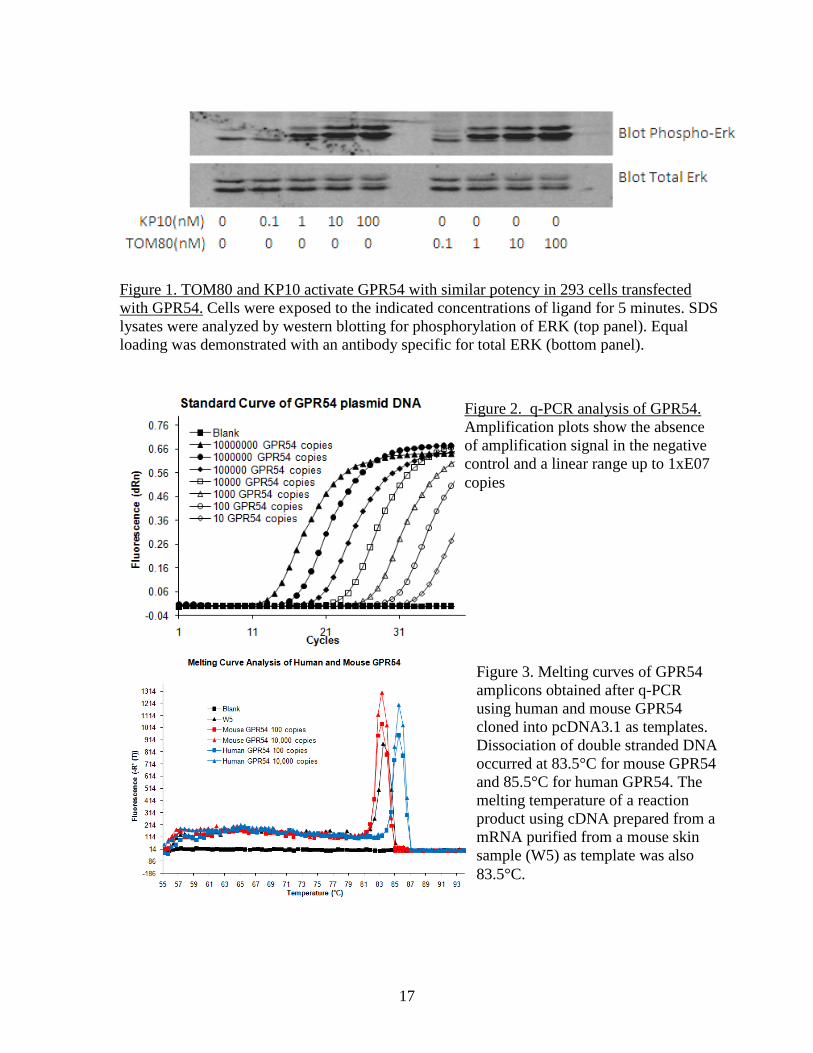
conditions tested (probes concentrations, stringency of hybridization solution and washes, temperature of hybridization) did not did not achieve a satisfying signal to noise ratio. Real time reverse transcription quantitative polymerase chain reaction (q-PCR) was developed in parallel in order to have a high sensitivity assay for the detection of GPR54-positive cells in tissues. Human and mouse GPR54 were subcloned into pcDNA3.1 plasmid and were used as templates. Three sets of primers were designed (2 for human GPR54 and 1 for mouse GPR54) and tested for sensitivity and specificity using a SYBR green-based method (QIAGEN) for detection of the PCR products. The q-PCR reactions were performed on a Stratagene MX3005P real-time thermocycler (95°C initial denaturation for 15 min, followed by 40 cycles consisting of 94°C denaturation, 45 sec, 60°C annealing, 45 sec, 72°C elongation, 45 sec) and analyzed using MxPro software (Stratagene). The nature of the amplification products was tested by performing a melting curve at the end of the amplification cycles. Another set of primers and the Taqman Probe technology (Roche) were tested in parallel according to the manufacturer’s protocol. The best results were obtained for both human and mouse GPR54 using the SYBR green detection method and a set of primers specific for mouse GPR54 (but with only one mismatch with the corresponding sequence of human GPR54). In these optimized conditions, the threshold of detection is below 10 copies of the template (Figure 2). The specificity of the amplification can be assessed by the melting curve which indicates a melting temperature of 85.5°C for human GPR54 and 83.5°C for mouse GPR54 (Figure 3). This difference in melting temperature would allow to discriminate amplification of contaminating cDNA of human origin or contamination with the plasmid used for the standard. Wound healing experiments with TOM80 In the first experiment performed for specific aim 1, 36 C57BL/6J mice (9 weeks old, 18 males, 18 females) received a full thickness skin excision performed with a 6 mm biopsy punch. The unexpected anesthesia-related death of 10 of the females necessitated a redesign of the experiments. Instead of comparing 2 different doses of KP10 with a PBS control, the remaining mice were divided in 2 groups treated either with PBS or with TOM80, the first KP10 analog expected to have better pharmacodynamic features than the natural decapeptide. On the day of wounding and every other day thereafter, the mice received an i.p. injection of either PBS or TOM80 (50 uM, 100 to 150 uL depending the weight of the animals). This dose is expected to achieve a maximum concentration of compound of 1 uM in the extracellular compartment. The wounds were measured (length and width) at the time of injection. After 7 days, half of the mice (4 females and 8 males) were euthanized and the wounded and healed areas were excised with a biopsy punch. The tissues were dissected with a scalpel in 2 identical halves: one was fixed for 24 hours in PBS-4% paraformaldehyde for histological studies, the other was placed in a 1.5 mL microtube and snap frozen in liquid nitrogen. The remaining mice were sacrificed 12 days after wounding and skin tissues were obtained and processed in an identical fashion. The fixed fragments were then embedded in paraffin and sections were stained with hematoxylin and eosin and observed by microscopy. The frozen fractions were used for total RNA extraction using a mIRvana kit (Ambion). Purified samples were quantified on a Nanodrop (Thermo) and analyzed on a 2100 Bioanalyzer (Agilent) to verify the integrity of
9
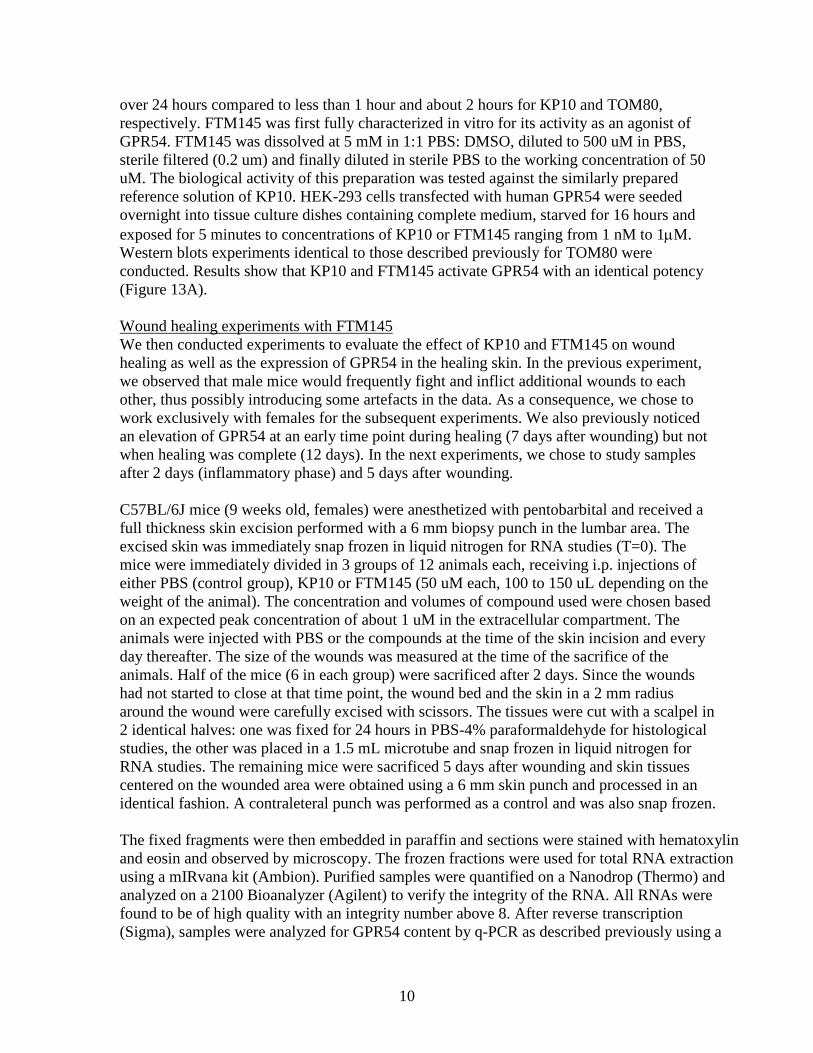
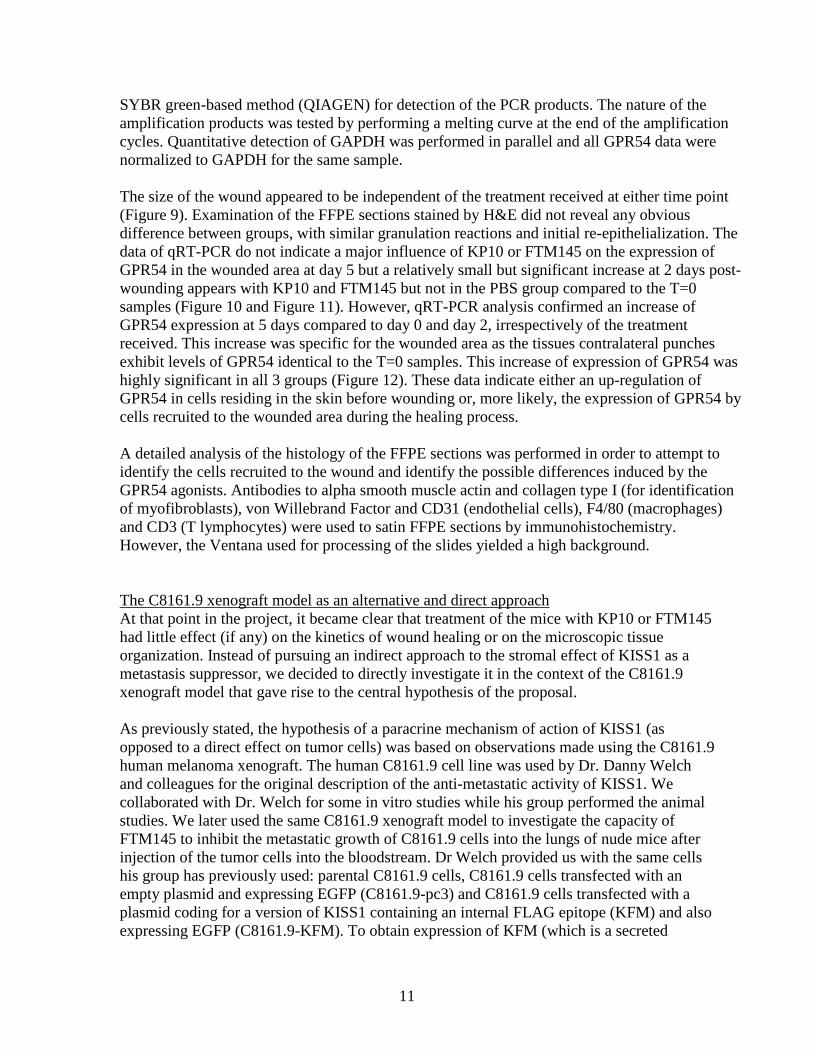
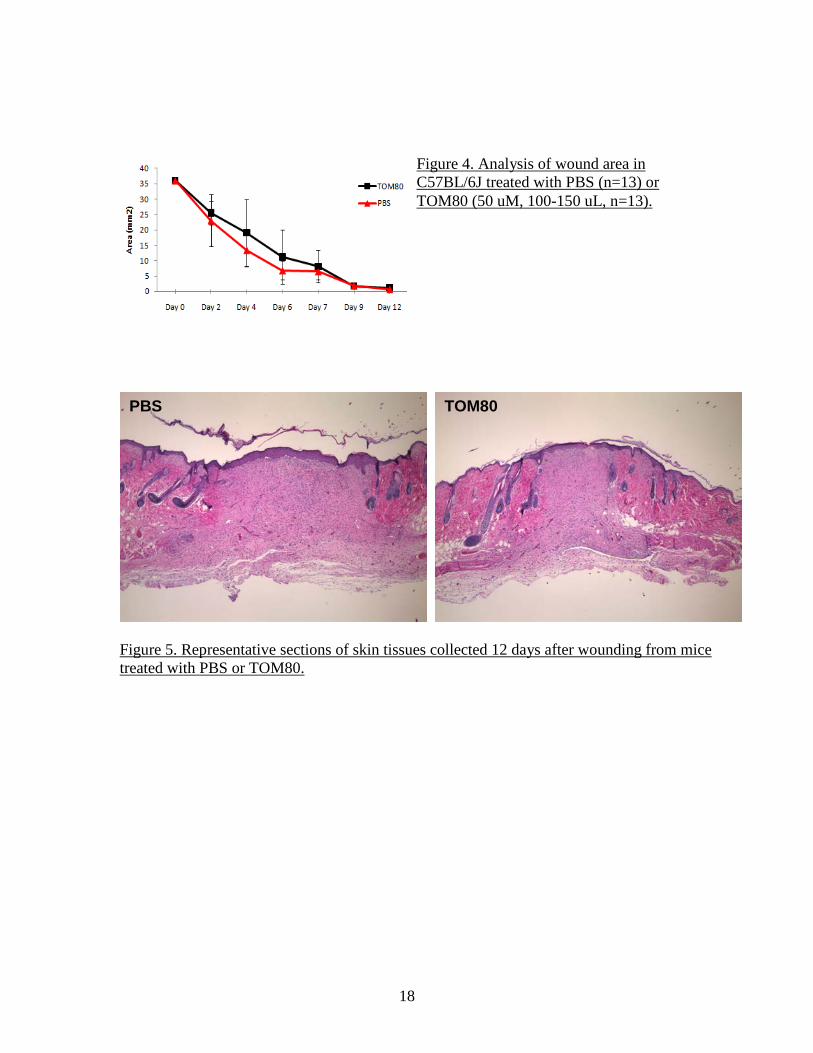
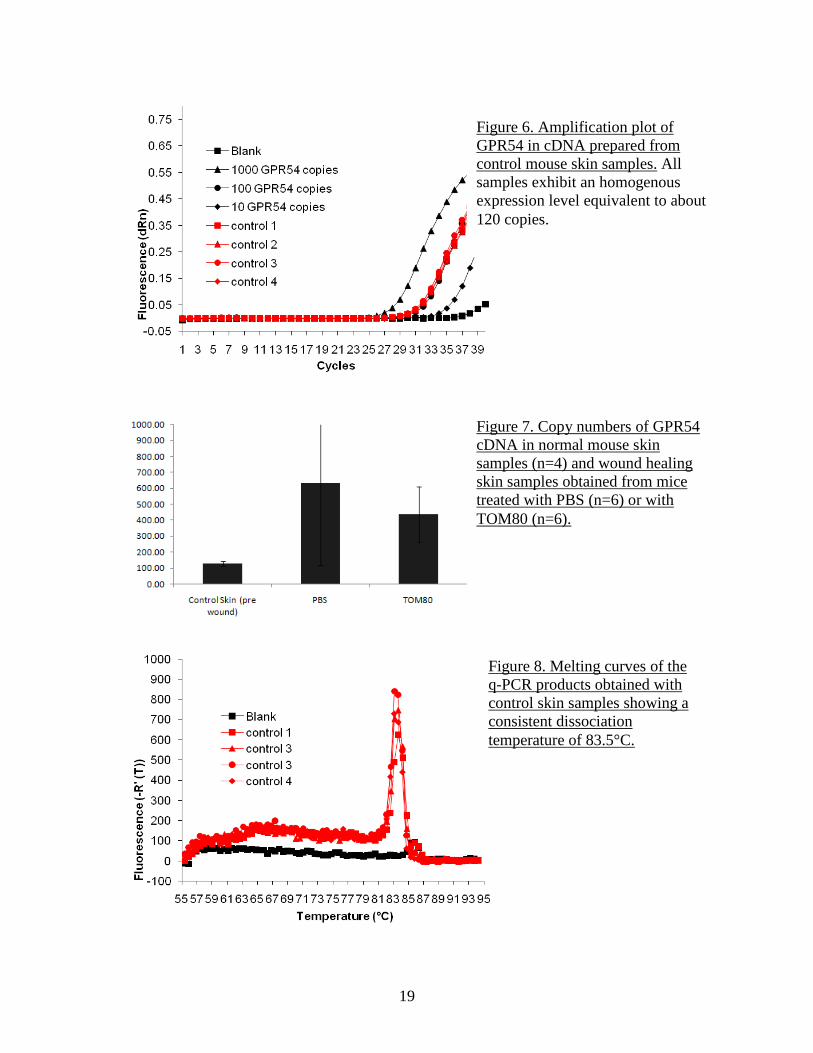
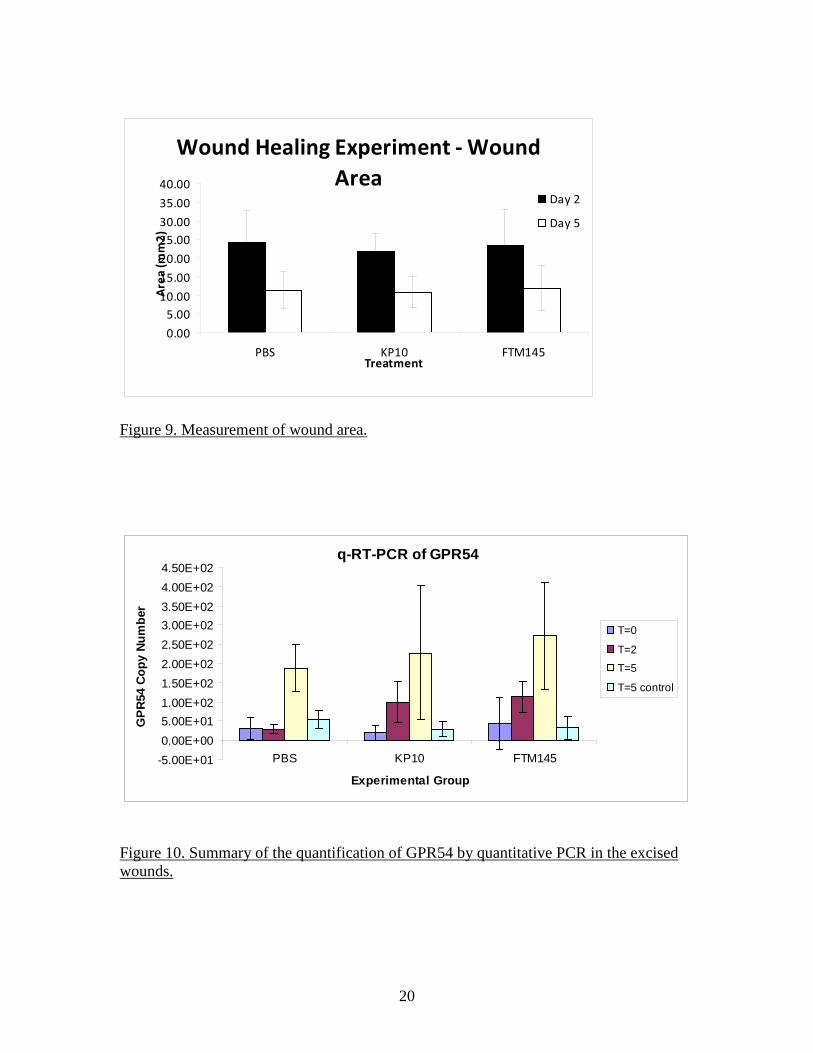
the RNA. All RNA were found to be of high quality with an integrity number above 8. After reverse transcription (Sigma), samples were analyzed for GPR54 content by q-PCR as described above. Measurement of wound size did not show any significant difference in timing of re-epithelialization between the PBS group and the TOM80 group, although there was a trend toward slightly larger wound areas in the TOM80 group, especially at earlier time points (Figure 4). Examination of sections of healing skins at both time points didn’t indicate any significant difference in morphology, with similar granulation reaction, re-epithelialization and number of blood vessels (Figure 5). However, the detection of GPR54 by q-PCR indicated the presence of mRNA in normal skin at very consistent levels of about 128 copies (range 115-144, n=4) (Figure 6). In the wound healing samples collected at 7 days, the expression level of GPR54 transcript was increased, in both the PBS (average 633 copies, range 63-1700, n=6) and the TOM80 (average 438 copies, range 152-722, n= 6) groups (Figure 7). The specificity of amplification was verified by the melting curves which indicate that dissociation of double stranded PCR products occur at the temperature of 83.5 °C expected for mouse GPR54 (Figure 2 and Figure 8). These results suggest that wound healing increases the expression of GPR54. Only in situ hybridization or immunostaining could indicate whether the basal level of expression and the increased expression in the context of wound healing are global or restricted to specific cell types. The fact that tissues from mice treated with TOM80 had a slightly lower expression of GPR54 in both males and females supports the hypothesis that GPR54 expression is restricted to specific cell populations and that TOM80, by activating GPR54, wound prevent the migration of these cells to the wound. The moderate effect of TOM80 could be due to an insufficient in vivo stability of the compound which would limit its biological activity in the context of an administration by i.p. injection every other day. Based on these preliminary data, additional experiments will be performed with the next generation of GPR54 agonist and tissues will be collected at an earlier time point to better investigate the inflammatory phase of wound healing. The first experiments related to specific aim 2 (pulmonary fibrosis) were performed in collaboration with Dr. Hogabaum (University of Michigan, Ann Arbor, MI) who has extensive expertise in the field. Lung samples were obtained from mice in which pulmonary fibrosis was induced by an intra-tracheal aerosol of bleomycin. Lungs were collected at days 0, 1, 7, 14 and 21 and tissues were snap frozen. Total RNA was extracted from the samples. FTM145, a highly stable and high potency agonist analog of KP10 Another series of wound healing experiments were performed using a new synthetic compound as an agonist of GPR54. The decapeptide KP10 derived from the normal processing of KISS1 is the most active physiological agonist of GPR54 but its sensitivity to proteolytic degradation by matrix metalloproteinases makes it very short-lived in vivo. We previously used TOM80, a pentapeptide derived from KP10 and with increased stability as an agonist of GPR54. A new compound (FTM145) was obtained by our collaborator Dr. Fujii (University of Kyoto) that is also derived from KP10. This modified pentapeptide was shown to have a very high resistance to proteases with an in vitro half-life in mouse serum
10
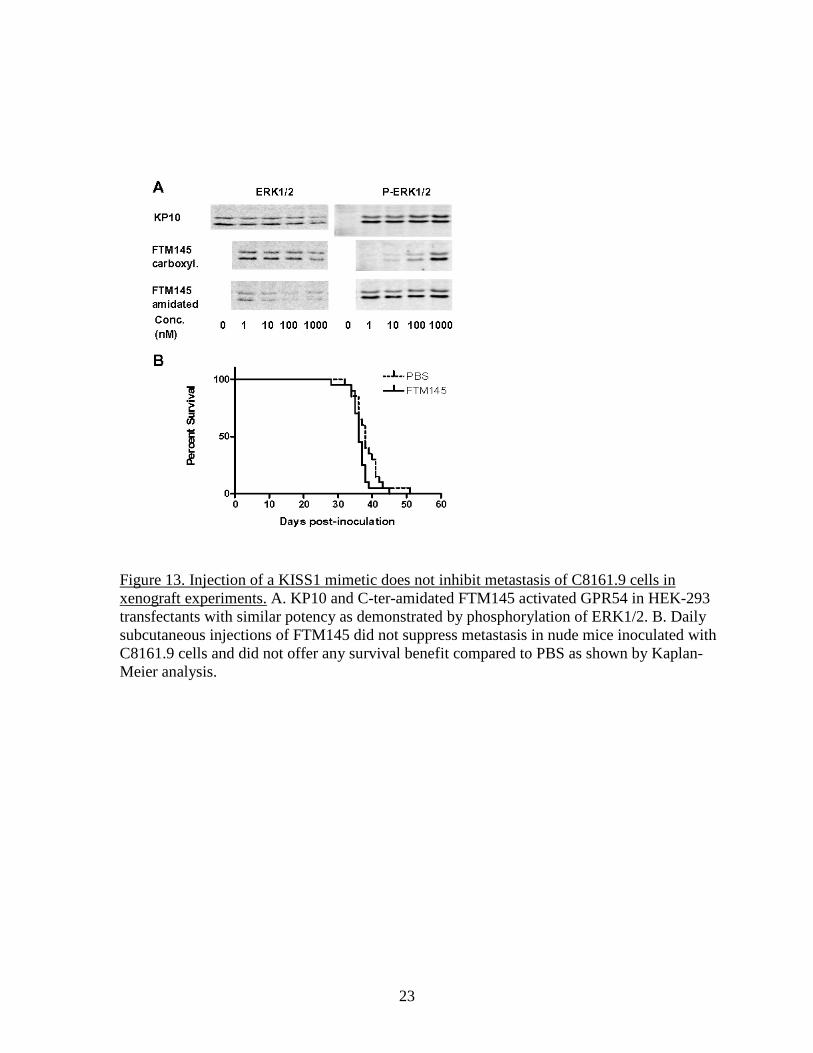
over 24 hours compared to less than 1 hour and about 2 hours for KP10 and TOM80, respectively. FTM145 was first fully characterized in vitro for its activity as an agonist of GPR54. FTM145 was dissolved at 5 mM in 1:1 PBS: DMSO, diluted to 500 uM in PBS, sterile filtered (0.2 um) and finally diluted in sterile PBS to the working concentration of 50 uM. The biological activity of this preparation was tested against the similarly prepared reference solution of KP10. HEK-293 cells transfected with human GPR54 were seeded overnight into tissue culture dishes containing complete medium, starved for 16 hours and exposed for 5 minutes to concentrations of KP10 or FTM145 ranging from 1 nM to 1µM. Western blots experiments identical to those described previously for TOM80 were conducted. Results show that KP10 and FTM145 activate GPR54 with an identical potency (Figure 13A). Wound healing experiments with FTM145 We then conducted experiments to evaluate the effect of KP10 and FTM145 on wound healing as well as the expression of GPR54 in the healing skin. In the previous experiment, we observed that male mice would frequently fight and inflict additional wounds to each other, thus possibly introducing some artefacts in the data. As a consequence, we chose to work exclusively with females for the subsequent experiments. We also previously noticed an elevation of GPR54 at an early time point during healing (7 days after wounding) but not when healing was complete (12 days). In the next experiments, we chose to study samples after 2 days (inflammatory phase) and 5 days after wounding. C57BL/6J mice (9 weeks old, females) were anesthetized with pentobarbital and received a full thickness skin excision performed with a 6 mm biopsy punch in the lumbar area. The excised skin was immediately snap frozen in liquid nitrogen for RNA studies (T=0). The mice were immediately divided in 3 groups of 12 animals each, receiving i.p. injections of either PBS (control group), KP10 or FTM145 (50 uM each, 100 to 150 uL depending on the weight of the animal). The concentration and volumes of compound used were chosen based on an expected peak concentration of about 1 uM in the extracellular compartment. The animals were injected with PBS or the compounds at the time of the skin incision and every day thereafter. The size of the wounds was measured at the time of the sacrifice of the animals. Half of the mice (6 in each group) were sacrificed after 2 days. Since the wounds had not started to close at that time point, the wound bed and the skin in a 2 mm radius around the wound were carefully excised with scissors. The tissues were cut with a scalpel in 2 identical halves: one was fixed for 24 hours in PBS-4% paraformaldehyde for histological studies, the other was placed in a 1.5 mL microtube and snap frozen in liquid nitrogen for RNA studies. The remaining mice were sacrificed 5 days after wounding and skin tissues centered on the wounded area were obtained using a 6 mm skin punch and processed in an identical fashion. A contraleteral punch was performed as a control and was also snap frozen. The fixed fragments were then embedded in paraffin and sections were stained with hematoxylin and eosin and observed by microscopy. The frozen fractions were used for total RNA extraction using a mIRvana kit (Ambion). Purified samples were quantified on a Nanodrop (Thermo) and analyzed on a 2100 Bioanalyzer (Agilent) to verify the integrity of the RNA. All RNAs were found to be of high quality with an integrity number above 8. After reverse transcription (Sigma), samples were analyzed for GPR54 content by q-PCR as described previously using a
11
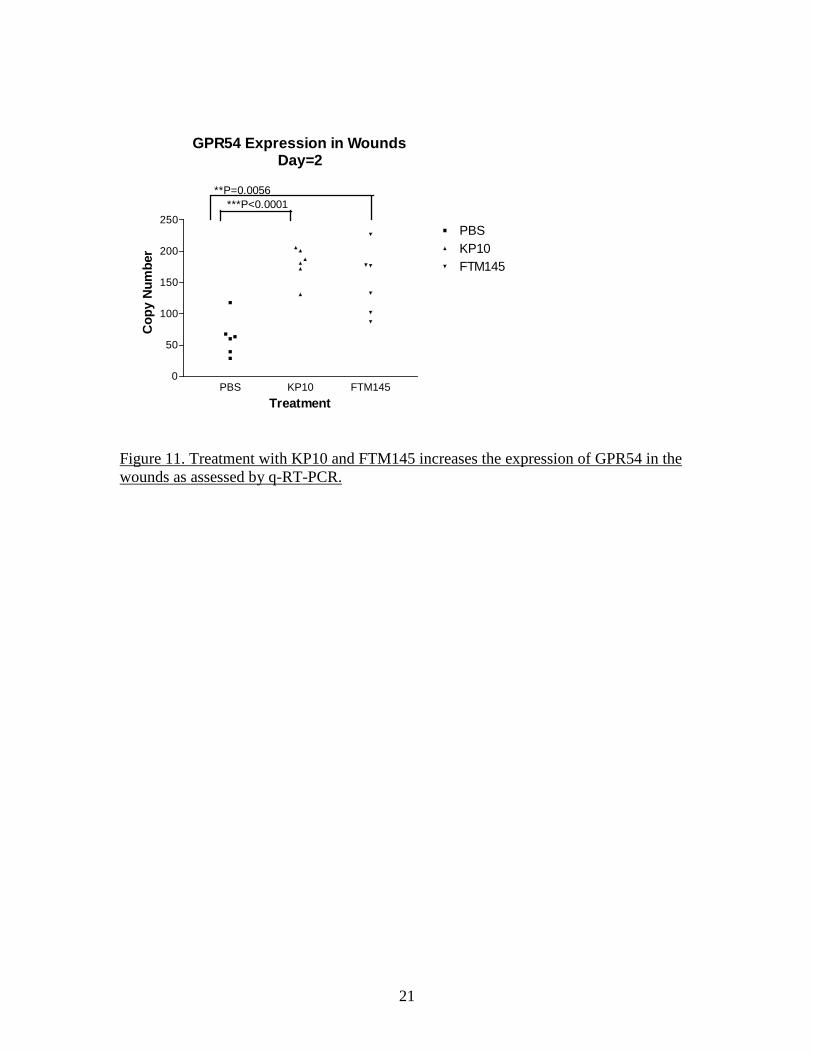
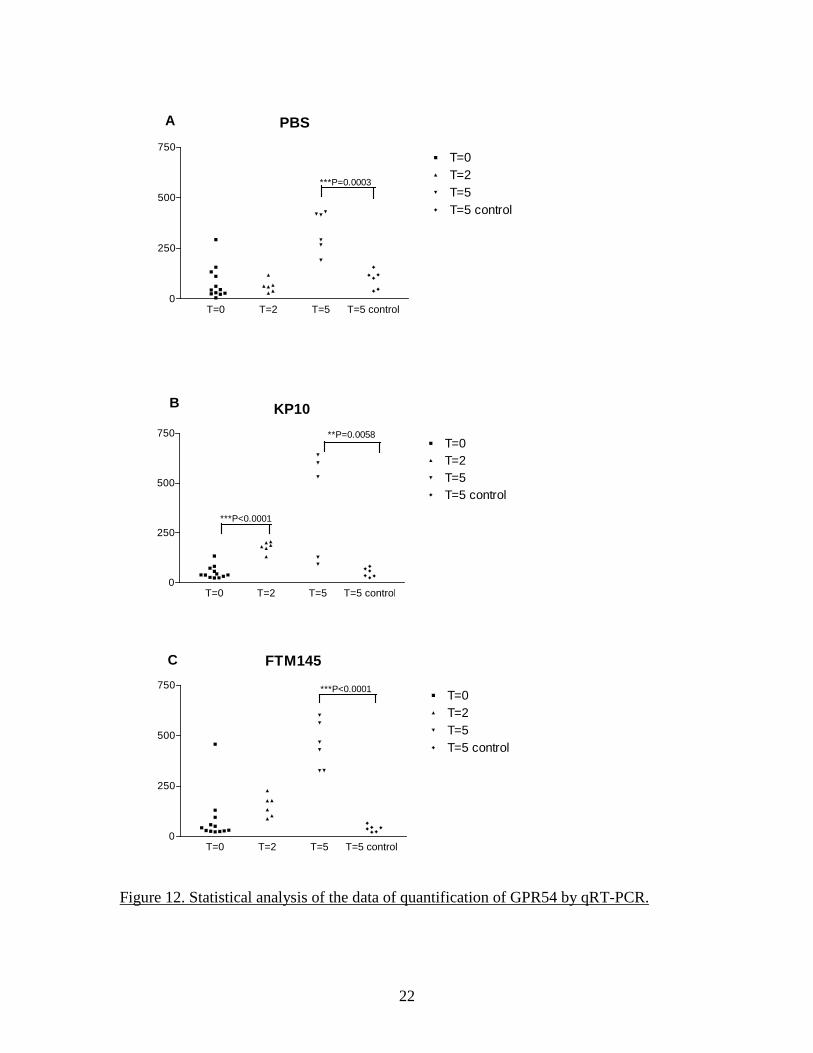
SYBR green-based method (QIAGEN) for detection of the PCR products. The nature of the amplification products was tested by performing a melting curve at the end of the amplification cycles. Quantitative detection of GAPDH was performed in parallel and all GPR54 data were normalized to GAPDH for the same sample. The size of the wound appeared to be independent of the treatment received at either time point (Figure 9). Examination of the FFPE sections stained by H&E did not reveal any obvious difference between groups, with similar granulation reactions and initial re-epithelialization. The data of qRT-PCR do not indicate a major influence of KP10 or FTM145 on the expression of GPR54 in the wounded area at day 5 but a relatively small but significant increase at 2 days post-wounding appears with KP10 and FTM145 but not in the PBS group compared to the T=0 samples (Figure 10 and Figure 11). However, qRT-PCR analysis confirmed an increase of GPR54 expression at 5 days compared to day 0 and day 2, irrespectively of the treatment received. This increase was specific for the wounded area as the tissues contralateral punches exhibit levels of GPR54 identical to the T=0 samples. This increase of expression of GPR54 was highly significant in all 3 groups (Figure 12). These data indicate either an up-regulation of GPR54 in cells residing in the skin before wounding or, more likely, the expression of GPR54 by cells recruited to the wounded area during the healing process. A detailed analysis of the histology of the FFPE sections was performed in order to attempt to identify the cells recruited to the wound and identify the possible differences induced by the GPR54 agonists. Antibodies to alpha smooth muscle actin and collagen type I (for identification of myofibroblasts), von Willebrand Factor and CD31 (endothelial cells), F4/80 (macrophages) and CD3 (T lymphocytes) were used to satin FFPE sections by immunohistochemistry. However, the Ventana used for processing of the slides yielded a high background. The C8161.9 xenograft model as an alternative and direct approach At that point in the project, it became clear that treatment of the mice with KP10 or FTM145 had little effect (if any) on the kinetics of wound healing or on the microscopic tissue organization. Instead of pursuing an indirect approach to the stromal effect of KISS1 as a metastasis suppressor, we decided to directly investigate it in the context of the C8161.9 xenograft model that gave rise to the central hypothesis of the proposal. As previously stated, the hypothesis of a paracrine mechanism of action of KISS1 (as opposed to a direct effect on tumor cells) was based on observations made using the C8161.9 human melanoma xenograft. The human C8161.9 cell line was used by Dr. Danny Welch and colleagues for the original description of the anti-metastatic activity of KISS1. We collaborated with Dr. Welch for some in vitro studies while his group performed the animal studies. We later used the same C8161.9 xenograft model to investigate the capacity of FTM145 to inhibit the metastatic growth of C8161.9 cells into the lungs of nude mice after injection of the tumor cells into the bloodstream. Dr Welch provided us with the same cells his group has previously used: parental C8161.9 cells, C8161.9 cells transfected with an empty plasmid and expressing EGFP (C8161.9-pc3) and C8161.9 cells transfected with a plasmid coding for a version of KISS1 containing an internal FLAG epitope (KFM) and also expressing EGFP (C8161.9-KFM). To obtain expression of KFM (which is a secreted
12
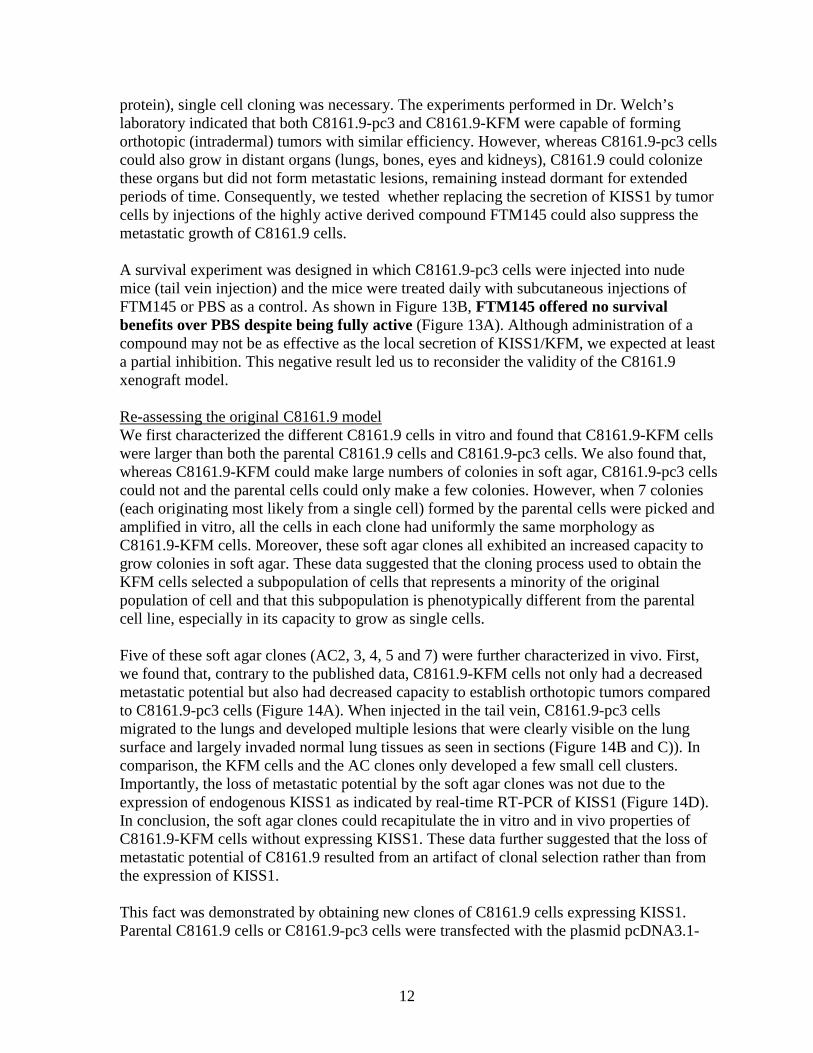
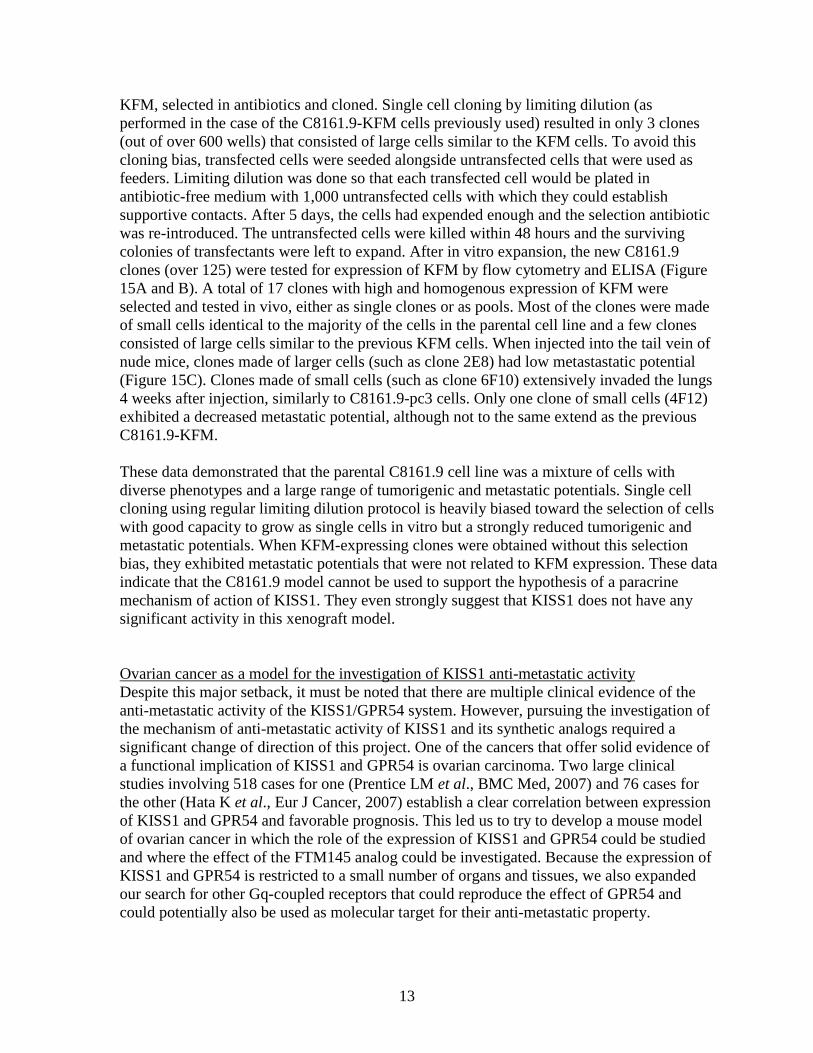
protein), single cell cloning was necessary. The experiments performed in Dr. Welch’s laboratory indicated that both C8161.9-pc3 and C8161.9-KFM were capable of forming orthotopic (intradermal) tumors with similar efficiency. However, whereas C8161.9-pc3 cells could also grow in distant organs (lungs, bones, eyes and kidneys), C8161.9 could colonize these organs but did not form metastatic lesions, remaining instead dormant for extended periods of time. Consequently, we tested whether replacing the secretion of KISS1 by tumor cells by injections of the highly active derived compound FTM145 could also suppress the metastatic growth of C8161.9 cells. A survival experiment was designed in which C8161.9-pc3 cells were injected into nude mice (tail vein injection) and the mice were treated daily with subcutaneous injections of FTM145 or PBS as a control. As shown in Figure 13B, FTM145 offered no survival benefits over PBS despite being fully active (Figure 13A). Although administration of a compound may not be as effective as the local secretion of KISS1/KFM, we expected at least a partial inhibition. This negative result led us to reconsider the validity of the C8161.9 xenograft model. Re-assessing the original C8161.9 model We first characterized the different C8161.9 cells in vitro and found that C8161.9-KFM cells were larger than both the parental C8161.9 cells and C8161.9-pc3 cells. We also found that, whereas C8161.9-KFM could make large numbers of colonies in soft agar, C8161.9-pc3 cells could not and the parental cells could only make a few colonies. However, when 7 colonies (each originating most likely from a single cell) formed by the parental cells were picked and amplified in vitro, all the cells in each clone had uniformly the same morphology as C8161.9-KFM cells. Moreover, these soft agar clones all exhibited an increased capacity to grow colonies in soft agar. These data suggested that the cloning process used to obtain the KFM cells selected a subpopulation of cells that represents a minority of the original population of cell and that this subpopulation is phenotypically different from the parental cell line, especially in its capacity to grow as single cells. Five of these soft agar clones (AC2, 3, 4, 5 and 7) were further characterized in vivo. First, we found that, contrary to the published data, C8161.9-KFM cells not only had a decreased metastatic potential but also had decreased capacity to establish orthotopic tumors compared to C8161.9-pc3 cells (Figure 14A). When injected in the tail vein, C8161.9-pc3 cells migrated to the lungs and developed multiple lesions that were clearly visible on the lung surface and largely invaded normal lung tissues as seen in sections (Figure 14B and C)). In comparison, the KFM cells and the AC clones only developed a few small cell clusters. Importantly, the loss of metastatic potential by the soft agar clones was not due to the expression of endogenous KISS1 as indicated by real-time RT-PCR of KISS1 (Figure 14D). In conclusion, the soft agar clones could recapitulate the in vitro and in vivo properties of C8161.9-KFM cells without expressing KISS1. These data further suggested that the loss of metastatic potential of C8161.9 resulted from an artifact of clonal selection rather than from the expression of KISS1. This fact was demonstrated by obtaining new clones of C8161.9 cells expressing KISS1. Parental C8161.9 cells or C8161.9-pc3 cells were transfected with the plasmid pcDNA3.1-
13
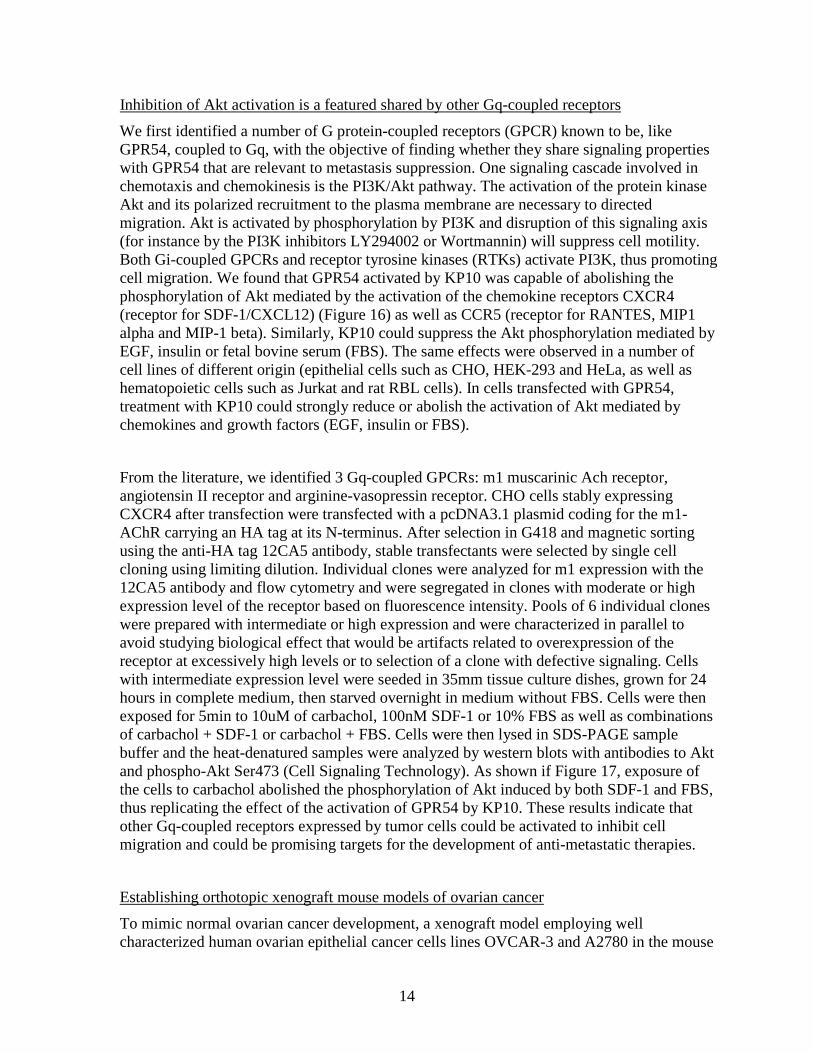
KFM, selected in antibiotics and cloned. Single cell cloning by limiting dilution (as performed in the case of the C8161.9-KFM cells previously used) resulted in only 3 clones (out of over 600 wells) that consisted of large cells similar to the KFM cells. To avoid this cloning bias, transfected cells were seeded alongside untransfected cells that were used as feeders. Limiting dilution was done so that each transfected cell would be plated in antibiotic-free medium with 1,000 untransfected cells with which they could establish supportive contacts. After 5 days, the cells had expended enough and the selection antibiotic was re-introduced. The untransfected cells were killed within 48 hours and the surviving colonies of transfectants were left to expand. After in vitro expansion, the new C8161.9 clones (over 125) were tested for expression of KFM by flow cytometry and ELISA (Figure 15A and B). A total of 17 clones with high and homogenous expression of KFM were selected and tested in vivo, either as single clones or as pools. Most of the clones were made of small cells identical to the majority of the cells in the parental cell line and a few clones consisted of large cells similar to the previous KFM cells. When injected into the tail vein of nude mice, clones made of larger cells (such as clone 2E8) had low metastastatic potential (Figure 15C). Clones made of small cells (such as clone 6F10) extensively invaded the lungs 4 weeks after injection, similarly to C8161.9-pc3 cells. Only one clone of small cells (4F12) exhibited a decreased metastatic potential, although not to the same extend as the previous C8161.9-KFM. These data demonstrated that the parental C8161.9 cell line was a mixture of cells with diverse phenotypes and a large range of tumorigenic and metastatic potentials. Single cell cloning using regular limiting dilution protocol is heavily biased toward the selection of cells with good capacity to grow as single cells in vitro but a strongly reduced tumorigenic and metastatic potentials. When KFM-expressing clones were obtained without this selection bias, they exhibited metastatic potentials that were not related to KFM expression. These data indicate that the C8161.9 model cannot be used to support the hypothesis of a paracrine mechanism of action of KISS1. They even strongly suggest that KISS1 does not have any significant activity in this xenograft model. Ovarian cancer as a model for the investigation of KISS1 anti-metastatic activity Despite this major setback, it must be noted that there are multiple clinical evidence of the anti-metastatic activity of the KISS1/GPR54 system. However, pursuing the investigation of the mechanism of anti-metastatic activity of KISS1 and its synthetic analogs required a significant change of direction of this project. One of the cancers that offer solid evidence of a functional implication of KISS1 and GPR54 is ovarian carcinoma. Two large clinical studies involving 518 cases for one (Prentice LM et al., BMC Med, 2007) and 76 cases for the other (Hata K et al., Eur J Cancer, 2007) establish a clear correlation between expression of KISS1 and GPR54 and favorable prognosis. This led us to try to develop a mouse model of ovarian cancer in which the role of the expression of KISS1 and GPR54 could be studied and where the effect of the FTM145 analog could be investigated. Because the expression of KISS1 and GPR54 is restricted to a small number of organs and tissues, we also expanded our search for other Gq-coupled receptors that could reproduce the effect of GPR54 and could potentially also be used as molecular target for their anti-metastatic property.
14
Inhibition of Akt activation is a featured shared by other Gq-coupled receptors
We first identified a number of G protein-coupled receptors (GPCR) known to be, like GPR54, coupled to Gq, with the objective of finding whether they share signaling properties with GPR54 that are relevant to metastasis suppression. One signaling cascade involved in chemotaxis and chemokinesis is the PI3K/Akt pathway. The activation of the protein kinase Akt and its polarized recruitment to the plasma membrane are necessary to directed migration. Akt is activated by phosphorylation by PI3K and disruption of this signaling axis (for instance by the PI3K inhibitors LY294002 or Wortmannin) will suppress cell motility. Both Gi-coupled GPCRs and receptor tyrosine kinases (RTKs) activate PI3K, thus promoting cell migration. We found that GPR54 activated by KP10 was capable of abolishing the phosphorylation of Akt mediated by the activation of the chemokine receptors CXCR4 (receptor for SDF-1/CXCL12) (Figure 16) as well as CCR5 (receptor for RANTES, MIP1 alpha and MIP-1 beta). Similarly, KP10 could suppress the Akt phosphorylation mediated by EGF, insulin or fetal bovine serum (FBS). The same effects were observed in a number of cell lines of different origin (epithelial cells such as CHO, HEK-293 and HeLa, as well as hematopoietic cells such as Jurkat and rat RBL cells). In cells transfected with GPR54, treatment with KP10 could strongly reduce or abolish the activation of Akt mediated by chemokines and growth factors (EGF, insulin or FBS).
From the literature, we identified 3 Gq-coupled GPCRs: m1 muscarinic Ach receptor, angiotensin II receptor and arginine-vasopressin receptor. CHO cells stably expressing CXCR4 after transfection were transfected with a pcDNA3.1 plasmid coding for the m1-AChR carrying an HA tag at its N-terminus. After selection in G418 and magnetic sorting using the anti-HA tag 12CA5 antibody, stable transfectants were selected by single cell cloning using limiting dilution. Individual clones were analyzed for m1 expression with the 12CA5 antibody and flow cytometry and were segregated in clones with moderate or high expression level of the receptor based on fluorescence intensity. Pools of 6 individual clones were prepared with intermediate or high expression and were characterized in parallel to avoid studying biological effect that would be artifacts related to overexpression of the receptor at excessively high levels or to selection of a clone with defective signaling. Cells with intermediate expression level were seeded in 35mm tissue culture dishes, grown for 24 hours in complete medium, then starved overnight in medium without FBS. Cells were then exposed for 5min to 10uM of carbachol, 100nM SDF-1 or 10% FBS as well as combinations of carbachol + SDF-1 or carbachol + FBS. Cells were then lysed in SDS-PAGE sample buffer and the heat-denatured samples were analyzed by western blots with antibodies to Akt and phospho-Akt Ser473 (Cell Signaling Technology). As shown if Figure 17, exposure of the cells to carbachol abolished the phosphorylation of Akt induced by both SDF-1 and FBS, thus replicating the effect of the activation of GPR54 by KP10. These results indicate that other Gq-coupled receptors expressed by tumor cells could be activated to inhibit cell migration and could be promising targets for the development of anti-metastatic therapies.
Establishing orthotopic xenograft mouse models of ovarian cancer
To mimic normal ovarian cancer development, a xenograft model employing well characterized human ovarian epithelial cancer cells lines OVCAR-3 and A2780 in the mouse
15
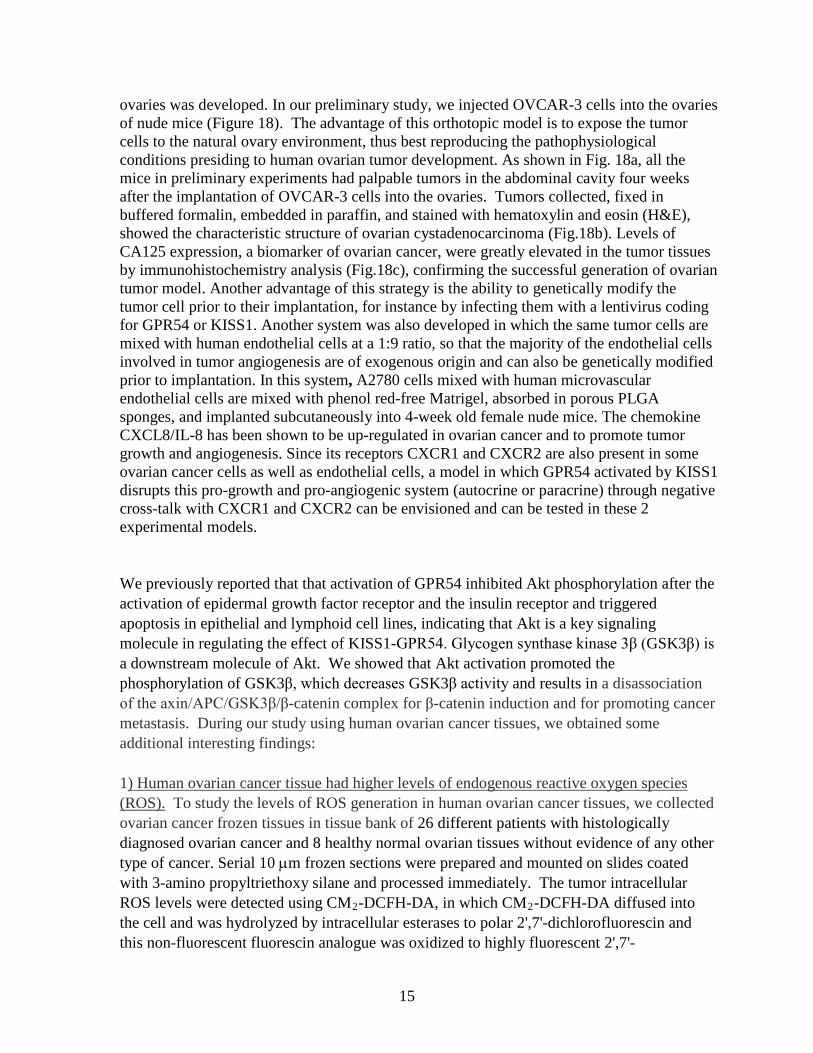
ovaries was developed. In our preliminary study, we injected OVCAR-3 cells into the ovaries of nude mice (Figure 18). The advantage of this orthotopic model is to expose the tumor cells to the natural ovary environment, thus best reproducing the pathophysiological conditions presiding to human ovarian tumor development. As shown in Fig. 18a, all the mice in preliminary experiments had palpable tumors in the abdominal cavity four weeks after the implantation of OVCAR-3 cells into the ovaries. Tumors collected, fixed in buffered formalin, embedded in paraffin, and stained with hematoxylin and eosin (H&E), showed the characteristic structure of ovarian cystadenocarcinoma (Fig.18b). Levels of CA125 expression, a biomarker of ovarian cancer, were greatly elevated in the tumor tissues by immunohistochemistry analysis (Fig.18c), confirming the successful generation of ovarian tumor model. Another advantage of this strategy is the ability to genetically modify the tumor cell prior to their implantation, for instance by infecting them with a lentivirus coding for GPR54 or KISS1. Another system was also developed in which the same tumor cells are mixed with human endothelial cells at a 1:9 ratio, so that the majority of the endothelial cells involved in tumor angiogenesis are of exogenous origin and can also be genetically modified prior to implantation. In this system, A2780 cells mixed with human microvascular endothelial cells are mixed with phenol red-free Matrigel, absorbed in porous PLGA sponges, and implanted subcutaneously into 4-week old female nude mice. The chemokine CXCL8/IL-8 has been shown to be up-regulated in ovarian cancer and to promote tumor growth and angiogenesis. Since its receptors CXCR1 and CXCR2 are also present in some ovarian cancer cells as well as endothelial cells, a model in which GPR54 activated by KISS1 disrupts this pro-growth and pro-angiogenic system (autocrine or paracrine) through negative cross-talk with CXCR1 and CXCR2 can be envisioned and can be tested in these 2 experimental models. We previously reported that that activation of GPR54 inhibited Akt phosphorylation after the activation of epidermal growth factor receptor and the insulin receptor and triggered apoptosis in epithelial and lymphoid cell lines, indicating that Akt is a key signaling molecule in regulating the effect of KISS1-GPR54. Glycogen synthase kinase 3β (GSK3β) is a downstream molecule of Akt. We showed that Akt activation promoted the phosphorylation of GSK3β, which decreases GSK3β activity and results in a disassociation of the axin/APC/GSK3β/β-catenin complex for β-catenin induction and for promoting cancer metastasis. During our study using human ovarian cancer tissues, we obtained some additional interesting findings: 1) Human ovarian cancer tissue had higher levels of endogenous reactive oxygen species (ROS). To study the levels of ROS generation in human ovarian cancer tissues, we collected ovarian cancer frozen tissues in tissue bank of 26 different patients with histologically diagnosed ovarian cancer and 8 healthy normal ovarian tissues without evidence of any other type of cancer. Serial 10 µm frozen sections were prepared and mounted on slides coated with 3-amino propyltriethoxy silane and processed immediately. The tumor intracellular ROS levels were detected using CM2-DCFH-DA, in which CM2-DCFH-DA diffused into the cell and was hydrolyzed by intracellular esterases to polar 2',7'-dichlorofluorescin and this non-fluorescent fluorescin analogue was oxidized to highly fluorescent 2',7'-
16
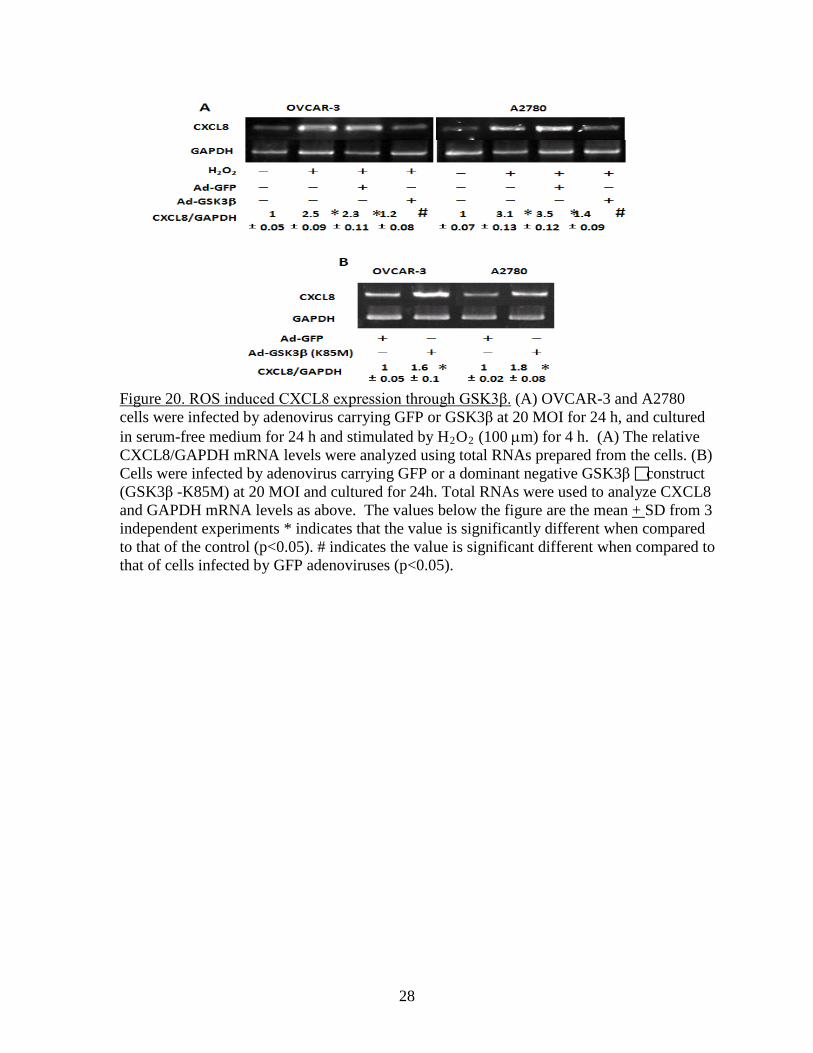
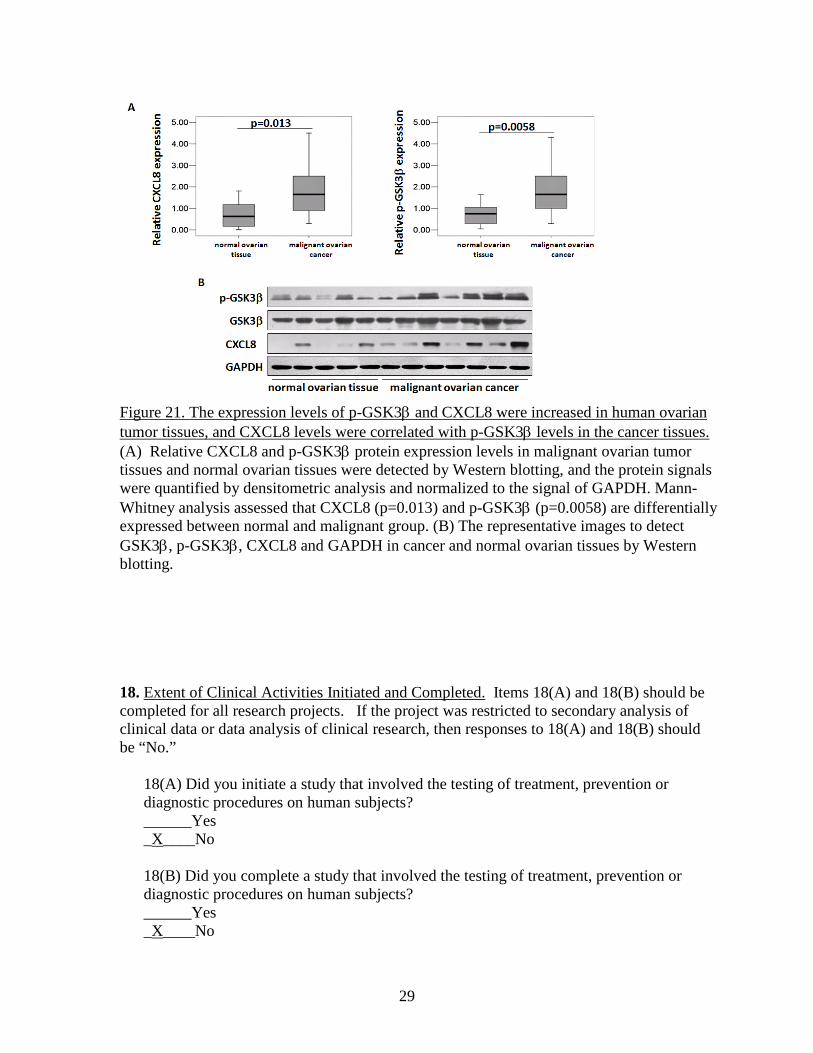
dichlorofluorescein by intracellular oxidants. The tissue sections were washed by cold 1×PBS buffer, and incubated with 10 µM CM2-DCFH-DA for 90 min. The sections were washed by cold 1×PBS and visualized under fluorescence microscope. The results showed that ovarian cancer tissues showed 10-fold higher levels of ROS when compared to normal ovarian tissues (Fig. 19). 2) ROS induced CXCL8 expression through GSK3β. To test whether ROS stimulates CXCL8 expression through GSK3β, ovarian cancer cells OVCAR-3 and A2780 were transduced with adenovirus carrying GFP or GSK3β for 24 h. After cultured in serum-free medium for 24 h, cells were treated with H2O2 (100 µm). The levels of CXCL8 were tested by RT-PCR analysis. We found that H2O2 treatment induced CXCL8 expression, while overexpression of wild-type GSK3β significantly inhibited H2O2-induced CXCL8 expression (Fig. 20A). On the contrary, overexpression of dominant negative form of GSK3β (K85 mutant, K85M) enhanced CXCL8 expression in ovarian cancer cells (Fig. 20B), suggesting that ROS stimulates CXCL8 production through GSK3β. 3) Higher expression levels of p-GSK-3β and CXCL8 were associated with ovarian cancer development. CXCL8 is important for cancer metastasis. Next, we determined the expression levels of CXCL8 and phospho-GSK3β (p-GSK3β) in ovarian cancer tissues, and analyzed the correlations between levels of CXCL8 and p-GSK3β) in cancer and normal tissues. By immunoblotting, we found that higher levels of both CXCL8 and p- GSK3β proteins were detected in cancer tissues, and that the expression levels of CXCL8 and p-GSK3β were significantly correlated with ovarian cancer development (Fig. 21). These results suggest that p-GSK3β levels are correlated with the induction of CXCL8 expression in vivo, and support the important and clinical relevance of our new findings: GSK3β regulates CXCL8 expression. Since the KISS1 receptor GPR54 can inhibit Akt activation, the effect of GPR54 on ROS generation, p-GSK3β and CXCL8 expression should be tested to elucidate the mechanism of GPR54 in suppressing ovarian cancer invasion and metastasis in the future.
17
Figure 1. TOM80 and KP10 activate GPR54 with similar potency in 293 cells transfected with GPR54. Cells were exposed to the indicated concentrations of ligand for 5 minutes. SDS lysates were analyzed by western blotting for phosphorylation of ERK (top panel). Equal loading was demonstrated with an antibody specific for total ERK (bottom panel).
Figure 2. q-PCR analysis of GPR54. Amplification plots show the absence of amplification signal in the negative control and a linear range up to 1xE07 copies
Figure 3. Melting curves of GPR54 amplicons obtained after q-PCR using human and mouse GPR54 cloned into pcDNA3.1 as templates. Dissociation of double stranded DNA occurred at 83.5°C for mouse GPR54 and 85.5°C for human GPR54. The melting temperature of a reaction product using cDNA prepared from a mRNA purified from a mouse skin sample (W5) as template was also 83.5°C.
18
Figure 5. Representative sections of skin tissues collected 12 days after wounding from mice treated with PBS or TOM80.
PBS TOM80
Figure 4. Analysis of wound area in C57BL/6J treated with PBS (n=13) or TOM80 (50 uM, 100-150 uL, n=13).
19
Figure 6. Amplification plot of GPR54 in cDNA prepared from control mouse skin samples. All samples exhibit an homogenous expression level equivalent to about 120 copies.
Figure 7. Copy numbers of GPR54 cDNA in normal mouse skin samples (n=4) and wound healing skin samples obtained from mice treated with PBS (n=6) or with TOM80 (n=6).
Figure 8. Melting curves of the q-PCR products obtained with control skin samples showing a consistent dissociation temperature of 83.5°C.
20
Wound Healing Experiment - Wound Area
0.005.00
10.0015.0020.0025.0030.0035.0040.00
PBS KP10 FTM145Treatment
Area
(mm
2)
Day 2
Day 5
Figure 9. Measurement of wound area.
q-RT-PCR of GPR54
-5.00E+010.00E+005.00E+011.00E+021.50E+022.00E+022.50E+023.00E+023.50E+024.00E+024.50E+02
PBS KP10 FTM145
Experimental Group
GPR
54 C
opy
Num
ber
T=0
T=2
T=5
T=5 control
Figure 10. Summary of the quantification of GPR54 by quantitative PCR in the excised wounds.
21
GPR54 Expression in WoundsDay=2
PBS KP10 FTM1450
50
100
150
200
250PBSKP10FTM145
Treatment
Cop
y N
umbe
r
***P<0.0001**P=0.0056
Figure 11. Treatment with KP10 and FTM145 increases the expression of GPR54 in the wounds as assessed by q-RT-PCR.
22
PBS
T=0 T=2 T=5 T=5 control0
250
500
750T=0T=2T=5T=5 control
KP10
T=0 T=2 T=5 T=5 control0
250
500
750T=0T=2T=5T=5 control
**P=0.0058
***P<0.0001
***P=0.0003
A
B
FTM145
T=0 T=2 T=5 T=5 control0
250
500
750T=0T=2T=5T=5 control
***P<0.0001
C
Figure 12. Statistical analysis of the data of quantification of GPR54 by qRT-PCR.
23
Figure 13. Injection of a KISS1 mimetic does not inhibit metastasis of C8161.9 cells in xenograft experiments. A. KP10 and C-ter-amidated FTM145 activated GPR54 in HEK-293 transfectants with similar potency as demonstrated by phosphorylation of ERK1/2. B. Daily subcutaneous injections of FTM145 did not suppress metastasis in nude mice inoculated with C8161.9 cells and did not offer any survival benefit compared to PBS as shown by Kaplan-Meier analysis.
24
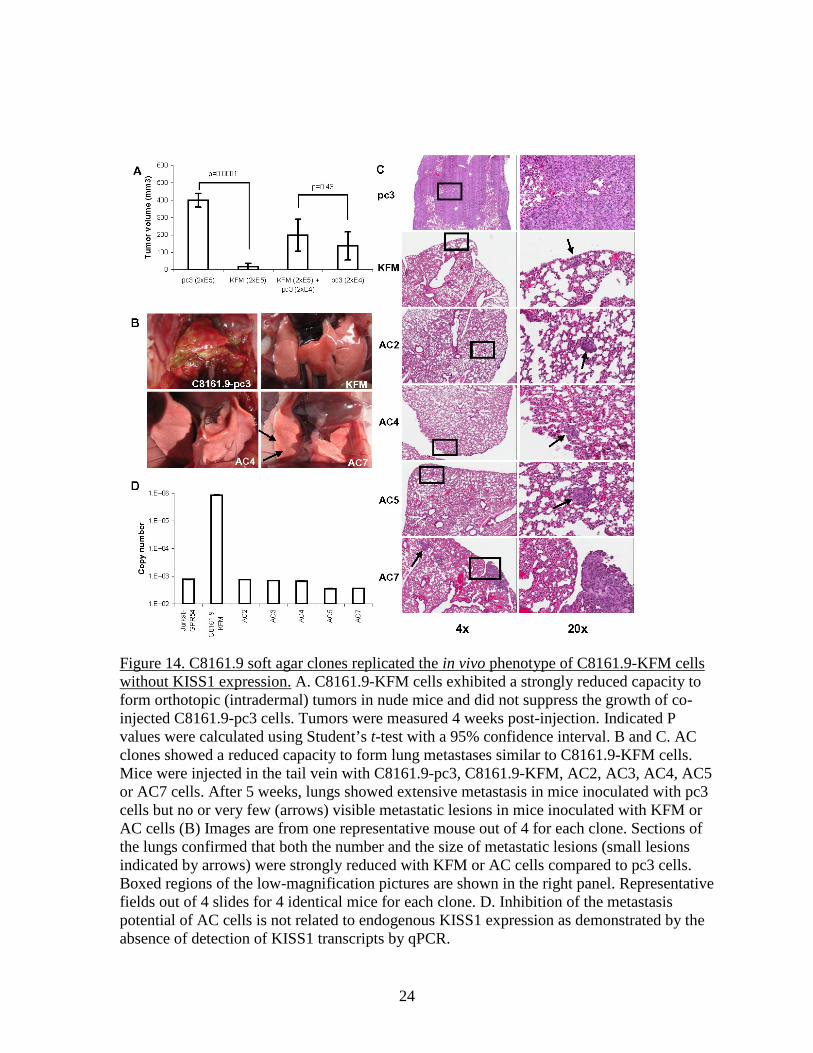
Figure 14. C8161.9 soft agar clones replicated the in vivo phenotype of C8161.9-KFM cells without KISS1 expression. A. C8161.9-KFM cells exhibited a strongly reduced capacity to form orthotopic (intradermal) tumors in nude mice and did not suppress the growth of co-injected C8161.9-pc3 cells. Tumors were measured 4 weeks post-injection. Indicated P values were calculated using Student’s t-test with a 95% confidence interval. B and C. AC clones showed a reduced capacity to form lung metastases similar to C8161.9-KFM cells. Mice were injected in the tail vein with C8161.9-pc3, C8161.9-KFM, AC2, AC3, AC4, AC5 or AC7 cells. After 5 weeks, lungs showed extensive metastasis in mice inoculated with pc3 cells but no or very few (arrows) visible metastatic lesions in mice inoculated with KFM or AC cells (B) Images are from one representative mouse out of 4 for each clone. Sections of the lungs confirmed that both the number and the size of metastatic lesions (small lesions indicated by arrows) were strongly reduced with KFM or AC cells compared to pc3 cells. Boxed regions of the low-magnification pictures are shown in the right panel. Representative fields out of 4 slides for 4 identical mice for each clone. D. Inhibition of the metastasis potential of AC cells is not related to endogenous KISS1 expression as demonstrated by the absence of detection of KISS1 transcripts by qPCR.
25
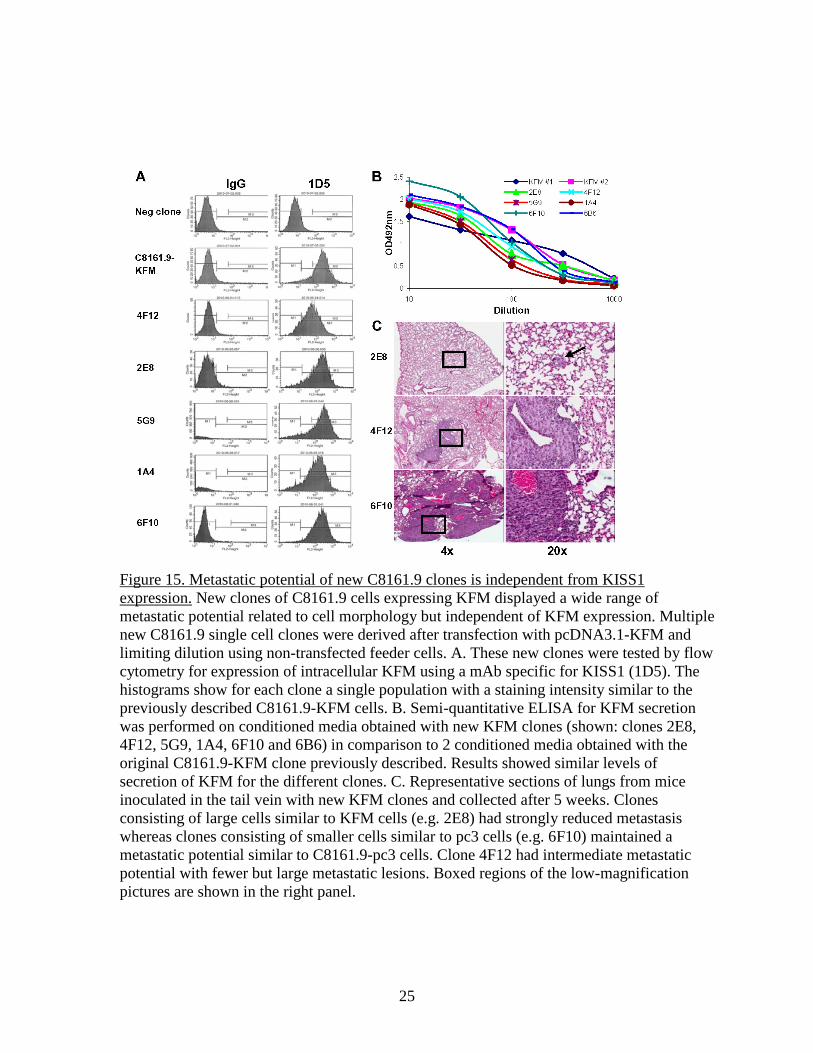
Figure 15. Metastatic potential of new C8161.9 clones is independent from KISS1 expression. New clones of C8161.9 cells expressing KFM displayed a wide range of metastatic potential related to cell morphology but independent of KFM expression. Multiple new C8161.9 single cell clones were derived after transfection with pcDNA3.1-KFM and limiting dilution using non-transfected feeder cells. A. These new clones were tested by flow cytometry for expression of intracellular KFM using a mAb specific for KISS1 (1D5). The histograms show for each clone a single population with a staining intensity similar to the previously described C8161.9-KFM cells. B. Semi-quantitative ELISA for KFM secretion was performed on conditioned media obtained with new KFM clones (shown: clones 2E8, 4F12, 5G9, 1A4, 6F10 and 6B6) in comparison to 2 conditioned media obtained with the original C8161.9-KFM clone previously described. Results showed similar levels of secretion of KFM for the different clones. C. Representative sections of lungs from mice inoculated in the tail vein with new KFM clones and collected after 5 weeks. Clones consisting of large cells similar to KFM cells (e.g. 2E8) had strongly reduced metastasis whereas clones consisting of smaller cells similar to pc3 cells (e.g. 6F10) maintained a metastatic potential similar to C8161.9-pc3 cells. Clone 4F12 had intermediate metastatic potential with fewer but large metastatic lesions. Boxed regions of the low-magnification pictures are shown in the right panel.
26
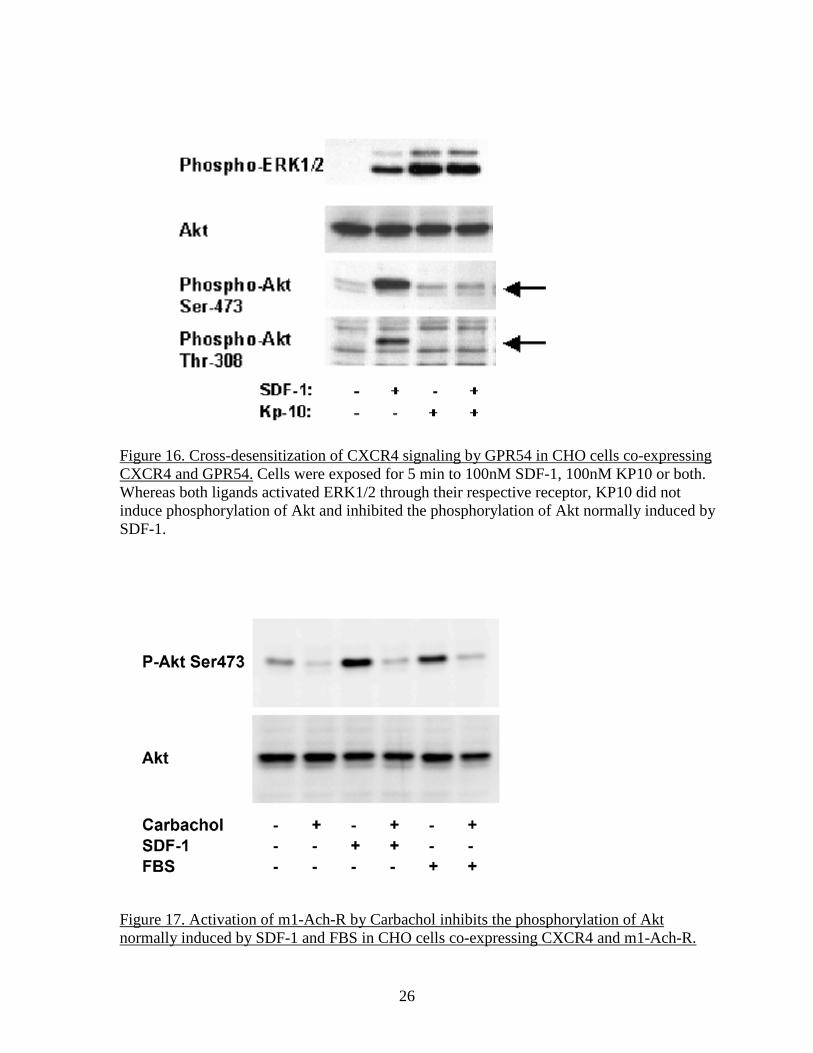
Figure 16. Cross-desensitization of CXCR4 signaling by GPR54 in CHO cells co-expressing CXCR4 and GPR54. Cells were exposed for 5 min to 100nM SDF-1, 100nM KP10 or both. Whereas both ligands activated ERK1/2 through their respective receptor, KP10 did not induce phosphorylation of Akt and inhibited the phosphorylation of Akt normally induced by SDF-1.
Figure 17. Activation of m1-Ach-R by Carbachol inhibits the phosphorylation of Akt normally induced by SDF-1 and FBS in CHO cells co-expressing CXCR4 and m1-Ach-R.
27
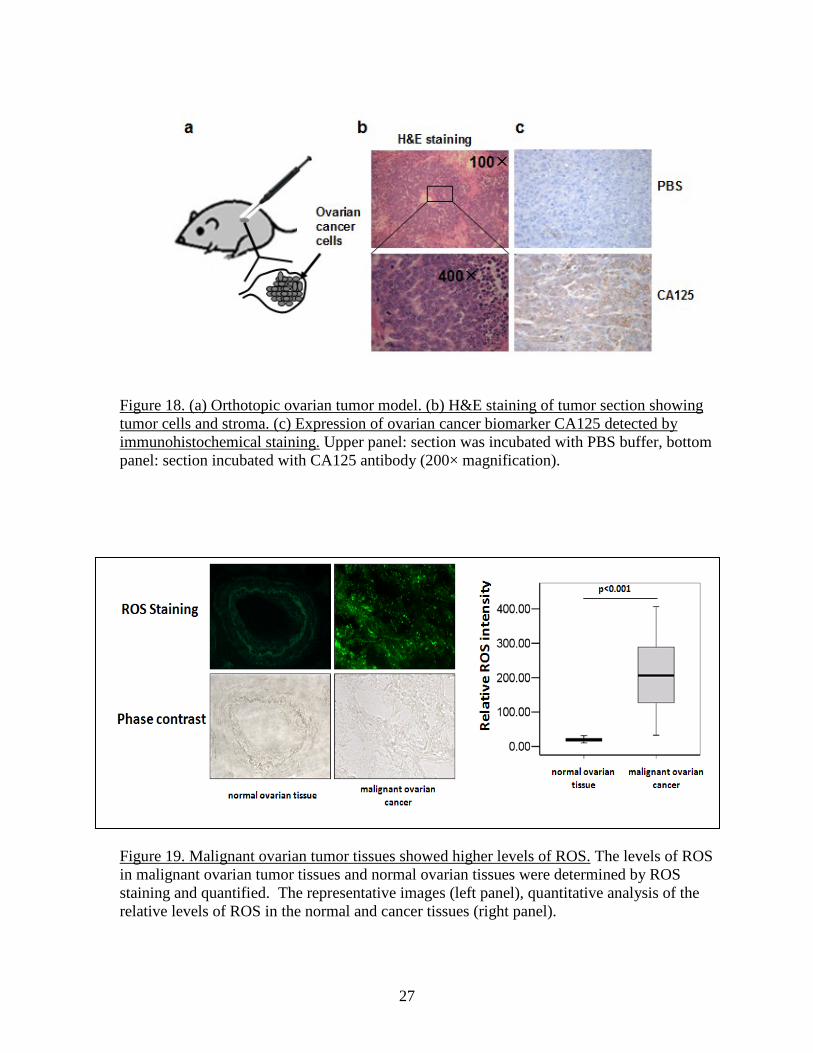
Figure 18. (a) Orthotopic ovarian tumor model. (b) H&E staining of tumor section showing tumor cells and stroma. (c) Expression of ovarian cancer biomarker CA125 detected by immunohistochemical staining. Upper panel: section was incubated with PBS buffer, bottom panel: section incubated with CA125 antibody (200× magnification). Figure 19. Malignant ovarian tumor tissues showed higher levels of ROS. The levels of ROS in malignant ovarian tumor tissues and normal ovarian tissues were determined by ROS staining and quantified. The representative images (left panel), quantitative analysis of the relative levels of ROS in the normal and cancer tissues (right panel).
28
Figure 20. ROS induced CXCL8 expression through GSK3β. (A) OVCAR-3 and A2780 cells were infected by adenovirus carrying GFP or GSK3β at 20 MOI for 24 h, and cultured in serum-free medium for 24 h and stimulated by H2O2 (100 µm) for 4 h. (A) The relative CXCL8/GAPDH mRNA levels were analyzed using total RNAs prepared from the cells. (B) Cells were infected by adenovirus carrying GFP or a dominant negative GSK3β construct (GSK3β -K85M) at 20 MOI and cultured for 24h. Total RNAs were used to analyze CXCL8 and GAPDH mRNA levels as above. The values below the figure are the mean + SD from 3 independent experiments * indicates that the value is significantly different when compared to that of the control (p<0.05). # indicates the value is significant different when compared to that of cells infected by GFP adenoviruses (p<0.05).
29
Figure 21. The expression levels of p-GSK3β and CXCL8 were increased in human ovarian tumor tissues, and CXCL8 levels were correlated with p-GSK3β levels in the cancer tissues. (A) Relative CXCL8 and p-GSK3β protein expression levels in malignant ovarian tumor tissues and normal ovarian tissues were detected by Western blotting, and the protein signals were quantified by densitometric analysis and normalized to the signal of GAPDH. Mann-Whitney analysis assessed that CXCL8 (p=0.013) and p-GSK3β (p=0.0058) are differentially expressed between normal and malignant group. (B) The representative images to detect GSK3β, p-GSK3β, CXCL8 and GAPDH in cancer and normal ovarian tissues by Western blotting. 18. Extent of Clinical Activities Initiated and Completed. Items 18(A) and 18(B) should be completed for all research projects. If the project was restricted to secondary analysis of clinical data or data analysis of clinical research, then responses to 18(A) and 18(B) should be “No.”
18(A) Did you initiate a study that involved the testing of treatment, prevention or diagnostic procedures on human subjects? ______Yes _X____No 18(B) Did you complete a study that involved the testing of treatment, prevention or diagnostic procedures on human subjects? ______Yes _X____No

30
If “Yes” to either 18(A) or 18(B), items 18(C) – (F) must also be completed. (Do NOT complete 18(C-F) if 18(A) and 18(B) are both “No.”)
18(C) How many hospital and health care professionals were involved in the research project? ______Number of hospital and health care professionals involved in the research project 18(D) How many subjects were included in the study compared to targeted goals? ______Number of subjects originally targeted to be included in the study ______Number of subjects enrolled in the study Note: Studies that fall dramatically short on recruitment are encouraged to provide the details of their recruitment efforts in Item 17, Progress in Achieving Research Goals, Objectives and Aims. For example, the number of eligible subjects approached, the number that refused to participate and the reasons for refusal. Without this information it is difficult to discern whether eligibility criteria were too restrictive or the study simply did not appeal to subjects. 18(E) How many subjects were enrolled in the study by gender, ethnicity and race? Gender: ______Males ______Females ______Unknown Ethnicity: ______Latinos or Hispanics ______Not Latinos or Hispanics ______Unknown Race: ______American Indian or Alaska Native ______Asian ______Blacks or African American ______Native Hawaiian or Other Pacific Islander ______White ______Other, specify: ______Unknown 18(F) Where was the research study conducted? (List the county where the research study was conducted. If the treatment, prevention and diagnostic tests were offered in more than one county, list all of the counties where the research study was conducted.)
31
19. Human Embryonic Stem Cell Research. Item 19(A) should be completed for all research projects. If the research project involved human embryonic stem cells, items 19(B) and 19(C) must also be completed.
19(A) Did this project involve, in any capacity, human embryonic stem cells? ______Yes ___X__ No 19(B) Were these stem cell lines NIH-approved lines that were derived outside of Pennsylvania? ______Yes ______ No 19(C) Please describe how this project involved human embryonic stem cells:
20. Articles Submitted to Peer-Reviewed Publications. 20(A) Identify all publications that resulted from the research performed during the funding period and that have been submitted to peer-reviewed publications. Do not list journal abstracts or presentations at professional meetings; abstract and meeting presentations should be listed at the end of item 17. Include only those publications that acknowledge the Pennsylvania Department of Health as a funding source (as required in the grant agreement). List the title of the journal article, the authors, the name of the peer-reviewed publication, the month and year when it was submitted, and the status of publication (submitted for publication, accepted for publication or published.). Submit an electronic copy of each publication or paper submitted for publication, listed in the table, in a PDF version 5.0.5 (or greater) format, 1,200 dpi. Filenames for each publication should include the number of the research project, the last name of the PI, the number of the publication and an abbreviated research project title. For example, if you submit two publications for PI Smith for the “Cognition and MRI in Older Adults” research project (Project 1), and two publications for PI Zhang for the “Lung Cancer” research project (Project 3), the filenames should be: Project 1 – Smith – Publication 1 – Cognition and MRI Project 1 – Smith – Publication 2 – Cognition and MRI Project 3 – Zhang – Publication 1 – Lung Cancer Project 3 – Zhang – Publication 2 – Lung Cancer If the publication is not available electronically, provide 5 paper copies of the publication. Note: The grant agreement requires that recipients acknowledge the Pennsylvania Department of Health funding in all publications. Please ensure that all publications listed acknowledge the Department of Health funding. If a publication does not acknowledge the funding from the Commonwealth, do not list the publication.
32
Title of Journal Article:
Authors: Name of Peer-reviewed Publication:
Month and Year Submitted:
Publication Status (check appropriate box below):
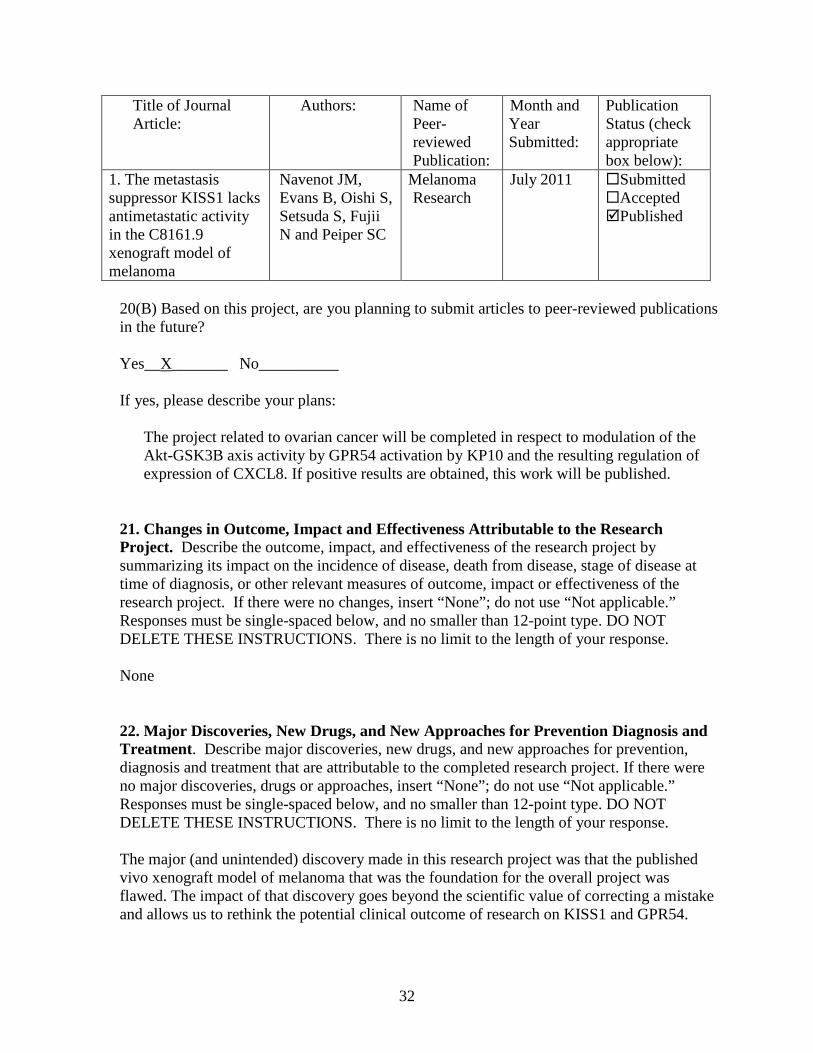
1. The metastasis suppressor KISS1 lacks antimetastatic activity in the C8161.9 xenograft model of melanoma
Navenot JM, Evans B, Oishi S, Setsuda S, Fujii N and Peiper SC
Melanoma Research
July 2011 Submitted Accepted Published
20(B) Based on this project, are you planning to submit articles to peer-reviewed publications in the future? Yes__X_______ No__________ If yes, please describe your plans:
The project related to ovarian cancer will be completed in respect to modulation of the Akt-GSK3B axis activity by GPR54 activation by KP10 and the resulting regulation of expression of CXCL8. If positive results are obtained, this work will be published.
21. Changes in Outcome, Impact and Effectiveness Attributable to the Research Project. Describe the outcome, impact, and effectiveness of the research project by summarizing its impact on the incidence of disease, death from disease, stage of disease at time of diagnosis, or other relevant measures of outcome, impact or effectiveness of the research project. If there were no changes, insert “None”; do not use “Not applicable.” Responses must be single-spaced below, and no smaller than 12-point type. DO NOT DELETE THESE INSTRUCTIONS. There is no limit to the length of your response. None 22. Major Discoveries, New Drugs, and New Approaches for Prevention Diagnosis and Treatment. Describe major discoveries, new drugs, and new approaches for prevention, diagnosis and treatment that are attributable to the completed research project. If there were no major discoveries, drugs or approaches, insert “None”; do not use “Not applicable.” Responses must be single-spaced below, and no smaller than 12-point type. DO NOT DELETE THESE INSTRUCTIONS. There is no limit to the length of your response. The major (and unintended) discovery made in this research project was that the published vivo xenograft model of melanoma that was the foundation for the overall project was flawed. The impact of that discovery goes beyond the scientific value of correcting a mistake and allows us to rethink the potential clinical outcome of research on KISS1 and GPR54.

33
23. Inventions, Patents and Commercial Development Opportunities. 23(A) Were any inventions, which may be patentable or otherwise protectable under Title 35 of the United States Code, conceived or first actually reduced to practice in the performance of work under this health research grant? Yes No X If “Yes” to 23(A), complete items a – g below for each invention. (Do NOT complete items a - g if 23(A) is “No.”)
a. Title of Invention: b. Name of Inventor(s): c. Technical Description of Invention (describe nature, purpose, operation and physical, chemical, biological or electrical characteristics of the invention): d. Was a patent filed for the invention conceived or first actually reduced to practice in the performance of work under this health research grant? Yes No If yes, indicate date patent was filed: e. Was a patent issued for the invention conceived or first actually reduced to practice in the performance of work under this health research grant? Yes No If yes, indicate number of patent, title and date issued: Patent number: Title of patent: Date issued: f. Were any licenses granted for the patent obtained as a result of work performed under this health research grant? Yes No If yes, how many licenses were granted? g. Were any commercial development activities taken to develop the invention into a commercial product or service for manufacture or sale? Yes No If yes, describe the commercial development activities:
23(B) Based on the results of this project, are you planning to file for any licenses or patents, or undertake any commercial development opportunities in the future?
Yes_________ No___X_______ If yes, please describe your plans:

34
24. Key Investigator Qualifications. Briefly describe the education, research interests and
experience and professional commitments of the Principal Investigator and all other key investigators. In place of narrative you may insert the NIH biosketch form here; however, please limit each biosketch to 1-2 pages. For Nonformula grants only – include information for only those key investigators whose biosketches were not included in the original grant application.
35
BIOGRAPHICAL SKETCH
NAME Stephen C. Peiper
POSITION TITLE Chairman and Peter A. Herbut Professor – Jefferson Medical College of Thomas Jefferson University
eRA COMMONS USER NAME
EDUCATION/TRAINING (Begin with baccalaureate or other initial professional education, such as nursing, and include postdoctoral training.)
INSTITUTION AND LOCATION DEGREE (if applicable)
YEAR(s) FIELD OF STUDY
Washington University, St. Louis, MO A.B. 1969 -1973 Biology St. Louis University, St. Louis, MO M.D. 1973-1977 Medicine University of North Carolina at Chapel Hill
Resident 1977-1981 Anat. & Clin. Path
A. Personal Statement I am a delegate of the American Board of Pathologists in Anatomic and Clinical Pathology. I have a long standing track record of publications in the study of G protein coupled receptors for chemokines including CXCR1 and CXCR2 (IL-8 receptors) and have demonstrated expertise in the immunohistochemical staining of formalin-fixed, paraffin-embedded tissues for chemokines and the cognate receptors. In addition, I have a track record of publications on the role of G protein coupled receptors, such as CXCR4, CCR5, and GPR54 in cell signaling in normal and neoplastic cells. I am directing the Diagnostic Molecular Pathology Laboratory, which includes state-of-the-art instrumentation for microarray analysis, next generation sequencing, methylated DNA immunoprecipitation, and automated immunohistochemical staining of human tissues. B. Positions and Honors Professional Appointments 1979-80 Fellow, Hematopathology, University of North Carolina at Chapel Hill 1980-81 Chief Resident & Clinical Instructor, Pathology, University of North Carolina at
Chapel Hill 1981-83 Research Associate, Pathology, St. Jude Children's Research Hospital,
Memphis, TN 1983-88 Assistant Member, Pathology, St. Jude Children's Research Hospital, Memphis,
TN 1983-88 Assistant Member, Tumor Cell Biology, St. Jude Children's Research Hospital,
Memphis, TN 1988-91 Associate Prof., Pathology, Medicine, Scientist, Cancer Center, University of
Alabama, Birmingham 1991-02 Agnes Brown Duggan Professor, Depts. of Pathology, Biochemistry & Molecular
Biology, Surgery, Chemistry, University of Louisville, Louisville, Kentucky 2002-08 Chairman & Edgar R Pund Professor, Department of Pathology, Medical College
of Georgia, Augusta, Georgia

36
2008 Chairman & Peter A Herbut Professor, Department of Pathology, Anatomy & Cell Biology, Thomas Jefferson University, Philadelphia, Pennsylvania
Awards and Honors 1977 Merck Book Award, School of Medicine, University of St. Louis 1977 Community Medicine Award, School of Medicine, University of St. Louis 1989 Benjamin Castleman Award, International Academy of Pathology 1991-02 Agnes Brown Duggan Professorship, University of Louisville 1993-95 Chair, Personnel for Research C Study Section, American Cancer Society 1996-00 Chair, Fogarty International Research Collaboration Study Section, National
Institutes of Health 1997-01 Veterans Health Administration, Research Program Review Division,
Subcommittee on Hematology (Chair 2001) 1998 President's Award for Outstanding Scholarship (bicentennial), University of
Louisville 2007 CLAS Distinguished Scientist Award 2009-12 Chair, Veterans Health Administration, Research Program Review Division,
Subcommittee on Hematology
BIOGRAPHICAL SKETCH
37
NAME Ling-Zhi Liu, MD, Ph.D.
POSITION TITLE Assistant Professor
eRA COMMONS USER NAME lxl027 EDUCATION/TRAINING (Begin with baccalaureate or other initial professional education, such as nursing, and include postdoctoral training.)
INSTITUTION AND LOCATION DEGREE (if applicable) MM/YY FIELD OF STUDY
Shenyang Medical College MD 07/94 Clinical Medicine
China Medical University MD, Ph.D. 07/00 Internal Medicine The Third Military Medical University, Chongqing, China Residency 12/03 Internal Medicine
Institute for Nutritional Sciences, Chinese Academy of Sciences, Shanghai, China
Postdoctoral Fellow 12/06 Molecular Biology
West Virginia University, Morgantown, WV Research Associate 04/09 Molecular Biology
A. Personal Statement I have 17 years of experience in molecular biology and signal transduction, excellent experience in tumorigenesis and angiogenesis signaling pathways and molecules in human cancers. I have good experience to study the role and mechanism of cytokines and their receptors such as VEGF/VEGFR and CXCL8/ CXCR1/2 in regulating tumor angiogenesis. I showed new mechanisms of ROS and other signaling molecules in inducing tumor growth and angiogenesis, and drug resistance and developed a novel tumor chimeric model which is suitable to study the interactions of human vascular endothelial cells and cancer cells. I have published 33 research papers in peer-reviewed journals. Currently, my major effort is to elucidate the role and mechanism of miRNAs and stromal cells in breast tumor growth and angiogenesis, which would also impact other human cancers. I have obtained new and interesting preliminary results to indicate the important role of stromal miR-148a expression in breast cancer development, which is novel and unexplored in the breast cancer research.
B. Positions and Honors.
04/09-04/10 Research Assistant Professor, Mary Babb Randolph Cancer Center and the Department of Biochemistry, West Virginia University, Morgantown, WV 26506
04/10-present Assistant Professor, Department of Pathology, Anatomy, and Cell Biology, Thomas Jefferson University, Philadelphia, PA 19107
C. Selected 15 peer-reviewed publications (selected from 33 Articles). 1. Liu LZ, Fang J, Zhou Q, Hu X, Shi X, Jiang BH. Apigenin inhibits expression of vascular endothelial growth factor and angiogenesis in human lung cancer cells: implication of chemoprevention of lung cancer. Mol Pharmacol. 2005; 68(3):635-43. 2. Liu LZ, Hu XW, Xia C, He J, Zhou Q, Shi X, Fang J, Jiang BH. Reactive oxygen species regulate EGF-induced VEGF and HIF-1α expression through activation of AKT and p70S6K1 in human ovarian cancer cells. Free Radic Biol Med. 2006; 41(10): 1521-33. 3. Zhou Q*, Liu LZ *, Fu B, Hu X, Shi X, Jiang BH. Reactive oxygen species regulate insulin-induced VEGF and HIF-1α expression through the activation of p70S6K1 in human prostate cancer cells. Carcinogenesis. 2007; 28 (1):28-37. (* co-first author)
38
4. Xia C*, Meng Q *, Liu LZ *, Yongyut R, Wang XR, Jiang BH. Reactive oxygen species in cancer cells regulate angiogenesis and tumor growth through expression of vascular endothelial growth factor. Cancer Res. 2007; 67(22):10823-30. (*co-first author) 5. Liu LZ, Zhou XD, Qian G, Shi X, Fang J, Jiang BH. AKT1 amplification regulates cisplatin resistance in human lung cancer cells through the mammalian target of rapamycin/p70S6K1 pathway. Cancer Res. 2007; 67 (13): 6325-32. 6. Liu LZ, Zheng JZ, Wang XR, Jiang BH. Endothelial p70S6K1 in regulating tumor angiogenesis. Cancer Res. 2008; 68(19):8183-8138. 7. Li D, Zhao Y, Liu C, Chen X, Qi Y, Jiang Y, Zou C, Zhang X, Liu S, Wang X, Zhao D, Sun Q, Zeng Z, Dress A, Lin MC, Kung HF, Rui H, Liu LZ, Mao F, Jiang BH, Lai L. Analysis of miR-195 and miR-497 expression, regulation and role in breast cancer. Clin Cancer Res. 2011; 17 (7): 1722-30. 8. Liu LZ, Li C, Chen Q, Jing Y, Carpenter R, Jiang Y, Kung HF, Lai L, Jiang BH. MiR-21 induced angiogenesis through AKT and ERK activation and HIF-1α expression. PLoS One. 2011; 6(4):e19139. 9. Lin CC, Liu LZ, Addison JB, Ivanov AV, Ruppert JM. KLF4-microRNA-206 autoregulatory feedback loop can promote or inhibit protein translation depending upon cell context. Mol Cell Biol. 2011; 31(12):2513-27. 10. Xu Q*, Liu LZ*, Qian X, Chen Q, Jiang Y, Li D, Lai L, Jiang BH. MiR-145 directly targets p70S6K1 in cancer cells to inhibit tumor growth and angiogenesis. Nucleic Acids Res. 2012; 40(2): 761-74. (*co-first author) 11. Shi ZM, Wang J, Yan Z, You YP, Li CY, Qian X, Yin Y, Zhao P, Wang YY, Wang XF, Li MN, Liu LZ, Liu N, Jiang BH. MiR-128 inhibits tumor growth and angiogenesis by targeting p70S6K1. PLoS One. 2012; 7(3): e32709. 12. Zou C, Xu Q, Mao F, Li D, Bian C, Liu LZ, Jiang Y, Chen X, Qi Y, Zhang X, Wang X, Sun Q, Kung HF, Lin MC, Dress A, Wardle F, Jiang BH, Lai L. MiR-145 inhibits tumor angiogenesis and growth by N-RAS and VEGF. Cell Cycle. 2012, 11 (11):2137-45. 13. Xu Q, Jiang Y, Yin Y, Li Q, He J, Jing Y, Qi YT, Xu Q, Li W, Lu B, Peiper SS, Jiang BH, Liu LZ*. A regulatory circuit of miR-148a/152 and DNMT1 in modulating cell transformation and tumor angiogenesis through IGF-IR and IRS1. J Mol Cell Biol. 2012 Oct 10. [Epub ahead of print]. (*Corresponding author) 14. He J, Xu Q, Jing Y, Agani F, Qian X, Carpenter R, Li Q, Wang XR, Peiper SS, Lu Z, Liu LZ, Jiang BH. Reactive oxygen species regulates ERBB2 and ERBB3 expression via miR-199a/125b and DNA methylation. EMBO Rep. 2012; 13(12):1116-22. 15. Yin Y, Yan ZP, Lu NN, Xu Q, He J, Qian X, Yu J, Guan X, Jiang BH, Liu LZ*. Downregulation of miR-145 associated with cancer progression and VEGF transcriptional activation by targeting N-RAS and IRS1. Biochim Biophys Acta. 2012 Nov 29. [Epub ahead of print]. (*Corresponding author)
BIOGRAPHICAL SKETCH
39
NAME Jiang, Bing-Hua
POSITION TITLE Professor
eRA COMMONS USER NAME bhjiang EDUCATION/TRAINING (Begin with baccalaureate or other initial professional education, such as
INSTITUTION AND LOCATION
DEGREE (if
applicable) MM/YY FIELD OF STUDY
South China University of Tropical Crops, Hainan, China B.S. 07/84 Plant Genetics
Mississippi State University, Starkville, MS Ph.D. 08/94 Molecular Biology The Johns Hopkins University School of Medicine, Baltimore,MD
Postdoctoral Fellow 03/97 Molecular Biology
The Scripps Research Institute, La Jolla, CA Research Associate 09/00 Molecular Biology
A. Personal Statement I have 21 years of experience in molecular biology and signal transduction, and have excellent experience in tumorigenesis and angiogenesis induced by HIF-1, VEGF, PI3K, MAP kinase, and other signaling molecules. We have established tumor models to study the interactions of human vascular endothelial and stromal cells and breast cancer cells in tumor growth and angiogenesis to study the paracrine effect of these cytokines in regulating angiogenesis. We have good experience in studying microRNAs, and signaling pathways in tumorigenesis and angiogenesis induced by cancer cells. I have extensive experience to study the role and mechanism of cytokines and their receptors such as VEGF/VEGFR and CXCL8/ CXCR1/2 in regulating tumor angiogenesis. We also establish an orthotopic ovarian cancer model which mimics ovarian cancer microenvironment and is suitable for treatment study. I originally cloned hypoxia-inducible factor 1α (HIF-1α) in 1994 when I worked at The Johns Hopkins University. I have published 120 research papers in peer-reviewed journals. These papers have been cited by more than 8000 times by other scientists.
B. Positions and Honors.
2000-2006 Assistant Professor, Dept. of Immunology, and Cell Biology and Mary Babb Randolph Cancer Center, West Virginia University, Morgantown, WV
2006-2010 Associate Professor, Department Immunology, and Cell Biology and Mary Babb Randolph Cancer Center, West Virginia University, Morgantown, WV
2010-present Professor, Department of Pathology, Anatomy, and Cell Biology, Thomas Jefferson University, Philadelpha. PA
Memberships on Editorial Boards Managing Editor, Frontiers in Bioscience Guest Editor, Current Cancer Drug Targets
C. Selected 15 peer-reviewed publications (selected from 120 articles).
40
1. Skinner HD, Zheng JZ, Fang J, Agani FH, Jiang BH*. Vascular endothelial growth factor transcriptional activation is mediated by hypoxia-inducible factor 1alpha, HDM2, and p70S6K1 in response to phosphatidylinositol 3-kinase/AKT signaling. J Biol.Chem. 2004;279(44):45643-51.
2. Fang, J., C. Xia, Z. Cao, J. Z. Zheng, E. Reed, and B.H. Jiang*. Apigenin Inhibits VEGF and HIF-1 Expression via PI3K/AKT/p70S6K1 and HDM2/p53 Pathways. FASEB J. 2005,19(3):342-353.
3. Fang, J., Q. Meng, P.K.Vogt, R. Zhang, and B.H. Jiang*. 2006. A downstream kinase of the mammalian target of rapamycin, p70S6K1, regulates human double minute 2 protein phosphorylation and stability. J Cell Physiol. 209(2): 261-5.
4. Cao, Z., L.Z. Liu, D.A. Dixon, J.Z. Zheng, B. Chandran, and B.H. Jiang*. 2007. Insulin-like growth factor-I induces cyclooxygenase-2 expression via PI3K, MAPK and PKC signaling pathways in human ovarian
cancer cells. Cell Signal. 19(7):1542-1553. 5. Fang, J, Q. Zhou, X. Shi, and B.H. Jiang*. 2007. Luteolin inhibits insulin-like growth factor
1 receptor signaling in prostate cancer cells. Carcinogenesis 28(3): 713-723. 6. Xia C, Meng Q, Liu LZ, Rojanasakul Y, Wang XR, Jiang BH*. Reactive oxygen species
regulate angiogenesis and tumor growth through vascular endothelial growth factor. Cancer Res. 2007; 67(22): 10823-30.
7. Liu LZ, Zheng JZ, Wang XR, Jiang BH*. Endothelial p70 S6 kinase 1 in regulating tumor angiogenesis. Cancer Res. 2008;68(19):8183-8.
8. Liu LZ, Li C, Chen Q, Jing Y, Carpenter R, Jiang Y, Kung HF, Lai L, Jiang BH *. MiR-21 induced angiogenesis through AKT and ERK activation and HIF-1α expression. PLoS One. 2011; 6(4):e19139.
9. Li D, Zhao Y, Liu C, Chen X, Qi Y, Jiang Y, Zou C, Zhang X, Liu S, Wang X, Zhao D, Sun Q, Zeng Z, Dress A, Lin MC, Kung HF, Rui H, Liu LZ, Mao F, Jiang BH*, Lai L*. Analysis of miR-195 and miR-497 expression, regulation and role in breast cancer. Clin Cancer Res. 17(7): 1722-1730.
10. Xu Q, Liu LZ, Qian X, Chen Q, Jiang Y, Li D, Lai L, Jiang BH*. MiR-145 directly targets p70S6K1 in cancer cells to inhibit tumor growth and angiogenesis. Nucleic Acids Res. 2012; 40(2): 761-74.
11. Shi ZM, Wang J, Yan Z, You YP, Li CY, Qian X, Yin Y, Zhao P, Wang YY, Wang XF, Li MN, Liu LZ, Liu N, Jiang BH*. MiR-128 inhibits tumor growth and angiogenesis by targeting p70S6K1. PLoS One. 2012; 7(3): e32709.
12. Zou C, Xu Q, Mao F, Li D, Bian C, Liu LZ, Jiang Y, Chen X, Qi Y, Zhang X, Wang X, Sun Q, Kung HF, Lin MC, Dress A, Wardle F, Jiang BH*, Lai L*. MiR-145 inhibits tumor angiogenesis and growth by N-RAS and VEGF. Cell Cycle. 2012, 11 (11):2137-45.
13. Xu Q, Jiang Y, Yin Y, Li Q, He J, Jing Y, Qi YT, Xu Q, Li W, Lu B, Peiper SS, Jiang BH*, Liu LZ*. A regulatory circuit of miR-148a/152 and DNMT1 in modulating cell transformation and tumor
angiogenesis through IGF-IR and IRS1. J Mol Cell Biol. 2012 Oct 10. [Epub ahead of print]. 14. He J, Xu Q, Jing Y, Agani F, Qian X, Carpenter R, Li Q, Wang XR, Peiper SS, Lu Z, Liu LZ, Jiang
BH*. Reactive oxygen species regulates ERBB2 and ERBB3 expression via miR-199a/125b and DNA methylation. EMBO Rep. 2012; 13(12):1116-22.
15. Yin Y, Yan ZP, Lu NN, Xu Q, He J, Qian X, Yu J, Guan X, Jiang BH*, Liu LZ*. Downregulation of miR-145 associated with cancer progression and VEGF transcriptional activation by targeting N-
RAS and IRS1. Biochim Biophys Acta. 2012 Nov 29. [Epub ahead of print]. *, indicates the corresponding author.