final preliminary assessment report -...
TRANSCRIPT
FINAL
PRELIMINARY ASSESSMENT REPORT
FOR THE NORWOOD LANDFILL
NORWOOD, DELAWARE COUNTY, PENNSYLVANIA
Prepared for:
U.S. Environmental Protection Agency Region III Hazardous Site Cleanup Division
1650 Arch Street Philadelphia, PA 19103
Prepared by:
Region III Superfund Technical Assessment and Response Team IV Weston Solutions, Inc.
1400 Weston Way West Chester, PA 19380
EPA Contract No.: EP-S3-15-02 Technical Directive Document No.: W503-17-03-001
Document Control No.: W0146.1A.02089
July 2017
(b) (4)
(b) (4)
(b) (4)
(b) (4)
Norwood Landfill Final Preliminary Assessment Report
July 2017 Page i TDD NO. WS05-17-03-001 DOCUMENT CONTROL NO. W0146.1A.02089
TABLE OF CONTENTS
Section Page
1.0 INTRODUCTION..............................................................................................................1
2.0 SITE BACKGROUND ......................................................................................................1 2.1 LOCATION AND DESCRIPTION ........................................................................1 2.2 SITE OWNERSHIP .................................................................................................2 2.3 PREVIOUS INVESTIGATIONS ............................................................................2
3.0 SOURCE DESCRIPTION AND CHARACTERISTICS...............................................5
4.0 GROUNDWATER MIGRATION PATHWAY .............................................................5 4.1 REGIONAL AND SITE GEOLOGY ......................................................................5 4.2 REGIONAL AND SITE HYDROGEOLOGY .......................................................6 4.3 GROUNDWATER TARGETS ...............................................................................6 4.4 GROUNDWATER CONCLUSIONS .....................................................................7
5.0 SURFACE WATER MIGRATION PATHWAY ...........................................................8 5.1 HYDROLOGIC SETTING .....................................................................................8 5.2 SURFACE WATER TARGETS .............................................................................9 5.3 SURFACE WATER CONCLUSIONS ...................................................................9
6.0 SOIL EXPOSURE AND AIR MIGRATION PATHWAYS ........................................11 6.1 PHYSICAL CONDITIONS...................................................................................11 6.2 SOIL AND AIR TARGETS ..................................................................................11 6.3 SOIL EXPOSURE AND AIR MIGRATION PATHWAY
CONCLUSIONS....................................................................................................13
7.0 SUMMARY AND CONCLUSIONS ..............................................................................13
8.0 REFERENCES .................................................................................................................16

Norwood Landfill Final Preliminary Assessment Report
July 2017 Page ii TDD NO. WS05-17-03-001 DOCUMENT CONTROL NO. W0146.1A.02089
LIST OF TABLES
Title Page
TABLE 1 DRINKING WATER WELLS WITHIN A 4-MILE RADIUS OF THE SITE .....7
TABLE 2 ESTIMATED POPULATION WITHIN A 4-MILE RADIUS OF THE SITE ....12
TABLE 3 WETLAND ACREAGE WITHIN A 4-MILE RADIUS OF THE SITE .............13
LIST OF APPENDICES
APPENDIX A FIGURES
Figure 1 Site Location Map Figure 2 Site Layout Map Figure 3 4-Mile Radius Map with Distance Rings Figure 4 15-Mile Downstream Surface Water Pathway Map
APPENDIX B TABLES
Table 1 1999 USFWS Analytical Data – Surface Water Samples Table 2 1999 USFWS Analytical Data – Sediment Samples

Norwood Landfill Final Preliminary Assessment Report
July 2017 Page iii TDD NO. WS05-17-03-001 DOCUMENT CONTROL NO. W0146.1A.02089
LIST OF ACRONYMS AND ABBREVIATIONS
µg/kg micrograms per kilogram
µg/L micrograms per liter
4,4-DDD 4,4-dichlorodiphenyldichloroethane
4,4-DDE 4,4-dichlorodiphenyldichloroethylene
4,4-DDT 4,4-dichlorodiphenyltrichloroethane
Aqua Pennsylvania Aqua Pennsylvania Water Company
BTAG Biological Technical Assistance Group
CERCLA Comprehensive Environmental Response, Compensation, and Liability Act of 1980
EPA U.S. Environmental Protection Agency
mg/kg milligrams per kilogram
PA preliminary assessment
PaGWIS Pennsylvania Groundwater Information System
PAH polycyclic aromatic hydrocarbon
PCB polychlorinated biphenyl
RBC Risk-Based Concentration
Ref. Reference
START Superfund Technical Assessment and Response Team
SVOC semivolatile organic compound
TAL Target Analyte List
TCL Target Compound List
TDD Technical Directive Document
TDL target distance limit
USFWS U.S. Fish and Wildlife Service
VOC volatile organic compound
WESTON® Weston Solutions, Inc.

Norwood Landfill Final Preliminary Assessment Report
July 2017 Page 1 TDD NO. WS05-17-03-001 DOCUMENT CONTROL NO. W0146.1A.02089
1.0 INTRODUCTION
Under the Superfund Technical Assessment and Response Team (START) IV Contract No.
EP-S3-15-02, Technical Directive Document (TDD) No. W503-17-03-001, the U.S.
Environmental Protection Agency (EPA) Region III tasked Weston Solutions, Inc. (WESTON®)
to conduct a Preliminary Assessment (PA) at the Norwood Landfill (Site) located in Norwood,
Delaware County, Pennsylvania.
The Site PA was conducted in accordance with EPA Guidance for Performing Preliminary
Assessments Under CERCLA (Reference [Ref.] 1). The purpose of this PA was to conduct an initial
site assessment to determine the need for additional action under the Comprehensive
Environmental Response, Compensation, and Liability Act of 1980 (CERCLA). The scope of the
Site PA included a review of available site information, a compilation and evaluation of potential
targets, a site reconnaissance, and an evaluation of reconnaissance information. Samples were not
collected as part of the Site PA.
2.0 SITE BACKGROUND
This section presents a description of the Site and its location, provides a discussion of the Site’s
ownership and history, and presents a summary of previous site investigation activities.
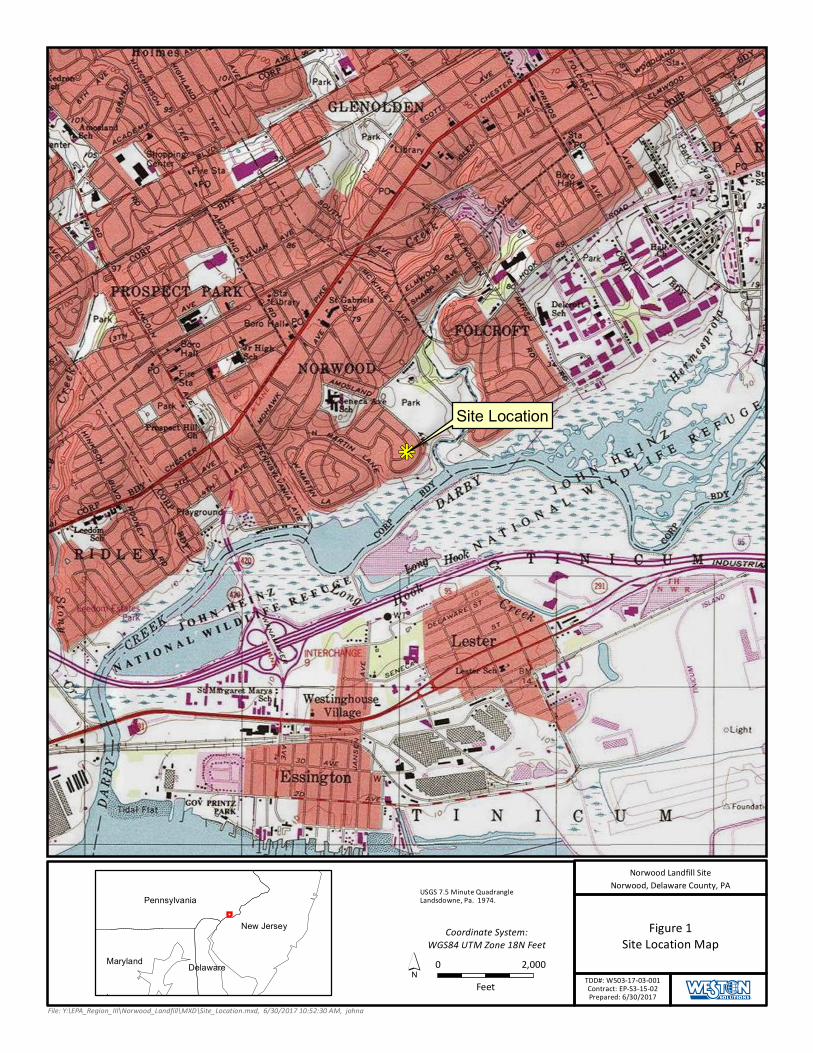
2.1 LOCATION AND DESCRIPTION
The Site consists of an urban residential neighborhood in lower Norwood, Delaware County,
Pennsylvania. The geographic coordinates of the approximate center of the Site are 39°52'55.76"
north latitude and 75°17'29.04" west longitude (Ref. 2). Land use at the Site and the surrounding
area consists of residential areas. Amosland Park borders the Site to the northeast, wooded areas
and Muckinipattis Creek are located to the east, wooded areas and Darby Creek are located to the
south, Norwood Elementary School is located to the northwest, and additional residential areas are
located north and west of the Site (Figures 1 and 2, Appendix A).
Norwood Landfill Final Preliminary Assessment Report
July 2017 Page 2 TDD NO. WS05-17-03-001 DOCUMENT CONTROL NO. W0146.1A.02089
2.2 SITE OWNERSHIP
The Site consists of a residential area located in a lower Norwood neighborhood and the
surrounding property between E. Winona Avenue and Darby Creek. Various individuals own the
properties in the residential area. According to the Delaware County Real Estate Parcels and Tax
Records System, the folio number for the property surrounding the lower Norwood neighborhood
is 310000600903 and the current owner is the Norwood Borough Authority (Ref. 3). No previous
owners are listed for this property.
2.3 PREVIOUS INVESTIGATIONS
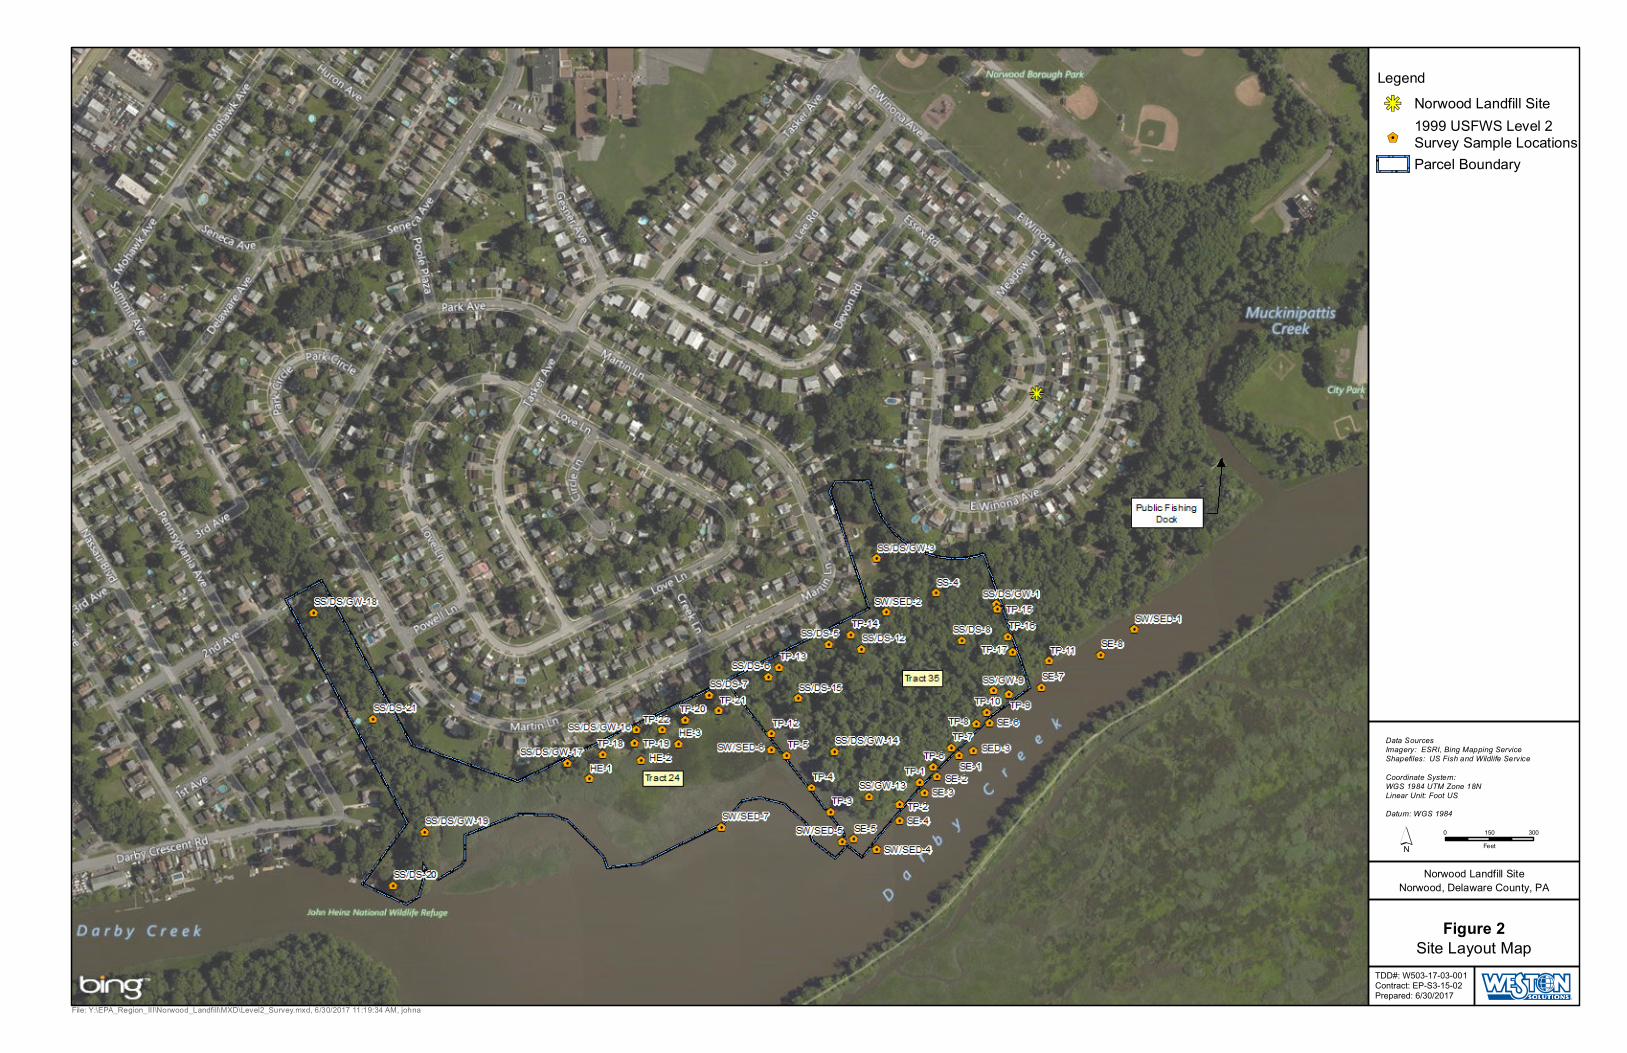
In 1993, the U.S. Fish and Wildlife Service (USFWS) conducted a Level I Contamination Survey
of two tracts of land, Tract 24 and Tract 35, which are located near the Site. Tract 35 appears to be
part of folio 310000600903, which is part of the undeveloped portion of the Site (Figure 2,
Appendix A). The Level I Contamination Survey noted that the Borough of Norwood historically
had used Tract 35 as municipal landfill and that debris was scattered across the property at the time
of the survey. Observed debris included glass jars and bottles, automobile frames and parts,
aluminum siding, asphalt, concrete, and tires (Ref. 4).
In 1999, Program Management Company conducted a Level II Survey of Tracts 24 and 35 for
USFWS, during which test pits were excavated and samples of soil (21 shallow and 17 deep),
sediment (7), surface water (6), and groundwater (10) were collected. The samples were analyzed
for Target Compound List (TCL) volatile organic compounds (VOCs), TCL semivolatile organic
compounds (SVOCs), TCL pesticides, polychlorinated biphenyls (PCBs), chlorinated herbicides,
Target Analyte List (TAL) metals (total and dissolved for groundwater samples), and cyanide.
Analytical results were compared to EPA Region III Risk-Based Concentrations (RBCs)
residential and industrial soil screening levels for surface soils and sediment samples and EPA
RBCs for tapwater for the surface water and groundwater samples, where applicable (Ref. 4).
Additionally, for this preliminary assessment, the surface water data and sediment data were
compared to EPA Biological Technical Assistance Group (BTAG) Screening Values for
freshwater and are discussed in Section 5.3 of this report (Ref. 20).
Norwood Landfill Final Preliminary Assessment Report
July 2017 Page 3 TDD NO. WS05-17-03-001 DOCUMENT CONTROL NO. W0146.1A.02089
VOCs were not detected in any of the soil samples above RBCs. Eleven of the 21 shallow soil
samples contained benzo(a)pyrene concentrations above the residential RBC of 87 micrograms
per kilogram (µg/kg), with results ranging from 160 µg/kg to 2,100 µg/kg, and 8 of the 17 deep
samples contained concentrations above the residential RBC, with results ranging from 150 to
3,000 µg/kg. PCBs were detected in four shallow and two deep soil samples at concentrations
exceeding the residential RBC of 320 µg/kg with a maximum concentration of 1,100 µg/kg. One
pesticide, chlordane, in one deep sample contained a concentration of 4,400 µg/kg, which exceeds
the residential RBC of 1,800 µg/kg. Concentrations of arsenic were detected above the residential
RBC of 0.43 milligrams per kilogram (mg/kg) in all the shallow and deep soil samples, with the
exception of one shallow soil sample. The results ranged from 1.0 mg/kg to 34.3 mg/kg.
Concentrations of lead exceeded the action level of 400 mg/kg in 4 of the 21 shallow and 2 of the
17 deep soil samples. The results ranged from 4.2 mg/kg to 1,160 mg/kg (Ref. 4).
Concentrations of benzo(a)anthracene, benzo(b)fluoranthene, and benzo(a)pyrene exceeded the
tapwater RBCs in only one surface water sample. These exceedances were detected in sample SW-
4, which was collected from the southwest corner of Tract 35 (Figure 2, Appendix A). Manganese
was detected above the RBC in one surface water sample, SW-5, which was also collected near
the southwest corner of Tract 35. No other contaminants were detected above the tapwater RBC
in the surface water samples (Ref. 4).
Six constituents were detected above their industrial soil RBCs in the sediment samples:
benzo(a)pyrene, benzo(a)anthracene, benzo(b)fluoranthene, dibenz(a,h)anthracene, arsenic, and
lead. Benzo(a)pyrene was detected above the industrial soil RBC of 780 µg/kg in four of the seven
sediment samples, with results ranging from 800 to 13,000 µg/kg. The remaining three SVOCs
were detected in one sediment sample, SE-2. Arsenic was detected above the industrial soil RBC
of 3.8 mg/kg in six of the seven sediment samples, with results ranging from 9.1 milligrams per
kilogram to 32.3 mg/kg. Lead was detected in one sediment sample above the action level of 400
mg/kg at a concentration of 814 mg/kg. Several VOCs, PCBs, and pesticides were detected in the
sediment samples; however, the concentrations did not exceed applicable industrial soil RBCs.
The concentrations of PCBs in two of the seven samples did exceed the residential soil RBC of
320 µg/kg, with results ranging from 380 µg/kg to 650 µg/kg (Ref. 4). The locations of the
collected sediment samples and associated data are unclear in the Level II Survey Report. In
Norwood Landfill Final Preliminary Assessment Report
July 2017 Page 4 TDD NO. WS05-17-03-001 DOCUMENT CONTROL NO. W0146.1A.02089
Section 2.2 of the Level II Survey Report, sediment samples SED-1 through SED-7 are identified
as having been collected at co-located surface water sample locations, with the exception of SED-
3, which was a sediment only location. However, in Table 3-7, the sediment sample locations are
identified as SE-1 through SE-7. Both sediment designations are shown on Figure 2-1, Sample
Location Map, provided in the report with a note indicating locations identified by SE are existing
sediment sample locations (Ref. 4).
One VOC, chloroform, was detected in one groundwater sample at a concentration of 1.6
micrograms per liter (µg/L), which exceeds the tapwater RBC of 0.15 µg/L. Concentrations of
benzo(a)anthracene exceeding the tapwater RBC of 0.092 µg/L were detected in 5 of the 10
groundwater samples, with results ranging from 0.2 µg/L to 0.6 µg/L. Concentrations of
benzo(b)fluoranthene exceeded the tapwater RBC of 0.092 µg/L in 5 of the 10 groundwater
samples, with results ranging from 0.3 µg/L to 0.8 µg/L. Concentrations of benzo(a)pyrene
exceeded the tapwater RBC of 0.0092 µg/L in 5 of the 10 groundwater samples, with results
ranging from 0.2 µg/L to 0.6 µg/L. Concentrations of 1,4-dichlorobenzene exceeded the tapwater
RBC of 0.47 µg/L in 3 of the 10 groundwater samples, with results ranging from 0.8 µg/L to 2.2
µg/L. Indeno(1,2,3-cd)pyrene exceeded the tapwater RBC of 0.092 µg/L in 3 of the 10
groundwater samples, with results ranging from 0.3 µg/L to 0.4 µg/L. Bis(2-ethylhexyl)phthalate
was detected in one groundwater sample at a concentration of 6.2 µg/L, which exceeds the tapwater
RBC of 4.8 µg/L. Concentrations of total arsenic exceeded the tapwater RBC of 0.045 µg/L in 4
of the 10 groundwater samples, with results ranging from 5 µg/L to 32.7 µg/L. Total aluminum in
two samples exceeded the tapwater RBC of 37,000 µg/L at concentrations of 52,900 µg/L and
46,700 µg/L. Total iron was detected above the tapwater RBC of 11,000 µg/L in all 10
groundwater samples, ranging in concentrations from 12,300 µg/L to 163,000 µg/L.
Concentrations of total lead exceeded the action level of 15 µg/L in 9 of the 10 groundwater
samples, with results ranging from 25.2 µg/L to 1,150 µg/L. Concentrations of total manganese
exceeded the tapwater RBC of 730 µg/L in 5 of the 10 groundwater samples, with results ranging
from 1,450 µg/L to 4,810 µg/L (Ref. 4).
Although constituents were detected in samples collected as part of the Level II Survey, the
concentrations of the constituents were attributed to natural conditions in the area, impacts from
Norwood Landfill Final Preliminary Assessment Report
July 2017 Page 5 TDD NO. WS05-17-03-001 DOCUMENT CONTROL NO. W0146.1A.02089
surface water runoff from adjacent properties and streets, and from non-hazardous materials
previously disposed on the property (Ref. 4).
No previous investigations have been conducted in the residential portion of the Site. EPA received
complaints from concerned citizens regarding the historical use of the surrounding area as a waste
dump for landfill material and laboratory equipment, as well as the use of potentially contaminated
fill material during construction of the housing development. EPA has been requested to conduct
an investigation to determine whether hazardous substances may be present on the Site.
3.0 SOURCE DESCRIPTION AND CHARACTERISTICS
It has been alleged that potentially contaminated material from areas excavated when the Walt
Whitman Bridge was constructed was used as fill material during construction of the houses in the
lower Norwood neighborhood. Additionally, it has been alleged that the undeveloped areas
surrounding the residential neighborhood have been used as a waste dump, potentially for landfill
material and laboratory supplies and equipment, and may contain hazardous substances. On April
12, 2017, WESTON personnel conducted a site reconnaissance of the property. Access to the entire
Site was limited because of dense brush and limited access points. Miscellaneous trash was
observed at various locations throughout the undeveloped portion of the Site.
4.0 GROUNDWATER MIGRATION PATHWAY
This section describes the Site’s geologic and hydrogeologic setting, presents the targets associated
with the groundwater migration pathway, and presents conclusions that can be made regarding the
groundwater migration pathway.
4.1 REGIONAL AND SITE GEOLOGY
The Site is located in the Lowland and Intermediate Upland Section of the Atlantic Coastal Plain
Physiographic Province, which is characterized by a flat upper terrace surface underlain by
unconsolidated to poorly consolidated sand and gravel with dendritic drainage patterns. These
deposits rest upon bedrock comprising schist, gneiss, and other metamorphic rocks (Ref. 5). The
bedrock of the Coastal Plain contains poorly exposed Cretaceous and Tertiary sediments that are
interlayered with series of sands, clays, and gravels that range in thickness from 0 feet to over 200

Norwood Landfill Final Preliminary Assessment Report
July 2017 Page 6 TDD NO. WS05-17-03-001 DOCUMENT CONTROL NO. W0146.1A.02089
feet (Ref. 6). The Cretaceous and Tertiary sediments are overlain by Quaternary sediments, which
are composed of Pleistocene deposits and Holocene deposits. The Pleistocene deposits are
characterized by series of interlayered sands, clays, and gravels ranging in thickness from 0 feet to
80 feet. The Holocene deposits are characterized by organic rich mud, silt, and fine sand that range
in thickness from less than 10 feet to approximately 80 feet (Ref. 6). The Lowland and Intermediate
Upland Section of the Coastal Plain Province has very low relief, with ground elevations ranging
from 0 feet to approximately 200 feet (Ref. 5).
Near the Site, the Holocene deposits are underlain by the Quaternary age Trenton Gravel formation
(Ref. 6). The Trenton Gravel formation is primarily composed of gray or pale reddish-brown
unconsolidated alluvial sand and clay that is approximately 30 feet thick (Ref. 7). Near the Site,
the Trenton Gravel formation overlies the Raritan Formation (Ref. 8).
4.2 REGIONAL AND SITE HYDROGEOLOGY
The yields of wells in the Trenton Gravel formation range from 8.0 to 200 gallons per minute; the
median is 50 gallons per minute.
Although this is the highest median yield of any of the water-bearing rock units in the county, the
gravel should not be considered a major water source because it is generally too thin and
discontinuous in most areas (Ref. 8). The Raritan Formation is approximately 100 feet thick and
is a very high-yielding aquifer; however, it thins rapidly to the southwest and is present under a
very small area of the county. The Raritan Formation is not tapped by wells in Delaware County
(Ref. 8).
4.3 GROUNDWATER TARGETS
Potential groundwater targets include persons who obtain drinking water from private domestic
wells within the 4-mile radius target distance limit (TDL) of the Site and persons supplied drinking
water from public water suppliers whose water source is from groundwater wells within the 4-mile
TDL.
The primary public water supplier serving persons within a 4-mile TDL is Aqua Pennsylvania
Water Company (Aqua Pennsylvania). The primary sources of water for Aqua Pennsylvania
include 8 surface water intakes and 28 groundwater wells (Refs. 9 and 15). There are no supply
Norwood Landfill Final Preliminary Assessment Report
July 2017 Page 7 TDD NO. WS05-17-03-001 DOCUMENT CONTROL NO. W0146.1A.02089
wells for Aqua Pennsylvania located within the 4-mile TDL; therefore, persons served through
this supply network will not be considered as targets as part of this PA (Ref. 10).
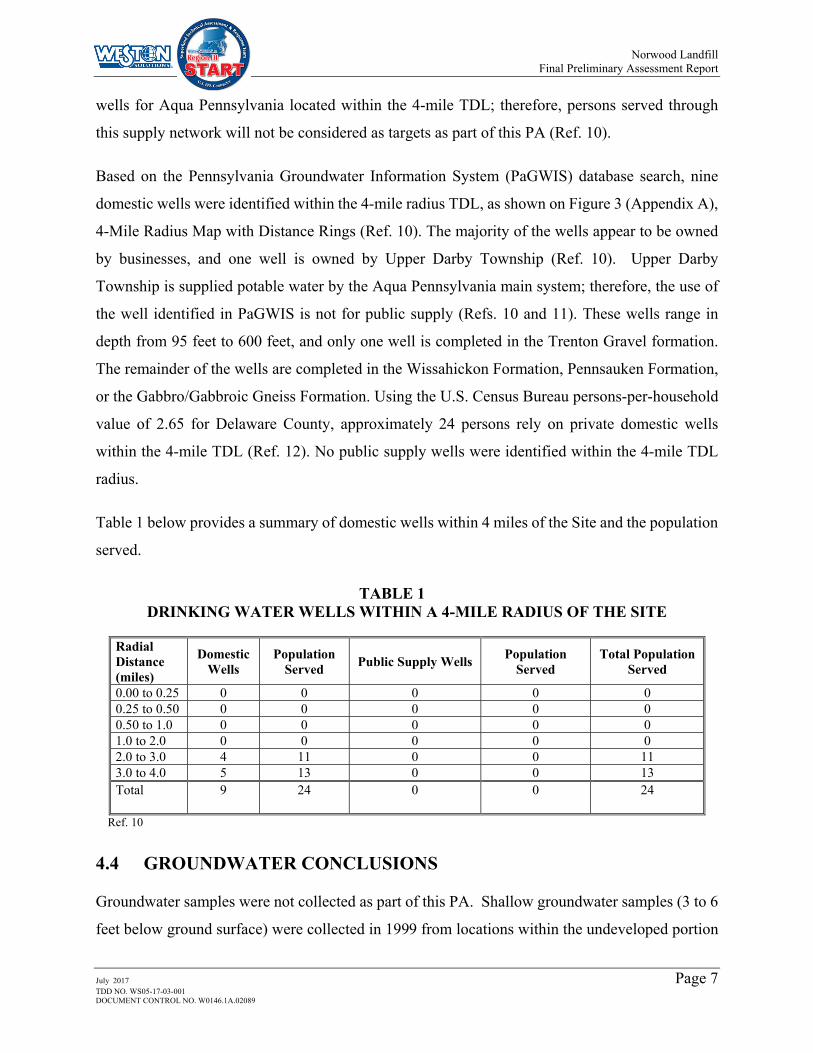
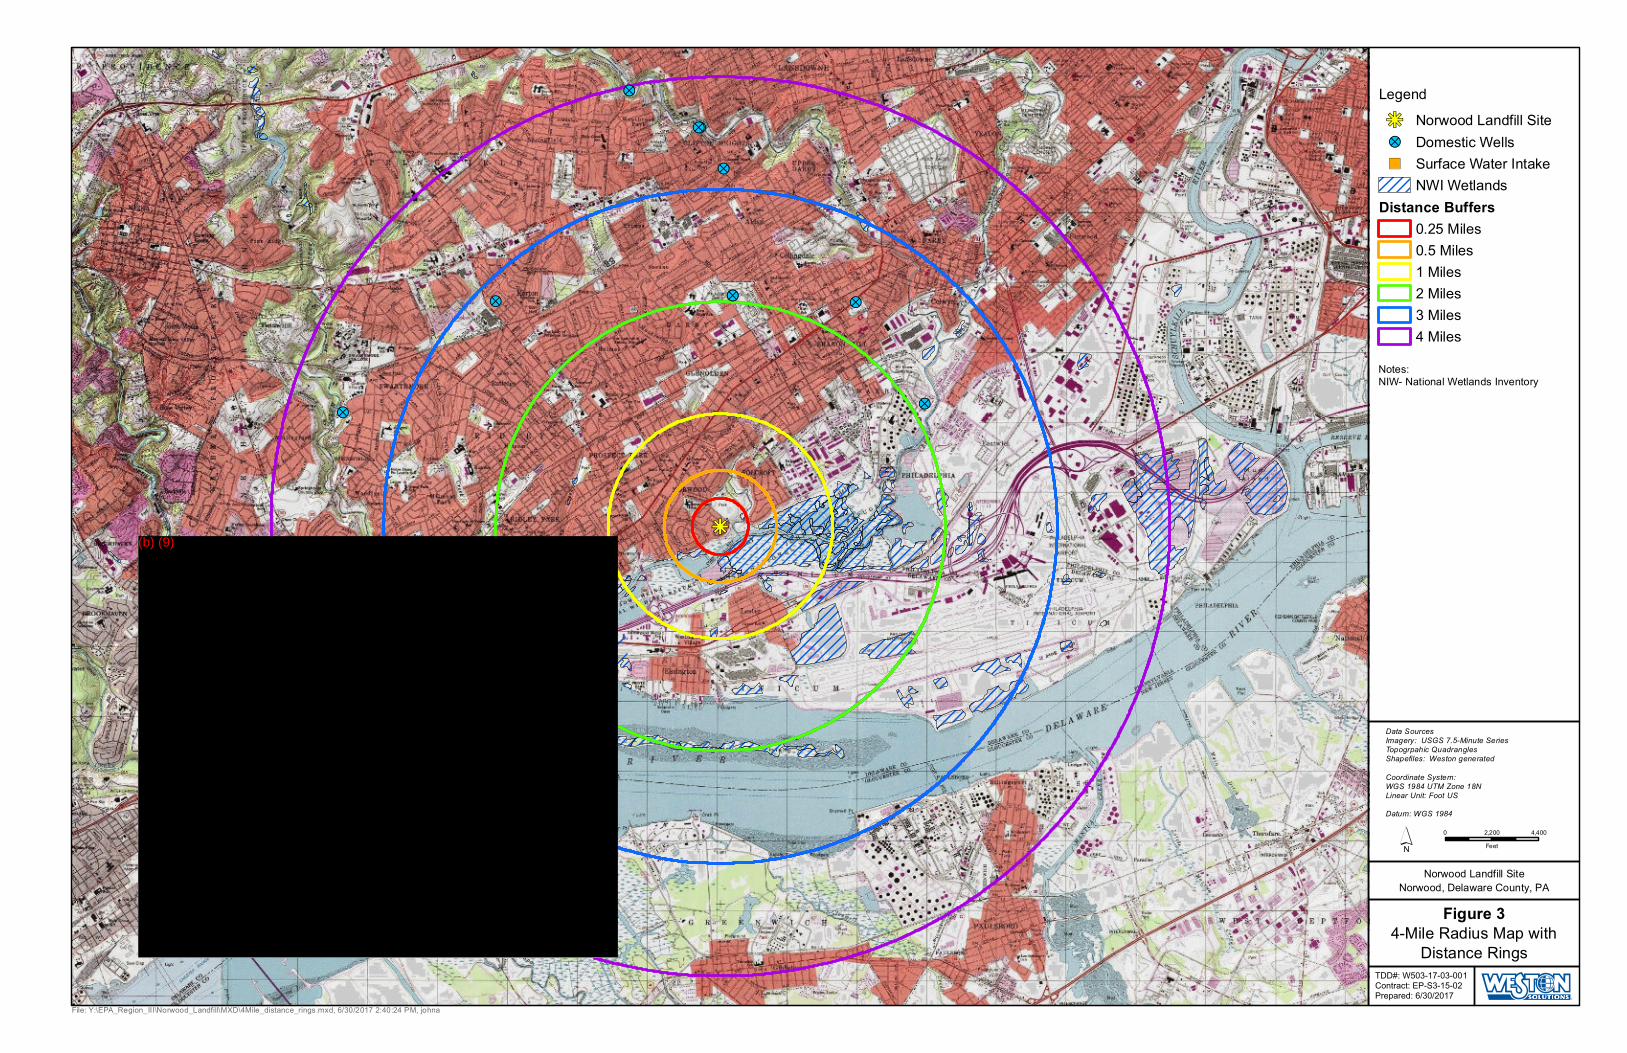
Based on the Pennsylvania Groundwater Information System (PaGWIS) database search, nine
domestic wells were identified within the 4-mile radius TDL, as shown on Figure 3 (Appendix A),
4-Mile Radius Map with Distance Rings (Ref. 10). The majority of the wells appear to be owned
by businesses, and one well is owned by Upper Darby Township (Ref. 10). Upper Darby
Township is supplied potable water by the Aqua Pennsylvania main system; therefore, the use of
the well identified in PaGWIS is not for public supply (Refs. 10 and 11). These wells range in
depth from 95 feet to 600 feet, and only one well is completed in the Trenton Gravel formation.
The remainder of the wells are completed in the Wissahickon Formation, Pennsauken Formation,
or the Gabbro/Gabbroic Gneiss Formation. Using the U.S. Census Bureau persons-per-household
value of 2.65 for Delaware County, approximately 24 persons rely on private domestic wells
within the 4-mile TDL (Ref. 12). No public supply wells were identified within the 4-mile TDL
radius.
Table 1 below provides a summary of domestic wells within 4 miles of the Site and the population
served.
TABLE 1 DRINKING WATER WELLS WITHIN A 4-MILE RADIUS OF THE SITE
Radial Distance (miles)
Domestic Wells
Population Served
Public Supply Wells Population
Served Total Population
Served
0.00 to 0.25 0 0 0 0 0 0.25 to 0.50 0 0 0 0 0 0.50 to 1.0 0 0 0 0 0 1.0 to 2.0 0 0 0 0 0 2.0 to 3.0 4 11 0 0 11 3.0 to 4.0 5 13 0 0 13 Total 9 24 0 0 24
Ref. 10
4.4 GROUNDWATER CONCLUSIONS
Groundwater samples were not collected as part of this PA. Shallow groundwater samples (3 to 6
feet below ground surface) were collected in 1999 from locations within the undeveloped portion
Norwood Landfill Final Preliminary Assessment Report
July 2017 Page 8 TDD NO. WS05-17-03-001 DOCUMENT CONTROL NO. W0146.1A.02089
of the Site. As previously discussed in Section 2.3, one VOC and six SVOCs, primarily polycyclic
aromatic hydrocarbons (PAHs), were detected in several of the groundwater samples at
concentrations exceeding the EPA RBC for tapwater. Additionally, concentrations of total
aluminum, arsenic, iron, lead, and manganese also exceeded the tapwater RBC in several
groundwater samples (Ref. 4). A background groundwater sample was not collected as part of
that assessment.
Aqua Pennsylvania provides drinking water that is primarily sourced from surface water to
residents in Delaware County. However, nine private domestic wells are present within a 4-mile
radius of the Site that potentially provide drinking water to approximately 24 persons.
5.0 SURFACE WATER MIGRATION PATHWAY
This section describes the Site’s hydrologic setting, presents targets associated with the surface
water migration pathway, and presents conclusions made regarding the surface water migration
pathway.
5.1 HYDROLOGIC SETTING
The Site is located on the Lowland and Intermediate Upland Section of the Atlantic Coastal Plain
Physiographic Province and is characterized by flat terrain with low relief ranging from 0 to 200
feet high. The surface is well draining in a dendritic pattern (Ref. 5). The Site is bordered by Darby
Creek to the south, which flows for approximately 2.25 miles to the west/southwest before
converging with the Delaware River. Muckinipattis Creek, which is located approximately 0.11
mile to the east of the Site and flows into Darby Creek at the southeast corner of the Site. The
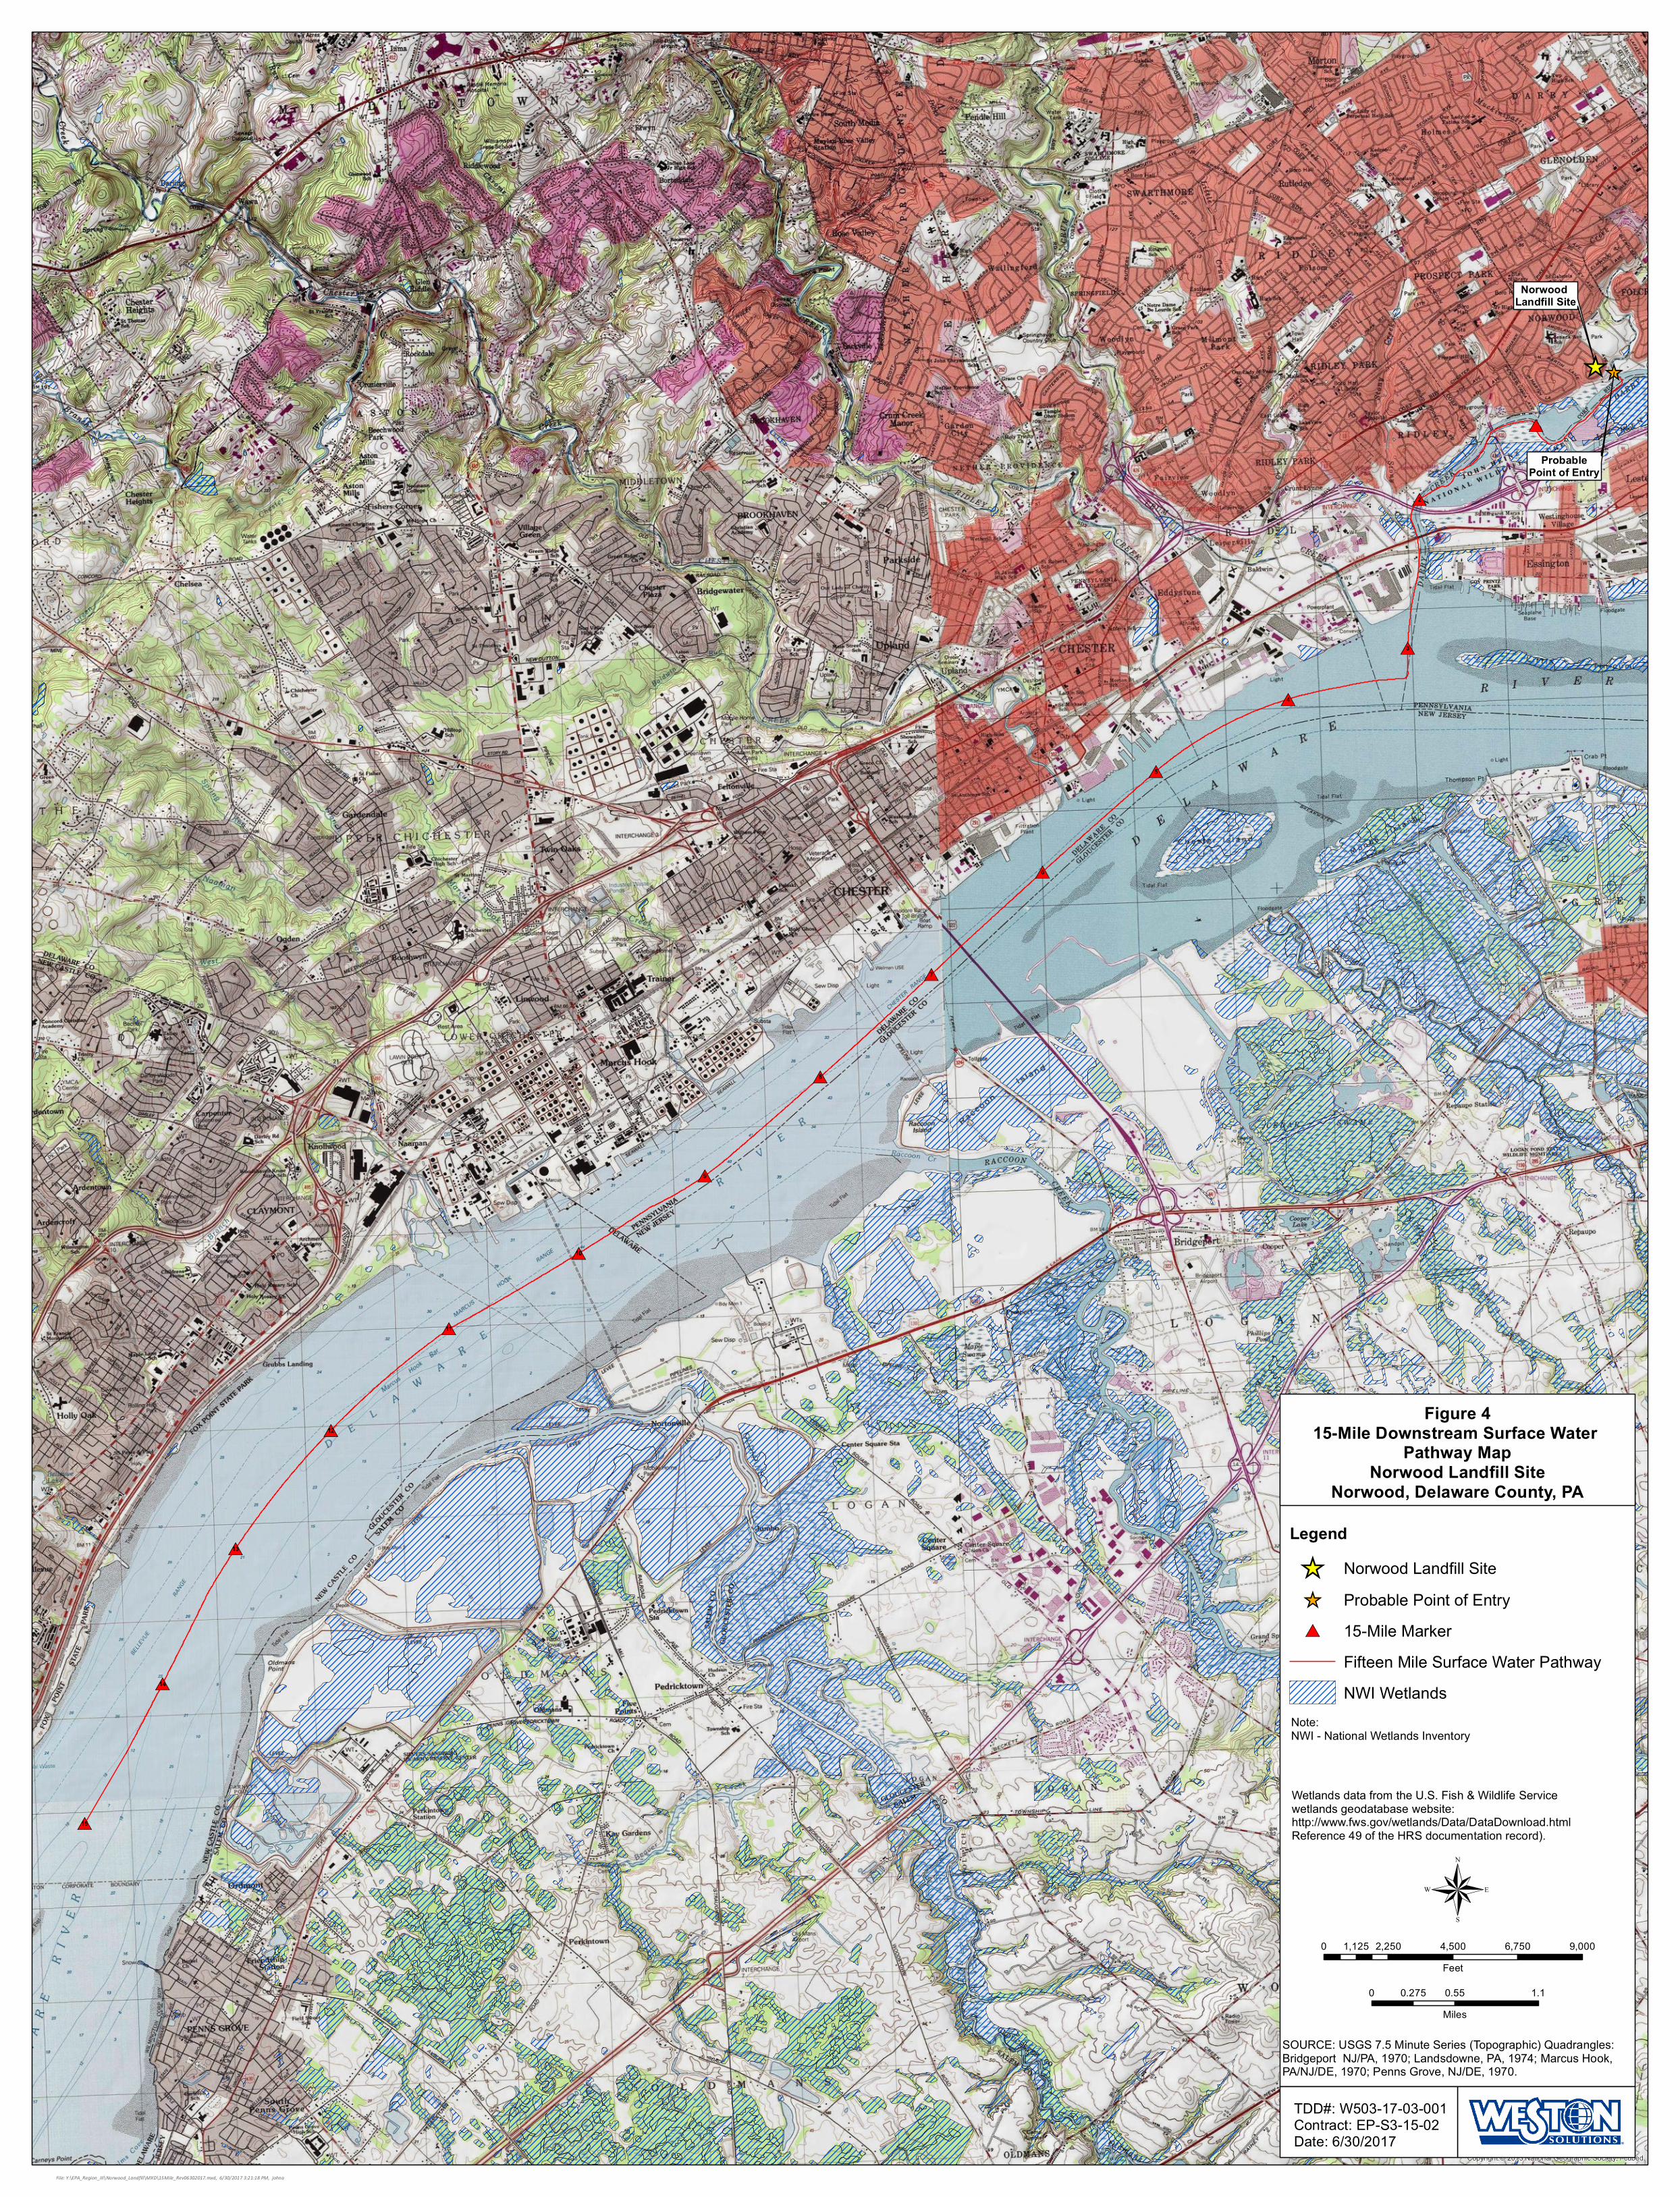
15-mile downstream TDL is shown on Figure 4 (Appendix A).
The Site is situated in the Darby Creek watershed and is part of the Delaware River Basin (Refs.
13 and 14). Portions of the Site consist of fully developed urban properties surrounded by
undeveloped areas that are overgrown with brush and trees. Surface water runoff in the developed
portions of the Site would most likely flow to storm drains along E. Winona Avenue and Essex
Road. The ground surface is relatively flat near the Site; therefore, surface water runoff in the
undeveloped portions of the Site would most likely percolate into the ground or run off into Darby
Creek.
Norwood Landfill Final Preliminary Assessment Report
July 2017 Page 9 TDD NO. WS05-17-03-001 DOCUMENT CONTROL NO. W0146.1A.02089
5.2 SURFACE WATER TARGETS
The primary public water supplier near the Site is the Aqua Pennsylvania. Aqua Pennsylvania
sources water from 8 surface water intakes and 28 groundwater wells and provides drinking water
to approximately 820,000 persons in Montgomery, Chester, and Delaware Counties (Ref. 15). One
of the surface water intakes is located
therefore, it is not located
along the 15-mile TDL. Persons served through this supply network are not potential targets
associated with the surface water migration pathway.
Muckinipattis Creek and Darby Creek are state-protected for the maintenance and propagation of
fish species and additional flora and fauna that are indigenous to a warm water habitat. The creeks
are also protected for the passage, maintenance, and propagation of anadromous and catadromous
fishes and other fishes that move to or from flowing waters to complete their life cycle in other
waters (Ref. 14).
As shown on Figures 1, 3, and 4 (Appendix A), John Heinz National Wildlife Refuge is located
across Darby Creek from the Site. Fourteen state-designated endangered species, 4 state-
designated threatened species, 1 federally-designated endangered species, and 1 federally-
designated threatened species are known to exist within Delaware County (Ref. 16). According
to the Pennsylvania Fish and Boat Commission, there are two access points for boats along the 15-
mile TDL (Ref. 17). Additionally, a floating dock was observed on the Muckinipattis Creek during
the site visit in April 2017. Based on the presence of several access points to the waterways near
the Site, it is assumed that recreational fishing occurs within the 15-mile TDL. Approximately
1.14 miles of wetlands are located along Darby Creek with an additional 7.28 miles of wetland
frontage located along the TDL in the Delaware River (Ref. 18).
5.3 SURFACE WATER CONCLUSIONS
Surface water and sediment samples were not collected as part of this PA. Surface water and
sediment samples were collected from Darby Creek in 1999 from locations adjacent to and
downstream of the Site. As discussed in Section 2.3, several SVOCs, primarily PAHs, were
detected in one surface water sample at concentrations above the EPA tapwater RBC, which was
(b) (9)
Norwood Landfill Final Preliminary Assessment Report
July 2017 Page 10 TDD NO. WS05-17-03-001 DOCUMENT CONTROL NO. W0146.1A.02089
used to compare the data. PAHs, arsenic, and lead were also detected in sediment samples at
concentrations exceeding the EPA RBC for industrial soil (Ref. 4).
For this PA report, the 1999 surface water and sediment sample analytical results were compared
to EPA BTAG freshwater screening criteria as shown on Tables 1 and 2 in Appendix B (Ref. 20).
As shown in Table 1 in Appendix B, one surface water sample, SW-4, contained a concentration
of carbon disulfide of 2.7 µg/L, which exceeds the BTAG screening criteria of 0.92 µg/L.
Concentrations of several PAHs, benzo(a)anthracene, benzo(a)pyrene, fluoranthene,
phenanthrene, and pyrene, exceeded their respective BTAG screening criteria in sample SW-4.
Estimated concentrations of fluoranthene and pyrene also exceeded BTAG screening values in
sample SW-5. Concentrations of total aluminum, barium, and iron in all six surface water samples
exceeded their respective BTAG screening criteria of 87 µg/L, 4 µg/L, and 300 µg/L at
concentrations ranging from 181 µg/L to 2,000 µg/L; 28.6 µg/L to 90.1 µg/L; and 937 µg/L to
7,290 µg/L, respectively. Sample SW-2 also contained concentrations of total calcium (383,000
µg/L), total copper (9.8 µg/L), and total zinc (134 µg/L) exceeding their respective BTAG
screening criteria of 116,000 µg/L, 9 µg/L, and 120 µg/L. Concentrations of total lead were
detected in five of the six surface water samples ranging from 2.8 µg/L to 11.2 µg/L. The detected
concentrations exceeded the lead BTAG screening criterion of 2.5 µg/L.
As shown in Table 2 in Appendix B, carbon disulfide was detected in four of the seven sediment
samples exceeding the BTAG freshwater screening criterion of 0.85 µg/kg at concentrations
ranging from 3.2 µg/kg to 23 µg/kg. Numerous SVOCs, particularly PAHs, were detected in five
of the seven samples at concentrations exceeding the BTAG criteria, with sample SE-2 containing
the highest concentrations. PCBs were detected in four of the seven sediment samples at
concentrations ranging from 200 µg/kg to 540 µg/kg, which exceed the BTAG criteria of 59.8
µg/kg. Several pesticides, including 4,4-dichlorodiphenyldichloroethane (4,4-DDD), 4,4-
dichlorodiphenyltrichloroethane (4,4-DDT), and 4,4-dichlorodiphenyldichloroethylene (4,4-
DDE), were detected in four of the seven sediment samples at concentrations exceeding the BTAG
criteria. Numerous metals, including arsenic, cadmium, chromium, copper, iron, lead, manganese,
mercury, nickel, and zinc were detected in the majority of the samples at concentrations exceeding
applicable BTAG criteria.
Norwood Landfill Final Preliminary Assessment Report
July 2017 Page 11 TDD NO. WS05-17-03-001 DOCUMENT CONTROL NO. W0146.1A.02089
As previously discussed in Section 2.3, it is unclear from the 1999 Level II Survey Report the
exact locations of the sediment samples; therefore, it is unclear if a suitable background sample
was collected as part of this investigation.
Areas of alleged disposal and sediment fill material from the Delaware River directly border
Muckinipattis Creek and Darby Creek. There are no drinking water targets associated with the
surface water migration pathway. Access to the creeks is unrestricted, with public access for
recreational purposes, including fishing along Darby Creek. Potential targets associated with the
surface water migration pathway include the Muckinipattis Creek and Darby Creek as fisheries,
14 state-designated endangered species, 4 state-designated threatened species, 1
federally-designated endangered species, and 1 federally-designated threatened species, John
Heinz National Wildlife Refuge, and 8.42 miles of wetland frontage located along the 15-mile
TDL.
6.0 SOIL EXPOSURE AND AIR MIGRATION PATHWAYS
This section provides information regarding the physical conditions of the Site and targets
associated with the soil exposure and air migration pathways.
6.1 PHYSICAL CONDITIONS
The Site consists of a residential area located in a lower Norwood neighborhood and the
surrounding property located between E. Winona Avenue and Darby Creek. The residential
portion of the Site consists of paved roads and individual residential houses. The portion of the
Site surrounding the neighborhood where alleged dumping occurred is undeveloped and
overgrown with heavy brush and trees. Access to the undeveloped portion of the Site is limited
because it is located behind private property and bordered by Darby Creek to the south. According
to the Delaware County Parcel Map, there are two right of way access points to the undeveloped
portion of the Site (Ref. 3).
6.2 SOIL AND AIR TARGETS
It has been alleged that potentially contaminated material from areas excavated when the Walt
Whitman Bridge was constructed was used as fill material during construction of the houses in the
Norwood Landfill Final Preliminary Assessment Report
July 2017 Page 12 TDD NO. WS05-17-03-001 DOCUMENT CONTROL NO. W0146.1A.02089
lower Norwood neighborhood and that the undeveloped areas surrounding the residential
neighborhood have been used as a waste dump; therefore, residents who reside in the lower
Norwood neighborhood are potential targets located on and within 200 feet of potential
contamination. No schools or daycare centers are located on the Site or within 200 feet of potential
source areas. Amosland Park is located approximately 1,000 feet to the north of the Site. John
Heinz National Wildlife Refuge is approximately 1,130 feet south of the Site, across Darby Creek.
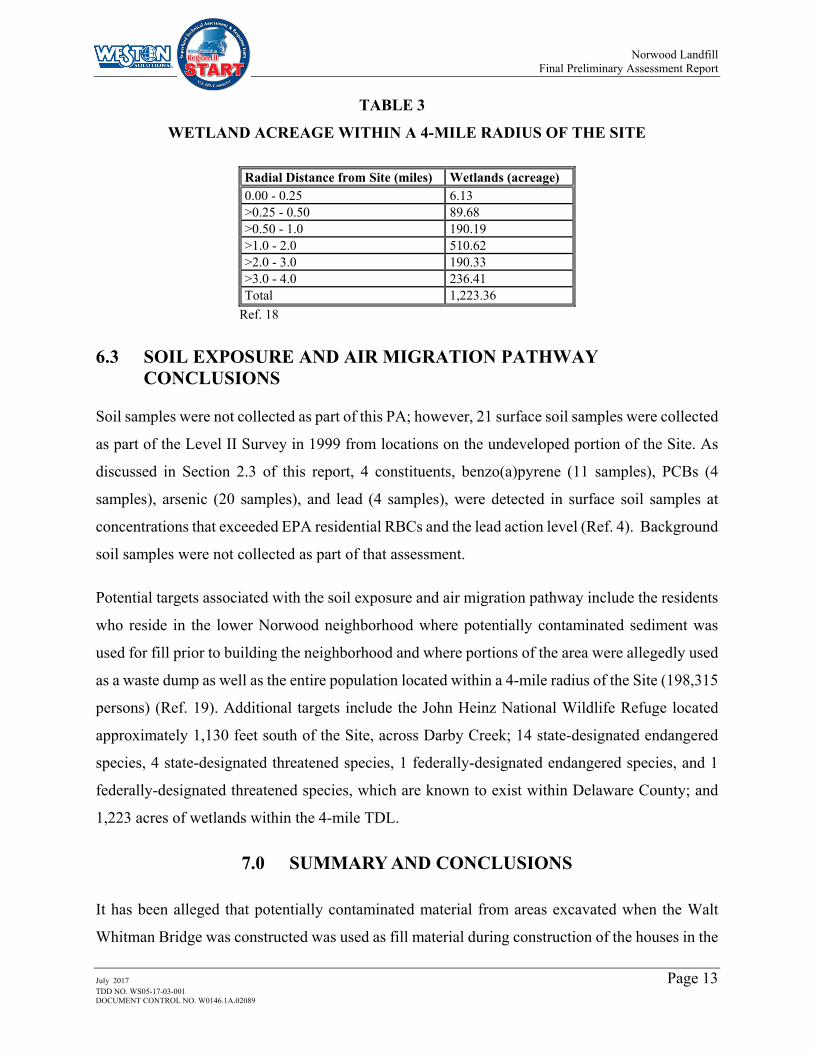
Norwood Elementary School is located approximately 1,700 feet to the northwest. The estimated
population and wetland acreage within a 4-mile radius of the Site are summarized below in Tables
2 and 3 (Refs. 18 and 19). Fourteen state-designated endangered species, 4 state-designated
threatened species, 1 federally-designated endangered species, and 1 federally-designated
threatened species are known to exist within Delaware County (Ref. 16).
TABLE 2
ESTIMATED POPULATION WITHIN A 4-MILE RADIUS OF THE SITE
Radial Distance from Site (miles) Population (number of persons) 0.00 - 0.25 764 >0.25 - 0.50 2,521 >0.50 - 1.0 10,667 >1.0 - 2.0 41,090 >2.0 - 3.0 57,454 >3.0 - 4.0 85,818 Total 198,315
Ref. 19
Norwood Landfill Final Preliminary Assessment Report
July 2017 Page 13 TDD NO. WS05-17-03-001 DOCUMENT CONTROL NO. W0146.1A.02089
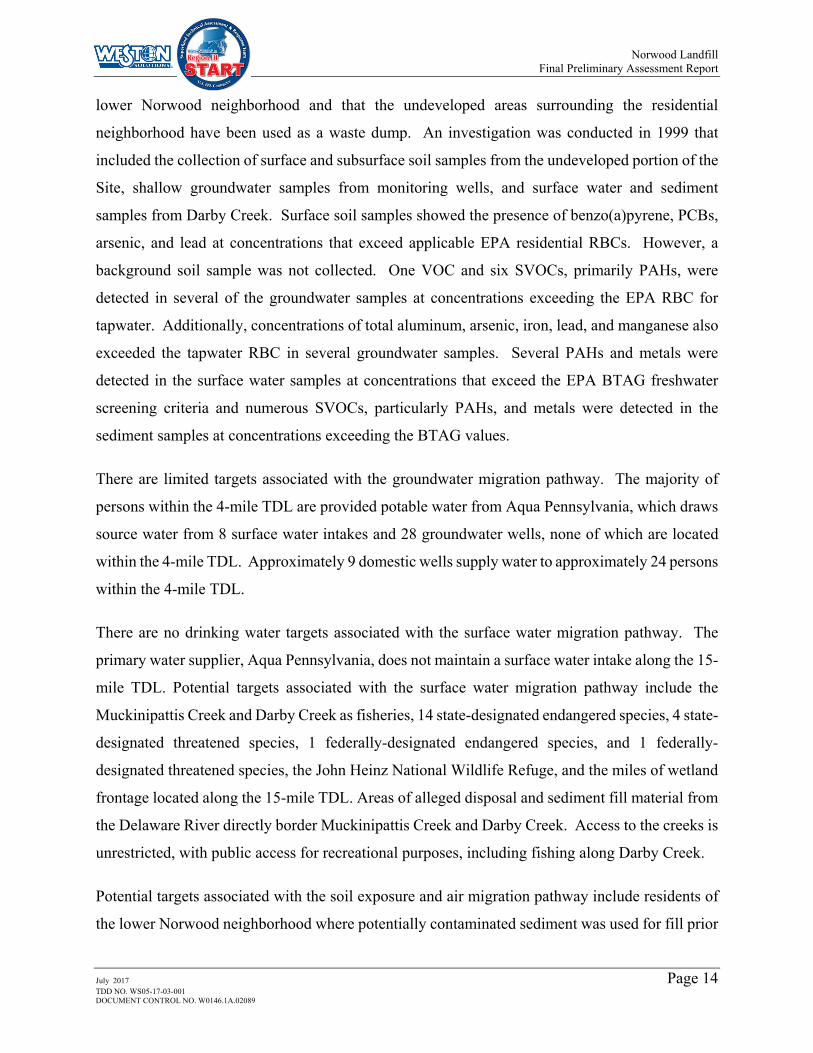
TABLE 3
WETLAND ACREAGE WITHIN A 4-MILE RADIUS OF THE SITE
Radial Distance from Site (miles) Wetlands (acreage) 0.00 - 0.25 6.13 >0.25 - 0.50 89.68 >0.50 - 1.0 190.19 >1.0 - 2.0 510.62 >2.0 - 3.0 190.33 >3.0 - 4.0 236.41 Total 1,223.36
Ref. 18
6.3 SOIL EXPOSURE AND AIR MIGRATION PATHWAY CONCLUSIONS
Soil samples were not collected as part of this PA; however, 21 surface soil samples were collected
as part of the Level II Survey in 1999 from locations on the undeveloped portion of the Site. As
discussed in Section 2.3 of this report, 4 constituents, benzo(a)pyrene (11 samples), PCBs (4
samples), arsenic (20 samples), and lead (4 samples), were detected in surface soil samples at
concentrations that exceeded EPA residential RBCs and the lead action level (Ref. 4). Background
soil samples were not collected as part of that assessment.
Potential targets associated with the soil exposure and air migration pathway include the residents
who reside in the lower Norwood neighborhood where potentially contaminated sediment was
used for fill prior to building the neighborhood and where portions of the area were allegedly used
as a waste dump as well as the entire population located within a 4-mile radius of the Site (198,315
persons) (Ref. 19). Additional targets include the John Heinz National Wildlife Refuge located
approximately 1,130 feet south of the Site, across Darby Creek; 14 state-designated endangered
species, 4 state-designated threatened species, 1 federally-designated endangered species, and 1
federally-designated threatened species, which are known to exist within Delaware County; and
1,223 acres of wetlands within the 4-mile TDL.
7.0 SUMMARY AND CONCLUSIONS
It has been alleged that potentially contaminated material from areas excavated when the Walt
Whitman Bridge was constructed was used as fill material during construction of the houses in the
Norwood Landfill Final Preliminary Assessment Report
July 2017 Page 14 TDD NO. WS05-17-03-001 DOCUMENT CONTROL NO. W0146.1A.02089
lower Norwood neighborhood and that the undeveloped areas surrounding the residential
neighborhood have been used as a waste dump. An investigation was conducted in 1999 that
included the collection of surface and subsurface soil samples from the undeveloped portion of the
Site, shallow groundwater samples from monitoring wells, and surface water and sediment
samples from Darby Creek. Surface soil samples showed the presence of benzo(a)pyrene, PCBs,
arsenic, and lead at concentrations that exceed applicable EPA residential RBCs. However, a
background soil sample was not collected. One VOC and six SVOCs, primarily PAHs, were
detected in several of the groundwater samples at concentrations exceeding the EPA RBC for
tapwater. Additionally, concentrations of total aluminum, arsenic, iron, lead, and manganese also
exceeded the tapwater RBC in several groundwater samples. Several PAHs and metals were
detected in the surface water samples at concentrations that exceed the EPA BTAG freshwater
screening criteria and numerous SVOCs, particularly PAHs, and metals were detected in the
sediment samples at concentrations exceeding the BTAG values.
There are limited targets associated with the groundwater migration pathway. The majority of
persons within the 4-mile TDL are provided potable water from Aqua Pennsylvania, which draws
source water from 8 surface water intakes and 28 groundwater wells, none of which are located
within the 4-mile TDL. Approximately 9 domestic wells supply water to approximately 24 persons
within the 4-mile TDL.
There are no drinking water targets associated with the surface water migration pathway. The
primary water supplier, Aqua Pennsylvania, does not maintain a surface water intake along the 15-
mile TDL. Potential targets associated with the surface water migration pathway include the
Muckinipattis Creek and Darby Creek as fisheries, 14 state-designated endangered species, 4 state-
designated threatened species, 1 federally-designated endangered species, and 1 federally-
designated threatened species, the John Heinz National Wildlife Refuge, and the miles of wetland
frontage located along the 15-mile TDL. Areas of alleged disposal and sediment fill material from
the Delaware River directly border Muckinipattis Creek and Darby Creek. Access to the creeks is
unrestricted, with public access for recreational purposes, including fishing along Darby Creek.
Potential targets associated with the soil exposure and air migration pathway include residents of
the lower Norwood neighborhood where potentially contaminated sediment was used for fill prior
Norwood Landfill Final Preliminary Assessment Report
July 2017 Page 15 TDD NO. WS05-17-03-001 DOCUMENT CONTROL NO. W0146.1A.02089
to building the neighborhood and where portions of the area were allegedly used as a waste dump,
as well as the entire population located within a 4-mile radius of the site (198,315 persons).
Additional targets include the John Heinz National Wildlife Refuge located approximately 1,130
feet south of the Site, across Darby Creek; 14 state-designated endangered species, 4 state-
designated threatened species, 1 federally-designated endangered species, and 1 federally-
designated threatened species known to exist within Delaware County; and 1,223 acres of wetlands
within the 4-mile TDL.

Norwood Landfill Final Preliminary Assessment Report
July 2017 Page 16 TDD NO. WS05-17-03-001 DOCUMENT CONTROL NO. W0146.1A.02089
8.0 REFERENCES
1. U.S. Environmental Protection Agency. 1991. Guidance for Performing Site Preliminary Assessments Under CERCLA. Hazardous Site Evaluation Division, Office of Solid Waste and Remedial Response, Washington, DC. September.
2. Google. 2017. Norwood Borough, PA. Google Maps. Available: https://www.google.com/maps/place/39%C2%B052'55.8%22N+75%C2%B017'29.0%22W/@39.8821556,-75.2935887,17z/data=!3m1!4b1!4m5!3m4!1s0x0:0x0!8m2!3d39.8821556!4d-75.2914
3. Delaware County, Pennsylvania. 2017. Delaware County Real Estate Parcels & Tax Records System and Homestead Status – Folio# 31-00-00609-03. Available: w01.co.delaware.pa.us/pa/publicaccess.asp?UAYN=Y&real.x=0 Accessed: April 13, 2017 and May 10, 2017.
4. Program Management Company. 1999. Site Sampling Survey John Heinz National Wildlife Refuge, Tinicum, Pennsylvania. Exton, Pennsylvania. June.
5. Pennsylvania Department of Conservation and Natural Resources. 2000. Physiographic Provinces of Pennsylvania. Bureau of Topographic and Geologic Survey. Fourth Edition.
6. Low, Dennis J., Daniel J. Hippe, and Dawna Yannacci. 2002. Geohydrology of Southeastern Pennsylvania. Water-Resources Investigations Report 00-4166. U.S. Geological Survey. New Cumberland, Pennsylvania.
7. Geyer, Alan and Peter J. Wilshusen. 1982. Engineering Characteristics of the Rocks of Pennsylvania. Environmental Geology Report 1. Pennsylvania Department of Environmental Resources Bureau of Topographic and Geologic Survey. Harrisburg, Pennsylvania.
8. Balmer, Wayne T. and Drew K. Davis. 1996. Groundwater Resources of Delaware County, Pennsylvania. Water Resource Report 66. Pennsylvania Geological Survey, Fourth Series. Harrisburg, Pennsylvania.
9. Aqua Pennsylvania, Inc. 2016. 2016 Water Quality Report, Main System, PWSID#: PA1460073.
10. Pennsylvania Department of Conservation and Natural Resources. 2017. Pennsylvania Groundwater Information System Database. Bureau of Topographic and Geological Survey. Available: www.dcnr.state.pa.us/topogeo/groundwater/pagwis/index.htm Accessed: April 26, 2017.
11. Aqua Pennsylvania, Inc. 2017. Available: https://www.aquaamerica.com/customer-service-center/water-quality.aspx?ZpCode=19082&submit=Go+%E2%80%BA Accessed: June 28, 2017.
Norwood Landfill Final Preliminary Assessment Report
July 2017 Page 17 TDD NO. WS05-17-03-001 DOCUMENT CONTROL NO. W0146.1A.02089
12. U.S. Department of Commerce. 2012. State and County Quickfacts. U.S. Census Bureau. Available: https://www.census.gov/quickfacts/fact/table/delawarecountypennsylvania,US/PST045216
13. Delaware County Conservation District. 2017. Darby Creek. Available: http://www.delcocd.org/darby-creek/ Accessed: May 30, 2017.
14. Pennsylvania Code. 2017. Delaware River Basin in Pennsylvania. Delaware River. Chapter 93. Section 9g. Drainage List g. Available: http://www.pacode.com/secure/data/025/chapter93/s93.9f.html Accessed: May 30, 2017.
15. Pennsylvania Department of Environmental Protection, Bureau of Water Supply Management. 2005. Source water Assessment Public Summary. Aqua Pennsylvania Water Company – Main System, PWSID #1460073. July.
16. Pennsylvania Natural Heritage Program. 2017. Species of Special Concerns Lists for Delaware County. Available: http://www.naturalheritage.state.pa.us/Species.aspx Accessed: June 2, 2017.
17. Pennsylvania Fish and Boat Commission. 2017. County Guide. Available: http://pfbc.maps.arcgis.com/apps/webappviewer/index.html?id=3292981a1fcf415e9ce4a4a7a3ce98e2 Accessed: June 2, 2017.
18. 2017. Weston Solutions, Inc. (WESTON®). Project Note to Norwood Landfill file: Wetland Frontage Located Along the 15-Mile Surface Water Pathway Target Distance Limit (TDL). April 26, 2017.
19. 2017. Weston Solutions, Inc. (WESTON®). Project Note to Norwood Landfill file: Population Analysis for Norwood Landfill Site. April 26, 2017.
20. U.S. Environmental Protection Agency. 2006. Biological Technical Assistance Screening Values. July 2006. Available: https://www.epa.gov/risk/biological-technical-assistance-group-btag-screening-values
(b) (4)
(b) (4)

Norwood Landfill Final Preliminary Assessment Report
APPENDIX A
FIGURES
kj
Figure 1Site Location Map
Site Location
Norwood Landfill SiteNorwood, Delaware County, PA
TDD#: W503-17-03-001Contract: EP-S3-15-02Prepared: 6/30/2017
USGS 7.5 Minute QuadrangleLandsdowne, Pa. 1974.
0 2,000Feet
File: Y:\EPA_Region_III\Norwood_Landfill\MXD\Site_Location.mxd, 6/30/2017 10:52:30 AM, johna
Pennsylvania
New Jersey
Maryland Delaware
Coordinate System:WGS84 UTM Zone 18N Feet
´
File: Y:\EPA_Region_III\Norwood_Landfill\MXD\Level2_Survey.mxd, 6/30/2017 11:19:34 AM, johna
Norwood Landfill SiteNorwood, Delaware County, PA
Figure 2Site Layout Map
TDD#: W503-17-03-001Contract: EP-S3-15-02Prepared: 6/30/2017
´ 0 300150Feet
Data SourcesImagery: ESRI, Bing Mapping ServiceShapefiles: US Fish and Wildlife Service
Coordinate System:WGS 1984 UTM Zone 18NLinear Unit: Foot USDatum: WGS 1984
Legendkj Norwood Landfill Site$1
1999 USFWS Level 2 Survey Sample LocationsParcel Boundary
kj
!?
!?!?
!?
!?!?!? !?
!?
!?
File: Y:\EPA_Region_III\Norwood_Landfill\MXD\4Mile_distance_rings.mxd, 6/30/2017 2:40:24 PM, johna
Norwood Landfill SiteNorwood, Delaware County, PA
Figure 34-Mile Radius Map with
Distance RingsTDD#: W503-17-03-001Contract: EP-S3-15-02Prepared: 6/30/2017
´ 0 4,4002,200Feet
Data SourcesImagery: USGS 7.5-Minute SeriesTopogrpahic QuadranglesShapefiles: Weston generated
Coordinate System:WGS 1984 UTM Zone 18NLinear Unit: Foot USDatum: WGS 1984
Legendkj Norwood Landfill Site!? Domestic Wells") Surface Water Intake
NWI WetlandsDistance Buffers
0.25 Miles0.5 Miles1 Miles2 Miles3 Miles4 Miles
Notes:NIW- National Wetlands Inventory
(b) (9)
#*
#*
#*
#*
#*
#*
#*
#*
#*
#*
#*
#*
#*
#*
#*
_̂̂_
Norwood Landfill Site
ProbablePoint of Entry
9
8
7
6
5
4
3
2
15
14
13
12
11
10
Copyright:© 2013 National Geographic Society, i-cubed
®0 0.55 1.10.275
Miles
SOURCE: USGS 7.5 Minute Series (Topographic) Quadrangles:Bridgeport NJ/PA, 1970; Landsdowne, PA, 1974; Marcus Hook,PA/NJ/DE, 1970; Penns Grove, NJ/DE, 1970.
0 2,250 4,500 6,750 9,0001,125Feet
Legend
_̂ Norwood Landfill Site_̂ Probable Point of Entry#* 15-Mile Marker
Fifteen Mile Surface Water PathwayNWI Wetlands
Figure 415-Mile Downstream Surface Water
Pathway MapNorwood Landfill Site
Norwood, Delaware County, PA
TDD#: W503-17-03-001Contract: EP-S3-15-02Date: 6/30/2017
Wetlands data from the U.S. Fish & Wildlife Servicewetlands geodatabase website:http://www.fws.gov/wetlands/Data/DataDownload.htmlReference 49 of the HRS documentation record).
File: Y:\EPA_Region_III\Norwood_Landfill\MXD\15Mile_Rev06302017.mxd, 6/30/2017 3:21:18 PM, johna
Note:NWI - National Wetlands Inventory

Norwood Landfill Final Preliminary Assessment Report
APPENDIX B
TABLES
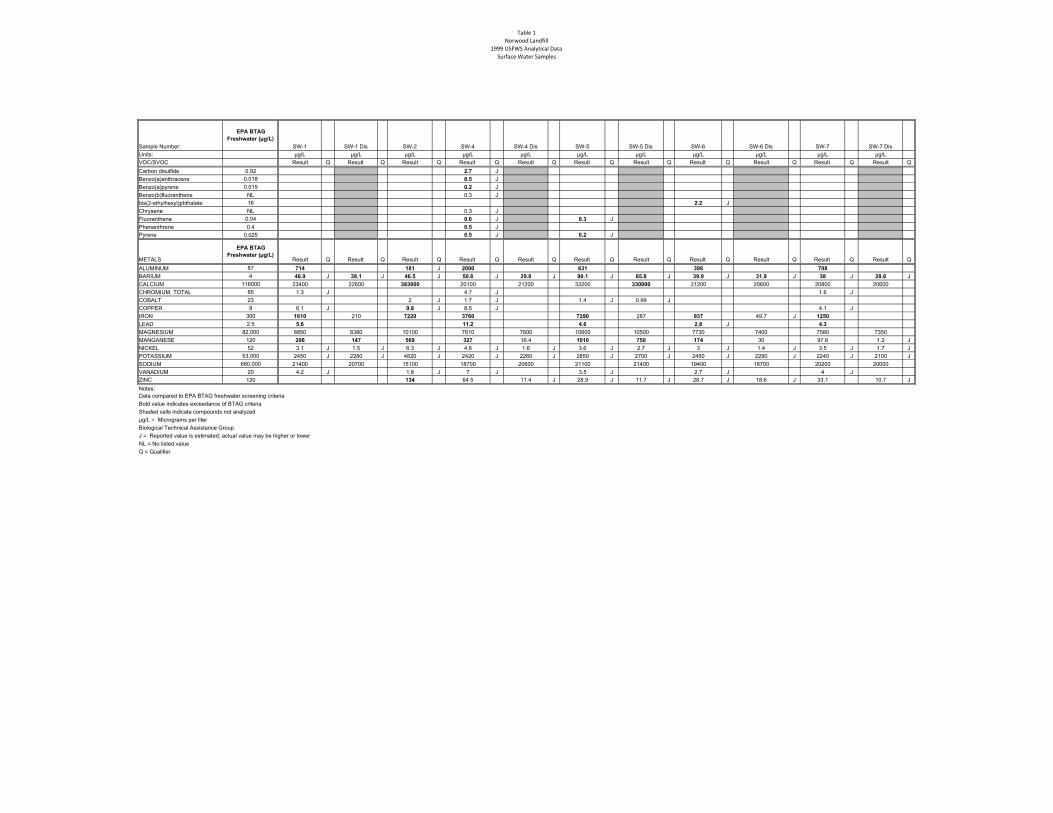
Table 1Norwood Landfill
1999 USFWS Analytical DataSurface Water Samples
Sample Number:
EPA BTAG Freshwater (µg/L)
SW-1 SW-1 Dis SW-2 SW-4 SW-4 Dis SW-5 SW-5 Dis SW-6 SW-6 Dis SW-7 SW-7 DisUnits: µg/L µg/L µg/L µg/L µg/L µg/L µg/L µg/L µg/L µg/L µg/LVOC/SVOC Result Q Result Q Result Q Result Q Result Q Result Q Result Q Result Q Result Q Result Q Result QCarbon disulfide 0.92 2.7 JBenzo(a)anthracene 0.018 0.5 JBenzo(a)pyrene 0.015 0.2 JBenzo(b)fluoranthene NL 0.3 Jbis(2-ethylhexyl)phthalate 16 2.2 JChrysene NL 0.3 JFluoranthene 0.04 0.6 J 0.3 JPhenanthrene 0.4 0.5 JPyrene 0.025 0.5 J 0.2 J
METALS
EPA BTAG Freshwater (µg/L)
Result Q Result Q Result Q Result Q Result Q Result Q Result Q Result Q Result Q Result Q Result QALUMINUM 87 714 181 J 2000 631 398 708
BARIUM 4 46.9 J 38.1 J 46.5 J 50.6 J 29.8 J 90.1 J 65.8 J 39.9 J 31.9 J 38 J 28.6 JCALCIUM 116000 23400 22600 383000 20100 21200 33200 330000 21200 20600 20800 20600CHROMIUM, TOTAL 85 1.3 J 4.7 J 1.6 JCOBALT 23 2 J 1.7 J 1.4 J 0.99 JCOPPER 9 6.1 J 9.8 J 8.5 J 4.1 JIRON 300 1610 210 7220 3760 7290 287 937 49.7 J 1250
LEAD 2.5 5.6 11.2 4.6 2.8 J 4.3
MAGNESIUM 82,000 8850 8380 10100 7610 7600 10600 10500 7730 7400 7580 7350MANGANESE 120 206 147 569 327 16.4 1010 750 174 30 97.6 1.2 JNICKEL 52 3.1 J 1.5 J 6.3 J 4.6 J 1.6 J 3.6 J 2.7 J 3 J 1.4 J 3.5 J 1.7 JPOTASSIUM 53,000 2450 J 2280 J 4820 J 2420 J 2260 J 2850 J 2700 J 2450 J 2290 J 2240 J 2100 JSODIUM 680,000 21400 20700 15100 18700 20600 21100 21400 19400 18700 20200 20000VANADIUM 20 4.2 J 1.8 J 7 J 3.5 J 2.7 J 4 JZINC 120 134 64.5 11.4 J 28.9 J 11.7 J 28.7 J 18.6 J 33.1 10.7 JNotes:Data compared to EPA BTAG freshwater screening criteria
Shaded cells indicate compounds not analyzed µg/L = Micrograms per literBiological Technical Assistance GroupJ = Reported value is estimated; actual value may be higher or lower NL = No listed valueQ = Qualifier
Bold value indicates exceedance of BTAG criteria
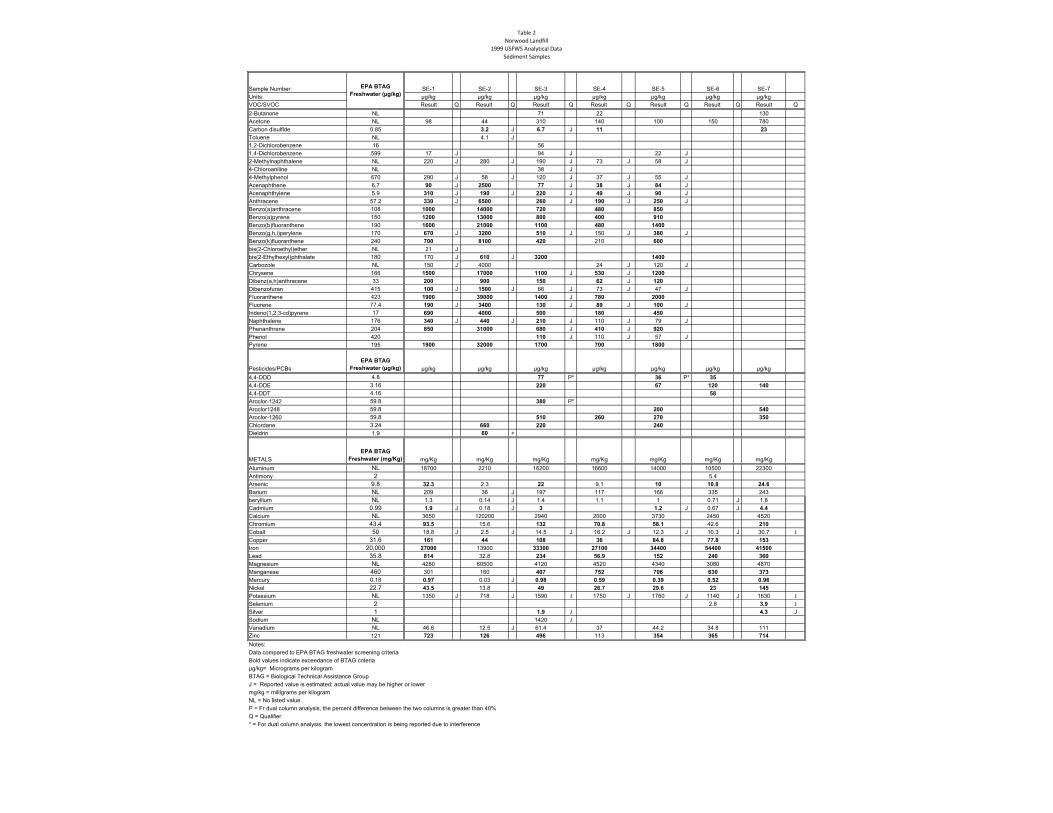
Table 2Norwood Landfill
1999 USFWS Analytical DataSediment Samples
Sample Number: SE-1 SE-2 SE-3 SE-4 SE-5 SE-6 SE-7Units: µg/kg µg/kg µg/kg µg/kg µg/kg µg/kg µg/kgVOC/SVOC Result Q Result Q Result Q Result Q Result Q Result Q Result Q2-Butanone NL 71 22 130Acetone NL 98 44 310 140 100 150 780Carbon disulfide 0.85 3.2 J 6.7 J 11 23Toluene NL 4.1 J1,2-Dichlorobenzene 16 561,4-Dichlorobenzene 599 17 J 94 J 22 J2-Methylnaphthalene NL 220 J 280 J 190 J 73 J 58 J4-Chloroaniline NL 38 J4-Methylphenol 670 290 J 58 J 120 J 37 J 55 JAcenaphthene 6.7 90 J 2500 77 J 38 J 84 JAcenaphthylene 5.9 310 J 190 J 220 J 49 J 90 JAnthracene 57.2 330 J 6500 260 J 190 J 250 JBenzo(a)anthracene 108 1000 14000 720 480 850Benzo(a)pyrene 150 1200 13000 800 400 910Benzo(b)fluoranthene 190 1600 21000 1100 480 1400Benzo(g,h,i)perylene 170 670 J 3200 510 J 150 J 380 JBenzo(k)fluoranthene 240 700 8100 420 210 600bis(2-Chloroethyl)ether NL 21 Jbis(2-Ethylhexyl)phthalate 180 170 J 610 J 3200 1400Carbozole NL 150 J 4000 24 J 120 JChrysene 166 1500 17000 1100 J 530 J 1200Dibenz(a,h)anthracene 33 200 900 150 62 J 120Dibenzofuran 415 100 J 1500 J 66 J 73 J 47 JFluoranthene 423 1900 39000 1400 J 780 2000Fluorene 77.4 190 J 3400 130 J 89 J 100 JIndeno(1,2,3-cd)pyrene 17 690 4000 500 180 450Naphthalene 176 340 J 440 J 210 J 110 J 79 JPhenanthrene 204 850 31000 680 J 410 J 920Phenol 420 110 J 110 J 57 JPyrene 195 1900 32000 1700 700 1800
Pesticides/PCBsEPA BTAG
Freshwater (µg/kg) µg/kg µg/kg µg/kg µg/kg µg/kg µg/kg µg/kg4,4-DDD 4.8 77 P* 36 P* 354,4-DDE 3.16 220 67 120 1404,4-DDT 4.16 58Aroclor-1242 59.8 380 P*Aroclor1248 59.8 200 540Aroclor-1260 59.8 510 260 270 350Chlordane 3.24 660 220 240Dieldrin 1.9 60 +
METALSEPA BTAG
Freshwater (mg/Kg) mg/Kg mg/Kg mg/Kg mg/Kg mg/Kg mg/Kg mg/KgAluminum NL 18700 2210 16200 16600 14000 10500 22300Antimony 2 5.4Arsenic 9.8 32.3 2.3 22 9.1 10 10.8 24.6Barium NL 209 36 J 197 117 166 335 243beryllium NL 1.3 0.14 J 1.4 1.1 1 0.71 J 1.8Cadmium 0.99 1.9 J 0.18 J 3 1.2 J 0.67 J 4.4Calcium NL 3650 120200 2940 2000 3730 2450 4520Chromium 43.4 93.5 15.6 132 70.8 58.1 42.6 210Cobalt 50 18.8 J 2.5 J 14.5 J 16.2 J 12.3 J 10.3 J 30.7 JCopper 31.6 161 44 108 36 84.8 77.8 153Iron 20,000 27000 13900 33300 27100 34400 54400 41500Lead 35.8 814 32.8 234 56.9 152 240 360Magnesium NL 4280 60500 4120 4520 4340 3080 4870Manganese 460 301 160 407 752 706 630 373Mercury 0.18 0.97 0.03 J 0.98 0.59 0.39 0.52 0.96Nickel 22.7 43.5 13.8 49 26.7 29.6 23 145Potassium NL 1350 J 718 J 1590 J 1750 J 1760 J 1140 J 1630 JSelenium 2 2.8 3.9 JSilver 1 1.9 J 4.3 JSodium NL 1420 JVanadium NL 46.6 12.5 J 61.4 37 44.2 34.8 111Zinc 121 723 126 496 113 354 365 714
Notes:Data compared to EPA BTAG freshwater screening criteriaBold values indicate exceedance of BTAG criteriaµg/kg= Micrograms per kilogramBTAG = Biological Technical Assistance GroupJ = Reported value is estimated; actual value may be higher or lower mg/kg = milligrams per kilogramNL = No listed valueP = Fr dual column analysis, the percent difference between the two columns is greater than 40% Q = Qualifier* = For dual column analysis, the lowest concentration is being reported due to interference
EPA BTAG Freshwater (µg/kg)