final pilot study advanced geophysical classification · pilot study advanced geophysical...
TRANSCRIPT

FINAL PILOT STUDY
ADVANCED GEOPHYSICAL CLASSIFICATION Spring Valley Formerly Used Defense Site
Spring Valley, Washington, DC
Prepared for:
U.S. Army Corps of Engineers Baltimore District
Contract: W912DR-15-D-0015, Delivery Order 0001
Prepared by: ERT, Inc.
Laurel, Maryland 20707
APRIL 2017

This Page Intentionally Left Blank

FINAL
PILOT STUDY ADVANCED GEOPHYSICAL CLASSIFICATION
Spring Valley Formerly Used Defense Site Spring Valley, Washington, DC
Prepared for:
U.S. Army Corps of Engineers
Baltimore District
Contract W912DR-15-D-0015
Delivery Order 0001
Prepared by:
ERT, Inc.
Laurel, Maryland 20707
(240) 554-0161
02/28/17
Thomas Bachovchin Date Project Manager
12/20/16
Jennifer Harlan Date Program Manager, PMP

This Page Intentionally Left Blank

Spring Valley FUDS Final Pilot Study Report – Advanced Geophysical Classification April 2017
ERT, Inc. i
COMPLETION OF SENIOR TECHNICAL REVIEW
This document has been produced within the framework of the ERT, Inc. (ERT) quality management system. As such, a senior technical review has been conducted. This included review of all elements addressed within the document, proposed or utilized technologies and alternatives and their applications with respect to project objectives and framework of U.S. Army Corps of Engineers regulatory constraints under the current project, within which this work has been completed.
12/20/16
Jennifer Harlan Date Senior Technical Reviewer
COMPLETION OF INDEPENDENT TECHNICAL REVIEW
This document has been produced within the framework of ERT’s quality management system. As such, an independent technical review, appropriate to the level of risk and complexity inherent in the project, has been conducted. This included a review of assumptions; alternatives evaluated; the appropriateness of data used and level of data obtained; and reasonableness of the results, including whether the product meets the project objectives. Comments and concerns resulting from review of the document have been addressed and corrected as necessary.
12/20/16
Michelle Chestnut Date Independent Technical Reviewer

Spring Valley FUDS Final Pilot Study Report – Advanced Geophysical Classification April 2017
ERT, Inc. ii
This Page Intentionally Left Blank

Spring Valley FUDS Final Pilot Study Report – Advanced Geophysical Classification April 2017
ERT, Inc. iii
TABLE OF CONTENTS
1.0 INTRODUCTION AND BACKGROUND ........................................................................1 1.1 Purpose and Objectives ........................................................................................... 1 1.2 Study Scope ............................................................................................................ 1 1.3 SVFUDS Background ............................................................................................. 2
1.3.1 Previous Investigations ............................................................................ 2 1.3.2 Conceptual Site Model ............................................................................. 3 1.3.3 Current Site Status ................................................................................... 4 1.3.4 Stakeholder Involvement ......................................................................... 5
1.4 Report Organization ................................................................................................ 5 2.0 SITE LOGISTICS AND FIELD WORK PROCEDURES .................................................7
2.1 Community Outreach .............................................................................................. 7 2.2 Site Preparation ....................................................................................................... 7
2.2.1 Landscape Survey/Arborist Appraisal ..................................................... 7 2.2.2 Civil Survey ............................................................................................. 7 2.2.3 Boundary Definition Study ...................................................................... 7 2.2.4 Determination of Geophysical Survey Accessible Areas ........................ 8 2.2.5 Vegetation Removal................................................................................. 8
2.3 Geophysical Equipment .......................................................................................... 8 2.3.1 MPV ......................................................................................................... 8 2.3.2 TEMTADS ............................................................................................... 9 2.3.3 Robotic Total Station ............................................................................... 9 2.3.4 Real Time Kinematic Global Positioning System ................................... 9 2.3.5 EM61-MK2A ......................................................................................... 10 2.3.6 Schonstedt GA-52Cx Magnetometer ..................................................... 10 2.3.7 White’s DFX-300 metal detector ........................................................... 10
2.4 Geodetic System Selection ................................................................................... 10 2.5 Geophysical System Verification (GSV) .............................................................. 10
2.5.1 Background ............................................................................................ 10 2.5.2 Instrument Verification Strip Construction ........................................... 11 2.5.3 Blind Seeding Program .......................................................................... 12
2.6 Geophysical Data Collection ................................................................................ 13 2.6.1 IVS ......................................................................................................... 13 2.6.2 AGC Geophysical Data Acquisition ...................................................... 21 2.6.3 Supplemental EM61-MK2A Surveys .................................................... 24
3.0 DYNAMIC SURVEY DATA QUALITY.........................................................................25 3.1 MPV ...................................................................................................................... 25 3.2 TEMTADS ............................................................................................................ 25

Spring Valley FUDS Final Pilot Study Report – Advanced Geophysical Classification April 2017
ERT, Inc. iv
3.3 Dynamic Data Measurement Quality Objectives ................................................. 26 3.4 Effect of Site Noise ............................................................................................... 27 3.5 Depth of Detection ................................................................................................ 28 3.6 Target Selection Accuracy .................................................................................... 31
3.6.1 Blind Verification Seed Detection ......................................................... 31 3.6.2 TOI Detection ........................................................................................ 35
3.7 Non Conformance Report (NCR) and Root Cause Analysis (RCA) Summary ... 35 3.7.1 NCR001 ................................................................................................. 35 3.7.2 NCR002 ................................................................................................. 37 3.7.3 NCR003 ................................................................................................. 38
3.8 Dynamic Data Target Synthesis............................................................................ 40 4.0 CUED SURVEY DATA QUALITY .................................................................................41
4.1 Background Verification and Correction .............................................................. 41 4.2 Intrinsic and Extrinsic Parameters ........................................................................ 41 4.3 MPV Cued Data Processing.................................................................................. 44 4.4 TEMTADS Cued Data Processing ....................................................................... 44 4.5 Cued Data Measurement Quality Objectives ........................................................ 44 4.6 Cued Data Analysis and Classification ................................................................. 46
4.6.1 Library Development ............................................................................. 46 4.6.2 Training Data ......................................................................................... 47 4.6.3 MPV Classification ................................................................................ 47 4.6.4 TEMTADS Classification ...................................................................... 48
4.7 Final Cued Target Synthesis ................................................................................. 49 5.0 INTRUSIVE INVESTIGATION.......................................................................................51
5.1 Overview ............................................................................................................... 51 5.2 Intrusive Investigation Procedures ........................................................................ 51
5.2.1 Reacquisition.......................................................................................... 51 5.2.2 Excavation.............................................................................................. 51 5.2.3 Anomaly Resolution Process ................................................................. 52
5.3 Intrusive Investigation Findings ........................................................................... 52 5.3.1 4720 Quebec Street ................................................................................ 52 5.3.2 4733 Woodway Lane ............................................................................. 53 5.3.3 4740 Quebec Street ................................................................................ 53
6.0 CLASSIFICATION RESULTS .........................................................................................55 6.1 ROC Curves .......................................................................................................... 55 6.2 Clutter Rejection ................................................................................................... 57
6.2.1 Cannot Analyze Targets ......................................................................... 57 6.3 Classification Accuracy for Blind Verification Seeds .......................................... 57 6.4 Classification of Native TOI ................................................................................. 61

Spring Valley FUDS Final Pilot Study Report – Advanced Geophysical Classification April 2017
ERT, Inc. v
6.5 Classification Measurement Quality Objectives ................................................... 61 6.5.1 NCR004 ................................................................................................. 61
6.6 Final Target Classifications .................................................................................. 62 7.0 COMPARATIVE ANALYSIS OF AGC METHODOLOGIES .......................................65
7.1 Advantages and Disadvantages of Each AGC Method ........................................ 65 7.1.1 Detecting Deep TOI ............................................................................... 66 7.1.2 Minimizing the Number of Intrusive Investigations .............................. 67 7.1.3 Blind Seed Detection and Classification................................................ 67 7.1.4 Instrument Coverage and Property Impacts ........................................... 67 7.1.5 Availability of Equipment and Trained Processors ............................... 68 7.1.6 Cost and Level of Effort ........................................................................ 68
7.2 Comparative Analysis Conclusions ...................................................................... 69 8.0 CONCLUSIONS AND RECOMMENDATIONS ............................................................71
8.1 Data and Measurement Quality Objectives .......................................................... 71 8.1.1 DQO and MQO Achievement ............................................................... 71
8.2 AGC Methods Compared to Traditional Geophysical Methods........................... 72 8.2.1 AGC Advantages ................................................................................... 73
8.3 Lessons Learned.................................................................................................... 75 8.3.1 Acceptance of Leaving Metallic Items in the Ground ........................... 75 8.3.2 Site Preparation ...................................................................................... 75 8.3.3 Survey System ....................................................................................... 75 8.3.4 Geophysical System Verification .......................................................... 76 8.3.5 Noise ...................................................................................................... 76
8.4 Recommended Procedures for Future Work......................................................... 76 8.4.1 Verification/Validation .......................................................................... 77
8.5 Accreditation ......................................................................................................... 77 8.6 Conclusions ........................................................................................................... 78 8.7 Recommendations ................................................................................................. 78
9.0 REFERENCES ..................................................................................................................79

Spring Valley FUDS Final Pilot Study Report – Advanced Geophysical Classification April 2017
ERT, Inc. vi
LIST OF TABLES
Table 2-1: IVS Summary .............................................................................................................. 11
Table 2-2: Blind Seed Summary .................................................................................................. 13
Table 2-3: Initial IVS Results of MPV and TEMTADS with RTK GPS ..................................... 15
Table 2-4: Initial IVS Results of MPV and TEMTADS with RTS .............................................. 15
Table 2-5: TEMTADS IVS results using RTK GPS and Single Source Solver ............................... 19
Table 2-6: TEMTADS IVS results using RTS and Single Source Solver ....................................... 19
Table 2-7: MPV IVS results using RTK GPS ............................................................................... 20
Table 2-8: MPV IVS results using RTS ......................................................................................... 20
Table 2-9: DGM Survey Durations ............................................................................................... 21
Table 2-10: Percent Coverage – Dynamic Survey ........................................................................ 21
Table 3-1: Dynamic Data MQOs .................................................................................................. 26
Table 3-2: Site Noise Levels ......................................................................................................... 27
Table 3-3: Percent Coverage – Dynamic Survey .......................................................................... 31
Table 3-4: Dynamic Target Selection Accuracy for Blind Seeds ................................................. 32
Table 3-5: EM61-MK2A Blind Seed Offsets ............................................................................... 34
Table 3-6: TOI Offset ................................................................................................................... 35
Table 3-7: Missed Blind Seeds – NCR 003 .................................................................................. 38
Table 3-8: Corrective Actions for MPV – NCR 003 .................................................................... 39
Table 3-9: Corrective Actions for TEMTADS – NCR 003 .......................................................... 39
Table 3-10: Dynamic Data Target Synthesis into Cued Targets .................................................. 40
Table 4-1: Cued Data MQOs ........................................................................................................ 44
Table 4-2: Final Cued Target Synthesis........................................................................................ 49
Table 5-1: Pilot Study Munitions-Related Finds .......................................................................... 54
Table 6-1: Clutter Rejection Rates ................................................................................................ 57
Table 6-2: MPV Classification of Blind Seeds ............................................................................. 59
Table 6-3: TEMTADS Classification of Blind Seeds................................................................... 60
Table 6-4: Classification of Native TOI ....................................................................................... 61
Table 6-5: Cued Classification MQO ........................................................................................... 61
Table 7-1: MPV and TEMTADS Comparative Analysis ............................................................. 65
Table 8-1: Advantages of AGC Methodology Over Traditional DGM Methodology ................. 72

Spring Valley FUDS Final Pilot Study Report – Advanced Geophysical Classification April 2017
ERT, Inc. vii
LIST OF EXHIBITS
Exhibit 2.1. Orientation of the Four TEMTADS Sensor Elements ................................................ 9
Exhibit 2.2. MPV Response Curve (at Properties) ...................................................................... 17
Exhibit 2.3. TEMTADS Response Curve (at IVS) ....................................................................... 17
Exhibit 3.1. MPV-Minimum Depth of Detection ......................................................................... 29
Exhibit 3.2. TEMTADS-Minimum Depth of Detection ............................................................... 30
Exhibit 3.3. EM61-Minimum Depth of Detection ........................................................................ 30
Exhibit 3.4: Blind Seed Offsets .................................................................................................... 33
Exhibit 3.5: MPV Data in the Vicinity of Seed #16 (white triangle) ........................................... 36
Exhibit 3.6: TEMTADS Paths Shown Relative to Seed #16 (red circle) ..................................... 37
Exhibit 4.1: TEMTADS Decision Plot ......................................................................................... 42
Exhibit 4.2: MPV Decision Plot ................................................................................................... 43
Exhibit 6.1: MPV ROC Curve for the Pilot Study ...................................................................... 56
Exhibit 6.2: TEMTADS ROC Curve for the Pilot Study ............................................................ 56
Exhibit 6.3: MPV Misclassified Blind Seed Data ....................................................................... 62
Exhibit 8.1: Stokes Mortar Data – G-858 (left) and EM61 ......................................................... 74
Exhibit 8.2: Stokes Mortar Data – MPV and TEMTADS ........................................................... 74
LIST OF APPENDIX A FIGURES
Figure 1 – SVFUDS Location Map ............................................................................................ A-1
Figure 2 - Pilot Study Properties ................................................................................................ A-1
Figure 3 - TEMTADS Dynamic Data Targets, 4720 Q St. ........................................................ A-1
Figure 4 - MPV Dynamic Data Targets, 4720 Q St. ................................................................... A-1
Figure 5 – Supplemental EM61 Data, 4720 Q St. ...................................................................... A-1
Figure 6 - Targets That Were Cued, 4720 Q St. ......................................................................... A-1
Figure 7 - Final Dig Targets, 4720 Q St. .................................................................................... A-1
Figure 8 - TEMTADS Classification of Targets, 4720 Q St. ..................................................... A-1
Figure 9 - MPV Classification of Targets, 4720 Q St. ................................................................ A-1
Figure 10 - MPV and TEMTADS Classification of Targets, 4720 Q St. ................................... A-1
Figure 11 - Summary of Selected Targets, 4720 Q St. ............................................................... A-1
Figure 12- TEMTADS Dynamic Data Targets, 4733 W Ln. ..................................................... A-1
Figure 13- MPV Dynamic Data Targets, 4733 W Ln. ................................................................ A-1

Spring Valley FUDS Final Pilot Study Report – Advanced Geophysical Classification April 2017
ERT, Inc. viii
Figure 14- Supplemental EM61 Data, 4733 W Ln. .................................................................... A-1
Figure 15- Targets That Were Cued, 4733 W Ln. ...................................................................... A-1
Figure 16 - Final Dig Targets, 4733 W Ln. ................................................................................ A-1
Figure 17- TEMTADS Classification of Targets, 4733 W Ln. .................................................. A-1
Figure 18- MPV Classification of Targets, 4733 W Ln.............................................................. A-1
Figure 19 - MPV and TEMTADS Classification of Targets, 4733 W Ln. ................................. A-1
Figure 20- Summary of Selected Targets, 4733 W Ln. .............................................................. A-1
Figure 21- TEMTADS Dynamic Data Targets s, 4740 Q St. ..................................................... A-1
Figure 22- MPV Dynamic Data Targets, 4740 Q St. .................................................................. A-1
Figure 23- Supplemental EM61 Data, 4740 Q St. ...................................................................... A-1
Figure 24- Targets That Were Cued, 4740 Q St. ........................................................................ A-1
Figure 25- Final Dig Targets, 4740 Q St. ................................................................................... A-1
Figure 26- TEMTADS Classification of Targets, 4740 Q St. .................................................... A-1
Figure 27- MPV Classification of Targets, 4740 Q St. .............................................................. A-1
Figure 28- MPV and TEMTADS Classification of Targets, 4740 Q St. .................................... A-1
Figure 29- Summary of Selected Targets, 4740 Q St. ................................................................ A-1
LIST OF APPENDICES
Appendix A: Figures ................................................................................................................... A-1
Appendix B: IVS and Blind Seed Installation Memoranda ........................................................ B-1
Appendix C: Verification Documentation .................................................................................. C-1
Appendix D: Non-Conformance and Root Cause Analysis Reports .......................................... D-1
Appendix E: Dig Sheets ............................................................................................................... E-1
Appendix F: Final Target Lists .................................................................................................... F-1
Appendix G: Photo Log .............................................................................................................. G-1

Spring Valley FUDS Final Pilot Study Report – Advanced Geophysical Classification April 2017
ERT, Inc. ix
LIST OF ACRONYMS AND ABBREVIATIONS
AGC Advanced Geophysical Classification AOI area of interest ARB Anomaly Review Board AU American University AUES American University Experiment Station bgs below ground surface BTG Black Tusk Geophysics CA Corrective Action CEHNC USACE Huntsville Center CENAB Corps of Engineers, Baltimore District cm centimeter CSM Conceptual Site Model CWM Chemical Warfare Materiel DD Decision Document DGM digital geophysical mapping DGQCRs Daily Geophysical Quality Control Reports DMM discarded military munitions DOEE District of Columbia Department of Energy and Environment DQO data quality objective DUA data usability assessment EMI electromagnetic induction EOD Explosive Ordnance Disposal ERT ERT, Inc. ESTCP Environmental Security Technology Certification Program FS Feasibility Study FUDS Formerly Used Defense Sites GPS global positioning system GSV geophysical sensor verification IMU Inertial Measurement Unit ISO industry standard object IVS instrument verification strip LOE level of effort MD munitions debris MEC munitions and explosives of concern mm millimeter ms millisecond

Spring Valley FUDS Final Pilot Study Report – Advanced Geophysical Classification April 2017
ERT, Inc. x
mV millivolt mV/A millivolts per amp MPV Man-Portable Vector MQO measurement quality objective NAD North American Datum NCR Non-Conformance Report NRL Naval Research Laboratory OESS Ordnance and Explosives Safety Specialist PP Proposed Plan QA quality assurance QC quality control RAOs Remedial Action Objectives RCA root cause analysis RI Remedial Investigation ROC receiver operating characteristic RTK real-time kinematic RTS robotic total station SOP standard operating procedure SUXOS Senior UXO Supervisor SVFUDS Spring Valley Formerly Used Defense Site TEMTADS time-domain electromagnetic multi-sensor towed-array detection system TOI target of interest TPC Three-phase Control UFP-QAPP Uniform Federal Policy for Quality Assurance Project Plans USACE U.S. Army Corps of Engineers USEPA U.S. Environmental Protection Agency UXO unexploded ordnance UXOQC/SO Unexploded Ordnance Quality Control Specialist/ Safety Officer

Spring Valley FUDS Final Pilot Study Report – Advanced Geophysical Classification April 2017
ERT, Inc. ES-1
EXECUTIVE SUMMARY
INTRODUCTION AND SCOPE ERT, Inc., (ERT) was tasked with performing a Pilot Study of Advanced Geophysical Classification (AGC) Technology in cooperation with an Environmental Security Technology Certification Program (ESTCP) Demonstration Project at the Spring Valley Formerly Used Defense Site (SVFUDS). The recommended remedial alternative to meet the Remedial Action Objectives (RAOs) of reducing the potential for encountering Munitions and Explosives of Concern (MEC) is to utilize AGC to classify anomalies and potentially reduce the number of anomaly removals.
The primary objective of the study was to evaluate the implementation and effectiveness of AGC technology using Time-domain Electromagnetic Multi-sensor Towed Array Detection System (TEMTADS) and Man Portable Vector (MPV) instrumentation at the SVFUDS in order to best inform planning for the remedial action. The Pilot Study was initially scoped to be performed on five SVFUDS residential properties where digital geophysical mapping (DGM) had previously been collected between 2007 and 2009. However, right-of-entry (ROE) for two of the five properties could not be obtained, and the study proceeded using the three remaining properties.
FIELD WORK APPROACH Prior to performing the geophysical surveys, a landscape survey to document the existing landscaping and vegetation was conducted by a qualified arborist. A site visit was also conducted to define and document all accessible areas where the geophysical surveys could be completed, to allow reasonable access for TEMTADS and MPV equipment. Landscape removal was limited to low-lying vegetation that could adversely affect the geophysical results.
Geophysical system verification was conducted using an Instrument Verification Strip (IVS) and a blind seeding program. The IVS was constructed in proximity to the existing Geophysical Prove Out on the federal property. Blind seeds were installed at each property using both inert munitions and industry standard objects (ISOs). The results of these efforts were captured in Memoranda, submitted to USACE and approved prior to the start of work.
The geophysical survey activities included conducting AGC Geophysics using the TEMTADS and MPV instruments to complete dynamic surveys (mapping with a moving sensor) and cued surveys (collecting data with a static sensor on a specific point) on each property. The instruments were operated by demonstrators under the ESTCP, with personnel from the Naval Research Laboratory (NRL) operating the TEMTADS, and personnel from Weston Solutions, Inc. and Black Tusk Geophysics (BTG) operating the MPV. The EM61 instrument, operated by ERT, was also used in selected areas not previously available during the earlier DGM investigations.
DYNAMIC AND CUED SURVEYS The MPV dynamic data collected in the field were processed and analyzed by the BTG team, and the TEMTADS dynamic data collected in the field were processed and analyzed by the NRL team.
Targets were selected from dynamic TEMTADS and MPV data by the respective instrument demonstrators, and cued data were then collected over the targets. Following the processing of

Spring Valley FUDS Final Pilot Study Report – Advanced Geophysical Classification April 2017
ERT, Inc. ES-2
the cued MPV and TEMTADS data, and the addition of the EM61 data, the synthesis of the cued targets into the final dig target list was performed. From this list, final dig sheets were generated for use by the UXO intrusive team.
INTRUSIVE INVESTIGATION For this Pilot Study, all targets were intrusively investigated. On average, 200+ targets were excavated from each of the three properties, under softscape and hardscape (sidewalks and driveways), by a qualified UXO team. Excavations were completed using shovels in softscape, or using power tools (concrete saws, jackhammers) in hardscape.
The 4720 Quebec property was the only property where munitions-related items were found during this Pilot Study. These included a 3-inch Stokes Mortar unfuzed practice round. In accordance with the approved Uniform Federal Policy for Quality Assurance Project Plans (UFP-QAPP), this item was turned over to the USACE Ordnance and Explosives Safety Specialist (OESS) for further processing. The OESS initiated a response from the Fort Belvoir Explosive Ordnance Disposal (EOD) unit, who took control of the item, removing it from the site for further assessment. It was ultimately determined to be a practice round and was properly disposed by the EOD unit. Targets #94, #201, and #202, at 4720 Quebec were also determined to be munitions debris. At the other properties, nails, steel scrap, and wires were common.
CLASSIFICATION RESULTS In order to analyze the data and assess each demonstrator’s classification process, Receiver Operating Characteristic (ROC) curves, clutter rejection rates, and ultimately, the correct classification of targets of interest (TOI) and non-TOI were used to show how well the data were classified.
TOI were classified into various categories, for example:
Cannot Analyze targets (data quality too poor to confidently classify). High Confidence Digs (targets are likely TOI). Lower Confidence Digs (targets could be TOI). High Confidence Do Not Dig (targets should not be TOI)
Figures representing the final dig recommendations based on classification, specific to each instrument, were prepared. Note that while all targets were intrusively investigated for this Pilot Study, for an actual AGC-based approach, only those targets recommended for digging would actually be excavated.
CONCLUSIONS AGC methods employing MPV and TEMTADS systems were successfully used at the SVFUDS. For three private properties, 200+ targets per property were detected, classified, and intrusively investigated. Four MD items, including one intact Stokes Mortar (determined to be an unfuzed practice round), were found. Both demonstrators correctly classified the Stokes Mortar found at 4720 Quebec.
In support of the primary objective of the Pilot Study, a comparison of AGC methods relative to traditional DGM methods used at the SVFUDS was conducted. In general, while there were challenges with noise in an urban environment, the findings of this Pilot Study support the

Spring Valley FUDS Final Pilot Study Report – Advanced Geophysical Classification April 2017
ERT, Inc. ES-3
implementation of AGC methods over the traditional DGM methods for future SVFUDS remedial actions.
A secondary objective of the Study was to determine which of the two AGC systems might be most effective for future remedial actions at the SVFUDS. With regard to performance of the individual AGC methodologies, while the MPV technology appears to have a slight advantage over the TEMTADS, given the lack of a strong preference for one system over the other, it is concluded that either technology could be effectively utilized to meet the RAOs for the SVFUDS.
Finally, with regard to the need to detect larger items at greater depths than either AGC system could achieve, AGC methodologies could be supplemented by traditional DGM technology, such as the G-858, to address deeper targets.
RECOMMENDATIONS The findings of this Pilot Study support the implementation of AGC methods over traditional DGM methods for future SVFUDS remedial actions. The specific AGC methodology to be implemented should be refined through the planning process, considering the recommended procedures presented in Section 8.4, as well as input from project stakeholders.

Spring Valley FUDS Final Pilot Study Report – Advanced Geophysical Classification April 2017
ERT, Inc. ES-1
This Page Intentionally Left Blank

Spring Valley FUDS Final Pilot Study Report – Advanced Geophysical Classification April 2017
ERT, Inc. 1
1.0 INTRODUCTION AND BACKGROUND ERT, Inc., (ERT) was tasked with performing a Pilot Study of Advanced Geophysical Classification (AGC) Technology in cooperation with an Environmental Security Technology Certification Program (ESTCP) Demonstration Project at the Spring Valley Formerly Used Defense Site (SVFUDS). The recommended remedial alternative to meet the SVFUDS Remedial Action Objectives (RAOs) of reducing the potential for encountering Munitions and Explosives of Concern (MEC) is to utilize AGC to classify anomalies and potentially reduce the number of anomaly removals.
ERT conducted this work for the U.S. Army Corps of Engineers (USACE), at the SVFUDS, located in Washington, D.C., under the Small Business Multiple Award Military Munitions Services II Contract #W912DR-15-D-0015, Delivery Order 0001. This effort falls under the Defense Environmental Restoration Program/Formerly Used Defense Sites (DERP/FUDS). All work was performed in compliance with the Comprehensive Environmental Response, Compensation, and Liability Act (CERCLA) and the National Oil and Hazardous Substances Pollution Contingency Plan, 40 CFR Part 300. As these activities involved work in areas potentially contaminated with MEC and Chemical Warfare Materiel (CWM) related items, it was conducted in full compliance with USACE, Baltimore District (CENAB), USACE Huntsville Center (CEHNC), Department of the Army, and Department of Defense regulations regarding personnel, equipment, and procedures.
1.1 Purpose and Objectives The purpose of the AGC Pilot Study was to assess the recommended remedial alternative presented in the Site-Wide Proposed Plan (PP), finalized in June 2016 (USACE, 2016b). The recommended remedial alternative to meet the RAOs of reducing the potential for encountering MEC is to utilize AGC technology to classify anomalies and potentially reduce the number of anomaly removals. Reducing the number of removals is especially advantageous at the SVFUDS as it will not only likely result in a reduced overall cost for the future remedial action by eliminating unnecessary digs, but will also minimize adverse impacts such as landscape or hardscape damage at residential properties where the remedial action will occur. The primary objective of the study was to evaluate the implementation and effectiveness of AGC technology using Time-domain Electromagnetic Multi-sensor Towed Array Detection System (TEMTADS) and Man Portable Vector (MPV) instrumentation at the SVFUDS in order to best inform planning for the remedial action. In addition, an EM61-MK2A instrument was used to survey several areas not previously surveyed during the 2007 – 2009 geophysical survey activities, and to provide supplemental data to support submittal of assurance letters to property owners that verify remediation is complete.
1.2 Study Scope The Pilot Study was initially scoped to be performed on five specific SVFUDS residential properties where digital geophysical mapping (DGM) had previously been collected between 2007 and 2009. However, right-of-entry (ROE) for two of the five properties could not be obtained, and the study proceeded using three properties.
The work included conducting AGC Geophysics using the TEMTADS and MPV instruments to

Spring Valley FUDS Final Pilot Study Report – Advanced Geophysical Classification April 2017
ERT, Inc. 2
complete dynamic surveys (mapping with a moving sensor) and cued surveys (collecting data with a static sensor on a point) on each property. The instruments were operated by demonstrators under the Environmental Security Technology Certification Program (ESTCP), with personnel from the Naval Research Laboratory (NRL) operating the TEMTADS, and personnel from Weston Solutions, Inc. and Black Tusk Geophysics (BTG) operating the MPV.
The EM61 instrument, operated by ERT, was also used in selected areas not previously available during the earlier investigations. Following the surveys, final dig lists were developed and all target anomalies were excavated.
All properties included in this study were categorized as low probability sites (i.e., the probability of encountering MEC/CWM during intrusive investigations is “seldom” or “remotely possible”). All work was conducted in accordance with the Advanced Geophysical Classification for Munitions Response Uniform Federal Policy Quality Assurance Project Plan (UFP-QAPP) for Munitions Response, Final March 2016 (USACE, 2016c). Additionally, procedures from the Site-Wide Work Plan for the SVFUDS, USACE, 2007, were also followed.
1.3 SVFUDS Background The SVFUDS comprises 661 acres in northwest Washington, D.C. This is a largely residential area with local shops and restaurants, surrounded by dense apartment buildings and/or townhouses, and spreading out into single-family homes. Land use in and around the SVFUDS is primarily low-density residential, with smaller portions zoned for commercial use. The campus of American University (AU) occupies a large portion of the SVFUDS.
During World War I, the U.S. Government established the American University Experiment Station (AUES) to investigate the testing, production, and effects of noxious gases, antidotes and protective masks. The AUES, which was located on the grounds of the current AU, used additional property in the vicinity to conduct this research and development on CWM, including mustard and lewisite agents, as well as adamsite, irritants and smokes. After the war, these activities were transferred to other locations, the AUES was demobilized, and the site was returned to the owners.
Figure 1 shows the entire SVFUDS boundary and the three residential Pilot Study properties. (All figures are presented in Appendix A while Tables and Exhibits are contained within the body of the report).
1.3.1 Previous Investigations The Site-Wide Remedial Investigation Report (RI Report) documents all previous investigations. The discussions below summarize the investigations most relevant to the Pilot Study. Geophysical investigations were conducted on 99 residential properties between 1998 and 2011. The investigations were conducted in two phases: non-intrusive geophysical surveys to identify buried metallic anomalies; then, following analysis of the survey results by an Anomaly Review Board (ARB), excavations of metallic anomalies with characteristics of buried munition items. Each of the three properties selected for this Pilot Study has previously undergone DGM and anomaly removal, as discussed below.

Spring Valley FUDS Final Pilot Study Report – Advanced Geophysical Classification April 2017
ERT, Inc. 3
1.3.1.1 4720 Quebec Street USACE conducted a DGM investigation on this property in 2007, with follow-on anomaly removal completed in 2009. Out of 69 total anomalies, 54 were selected by the ARB for removal and were successfully excavated in 2009. Two munition debris (MD) fragments (one from a 75 millimeter (mm) projectile and one not further identified) were found during the investigation (USACE, 2010).
1.3.1.2 4733 Woodway Lane USACE conducted a DGM investigation on this property in 2009, with follow-on anomaly removal completed in 2011. Out of 32 total anomalies selected by the ARB for removal, 31 were successfully investigated. One anomaly was not investigated due to its location under the walkway. No MEC/Recovered CWM (RCWM) items or other (AUES)-related items were encountered (USACE, 2011b)
1.3.1.3 4740 Quebec Street USACE conducted a DGM investigation on this property in 2009, with follow-on anomaly removal completed in 2010. Out of 45 total anomalies selected by the ARB for removal, all were successfully investigated at 4740 Quebec Street. A pipe that contained explosives was categorized as a MEC item. Based on the results of soil sample associated with the MEC find, the 4740 Quebec Street property included spot removal of soil based on trinitrotoluene (TNT) contamination (USACE, 2011a).
1.3.2 Conceptual Site Model Conceptual Site Models (CSMs) present the pathway analysis that identifies all complete, potentially complete, or incomplete pathways for both current and reasonably anticipated future land uses for a site. Each pathway must include a source, a receptor, and interaction between them (access and activity). Sources are those areas where MEC have entered the site. A receptor is an organism (human or ecological) that contacts the source. Interaction describes access and activities that facilitate receptors coming into contact with a source.
The primary release mechanisms resulting in the occurrence of MEC are related to the type of military munition activity. Releases may result from the improper functioning of the military munition, or military munitions may be lost, abandoned, or buried, resulting in unfired munitions. In addition, the munitions may possibly be spread beyond the immediate vicinity by the detonation (“kickouts”), or incomplete combustion or low/high order detonation failure can leave uncombusted explosives. In some cases, excess, obsolete, or unserviceable munitions may have been buried near the testing areas as discarded military munitions (DMM).
The MEC CSM for the SVFUDS is based on the historical AUES activities, where munitions were ballistically and statically fired. The SVFUDS Range Fan was developed based on ballistically fired testing activities of 3-inch and 4-inch Stokes Mortars and Livens projectiles. Static firing, the remote firing of fixed or stationary munitions, was also conducted (at the SVFUDS, this primarily involved 75mm munitions). The investigations of the sources of munitions for the SVFUDS were focused around the past activities most likely to result in MEC, specifically:
Ballistically Fired Testing (e.g., Range Fan);

Spring Valley FUDS Final Pilot Study Report – Advanced Geophysical Classification April 2017
ERT, Inc. 4
Statically Fired Testing (e.g., Circular Trenches); and Disposal or Burial (e.g., area of interest [AOI] 13).
Ballistic firing can result in MEC in impact areas or buffers around these areas, while static firing often produces kick-out. DMM are often associated with static fire areas where these munitions are buried near the test site. All of these can result in MEC being present in the subsurface. All but burial pits can result in MEC at the surface.
Figure 2 indicates that all three of the Pilot Study properties are considered areas of focus for response actions because they lie within the AOI 13 possible disposal area. AOI 13 is one of two areas of the SVFUDS identified as ‘possible’ disposal areas based on the findings of various investigations. These are considered ‘possible’ disposal areas based on a weight of evidence assessment, but it is not certain that they contain buried munitions. Note that Figure 2 shows munitions-related finds from the previous investigations and not from this Pilot Study.
1.3.3 Current Site Status The RI Report, characterizing the nature and extent of contamination, was finalized in June 2015 (USACE, 2015). The Site-Wide Feasibility Study (FS), evaluating alternatives to address remaining risks or hazards, was finalized in January 2016 (USACE, 2016a). Figure 2 indicates the areas of active response action necessary to mitigate explosive hazards, as identified through the FS, and the three residential properties involved in the Study. The Site-Wide Proposed Plan was finalized in June 2016, and the Site-Wide Decision Document (DD), formalizing the selection of the recommended alternative, is in the process of being finalized.
The RI Report concluded that, with regard to explosive hazards, the unknowns associated with the locations identified as possible disposal areas, and the moderate potential explosive hazard conditions they represent, suggest that follow-on actions may be required to mitigate unacceptable explosive hazards that could exist in these areas.
The RAOs to mitigate these unacceptable explosive hazards, as initially presented in the FS and slightly modified through the PP and DD process, are:
Reduce the potential for encountering MEC in the identified focus areas of potential explosive hazards by investigating and removing subsurface anomalies that are most likely military munitions, to the depth of detection of the technology and procedures used.
Reduce the probability of residents, workers, and visitors handling MEC encountered during residential or construction activities conducted within the SVFUDS, through education and awareness initiatives (in addition to the focus areas, these initiatives will also be applied to all areas of the SVFUDS to address the possibility that MEC could be relocated to, or less likely, found there).
Based on the FS’s detailed analysis of explosive hazards remedial alternatives for the areas of focus, DGM Accessible Areas, Remove Selected Anomalies, was the preferred remedial alternative to achieve the RAOs. This alternative was selected as the preferred alternative through the PP/DD process. The Pilot Study is intended to further evaluate the implementation and effectiveness of AGC Technology as part of this alternative.

Spring Valley FUDS Final Pilot Study Report – Advanced Geophysical Classification April 2017
ERT, Inc. 5
1.3.4 Stakeholder Involvement The project stakeholders include, but are not limited to, USACE; the District of Columbia Department of Energy & Environment (DOEE); the U.S. Environmental Protection Agency (USEPA) Regional office (Region III); and the Pilot Study property residents. CEHNC provides additional oversight for activities involving CWM.
1.4 Report Organization This Pilot Study Report is organized into sections as follows:
Section 1.0 is an introduction and background section. Section 2.0 discusses site logistics and field procedures. It describes the significant
preparation activities required, including what was set up and how the demonstrators used it.
Sections 3.0 and 4.0 describe the Dynamic and Cued AGC surveys, respectively, including data processing procedures and results.
Section 5.0 provides the intrusive investigation details. Section 6.0 discusses the AGC survey final classification results. Section 7.0 provides a comparative analysis of the AGC methodologies Section 8.0 presents Study conclusions and recommendations.
The report also contains seven appendices, as follows:
Appendix A presents all relevant figures. Tables and Exhibits are contained within the test, but all large scale figures presenting data results are contained in Appendix A. The figures are organized into a series of 9 maps per property, representing the sequence of the phases of work. They are sequential for a given property so that all phases can be followed on consecutive maps. That is, Figures 3 through 11 show the results of different phases for the 4720 property. Figures 12 through 20 show the results for the 4733 property. Figures 21 through 29 show the results for the 4740 property.
Appendix B presents IVS and Blind Seed Memoranda. Appendix C presents verification documentation including Quality Control (QC), Three-
phase Control (TPC) checklists, and SUXOS Daily reports. Appendix D presents Non-conformance Reports and Recommended Corrective Actions. Appendix E presents field dig sheets. Appendix F presents a series of target lists generated by different phases of the Study. Appendix G presents a photolog.

Spring Valley FUDS Final Pilot Study Report – Advanced Geophysical Classification April 2017
ERT, Inc. 6
This Page Intentionally Left Blank
1

Spring Valley FUDS Final Pilot Study Report – Advanced Geophysical Classification April 2017
ERT, Inc. 7
2.0 SITE LOGISTICS AND FIELD WORK PROCEDURES This section discusses the field work procedures, including site set-up and preparation, the results of the geophysical system verification (initial instrument testing and prove-out), and DGM data collection methods used at the Pilot Study properties.
2.1 Community Outreach Prior to start of work in the neighborhood, ERT provided support to the SVFUDS Community Outreach Team to work with and notify property owners of all aspects of the Pilot Study schedule from the planning phase to the restoration phase. Significant coordination was involved, both with individual property owners as well as with the greater community, in order to prepare for the field effort. Individual resident support involving many meetings and telephone calls was necessary prior to, during, and after the individual work tasks described below.
2.2 Site Preparation
2.2.1 Landscape Survey/Arborist Appraisal Prior to performing the geophysical surveys, a landscape survey to document the existing landscaping and vegetation was conducted. The flora of each property was documented and inventoried by a qualified arborist who assessed the flora of each property and provided appraised values in the event that damage and restoration was required. As part of this survey, the property’s landscaping/vegetation was videotaped to document the existing pre-investigation conditions so that it could be consulted if any landscaping was destroyed requiring replacement or owner reimbursement for the loss. Following intrusive activities, a post-restoration landscape survey was conducted at each property to determine the impact to properties, to assess any damage caused, and to estimate the cost for repairs.
2.2.2 Civil Survey Prior to commencement of the field activities, a licensed surveyor (Charles P. Johnson & Associates, Inc.) captured current site conditions including locations of buildings, structures, landscaping, and major plants at each property, and provided CAD drawings. The data obtained were of second order, Class I accuracy and referenced to the Maryland State Plane Coordinate System [North American Datum (NAD) 83].
2.2.3 Boundary Definition Study NRL collected data on June 22, 2016 at four of the original five properties within the SVFUDS. The data collection plan was designed to evaluate the effects of the houses themselves on the EM data and to help define how close to the houses data collection could reasonably be planned. These data were additionally used to help determine what vegetation and landscaping required removal prior to the Pilot Study. The Boundary Definition Study concluded that vegetation and landscaping clearance should be conducted to within 40 cm of the houses at each property, and that EM data could be collected to within this range of each property. In some locations, the approach distance was found to be greater, such that some sections of cleared ground would be considered unsurveyable. These conclusions were used to plan the Pilot Study field effort.

Spring Valley FUDS Final Pilot Study Report – Advanced Geophysical Classification April 2017
ERT, Inc. 8
2.2.4 Determination of Geophysical Survey Accessible Areas Prior to commencement of the geophysical survey activities, a site visit, including USACE personnel, was conducted at each property on July 19, 2016, to define and document all accessible areas where the geophysical surveys could be completed. The objective was to allow reasonable access for TEMTADS and MPV equipment, with landscape removal limited to predominantly low-lying materials that could adversely affect the geophysical results.
2.2.5 Vegetation Removal Using the information gathered during the civil survey, the landscape survey and appraisals, and the geophysical survey access site visits, the properties were prepared for geophysical activities by removing landscaping and/or other moveable objects as needed. This included mowing, cutting, removal, and/or tying back of low lying bushes and ornamental plantings, temporary re-location of ornamental objects, and temporary removal of recreational equipment.
Vegetation removal was required to improve geophysical survey coverage and to facilitate access for intrusive investigations. It was accomplished by use of hand-held tools including machetes and gasoline-powered weed eater type equipment. Removal of trees and/or bushes up to six inches in diameter was only required where low lying branches impeded geophysical instrument access around the trunk.
Valuable vegetation was addressed by either replacing the individual item in kind (in accordance with the Arborist appraisals), or removing it, transplanting it and maintaining it during the investigation, and then replanting it upon completion of the field activities.
2.3 Geophysical Equipment Geophysical equipment used during this Pilot Study is described below.
2.3.1 MPV The MPV is a handheld sensor with wide-band, time-domain, electromagnetic-induction (EMI) technology. The main EMI sensing elements are a transmitter coil and an array of five vector receiver units or cubes. Each 8-centimeter (cm) cube bears a set of three orthogonal air-coil receivers that measure the EMI vector field. The transmitter and receiver elements are contained in the MPV sensor head, a plastic disk enclosure with 50-cm diameter and 8.5-cm height. The circular transmitter coil is wound around the disk while the receiver cubes are distributed in a cross pattern inside the disk. For cued interrogation the sensor head is complemented with a pair of orthogonal horizontal-axis transmitter loops. These are packaged as detachable rectangular shaped units that can be placed on top of the main sensor head. Their main purpose is to provide transverse excitation of a buried object of interest while keeping the MPV sensor head at the same location. The transmitters and receivers are connected to a compact data acquisition system mounted on a backpack and to a field tablet that controls the acquisition and helps monitor data quality. The MPV sensor head is carried with a telescopic handling boom that retracts and detaches for storage. The opposite end of the boom holds the positioning units: the Attitude and Heading Reference System sensor, the global positioning system (GPS) antenna or robotic total station (RTS) retroreflector, and a data conditioning box. Photographs of the MPV can be seen in Appendix G.

Spring Valley FUDS Final Pilot Study Report – Advanced Geophysical Classification April 2017
ERT, Inc. 9
2.3.2 TEMTADS The TEMTADS is an advanced electromagnetic induction sensor designed for the detection and classification of buried metal objects. The sensor consists of four sensor elements arranged on 40-centimeter (cm) centers in a 2x2 array. Each sensor element consists of a 35-cm square transmit coil for target illumination with an 8-cm three-axis receiver cube centered in the transmit coil. The transmitters are energized in sequence and the decay curve is recoded up to 25 milliseconds after the transmitters are turned off for each of the 12 (4 cubes with 3 axes each) receiver channels. A schematic of the sensor coil configuration is shown on Exhibit 2.1. The TEMTADS orientation is measured using a six-degree-of-freedom Inertial Measurement Unit (IMU).
Exhibit 2.1. Orientation of the Four TEMTADS Sensor Elements
2.3.3 Robotic Total Station A Trimble S7 RTS was utilized for the majority of the Pilot Study data collection. A Leica 1200 RTS was used for most cued target reacquisition and all final target reacquisition. Both models include a total station laser rangefinder (“gun”) and a retroreflecting prism supplemented with LED lights for enhanced tracking abilities. Laser distancing between the gun and the prism is used to provide centimeter level accuracy. Establishing the RTS location and verifying the setup of the RTS requires a minimum of three known control points within line of sight of the setup location.
2.3.4 Real Time Kinematic Global Positioning System Real Time Kinematic Global Positioning System (RTK GPS) relies on a constellation of satellites to obtain positional information in real time. A Trimble R10 RTK GPS was utilized for some of the data collection. Real-time corrections were obtained through a cellular based subscription using a T-Mobile sim card. A Topcon HiperGa system was used for some of the cued target reacquisition, with the base station set up on control points. The RTK GPS provides centimeter level accuracy.
1 2
4 3EM Sensor
Direction of Travel
+Y
+X+Z
Sensor Orientation

Spring Valley FUDS Final Pilot Study Report – Advanced Geophysical Classification April 2017
ERT, Inc. 10
2.3.5 EM61-MK2A An EM61-MK2A (EM61) was also used during the Pilot Study (it had been previously used during the 2007 – 2009 geophysical survey activities). As described in Section 1.1, the EM61 is not an AGC instrument, but was used in this Study in areas not previously accessible to provide supplemental data to support submittal of assurance letters to property owners that verify remediation is complete
The EM61-MK2A, manufactured by Geonics Ltd., is a time-domain electromagnetic device consisting of a computer, data logger (Juniper Systems Allegro CX), and cart assembly towed on wheels. This instrument measures the response of the immediate area to a primary pulsed electromagnetic (EM) field, generated in the lower copper coil. The device records EM data in units of millivolts (mV) in four channels, or time gates, corresponding to four durations after an EM pulse. The device was integrated with the Leica 1200 RTS for navigation.
2.3.6 Schonstedt GA-52Cx Magnetometer This magnetic locator is a hand-held gradiometer that detects the magnetic field of a ferromagnetic object. It responds to the difference in the magnetic field between two sensors spaced about 0.5 m apart. The response is a change in the frequency of the signal emitted by the piezoelectric speaker. The locator can be oriented in any direction without producing a significant change in the frequency of the tone from its idling frequency. The GA-52Cx was used by qualified UXO personnel for intrusive clearance.
2.3.7 White’s DFX-300 metal detector The White's DFX-300 is an electromagnetic metal detector capable of operating at multiple frequencies. It can detect ferrous as well as non-ferrous metals. Although most ordnance found at the SVFUDS to date has been primarily ferrous metal, the DFX-300 was included in the Study for anomaly resolution procedures because the AGC sensors are electromagnetic and detect both ferrous and non-ferrous metal.
2.4 Geodetic System Selection The geodetic system historically used for the SVFUDS, over many years of project work, is the Maryland State Plane, NAD83, with units of U.S. Survey Feet. However, the AGC systems used during this Pilot Study require use of UTM coordinates (Zone 18 North), with units of meters. Both systems were used during the course of fieldwork and both are included in project geodatabases. The use of these multiple systems, and the conversion between them, was readily accomplished without issue.
2.5 Geophysical System Verification (GSV)
2.5.1 Background The guidance document Geophysical System Verification (GSV): A Physics-Based Alternative to Geophysical Prove-Outs for Munitions Response, (July 2009, 2015) was followed to construct an instrument verification strip (IVS) and complete the blind seeding program.

Spring Valley FUDS Final Pilot Study Report – Advanced Geophysical Classification April 2017
ERT, Inc. 11
The IVS component of GSV consists of installation of a line of munitions surrogates buried in the shallow subsurface at known locations. The munitions surrogates used in this project were inert munitions and industry standard objects (ISOs), which are welded steel pipes of standard sizes, and conform to specifications listed in Table 2-1 of the GSV guidance document. After burial, the ISOs are referred to as “seeds.” An anomaly-free “noise line” is placed next to the line of ISOs. Geophysical sensors are used to collect dynamic or static data on the seed line and the noise line twice daily to document that the instrument produces a repeatable response with accurate positioning throughout the duration of the project.
The other component of GSV is a blind seeding program. Blind seeds are inert munitions or ISOs placed in the subsurface at the Study properties at locations unknown to the geophysical data collectors and data processors. Detection of blind seeds by the demonstrators is a key component of quality control in this project.
At the project kick-off meeting on May 24, 2016, USACE gave permission to extract inert munitions items from the existing Geophysical Prove Out (GPO) grids on the Federal property (USACE SVFUDS headquarters), and to install a new IVS there. The GPO was constructed in approximately 2004 and contained dozens of items buried in the subsurface. Items included both metallic and non-metallic objects, and both inert ordnance items and non-ordnance such as rebar and pipe. Many items were extracted from the GPO in July-August, 2016, and used as IVS items and blind seeds on the Study properties. The procedures for completion of the GSV program were submitted in separate Memoranda for the IVS and for the Blind Seed Program; these are presented in Appendix B.
2.5.2 Instrument Verification Strip Construction Following removal of items from the GPO, a background survey was conducted with the TEMTADS instrument. A subset of anomalies mapped by the TEMTADS were reacquired and dug, and other metallic debris was removed. The IVS was installed on 1 August 2016. A summary of the IVS is shown in Table 2-1.
Table 2-1: IVS Summary Seed ID
Description UTM Zone 18, NAD83, meters
MD State Plane, NAD83, US Survey Feet
Diameter (cm)
Depth to center (cm) Easting Northing Easting Northing
1
Inert Stokes Mortar, Horizontal, small diameter end points south
317469.999 4311986.730 1282183.98 462959.89 7.5 29.5
2
Inert 75mm projectile, Horizontal, nose to south
317470.213 4311982.371 1282184.99 462945.61 7.5 36.1
3 Medium ISO, Horizontal, Cross track
317470.161 4311977.887 1282185.15 462930.90 5.08 13.5

Spring Valley FUDS Final Pilot Study Report – Advanced Geophysical Classification April 2017
ERT, Inc. 12
Table 2-1: IVS Summary Seed ID
Description UTM Zone 18, NAD83, meters
MD State Plane, NAD83, US Survey Feet
Diameter (cm)
Depth to center (cm) Easting Northing Easting Northing
4 Small ISO, Horizontal, Along track
317470.006 4311973.248 1282184.97 462915.67 2.54 28.0
The UFP-QAPP called for a “background” location (with no seed buried) in line with the IVS seeds. However, the TEMTADS established and verified a background location to the west of the IVS area prior to conducting the background survey, and this was subsequently used by both demonstrators. The background location was selected by NRL and a 5-point static background verification test was run, based on a suspected clean area within the former GPO grid.
Note that the smallest Target of Interest (TOI), based on the munitions related items confirmed or suspected to exist in the SVFUDS study area, was determined to be a booster/fuze from a 75mm MkIV Booster at 1 foot below ground surface (bgs). For the IVS, seed item #4 (Table 2-1), the small ISO, was used to designate the smallest TOI. At the time of the background survey, an inert MkIV Booster was not available, so the small ISO was used to define the minimum response.
Photographs of the items prior to burial are shown in Appendix G, photos 1 to 4. The completed IVS is shown in photo 5.
After installation of the IVS, the TEMTADS team returned to the site and collected dynamic data on the seed line and the noise line using the TEMTADS integrated with both the RTK GPS and the RTS. Cued measurements were also collected over each seed. The results of TEMTADS testing at the IVS are documented in Initial Dynamic and Static Instrument Verification Strip (IVS) Technical Memorandum presented in Appendix B. This memorandum also presents the results of the background survey.
The MPV team collected dynamic data on the seed line using the MPV integrated with both the RTK GPS and the RTS. Cued measurements were also collected over each seed. The results of MPV testing at the IVS are documented in Initial Dynamic and Static Instrument Verification Strip Technical Memorandum, presented in Appendix B.
The ERT team collected dynamic data on the seed line and noise line using the EM61-MK2A integrated with the RTS. The results of testing at the IVS are documented in the memorandum presented in Appendix B.
All demonstrators collected data daily at the IVS, in the morning prior to production work, and in the afternoon after production work.
2.5.3 Blind Seeding Program Blind seeds were installed at 4733 Woodway Lane and at 4740 Quebec Street on August 9, 2016, and blind seeds were installed at 4720 Quebec Street on August 10, 2016. Both inert munitions and ISOs were used at each of the properties. The UFP-QAPP called for installation of up to 5
Spring Valley FUDS Final Pilot Study Report – Advanced Geophysical Classification April 2017
ERT, Inc. 13
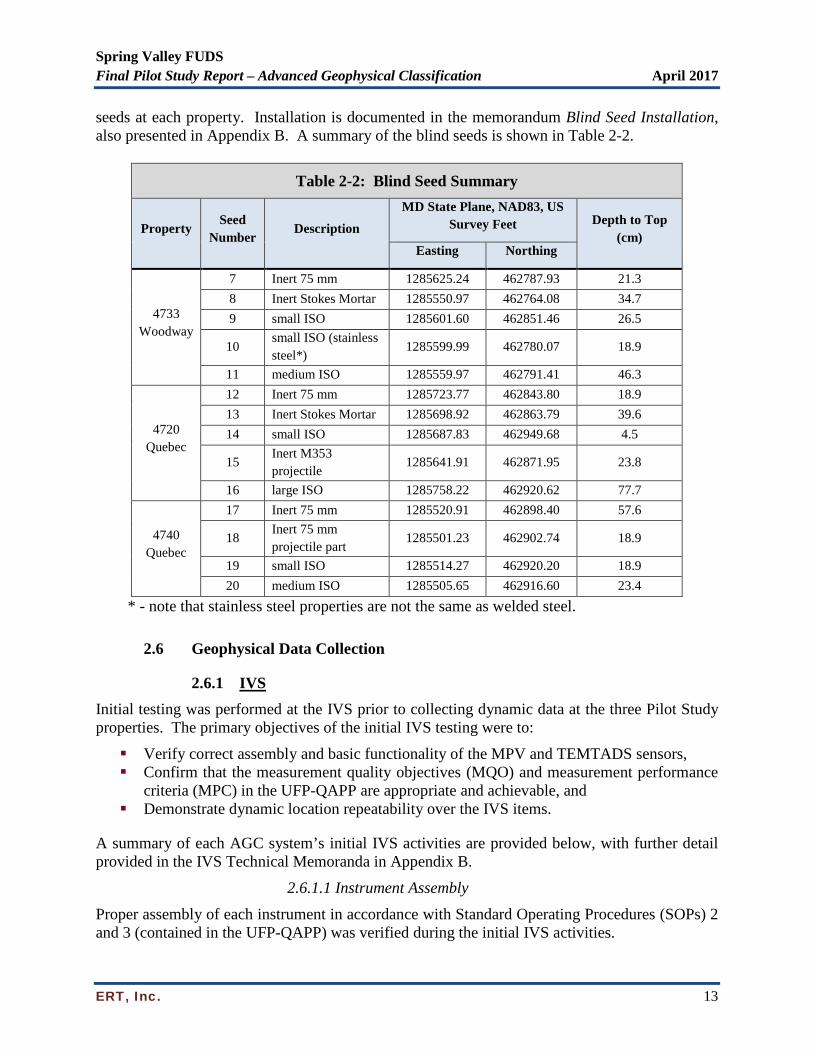
seeds at each property. Installation is documented in the memorandum Blind Seed Installation, also presented in Appendix B. A summary of the blind seeds is shown in Table 2-2.
Table 2-2: Blind Seed Summary
Property Seed
Number Description
MD State Plane, NAD83, US Survey Feet Depth to Top
(cm) Easting Northing
4733 Woodway
7 Inert 75 mm 1285625.24 462787.93 21.3 8 Inert Stokes Mortar 1285550.97 462764.08 34.7 9 small ISO 1285601.60 462851.46 26.5
10 small ISO (stainless steel*)
1285599.99 462780.07 18.9
11 medium ISO 1285559.97 462791.41 46.3
4720 Quebec
12 Inert 75 mm 1285723.77 462843.80 18.9 13 Inert Stokes Mortar 1285698.92 462863.79 39.6 14 small ISO 1285687.83 462949.68 4.5
15 Inert M353 projectile
1285641.91 462871.95 23.8
16 large ISO 1285758.22 462920.62 77.7
4740 Quebec
17 Inert 75 mm 1285520.91 462898.40 57.6
18 Inert 75 mm projectile part
1285501.23 462902.74 18.9
19 small ISO 1285514.27 462920.20 18.9 20 medium ISO 1285505.65 462916.60 23.4
* - note that stainless steel properties are not the same as welded steel.
2.6 Geophysical Data Collection
2.6.1 IVS Initial testing was performed at the IVS prior to collecting dynamic data at the three Pilot Study properties. The primary objectives of the initial IVS testing were to:
Verify correct assembly and basic functionality of the MPV and TEMTADS sensors, Confirm that the measurement quality objectives (MQO) and measurement performance
criteria (MPC) in the UFP-QAPP are appropriate and achievable, and Demonstrate dynamic location repeatability over the IVS items.
A summary of each AGC system’s initial IVS activities are provided below, with further detail provided in the IVS Technical Memoranda in Appendix B.
2.6.1.1 Instrument Assembly Proper assembly of each instrument in accordance with Standard Operating Procedures (SOPs) 2 and 3 (contained in the UFP-QAPP) was verified during the initial IVS activities.

Spring Valley FUDS Final Pilot Study Report – Advanced Geophysical Classification April 2017
ERT, Inc. 14
2.6.1.2 Function Tests – General Sensor-specific function tests were performed to confirm that all geodetic, inertial and electromagnetic transmitters and receivers were operating as expected. This was achieved by recording the instrument response to a known calibration item, and then comparing the data to a reference measurement. The reference measurement represents data acquired of the calibration item when the instrument was already established to have been operating properly. For both AGC systems, the instrument functionality was verified and applicable MQOs were achieved prior to collecting initial IVS data.
2.6.1.3 Function Tests – MPV The MPV function tests consist of acquiring a static measurement with a Schedule 80 small ISO in the middle of the horizontal transmitter coils, and performing a spin test. Both tests were performed at least twice per day, as follows:
The small ISO is oriented vertically and stands on the x-component coil on top of the center cube. To improve the repeatability of the ISO placement, a circle drawn on the coil indicates where the small ISO should be placed. A background measurement is acquired such that the instrument and background response can be subtracted from the function test data. The MQO for the function test is that the background subtracted response is within 20% of a reference measurement. The data must then be post processed to confirm that the MQO is achieved.
The spin test is designed to verify proper operation of the GPS or RTS and IMU, as well as the correct integration of their respective data streams. If the GPS and IMU function properly (e.g. no bias in the IMU data stream) and the sensor geometry is correctly defined in sensor definition files, the center cube of the MPV should exhibit a limited range of motion when the MPV is rotated about the center of the sensor head. The spin test consists of doing a full 360 degree rotation of the MPV head, with the center of the MPV head in the same location. To minimize lateral movement of the sensor head, the sensor head is placed in jig during the rotation. Dynamic data are recorded during the rotation. If the MPV position on the field display appears to remain within a tight circle, then the positioning sensors are deemed to be operating correctly. The spin test was done at the beginning and end of each day.
2.6.1.4 Function Tests – TEMTADS The TEMTADS function tests consist of acquiring a static measurement with a Schedule 80 small ISO in the middle of the transmit coils and verifying the IMU is correctly oriented. The first is performed at least twice daily and the second is only performed after assembly.
In order to verify the functionality of the TEMTADS, a known reference response for the small ISO is required. After collecting a background reading, a vertical small ISO is placed in the hole on the top of the sensor housing and a static reading is collected. The MQO for the TEMTADS function test is: response (mean static spike minus mean static background) within 25% of predicted response for all monostatic Tx/Rx combinations.
The IMU orientation is verified by rotating the sensor around various axes and ensuring that the data acquisition system records the correct sign (e.g. positive or negative) in
Spring Valley FUDS Final Pilot Study Report – Advanced Geophysical Classification April 2017
ERT, Inc. 15
accordance with the SOP. Once the orientation has been confirmed, this test is not needed unless the system must be disassembled and reassembled.
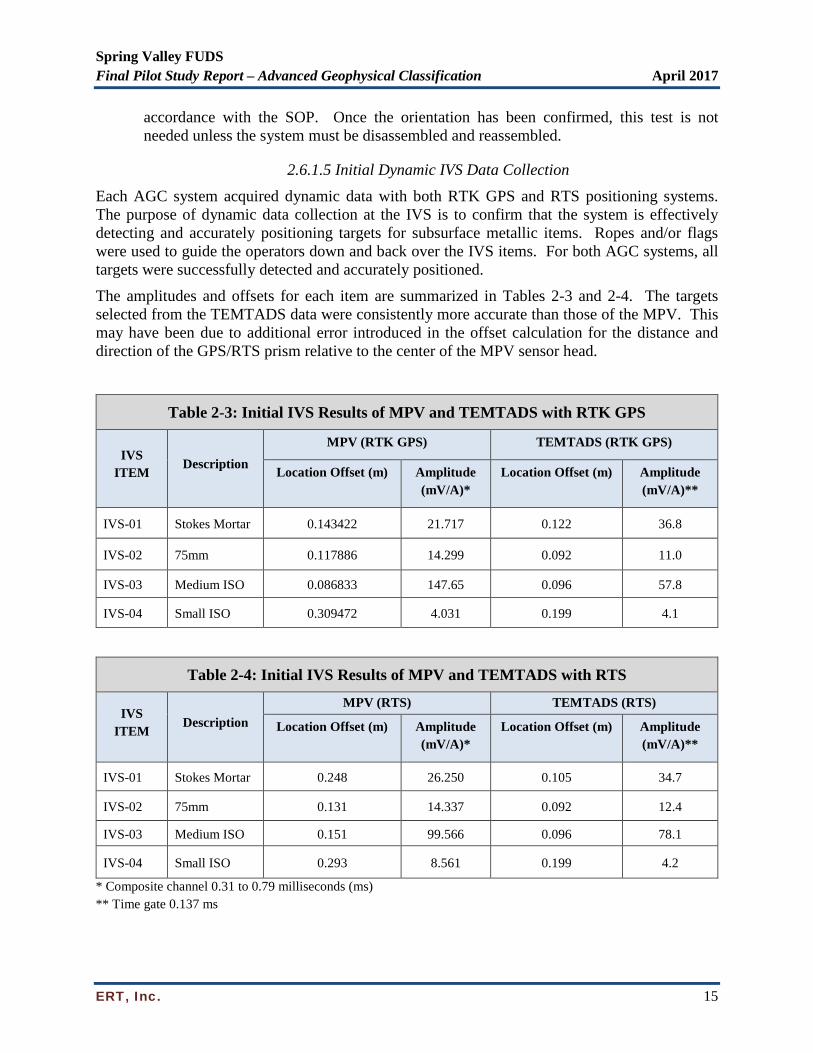
2.6.1.5 Initial Dynamic IVS Data Collection Each AGC system acquired dynamic data with both RTK GPS and RTS positioning systems. The purpose of dynamic data collection at the IVS is to confirm that the system is effectively detecting and accurately positioning targets for subsurface metallic items. Ropes and/or flags were used to guide the operators down and back over the IVS items. For both AGC systems, all targets were successfully detected and accurately positioned.
The amplitudes and offsets for each item are summarized in Tables 2-3 and 2-4. The targets selected from the TEMTADS data were consistently more accurate than those of the MPV. This may have been due to additional error introduced in the offset calculation for the distance and direction of the GPS/RTS prism relative to the center of the MPV sensor head.
Table 2-3: Initial IVS Results of MPV and TEMTADS with RTK GPS
IVS ITEM
Description MPV (RTK GPS) TEMTADS (RTK GPS)
Location Offset (m) Amplitude (mV/A)*
Location Offset (m) Amplitude (mV/A)**
IVS-01 Stokes Mortar 0.143422 21.717 0.122 36.8
IVS-02 75mm 0.117886 14.299 0.092 11.0
IVS-03 Medium ISO 0.086833 147.65 0.096 57.8
IVS-04 Small ISO 0.309472 4.031 0.199 4.1
Table 2-4: Initial IVS Results of MPV and TEMTADS with RTS
IVS ITEM
Description MPV (RTS) TEMTADS (RTS)
Location Offset (m) Amplitude (mV/A)*
Location Offset (m) Amplitude (mV/A)**
IVS-01 Stokes Mortar 0.248 26.250 0.105 34.7
IVS-02 75mm 0.131 14.337 0.092 12.4
IVS-03 Medium ISO 0.151 99.566 0.096 78.1
IVS-04 Small ISO 0.293 8.561 0.199 4.2
* Composite channel 0.31 to 0.79 milliseconds (ms) ** Time gate 0.137 ms

Spring Valley FUDS Final Pilot Study Report – Advanced Geophysical Classification April 2017
ERT, Inc. 16
2.6.1.6 Background Noise Analysis Electromagnetic background noise is typically analyzed to develop amplitude thresholds for target selection. Causes of background noise include, but are not limited to, utilities, terrain induced noise, radio frequencies, and standard noise in the electronic hardware. When the target selection threshold (the instrument response level at which an item of interest is identified) is set too close to the background noise level, the frequency of false positives increases. The standard rule is to set the target selection threshold at three to five times the standard deviation of the background response. Analysis of the dynamic IVS background line showed that both systems experienced relatively high noise levels at the IVS. The average noise for each system on the channel selected for target selection was as follows:
MPV: 0.41 mV/A for the 0.45 ms time gate and 0.30 mV/A for the composite channel of 0.31 – 0.79 ms
TEMTADS: 0.34 mV/A for the 0.137 ms time gate
These system specific channels presented the highest signal to noise (SNR) and were therefore used for target selection. The IVS noise was not as high or irregular as what was observed at the individual Pilot Study properties. Site specific noise is discussed further in Section 3.4. Incidentally, it is noted that the data collected using the RTS consistently produced higher noise levels.
2.6.1.7 Dynamic Target Selection Threshold Target selection threshold is the instrument response level at which an item of interest is identified. The initial target selection threshold for each system was initially defined as follows:
MPV: 1.19 mV/A for the composite channel of 0.31 – 0.79 ms TEMTADS: 1.69 mV/A for the 0.137 ms time gate
The 1.69mV/A threshold was selected because it corresponded to the response of a small ISO at a depth of 35cm (approximately 13.8 inches, which is slightly deeper and thus more conservative than the project objective of 1ft (12 inches) bgs.
When comparing the two AGC systems, it is not appropriate to rely on a direct comparison of the amplitudes recorded by the two systems because different time gates were used for target selection. A more accurate comparison is to evaluate the SNR for each system’s defined selection threshold. Each demonstrator based their target selection threshold on the response curve for a small ISO at 1 foot bgs, as this was determined to be the best representation of the smallest TOI, a MarkIV Booster at the required depth of detection. The response curves for each system are shown in Exhibits 2.2 and 2.3. The TEMTADS was able to detect a small ISO using a threshold equal to 5 times the IVS background noise. Note that the MPV threshold at the properties had to be set to 4.3 and 2.8 times the background noise for RTK and RTS data, respectively.
Based on this analysis of IVS data, the TEMTADS data provided a higher SNR and is therefore more likely to detect the smallest target of interest at depth.
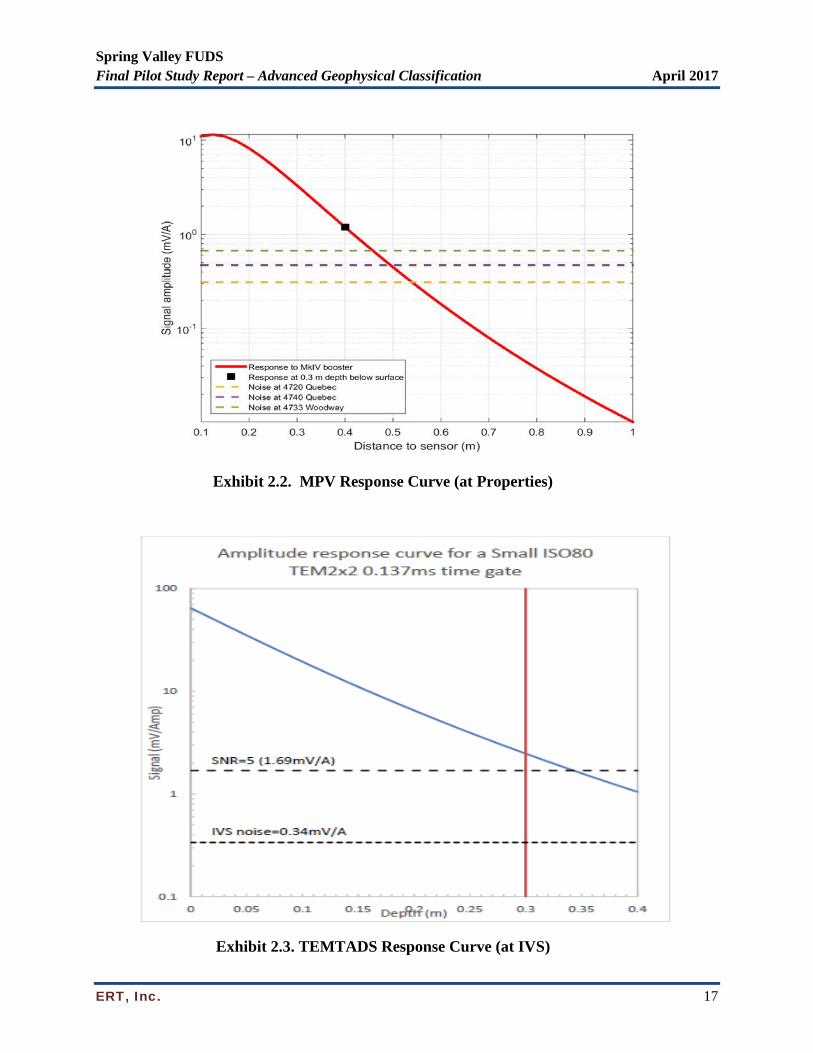
Spring Valley FUDS Final Pilot Study Report – Advanced Geophysical Classification April 2017
ERT, Inc. 17
Exhibit 2.2. MPV Response Curve (at Properties)
Exhibit 2.3. TEMTADS Response Curve (at IVS)

Spring Valley FUDS Final Pilot Study Report – Advanced Geophysical Classification April 2017
ERT, Inc. 18
2.6.1.8 Dynamic Source Selection Dynamic source selection is inverting the dynamic data to identify dipole sources rather than selecting targets based on amplitude threshold. It was utilized for selecting targets from the dynamic MPV data, unlike TEMTADS data which used the threshold discussed in the previous section. This process involves first identifying targets that meet the amplitude selection threshold and then inverting the data within a specified distance of the selected target to estimate additional parameters such as size and depth of the item. Additional thresholds for size and decay of the polarizabilities were defined for the MPV data and were incorporated into the initial target selection process. These thresholds were based on the derived polarizabilities of the small ISO at 30 cm depth (approximately 1 ft bgs). Note that this process had to be modified as part of the corrective action for Non-conformance Report (NCR) 002 and is discussed further in Section 3.7.2.
2.6.1.9 Initial Cued IVS Data Collection Cued data was also collected with both the RTK GPS and RTS positioning systems. Each AGC sensor was positioned over each IVS item and static data was collected. The inverted source parameters for each AGC system are provided in Tables 2-5 to 2-8.
Polarizability curves were recovered for all IVS targets; however neither system consistently achieved the MQO for derived polarizability accuracy for the IVS-04 item. The acceptance criteria for this MQO is that the library match metric must be greater than or equal to 0.9 for each set of inverted polarizabilities. The root cause of the failure for both systems was that due to the site noise and the presence of additional metal in the vicinity, the data did not match the reference library at the required level. As a result, the IVS-04 item was removed from the daily IVS requirement. It should be noted that although the MQO was not achieved, the matches were sufficient to be classified as a TOI. Therefore, the IVS confirmed that the Data Quality Objective (DQO) to detect and correctly classify an item the size of a small ISO at a depth of 1 ft bgs was achievable.

Spring Valley FUDS Final Pilot Study Report – Advanced Geophysical Classification April 2017
ERT, Inc. 19
Table 2-5: TEMTADS IVS results using RTK GPS and Single Source Solver
IVS Item
Seed Description
UTM Easting (m)
UTM Northing (m)
Depth (m)
Location offset (m)
Depth offset (m)
Fit coherence
Library match metric
IVS‐01 Stokes Mortar 317470.086 4311986.759 0.312 0.091 ‐0.017 0.9985 0.9443
IVS‐02 75mm 317470.282 4311982.377 0.393 0.070 ‐0.032 0.9988 0.9592
IVS‐03 Medium ISO 317470.222 4311977.826 0.176 0.087 ‐0.041 0.9995 0.9799
IVS‐04 Small ISO 317470.104 4311973.193 0.274 0.112 0.006 0.9503 0.8324
Table 2-6: TEMTADS IVS results using RTS and Single Source Solver
IVS Item
Seed Description
UTM Easting (m)
UTM Northing (m)
Location offset (m)
Depth (m)
Depth offset (m)
Fit coherence
Library match metric
IVS‐01 Stokes Mortar 317470.105 4311986.790 0.121 0.312 ‐0.018 0.9984 0.9440
IVS‐02 75mm 317470.306 4311982.390 0.095 0.390 ‐0.029 0.9984 0.9537
IVS‐03 Medium ISO 317470.221 4311977.822 0.089 0.176 ‐0.041 0.9995 0.9782
IVS‐04 Small ISO 317470.105 4311973.183 0.118 0.252 0.028 0.9482 0.8450

Spring Valley FUDS Final Pilot Study Report – Advanced Geophysical Classification April 2017
ERT, Inc. 20
Table 2-7: MPV IVS results using RTK GPS IVS ID Seed
Description UTM Easting
(m) UTM Northing
(m) Location
offset (m) Depth
(m) Depth offset (m)
Library match metric
IVS‐01 Stokes Mortar 317470.00 4311986.72 0.01 0.338 0.049 0.996
IVS‐02 75mm 317470.18 4311982.31 0.07 0.438 0.078 0.957
IVS‐03 Medium ISO 317470.14 4311977.78 0.11 0.167 0.028 0.989
IVS‐04 Small ISO 317470.95 4311973.17 0.10 0.309 0.029 0.937
Table 2-8: MPV IVS results using RTS IVS ID Seed
Description UTM Easting
(m) UTM Northing
(m) Location
offset (m) Depth
(m) Depth offset (m)
Library match metric
IVS‐01 Stokes Mortar 317470.00 4311986.80 0.07 0.339 0.049 0.989
IVS‐02 75mm 317470.21 4311982.29 0.08 0.428 0.068 0.988
IVS‐03 Medium ISO 317470.12 4311977.84 0.06 0.159 0.019 0.99
IVS‐04 Small ISO 317470.98 4311973.20 0.06 0.305 0.025 0.843
In summary, the two AGC systems produced consistent results for the inversion of the IVS items. The depth estimate was slightly more accurate for the TEMTADS because the standoff height is fixed, while the MPV height is variable and must be estimated. The Library (repository of geophysical response data for munitions items) Match Metrics appear to be higher for the MPV; however, the MPV metric is based on a solution more similar to the multi-source solution for the TEMTADS (which was not provided in the TEMTADS demonstrator’s IVS Memorandum for all IVS items).
2.6.1.10 Daily IVS Procedures Demonstrators collected IVS data twice daily during field operations. Cued and/or dynamic surveys at the IVS were performed to be consistent with the day’s field work. If no dynamic data was collected during the day, only a cued data survey at the IVS was required and vice versa. Additionally, any positioning system utilized during the day was required to be demonstrated at the IVS. So, for days when both RTS and RTK GPS were used, both systems were demonstrated at the IVS. All daily IVS MQOs were achieved.

Spring Valley FUDS Final Pilot Study Report – Advanced Geophysical Classification April 2017
ERT, Inc. 21
2.6.2 AGC Geophysical Data Acquisition Demonstrators collected data at the three Pilot Study properties in accordance with the approved UFP-QAPP and SOPs. Both cued and dynamic data collection took approximately two days per property, as shown in Table 2-9. This is approximately twice as long as was initially planned. The field procedures as well as a qualitative assessment for each system are discussed below.
Table 2-9: DGM Survey Durations
Property Days for
TEMTADS Dynamic
Days for MPV
Dynamic
Days for TEMTADS
Cued
Days for MPV Cued
4720 Quebec 2 3 2 2
4733 Woodway 2 2 2 2
4740 Quebec 1 1 2 1
Total 5 6 6 5
2.6.2.1 Dynamic Data Collection Dynamic data was collected to achieve 100% coverage of accessible areas on each property.
The contoured dynamic and anomalies detected for the TEMTADS for the 4720, 4733, and 4740 properties are shown in Figures 3, 12, and 21, respectively. The contoured dynamic and anomalies detected for the MPV are shown in Figures 4, 13, and 22.
As expected, coverage percentage for the smaller, more maneuverable MPV was significantly higher than that of the TEMTADS (see Table 2-10). The MPV design is advantageous for fitting in tight spaces, and under and around vegetation. The MPV operator can maneuver the instrument to maintain lock with the RTS gun while collecting data in difficult locations. This is especially advantageous for dealing with low lying branches and larger bushes and shrubs. The largest difference in coverage was seen at the 4740 Quebec property, where the MPV was able to maneuver around restricted access associated with sensitive plants in the front yard; the TEMTADS was not able to collect data in these areas without harming the plants.
Table 2-10: Percent Coverage – Dynamic Survey
Property TEMTADS Dynamic (sq ft)
MPV Dynamic (sq ft)
4720 Quebec 2,421 3,404
4733 Woodway 1,993 2,500
4740 Quebec 1,485 2,278
Following processing of dynamic data as described in detail in Section 3.0, and generation of a synthesized cued target list for each property, the cued surveys began.

Spring Valley FUDS Final Pilot Study Report – Advanced Geophysical Classification April 2017
ERT, Inc. 22
2.6.2.2 Cued Data Collection Based on the dynamic data, targets synthesized from MPV, TEMTADS, and the previous EM61 data, were selected for cued data collection with each AGC system, using the cued target list generation process described in Sections 3.8 and 4.0.
The cued locations were reacquired using wooden golf tees with flagging to mark the locations. This flagging method was considered to be low profile as was used to accommodate the property owner. However, the flags were less visible to the teams and were sometimes disturbed by the property owner, requiring reacquisition and causing unwarranted delays during the cued investigation phase.
One advantage of the MPV was the ability to actively reacquire targets, meaning that the MPV software allowed the user to see a real-time map showing the cued target locations relative to the sensor location. This was very helpful for identifying missing flags. The TEMTADS software was not designed to have this ability, and this meant that for the TEMTADS, if a flag was missing, it would not have been identified until the data were processed in the office.
Both systems have the ability to perform real-time single source inversions in the field. This allows the operator to see the estimated location of the metallic object beneath the sensor. If the estimated location was too far from the center of the sensor, the operator moved the sensor to the estimated location and collected additional data. The MPV would commonly repeat this process multiple times to ensure that adequate data were acquired, however the TEMTADS would typically only collect one additional data point to maximize efficiency in the field. It was very common for the estimated location to be influenced by underground utilities and/or surface or subsurface metal. In these cases the field teams typically opted not to recollect additional data and recorded a field note to document the observation.
As with the dynamic data, the MPV was able to collect more cued data than the TEMTADS, the smaller sensor size and increased maneuverability allowing the MPV to acquire data in locations where the TEMTADS was not able to access. The cued target totals for each property are detailed in Section 3.8 and shown in Table 3-9.
2.6.2.3 Field Efficiency Issues Due to the different operating procedures for each AGC sensor, the field efficiencies for collecting dynamic data were varied. When considering the two systems, independent of the positioning system used, the TEMTADS typically provided a more efficient method for collecting data with a smaller field team. The TEMTADS utilizes real-time physical guidance for maintaining line spacing and can be accomplished with two or three personnel. To maintain the required line spacing, one person pushes the cart and one person follows behind moving bean bags with a grabber to mark the path for the return line. The bean bag mover can also operate the data acquisition tablet, or a third individual can be used for this purpose. In general, only one technically competent person is required for TEMTADS operation. The MPV operation can also be accomplished with two personnel, however, as with TEMTADS, a third individual is advantageous for taking notes. Some efficiency is lost when collecting dynamic MPV due to the necessity to lay out lanes using ropes and/or flags prior to starting data collection. This can easily be done with two people, but it will take approximately 10-30 minutes depending on the size of the area to be mapped. Due to the small size of the sensor head

Spring Valley FUDS Final Pilot Study Report – Advanced Geophysical Classification April 2017
ERT, Inc. 23
and the way in which the MPV is carried, the bean bag method is not sufficient for maintaining the required line spacing for the system. Additionally, a tighter line spacing is required for the MVP to account for the smaller sensor footprint. This also increases the amount of time needed for dynamic MPV data collection.
While subtle differences in the mapping procedures for the two systems affect the field efficiency, the type of geodetic system utilized can have a far greater influence. Utilizing the RTK GPS (with a cell phone correction system) rather than the RTS, is by far the most efficient for areas where corrections can be received. RTK GPS using a cell based correction service is the most efficient method as long as cellular service is available at the site. This option eliminates the need for a base station and only requires that the user confirm that corrections are being received.
During the demonstration, the MPV team commonly had to drive away from the property to obtain cell corrections, but once initial corrections were received, they continued to stream at the site. A traditional RTK GPS (using a base station) would provide the second most efficient option, but could potentially require multiple base station setups per day depending on the relative location of the IVS and the property to be mapped. If this option is used it would be necessary to utilize a control point on an adjacent property so that the base station does not generate a data gap.
The RTS is the least efficient geodetic option. It requires multiple set-ups per property and necessitates the installation of numerous control points. An efficient field team should be able to set up the RTS and perform a resection or back sight in approximately 15 minutes. Considering that this process is likely to happen at least four times per day (morning IVS, front yard, back yard, and PM-end of day, IVS), a minimum of 1 hour is spent performing this task.
Based on site conditions, the majority of the Pilot Study acreage was not suitable for maintaining fixed positions with the RTK GPS. As a result, the RTS was utilized for the majority of the dynamic data collection at the three Pilot Study properties. Despite having a clear sky view for the majority of the 4733 Woodway property, the RTK GPS was only able to receive corrections for part of the front yard. MPV also utilized GPS positioning for the majority of the front yard at 4720 Quebec, however data gaps were created under trees due to loss of satellite reception. Depending on the location of these data gaps, and how they relate to other data gaps on the property, they can be very time consuming to collect after the fact because they may require multiple RTS set-ups. On average, four to six RTS set-ups were needed to provide 100% coverage of each property and additional set-ups were required for collecting data gaps identified in the original data set. Based on observations made during dynamic data collection, roughly two hours were spent each day tearing down and setting up the RTS gun.
2.6.2.4 Equipment Durability and Technical Issues Both systems experienced minor technical issues in the field that ultimately caused a delay in field work. The TEMTADS computer was prone to overheating and required that ice packs be attached to the CPU to aid in cooling the system. This issue delayed field work on several occasions and in one instance prevented the field team from collecting the afternoon IVS. This issue has been identified on other TEMTADS systems, but it is not clear if it would be likely to present itself on all systems; the commercially available TEMTADS equivalent (MetalMapper2x2) can reportedly operate at higher temperatures than experienced during the

Spring Valley FUDS Final Pilot Study Report – Advanced Geophysical Classification April 2017
ERT, Inc. 24
Study. Additionally, on few occasions, the TEMTADS tablet had difficulty connecting to the computer via Wi-Fi, causing additional delays. This could be prevented by hardwiring the tablet to the computer or improving the wireless connection.
Another delay for the MPV was encountered when the CPU batteries were completely drained, causing the computer to shut down. When this happened the operator could not reboot the computer without connecting it to an external keyboard. This could be prevented by having a keyboard readily available and/or implementing a better battery monitoring system. Other factors affecting durability include weather resistance and availability of spare parts/systems. At this time, neither system is waterproof, so field activities would be limited to fair weather. Spare parts/systems are more available for the TEMTADS.
It should be noted that both systems used for this Pilot Study were developed in house, by each respective demonstrator, and neither are commercially available at this time.
2.6.2.5 Field Activities Verification and Validation The QC Geophysicist was present for the duration of the field activities. Daily Geophysical Quality Control Reports (DGQCRs) and Three Phase Inspection checklists were used to document that the field activities were performed in accordance with the approved UFP-QAPP. These are provided in Appendix C. Additionally, a USACE QA Geophysicist was on site for the majority of the field activities. No Non-Conformance Reports directly related to field activities were issued during this project.
2.6.3 Supplemental EM61-MK2A Surveys Following all dynamic and cued surveys with both AGC instruments, a survey of the Pilot Study properties using the EM61-MK2A was conducted by ERT. This was performed for two reasons:
To demonstrate that the blind seeds are within the detection range of an instrument (a reaction to the failure of the MPV and TEMTADS to detect all blind seeds during the dynamic surveys), and
To collect data in areas that were inaccessible to the EM61-MK2A during the previous investigations in 2007-2009 (significantly more vegetation removal was completed in preparation for the Pilot Study AGC surveys).
The EM61-MK2A was used on the IVS on September 19, 2016, as documented in the memorandum in Appendix B. The device was then used to perform dynamic surveys over all blind seeds (although the locations were not blind to ERT operators and the seed locations were specifically targeted for coverage) as well as areas not previously covered. Targets within areas not previously covered, and which were not detected by the MPV or TEMTADS, were added to the final dig sheets for intrusive investigation.
The EM61-MK2A contoured dynamic data showing anomalies detected, for the 4720, 4733, and 4740 properties, are shown in Figures 5, 14, and 23, respectively.

Spring Valley FUDS Final Pilot Study Report – Advanced Geophysical Classification April 2017
ERT, Inc. 25
3.0 DYNAMIC SURVEY DATA QUALITY The MPV dynamic data collected in the field were processed and analyzed by the BTG team. The TEMTADS dynamic data collected in the field were processed and analyzed by the NRL team. A summary of each demonstrator’s data processing procedures and Dynamic Data MQOs are detailed below.
3.1 MPV Data processing for the MPV data was performed using UXOLab, software that was developed by BTG. Initial processing steps included normalizing to the transmitter current, positioning the data, correcting for instrument latency and removing background noise (i.e., leveling the data). The dynamic target selection process for the MPV evolved throughout the Study, due to observations made regarding the dynamic data.
Initially, BTG selected all targets that exceeded the threshold defined in the IVS Memorandum (1.2mV/A) for the composite of the Z-component response for time gates 0.31 to 0.79 ms. Using the Z-component response amplitude as a detection metric is essentially the same as using a Geonics EM61 response amplitude detection. This process alone, however, produced an extremely large target population greater than 5 times that for the TEMTADS. The extreme number of targets was likely due to a combination of many factors. For one, the MPV is situated much closer to the ground during dynamic data collection which can increase the number of small anomalies that meet the target selection threshold and can also increase the effect of underground utility noise. Additionally, BTG selected targets on profiles rather than on a grid of the data. Although the profile picks were merged, selecting targets using this method typically results in high target counts.
In order to reduce the MPV target list to a more reasonable number, a two-stage process was developed to eliminate targets that were not representative of the site specific TOI. First, the detection algorithm selected anomalies where the amplitude exceeded the detection threshold defined in the IVS Memorandum. Second, the data surrounding each anomaly were inverted using models with 1, 2 or 3 objects to determine whether there could a dipole source equal to or greater than the size of the MkIV Booster (smallest TOI) at or near the selected anomalies. The inversion results and models were then processed similar to the routine used for cued data. Data that did not fit dipole models very well were eliminated from the list. The remaining models were classified according to the estimated size and, initially, decay of the polarizability curves. The decay threshold was ultimately eliminated based on the root cause analysis for NCR002 (see Section 3.7.2). Sources where the size exceeded 0.6 were retained, as well as anomalies where no reliable model was available, similar to a "cannot analyze" category. Source locations were merged to provide the final dynamic target list.
3.2 TEMTADS Data processing for the TEMTADS data was performed using Geosoft Oasis montaj, a commercially available software package. As with the MPV data, the initial processing steps included normalizing to the transmitter current, positioning the data, correcting for instrument latency, and removing background noise (i.e., leveling the data). After initial corrections, the Z-Component for time gate 0.137 ms was gridded and targets were selected based almost entirely on signal response amplitude.

Spring Valley FUDS Final Pilot Study Report – Advanced Geophysical Classification April 2017
ERT, Inc. 26
The Geosoft automatic grid peak detection algorithm was used to extract locations of all grid peaks in the gridded data that were above the project detection threshold, 1.6mV/A. These target anomaly locations were reviewed by the project geophysicist and manual additions and deletions were made to the list. In many instances several targets were removed from the list, because the target selection threshold was within the site noise levels. Additionally, areas of saturated response, typically due to reinforced concrete or underground utilities, were identified, but not selected for cued interrogation.
3.3 Dynamic Data Measurement Quality Objectives The dynamic data MQOs and the completion status are presented in Table 3-1.
Table 3-1: Dynamic Data MQOs Measurement Quality
Objective Frequency Acceptance Criteria Status Verify correct assembly Once following
assembly Instrument is correctly assembled
Achieved for both TEMTADS and MPV. Documented on Initial TPC Checklist.
Initial sensor function test (instrument response amplitudes)
Once following assembly
Response (mean static spike minus mean static background) within 25% of predicted response for all monostatic transmit/receive (Tx/Rx) combinations
Achieved for both TEMTADS and MPV. Documented on Initial TPC Checklist and IVS Report.
Initial dynamic positioning accuracy (IVS)
Once prior to start of dynamic data acquisition
Derived positions of IVS target(s) are within 25 cm of the ground truth locations
Achieved for both TEMTADS and MPV. Documented in the IVS Report.
Ongoing instrument function test (instrument response amplitudes)
Beginning and end of each day and each time instrument is turned on
Response (mean static spike minus mean static background) within 25% of standard response for all monostatic Tx/Rx combinations
Achieved for both TEMTADS and MPV. Documented in DGQCRs, TPC Checklists and Demonstrator Data.
Ongoing dynamic positioning precision (IVS)
Beginning and end of each day
Derived positions of IVS target(s) within 25 cm of the average locations
Achieved* for both TEMTADS and MPV. Documented in DGQCRs, TPC Checklists and Demonstrator Data.
In-line measurement spacing
Verified for each DU using the Oasis montaj UX-Detect Sample Separation Tool based on monostatic Z coil data positions
100% ≤ 0.20m between successive measurements
Achieved for both TEMTADS and MPV. Documented in Demonstrator Data.
Coverage Verified for each DU using Oasis montaj UX-Detect Footprint
100% at ≤ 0.5m cross-track measurement spacing (excluding site-specific
Achieved for both TEMTADS and MPV. Documented in

Spring Valley FUDS Final Pilot Study Report – Advanced Geophysical Classification April 2017
ERT, Inc. 27
Table 3-1: Dynamic Data MQOs Measurement Quality
Objective Frequency Acceptance Criteria Status Coverage Tool based on monostatic Z coil data
access limitations, e.g., obstacles, unsafe terrain)
Demonstrator Data.
Sensor Tx current Per measurement Current must be ≥5.5A (TEMTADs), ≥3.5A (MPV)
Achieved for both TEMTADS and MPV. Documented in Demonstrator Data.
Dynamic detection performance
Evaluated by Property
All blind QC seeds must be detected and positioned within 40 cm radius of ground truth
Not achieved. See NCR Summaries in Section 3.7.
Valid orientation data Per measurement Orientation data reviewed and appear reasonable within bounds appropriate to site
Achieved for both TEMTADS and MPV. Documented in Demonstrator Data.
*TEMTADS did not successfully complete the PM (end of day) IVS on August 15, 2016, due to the system overheating. MPV did not successfully complete the PM IVS on September 7, 2016, due to inclement weather. In both instances the AM (start of day) IVS and regular sensor function tests were used to validate the data.
3.4 Effect of Site Noise Both the MPV and TEMTADS data suggested a large variability in background conditions between and within each property, both geographically and temporally. At 4720 Quebec, the background noise levels ranged from an amplitude of approximately 0.17 mV/A to 0.96mV/A. At 4740 Quebec, they ranged from 0.23 mV/A to 0.79 mV/A. The house at 4733 Woodway was the noisiest ranging from 0.29 mV/A to 3.52 mV/A. The minimum and maximum noise levels observed by each demonstrator are detailed in the Table 3-2.
Table 3-2: Site Noise Levels MPV TEMTADS
Property Min Noise
Max Noise
Target Selection
Threshold
Max SNR
Min SNR
Min Noise
Max Noise
Target Selection
Threshold
Max SNR
Min SNR
4720 Quebec
0.17 0.28 1.20 7.06 4.29 0.28 0.96 1.60 5.71 1.67
4733 Woodway
0.29 0.67 1.20 4.14 1.79 1.00 3.52 1.60 1.60 0.45
4740 Quebec
0.23 0.42 1.20 5.22 2.86 0.24 0.79 1.60 6.67 2.03
In general, at the properties, the SNR for the MPV was greater than that for the TEMTADS. Demonstrators also observed noise levels changing temporally. For instance, in one case the TEMTADS team collected acceptable data at a background location early in the day, but when

Spring Valley FUDS Final Pilot Study Report – Advanced Geophysical Classification April 2017
ERT, Inc. 28
they returned to the same location later that day, the noise was much higher and the data were not acceptable for use as a background.
The principal consequence of higher noise levels is a reduction in the depth of detection and classification of TOI. At the SVFUDS, both small and large TOI are expected to be at depths near the maximum detection range for available industry standard EMI instruments, and therefore is it critical to manage the effect of site noise.
The exact source of the background noise at the Pilot Study properties could not be determined. However, it is likely related, in part, to the large radio tower on the AU campus, to the south east of the properties. The 4733 Woodway property is slightly closer to this tower and also presented the highest noise levels. Other observed sources of noise included underground and above-ground utilities, and HVAC units. Due to the broad range and density of noise sources at these properties it would be very difficult, if not impossible, to eliminate or substantially reduce the noise levels. Consequently, the best chance of increasing the depth of detection is to try to eliminate noise during data processing. Due to time restraints for this Study, the demonstrators were not able to implement any advanced processing techniques that would help to reduce the effect of site noise. However, the TEMTADS team proposed a potential solution in response to NCR002. Because the TEMTADS has two sets of receiver coils that practically follow the same path, it is possible to isolate site noise by subtracting the result of one coil from the other at each coincident location. This process would allow for noise to be filtered more effectively and would result in an increase in the SNR and depth of detection. For future AGC work at the SVFUDS, time and effort should be allotted to perform the processing steps necessary to maximize the depth of detection.
3.5 Depth of Detection The depth of detection of small and large TOI is predominantly dependent on site-specific noise levels. As discussed in the previous discussions, the site noise for the three Pilot Study properties was variable. Each demonstrator used test stand and physics based models to estimate the minimum depth of detection for the following expected SVFUDS-specific TOI:
3” Stokes Mortar Livens Projectile MkIV Booster (from 75mm)
Modeled and test stand data provided the expected response for each item situated in the least favorable orientation and located at the maximum expected horizontal offset. For the MPV, this offset was ½ the project defined line spacing and for TEMTADS this was in the center of the array. Additionally, the EM61 data collected on each property during the previous investigations were reviewed to determine what level of noise was present in that data. As an example, the noise ranged from approximately 2.5 mV to 3.5 mV at 4720 Quebec. These thresholds were used to determine detection limits using physics based models ("EM61-MK2 Response of Standard Munitions Items, "NRL/MR/6110--08-9155, October 2008). It should be noted that there is no EM61 physics-based model or test stand data available for the Livens Projectile, so a large ISO was used to represent a Livens. Furthermore, the G-858 (also used during the previous investigations) depth of detection is not considered here because physics-based models and/or test stand data are not available. The results for each system are presented in the Exhibits below.

Spring Valley FUDS Final Pilot Study Report – Advanced Geophysical Classification April 2017
ERT, Inc. 29
Exhibit 3.1. MPV-Minimum Depth of Detection
4720 QuebecMax Noise
4720 QuebecMin Noise
4740 QuebecMax Noise
4740 QuebecMin Noise
4733Woodway Max
Noise
4733Woodway Min
NoiseStokes 0.65 0.72 0.6 0.68 0.54 0.65Livens 0.69 0.76 0.63 0.71 0.57 0.68MKIV Booster 0.33 0.39 0.29 0.36 0.24 0.33
0
0.2
0.4
0.6
0.8
1
1.2
Dept
h (m
)
Minimum Depth of Detection - MPV
4720Quebec
front yard
4720Quebec
back yard
4740Quebec
front andeast
4740Quebec
back
4733Woodway
front
4733Woodway
east
4733Woodway
back
4733Woodway
west
Stokes 0.72 0.65 0.68 0.6 0.62 0.54 0.65 0.6Livens 0.76 0.69 0.71 0.63 0.65 0.57 0.68 0.63MKIV Booster 0.39 0.33 0.36 0.29 0.31 0.24 0.33 0.29
0
0.1
0.2
0.3
0.4
0.5
0.6
0.7
0.8
Dept
h (m
)
Minimum Depth of Detection - MPV

Spring Valley FUDS Final Pilot Study Report – Advanced Geophysical Classification April 2017
ERT, Inc. 30
Exhibit 3.2. TEMTADS-Minimum Depth of Detection
Exhibit 3.3. EM61-Minimum Depth of Detection
4720 QuebecMax Noise
4720 QuebecMin Noise
4740 QuebecMax Noise
4740 QuebecMin Noise
4733Woodway Max
Noise
4733Woodway Min
NoiseStokes 0.53 0.73 0.56 0.76 0.35 0.52Livens 0.87 1.15 0.91 1.19 0.63 0.86MKIV Booster 0.23 0.36 0.25 0.38 0.1 0.22
0
0.2
0.4
0.6
0.8
1
1.2
Dept
h (m
) Minimum Depth of Detection - TEMTADS
Chan 2, High Noise Chan 2, Low NoiseStokes 0.68 0.76Large ISO 0.92 1.02MKIV Booster 0.17 0.22
0
0.2
0.4
0.6
0.8
1
1.2
Dept
h (m
)
Minimum Depth of Detection - EM61

Spring Valley FUDS Final Pilot Study Report – Advanced Geophysical Classification April 2017
ERT, Inc. 31
For each system, the minimum depth of detection is based on 3 times the measured minimum and maximum noise levels as detailed in Table 3-3 below. This represents the depths that these targets could have been detected in this study, however, targets were not selected below the minimum target selection thresholds as defined in Section 3 (1.2mV/A for the MPV and 1.6mV/A for the TEMTADS).
Table 3-3: Percent Coverage – Dynamic Survey
Property TEMTADS (mV/A) 3x TT
MPV (mV/A) 3x MPV
4720 Quebec Max Noise 0.96 2.88 0.28 0.84
4720 Quebec Min Noise 0.28 0.84 0.17 0.51
4740 Quebec Max Noise 0.79 2.37 0.42 1.26
4740 Quebec Min Noise 0.24 0.72 0.23 0.69
4733 Woodway Max Noise 3.52 10.56 0.67 2.01
4733 Woodway Min Noise 1 3 0.29 0.87
Conclusions based on the data displayed in Exhibits 3.1 through 3.3 above include the following:
MPV has the greatest depth of detection for small items similar in size to the MkIV Booster.
TEMTADS has the greatest depth of detection for large items similar in size to the Livens Projectile; however, note that no EM61 response curve was available for a Livens and a large ISO is significantly smaller than a Livens.
All sensors have a comparable depth of detection for medium items similar in size to a 3” Stokes Mortar.
Note that if advanced processing techniques performed on any dataset resulted in noise reduction, the depth of detection would be increased.
3.6 Target Selection Accuracy
3.6.1 Blind Verification Seed Detection During the dynamic data collection phase, the blind seeds provide the best measure of target selection accuracy. The offsets for blind seeds are shown in Table 3-4 and Exhibit 3.4. Overall, the MPV detected more seeds than the TEMTADS. The undetected seeds are discussed in Section 3.7. Of note when considering the offsets presented below, is that the MPV performed an extra processing step as described in Section 2.6.1.8. This step should technically increase the accuracy of the target location, and this appears to be the case for the 4720 Quebec and 4733 Woodway properties. However, for 4740 Quebec, the MPV offsets are generally larger than those for the TEMTADS. This seems to be attributed to improved accuracy of TEMTADS targets, rather than diminished accuracy of the MPV targets.
In summary, the MPV detected more seeds and the target selection process for MPV also resulted in greater accuracy of the seed location. However, if this extra advanced processing step was performed on the TEMTADS data it is likely that the accuracy of selected targets would increase as well.

Spring Valley FUDS Final Pilot Study Report – Advanced Geophysical Classification April 2017
ERT, Inc. 32
Table 3-4: Dynamic Target Selection Accuracy for Blind Seeds Property Blind
Seed #
Blind Seed Description
Seed Easting
Seed Northing
MPV Target Easting
MPV Target
Northing
MPV Target
Offset (m)
TT Target Easting
TT Target Northing
TT Target Offset (m)
4720 Quebec
12 75 mm, Horz. 318547.95 4311927.67 318547.96 4311927.71 0.03 318548.02 4311927.84 0.17
13 Stokes Mortar, Horz.
318540.52 4311933.93 318540.53 4311934.02 0.08 318540.70 4311933.90 0.19
14 Small ISO (w.s.) , Horz.
318537.71 4311960.18 318537.60 4311960.25 0.13 318537.70 4311960.30 0.12
15 M353 TPT projectile, Horz.
318523.20 4311936.80 318523.21 4311936.83 0.03 318523.20 4311936.70 0.10
16 Large ISO, Horz.
318558.97 4311950.85 NA NA NA NA NA NA
4733 Woodway
7 75 mm, Vert. 462787.93 1285625.24 318517.51 4311911.18 0.13 NA NA NA
8 Stokes Mortar, Horz.
462764.08 1285550.97 318494.79 4311904.52 0.03 318494.60 4311904.50 0.17
9 Small ISO (w.s.), Horz.
462851.46 1285601.60 318510.74 4311930.82 0.04 NA NA NA
10 Small ISO (s.s.), Vert.
462780.07 1285599.99 NA NA NA NA NA NA
11 Medium ISO, Horz.
462791.41 1285559.97 NA NA NA NA NA NA
4740 Quebec
17 75 mm, Horz. 462898.40 1285520.91 318486.41 4311945.94 0.28 NA NA NA
18 75 mm proj. part, 45 Deg.
462902.74 1285501.23 318480.56 4311947.20 0.08 318480.50 4311947.10 0.04
19 Ssmall ISO (w.s.), Horz.
462920.20 1285514.27 NA NA NA 318484.40 4311952.50 0.26
20 Medium ISO, Horz.
462916.60 1285505.65 318481.99 4311951.37 0.05 318482.00 4311951.30 0.03
Coordinates are in NAD83 UTM Zone 18N meters. NA is Not Applicable (NA results discussed in Sections 3.7 and 6.5).

Spring Valley FUDS Final Pilot Study Report – Advanced Geophysical Classification April 2017
ERT, Inc. 33
Exhibit 3.4: Blind Seed Offsets
-0.60
-0.40
-0.20
0.00
0.20
0.40
0.60
0.80
-0.80 -0.60 -0.40 -0.20 0.00 0.20 0.40 0.60 0.80Nor
thin
g (M
)
Easting (m)
Blind Seed Offsets for Targets Selected from Dynamic Data
MPV
TT
EM61

Spring Valley FUDS Final Pilot Study Report – Advanced Geophysical Classification April 2017
ERT, Inc. 34
EM61-MK2A data were collected over the blind seeds as described in Section 2.6.3. The offsets for the targets selected from this data are presented in Table 3-5 and Exhibit 3.4. In general the EM61 offsets are greater than those for the MPV and TEMTADS.
Table 3-5: EM61-MK2A Blind Seed Offsets
Property Blind Seed
#
Blind Seed Description
Seed Easting
Seed Northing
EM61 Target Easting
EM61 Target
Northing
EM61 Target
Offset (m)
4720 Quebec
12 75 mm, Horz. 318547.95 4311927.67 318517.3 4311911.2 0.26
13 Stokes Mortar, Horz.
318540.52 4311933.93 318494.3 4311904.5 0.45
14 Small ISO, Horz.
318537.71 4311960.18 318510.2 4311930.9 0.57
15 M353 TPT projectile, Horz.
318523.20 4311936.80 318509.9 4311908.9 0.14
16 Large ISO, Horz.
318558.97 4311950.85 318497.1 4311912.7 0.61
4733 Woodway
7 75 mm, Vert. 318517.55 4311911.31 318547.9 4311927.7 0.10
8 Stokes Mortar, Horz.
318494.76 4311904.54 318540.4 4311933.8 0.16
9 Small ISO, Horz.
318510.78 4311930.83 318537.5 4311960.6 0.47
10 Small ISO, Vert.
318509.81 4311909.08 318523.2 4311936.7 0.14
11 Medium ISO, Horz.
318497.69 4311912.80 318558.4 4311950.8 0.52
4740 Quebec
17 75 mm, Horz. 318486.50 4311945.67 318486.6 4311945.7 0.11
18 75 mm proj. part, 45 Deg.
318480.53 4311947.12 318480.5 4311947.2 0.11
19 Small ISO, Horz.
318484.62 4311952.36 318484.4 4311952.3 0.24
20 Medium ISO, Horz.
318481.97 4311951.32 318481.9 4311951.4 0.13
All blind seeds are inert items.

Spring Valley FUDS Final Pilot Study Report – Advanced Geophysical Classification April 2017
ERT, Inc. 35
3.6.2 TOI Detection One non-seeded TOI (3-inch Stokes Mortar, ultimately determined to be MD, a practice item) was discovered on the 4720 Quebec property (target #129). A post analysis of the dynamic targets selected at the location of this 3-inch Stokes Mortar confirmed the target selection accuracy observed for blind seeds. Additionally, data were collected over this location during the previous investigations (2007-2009) at this site. However, at that time, while no EM61 target was selected at this location, the G-858 magnetic data did identify an anomaly, but it was classified as a Category D target (not indicative of MEC), and was not recommended for intrusive investigation. The offsets for all three datasets are shown in Table 3-6.
Table 3-6: TOI Offset Stokes Easting
Stokes Northing
Sensor Target Easting
Target Northing
Target Offset (m)
318555.45 4311944.84
MPV 318555 4311945 0.09
TEMTADS 318555.2 4311945 0.28
G-858 318555.45 4311944.84 0.54
3.7 Non Conformance Report (NCR) and Root Cause Analysis (RCA) Summary Three NCRs were issued during the dynamic data collection phase of the Pilot Study. All NCRs were related to Dynamic Detection Performance Failures. In each instance the demonstrator(s) provided a Root Cause Analysis (RCA) and recommended Corrective Action (CA). The complete RCA/CA documents are provided in Appendix D. Summaries are provided below.
3.7.1 NCR001 Blind seed #16 was not detected by either the MPV or the TEMTADS at the 4720 Quebec property. Seed # 16 is a large ISO at 2.5 ft depth.
3.7.1.1 MPV RCA The RCA indicated that the data collected over the blind seed were improperly leveled. Leveling is the process of removing the background response (i.e. – signal not related to the target of interest) from the data in order to isolate metallic anomalies. This occurred because the line of data was relatively short (line 297 in Exhibit 3.5 is only approximately two meters long) which resulted in a poor estimation of the background conditions that needed to be subtracted from the data. When the data are properly leveled, the seed is selected using the standard target selection procedure.

Spring Valley FUDS Final Pilot Study Report – Advanced Geophysical Classification April 2017
ERT, Inc. 36
Exhibit 3.5: MPV Data in the Vicinity of Seed #16 (white triangle)
3.7.1.2 MPV CA The following CAs were recommended by the MPV demonstrators to address the non-conformance:
The analyst should carefully review each line to determine if negative offsets were introduced due to median filtering artifacts.
Re-level lines with a modified filtering approach appropriate for shorter lines and lines where the standard filtering may overestimate the background response.
Repeat the target picking procedure using the newly levelled data.
These corrective actions were implemented and resulted in five additional targets. These targets were added to the cued list and intrusively investigated.
3.7.1.3 TEMTADS RCA The RCA indicated that while the data met the required MQO, the coverage over the seed item was not sufficient to detect the item (Exhibit 3.6). The seed is located right at the intersection of lines going in two directions and was also located beneath tree branches that interfered with the RTS line of sight. This reduced the data density over the target. The amplitude of the target was also lower than that predicted by physics-based models.

Spring Valley FUDS Final Pilot Study Report – Advanced Geophysical Classification April 2017
ERT, Inc. 37
Exhibit 3.6: TEMTADS Paths Shown Relative to Seed #16 (red circle)
3.7.1.4 TEMTADS CA The following CAs were recommended by the TEMTADS team to address the non-conformance:
Collect additional data in areas where coverage is sparse. Collect cued data over the seed to determine if there are any issues with the specific seed
item or location.
Additional data were collected where small data gaps were identified. Cued data were collected over the item and were classified as “Cannot Analyze”. This suggests that the item was too deep for the TEMTADS to detect at this site.
3.7.1.5 Additional Considerations This non-conformance helped to identify a flaw in the development of the DQOs. During the project planning phase, the smallest TOI and required depth of detection was identified, but no focus was given to the largest TOIs. When developing the RCA for this NCR, both demonstrators noted that the target threshold would need to be decreased in order to account for large/deep TOI. To address this issue, demonstrators collected test stand data over a Livens Projectile, one of the largest expected TOI, to determine the depth of detection.
3.7.2 NCR002 Blind seed #17 was not detected by the TEMTADS and seed #19 was not detected by the MPV at the 4740 Quebec property. The missed seed items were an inert 75mm projectile at 1.88 ft

Spring Valley FUDS Final Pilot Study Report – Advanced Geophysical Classification April 2017
ERT, Inc. 38
depth and a small ISO at 0.6 ft depth, respectively.
3.7.2.1 MPV RCA The RCA indicated that due to the high number of targets detected above the selection threshold, MPV data processors were initially utilizing size and decay to reduce the number of targets that required cued data collection. The thresholds for size and decay were based on data collected over a small ISO and the MkIV Booster. The dipole source closest to the location of blind seed #19 did not present a decay value greater than the threshold, and therefore was removed from the final cued target list. In general the decay information is difficult to recover in noisy environments.
3.7.2.2 MPV CA For the CA, targets were reselected for both 4720 Quebec and 4740 Quebec using only size as a discriminator. No decay threshold was implemented. This resulted in 39 additional targets at 4720 Quebec and 69 additional targets at 4740 Quebec. These targets were not cued, but were intrusively investigated.
3.7.2.3 TEMTADS RCA
The RCA indicated that the data met the MQO, but seed #17 was not detected. The physics-based model of the response of a 75mm at this depth indicates that the target should have been detected. Based on a thorough review of the data, the root cause of the failure was not determined.
3.7.2.4 TEMTADS CA As the root cause of the failure could not be determined, the only corrective action recommended was to collect cued data over the seed to determine if there are any issues with the specific seed item or location. Cued data were collected over the item and a dipole source in the correct location was identified. This source matched a 60mm item and had a fit metric of 0.91 out of 1.0. It was classified as TOI. The fit item suggested that the item was smaller than a 75mm, however the intrusive activities confirmed that the item was an inert 75mm projectile.
3.7.3 NCR003 Table 3-7 shows the blind seeds that were not detected by the respective demonstrators at the 4733 Woodway property:
Table 3-7: Missed Blind Seeds – NCR 003 Seed # Description MPV TEMTADS
7 75mm, vert, 0.7ft Pass Fail
9 Small ISO, horz, 0.8ft Pass Fail
10 Small ISO, vert, 0.6ft Fail Fail
11 Med ISO, horz, 1.5ft Fail Fail

Spring Valley FUDS Final Pilot Study Report – Advanced Geophysical Classification April 2017
ERT, Inc. 39
3.7.3.1 MPV RCA/CA
Table 3-8 indicates the RCA and CAs recommended by the MPV team for NCR 003:
Table 3-8: Corrective Actions for MPV – NCR 003
Seed # RCA CA QC Comments 10 Stainless Steel pipe nipple does
not produce the same response as the standard black steel.
This seed should be removed from the required verification seed population.
Concur
11 Seed was adjacent to high noise (underground utility) area and the response is masked by the noise.
A larger buffer should be utilized around high noise areas where we do not have a high confidence in successful detection.
Concur. High noise areas could be addressed using mag and dig methods.
3.7.3.2 TEMTADS RCA/CA
Table 3-9 indicates the RCA and CAs recommended by the TEMTADS team for NCR 003:
Table 3-9: Corrective Actions for TEMTADS – NCR 003
Seed # RCA CA QC Comments
7 Seed was outside of TEMTADS coverage
This seed should be removed from the required verification seed population for TEMTADS.
Concur
9 The signal to noise ratio in this area was too low to detect the seed.
Consider revising the objective depth of detection in noisy areas or perform additional processing (differencing) that will substantially increase the number of targets to be cued.
Concur. Additional analysis should be performed to better define the advantages of utilizing the differencing technique to increase signal to noise.
10 Stainless Steel pipe nipple does not produce the same response as the standard black steel.
This seed should be removed from the required verification seed population.
Concur
11 Seed was adjacent to high noise (underground utility) area and the response is masked by the noise.
A larger buffer should be utilized around high noise areas where we do not have a high confidence in successful detection.
Concur. High noise areas could be addressed using mag and dig methods.
As discussed in Section 3.4, the noise levels were highest at the 4733 Woodway property. This had a significant effect on the ability to detect targets. Other issues that contributed to missed seeds at this property included utilizing stainless steel pipe nipples rather than welded steel and placing seeds outside of the TEMTADS coverage area. It is not clear as to why the stainless-steel pipes are not detectable, however the failure was confirmed by the MPV at the IVS background location. Data were collected over a stainless-steel ISO at the surface and produced a very low amplitude response. As a result, this seed was removed from the required verification population. It is noted that stainless steel seeds should not be used in the future, in order to avoid this issue.

Spring Valley FUDS Final Pilot Study Report – Advanced Geophysical Classification April 2017
ERT, Inc. 40
3.8 Dynamic Data Target Synthesis As described in Section 2.6.2.2, cued targets were selected from dynamic TEMTADS and MPV data by the respective instrument demonstrators. Additionally, several targets remained from the previous investigations (2007-2011) for the three Pilot Study properties. These were either generated from the G-858 magnetometer surveys or the EM61 surveys done at that time.
The three target lists were synthesized to generate the Final Cued Target List (see Appendix F-1) for each property. Targets from all datasets were plotted in Geosoft Oasis montaj and the GPO tool was used to find targets within 0.3m of each other. These targets were then merged to form a single target centered between the original targets. The original target source and ID was carried through the merging process for tracking purposes. The general statistics for each dataset are detailed in Table 3-10.
Maps showing all cued targets for the 4720, 4733, and 4740 properties, are presented as Figures 6, 15, and 24, respectively.
Note, at this stage, these are targets to be cued, not intrusively investigated.
Table 3-10: Dynamic Data Target Synthesis into Cued Targets
Metric 4720 Quebec 4733 Woodway 4740 Quebec
Number of unique targets detected with the EM61 6 0 1
Number of unique targets detected with the G-858 10 0 0
Number of unique targets detected with the TEMTADS 50 61 74
Number of unique targets detected with the MPV 71 76 57
Number of targets detected with both the TEMTADS and MPV 28 55 15
Number of targets detected with both the TEMTADS and G-858 1 0 0
Number of targets detected with the TEMTADS, MPV, and G-858 1 0 0
Number of QC targets added 4 2 0
Total Number of Cued Targets 171 194 147

Spring Valley FUDS Final Pilot Study Report – Advanced Geophysical Classification April 2017
ERT, Inc. 41
4.0 CUED SURVEY DATA QUALITY The MPV cued data collected in the field was processed and analyzed by the BTG team. The TEMTADS cued data collected in the field was processed and analyzed by the NRL team. Each demonstrator’s data processing procedures and cued data MQOs are detailed below.
4.1 Background Verification and Correction Background corrections were used to remove the instrument response (self-signature) of the MPV and TEMTADS systems and the soil response from the measured anomaly data. Background measurements were taken at locations selected from the dynamic survey data sets. Prior to utilizing these locations for background measurements, they were verified to be devoid of metal by comparing a set of five measurements taken at each selected background location: one measurement at the location and one more with the sensor offset by approximately 0.25 m in each cardinal direction. For the TEMTADS background verification data, the forward model of the most challenging target of interest/depth scenario (MkIV Booster at 12 inches bgs) was added to the center background measurement, and the background was verified by separately subtracting each of the four offset backgrounds and performing a library match to the target of interest. The background location was considered valid if the library match from all four offsets exceeded 0.9. Additionally each individual background measurement was verified as suitable prior to using it for background correction of the target measurement data. For the MPV background verification data, a synthetic seeding approach was not used, however all four offsets were confirmed to be below the project specific threshold to verify background location.
4.2 Intrinsic and Extrinsic Parameters For both systems, cued data were inverted to estimate intrinsic and extrinsic parameters. These parameters include extrinsic parameters (location and orientation) as well as the intrinsic parameters (principal axis polarizabilities) related to the object size, shape, and composition. The intrinsic parameters [betas (β)] are used for classification. For an axial symmetric object similar to a projectile, the three betas typically present as one primary beta, having the highest amplitude, and two relatively equal, lower amplitude secondary betas.
Exhibits 4.1 and 4.2 show examples of decision plots made by each demonstrator. These plots are generated for every source, and not only show how well the polarizability curves match the library, but also provide visual representations of other extrinsic and intrinsic properties. The TEMTADS Decision Plot includes the following information: Top Left: Size and decay feature space. Longer decays are typically associated with thick walls,
allowing the analyst to compare the size and thickness of each source with the other targets on the site, as well as site specific library items.
Bottom Left: Visual representation of the decision metric. Relates to the classification ranking system and the likelihood that a source is a TOI.
Center: Polarizability curves of the source (blue) compared to the best library match (red). This example matches with a metric of 0.94 out of 1.
Top Right Figure: Shows cued flag locations and sources relative to the position of the TEMTADS sensor.
Top Right Text: Summary of the pertinent information. Bottom Right: Shows the depth of the source relative to the sensors.

Spring Valley FUDS Final Pilot Study Report – Advanced Geophysical Classification April 2017
ERT, Inc. 42
1 Exhibit 4.1: TEMTADS Decision Plot 2
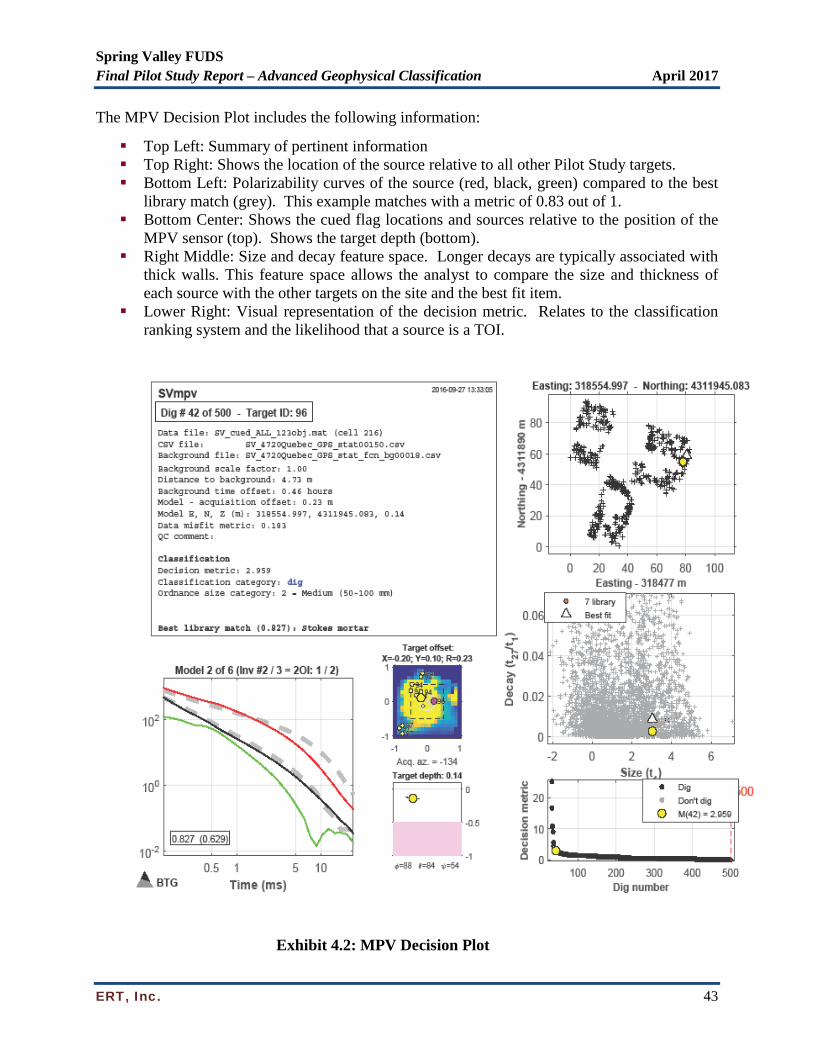
Spring Valley FUDS Final Pilot Study Report – Advanced Geophysical Classification April 2017
ERT, Inc. 43
The MPV Decision Plot includes the following information:
Top Left: Summary of pertinent information Top Right: Shows the location of the source relative to all other Pilot Study targets. Bottom Left: Polarizability curves of the source (red, black, green) compared to the best
library match (grey). This example matches with a metric of 0.83 out of 1. Bottom Center: Shows the cued flag locations and sources relative to the position of the
MPV sensor (top). Shows the target depth (bottom). Right Middle: Size and decay feature space. Longer decays are typically associated with
thick walls. This feature space allows the analyst to compare the size and thickness of each source with the other targets on the site and the best fit item.
Lower Right: Visual representation of the decision metric. Relates to the classification ranking system and the likelihood that a source is a TOI.
Exhibit 4.2: MPV Decision Plot

Spring Valley FUDS Final Pilot Study Report – Advanced Geophysical Classification April 2017
ERT, Inc. 44
Both Exhibit 4.1 and 4.2 are plots for the cued data collected over the native Stokes Mortar TOI found at 4720 Quebec.
4.3 MPV Cued Data Processing Data processing for the MPV data was performed using UXOLab, software that was developed by BTG. After performing preliminary quality control checks and performing background corrections, the data were inverted and classified. Next, the intrinsic and extrinsic features were estimated for the target anomalies as well as the daily QC measurements collected at the IVS. The data were inverted using a sequential single- and multi-object inversion approach to estimate intrinsic parameters (principal axis polarizabilities) and extrinsic parameters (target location and depth). Polarization tensor models representing a single-object, two-objects and three objects were fit to each cued dataset. All solutions were retained, to consider during the classification process.
4.4 TEMTADS Cued Data Processing Data processing for the TEMTADS data was performed using Geosoft Oasis montaj, a commercially available software package. Single target and multi-target inversion routines in UXA-Advanced were used to determine the parameters of a target (single-target inversion), or constellations of targets (multi-target inversion), that would produce responses that closely match the observed responses.
As the names suggest, the single-target inversion solves for a single target and the multi-target inversion posits multiple targets. The multi-source solver not only presupposes multiple sources, it will also produce a number of candidate ‘realizations’ of targets. Each candidate realization proposes a configuration of targets whose modeled response reasonably fits the observed data. For example, one candidate realization may have three targets, while a second candidate realization for the same measurement may have two or four targets. This process reflects the fact that, with an unknown number of potential targets of difference sizes and shapes, a number of different models can closely match the observed data. A separate fit coherence value is derived for each candidate realization as well as for the single solver.
4.5 Cued Data Measurement Quality Objectives Cued Data MQOs are presented in Table 4-1. Model results were only used for classification if they passed the MQOs, confirming that they support classification.
Table 4-1: Cued Data MQOs Measurement Quality
Objective Frequency Acceptance Criteria Status
Verify correct assembly Once following assembly
Instrument is correctly assembled
Achieved for both TEMTADS and MPV. Documented on Initial TPC Checklist.
Initial sensor function test (instrument response amplitudes)
Once following assembly
Response (mean static spike minus mean static background) within 25% of predicted response for all monostatic transmit/receive (Tx/Rx) combinations
Achieved for both TEMTADS and MPV. Documented on Initial TPC Checklist and IVS Report.

Spring Valley FUDS Final Pilot Study Report – Advanced Geophysical Classification April 2017
ERT, Inc. 45
Table 4-1: Cued Data MQOs Measurement Quality
Objective Frequency Acceptance Criteria Status
Initial IVS background measurement (five background measurements, one centered at the flag, and one offset at least 35cm in each cardinal direction)
Once during initial system IVS test
All decay amplitudes lower than project threshold (threshold dependent upon soil response and will be defined in the IVS Tech Memo)
Achieved for both TEMTADS and MPV. Documented in TPC Checklists and Demonstrator Data.
Initial derived polarizabilities accuracy (IVS)
Once during initial system IVS test
Library Match metric ≥ 0.9 for each set of inverted polarizabilities
Achieved for both TEMTADS and MPV. Documented in IVS Report and Demonstrator Data.
Derived target position accuracy (IVS)
Once during initial system IVS test
All IVS item fit locations within 0.25m of ground truth locations
Achieved for both TEMTADS and MPV. Documented in IVS Report and Demonstrator Data.
Ongoing IVS background measurements
Beginning and end of each day as part of IVS testing
All decay amplitudes lower than project threshold
Achieved for both TEMTADS and MPV. Documented in Demonstrator Data.
Ongoing derived polarizabilities precision (IVS)
Beginning and end of each day as part of IVS testing
Library Match to initial polarizabilities metric ≥ 0.9 for each set of three inverted polarizabilities
Achieved for both TEMTADS and MPV. Documented in Demonstrator Data.
Ongoing derived target position precision (IVS)
Beginning and end of each day as part of IVS testing
All IVS items fit locations within 0.25m of average of derived fit locations
Achieved for both TEMTADS and MPV. Documented in Demonstrator Data.
Initial measurement of production area background locations (five background measurements: one centered at the flag and one offset at least 35cm in each cardinal direction)
Once per background location
All decay amplitudes lower than project threshold (defined in the IVS Tech Memo)
Achieved for both TEMTADS and MPV. Documented in TPC Checklists and Demonstrator Data.
Ongoing production area background measurements
Background data collected a minimum of every 1.5 hours during production
All decay amplitudes lower than project threshold (defined in the IVS Tech Memo)
Achieved for both TEMTADS and MPV. Documented in TPC Checklists and Demonstrator Data.
Ongoing instrument function test
Minimum 1 every 3 hours and each time instrument is restarted
Response (mean static spike minus mean static background) within 25% of predicted response for all monostatic Tx/Rx combinations
Achieved for both TEMTADS and MPV. Documented in TPC Checklists and Demonstrator Data.
Transmit current levels Evaluated for each sensor measurement
Current must be ≥5.5A Achieved for both TEMTADS and MPV. Documented in TPC Checklists and Demonstrator Data.
Confirm all background measurements are valid
Evaluated for each background
Ensure background variation does not impact ability to
Achieved for both TEMTADS and MPV. Documented in

Spring Valley FUDS Final Pilot Study Report – Advanced Geophysical Classification April 2017
ERT, Inc. 46
Table 4-1: Cued Data MQOs Measurement Quality
Objective Frequency Acceptance Criteria Status
measurement classify correctly Demonstrator Data. Confirm inversion model supports classification (1 of 3)
Evaluated for all models derived from a measurement (i.e., single-item and multi- item models)
Derived model response must fit the observed data with a fit coherence ≥ 0.86
Achieved with few exceptions* for both TEMTADS and MPV. Documented in Demonstrator Data.
Confirm inversion model supports classification (2 of 3)
Evaluated for derived target
Fit location estimate of item ≤ 0.4m from center of sensor
Achieved with few exceptions* for both TEMTADS and MPV. Documented in Demonstrator Data.
Confirm inversion model supports classification (3 of 3)
Evaluated for all seeds 100% of predicted seed positions ≤ 0.25m from known position (x, y, z)
Achieved for both TEMTADS and MPV. Documented in Demonstrator Data.
Confirm reacquisition GPS precision
Daily Benchmark positions repeatable to within 10 cm
Achieved for both TEMTADS and MPV. Documented in TPC Checklists.
* This metric was not met for some targets with very low signal amplitude. In these cases, the failure does not impact the ability to classify and therefore was not considered a significant failure that needed to be addressed.
4.6 Cued Data Analysis and Classification After the cued data were inverted and intrinsic and extrinsic parameters were estimated, the data were classified. All targets were ultimately classified as “Dig” or “Do Not Dig”, however subcategories for targets that are listed as “Dig” include:
Training Cannot extract reliable parameters Likely to be TOI Cannot Decide
4.6.1 Library Development Additional test stand measurements were collected over an MkIV Booster and Livens Projectile provided by USACE to supplement available library data. In general, the following items were considered “site specific” and were required to be included in the demonstrators’ primary library:
75 mm projectiles Fuzes (MK-3 and/or similar) 5” projectiles projectile (similar to 4.7” illumination projectiles) 3" Stokes mortars MkIV Booster (from 75mm) Livens Projectiles Small, medium and large ISOs
The TEMTADS analysis was based on the standard all-inclusive library included with the UXAnalyze installation, with minor modifications. Because the smallest anticipated TOI was a small ISO/MKIV booster, all smaller items such as 20mm were removed as well as grenades and

Spring Valley FUDS Final Pilot Study Report – Advanced Geophysical Classification April 2017
ERT, Inc. 47
T-Bar fuzes. All the seeds and the native Stokes produced library matches of sufficient quality to the actual item to declare a dig except in a couple of instances. There was a small ISO that matched better to a 60mm and a 75mm that also matched to a 60mm.
The MPV utilized an expanded library that included items not expected at this site. This decision was made to provide a conservative approach based on the limited amount of site specific training data that was available. The Stokes Mortar and all blind seeds would have been detected with a site specific library.
Both demonstrators agree that the number of false positives would be decreased if a site-specific library were utilized for final classification. However, both demonstrators also recommend the use of an all-inclusive library to identify possible unanticipated items to be identified during the training phase. In this case, if training digs did not result in a MEC find, then the site-specific library would be acceptable for final classification. Otherwise, if any of the training digs resulted in a MEC item, the library item with the best match to that data would be added to the site-specific library.
4.6.2 Training Data
Training data are select intrusive results provided to the demonstrator prior to receiving their final classified list. These data are meant to provide additional ground truth to help inform classification decisions. Training data were requested by both demonstrators for the Pilot Study. Primary justifications for requesting ground truth for specific targets are as follows:
1. Selected from targets flagged as potential TOI during QC. Some of these may be targets with polarizabilities that have a close match with a library item. These requests will be used for validation purposes.
2. Others may correspond to targets with polarizabilities distinct from all entries in the library. These requests will serve to potentially augment the classification library (if new TOI are found).
3. Cluster analysis is used to automatically find clusters of items with self-similar polarizabilities. The polarizabilities for a cluster may or may not be potential high-likelihood TOI (e.g., horseshoes, small arms projectiles). Representative items from clusters not comprising only models associated with small scrap are commonly requested as training data.
4.6.3 MPV Classification
A classification scheme primarily based on matching polarizabilities with ordnance items in the site-specific library was employed. Each set of cued measurements were inverted using one, two and three dipole source inversions. Inversion results were reviewed by the analyst and only valid models were retained for classification. Models were failed when the associated predicted data had a poor fit with the observed data, or when the predicted source location was too far from the sensor to be considered reliable. If all models/inversions for a target were failed, the target was classified as “cannot extract reliable parameters” and classified as “dig”. There were two exceptions to this process of assigning pass/fail status to models from the inversions:
1. Close target picks: The SVFUDS properties had many instances of close target picks, which often prompted the field operators to collect multiple soundings in an effort to

Spring Valley FUDS Final Pilot Study Report – Advanced Geophysical Classification April 2017
ERT, Inc. 48
collect a sounding directly on top of the buried items. Although this process improved the data quality for classification, it also complicated the task of matching source locations and target identity labels, especially when a source would be predicted between two target picks. In this case some models would be manually failed to avoid that the same source location being reported for two targets, and to match the source to the closest target.
2. Empty holes: Soundings collected at locations with no detectable object may generate spurious models or poor fits, which could result in targets being labelled “cannot analyze” and therefore being marked to be dug. For these cases where there was no discernable signal from a metal object present in the data, the analyst ensured that at least one model was passed, even if the data was a poor fit or the location too far, so that a high confidence empty hole would not be prioritized for digging.
Polarizabilities obtained from the IVS measurements of site specific TOI were added to the classification library. Additional information was obtained via training digs selected by the analyst based on their polarizability’s matching to potential TOI. A final dig list was generated by sorting the targets according to the library match metric, starting with the targets for which ground-truth information had already been obtained (missed seeds from detection phase and training digs). The stop-dig point was specified where the decision metric indicated a low likelihood of a TOI. The stop dig point is guided by the decision metric which indicates the portion of the ranked dig list where the probability of finding a TOI becomes small. There is no threshold value used, rather the plot of the decision metric produces an L-shaped curve with a region just beyond the "elbow" of that curve where the analyst should consider setting the stop dig point. While the plot of the decision metric suggests the region of the ranked list where the analyst should consider stop digging, the actual stop dig point within this region is determined by the analyst's examination of the polarizability misfits along the ranked dig list and identification of the point where the analyst determines the fits are sufficiently degraded.
4.6.4 TEMTADS Classification Classification was based primarily on the goodness of fit metric (values from 0.0 to 1.0) generated by UXA during a comparison of the β values estimated for each surveyed target and the β values in the munitions library developed for the project. This comparison was performed via the library match utility in UXA. The goodness of fit metric is a measure of the fit correlation between a target and the library entry that best fits that target, with higher values indicating a better fit between the target and the corresponding item in the library. The library fit analysis matches the following four combinations of βs to those of the candidate library TOIs:
β1, β1/β2, β1/β3 β1, β1/β2 β1/β2, β1/β3 β1
The confidence metrics for each fit combination were averaged to derive a ‘decision metric’.
This library matching process is performed for each single-solver model and every target in each of the multi-source solver models. For each flag position, the best library fit from the single-solver and multi-solver targets is used as the decision metric. This decision metric is used to

Spring Valley FUDS Final Pilot Study Report – Advanced Geophysical Classification April 2017
ERT, Inc. 49
rank and classify the target list. Values below the analyst’s threshold are considered non-TOI. A threshold number of 0.825 for the decision statistic was used as the stop dig point. Due to the noise at the site, a threshold of 0.925 for the “100” library match was used to conservatively add other potential TOI that may have a reduced decision statistic caused by noisy secondary polarizations. The thresholds were initially selected using classification experience from past projects and refined to the final numbers using site specific training data. The stop dig point represents the point where the training data and past experience suggest that no other TOI in the library exists in the remaining items on the dig list.
Individual items that did not match any library items but had βs that indicated an axially symmetric, thick-walled object were conservatively placed on the Dig list.
4.7 Final Cued Target Synthesis The inverted source locations generated by each demonstrator were synthesized to form the final dig target list. A merge radius of 0.3 m was used to combine targets into a single dig location in the same manner as it was done after the dynamic detection phase. Following cued data processing of MPV and TEMTADS data, the collection of EM61-MK2A data, and any targets selected as part of the corrective action for NCRs 001 and 002, synthesis of the final cued targets into the final dig target list (i.e., which cued targets should be dug) was performed. From this list, the final dig sheets (Appendix E) were generated for use by the UXO intrusive team.
Maps showing final dig target locations for the 4720, 4733, and 4740 properties, are presented as Figures 7, 16, and 25, respectively. The figures indicate whether the target was identified by the MPV only, the TEMTADS only, both MPV and TEMTADS, or by the EM61-MK2A. Appendix F-2 provides the detailed dig target list spreadsheets used to produce the figures.
The final target counts for each property are summarized in Table 4-2.
Table 4-2: Final Cued Target Synthesis Site Targets Detected
in Dynamic Data EM61/Mag/ QC
Targets Added
Total Number
Cued Targets
Targets Removed
during Reacquisition
Targets Cued by Each System
Corrective
Action Targets Added
EM61 Targets Added
Targets on Dig
List TEMTADS MPV TEMTADS MPV
4720Q 80 100 20 171 5 168 166 39 15 243
4733W 152 193 2 194 3 194 194 0 16 230
4740Q 89 82 1 147 7 123 140 69 20 278

Spring Valley FUDS Final Pilot Study Report – Advanced Geophysical Classification April 2017
ERT, Inc. 50
This Page Intentionally Left Blank

Spring Valley FUDS Final Pilot Study Report – Advanced Geophysical Classification April 2017
ERT, Inc. 51
5.0 INTRUSIVE INVESTIGATION
5.1 Overview In a typical AGC based investigation or removal activity approach, only those targets classified as ‘Dig’ would be intrusively investigated. But for this Pilot Study all targets were intrusively investigated, whether the classifiers indicated they should be dug or not.
The intrusive investigation began on September 30, 2016 with the flagging of final dig targets, as presented in the Appendix E dig sheets. These dig sheets represent the actual field team descriptions as targets were excavated; the sheets were later typed for readability for inclusion in the appendix.
The team of UXO technicians began intrusive operations on October 3, 2016, and completed most digs at 4740 Quebec Street and 4733 Woodway Lane by October 7, 2016. Due to the requirements for permitting to dig beneath the public space sidewalks in front of each property, no sidewalk targets were investigated at that time.
Furthermore, due to the presence of other workers and scaffolding at 4720 Quebec Street, the intrusive investigation of that property was further delayed. The UXO dig team remobilized to complete digs at 4720 Quebec Street and all remaining digs on public sidewalks on November 14, 2016 and all digs were completed by November 17, 2016.
5.2 Intrusive Investigation Procedures
5.2.1 Reacquisition Reacquisition of final targets was accomplished by ERT using the Leica 1200 RTS. Positional accuracy was obtained by resection using control points provided by licensed surveyors, with verification of the rover prism on a third point. As an accommodation of the homeowners, wooden golf tees with plastic flagging were used to mark softscape targets (in grass or soil), and marking paint were used to mark hardscape targets (on concrete or slate driveways, patios, or sidewalks).
On other projects where DGM is employed to map targets of interest, typically the instrument used for the mapping is again used after the target flag is placed in the ground, in order to refine the location of the target by searching for the highest geophysical response, or peak. However, when AGC systems are used, the cued measurement process refines the target location with a high degree of precision, and the instrument does not need to revisit the anomaly.
Furthermore, on AGC projects it is typical that targets where the geophysical data does not seem to match the dig result (such as “no contacts” where nothing is found) may be revisited by the dig team, primarily to ensure that the flag was placed in the correct location. Due to the limited time requirements at these private properties, once all targets were dug, site restoration had to proceed, and there was no opportunity to revisit dig targets. However, due to the small size and abundant cultural site features at the three properties, it is unlikely that any flags would have been placed too far from the correct location without it being noticed by the reacquisition team.
5.2.2 Excavation The UXO teams consisted of the Senior UXO Supervisor (SUXOS), UXOSO/QCS, a Technician III field team leader, and several Technician IIs and Is. As a matter of logistics, some

Spring Valley FUDS Final Pilot Study Report – Advanced Geophysical Classification April 2017
ERT, Inc. 52
technicians were dedicated to hardscape anomalies, while others were deployed on softscape targets.
The UXO team completed all excavations using shovels in grass or other softscape, or using power tools (concrete saws, jackhammers) in hardscape. The field dig sheets included an estimated depth based on cued measurements for many targets, as well as a ‘Fit item’ generated through cued data processing (essentially an estimate of the size and shape of the object). Depth to contact, contact type, and other notes were recorded on the dig sheet.
Any munition debris (MD) was removed and stored in a secure location on site until proper disposal at the end of the project. Cultural debris was either removed or left in place.
Hardscapes were temporarily restored with quick-crete type patching immediately after completion of the excavation. Hardscapes were later permanently restored by ERT’s landscape/restoration contractor.
5.2.3 Anomaly Resolution Process The intrusive investigations were resolved in the field using analog detectors (Schonstedt GA-52Cx magnetometer or White’s DFX-300 metal detector). Unless the source was verified and could not be removed, a hole was not considered clear until there was no remaining audible response produced by the analog sensor. For any “no contacts” the intrusive investigation continued until the depth of the hole was 6 inches deeper than the estimated fit depth from the classified data.
Additional anomaly resolution was performed by the QC geophysicist. This process consisted of comparing classified data to the intrusive results to ensure that they were consistent. During this process, the only discrepancies noted were related to low signal targets. It is common for the inversion process to falsely predict large deep objects when there is little to no signal, which was the case with several targets here. As a result, the dig team was not redeployed to re-investigate these targets.
5.3 Intrusive Investigation Findings
5.3.1 4720 Quebec Street Intrusive work began on November14 and was concluded on November 16, 2016. Complete dig results are shown in Appendix E.
A map of the final dig target locations for 4720 Quebec is presented as Figure 7. The dig sheet detailing the findings is contained in Appendix E. 243 targets were investigated.
This property was the only one where munitions-related items were found during this Pilot Study, as described below.
A native TOI, a 3-inch Stokes Mortar unfuzed practice round, was found at target #129. This item is shown in photo 18 of Appendix G. In accordance with the UFP-QAPP, this item was turned over to the USACE OESS for further processing. The OESS initiated a response from the Fort Belvoir EOD unit, who took control of the item, removing it from the site for further assessment. It was ultimately determined to be a practice round and was properly disposed by the EOD unit. The item appeared completely intact as found; there was no staining of soil or other indications of the need for a soil sample, and therefore, none was collected.

Spring Valley FUDS Final Pilot Study Report – Advanced Geophysical Classification April 2017
ERT, Inc. 53
This anomaly had been detected during previous geophysical survey in 2009. The EM61 survey recorded a saturated area and thus no target was picked. The G-858 magnetometer recorded an anomaly. At that time, as it was only selected as a target in the G-858 dataset (i.e., a ‘mag-only’ target), the procedure was to classify it as a Category D target (not indicative of MEC), and it was not recommended for intrusive investigation.
Targets #94, #201, and #202 were found to be MD. These are shown in photos 17, 19, and 20, respectively, of Appendix G. These items were also taken by the OESS, and following negative results for head-spacing for potential CWM, were properly disposed.
All other items were cultural debris. Nails, screws, and wires were common. One unusual item was target #73 and #74, a steel spike of 1 inch diameter and 26 inch length buried under the sidewalk in front of the property. This is shown in photo 16 of Appendix G.
Note also, as described in Section 1.3.1.1, two MD fragments were found in 2009 during the previous investigations at this property.
5.3.2 4733 Woodway Lane Intrusive work began on October 6 and most digs were completed by October 7, 2016. Targets beneath the public sidewalk and the slate patio in the backyard were dug on November 16 and 17, 2016.
A map of the final dig target locations for 4733 Woodway is presented as Figure 16. The dig sheet detailing the findings is contained in Appendix E. A total of 230 targets were investigated.
No munitions-related items were found. Nails, wires, and screws were common. Targets #2013 (a tent stake), #2158 (rain gutter embedded in concrete), and #2189 (steel scrap), are shown in photos 24, 25, and 26, respectively, of Appendix G.
5.3.3 4740 Quebec Street Intrusive work began on October 4 and most digs were completed by October 6, 2016. Targets beneath the public sidewalk were dug on November 16, 2016.
A map of the final dig target locations for 4740 Quebec is presented as Figure 25. The dig sheet detailing the findings is contained in Appendix E. A total of 278 targets were proposed to be investigated, but not all were ultimately dug, as described below.
A group of anomalies were mapped by the MPV in an area of sensitive vegetation in the front of the property; however, as an accommodation to the homeowner, only a subset of these targets was dug. Specifically, targets #1089, #1106, and #1107 were dug because the ‘fit item’ was listed as a Stokes mortar or 75mm projectile, and it would not be considered reasonable to leave such potential items in the ground to save vegetation. Target #1089 (steel banding) is shown in photo 23 of Appendix G. None of these targets were munitions-related items.
Another group of targets (#1210 to #1278, inclusive), designated ‘MPV Extras’, were added to the dig list based on the proposed corrective action for NCR 002, where a blind seed had been missed. With concurrence from USACE, it was decided to dig some percentage (at least 25%) of the targets initially, with more to be dug based on the findings. The result was that 19 of the 67 targets were dug, with no significant findings, and therefore, none of the remaining targets were dug in this group.

Spring Valley FUDS Final Pilot Study Report – Advanced Geophysical Classification April 2017
ERT, Inc. 54
Overall at this property, no munitions-related items were found. Except as noted above, all remaining targets were dug. Nails, steel scrap, and wires were common, especially lawn staples, as shown in photo 21 of Appendix G.
Table 5-1 summarizes the munitions-related finds from the Pilot Study.
Table 5-1: Pilot Study Munitions-Related Finds
Site Target # Depth (cm)
Description
4720 Quebec
94 30.5 MD, fragment, 8 inches long
129 7.6 MD, 3-inch diameter intact Stokes Mortar practice round
201 20.3 MD, fragment, 6 inches long
202 20.3 MD, fragment, 4 inches long

Spring Valley FUDS Final Pilot Study Report – Advanced Geophysical Classification April 2017
ERT, Inc. 55
6.0 CLASSIFICATION RESULTS Due to the small number of TOI found during in the Pilot Study, the classification results were analyzed for all properties combined, rather than individually. Receiver Operating Characteristic (ROC) Curves, clutter rejection rates, and correct classification of TOI and non-TOI were analyzed for each demonstrators’ classification process.
6.1 ROC Curves ROC curves are plots of the true positive rate against the false positive rate as a means to compare diagnostic tests. In general, for these Pilot Study data, the ROC curves show how well the data were classified. The ROC curves for each demonstrator are shown in Exhibits 6.1 and 6.2.
In the best-case scenario, the red line would go straight up the y-axis and then the green line would go horizontal at the total number of TOI. This would mean that the classifier correctly identified all TOI and all clutter. In most cases, however, some clutter will look like TOI, and as a result, the stop dig point will be offset from the axis by the number of clutter items that were incorrectly classified. In the ROC curves below, the different line colors represent different categories of targets:
Blue represents Training Digs (ground truth for targets requested by the demonstrator to help improve and/or verify their classifier).
Grey represents ‘Cannot Analyze’ targets: The processor deemed the data quality of these targets to be too poor to confidently classify.
Red represents High Confidence Digs: These targets are likely TOI. Yellow represents Lower Confidence Digs: These targets could be TOI.
Green represents High Confidence Do Not Dig: These targets should not be TOI.
Also displayed in the figures are a red ‘Stop Dig’ symbol, a black star to indicate the position of the native (not an emplaced seed) TOI, and an orange cross symbol to indicate a missed TOI.
Please note that two separate TEMTADS Target IDs were associated with the native Stokes Mortar. One of these was selected as a training dig and the other was selected as a TOI. This is the reason for the two black stars as well as the count of 14 total TOI in the TEMTADS ROC curve (Exhibit 6.2).
It is evident, based on the differences in the ROC curves, that the demonstrators approached the classification of the data very differently. The MPV classifier was relatively more aggressive and only classified one target as ‘Cannot Analyze’. The TEMTADS classifier, on the other hand, placed 164 targets into the ‘Cannot Analyze’ category, meaning the processor didn’t trust that the SNR was high enough to make an informed decision, due to the power line noise combined with many small amplitude targets. The processor stated that it is likely that the small amplitude targets are nothing, but could not reliably classify them as such because of uncertainty in the inversion results due to the noise.

Spring Valley FUDS Final Pilot Study Report – Advanced Geophysical Classification April 2017
ERT, Inc. 56
Exhibit 6.1: MPV ROC Curve for the Pilot Study
Exhibit 6.2: TEMTADS ROC Curve for the Pilot Study

Spring Valley FUDS Final Pilot Study Report – Advanced Geophysical Classification April 2017
ERT, Inc. 57
The MPV classifier was not as conservative on this point and classified many of these targets as non-TOI. Even if the number of ‘Cannot Analyze’ targets is ignored, the TEMTADS classifier takes more digs to get to the stop dig point. TEMTADS includes 101 targets classified as high or low confidence digs, while MPV only classified 40 targets as such.
The MPV missed one blind seed. The RCA for this failure is summarized in Section 6.5, and is supported by the location of the item in the ROC curve (Exhibit 6.1). A failure closer to the stop dig point would likely be a symptom of an overly aggressive classifier, but because the item is almost at the end of the classified and ranked list, it indicates that there is more likely an issue with the data, than there is with the classifier.
6.2 Clutter Rejection The ROC curves also provide a visual representation of the clutter rejection percentage based on the Pilot Study. This relates to the number of non-TOI that could be confidently left in the ground. The clutter rejection percentages for each AGC classifier are detailed in Table 6-1. The primary differentiator between the two datasets is the presence of ‘Cannot Analyze’ targets.
Table 6-1: Clutter Rejection Rates
System Number of
Cued Targets Number of
TOI Number of
Clutter Stop Dig
Point
Clutter Rejection
Percentage
MPV 500 13 487 50 digs 90%
TEMTADS 485 13 472 285 digs 41%*
* See Section 6.2.1.
6.2.1 Cannot Analyze Targets Additional analysis was performed to determine if a high percentage of the targets that resulted in ‘Cannot Analyze’ conclusions for the TEMTADS cued data were only detected by the MPV during the dynamic detection phase. The intent of this analysis is to provide a more accurate representation of the ‘Cannot Analyze’ rate that may be expected for a TEMTADS only survey. In this case, 46% of the TEMTADS ‘Cannot Analyze’ targets were not selected from the TEMTADS dynamic data, suggesting that the clutter rejection percentage would likely increase if TEMTADS were not responsible for cueing targets detected by the MPV.
If the TEMTADS ‘Cannot Analyze’ targets were instead classified as non-TOI, the clutter rejection rate for this dataset would increase to 77%. However, in this scenario there may be a greater chance that small TOI could be missed in high noise areas. The same may also be true for the low SNR targets within the MPV dataset.
6.3 Classification Accuracy for Blind Verification Seeds From the cued data, TEMTADS correctly classified all blind seeds, while the MPV incorrectly classified one detected item (Seed 16 was not detected and could not be correctly classified). A comprehensive RCA for this failure is included in Appendix D, and a summary is provided below in Section 6.5.

Spring Valley FUDS Final Pilot Study Report – Advanced Geophysical Classification April 2017
ERT, Inc. 58
The classification results for blind seeds are detailed in Tables 6-2 and 6-3. The two most difficult targets were Seeds 16 and 17. Both are large deep objects, at or beyond, the depth of detection defined in Section 3.5. This provides additional verification that the observed amplitude of the site specific noise results in limits to the depth of detection and classification.
The “Best Fit” items listed in the tables below represent the library item with the best fit to the cued data. Both demonstrators were using different cued data sets and different library data for this Pilot Study. Therefore, the “Best Fit” items for each dataset may be different from each other, and while these items may not be consistent with the nomenclature of the seed item, they are considered to be equivalent if they are of similar size and if the target was classified as ‘Dig’. With the exception of the difficult targets, the average horizontal and vertical offsets for both demonstrators are approximately 9 cm.

Spring Valley FUDS Final Pilot Study Report – Advanced Geophysical Classification April 2017
ERT, Inc. 59
Table 6-2: MPV Classification of Blind Seeds Property Blind
Seed #
Blind Seed Description
Seed Depth
(m)
Detection Phase
MPV Target
ID
MPV Target Easting
MPV Target
Northing
MPV Target Offset
(m)
MPV Target Depth
(m)
Depth Offset
(m)
MPV Best Fit
MPV Category
4720Q 12 75 mm 0.30 Detected SV-168 318547.89 4311927.76 0.11 0.25 0.05 75 mm Dig
13 Stokes Mortar 0.41 Detected SV-135 318540.53 4311933.97 0.04 0.4 0.01 Medium ISO Dig
14 Small ISO 0.1 Detected SV-25 318537.68 4311960.16 0.04 0.09 0.01 Small ISO Dig
15 M353 TPT projectile
0.30 Detected SV-120 318523.14 4311936.76 0.07 0.3 0.00 75 mm Dig
16 Large ISO 0.91 Missed by TT, MPV
SV-80 318559.44 4311951.45 0.76 0.59 0.32 BDU33 Training
4733W 7 75 mm 0.28 Missed by
TT SV-2162 318517.53 4311911.25 0.06 0.36 -0.08 81mm Mortar Training
8 Stokes Mortar 0.41 Detected SV-2047 318494.9 4311904.64 0.17 0.38 0.03 2.75in Rocket Training
9 Small ISO 0.20 Detected SV-2120 318510.68 4311930.9 0.12 0.29 -0.09 Small ISO Dig
10 Small ISO Not Required. Stainless steel pipe nipple is not detectable.
11 Medium ISO Not Required. Item is too close to an underground utility.
4740Q 17 75 mm 0.66 Missed by
TT SV-1076 318486.44 4311945.78 0.13 0.23 0.43 37mm Do Not Dig
18 75 mm proj. part
0.08 Detected SV-1084 318480.55 4311947.2 0.08 0.23 -0.15 90mm Dig
19 Small ISO 0.15 Missed by
MPV SV-1094 318484.66 4311952.47 0.12 0.11 0.04 MkIV booster Training
20 Medium ISO 0.18 Detected SV-1090 318481.94 4311951.29 0.04 0.3 -0.12 Medium ISO Dig
All blind seeds are inert items.

Spring Valley FUDS Final Pilot Study Report – Advanced Geophysical Classification April 2017
ERT, Inc. 60
Table 6-3: TEMTADS Classification of Blind Seeds Property Blind
Seed # Blind Seed Description
Seed Depth
(m)
Detection Phase
TT Target
ID
TT Target Easting
TT Target Northing
TT Target Offset (m)
TT Target
Depth (m)
Depth Offset
(m)
TT Best Fit TT Category
4720Q 12 75 mm 0.3 Detected SV-168 318547.97 4311927.77 0.10 0.25 0.05 105mm Dig
13 Stokes Mortar
0.41 Detected SV-135 318540.51 4311933.95 0.02 0.47 0.06 Stokes Mortar
Dig
14 Small ISO 0.1 Detected SV-25 318537.73 4311960.23 0.05 0.07 0.03 Small ISO Dig
15 M353 TPT projectile
0.3 Detected SV-120 318523.16 4311936.75 0.06 0.3 0.00 3 inch Proj Dig
16 Large ISO 0.91 Missed by TT, MPV
SV-80 318558.73 4311950.52 0.41 0.69 0.22 NA Cannot Analyze
4733W 7 75 mm 0.28 Missed by
TT SV-2162 318517.58 4311911.23 0.09 0.33 0.05 3 inch Proj
Cannot Decide, Dig
8 Stokes Mortar
0.41 Detected SV-2047 318494.87 4311904.61 0.13 0.4 0.01 105mm Training
9 Small ISO 0.20 Detected SV-2120 318510.76 4311930.8 0.04 0.27 0.07 Small ISO Cannot
Decide, Dig
10 Small ISO Not Required. Stainless steel pipe nipple is not detectable.
11 Medium ISO Not Required. Item is too close to an underground utility.
4740Q 17 75 mm 0.66 Missed by
TT SV-1076 318486.48 4311945.63 0.04 0.45 0.21 60mm
Cannot Decide, Dig
18 75 mm proj. part
0.08 Detected SV-1084 318480.52 4311947.21 0.09 0.21 0.13 3 inch Proj Dig
19 Small ISO 0.15 Missed by
MPV SV-1094 318484.62 4311952.35 0.01 0.4 0.25 3 inch Proj
Cannot Decide, Dig
20 Medium ISO 0.18 Detected SV-1090 318481.93 4311951.27 0.06 0.28 0.10 75mm Dig
All blind seeds are inert items.

Spring Valley FUDS Final Pilot Study Report – Advanced Geophysical Classification April 2017
ERT, Inc. 61
6.4 Classification of Native TOI Both demonstrators correctly classified the Stokes Mortar found at 4720 Quebec. The MPV Fit Item is listed as a BDU33 bomb which falls into the same size category as a 3-inch Stokes Mortar. The MPV data processor also confirmed that the polarizabilities are a good match to a Stokes, however the best match was to the BDU33. This is still considered to be a successful classification of the item. Table 6-4 summarizes the findings.
Table 6-4: Classification of Native TOI
Target #
Stokes Depth
(m) System
Cued Target
ID Target Easting
Target Northing
Target Offset
(m)
Target Depth
(m)
Depth Offset
(m) Best Fit Category
129 0.08
MPV 94 318555.08 4311945.04 0.14 0.2 0.12 BDU33 Dig
TEMTADS 96 318555.1 4311944.99 0.11 0.11 0.03 3"
Stokes Dig
6.5 Classification Measurement Quality Objectives As indicated in Table 6-5, only one MQO was specifically related to the classification of cued data.
Table 6-5: Cued Classification MQO Measurement
Quality Objective Frequency Acceptance Criteria Status Classification performance
Evaluated for all seeds
100% of QC and validation seeds placed on dig list
Achieved for TEMTADS. MPV missed one seed. NCR004 and RCA documented in Appendix D.
One NCR was issued during the cued data analysis and classification phase. The MPV demonstrator provided an RCA and recommended CA. The complete RCA/CA documents are provided in Appendix D, however a summary of this NCR is provided below.
6.5.1 NCR004 Blind seed #17 was incorrectly classified by the MPV. Seed # 17 is an inert 75mm at 1.88 ft depth, placed at the 4740 Quebec property. Exhibit 6.3 below shows the locations of various sources or “fits” derived from the cued data for targets #1077 and #1076. The seed itself was closer to #1076 and is indicated by the black cross. The polarizability curves (red, black and pink) with the best match to a 75mm (grey) are shown on the left. This is considered to be a very poor fit.

Spring Valley FUDS Final Pilot Study Report – Advanced Geophysical Classification April 2017
ERT, Inc. 62
Exhibit 6.3: MPV Misclassified Blind Seed Data
The root-cause of the missed seed (inert 75mm) classification was that the elevated noise values at the 4740 Quebec property were too high to reliably detect and classify a 75mm target at 57 cm with the MPV. It should be noted that 57 cm was the depth measured when the seed was emplaced, however, the depth measured during intrusive investigation was closer to 66 cm (this may have been the result of soft soil and sinking of the item from the original surveyed depth of 57 cm). The MPV estimated depth of detection for a 3-inch Stokes (similar in size to a 75mm) in the high noise conditions at this property, is 60 cm. Assuming that the depth of detection and the depth of classification are roughly equivalent, this data supports the RCA for this failure. The only applicable corrective action in this case is to revise the DQOs to be more representative of site specific detection and classifications limits.
Note that this seed also gave the TEMTADS problems during the detection phase and this root cause is consistent with that presented by the TEMTADS in response to NCR002.
6.6 Final Target Classifications The final target classifications for the TEMTADS and MPV data, showing ‘Dig’ or ‘Do Not Dig’ determinations at various levels of confidence, are shown in the detailed Appendix F-3 spreadsheets.

Spring Valley FUDS Final Pilot Study Report – Advanced Geophysical Classification April 2017
ERT, Inc. 63
Maps showing final TEMTADS target classification locations for the 4720, 4733, and 4740 properties, are presented as Figures 8, 17, and 26, respectively. Maps showing final MPV target classification locations for the 4720, 4733, and 4740 properties, are presented as Figures 9, 18, and 27, respectively.
Maps showing the combination of the MPV and TEMTADS final recommendations for the 4720, 4733, and 4740 properties, are presented as Figures 10, 19, and 28, respectively. These figures provide a useful picture of the recommended digs from both methods on a single figure, and also indicate where both instruments recommended a target be dug. The objective of these figures is to show the final targets recommended for digging, by each instrument, if this were an actual AGC project as opposed to this Pilot Study where all targets were dug.
Finally, figures 11, 20, and 29, provide a snapshot of selected targets, indicating what was predicted by each instrument, and what was actually found. These figures were developed by showing targets that both instruments recommended be dug (figures 10, 19, and 28 as discussed above), plus other significant targets (such as munitions-related items and blind seeds), whether they were recommended for digging or not.

Spring Valley FUDS Final Pilot Study Report – Advanced Geophysical Classification April 2017
ERT, Inc. 64
This Page Intentionally Left Blank

Spring Valley FUDS Final Pilot Study Report – Advanced Geophysical Classification April 2017
ERT, Inc. 65
7.0 COMPARATIVE ANALYSIS OF AGC METHODOLOGIES The Pilot Study assessed the performance of AGC methodologies using MPV and TEMTADS systems with a primary objective of evaluating whether AGC methodologies could be used to effectively meet the RAOs for the SVFUDS. The Study indicates that AGC methods were successfully used at the SVFUDS at three private properties, where 200+ targets per property were detected, classified, and intrusively investigated. Section 8.0 discusses the overall success of the Pilot Study with regard to the primary objective, providing a more detailed comparative analysis of AGC vs the traditional DGM methods historically performed at the SVFUDS using an EM61 and G-858 magnetometer.
A secondary objective of the Study was to determine which AGC system might be most effective for future remedial actions at the SVFUDS. The following discussions provide a comparative analysis of MPV and TEMTADS methodologies based on the SVFUDS Pilot Study findings. However, it is acknowledged that some of the differences observed in the detection and classification results may be due to analyst judgment or data processing methods and software used, as opposed to instrument performance. Therefore, the comparison is qualitative in nature because of the difficulty in separating out these factors. As provided in the approved UFP-QAPP DQOs, one of the goals of data collection was to answer the following question:
What AGC sensor platform (TEMTADS or MPV) is most effective for remediating the residential properties at the SVFUDS?
7.1 Advantages and Disadvantages of Each AGC Method A comparative analysis of MPV and TEMTADS methodologies, describing primary advantages and disadvantages of the two AGC methods, is summarized in Table 7-1. Following the table, additional discussion detailing Pilot Study specific findings and observations, is presented.
Table 7-1: MPV and TEMTADS Comparative Analysis Considerations Criterion MPV TEMTADS
Technical
Detection of Small Items
MPV can detect small items deeper than TEMTADS Not as effective as MPV
Detection of Large Items
Not as effective as TEMTADS
Can detect large items deeper than MPV
Reducing Number of Digs
On average, MPV produced a 90% clutter rejection rate (e.g., only 10 of 100 targets would be recommended for intrusive investigation, the rest being ‘clutter’)
TEMTADS resulted in only a 41% clutter rejection rate (59 of 100 targets would be recommended for intrusive investigation)
Signal to Noise Ratio
MPV provided a higher signal to noise ratio (strength of target signal relative to interference or noise-higher ratio is better) at the properties
Generally provided a lower signal to noise ratio at the properties than the MPV

Spring Valley FUDS Final Pilot Study Report – Advanced Geophysical Classification April 2017
ERT, Inc. 66
Table 7-1: MPV and TEMTADS Comparative Analysis Considerations Criterion MPV TEMTADS
False Positives Mapped significantly higher
numbers of anomalies in dynamic survey (many were verified to be noise related)
Fewer targets caused by noise
Blind Seed Detection
13 of 14 blind seeds detected during Dynamic survey
Blind seeds were mapped with lesser offset distances than TEMTADS
Only 9 of 14 blind seeds detected during Dynamic survey
Blind seeds were mapped with greater offset distances than MPV
Blind Seed Classification
Missed one blind seed (categorized as “do not dig”) based on cued data
All blind seeds categorized as “dig” based on cued data
Logistical/
Practical
Field Preparation Time
Generally requires that ropes and tapes be set up to ensure coverage
More efficient than MPV, can be operated using paint markers or bean bags as guides
Field Duration/ Efficiency
MPV Dynamic survey duration was 6 days
Minimum 3 field personnel are required for efficiency
TEMTADS Dynamic survey duration was slightly faster (5 days)
2 field personnel can do the survey efficiently
Maneuverability/ Instrument Coverage
Achieves greater coverage in and around vegetation and other obstacles
Coverage is lesser than MPV, limited to spaces where a sensor that is approximately 0.8m wide can fit.
Property Impacts Significantly less vegetation
needs to be impacted (plants removed/transplanted) relative to TEMTADS
TEMTADS requires more cleared acreage to operate relative to MPV
Availability of Equipment and Software
There are only 2 MPV units available (additional ones would need to be built)
Processing software was developed by BTG. Thus, there are few experienced processors and BTG may have to be part of the classification team.
There are 4 TEMTADS units available and the new MetalMapper 2x2 equivalent is now available commercially.
Software is commercially available and there are several experienced processors within the industry
Cost The MPV is estimated to cost $80,000-$100,000
The TEMTADS/MetalMapper 2x2 is approximately $100,000-$150,000
7.1.1 Detecting Deep TOI Exhibits 3.1 and 3.2 indicate how depth of detection varies with site noise. Overall, the MPV demonstrated the ability to detect small TOI such as the MkIV Booster deeper than the TEMTADS, or the EM61. Considering the site noise levels ranged from 0.17 mV/A to 2 mV/A, the minimum depth of detection of the MkIV Booster can range from 0.24m to 0.39m. However,

Spring Valley FUDS Final Pilot Study Report – Advanced Geophysical Classification April 2017
ERT, Inc. 67
if the TEMTADS data could be processed to reduce the effect of site noise, it is possible that it could achieve detection depths equivalent to that demonstrated by the MPV.
The depth of detection with any system is related to the amount of site noise; however, the TEMTADS demonstrated the greatest depth of detection for large, deep objects. Based on the range of noise observed during the Pilot Study, the minimum depth of detection can range from 0.6m to 1.2m. If the orientation of the projectile is more favorable it can be seen deeper than these depths. If it is necessary to detect large objects deeper than this, the G-858 magnetometer, used in combination with an AGC instrument would be recommended. In this situation, rules would need to be developed to describe to process for dealing with magnetic and EM anomalies. For example, it would have to be determined whether it would be acceptable to leave magnetic anomalies in the ground, if the AGC data classified the item as a non-TOI.
7.1.2 Minimizing the Number of Intrusive Investigations During this Pilot Study, the 90% clutter rejection rate (e.g., only 10 of 100 targets would be recommended for digging) for the MPV data was superior to the 41-77% clutter rejection rate for the TEMTADS. Based on this data point alone, the MPV would require significantly less intrusive work on a property, reducing time on site and the associated costs of additional digging.
However, the TEMTADS analysis was very conservative and considered targets that were in high noise areas as ‘Cannot Analyze’, to ensure nothing was missed. As the more aggressive MPV process may not have accounted for the risk of missing small TOI in areas of high noise in the same manner as the TEMTADS, the upper end of the TEMTADS clutter rejection rate, 77%, was used for comparative purposes for this Study (the more conservative TEMTADS classification procedure could likely be modified to increase the clutter rejection rate based on the Pilot Study data). Note that since the MPV had lower noise levels, it would not likely have had as many ‘Cannot Analyze’ determinations as the TEMTADS, and so the MPV is still considered much more favorable with regard to minimizing the number of digs.
7.1.3 Blind Seed Detection and Classification The MPV detected 13 of the 14 blind seeds during the Dynamic survey, and they were mapped with lesser offset distances than the TEMTADS, which only detected 9 of the 14 blind seeds. However, the MPV missed one blind seed (i.e., categorized it as “do not dig”) based on the Cued data. This is described in detail in NCR 004 (Section 6.5 and Appendix D). The TEMTADS categorized all blind seeds as “dig” based on Cued data.
7.1.4 Instrument Coverage and Property Impacts As a function of acreage covered by the instrument, with minimal disturbance to the existing property, the MPV is significantly better than the TEMTADS (see Table 2-10 for instrument coverage of each property). The MPV is able to obtain data much closer to obstacles and allows the operator to situate the positioning sensor and maximize coverage with a single RTS setup. The MPV can maneuver between close trees and low-lying vegetation without harming them, producing a significant advantage with regard to vegetation and landscaping impacts. The TEMTADS requires more cleared acreage to operate. Based on the experience of the Pilot Study, this could be a significant factor for the full scale future remediation of the SVFUDS.

Spring Valley FUDS Final Pilot Study Report – Advanced Geophysical Classification April 2017
ERT, Inc. 68
7.1.5 Availability of Equipment and Trained Processors At this time, there are only two MPV systems in existence, both owned by BTG. It is assumed that additional systems could be built, particularly if a commitment was made by USACE, but the details are not certain. There are at least four TEMTADS units in existence similar to the one used during this Pilot Study; however, the commercial model produced by Geometrics (MetalMapper 2x2) has recently become available. It is assumed that the quality of the new MetalMapper 2x2 will be greater than or equivalent to the TEMTADS used for the Study.
The only software capable of processing MPV data at this time is UXOLab, software that was developed by BTG. While UXOLab has been made available to industry and USACE personnel, the number of experienced MPV processors available is limited, and BTG may have to be associated with future remedial activities using the MPV. TEMTADS data can be processed using the Geosoft Oasis montaj UX-Analyze Advanced extension. At this time the tools required to process dynamic data are not available, but are expected to be released by early 2017. There are several geophysicists in the industry that have been trained to process TEMTADS data, however it is unclear how many companies will be accredited to perform this work.
7.1.6 Cost and Level of Effort The Pilot Study incorporated the efforts of five separate contractors. As a result, the level of effort (LOE) and cost could not be tracked consistently for all phases of work and the ability to provide a quantitative cost analysis was limited. The MPV, with a cost estimated at $80,000-$100,000, is likely to be less expensive than the commercially available MetalMapper 2x2 (TEMTADS equivalent), at approximately $100,000-$150,000. These costs are estimated and are not based on quotes from vendors. However, the future remedial activities at the SVFUDS would not necessarily require a large number of units as the amount of production work that could be done concurrently will be limited by the need to obtain Rights-of-Entry for individual properties. That is, an economy of scale discount for these units is unlikely to be supported.
7.1.6.1 AGC Data Collection, Processing, Classification LOE The MPV requires more setup time for dynamic data collection, relative to the TEMTADS, because ropes must be laid out to guide the operator. This extra time may be recovered based on the MPV instrument’s ability to maximize coverage from a single RTS setup. Based on observations made during the Pilot Study, the TEMTADS required more RTS setups than the MPV. Each RTS setup takes approximately 20 to 30 minutes; therefore, the ability to minimize the number of times the system must be taken down and setup again is significant. For cued data collection, the LOE for both systems is very similar, assuming the targets have been reacquired ahead of time. The MPV instrument’s ability to reacquire in real time is advantageous if single target flags have been lost or removed, as happened during the Study, because it can eliminate the need for reacquisition. The MetalMapper 2x2 may also have this capability.
Summarizing information from Section 2.6, on average, for properties the size of those in the Pilot Study, it is estimated that 2 to 4 days will be required to complete dynamic and cued data collection using either system. This is likely similar to the production rate for collecting data using both the EM61 and G-858 instruments on each property.
In general, the dynamic source selection process utilized by the MPV processors took longer than the amplitude selection process utilized by the TEMTADS processors. However, this

Spring Valley FUDS Final Pilot Study Report – Advanced Geophysical Classification April 2017
ERT, Inc. 69
increase in LOE is justified based on the increased accuracy and potential reduction in cued target locations for the MPV. The data processing LOE for AGC data can be much greater than that for traditional DGM methods. Cued data processing is typically performed using scripts and can be streamlined, however, the final classification decisions will take additional time. This amount of time will vary depending on the classification process. Another important consideration for AGC data processing is that time must be allotted for Data Usability Assessments (DUAs) between phases of work to ensure that the DQOs are being achieved.
7.2 Comparative Analysis Conclusions Comparative analysis of both AGC instruments indicates that there is no strong preference for one method over the other. As Table 7-1 indicates, of the 13 criteria examined, seven favored the MPV and six favored the TEMTADS. However, assessing favorability for some criteria was dependent on certain assumptions about future actions and it is not known whether those assumptions will ultimately be supported. In addition, some criteria were considered more impactful than others. Thus, an informal qualitative weighting of some of the criteria was used to help differentiate between the methods.
Of the seven criteria under ‘Technical’ considerations, the MPV was favorable for four of them. One of those, “Reducing the number of digs” was considered to carry more weight than the others, and the MPV significantly reduced the number of digs that would be required on a given property, relative to the TEMTADS. Of the six ‘Logistical/Practical’ criteria, three were favorable for the MPV and three were favorable for the TEMTADS. Two of the six criteria, “Property Impacts” and “Availability of Equipment” were considered to carry more weight than the others. The MPV significantly minimizes the overall negative impact on a property relative to the TEMTADS by reducing the amount of vegetation removal, an advantage significant beyond the cost savings, as fewer home owner meetings, less landscaper planning, fewer unknowns regarding the success of transplanted vegetation, and less time overall occupying a given property, will be required. This will ultimately contribute to community goodwill across a large-scale project that may take several years to complete.
The fact that the TEMTADS (or MetalMapper 2x2) is more commercially available and has readily available software was also a significant factor. However, for this Study, it was assumed that the necessary number of MPV units would become available, and that an accommodation of software or processor personnel needs would be made, should USACE committed to this approach for full-scale remediation of the SVFUDS, i.e., these disadvantages could be overcome by a USACE commitment to use the MPV for remediation purposes.
In summary, while the MPV technology appears to have a slight advantage over the TEMTADS based on the above analysis, given the lack of a clear preference for one methodology over the other and the unknowns associated with the various assumptions that could impact the choice, it is concluded that either technology could be effectively utilized to meet the RAOs for the SVFUDS.
With regard to the need to detect larger items at greater depths than either AGC method could achieve, the G-858 magnetometer, historically used at the SVFUDS to investigate for the presence of pits and trenches, could continue to be deployed to supplement the AGC technology. The G-858 has a relatively small footprint (similar to the MPV) and significantly better maneuverability than the traditional EM61.

Spring Valley FUDS Final Pilot Study Report – Advanced Geophysical Classification April 2017
ERT, Inc. 70
This Page Intentionally Left Blank

Spring Valley FUDS Final Pilot Study Report – Advanced Geophysical Classification April 2017
ERT, Inc. 71
8.0 CONCLUSIONS AND RECOMMENDATIONS The Pilot Study assessed the performance of AGC methodologies using MPV and TEMTADS systems with a primary objective of evaluating whether AGC methodologies could be used to effectively meet the RAOs for the SVFUDS. This section discusses the overall success of the Pilot Study with regard to the primary objective, providing a more detailed comparative analysis of AGC vs the traditional DGM methods historically performed at the SVFUDS using an EM61 and G-858 magnetometer.
As provided in the approved UFP-QAPP DQOs, the primary goal of data collection was to answer the following question:
Can classification be used effectively to meet the RAOs for the SVFUDS?
The success of the Pilot Study with regard to answering this question is assessed relative to achievement of the DQOs and MQOs.
8.1 Data and Measurement Quality Objectives The approved decision rules for drawing conclusions from the study findings were as follows:
If the data quality of both the detection and cued data are verified and validated, and the demonstrator’s classified and ranked dig list results in a reduction in the number of unnecessary intrusive investigations without incorrectly classifying a TOI, then AGC technology will be considered a potentially effective tool for the SVFUDS.
If the quality of either the detection or cued data cannot be verified or validated, or if the demonstrator incorrectly classifies TOI, an RCA will be performed.
If the RCA results in a finding that site-specific conditions prevented the data quality from being acceptable, or prevented the TOI from being correctly classified, then AGC technology may not be an effective tool for the SVFUDS.
8.1.1 DQO and MQO Achievement Sections 3.7 and 6.5 discuss challenges to achieving MQOs during the Pilot Study. The RCA and proposed corrective actions are discussed in these sections. With the exception of NCR001 (resolved by modifying procedures), the primary causes for the non-conformances were depth of detection limitations combined with site and sensor specific noise. Site-specific conditions did prevent some TOI from being detected and correctly classified in these cases; the implications are further analyzed below to determine if AGC technology should be considered an effective tool for future SVFUDS remedial actions.
The depths of detection for various munitions (for each instrument) based on the site specific noise observed during this demonstration, are detailed in Exhibits 3.1, 3.2, and 3.3. The DQO for depth of detection was based on detecting a MKIV Booster at a depth of 1 foot below ground surface. (Note that there was no DQO related to larger items, but this is recommended for future work). The MPV achieves this depth of detection metric in the minimum noise environments on all properties, however fails to meet this metric in the maximum noise environments at 4733 Woodway and 4740 Quebec. This is also true for the TEMTADS, but additionally, this metric

Spring Valley FUDS Final Pilot Study Report – Advanced Geophysical Classification April 2017
ERT, Inc. 72
was not met in the minimum noise conditions for this system at 4733 Woodway (the noisiest property). Based on these results, in order for AGC technology to be considered effective at SVFUDS, the following actions must occur:
1. The DQOs must be modified to better define the detection limitations of the AGC sensors in the variable noise conditions present at SVFUDS.
2. A secondary sensor (e.g., the G-858) must be utilized to detect TOI deeper than the AGC sensors, and rules must be developed to determine how this secondary dataset will be used in coordination with the AGC data.
It is concluded that although site-specific conditions did present challenges to the effective use of AGC, these challenges can be overcome by implementing the suggested actions above.
8.2 AGC Methods Compared to Traditional Geophysical Methods As an initial step in developing recommendations for future remedial activities at the SVFUDS, a brief review of how AGC methods, in general, compare to the traditional DGM methods, is provided. The Pilot Study assessed the performance of AGC methodologies using MPV and TEMTADS systems. Traditional DGM at the SVFUDS historically was performed using an EM61 and G-858 magnetometer.
The primary objective was to evaluate whether AGC provides distinct advantages, relative to traditional DGM, to effectively meet the RAOs for the SVFUDS. The advantages and disadvantages of using AGC methods rather than traditional EM61 and G-858 methods are detailed in Table 8-1.
Table 8-1: Advantages of AGC Methodology Over Traditional DGM Methodology
Advantage Disadvantage
Multiple receiver cubes allow for greater resolution of detected anomalies, and combined with more advanced positioning systems, result in improved accuracy of detected target positions.
The amount of time required for data collection and processing is greater for AGC than for traditional methods (but this may be offset but the reduction in time spent on intrusive investigation).
Depth of detection for smaller items may be greater.
A magnetometer (a traditional approach), such as the G-858, will be able to see large items deeper than the AGC (or EM61) systems.
As much as 90% of clutter can confidently be left in the ground, drastically reducing the damage to properties and the renovation costs.
Cost of acquiring AGC systems is greater than that for acquiring traditional systems.
Affords increased data density and quality, which results in higher confidence in the removal action if verification and validation procedures are implemented.
More sophisticated processing software and personnel are required for AGC systems.
Advance processing techniques may result in the ability to reduce the effect of site-specific noise.
Comparing intrusive results to modeled sources for all targets increases the confidence in the process.

Spring Valley FUDS Final Pilot Study Report – Advanced Geophysical Classification April 2017
ERT, Inc. 73
8.2.1 AGC Advantages As Table 8-1 shows, AGC provides advantages over the traditional DGM methodologies used at the SVFUDS in terms of higher resolution sensors, greater positional accuracy, and better survey metrics using tighter spacing. Large anomaly sources such as utilities and buildings lead to saturated responses that are generally reduced with AGC. These factors result in improved accuracy of detected target positions and will provide an overall higher confidence level in removal actions.
8.2.1.1 Stokes Mortar Example An example illustrating the advantages AGC methods relative to traditional methods is seen in the Stokes Mortar TOI find at 4720 Quebec during the Pilot Study (Section 3.6.2). The Stokes Mortar was also detected (by both the EM61 and G-858) during the previous investigations (2007-2009). However, the EM61 survey recorded a saturated area and thus, no target was picked. The G-858 magnetometer recorded a distinct anomaly, but at that time, as it was considered a ‘mag-only’ target, it was classified as ‘not indicative of MEC’, and it was not recommended for intrusive investigation. It is acknowledged that the objectives for the previous investigation were not the same as those for a removal action, and that if the traditional methods were applied to a removal action, all detected anomalies would likely be investigated, and the Stokes would have been recovered back then.
Nevertheless, based on the accuracy of the demonstrator’s classification of this target, where both the MPV and TEMTADS correctly classified the Stokes Mortar for this Pilot Study, it is clear that the confidence in the ability to detect and identify this TOI is much higher using AGC technology, and it can be concluded that the AGC methods provide higher quality data than traditional methods. The AGC advantages are primarily due to the increase in data resolution and positional accuracy that is afforded by the AGC sensors used in conjunction with the RTK/RTS. The buildings, utilities and other sources of noise present throughout the SVFUDS introduce saturated response areas that make detection of individual targets difficult. In these types of environments data resolution and positional accuracy are critical for increasing the likelihood of detecting TOI.
The 2007-2009 data for the EM61 and G-858 relative to the Stokes Mortar is shown in Exhibit 8.1. When these data are compared to the data for the two AGC systems shown in Exhibit 8.2, the difference in target resolution is evident.

Spring Valley FUDS Final Pilot Study Report – Advanced Geophysical Classification April 2017
ERT, Inc. 74
Exhibit 8.1: Stokes Mortar Data – G-858 (left) and EM61
Exhibit 8.2: Stokes Mortar Data – MPV and TEMTADS

Spring Valley FUDS Final Pilot Study Report – Advanced Geophysical Classification April 2017
ERT, Inc. 75
8.3 Lessons Learned While the findings of the Study indicate that AGC technology can be advantageous for future remedial actions within the SVFUDS, this discussion highlights some of the larger challenges that were encountered; it does not include discussion of every technical/logistical hurdle that had to be negotiated to complete the work, such as equipment failures or details of all permitting requirements or home owner involvement with vegetation clearance or landscape impacts.
8.3.1 Acceptance of Leaving Metallic Items in the Ground Since one of the primary objectives of AGC is to reduce the number of intrusive investigations (digs) required, AGC will leave more metal in the ground than traditional methods where most if not all metallic anomalies are dug. This is a key issue with regard to stakeholder acceptance, whether regulators or the community. To ensure that the methods for determining which items are not intrusively investigated are acceptable to all involved parties, clear DQOs, as well as the verification and validation processes, must be developed in coordination with all stakeholders. While there are limits to any technology, as discussed in this report, AGC technology ultimately provides increased confidence in the ability to detect and classify TOI such that items left in ground can be assumed to be innocuous metallic items.
8.3.2 Site Preparation Civil property surveys must be obtained earlier in the process, to properly identify fence ownership, border plant ownership, etc. The surveys should be completed before or in conjunction with arborist appraisal, and the surveyor may need multiple mobilizations to support accessible areas determinations and landscape removal decisions (i.e., some could not be made until property lines were clearly delineated) and to survey blind seeds.
Agreement with the property owner and Partners, relative to minimum accessibility DGM survey coverage of the property, must be established
Sufficient time must be allotted for permitting of DC public spaces (required for sidewalks in front of the properties, as applicable).
Utilities (underground and overhead) must be thoroughly mapped early on, not just prior to intrusive work. This may help evaluate interference effects.
8.3.3 Survey System With regard to establishing location, an important issue was the use of the appropriate survey system, RTS vs RTK GPS. The Pilot Study showed that either system can work, but obviously properties with less open space will present more problems for RTK GPS.
It will also be critical to ensure there are sufficient points to establish location. Based on the Pilot Study, for RTK GPS, a minimum of two points per property is recommended, while for RTS three points in the front yard and three in the backyard of each property is a reasonable minimum for efficient RTS operation.

Spring Valley FUDS Final Pilot Study Report – Advanced Geophysical Classification April 2017
ERT, Inc. 76
8.3.4 Geophysical System Verification IVS items should be placed at reasonable depths of detection. The purpose of the IVS is not to determine the depth of detection, but rather to confirm that the AGC system is working correctly.
ISOs are recommended for verification and validation blind seeds. The standard black steel pipe nipples defined in the ESTCP Guidance “Geophysical System Verification (GSV): A Physics-Based Alternative to Geophysical Prove-Outs for Munitions Response, Addendum – September 24, 2015” should be utilized to avoid detection issues based on material properties. Stainless steel seeds should not be utilized
Potential interference effects should be evaluated before placing blind seeds; making them hard to find may improve performance, but too hard to find may reduce data confidence.
8.3.5 Noise The site noise observed during the Pilot Study had the greatest impact on the quality of the AGC data. The site noise was found to vary spatially and temporally. As a result, flexibility should be introduced into project DQOs and MQOs to allow for variable site conditions. Target selection thresholds should be defined to maximize depth of detection based on the site specific noise for each property. Additional processing steps should also be explored to determine if the noise can be reduced digitally.
8.4 Recommended Procedures for Future Work In order to obtain the highest quality classification results, the following suggestions or procedures may need to be implemented for the future SVFUDS remedial work based on lessons learned during the Pilot Study. Some of these are specific to one instrument, but most apply to AGC procedures in general:
Project DQO’s should consider the variable depth of detection for small and large TOI based on site specific noise.
The UFP-QAPP Guidance should be followed for blind seeding. o Blind seeds should be placed shallower than the minimum depth of detection. o Blind QC seeds must be detectable as defined by the DQOs and located
throughout the horizontal and vertical survey boundaries defined in the DQOs. o Blind QC seeds should be distributed such that the field team can be expected to
encounter between one and three seeds per day per team. o Based on production rates observed during this Pilot Study there should be at least
2 blind seeds per property. o Variable rate QA seeding should also be implemented on each property. o Stainless steel seeds should not be used for classification.
Dynamic data should be positioned with RTS or RTK GPS rather than fiducially. Line spacing should be maintained at 0.5m for MPV and no greater than 0.6 m for the
TEMTADS as measured from the center of the sensor (not each receiver cube). Additional consideration should be given to processing techniques that may result in
increased SNR in the dynamic data. Processors should consider selecting amplitude targets on gridded data, rather than on
profiles, to eliminate duplicate picks.

Spring Valley FUDS Final Pilot Study Report – Advanced Geophysical Classification April 2017
ERT, Inc. 77
Advanced source selection is recommended to improve the accuracy of cued flag locations and eliminate targets that do not meet conservative size requirements.
The process for determining which cued data fall into the “Cannot Analyze” category should be well defined, and the limits to the decisions should be made clear to all stakeholders.
Data Usability Assessments: DUAs should be written and approved after each phase of work. This will ensure that the data are acceptable for achieving the project DQOs and will prevent unnecessary rework in the event of a failure.
8.4.1 Verification/Validation Verification/Validation: Verification/validation should be developed with stakeholders and regulators and performed in accordance with the UFP-QAPP guidance. The level of effort and cost for verification and validation of the data will be greater for AGC methods compared to traditional DGM, as a result of using more complex processes. Implementing these processes will impact cost and schedule and must be considered during project planning. Verification/Validation processes recommended for future efforts, include the following:
Verification/validation Seeding: Verification Seeds describe seeds placed by the contractor performing the work. These serve as an internal QC check. Validation Seeds are seeds emplaced by the government or a third party. These serve as a QA check, and have more serious consequences if one is missed. For this Pilot Study only Verification Seeds were utilized.
Verification/Validation Digs: These are additional intrusive investigations that are performed beyond the “stop dig” point on the classified and ranked list. While it is common within the industry for the next 50 to 200 targets to be investigated to verify that the classifier was not too aggressive, these numbers are too large to be used on a property by property basis. Due to the size of the properties and the expected number of targets, a reasonable verification and validation approach would be to utilize percentages of detected anomalies. Regulators and Stakeholders should provide input when defining the percentage of required verification/validation digs; this can be further refined in the UFP-QAPP development planning stages. However the following percentages are recommended:
o Verification digs should consist of 10% of the total cued target population. The highest ranking non-TOI should be investigated to verify the stop dig threshold.
o Validation digs should consist of 5% of the total cued target population. These should be randomly selected from the non-TOI population and the relative size and shape of the intrusive results should be compared to the classification results to ensure they are consistent.
o USACE should consider developing rules to prevent Verification and Validation digs from unnecessarily increasing the costs. For example, consider that no verification/validation digs will be selected in hardscape locations.
8.5 Accreditation It is understood that ISO 17025 Accreditation will be required for AGC work starting in 2017. Accredited companies will have demonstrated capability to successfully implement procedures that align with the government’s interpretation of the ISO standard. Accreditation is not

Spring Valley FUDS Final Pilot Study Report – Advanced Geophysical Classification April 2017
ERT, Inc. 78
instrument specific, but it does require all subcontractors to fall under the quality management system of the accredited company. The requirements for ISO 17025 include stop work requirements that may impact project schedule and cost. This will need to be considered when planning the future remedial actions for the SVFUDS.
8.6 Conclusions AGC methods employing MPV and TEMTADS systems were successfully used at the SVFUDS. For three private properties, 200+ targets per property were detected, classified, and intrusively investigated. Four MD items, including one intact Stokes Mortar (determined to be an unfuzed practice round), were found. As a Pilot Study, all targets were dug, regardless of the final AGC classification of the item.
In general, while there were challenges with noise in an urban environment, the findings of this Pilot Study support the implementation of AGC methods over the traditional DGM methods for future SVFUDS remedial actions. With regard to performance of the individual AGC methodologies, while the MPV technology appears to have a slight advantage over the TEMTADS, given the lack of a strong preference for one system over the other, it is concluded that either technology could be effectively utilized to meet the RAOs for the SVFUDS.
Finally, with regard to the need to detect larger items at greater depths than either AGC system could achieve, AGC methodologies could be supplemented by traditional DGM technology, such as the G-858, to address deeper targets.
8.7 Recommendations The findings of this Pilot Study support the implementation of AGC methods over traditional DGM methods for future SVFUDS remedial actions. The specific AGC methodology to be implemented should be refined through the planning process, considering the recommended procedures presented in Section 8.4, as well as input from project stakeholders.

Spring Valley FUDS Final Pilot Study Report – Advanced Geophysical Classification April 2017
ERT, Inc. 79
9.0 REFERENCES USACE, 2007. Site-Wide Work Plan for the SVFUDS, Final, March 2007.
USACE, 2010. Site Specific Anomaly Investigation Report for 4720 Quebec Street. Prepared by Parsons. September.
USACE, 2011a. Site Specific Anomaly Investigation Report for 4740 Quebec Street. Prepared by Shaw Environmental, Inc. April.
USACE, 2011b. Site Specific Anomaly Investigation Report for 4733 Woodway Lane. Prepared by Shaw. November.
USACE, 2015. Site-Wide Remedial Investigation Report for the SVFUDS, Final, June.
USACE, 2016a. Site-Wide Feasibility Study Report for the SVFUDS, Final, January.
USACE, 2016b. Site-Wide Proposed Plan for the SVFUDS, Final, June.
USACE, 2016c. Advanced Geophysical Classification for Munitions Response Uniform Federal Policy Quality Assurance Project Plan (UFP-QAPP) for Munitions Response, Final March.

Spring Valley FUDS Final Pilot Study Report – Advanced Geophysical Classification April 2017
ERT, Inc.
This Page Intentionally Left Blank

Spring Valley FUDS Final Pilot Study Report – Advanced Geophysical Classification April 2017
ERT, Inc. A-1
Appendix A: Figures
Figure 1 – SVFUDS Location Map Figure 2 - Pilot Study Properties Figure 3 - TEMTADS Dynamic Data Targets, 4720 Q St. Figure 4 - MPV Dynamic Data Targets, 4720 Q St. Figure 5 – Supplemental EM61 Data, 4720 Q St. Figure 6 - Targets That Were Cued, 4720 Q St. Figure 7 - Final Dig Targets, 4720 Q St. Figure 8 - TEMTADS Classification of Targets, 4720 Q St. Figure 9 - MPV Classification of Targets, 4720 Q St. Figure 10 - MPV and TEMTADS Classification of Targets, 4720 Q St. Figure 11 - Summary of Selected Targets, 4720 Q St. Figure 12- TEMTADS Dynamic Data Targets, 4733 W Ln. Figure 13- MPV Dynamic Data Targets, 4733 W Ln. Figure 14- Supplemental EM61 Data, 4733 W Ln. Figure 15- Targets That Were Cued, 4733 W Ln. Figure 16 - Final Dig Targets, 4733 W Ln. Figure 17- TEMTADS Classification of Targets, 4733 W Ln. Figure 18- MPV Classification of Targets, 4733 W Ln. Figure 19 - MPV and TEMTADS Classification of Targets, 4733 W Ln. Figure 20- Summary of Selected Targets, 4733 W Ln. Figure 21- TEMTADS Dynamic Data Targets s, 4740 Q St. Figure 22- MPV Dynamic Data Targets, 4740 Q St. Figure 23- Supplemental EM61 Data, 4740 Q St. Figure 24- Targets That Were Cued, 4740 Q St. Figure 25- Final Dig Targets, 4740 Q St. Figure 26- TEMTADS Classification of Targets, 4740 Q St. Figure 27- MPV Classification of Targets, 4740 Q St. Figure 28- MPV and TEMTADS Classification of Targets, 4740 Q St. Figure 29- Summary of Selected Targets, 4740 Q St.

Spring Valley FUDS Final Pilot Study Report – Advanced Geophysical Classification April 2017
ERT, Inc. A-2
This Page Intentionally Left Blank

Spring Valley FUDS Final Pilot Study Report – Advanced Geophysical Classification April 2017
ERT, Inc. B-1
Appendix B: IVS and Blind Seed Installation Memoranda
Appendix B-1. IVS Memorandum Appendix B-2. Blind Seed Installation Memorandum

Spring Valley FUDS Final Pilot Study Report – Advanced Geophysical Classification April 2017
ERT, Inc. B-2
This Page Intentionally Left Blank

Spring Valley FUDS Final Pilot Study Report – Advanced Geophysical Classification April 2017
ERT, Inc. B-3
Appendix B-1:
IVS Memorandum

Spring Valley FUDS Final Pilot Study Report – Advanced Geophysical Classification April 2017
ERT, Inc. B-4
This Page Intentionally Left Blank

Spring Valley FUDS Final Pilot Study Report – Advanced Geophysical Classification April 2017
ERT, Inc. B-5
Appendix B-2:
Blind Seed Installation Memorandum

Spring Valley FUDS Final Pilot Study Report – Advanced Geophysical Classification April 2017
ERT, Inc. B-6
This Page Intentionally Left Blank

Spring Valley FUDS Final Pilot Study Report – Advanced Geophysical Classification April 2017
ERT, Inc. C-1
Appendix C: Verification Documentation
Appendix C-1. TPC Checklists Appendix C-2. Daily Geophysical Quality Control Reports Appendix C-3. SUXOS Daily Reports

Spring Valley FUDS Final Pilot Study Report – Advanced Geophysical Classification April 2017
ERT, Inc. C-2
This Page Intentionally Left Blank

Spring Valley FUDS Final Pilot Study Report – Advanced Geophysical Classification April 2017
ERT, Inc. C-3
Appendix C-1:
TPC Checklists

Spring Valley FUDS Final Pilot Study Report – Advanced Geophysical Classification April 2017
ERT, Inc. C-4
This Page Intentionally Left Blank

Spring Valley FUDS Final Pilot Study Report – Advanced Geophysical Classification April 2017
ERT, Inc. C-5
Appendix C-2:
Daily Geophysical Quality Control Reports

Spring Valley FUDS Final Pilot Study Report – Advanced Geophysical Classification April 2017
ERT, Inc. C-6
This Page Intentionally Left Blank

Spring Valley FUDS Final Pilot Study Report – Advanced Geophysical Classification April 2017
ERT, Inc. C-7
Appendix C-3:
SUXOS Daily Reports

Spring Valley FUDS Final Pilot Study Report – Advanced Geophysical Classification April 2017
ERT, Inc. C-8
This Page Intentionally Left Blank
Spring Valley FUDS Final Pilot Study Report – Advanced Geophysical Classification April 2017
ERT, Inc. D-1
Appendix D: Non-Conformance and Root Cause Analysis Reports

Spring Valley FUDS Final Pilot Study Report – Advanced Geophysical Classification April 2017
ERT, Inc. D-2
This Page Intentionally Left Blank

Spring Valley FUDS Final Pilot Study Report – Advanced Geophysical Classification April 2017
ERT, Inc. E-1
Appendix E: Dig Sheets

Spring Valley FUDS Final Pilot Study Report – Advanced Geophysical Classification April 2017
ERT, Inc. E-2
This Page Intentionally Left Blank

Spring Valley FUDS Final Pilot Study Report – Advanced Geophysical Classification April 2017
ERT, Inc. F-1
Appendix F: Final Target Lists
Appendix F-1. Final CUED Target Lists Appendix F-2. Final Dig Target Lists Appendix F-3. Final Target Classification Lists

Spring Valley FUDS Final Pilot Study Report – Advanced Geophysical Classification April 2017
ERT, Inc. F-2
This Page Intentionally Left Blank

Spring Valley FUDS Final Pilot Study Report – Advanced Geophysical Classification April 2017
ERT, Inc. F-3
Appendix F-1:
Final CUED Target Lists

Spring Valley FUDS Final Pilot Study Report – Advanced Geophysical Classification April 2017
ERT, Inc. F-4
This Page Intentionally Left Blank
Spring Valley FUDS Final Pilot Study Report – Advanced Geophysical Classification April 2017
ERT, Inc. F-5
Appendix F-2:
Final Dig Target Lists

Spring Valley FUDS Final Pilot Study Report – Advanced Geophysical Classification April 2017
ERT, Inc. F-6
This Page Intentionally Left Blank

Spring Valley FUDS Final Pilot Study Report – Advanced Geophysical Classification April 2017
ERT, Inc. F-7
Appendix F-3:
Final Target Classification Lists

Spring Valley FUDS Final Pilot Study Report – Advanced Geophysical Classification April 2017
ERT, Inc. F-8
This Page Intentionally Left Blank

Spring Valley FUDS Final Pilot Study Report – Advanced Geophysical Classification April 2017
ERT, Inc. G-1
Appendix G: Photo Log

Spring Valley FUDS Final Pilot Study Report – Advanced Geophysical Classification April 2017
ERT, Inc. G-2
This Page Intentionally Left Blank