final paper: abs0059 csir built environment, pretoria
TRANSCRIPT
Final Paper: ABS0059 Reconsideration of tyre-pavement input parameters for the structural design of flexible pavements M De Beer CSIR Built Environment, Pretoria, South Africa e-mail: [email protected] ABSTRACT: Pavement/vehicle interaction is one of the growing areas in asphalt pavement design. Traffic volumes have increased considerably over the past few decades, and not only are modern trucks carrying heavier payloads, but they are also using fewer tyres which have higher inflation pressures and hence higher contact stresses than was previously the case. The aim of this paper is to highlight the variabilities associated with actual measured three-dimensional tyre-pavement contact loading/stress regimes of modern truck tyres. Tyre-pavement contact stress measurements were carried out on a busy national road (N3) in South Africa from the port of Durban to the inland province of Gauteng. The three-dimensional tyre-pavement contact stress regimes of 45 227 individual tyres were measured using the Stress-In-Motion (SIM) system. In addition, the loading on each tyre was also captured. This measurement series was performed at slow (< 5 km/hr) creep speed conditions at a controlled weigh-bridge as part of the N3 Traffic Control Centre (N3-TCC) near Heidelberg in SA. Mechanistic Analysis indicated that near surface Strain Energy of Distortion (SED) may be utilised for pavement rutting studies in this asphalt layers.
KEY WORDS: Contact Stresses, Interaction, Pavement, Trucks, Tyres.
1 INTRODUCTION
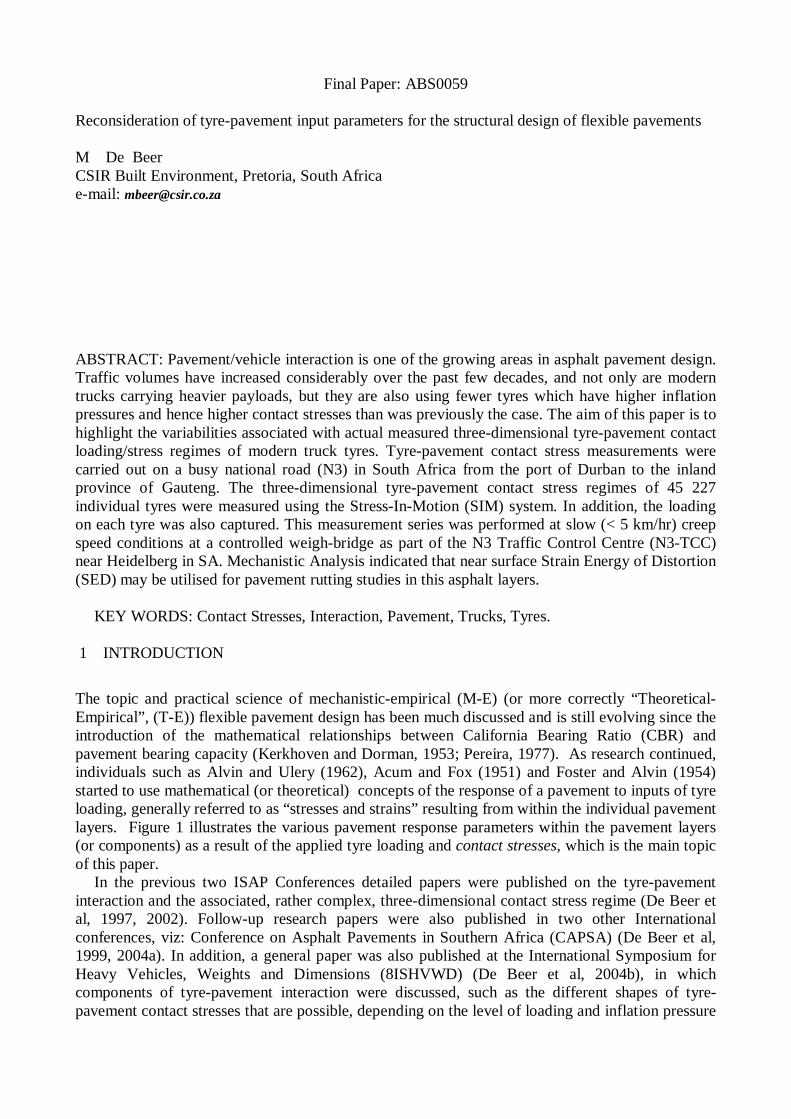
The topic and practical science of mechanistic-empirical (M-E) (or more correctly “Theoretical-Empirical”, (T-E)) flexible pavement design has been much discussed and is still evolving since the introduction of the mathematical relationships between California Bearing Ratio (CBR) and pavement bearing capacity (Kerkhoven and Dorman, 1953; Pereira, 1977). As research continued, individuals such as Alvin and Ulery (1962), Acum and Fox (1951) and Foster and Alvin (1954) started to use mathematical (or theoretical) concepts of the response of a pavement to inputs of tyre loading, generally referred to as “stresses and strains” resulting from within the individual pavement layers. Figure 1 illustrates the various pavement response parameters within the pavement layers (or components) as a result of the applied tyre loading and contact stresses, which is the main topic of this paper.
In the previous two ISAP Conferences detailed papers were published on the tyre-pavement interaction and the associated, rather complex, three-dimensional contact stress regime (De Beer et al, 1997, 2002). Follow-up research papers were also published in two other International conferences, viz: Conference on Asphalt Pavements in Southern Africa (CAPSA) (De Beer et al, 1999, 2004a). In addition, a general paper was also published at the International Symposium for Heavy Vehicles, Weights and Dimensions (8ISHVWD) (De Beer et al, 2004b), in which components of tyre-pavement interaction were discussed, such as the different shapes of tyre-pavement contact stresses that are possible, depending on the level of loading and inflation pressure
combination used in modern truck tyres. Most of the foregoing research was carried out under controlled conditions of loading and inflation pressure.
The aim of this paper is to highlight the variabilities and methodologies associated with actual, measured three-dimensional (3D) tyre-pavement contact loading/stress regimes of modern truck tyres. Tyre-pavement contact stress measurements were carried out on a busy national road (N3) in South Africa from the port of Durban to the inland province of Gauteng. The three-dimensional tyre-pavement contact stress regimes of 45 227 individual tyres were measured using Stress-In-Motion (SIM) system developed in South Africa. In addition, the loading on each tyre was also captured. This measurement series was performed at slow (< 5 km/hr) creep speed conditions at a controlled weigh-bridge point as part of the N3 Traffic Control Centre (N3-TCC) operations near Heidelberg in SA.
2 ACTUAL 3D TYRE-PAVEMENT CONTACT STRESS MEASUREMENTS
Accurate weighing of vehicles on roads is one of the most important actions needed for to effective management of roads in terms of the optimisation of their function and structural capacity. There are approximately 253 000 registered heavy vehicles with a Gross Vehicle Mass/Gross Combination Mass (GVM/GCM) greater than 3.5 tonne in South Africa, of which 26 000 are buses (Bosman, 2004). In this paper a relatively new development for the enhanced weighing of individual tyres of slow moving vehicles is discussed, the results of which could easily be compared with normal axle mass weights, axle group mass weights and GVM/GCM of heavy vehicles obtained from existing Weigh - In - Motion (WIM) or static weighing devices. The idea was to capture the tyre-pavement contact stresses under slow-moving tyres of real trucks. The technology used is referred to as “Stress - In - Motion”, or SIM. This study reports on an experimental programme conducted during 2003, in which the results obtained from the SIM technology were compared with those from a Weigh-In-Motion (WIM) scale (DAW 50) and a Multi-Deck Static scale at the N3 Traffic Control Centre (N3-TCC) near Heidelberg in Gauteng. Although the main function of the SIM technology is to provide information on the 3D tyre-pavement contact stress regime for enhanced road pavement design, this technology can also be used to obtain tyre mass weights, axle mass weights, axle group weights and GVM/GCM. The aim of this study was to statistically compare the axle mass weights, axle group mass weights and GVM/GCM of a population of heavy vehicles travelling north on the N3. The SIM system was installed in a specially designed test pit near the WIM scale (DAW 50) next to the Multi Deck Static scale in a parallel lane in the north-bound direction of the N3-TCC, northern direction.
A total of 3 047 trucks, 17 770 individual axles and 63 265 individual tyres were measured with the SIM over a 6 week period during 2003 at the N3-TCC. For comparative purposes the raw data were validated for quality, and approximately 75.4 per cent of the measurements were rated as “good” to “very good”. This represents a total useable sample of 2 297 trucks, 12 830 axles and 45 227 tyres. The majority of trucks (77 per cent) measured incorporated 3 or more axles. For the purposes of statistically comparing the measurements on the SIM, DAW 50 and Multi - Deck Static scales, only paired data sets were used. The validated paired data indicated that the SIM data compares very linearly (with r2 ≈ unity) for the GVM/GCM, axle group mass weights and axle mass weights. Since the SIM results compared very linearly with the DAW 50 and the Multi – Deck Static measurements, the SIM data corresponded almost exactly with the results from both the DAW 50 and Static weighbridges.
2.1 Composition of Truck Class of the measured population
The composition or breakdown of the measured truck population (2 297 trucks), from the N3
highway that went over the scales during the testing period were also recorded. Approximately 45
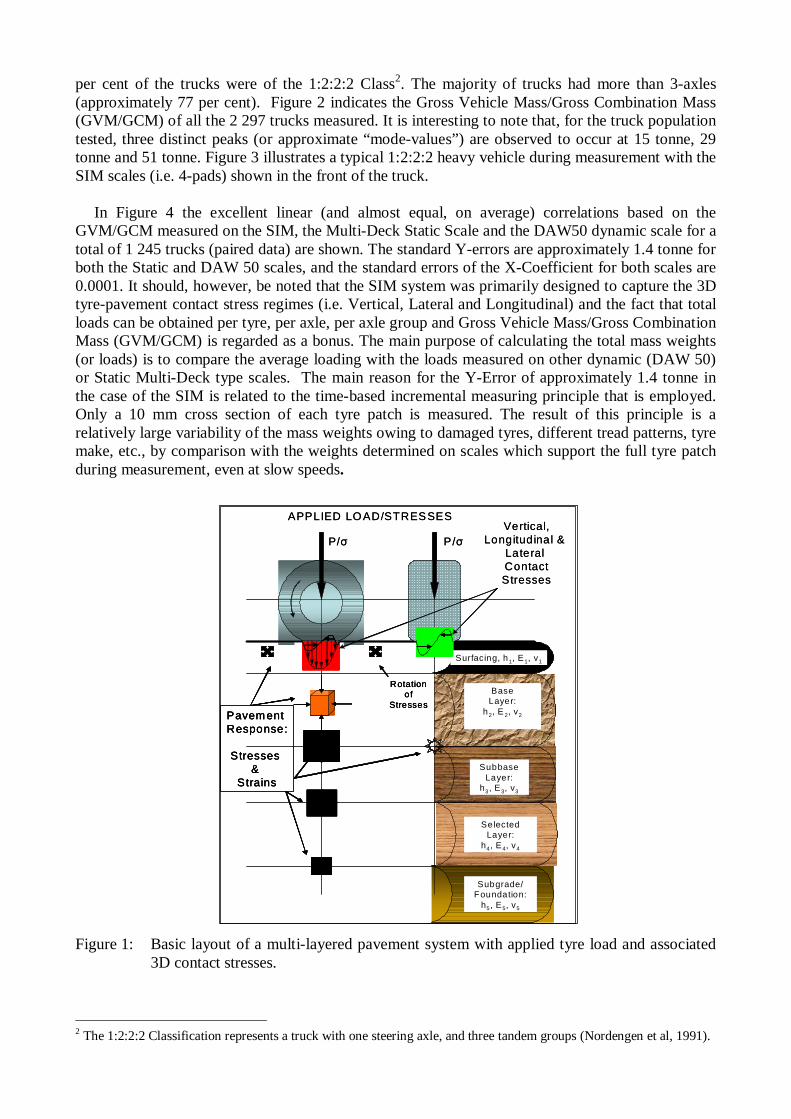
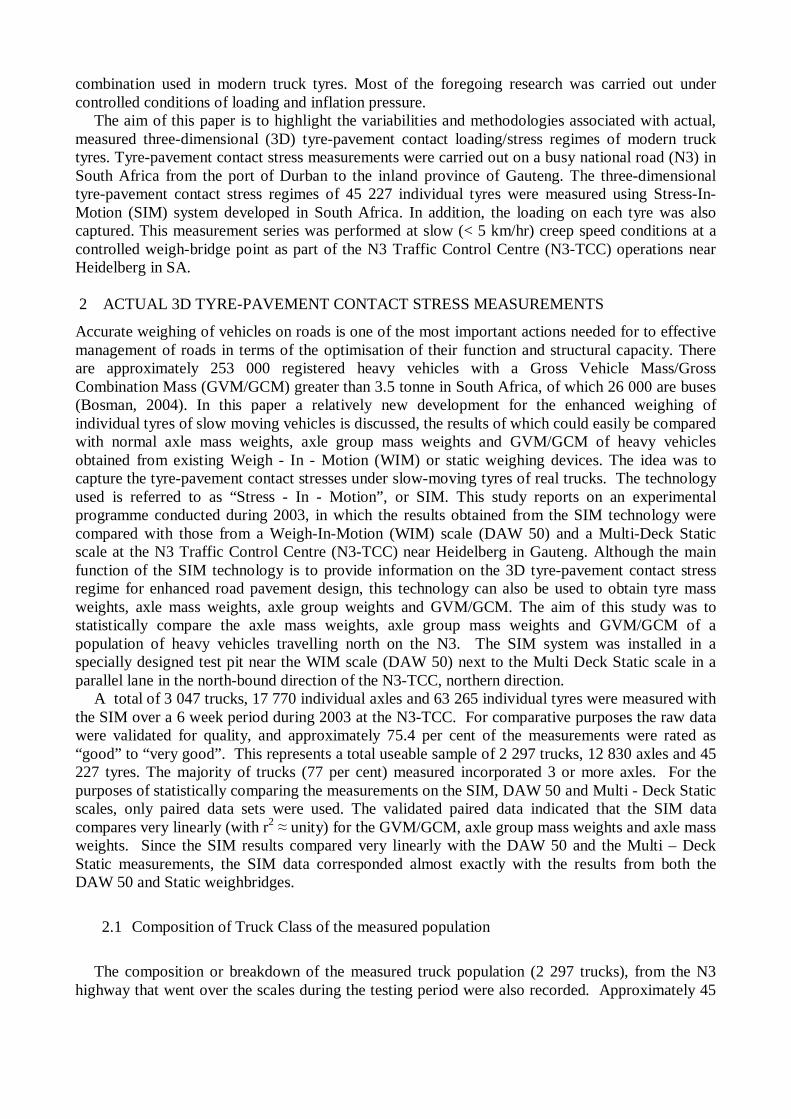
per cent of the trucks were of the 1:2:2:2 Class2. The majority of trucks had more than 3-axles (approximately 77 per cent). Figure 2 indicates the Gross Vehicle Mass/Gross Combination Mass (GVM/GCM) of all the 2 297 trucks measured. It is interesting to note that, for the truck population tested, three distinct peaks (or approximate “mode-values”) are observed to occur at 15 tonne, 29 tonne and 51 tonne. Figure 3 illustrates a typical 1:2:2:2 heavy vehicle during measurement with the SIM scales (i.e. 4-pads) shown in the front of the truck.
In Figure 4 the excellent linear (and almost equal, on average) correlations based on the
GVM/GCM measured on the SIM, the Multi-Deck Static Scale and the DAW50 dynamic scale for a total of 1 245 trucks (paired data) are shown. The standard Y-errors are approximately 1.4 tonne for both the Static and DAW 50 scales, and the standard errors of the X-Coefficient for both scales are 0.0001. It should, however, be noted that the SIM system was primarily designed to capture the 3D tyre-pavement contact stress regimes (i.e. Vertical, Lateral and Longitudinal) and the fact that total loads can be obtained per tyre, per axle, per axle group and Gross Vehicle Mass/Gross Combination Mass (GVM/GCM) is regarded as a bonus. The main purpose of calculating the total mass weights (or loads) is to compare the average loading with the loads measured on other dynamic (DAW 50) or Static Multi-Deck type scales. The main reason for the Y-Error of approximately 1.4 tonne in the case of the SIM is related to the time-based incremental measuring principle that is employed. Only a 10 mm cross section of each tyre patch is measured. The result of this principle is a relatively large variability of the mass weights owing to damaged tyres, different tread patterns, tyre make, etc., by comparison with the weights determined on scales which support the full tyre patch during measurement, even at slow speeds.
Figure 1: Basic layout of a multi-layered pavement system with applied tyre load and associated 3D contact stresses.
2 The 1:2:2:2 Classification represents a truck with one steering axle, and three tandem groups (Nordengen et al, 1991).
P/σ
Surfacing, h1, E1, v1
SelectedLayer:
h4 , E4, v4
BaseLayer:
h2, E 2, v2
Subgrade/Foundation:
h5 , E5, v5
SubbaseLayer:
h3 , E3, v3
APPLIED LOAD/STRESSES
P/σ
Pavement Response:
Stresses &
Strains
Rotationof
Stresses
Vertical,Longitudinal &
Lateral ContactStresses
P/σ
Surfacing, h1, E1, v1
SelectedLayer:
h4 , E4, v4
BaseLayer:
h2, E 2, v2
Subgrade/Foundation:
h5 , E5, v5
SubbaseLayer:
h3 , E3, v3
APPLIED LOAD/STRESSES
P/σ
Pavement Response:
Stresses &
Strains
Rotationof
StressesPavement Response:
Stresses &
Strains
Rotationof
Stresses
Vertical,Longitudinal &
Lateral ContactStresses
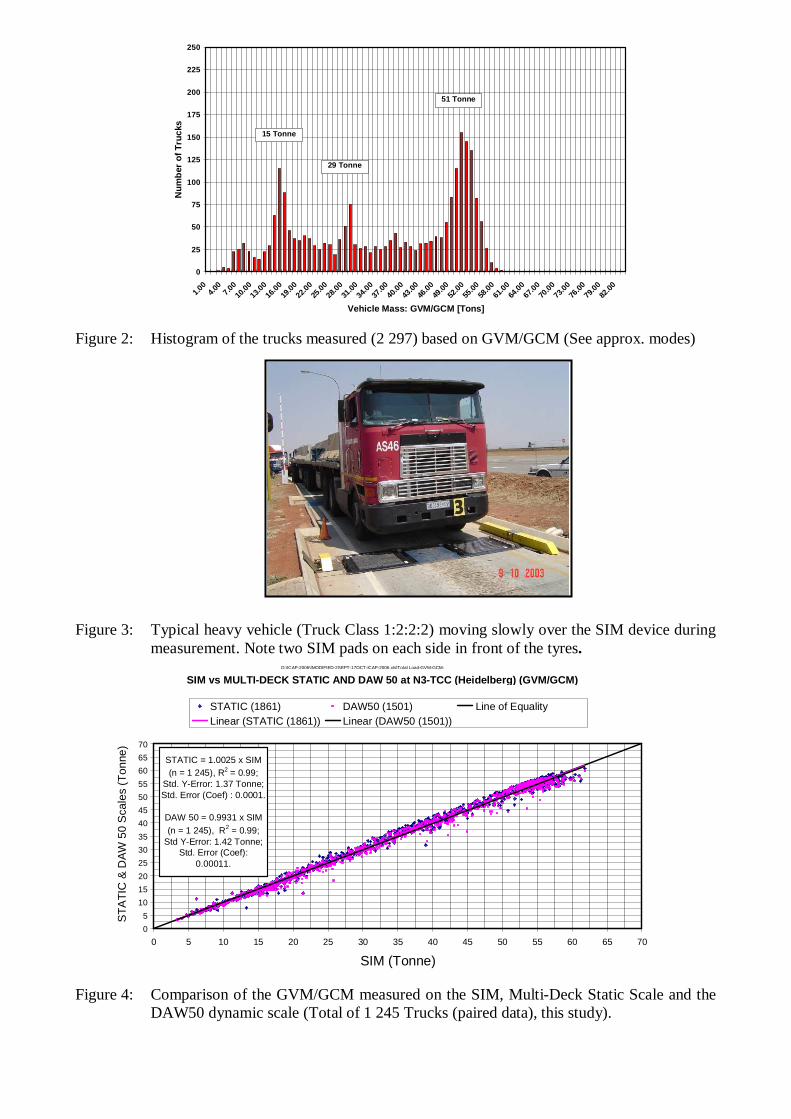
Figure 2: Histogram of the trucks measured (2 297) based on GVM/GCM (See approx. modes)
Figure 3: Typical heavy vehicle (Truck Class 1:2:2:2) moving slowly over the SIM device during measurement. Note two SIM pads on each side in front of the tyres.
Figure 4: Comparison of the GVM/GCM measured on the SIM, Multi-Deck Static Scale and the DAW50 dynamic scale (Total of 1 245 Trucks (paired data), this study).
SIM vs MULTI-DECK STATIC AND DAW 50 at N3-TCC (Heidelberg) (GVM/GCM)
0
5
10
15
20
25
30
35
40
45
50
55
60
65
70
0 5 10 15 20 25 30 35 40 45 50 55 60 65 70
SIM (Tonne)
ST
AT
IC &
DA
W 5
0 S
cale
s (T
onne
)
STATIC (1861) DAW50 (1501) Line of EqualityLinear (STATIC (1861)) Linear (DAW50 (1501))
STATIC = 1.0025 x SIM(n = 1 245), R2 = 0.99;
Std. Y-Error: 1.37 Tonne;Std. Error (Coef) : 0.0001.
DAW 50 = 0.9931 x SIM
(n = 1 245), R2 = 0.99;Std Y-Error: 1.42 Tonne;
Std. Error (Coef): 0.00011.
D:\ICAP-2006\[MODIFIED-2SEPT-17OCT-ICAP-2006.xls]Total Load-GVM-GCM-
0
25
50
75
100
125
150
175
200
225
250
1.00
4.00
7.00
10.00
13.00
16.00
19.00
22.00
25.00
28.00
31.00
34.00
37.00
40.00
43.00
46.00
49.00
52.00
55.00
58.00
61.00
64.00
67.00
70.00
73.00
76.00
79.00
82.00
Vehicle Mass: GVM/GCM [Tons]
Nu
mb
er o
f T
ruck
s
15 Tonne
29 Tonne
51 Tonne
ALL TYRES MEASURED: n = 45 227 (This Study) - N3 -TCC-2003
0
200
400
600
800
1000
1200
1400
1600
0.05
00.
300
0.55
00.
8001.
0501.
300
1.55
01.80
02.05
02.30
02.
550
2.80
03.
050
3.30
03.
5503.
8004.
050
4.30
04.55
04.80
0
Bin: Tyre Mass Weight [Tonne]
Num
ber
of T
yres
0
20
40
60
80
100
120
All Other Tyres Axle 1 Left Axle 1 Right
Steering Tyres:
2.95 Tonne
All other Tyers:
1.9 Tonne
H:\ICAP-2006 Summary N3 TCC-FINAL-4-B-ICAP-2006.xls TYRES-1-2 -Histogram-Paper (2)
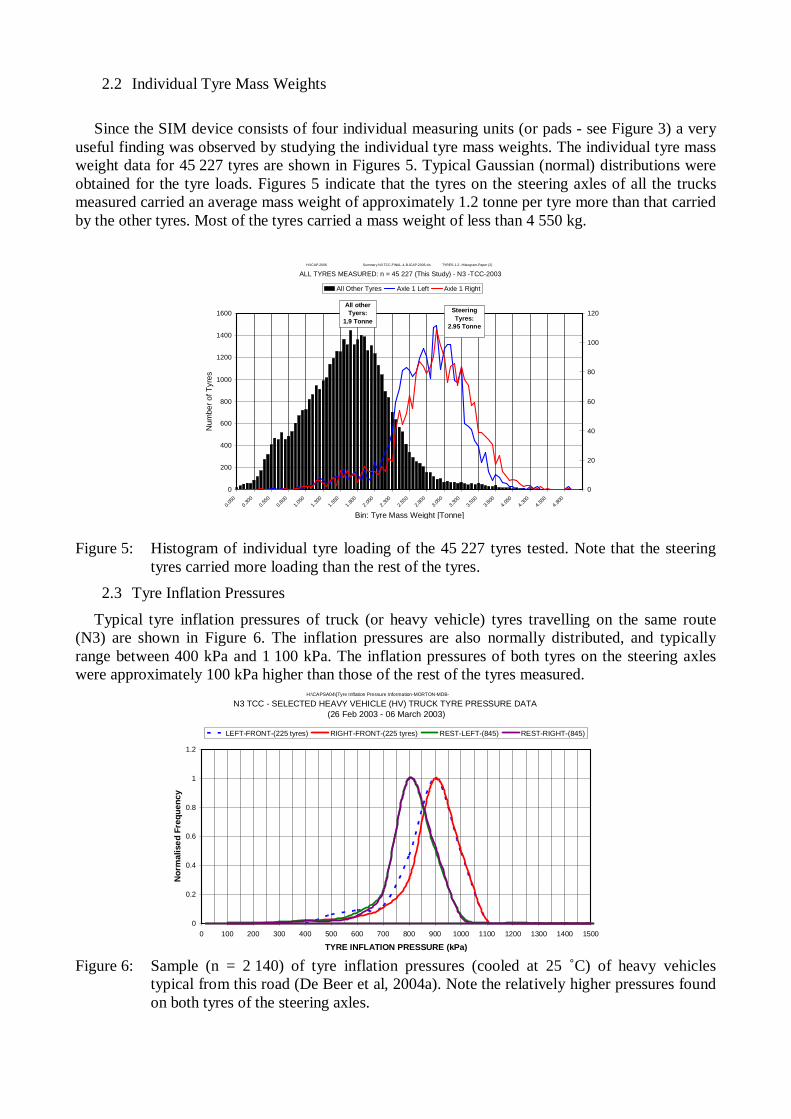
2.2 Individual Tyre Mass Weights
Since the SIM device consists of four individual measuring units (or pads - see Figure 3) a very
useful finding was observed by studying the individual tyre mass weights. The individual tyre mass weight data for 45 227 tyres are shown in Figures 5. Typical Gaussian (normal) distributions were obtained for the tyre loads. Figures 5 indicate that the tyres on the steering axles of all the trucks measured carried an average mass weight of approximately 1.2 tonne per tyre more than that carried by the other tyres. Most of the tyres carried a mass weight of less than 4 550 kg.
Figure 5: Histogram of individual tyre loading of the 45 227 tyres tested. Note that the steering tyres carried more loading than the rest of the tyres.
2.3 Tyre Inflation Pressures
Typical tyre inflation pressures of truck (or heavy vehicle) tyres travelling on the same route (N3) are shown in Figure 6. The inflation pressures are also normally distributed, and typically range between 400 kPa and 1 100 kPa. The inflation pressures of both tyres on the steering axles were approximately 100 kPa higher than those of the rest of the tyres measured.
Figure 6: Sample (n = 2 140) of tyre inflation pressures (cooled at 25 ˚C) of heavy vehicles typical from this road (De Beer et al, 2004a). Note the relatively higher pressures found on both tyres of the steering axles.
N3 TCC - SELECTED HEAVY VEHICLE (HV) TRUCK TYRE PRESSURE DATA
(26 Feb 2003 - 06 March 2003)
0
0.2
0.4
0.6
0.8
1
1.2
0 100 200 300 400 500 600 700 800 900 1000 1100 1200 1300 1400 1500
TYRE INFLATION PRESSURE (kPa)
No
rmal
ise
d F
req
uen
cy
LEFT-FRONT-(225 tyres) RIGHT-FRONT-(225 tyres) REST-LEFT-(845) REST-RIGHT-(845)
H:\CAPSA04\[Tyre Inflation Pressure Information-MORTON-MDB-
3 MEASURED CONTACT STRESSES
3.1 Typical results - Vertical Contact Stresses
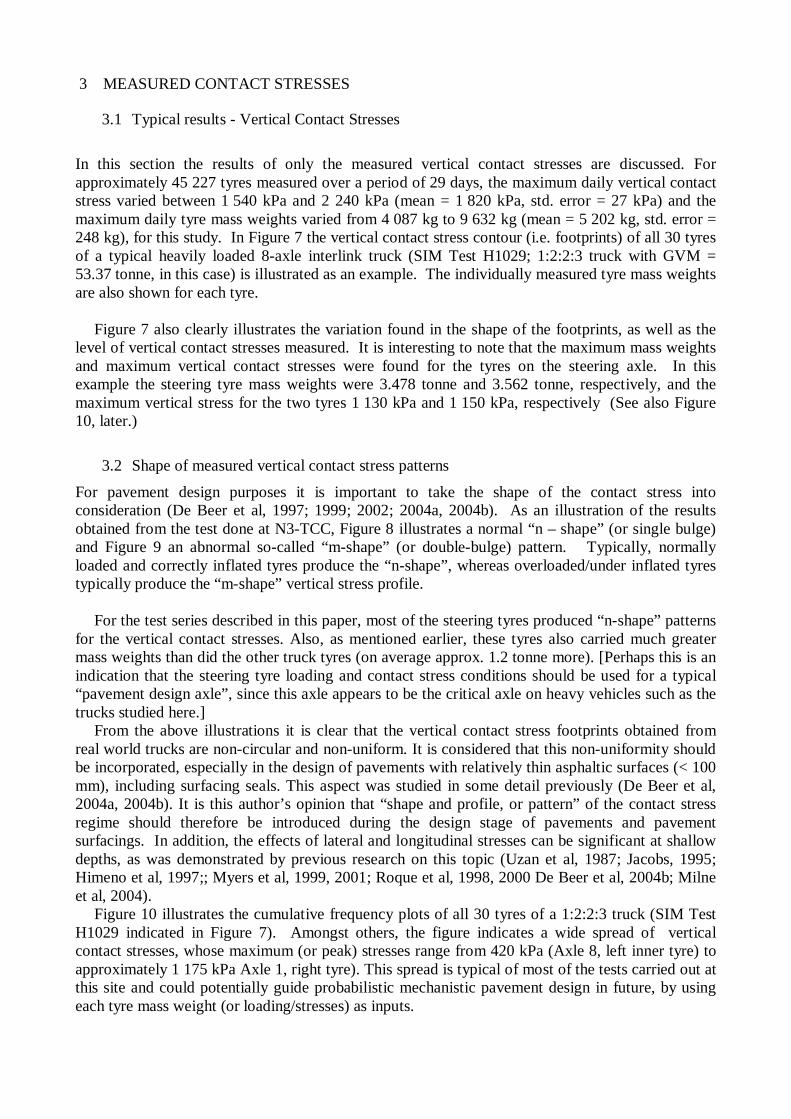
In this section the results of only the measured vertical contact stresses are discussed. For approximately 45 227 tyres measured over a period of 29 days, the maximum daily vertical contact stress varied between 1 540 kPa and 2 240 kPa (mean = 1 820 kPa, std. error = 27 kPa) and the maximum daily tyre mass weights varied from 4 087 kg to 9 632 kg (mean = 5 202 kg, std. error = 248 kg), for this study. In Figure 7 the vertical contact stress contour (i.e. footprints) of all 30 tyres of a typical heavily loaded 8-axle interlink truck (SIM Test H1029; 1:2:2:3 truck with GVM = 53.37 tonne, in this case) is illustrated as an example. The individually measured tyre mass weights are also shown for each tyre.
Figure 7 also clearly illustrates the variation found in the shape of the footprints, as well as the
level of vertical contact stresses measured. It is interesting to note that the maximum mass weights and maximum vertical contact stresses were found for the tyres on the steering axle. In this example the steering tyre mass weights were 3.478 tonne and 3.562 tonne, respectively, and the maximum vertical stress for the two tyres 1 130 kPa and 1 150 kPa, respectively (See also Figure 10, later.)
3.2 Shape of measured vertical contact stress patterns
For pavement design purposes it is important to take the shape of the contact stress into consideration (De Beer et al, 1997; 1999; 2002; 2004a, 2004b). As an illustration of the results obtained from the test done at N3-TCC, Figure 8 illustrates a normal “n – shape” (or single bulge) and Figure 9 an abnormal so-called “m-shape” (or double-bulge) pattern. Typically, normally loaded and correctly inflated tyres produce the “n-shape”, whereas overloaded/under inflated tyres typically produce the “m-shape” vertical stress profile.
For the test series described in this paper, most of the steering tyres produced “n-shape” patterns for the vertical contact stresses. Also, as mentioned earlier, these tyres also carried much greater mass weights than did the other truck tyres (on average approx. 1.2 tonne more). [Perhaps this is an indication that the steering tyre loading and contact stress conditions should be used for a typical “pavement design axle”, since this axle appears to be the critical axle on heavy vehicles such as the trucks studied here.]
From the above illustrations it is clear that the vertical contact stress footprints obtained from real world trucks are non-circular and non-uniform. It is considered that this non-uniformity should be incorporated, especially in the design of pavements with relatively thin asphaltic surfaces (< 100 mm), including surfacing seals. This aspect was studied in some detail previously (De Beer et al, 2004a, 2004b). It is this author’s opinion that “shape and profile, or pattern” of the contact stress regime should therefore be introduced during the design stage of pavements and pavement surfacings. In addition, the effects of lateral and longitudinal stresses can be significant at shallow depths, as was demonstrated by previous research on this topic (Uzan et al, 1987; Jacobs, 1995; Himeno et al, 1997;; Myers et al, 1999, 2001; Roque et al, 1998, 2000 De Beer et al, 2004b; Milne et al, 2004).
Figure 10 illustrates the cumulative frequency plots of all 30 tyres of a 1:2:2:3 truck (SIM Test H1029 indicated in Figure 7). Amongst others, the figure indicates a wide spread of vertical contact stresses, whose maximum (or peak) stresses range from 420 kPa (Axle 8, left inner tyre) to approximately 1 175 kPa Axle 1, right tyre). This spread is typical of most of the tests carried out at this site and could potentially guide probabilistic mechanistic pavement design in future, by using each tyre mass weight (or loading/stresses) as inputs.
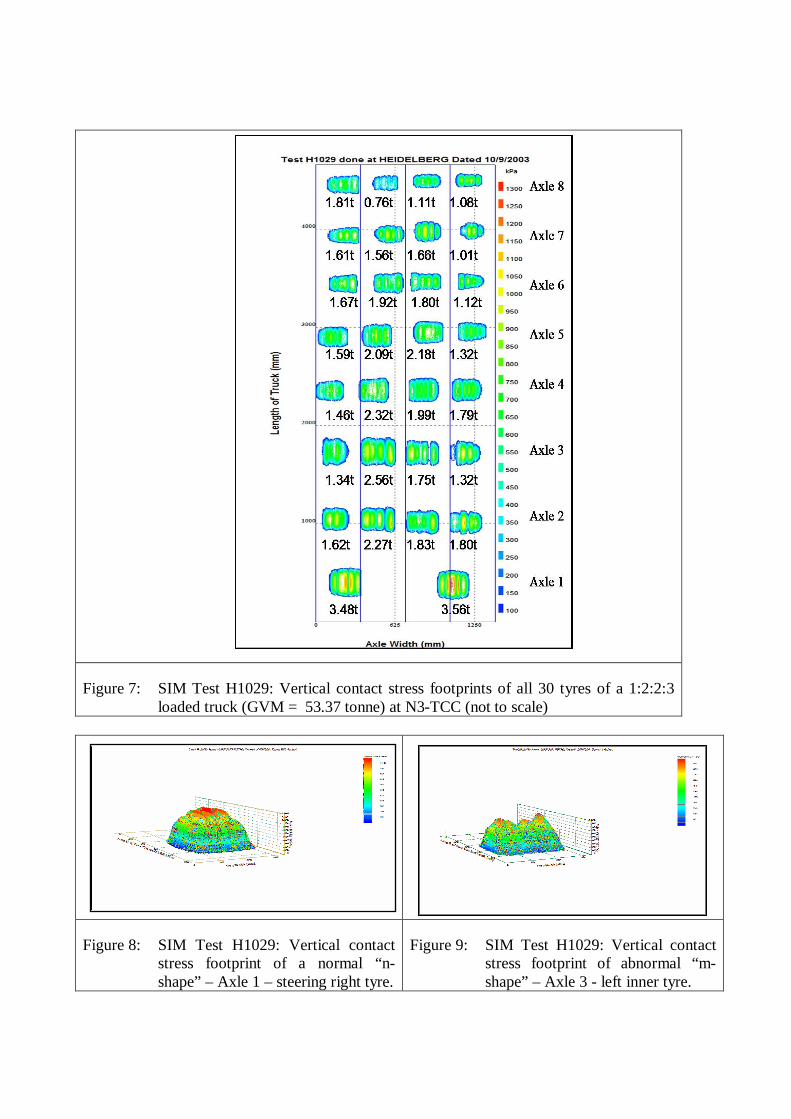
Figure 7: SIM Test H1029: Vertical contact stress footprints of all 30 tyres of a 1:2:2:3 loaded truck (GVM = 53.37 tonne) at N3-TCC (not to scale)
Figure 8: SIM Test H1029: Vertical contact stress footprint of a normal “n-shape” – Axle 1 – steering right tyre.
Figure 9: SIM Test H1029: Vertical contact stress footprint of abnormal “m-shape” – Axle 3 - left inner tyre.
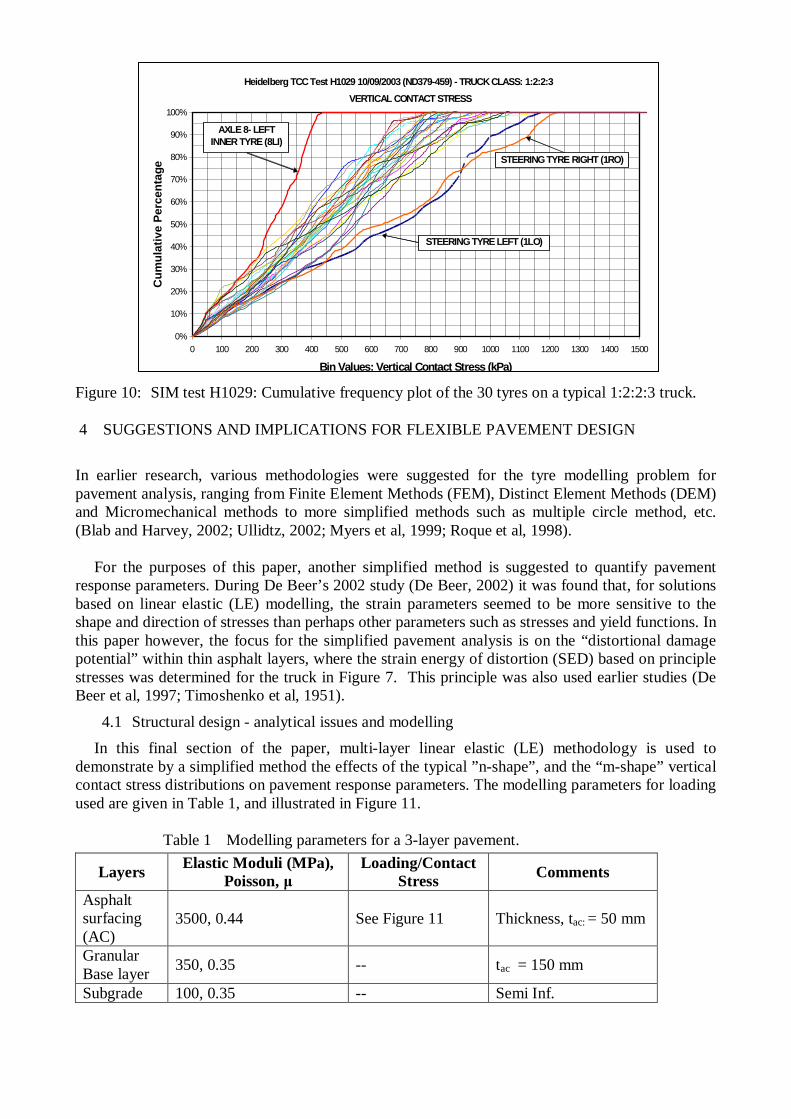
Figure 10: SIM test H1029: Cumulative frequency plot of the 30 tyres on a typical 1:2:2:3 truck. 4 SUGGESTIONS AND IMPLICATIONS FOR FLEXIBLE PAVEMENT DESIGN
In earlier research, various methodologies were suggested for the tyre modelling problem for pavement analysis, ranging from Finite Element Methods (FEM), Distinct Element Methods (DEM) and Micromechanical methods to more simplified methods such as multiple circle method, etc. (Blab and Harvey, 2002; Ullidtz, 2002; Myers et al, 1999; Roque et al, 1998).
For the purposes of this paper, another simplified method is suggested to quantify pavement response parameters. During De Beer’s 2002 study (De Beer, 2002) it was found that, for solutions based on linear elastic (LE) modelling, the strain parameters seemed to be more sensitive to the shape and direction of stresses than perhaps other parameters such as stresses and yield functions. In this paper however, the focus for the simplified pavement analysis is on the “distortional damage potential” within thin asphalt layers, where the strain energy of distortion (SED) based on principle stresses was determined for the truck in Figure 7. This principle was also used earlier studies (De Beer et al, 1997; Timoshenko et al, 1951).
4.1 Structural design - analytical issues and modelling
In this final section of the paper, multi-layer linear elastic (LE) methodology is used to demonstrate by a simplified method the effects of the typical ”n-shape”, and the “m-shape” vertical contact stress distributions on pavement response parameters. The modelling parameters for loading used are given in Table 1, and illustrated in Figure 11.
Table 1 Modelling parameters for a 3-layer pavement.
Layers Elastic Moduli (MPa),
Poisson, µ Loading/Contact
Stress Comments
Asphalt surfacing (AC)
3500, 0.44 See Figure 11 Thickness, tac: = 50 mm
Granular Base layer
350, 0.35 -- tac = 150 mm
Subgrade 100, 0.35 -- Semi Inf.
Heidelberg TCC Test H1029 10/09/2003 (ND379-459) - TRUCK CLASS: 1:2:2:3
0%
10%
20%
30%
40%
50%
60%
70%
80%
90%
100%
0 100 200 300 400 500 600 700 800 900 1000 1100 1200 1300 1400 1500
Bin Values: Vertical Contact Stress (kPa)
Cu
mu
lati
ve P
erce
nta
ge
VERTICAL CONTACT STRESS
STEERING TYRE RIGHT (1RO)
STEERING TYRE LEFT (1LO)
AXLE 8- LEFT INNER TYRE (8LI)
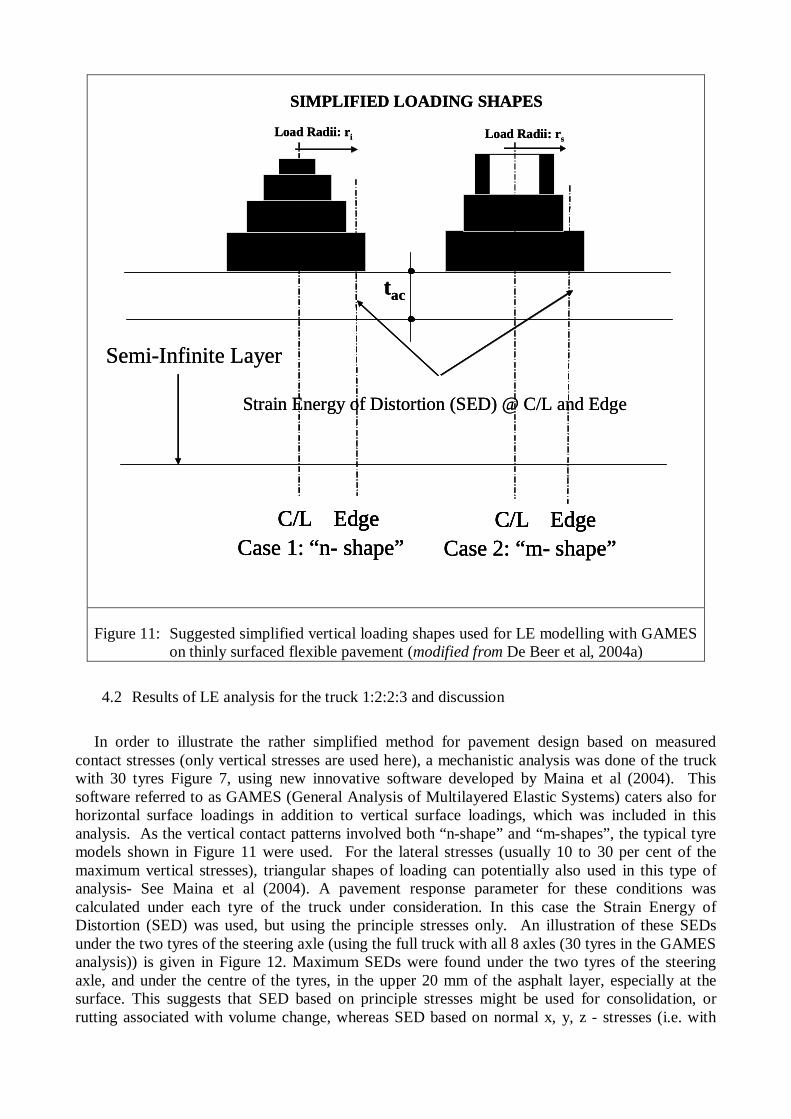
Figure 11: Suggested simplified vertical loading shapes used for LE modelling with GAMES on thinly surfaced flexible pavement (modified from De Beer et al, 2004a)
4.2 Results of LE analysis for the truck 1:2:2:3 and discussion
In order to illustrate the rather simplified method for pavement design based on measured
contact stresses (only vertical stresses are used here), a mechanistic analysis was done of the truck with 30 tyres Figure 7, using new innovative software developed by Maina et al (2004). This software referred to as GAMES (General Analysis of Multilayered Elastic Systems) caters also for horizontal surface loadings in addition to vertical surface loadings, which was included in this analysis. As the vertical contact patterns involved both “n-shape” and “m-shapes”, the typical tyre models shown in Figure 11 were used. For the lateral stresses (usually 10 to 30 per cent of the maximum vertical stresses), triangular shapes of loading can potentially also used in this type of analysis- See Maina et al (2004). A pavement response parameter for these conditions was calculated under each tyre of the truck under consideration. In this case the Strain Energy of Distortion (SED) was used, but using the principle stresses only. An illustration of these SEDs under the two tyres of the steering axle (using the full truck with all 8 axles (30 tyres in the GAMES analysis)) is given in Figure 12. Maximum SEDs were found under the two tyres of the steering axle, and under the centre of the tyres, in the upper 20 mm of the asphalt layer, especially at the surface. This suggests that SED based on principle stresses might be used for consolidation, or rutting associated with volume change, whereas SED based on normal x, y, z - stresses (i.e. with
Load Radii: ri Load Radii: rs
tac
C/L Edge C/L EdgeCase 1: “n- shape” Case 2: “m- shape”
Semi-Infinite Layer
SIMPLIFIED LOADING SHAPES
Strain Energy of Distortion (SED) @ C/L and Edge
Load Radii: ri Load Radii: rs
tac
C/L Edge C/L EdgeC/L EdgeC/L Edge C/L EdgeC/L EdgeCase 1: “n- shape” Case 2: “m- shape”Case 1: “n- shape” Case 2: “m- shape”
Semi-Infinite Layer
SIMPLIFIED LOADING SHAPES
Strain Energy of Distortion (SED) @ C/L and Edge
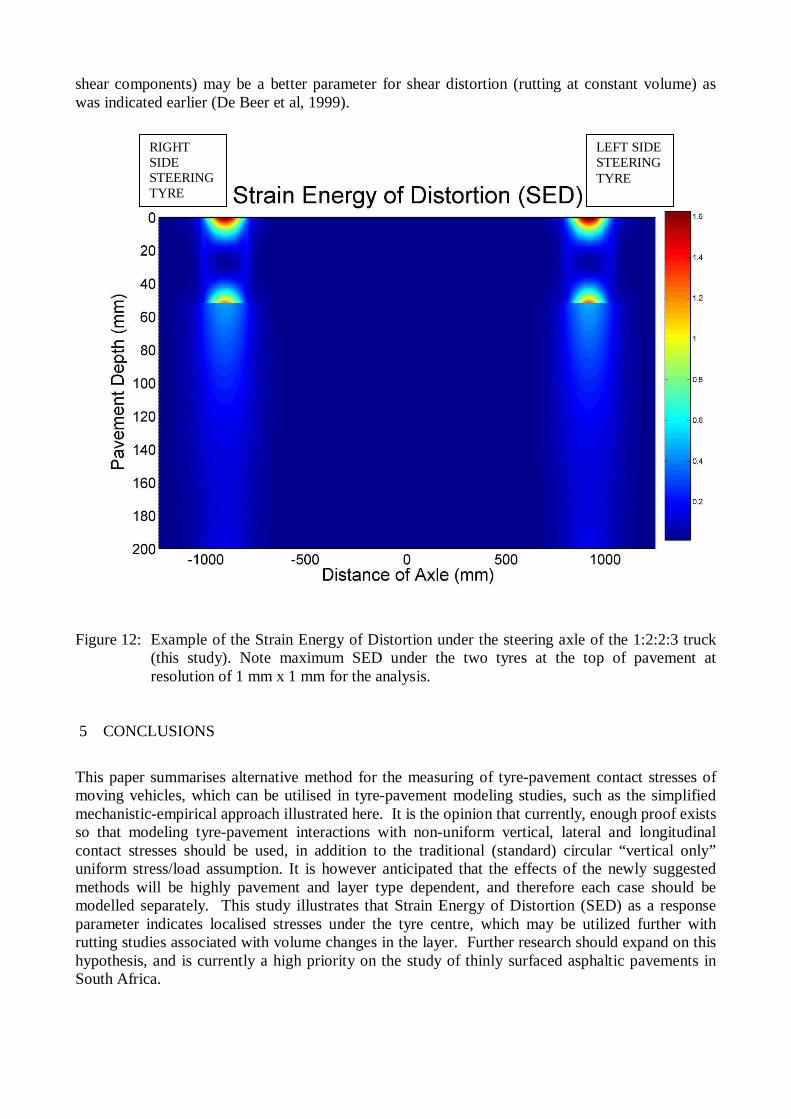
shear components) may be a better parameter for shear distortion (rutting at constant volume) as was indicated earlier (De Beer et al, 1999).
Figure 12: Example of the Strain Energy of Distortion under the steering axle of the 1:2:2:3 truck (this study). Note maximum SED under the two tyres at the top of pavement at resolution of 1 mm x 1 mm for the analysis.
5 CONCLUSIONS
This paper summarises alternative method for the measuring of tyre-pavement contact stresses of moving vehicles, which can be utilised in tyre-pavement modeling studies, such as the simplified mechanistic-empirical approach illustrated here. It is the opinion that currently, enough proof exists so that modeling tyre-pavement interactions with non-uniform vertical, lateral and longitudinal contact stresses should be used, in addition to the traditional (standard) circular “vertical only” uniform stress/load assumption. It is however anticipated that the effects of the newly suggested methods will be highly pavement and layer type dependent, and therefore each case should be modelled separately. This study illustrates that Strain Energy of Distortion (SED) as a response parameter indicates localised stresses under the tyre centre, which may be utilized further with rutting studies associated with volume changes in the layer. Further research should expand on this hypothesis, and is currently a high priority on the study of thinly surfaced asphaltic pavements in South Africa.
RIGHT SIDE STEERING TYRE
LEFT SIDE STEERING TYRE
REFERENCES
Acum, W. E. A. and Fox, L. 1951. Computation of load stresses in a three-layer elastic system. Geotechnique, Vol. 2, pp. 293 to 300, 1951.
Alvin, R. G. and Ulery, H. H. (1962. Tabulated Values for Determining the Complete Pattern of Stress, Strains and Deflections Beneath a Uniform Circular Load on a Homogeneous Half Space, Highway Research Board Bulletin 342, 1962, Washington, D.C., USA.
Blab, R, 1999, Introducing Improved Loading Assumptions into Analytical Pavement Models Based on Measured Contact Stresses of Tires. International Conference on Accelerated Pavement Testing, Reno, Nevada, USA, 1999. Paper Number: CS5-3.
Blab, R. and Harvey, J. T., 2002. Modeling measured 3D Tire Contact Stresses in a Visco-Elastic FE Pavement Model. The International Journal of Geomechanics, Volume 2, Number 3, pp 271-290, June, 2002.
Bosman, J. 2004. Traffic loading characteristics of South African Heavy vehicles. Eighth (8th) International Symposium on Heavy Vehicles, Weights and Dimensions. Loads, Roads and the Information Highway. 14-18 March 2004, Misty Hills Conference Centre, Muldersdrift, Gauteng, South Africa.
De Beer, M., Fisher, C. and Jooste, F. J., 1997. Determination of pneumatic tyre/pavement interface contact stresses under moving loads and some effects on pavements with thin asphalt surfacing layers. Eighth International Conference on Asphalt Pavements (ICAP ‘97), Vol. 1, pp 179-227, Seattle, Washington, USA, August 10-14, 1997.
De Beer, M., Kannemeyer, L. and Fisher, C., 1999. Towards Improved Mechanistic Design of thin Asphalt Layer Surfacings based on Actual Tyre/pavement Contact Stress - In - Motion (SIM) data in South Africa. Seventh (7th) Conference on Asphalt Pavements for southern Africa (CAPSA ’99), Theme 5: Innovation in Asphalt Design, 33 pp. Victoria Falls, Zimbabwe, 29 August to 2 September 1999.
De Beer, M., Fisher, C. and Jooste, F. J., 2002: Evaluation of non-uniform tyre contact stresses on thin asphalt pavements. Ninth (9th) International Conference on Asphalt Pavements (ICAP 2002), Copenhagen, Denmark, August 17-22, 2002. (Proceedings on CD from conference organisers: The Danish Road Directorate, Ministry of Transport, Copenhagen, Denmark, and the International Society of Asphalt Pavements (ISAP). De Beer, M., Fisher. C. and Kannemeyer, L., 2004a. Tyre-pavement interface contact stresses on flexible pavements - quo Vadis? Roads - The Arteries of Africa; Eighth Conference on Asphalt Pavements for Southern Africa; September 12-16, 2004: Sun City, North West Province, South Africa, Document Transformation Technologies cc.
De Beer, M., Fisher, C and Kannemeyer, L. 2004b. Towards the application of Stress-In-Motion (SIM) results in pavement design and infrastructure protection. Eighth (8th) International Symposium on Heavy Vehicles, Weights and Dimensions. Loads, Roads and the Information Highway. 14-18 March 2004, Misty Hills Conference Centre, Muldersdrift, Gauteng, South Africa.
Foster, C. R., and Alvin, R. G., 1954. Stresses and Deflections induced by a uniform circular load. Proceedings of HRB, page 467, Highway Research Board, Washington, D.C., USA, 1954.
Himeno, K., Kamijima, T., Ikeda, T. and Abe, T., 1997. Distribution of Tire Contact Pressure of Vehicles and its Influence on Pavement Distress. Eighth International Conference on Asphalt Pavements (ICAP ‘97), Vol. 1, pp 129-139, August 10-14, 1997, Seattle, Washington, USA.
Jacobs, M. M. J., 1995. Crack Growth in Asphalt Mixes. Ph. D. thesis submitted to Technical University Delft, Faculty of Civil Engineering, Infrastructure, Delft, Netherlands, February, 1995.
Kerkhoven, R. E. and Dorman, G. M., 1953. Some considerations on the California Bearing Ratio Method for the design of flexible pavements. Shell Bitumen Monograph, No. 1, 3rd Release, Shell International Company, London, UK, 1953.
Maina, J. W, Matsui, K,. 2004. Developing Software for Elastic Analysis of Pavement Structure Responses to Vertical and Horizontal Loadings. Transportation Research Record: Journal of the Transportation Research Board, No. 1896, TRB, National Research Council, Washington, D.C., 2004, PP. 107-118. Milne T.I., Huurman, H., van de Ven, M.F.C., Jenkins, K.J., Scarpas, A., Kasbergen, 2004. Development of a Prototype FEM Road Surfacing Seal Behavioural Model. CAPSA 2004, Sun City, September 2004 12 to 16, Sun City, Northwest Province, South Africa.
Myers, L. A., Roque,. R., Ruth, B. E., Drakos, C., 1999. Measurements of Contact Stresses for Different Truck Tire Types to Evaluate their Influence on Near Surface Cracking and Rutting. In Transportation Research Record: Journal of the Transportation Research Board, No. 1655, TRB, National Research Council, Washington, D. C., USA, 1999, pp. 175-184.
Nordengen, P. A. and Hellens, M. C., 1991. A System for Monitoring Overloaded Vehicles. Proceedings of the Annual Transportation Convention (ATC), Freight Transport, Volume 5A, Paper 5. CSIR Conference Centre, Pretoria, South Africa, August 5 to 9, 1991.
Pereira A. T., 1977. Procedures for Development of CBR Design Curves. Final Report. Soils and Pavements Laboratory. U.S. Army Engineer, Waterways Experiment Station P.O. Box 631, Vicksburg, Mississippi, USA, 1977.
Roque, R., Myers, L. A., Ruth, B. E., 1998. Loading characteristics of modern truck tires and their effects on surface cracking of asphalt pavements. Proceedings of the Fifth International Conference on the Bearing Capacity of Roads and Airfields BCRA ‘98, Volume 1, Trondheim, Norway, 6 to 8 July 1998, pp 93-102.
Timoshenko, S. and Goodier, J. N., 1951. Theory of Elasticity, McGraw-Hill Inc., New York, USA, 1951.
Ullidtz, P., 2002. Analytical Tools for Design of Flexible Pavements. Technical University of Denmark, Ninth International Conference on Asphalt Pavements, Copenhagen, Denmark, August 17-22, 2002.
Uzan, J., Sides, A., 1987. The Effect Of Contact Area Shape And Pressure Distribution On Multi layer Systems Response.
Filename: ICAP-2006-FINAL PAPER- ABS0059.doc
Directory: H:\ICAPS\ICAP 2006 - Quebec City
Template: C:\Documents and Settings\MBeer\Application Data\Microsoft\Templates\Normal.dot
Title: ICAP-Draft Paper - M De Beer-ABS0059
Subject: ICAP-2006 Author: M DE BEEER Keywords: Comments: Creation Date: 07/09/2006 12:27
PM Change Number: 22 Last Saved On: 07/09/2006 3:07
PM Last Saved By: Morris De Beer Total Editing Time: 158 Minutes Last Printed On: 07/09/2006 3:10
PM As of Last Complete Printing Number of Pages: 12 Number of Words: 12 472 (approx.) Number of Characters: 71 093
(approx.)