final mortality statistics, 1973 · from 16.4 in 1972 to 15.8in 1973 (a3.7-percent de-crease),...
TRANSCRIPT

�
U.S. DEPARTMENT OFHEALTH, EDUCATION, ANO WELFAREPublic Health set-viceHealth Remmces Adminisrratim
5600 Fishers !-meRockville, Maryland 20S52
I VITAL STATISTICS REPORT
Summary Report Final Mortality Statistics, 1973
I (HRA)75-1120VOL. 23, NO. 11 FROM THESUPPLEMENT (2)FEBRUARY 10, 1975 NATIONAL CENTER FOR HEALTH STATISTICS
Deaths and Death Rates
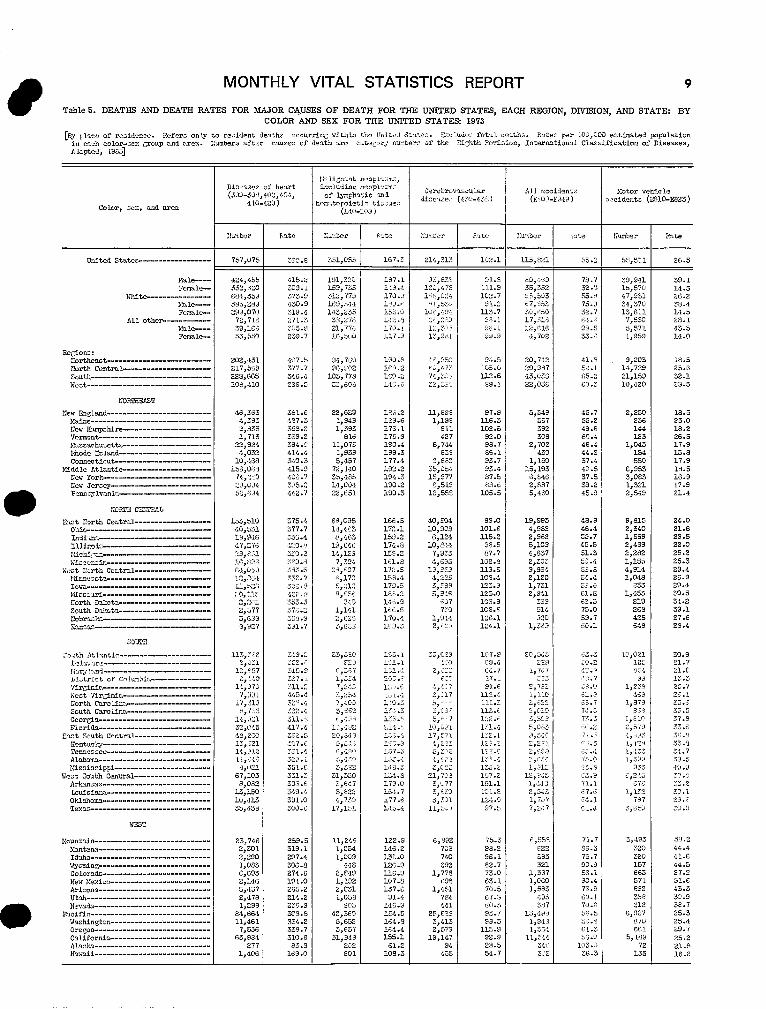
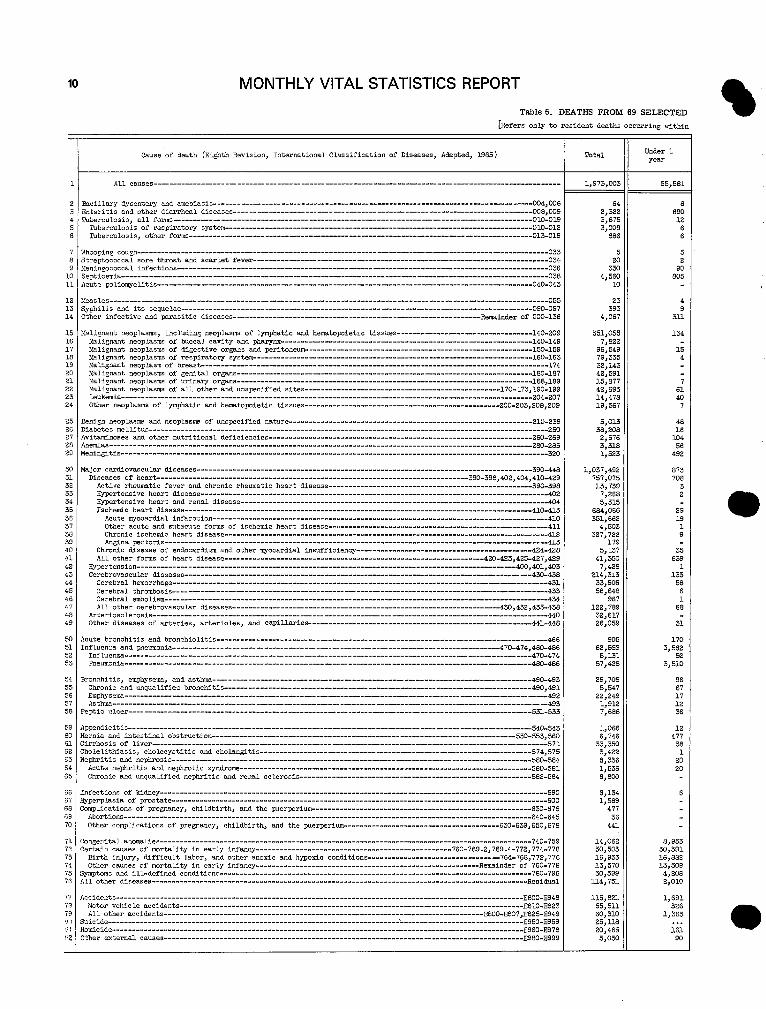
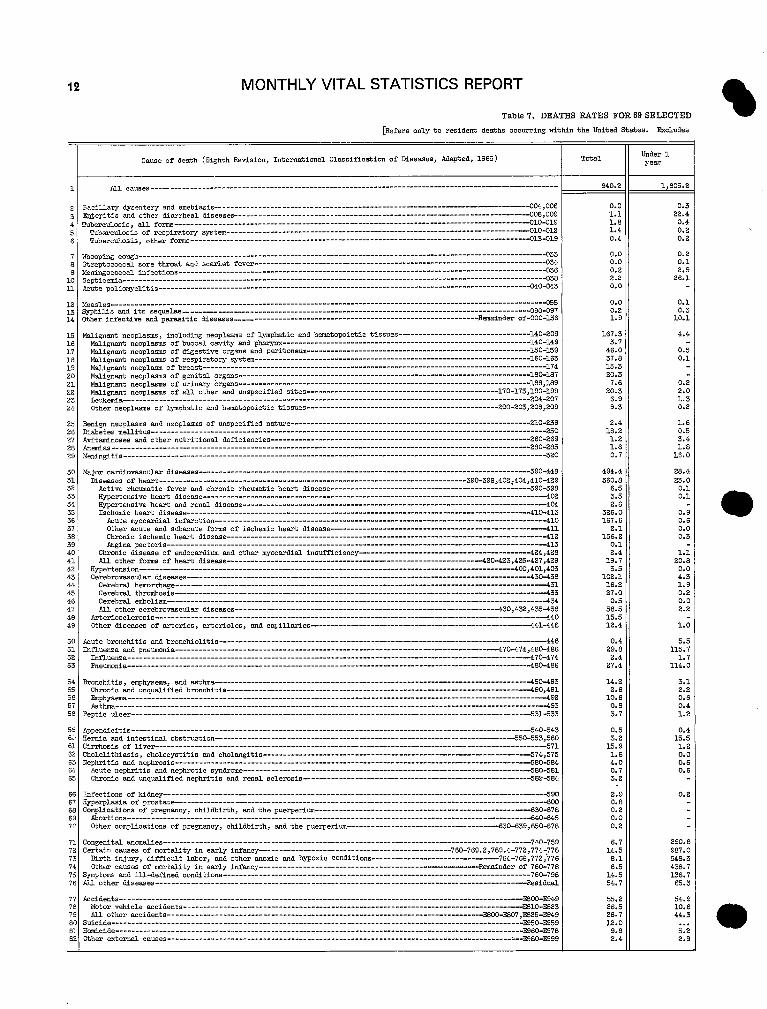
There were 1,973,003 resident deaths in the United States during 1973, 9,059 more than in 1972 (table 1). The death rate for 1973 was 9.4 per 1,000 population, the same as the rate in 1972. The rate for males was 0.9 percent lower than that of 1972, while the rate for females (8.1 percent) remained unchanged. The difference between the rates for the two sexes in 1973 was 2.7 deaths per 1,000 population. This difference has remained relatively constant for many years. By color, the rates for white persons and all other persons in 1973 were both 1. I percent lower than in 1972.
The effect of yearly changes in the age composition of the population is eliminated by age:adjusting the death rates. Current age-specific death rates are applied to a standard population of unchanging age structure. In this report the standard selected was the total U.S. population in 1940. The age-adjusted rate in
FIGURE 1
CRUDE DEATH RATES 193&73
12
““’””popu’a’”n~ ‘2
11 —.~11 -ii I
10
9 — 1930
0 E1940 1950 1s60 1970 19E0
1973 was &.9per 1,000 population (table 12), a decrease of 1.4 percent from the previous year. The age-adjusted death rate for males was 1.8 times the corresponding rate for females in 1973. By color, the age-adjusted death rate for all other persons was 1.4 times the corresponding rate for white persons in 1973.
The death rates for the South and West Regions were slightly higher for 1973 than for 1972. The North-east and North Central Regions experienced lower deaths rates. The rates for both regions were 1.0 per-cent lower in 1973 than in 1972.
Causes of Death
The death rate in 1973 for most causes of death was either lower or changed very little between 1972 and 1973. One noteworthy exception was Homicide, which increased 4 percent. Some of the causes that
FIGURE 2
LIFE EXPECTANCY BY SEX 1930.7S
— Bothsexes . . . . . . ~~,e
: :-.. . ...-””. :
50 50
0 0
1930 1925 1940 1945 1950 1955 1900 1905 1970 1975

2 MONTHLY VITAL STATISTICS REPORT
decreased in 1973 were Acute bronchitis and bron- mention of cause, up 7.9 percent; Toxemiaofpreg- %
chiolitis, down 33 percent; Infection of kidney, 12.1 nancy, up 7.3 percent; and Diarrheal diseases, Up
percent; Congenital anomalies, 5.6 percent; andDia- 6.2 percent. The rates for Hemolytic disease ofbetes mellitus, down 2,2 percent. Death rates for newborn, Asphyxia of newborn, Influenza and pneu
nine of the 10 leading causes showed decreases from monia, and Immaturity, unqualified, were substan-
1972 to 1973. The one exception was the death rate tially lower in 1973 than in 1972.
for Cirrhosis of liver, which increased 1.9 percent,
Maternal Mortality Life Expectancy
There were 477 women who died of maternal The expectation of life at birth was 71.3 years
causes in 1973. As in previous years, this numberfor the total population in 1973. This represents the
does not include all deaths occurring to pregnantaverage number of years at the time of birth that the
women but only deaths assigned to Complications ofmembers of the life table cohort may expect to live. p egnancy, childbirth, andthepuerperium (630-678).Based on mortality experience during 1973 the life L e number of maternal deaths andthematernalmor -expectancy at birth was 67.6 for males and 75.3 for
tality rates per 100,OOO1ive births by color for 1973females. Life expectancy values increased slightly were as follows:in 1973 over the previous year.
I I
Infant Mortality Color I Number I Rate
The infant mortality rate in 1973 was 17.7 per 1,000 live births, a reduction of 4.3 percent from the level of 18.5 in 1972. This continued the decrease in infant mortality that has been evidenced over the last decade. Among white infants themortality ratedropped from 16.4 in 1972 to 15.8in 1973 (a3.7-percent de-crease), while among all other races it went from 27.7 to 26.2 (a5.4-percent decrease).
In 1973 the infant mortality rates for most major causes of death were somewhat lower than in 1972.
The overall rate in 1973 was 19.1 percent below the rate for 1972. The maternal mortality rate for m
white women declined 25.2 percent and the rate for all other women declined 10.1 percent. The maternal mortality rate for all other women was 3.2 times that
The major exceptions were Birth injury without for white women.
This report presents summary tabulations from the final mortality statistics for 1973. More detailed tabulations for 1973 wiH be published in Vital Statistics of the United Stutes, Volume 11—Mm@ality. Prior to the publication of that volume, the National Center for Health Statistics will respond to requests for unpublished data whenever possible.

--------------------------------------------------------------
-------
-----------------------------------------------------------------------
---------------------------------------------------------------------
-------------------------------------------------------------------------------------------------------------------------------------------
-----------------------------------------------------------------------------------------------------------------------------------------
----------------------------------------------------------------------------------------------------------------------------------------
----------------------------------------------------------------
---------------------------------------------------------------------------------------------------------------------------------------------
----------------------------------------------------------------
---------------------------------------------------------------------
-----------------------------------------------------------------------------------------------------------------------------------
-----------------------------------------------------------------------------------------------------------------------------------------------------------------------------------------------------------------
----------------------------------------------------------------------------------------------------------------------------------
--------------------------------------------------------------------------------------------------------------------------------------------------------------------------------------------
---------------------------------------------------------------------
-------------------------------------------------------------------
---------------------------------------------------------------------------------------------------------------------------------
--------------------------------------------------------------------------------------------------------------------------------------------
---------------------------------------------------------------------
-----------------------------------------------------------------------
----------------------------------------------------------------------
-----------------------------------------------------------------------
--------------------------------------------------------------------------------------------------------------------------------------------------
----------------------------------------------------------------------
----------------------------------------------------------------------------------------------------------------------------------------------
0 MONTHLY VITAL STATISTICS REPORT 3
Table 1. TOTAL. , INFANT. AND NEONATAL DEATHS AND INFANT AND NEONATAL MORTALJTY RATES. FOR THE UNITED STATES. , EACH ‘ REGION, DIVISION, AND STATE: AND BY COLOR AND SEX FOR THE UNITED STATES, 1’373
[3y P1O.CCof reddcrme. Refer; only to events occurring within the United State:]
IL”ant deaths Seonatal deaths(under lyear) (uncler2.9days)
Color, sex, and area
FateL Sumber Number Ratez
united st3teG 9.? 5s,531 17.7 40,664 13.0
],>1,--- 1,09S,79: 10.? L g= 19.9 23,5X 14.6
white---— 1,728,40S 9.4 40,239 15.8 30,201 11.s 14ale---- 957.91: 10.7 23,414 17.3 17,647 13.5 Femlc-- 770;487 8.2 16,BZ5 13.6 12,554 10.1
All other-------- 244,59E 9.1 15,:’42 26.2 10,462 17.9 ],ill+—- 13a,877 lo.a 8,572 28.8 5,89s 19.a
e--FeT.31 11J5,721 7.6 6,770 23.5 14>57: 15.9
Fmrile-- S-m>zo: ‘3.1 23,535 15.4 17,12~ 11.2
Re@nE:l10rthe3st 493,104 9.9 10,724 16.!3 8>07E 12.sXlotihCentral------------------------------------------------------------------- 546>624 9.5 15,093 L7.6 1.1,26 13.2sOuth--------------------------------------------------------------------------- 631,115 9.6 21,122 19.7 15>205 14.2Gt---------------------------------------------------------------------------6>Lli 10..9,Jo 302,16C 8.3 e,ms 15.4
IIOSTKSMT
??cwmchd l16,49E 9.6 2,421 15.5 1,84: 11.9 bbhc ------------------------------------------------------------------------- 10,57C 10.6 255 16.3 162 11.6 Sew Wpnhim 7,5s3 9.6 191 16.5 14E 12.6 Vcmnt 4,504 9.7 10!? 16.1 7E 11.s
57,3M 9.9 1,10s 15.3 /355 L1.s Shode Iolmd ------------------------------------------------------------------- 9,509 9.8 203 17.0 1s7 13.6 cOmecticut :6,714 3.7 5.5i 14.7 415 11.1
Middle AtWtic 376.026 10.0 17.? 12.8 llewYOrk---------------------------------------------------------------------- 181;?37 9.s 17.. 12.7 llcuJcrccy C5,C37 3.3 le.7 12.s; FemzyV?miu Km, $6:2 lQ.< ~7.Q 13.C,
1WK2?LCE?LE41,
m m-% Scr+.hCcr,trLl 1.3.1 13.5 Ohi*------------------------------------------------------------------------- 17.: 13.C4 Intima 9.3 1s.: 13.7 IIUnOir 3.3 :.,.1 15.1 1.%ct,lr,r,------------------------------------------------------------------------ 8.7 13.: 13.s Wisconsin-------------------------------------------------------------------- 3.,.’ 1$..: 10.5
h%t Ihrth Ccntrnl a.? 16.h 12.2 yogi:::::::::::::::::: ::::::::-:::::::::::::-:::::::::---::::::::::-::::::: 3.7 1:.2
lcf. I l.i..? lliszOmt la .:, 17.5
krth ~batJ 3.,: ~,:.:
south c,2Pmta 3.7 15.,: 1:cbrask3------------------------------------------------------------------- 3.7 1<.1 12.9
1.5.5 11.7
~~~~
Srmth Atlw,tic 14.: 13.9 tibvwc 15.S+ 15.1 !fhrylmd Is.z 11.2 Diotrict CS CaLWbia ?:!.E 13.2 vir@tiJ 1,.: 13.9 WMt Vir@rrla 1.I.L’ 13.9 I:5fi@m1inl Z1..c 15.5 Zcmth CWo LtiJ 2?.7 La 4 mOrniu 1:!.1 12.s
lJ.C 1s.6 East South Ccntml ---------------------------------------------------------------- 10.1 21.1 14.9
lQ .5 16.8 12.4 3Temezfiee 3.6 2?l. 15.0
Alabam ----------------------------------------------------------------------- 10.0 22.1 89C 15.0 Ms5isGimi 24;022 10.5 2s.9 79: 17.s
Iie.tSouth Central 186,191 9.2 19.1 4,945 14.1 &moas 22,155 10.9 19.6 4ss 14.4 huisiwa 35,039 9.3 20.6 1,015 1s.3 Okl&om 27,.349 10.3 15.3 472 11.6 Texu --------------------------------------------------------------------------- 101,647 8.6 19.2 2,972 14.2
WET
7L,905 7.9 2,743 16.5 1,917 11,6
�
140nti 6,s67 9.5 222 19.5 1G2 14.2 IMo-------------------------------------------------------------------------- 6,479 e.a 247 17.C 1s2 12.5 wyOtinfl 3,070 8.7 112 19.4 87 14.3 Colorado-----------------------------------------------------------------------liewl<etia
18.6748;m
7.7 7.3 419
16.7 20.1
46S 265
12.1 12.7
tiizOm ------------------------------------------------------------------------ qe47 8.2 5s4 15.4 391 10.3 uti-------------------------------------------------------------------------- 7,595 &.6 354 12.7 252 9.0 Ii-ti 4,264 7.s 163 19.0 115 1.3.1
mific 230,255 8.4 5,919 14.9 4,2(X 10.5 W=ti@On 30.21z 9.0 782 16.4 535 11.6 Oregon-------------------------------------------------------------------------- 20:S06 9.4 E. 1 331 10.7 ~Lifornia 172;710 8.4 4,333 14.5 3,05s 10.3 Ahck 1,459 4.4 131 19.s 90 13.6 Btii------------------------------------------------------------------:------- 4,368 5.3 207 13.5 ME 10.9
‘Per 1,000 population in swcificd PUP.2Per 1,000 live births.

--------------
------------------------------------------------------
---------------------------------------------
-------------------------------------------------
---------------------------------------
----------------- ---------------------------------------
----- --
--------
---------------
-------------------------------------------------
------------
------------------------------------------------
-------------
-------------------------------------------
------------------------------
------------------------------------------------
---------------------------------------------------------------------
-------------------------------------
-------------------------
-------------------------------------
------- --------------------------- ------
----------------------------
----------------
-------------------------
-------------------------------------------------
------------------------------------------------------------------------------------------------------
--------------------- ----------------------------
----------------
----------------------------------------------------------------
--------------
.
MONTHLY VITAL STATISTICS REPORT
TabLe 2. AS227PGED IJ3’E TABLES BY C02KIR ,4ND SSX DN2TED STATES, 1973 [For eq,lemtim of the COlm, of the Life Table, o., Section 5 .& Vital .3t@1stics of tile United St.te,t 13692 V.alulw 22]
4GE INTERVAL
PER1OD OF LIFE OETHEEN TWO EXACT AGfS
STATED IN YEARS
[1)
x to.+”
70TAL
0-1-------------------------------—------1-5 —-—----—-—. -----—----—------—-. 5-10 —-------—-—--—--—------------—-. 10-15 -—------------— ----—
15-20 -———----— 29-25 -----— 25-30 --------—-----— 30-35 ---------—
35-40 ------—-----—--------— 40-45 45-50 --------—-------------— 50-55 --------—
55+0 —60-b5--------------—65-70 —--------------— —--------—70-75-------—-----------—--—----------
75-80-------------------------------------80-85 --------—---_ -—----—---— 85 AND OLIER-------------------------------
HALE
o-1 —---------------------------------1-5---------—----------— 5-10 --------------------—--------—------10-15 -----------------—------—----------
15-23 ---—---------—-------—20-2525-30 -----—-—-—--—------—30-35 ------------------_ --_ —-------------
35-40 ------------------_ --_-— 40-45 +5-50 -—-- —----------------------------— 50-55 ---—----------—----—
55-6060-65 —------------— ----------—---65-70 -—----—-----—--——--—-------—70-75------- —- —-—---— -—-— --—------
75-00 -------------------— —------------80-85 -------—-------------—-----—------85 ANO OVE R---------—-----— ---------—--
FEMALE
o-1 —-------—----------— 1-5--------- —-—--------— 5-lo 10-15 -—----------—-------——
15-20-----------------------—------------20-2525-30 ---—30-35 -— —-------------- —----------------
35+040-45 --------------------------------—---45-5.2 ------—--—50-55 -—-—--------—---— —--------------
55+060-6 S-—----—----—--—--—---------—--65-70 —- —--— —-.----—-70-75 —--------—
75-80 -----— —--—--—-— 00-a5---——--------—--—-— 85 &NO OVER-------------------------------
WHITE
o-l--------- —-----—--— 1-5-------------------- .—----------------5-lo--- —--—--------------— 10-15 --------—-----—--—-—
1s-20-------------------—----------------20-25 --—--------—-—---- ——------------25-30 -—-- —-—-----------——30-35
3540 -----— —----— 40+5 ——------------_-— __________ +5-50 50-55
55-69 --------—-------—--—60+5 —65-10 --------— -----— --—70775 -—------------_---__ —--------------
75-80 -------—80-8585 AND OVER-——---——-——
PROPOR11ON DYING 06 100.000 9@R!4 ALLVG S7ATIOL4RV POPULATION
NUMBER L lVING NUM8ER DYING IN 7HlS AND AT 8EG1NN{NG OF WRING dGE IN THE 3GE ALL SUBSEQUENT
bGE INTERvAL I% TERV4L INTERVAL AGE lNTFRVALS
13) 14) [5) 16)
“xq lx “x d . L. Tx
0.01 7! 100. OOC 1,76? $8,436 7,134,067 . od3, .002
98.231 97,925
312 2,3:
392,201 489,077
7.035,631 3,.643,430
. 002( 97,722 19t 488,163 6,154.353
.0051 97.524 544 406,372 5,666.190
.007 96.980 71< 483, 137 5.179,818 .007: 96.270 bee 479,654 4.696,661 .00% 95.582 78% 476,029 4,217,001
.011’ 94.793 1.10s 471,376 3,7+), 973 .0171 93.684 1.651 464,587 7.269,602 .0271 92.033 2.555 454.233 2,805.015 .040( 89.474 3.655 430,772 2,350.782
.0631 e5. 819 5.472 616,170 1.912.010
.092, 80,347 7.466 383,960 1,495,84o
.1311 72.801 9.577 341.370 1.111.872
. 19+( 63,304 12,334 286.57b 770,502
.288! 50.970 14,701 218.706 433,926
.391, 36.263 14.192 145.115 265,218 1.000{ 22,071 22,071 120.103 k20, L03
0.0191 100,000 1.973 98,241 6.756,651 .003: 98. Q22 3+a 391.259 6,658,410 .0024 97,614 236 487.740 6.267, 15L .0024 97.+38 251 486,6+0 5.779,411
.008( 97.187 782 484,160 5,292,771
.0111 96,405 1.068 4T9, 389 4.008.611
.0102 93.337 583 474.222 4,329,222
.0111 94.354 1.047 469,259 3,855.301
.0151 93.307 1,411 463,244 3,385.741
.0225 91.896 2.066 454.698 2,92.?.497
.036< 89.830 3.23E 44 L.672 2,467,799
. (353: 06.592 4.656 422.019 2,026.127
.0854 01.936 b,?96 393,09? 1.60+ 108
.1266 74,940 9.490 351,961 1.211,91L
.1795 65.450 11,750 290,605 859,050
.2564 53.700 13.771 234,454 580,445
.361C 39,929 14.416 163.517 325,991
. 464S 25.513 11.851 96.792 162.47+ 1.0!700 13,662 13,662 65.682 65,602
0.0154 190.000 1.536 98,641 7.527, ~80 .0028 98.464 275 393,190 7,429,239 .0017 98.189 165 490,482 7,036,349 .0015 90.020 143 489.761 6,545.567
.0031 97,017 299 488,685 6.035,306
.0036 97,578 352 407.040 5,567.121
.0040 97.226 393 405,191 5,080,>81
. 00S5 96.833 532 482.909 4.594.090
.0084 96.3U1 F112 479,607 4.111,981
.0130 ?5.489 1,238 474,553 3,632,374
.0230 94.231 1.888 466.843 3,157,919
.0287 92,363 2.652 455,552 2,690,976
.0436 89.711 3,911 439, 37.J 2,235,424
.0625 85.800 5,36! 4i6,373 1,796,054
.0910 w .439 7,321 384,903 1.379, b31
. 1+68 73.lla 10.735 349.102 994,778
.2366 62.383 14.762 276.405 654.676
.345> 47.621 16.429 1.5,073 37 R.271 1.0000 31. 19,? 31.192 181,398 L810398
0.0155 100.000 98,611 7,216,607 .0029 98.450 393,136 7,117.996 .0019 98.169 490,331 4,724,860 .0’319 97.970 469,464 6,234,529
.0054 97.709 327 487.730 3,745.065
.0065 97.262 632 484,745 5,257,335
.0060 96.630 584 481,699 4,772,590
.0068 ‘?4, 046 655 478,669 4.2%3,891
.0097 55.391 92s 474.797 3.012,222
.0152 94.462 1.43S 460.993 3,337,425
.0249 93.023 2,317 459,767 2,862+,432
.0375 90.706 3.403 445,542 2,408,665
.0.331 67.503 5.25( 424,15n 1,963,123
.0890 82,053 7.331 392.965 1.530,965
.1279 74,752 9,558 2.50,560 1,146,000
.1307 65,194 12.305 296,210 795.140
.2875 52.809 15.203 227,144 498,933
.3965 37.604 14.941 150,307 271,786 1.0000 22.743 7.2.743 121.479 12 L,479
,VEFA; F <EMAI NlNG L lFCT!ME
(7)
8X
71.3 71.6 67.8 63.0
58.1 53.4 48.8 44.1
39.5 34.9 30.5 26.3
22.3 18.6 15.3 12.2
9.5 7.3 5.4
67.6 67.9 64.2 59.3
54.5
27.5 23.4
19.6 16.2 13.1 10.4
8.2 6.4 4.8
75.3 75.5 71,7 66.8
61.9 57.1 52.3 47.5
62.7 38.0 33.5 29.1
24.9 20.9 17.2 13.6
10.5 7.9 <.8
72.2 72.3 68.5 63.6
58.7 54.1 49.4 44.7
;::;
39.8 26.6
22.s 18.8 ~5.3 12.2 m
9.4 7.2 5.3

------------------------
--------------------------------------------------
-------------------------------
--------------------------------------------
----------------------------------------
------------------------
-----------------------------------------
---------------------------
-----------------------
-----------
---------------------------
---------------------------------------
----------
-------------------------------------
-------------------- ----
----------------
-------------------------------
--------------
------------
--------------------
------------
------------------------------------------------------------------------
----------------
5 MONTHLY VITAL STATISTICS REPORT Table2.AB~ED L3FETABLES BY COLOR ANO SEX UNITEDSTATES,1973-COII.
[~o, qkn.tfon of the COlm. of the LifeTable,cm Smtkm : of VitnlStztistlc.of theUnitedSt,tes,1969,VolumeI?.]
m
m
AGE INTE.QVAL
PEA Iu!l lF LIFE RET!4Efk Tu’3 GXACT AGES
STATED IN Yeb QS
(11
.xtox+n
tiHr’7E, !+4LE
0-1-----. -----------_ -_----_ ----_ .------, 1-5-------— —-—-.--——— 5-1 J-------. _--—------——-— 10-15 -—---------------------------------
.?0-2 5-----—-—-----— ----—--__----_--,25-3030-35 -------—----------—
3 5-4 J-------_ ---—-—-—40-45 ------—---—----—45-50 -----—--—----------------------—-.5L1-3>-------—----—---------—---—------
55-63-—----— ------—----------—60-65
79-75 -------------------— _________
75-8080-85 —------------— -------—--—----u 5 A.(W WE R-—--—-———--------——--
W41TE, FEMALE
o -1---------—--—
5-10 ---——---------—-— 10-15 --------—
15-2d---------—_----------—-----------2Q-25---—--—---—--——-----—--—----
3J-35---—
3 5-4> --------— -—-------- —-----. --—---‘W-45 --------------—-----------—--—----45-50---—--—-—-—---———---------—
b5 ‘ad-----— —---—--——-----— 70-75 -----—-—- ———----—
75-80-------—----.. —--— ----— --------80-85--------—--————-—---— —------U5 A~W LWER--—---------—-_—
.ALL LITHFR
1-5----------—5-10 ---------------------------------—--lJ-1+-----—-—----------——---—---
15-20 -----— ----—--------—20-25 --------—25-30 -----—------------—------—--------35-35 -----------—------— —--------------
w+5------—------— _-——-— 45-5’2----—--—---- —-------- —--------—— 50-55
55-60-----— —----- —-—-— 60-65 —-----— -----— —-------b5-70--------—--------- — 70-75 ---------------—-----—-———----—
75-80 ----------------——--—--— 00-85—-—---— 85 ANO CIDER----—---------—
ALL IT7H!SR, t4bLE
0-1-—------------------—-—-—-----—--1-5--------- —-----------------------—--5-10----—--- —--—-——--—------—--15-1 5-------—----—_-----—
15-20 ----------------------------—------20-25 —- ——------——-------—---— 25-3 >- —-- —-—-------— 30-35-------------------------------------
35-40—--.——-—-—----_—
45-50 50-55
>5-6 a-------------- —---------------------60-65 --------— —------—k5-7d --------—------------------------—-70-75 -----——------—----—-—-—-—---
75-8 >--—-—-—----—-— —------------ELI-85 --------------------—------—-------S5 ANll WE !2--——--—--—— -—--—-—-——
VERAGE REMAIv-17F 11)0, Ch20 802N ALIVE ‘ 5TATIONAKY POPULAT19N lNG LIFETIME
NUNBER LIVING YUWER DY1!G IN THIS AND AT BEGINVING QF DURING AGE IX THE AGE &LL SUBSEQUENT
AGE INTERVAL IUTECVAL lVTERVAL AGE INTERVALS
(21 131 (4) (5) [6) (7)
. .,d . L . T, .x
0.0175 133.33 1.754 98,425 6,842.18, 68.4 .0032 98,24, 31? 392,252 6, T43,76, 68.6 .9023 97,93 221 489,076 6,351.51: 64.9 .0024 97,71, 237 488,04: 5,862,43( 60.0
.0078 97.47 761 485,64: 5,3 T4,3% 55.1
.,1099 %,71. 95t 481,191 4,808.75( 50.5
.0086 95.751 826 476,704 4,407,55~ 46.0
.0091 5+.93, 664 472, 59C 3,930,05! 41.4
.0125 94.051 1.17$ +67,604 3,458,26! 36.8
.0Lq5 92.08< 1,815 4t 3,272 2.990, 66) 32.2
.0325 91.07, 2,96? 448,55E 2,530, 38C 27.8
.G499 ila,ll 4,393 430,257 2.081s 83: 23.6
.0814 83.71! 6,812 w2, +92 L,651,57A 19.7
. 122a 76, Q(I< 9,447 361,94e 1,249,00i 16.2
.1769 67,45< 11,935 308,271 887, 13: 13.2
.2524 55.52, 1+.1214 243.082 5T8,86; 10.4
.36 ;6 41.51( 15.011 169,9TC 335,78( 8.1
.4718 26.49C 12,503 100,005 165,01< 6.3 1.09’7> 13.99( 13.994 65,805 65,80! 4.7
0.0133 100,00( 1,334 98,808 7,607,651 76.1 .9025 38,6.3( 246 394,076 7,508,84? 76.1 .0016 98.42< 160 491.664 7.114,767 72.3 .001+ 98,26( 139 490,973 6,623.10: 67.4
.0029 98.12: 284 409,939 6,132,13: 62.5
.0031 97,831 395 488,445 _ 5,642,191 57.7
. 003+ 97, 53; 336 406,857 5,153 .7Jt6 52.8
.0046 97.19: 444 404,938 +,666,88< 48.0
.0010 96,75: 678 482.187 4,181,951 43.2 .0110 9.5,07: 1,060 477,917 3,699,764 38.5 .0177 95,015 1.677 471,168 3,221,847 33.9 . 0?59 33. 33[ 2.414 460,995 2,750,675 29.5
.0402 90. Y2Z 3,65~ 446,073 2.209,684 25. Z
.0583 87.26( 5,091 424,436 1,043,611 21.1
. 2s66 82.17! 7.120 394.165 1,+19, 175 17.3
.1396 75,055 10,476 350,530 l,025,0K 13. T
.2348 64, 57! 15,166 286,504 67+,483 10.4
.3490 .49,41; 17,245 203,799 307,97t 7.9 1.0000 32,16t ?2,168 184,177 18% 171 5.7
0.0276 lJC, C7C 2.757 97,616 6,590.158 65.9 .0068 97.243 +70 387.800 6,492,542 66.8 .0027 96,773 264 483,142 6,104,742 63.1 .3026 56.5QS 24s 481,979 5,621,600 58.2
.0067 96.26C 647 479,8+9 5,139,621 53.4
.0125 95.613 1,198 475.229 4,659,772 48.7
.0152 94.415 1,435 468.638 4,184.543 44.3
.0182 92, WD 1.69G 460,883 3,715,905 40.0
.0254 91,290 2.314 450,997 3,255.922 35.7
.0348 E8..76 3.099 437,503 2,804,025 31.5
.0512 S5,877 4,398 419.010 2,366,522 27.6 .0694 81,479 5,655 353,971 1,947,512 23.9
.0988 T5,824 7,492 36 L ,057 1,553,5+1 20.5
.1286 69. ?32 8,79C 320,149 1,192,484 17.5
.1633 59.542 9,720 273,643 972,335 14.7
.2581 4?, 822 12,85,C 2i6.686 590,692 12.0
.3013 36.%2 11,135 156.682 382.006 10.3
.3287 25.327 8.489 197,414 225,324 8.7 1.0000 17.3%8 17,338 1L7,91O 117,910 6.8
0.0304 10 C.O3> 3.040 97,368 6,186,532 61.9 .0054 96. Q60 525 386,526 6,089,164 62.6 .0039 96,435 316 481,525 5,702,638 59.1 .0034 96.119 326 479,888 5,221,313 54.3
.0095 95,793 908 476 ,96L 4,741,443 49.5
.0191 94. RL15 1.810 470.123 4,264,504 44.9
.0233 93,075 2, 1e6 460,068 3,794,381 +0.8
.0260 9Q.8L?9 2,363 4+8,775 3,334,313 36.7
.0347 88,526 3.074 435.364 2.883,538 32.6
.9453 8>, +52 3.873 418,035 2,450.174 28.7
.0651 81.579 ..357 395.239 2,032, 139 24.9
.0883 76,222 6.733 365,069 1.636.909 21.5
.1252 69.489 8.69~ 326.302 1.271,840 18.3
.1614 66,792 9,811 280,014 945,458 15.6
.2029 5U.979 10,342 229.168 665,444 13.1
. 29fT3 40,637 11.961 172.633 436.276 10.7
.3541 20,676 1’2,155 11?,474 263,643 9.2 .3815 18.521 7.065 74.373 146,169 7.9
1.00J0 11 .f?>b 11.456 71,756 71,796 6.3

--------------------------------------
----------------------------------------------------------------
-------------------------------------------------------------------------------
--------------------------------------------------------------------------
--------------------------------------------- -------------
----------- -----------------------------------------------
------- ---------
------------------------------
----------------------------------------------------------------------
----------------------------------
---------------------------------
------------------------------------------------------------------
---------------------------------
------------------------------------------------------------
----------------------------------
-----------------------------
---------------------------------
---------------------------------
------------------------------------------------------------------
---------------------------
6 MONTHLY VITAL STATISTICS REPORT
Table 2. AB2UGED L3FE TA8LES BY COLOR AND SEX UNITED STATES, 1973-COn. s
[For eqlana%io.of the column,c.,the m,, wM., .,.3ect10n5 of Vita.1 Statlz%ics of the u“itd States, 1969> Volume II]
bVERAGE llEMAIN-OF 100,000 30RN AL lVE STATIONARY POPULATION lNG LIFETIME
AVERAGE NUUOFR
PkR1OD OF LIFE BETwEEN Tkl!l EXACT AGES NUUBER LIVING NUMBER DYING IN THIS AND OF YEARS OF LIFE AT UEGINMING CF DU$l$!G AGE IN THE &GE iLL SU8SEOUENT REMAINING AT
&GE INTERVAL INTERVAL INTERVAL \GE TNTEPVALS BEGINNING OF AGE 1t4TERV&L3
{1) {21 [s) {4) (5) [6) I (7 I
xto, +” “’?x 1, d L “x n.
&LL OTHER, FEMALF
0-z---------—-. ---_ --_---— 0.0247 100.000 2,466 97,871 7,006,271 70.1 1-5--- —------— . 00+3 ‘97.534 415 389.105 6,9a8,43il 70.8 5-10 .0022 97,119 211 485,005 6.519,295 bl.1 10-15 -----—-— .0018 96.908 171 404.139 6,034,290 62.3
15-21 ----------------__ -_—________________ 20-25
.0040 .0066
96.737 56.352
385 636
482,818 43a,270
5,550,151 5,067,333
57.4 52.6
25-30 —-----------------—---------- .0081 95.716 771 f.7b,172 4,587,063 47.9 30-35 .0115 94,945 1.091 472,160 4,110.291 43.3
35-40 .0176 93,354 1,652 465. 38ti 3,630,131 38.0 4045 .0260 qz, zoz 2.395 455.307 3,172,743 34.4 45-50 -----------_ ---___-__ —-------------- .0336 89,8$7 3.466 440,868 2,7 L7, +S6 So.s 50-55 ---------------______— ______________ .0525 36,341 4,533 420,90+ 2,276,560 26.4
55-50 .0753 81,803 6.161 39+,257 1,055,584 22.7 60-65 —------------— .0996 75.647 7.538 359,716 1,461,327 19.3 65-73 --------— — .1302 68.109 8.868 S18,691 1,101,611 16.2 70-75 .2256 59.241 13.367 26,!.951 782,920 13.2
75-80 —-----------------— I .2585 45.074 11,857 199,732 519,969 11.3 30-85 --------—---------------—---------- .2904 34.017 9,87’7 145,025 320,2S7 9.+ 05 AND OVER--—-----------------------—-- 1.0000 24.140 24,140 175, L12 175,212 7.3
Table S. DEATHS AND DEATH RATES BY AGE, COLOR, AND SEX UNITED STATES, 1973
[Refers only to re,ldent deaths occurring within the Unltcd States. Siat.smper PI0,1300ertimted pop.latio” in apeczfled age group]
!iMte A22 other
Age
Eoth sexe~ Male Female ?th sexes =_T== oth sexes mt-
AU ages 1,973,003L- 1,096,795 876,20S 1,728,405 957,918 770,407 244,59S ===4=== Unaer 1 year-------------------------------- 55,581 31,986 23,595 40,239 23,414 16,825 25,342 8,572 6,770 1-4 yews 10,843 6>178 4,665 8,139 4,830 3,481 2,704 1,520 1,1s4 5-9 yearn 7,514 4,462 3,052 3,933 3,510 2,425 1>379 e32 627 10-14 years --------------------------------- 5,458 3,480 2, 9s8 6,814 4,3ss 2,425 1,654 1,091 5s3 13-19 years --------------------------------- 22,9o8 16,723 6,165 10,872 13,8s3 4,987 4,03e 2,838 1,1S8 20-24 YeS.?? S--------------------------------- 26,549 le,e36 6,593 20,3S3 15,495 4,8i9e 6,186 4,461 1,705 25-29 year 22,205 15,872 6,332 16,482 11,775 4,707 3,723 4,0s7 1,626 30-34 yam--------------------------------- 21,512 14,244 7,268 25,51C 10,288 5,22S 6,002 3,956 2.046 33-39 years --------------------------------- 26,374 16;632 9,742 19,195 12,1s1 7,014 7, 17s 4,431 2;728 40-44 years 40,913 23,32S 15,3s5 31,069 19,6S9 11,40C 9,844 5,859 3,S85 45-49 years --------------------------------- 67,349 42,387 24,962 33,694 34,20s 19,4s6 13,655 5,179 5,476 50-54 years --------------------------------- 96,667 62,2S4 35,7s3 51,140 52,363 28,777 17,327 10,521 7>006 53-59 years --------------------------------- 133,604 86,333 47,251 114,196 74,789 39,427 19,40e 11,3s4 7,S24 60-64 yews 176,973 114,423 62,550 152,610 100,070 52,34C 24,3S3 14,353 10.010
.63-69 years 213,495 133,071 80,424 186, e3a 118,011 8S,S27 26,6S7 2.5,060 11;397 70-74 year, 241,166 138;988 102,178 213,036 124,038 89,02C 28,110 14,932 13,156 75-79 yearn--------------------------------- 263,231 137,402 125,849 241, 73? 126,0ae 125,645 21,53.8 11,314 10,204 80-84 ye&s 250>9S3 115,S08 135,077 235,034 108,125 126,909 2.5,531 7,783 8,16!3 85 yews ana over iwtst~t~a
284,100 546
107,961 357
176,139 109
267,107 359
100,750 234
166,337 125
16, S93 187
7,211 9>782 123 34
NUMBER
m Pm 100,000 POPULATION I All aged e40.2 1,072.9 814.2 944.2 1,071.2 823.C 912.6
under year-------------------------------- 1,803:2 2,032.1 1,566.6 1,5s3.1 1,776.3 1,342.8 3,020.1 3,335.4 2,697.2 1-4 years ----------------------------------- 79.5 88.8 6S. 9 71.4 79.8 62.5 121.1 lS5. 6 106.4 5-9 years ----------------------------------- 41.5 48.4 34.4 39.0 45.2 32.6 54.3 65.5 43.5 10-14 yewe 40.6 51.3 2e.2 30.5 28.1 51.7 67.9 35.3
=4== 1
156.6 20-24 ye~S --------------------------------- 146.8 222.6 72.3 130.4 198.6 62.4 251.9 394.6 7.S2.4 25-39 yE@ZS--------------------------------- 143.5 201.3 51.0 121.1 173.3 6S.1 306.0 474.7 162..6 30-34 years --------------------------------- 1s5.7 223.1 110.2 136.8 1S2.7 91.5 366.4 52S. 1 230.9 35-3s yea-s--------------------------------- 235.1 304.5 2.69.3 195.5 252.1 140.7 512.8 783.4 354.7 4044 yews --------------------------------- 355.2 434.2 260.9 306.8 394.3 221.8 707.7 S25. 6 525.7 43-49 yen-s 5s3.3 732.8 4U4. 4 503.9 660.4 355.9 1,04s.8 1,354.1 765.7 50-54 yam--------------------------------- 832.8 1,103.0 382.1 763.6 1,020.7 323.6 1,434.3 1. S42.6 1.076.2 55-59 ym,,m--------------------------------- 1,314.3 1.779.0 S89. 8 1,237.5 1;692.0 819.9 2,073.5 2;663.0 1;361.7 SO-64 ye~--------------------------------- 1,943.9 2;693.5 1,287.3 1,.957.5 2,609.4 1,199.3 2,743.6 3,500.7 2,094.1 65-69 years--------------------------------- 2,804.7 3,933.5 1,901.7 2,723.6 3,870.3 1,606.0 3,549.5 4,309.0 2,781.1 70-74 years --------------------------------- 4,302.7 5,671.9 3,155.6 4,133.1 5,763.S 2,es6.3 5,930.4 6,922.2 5,080.3 75-79 yam 6,722.4 6,61S.5 5,539.4 6,692.5 8,829.7 5,292.7 7,101.7 8,636.6 3,932.S 80-84 yews 9,777.4 12,239.5 S,343.2 S,93S.0 12,300.0 8,460.6 7,696.3 9,491.5 6,606.7 S5 years end over 17,429.4 19,809.4 16, Z34. O 17,983.6 20,436.1 16,665.S 12,137.9 13;605.7 I 11,113.9
15-19 Yeas---------------------------------r111.s 161.4 ml 100.0 748.6 37.9 134.7 190.2 79. s
m
‘Figures for we n.tstated includeain “mlqea’’b utn&diDttibticdm.w agegr.ups.

-----------------------------------------
--------------------------------------
-----------------------------------------
-----------------------------------------
----------------------------------------------------------
----------------
-----------------------------------------
MONTHLY VITAL STATISTICS REPORT
Table 4. DEATH RATES BY AGE, COLOR, AND SE= UNITED STATES, 1960-73
[Ratee per l,NW pqllatim in cpecified Croup]
All Ihder 1-4 5-14 E-24 ?5-34 55-4=4 45-541Color, sex, and year lx-d 1 year years
I yearz imrs years years
nmu,
1973=----------------------------------------- 9.4 la 1 %8 1.3 1.5 3.0 7.0 1972~>~-------------------------------------- 9.4 3s.3 o. a L 3 1.5 3.0 7.1 1971~----------------------------------------- 9.3 19.0 0. a 1.3 1.B 3.L 7.1 197$----------------------------------------- 9.5 21.4 o. a 1.3 L 6 3.1 7.3 1969------------------------------------------ 9.5 21.5 Q.9 1.3 1.6 3.2 7.3 1968------------------------------------------ 9.7 22.3 0.9 1.2 1.6 3.2 7.5 1967----------------------------------------- 9.4 22.3 0.9 1.2 L 5 3.1 7.3 1966------------------------------------------ 9.s 23.3 0.9 L 2 1.5 3.1 7.4 1963------------------------------------------ 9.4 24.1 0.9 1.1 1.5 3.1 7.4 1964----------------------------------------- 9.4 24.6 L o l-l L 5 3.1 7.4 1963------------------------------------------ 9.6 23.3 L o 1.1 L 5 3.0 7.5 1962------------------------------------------ 9.5 25.3 L 0 L o 1.5 7.4 1961------------------------------------------ 9.3 23.4 L 0 L o 1.4 :; 7.3 196G 9.5 27.0 L 1 1.1 1.5 3.0 7.6
. M73------------------------------------------ m. 7 20.3 0.9 1..9 2.1 3.6 9.2 1972223 3.0.8 20.6 0.9 1.9 2.1 3.9 9.4 1971~----------------------------------------- 10.7 21.4 0.9 1.9 2.1 3.9 9.3 197F----------------------------------------- 10.9 24.1 0.9 1.9 2.2 4.0 9.6 1s69------------------------------------------ 11.0 24.2 0.9 L 9 2.2 4.1 9.6 1963------------------------------------------ Il.1 25.2 0.9 L 8 2.1 4.1 9.8 1967----------------------------------------- 10.8 25.2 L 0 3..7 2.0 3.9 9.6 196&---------------------------------------- 11.0 26.3 L o 1..7 2.0 3.9 9.8 Igm----------------------------------------- m. g 27.1 L 0 1.6 2.0 3.9 9.7 19E*----------------------------------------- 1!2..9 27.7 L o sI.. 2.0 3.8 9.7 19s:------------------------------------------ 11.1 m. 6 1.1 L 5 1.9 3.B 9.8 19$2----------------------------------------- 1,?.9 2.2.7 L c1 L 5 1.9 3.7 9.7 19Q1----------------------------------------- 1’..7 2%.6 1.1 1.5 1.8 3.7 9.6 1.26L?------------------------------------------ u. ,3 39.6 1.2 1.5 1.9 3.7 9.9
mrm
gM73~----------------------------------------- 8.1 & 7 ?.7 n? ,-,. 2.2 4.97 <g. L ,> 2.2 ~.,,197z2~3-------------------------------------- a.1 & g !>. 7
~ 71971~----------------------------------------- ~.,7 ~lj. t 7 ,1. 1.!3 2.3 5.07U7$-- .......-..----------------------------- 8.1 M. 6 ..g ,?. 1.0 2.3 5.2
lg~g-----— ....-...-......-------------------- & 1 Is.6 ‘~.9 m 7 1.0 2.4 s.1~ 7 31963----------------------------------------- 8.? 19.2 ~,. <:,. 1.0 2.4 5..sl’3G7----------------------------------------- 8.,7 19.4 ‘?. ?.(3 L ,3 2.3 5.1
19s6---------------------------------------- s.1 2:’.3 ‘>. 69 c>. L 1 2.3 5.2M&------------------------------------------ 9.r! 2*.g ‘.. 0.6 L.1 2.3 5.2s15$;G /3. go 21.4 ,?. 0.c 1.1 2.3 5.2
s19s5----------------------------------------- 8.2 21.El :,q r!. 1.1 2.5 5.263.1 21.9 ~.9 c!. 1.1 2.3 5.2
lqE1----------------------------------------- 7.g 22.0 ~,2 n.G 1.c1 2.2 5.1 u~b--------------------------------------- 8.1 22.2 L n c1. 1.1 2.3 5.36
,XHI m .
1$73------------------------------------------ 9.4 E. 7 ,J.-/ L 2 L 3 2.s G.371972==--------------------------------------- s.5 M. 9 ‘3. L2 1.3 2.6 6.5
1571~----------------------------------------- 9.4 LG.6 Q.7 L 1 3..3 2.6 G.51~7$----------------------------------------- S.s 3.3.7 ‘5. I-2 L 3 2.7 6.73 -. .. !?.5 19.2 0.a L 2 1.3 2.7 6.6
gIqfis g.is 19.Ei ,~, L 1 L 3 9.7 6.9 c1367------------------------------------------ g.& 1$(. e.9 3..1 L 3 2.7 6.7
g19s6------------------------------------------ 9.5 27.2 !?. 1.1 1..3 2.7 6..3g r, L 3 2.6 & 819=------------------------------------------ 9.4 2-,.? ,~. 3..
1%4------------------------------------------ 9.4 21.: L ‘1 l.~ 1.5 26 s.ij
19634....— ................ 9.E 22.2 L ‘> L <n 1.5 2s !3.g519624 9.d 22.4 L n L ‘3 1.2 2.6 (G.
1961------------------------------------------ 9.3 22.5 1.0 L ‘i L 2 ?.5 6.7196c------------------------------------------ 9.s 23.6 L 1 L n 1.2 2.6 6.9
I’mI’m,ILK(I
71973= -----....-.-----------— l.c. 17.8 & 9 L 8 L a 3.2 8.‘i1972=~3-------------------------------------- lQ.g la.o !3..2 1..7 1.7 5.3 EL619712----------------------------------------- 10.7 19.8 0.9 L 7 L 7 3.3 R.s 1970=----------------------------------------- la 9 21.1 ~,2. 1.7 1.9 3.‘i R.9 1969------------------------------------------ g1,:, 21.e Q ~ La 1.8 3.: 8.9 1962----------------------------------------- 32.1 22.7 9.e L 7 1.7 3.s 9.1
a1967------------------------------------------ I.cl. 22.4 1.g 1.6 L 7 3.4 9.0
1966------------------------------------------ 10.9 23.0 1.0 1.6 1.7 3.4 9.11965----------------------------------------- 12.a 23.7 L o 1.5 1.7 3.4 % o1264-------------------------------------—--- 1!.8 24.4 L n 1.5 1.7 3.4 g.j
1965%---------------------------------------- 11.c1 25.2 L 1 1.4 1.7 5.3 9.239624 m. u 25.5 1.n 1.4 1.s 3.3 9.11961------------------------------------------ 10.7 25.6 1.1 L 4 1.s 3.3 9.0196C------------------------------------------ m 0 26.9 1.2 1.4 L 6 3.3 9.3
See footnotes at end of table.
7
55-24 75-84 5 years years fears nd over1
16.1 34.4 79.3 174.516.3 35.3 79.7 173.516.2 34.9 78.7 174.316.6 35.8 60.0 163.416.6 37.4 79.0 190.817.2 38.5 80.8 196.116.7 37.5 79.0 194.217.0 38.4 81.7 200.516.9 37.9 61.9 202.017.0 37.8 81.8 200.217.3 3%.9 85.2 210.116.9 38.0 84.3 204.716.7 37.2 83.6 1.25.917.4 38.2 87.5 128.8
22.1 47.3 10L 1 3.98.1 22.3 48.2 10L 2 I.%.o 22.3 47.6 99.2 3.27.5 22.6 48.7 100.1 17a.2 23.1 50.3 97.8 1.25.5 23.7 51.9 98.8 205.9 23.0 [email protected] 96.2 203.8 23.3 51.2 96.5 2C9.3 23.1 50.5 98.2 21.2.a23.0 49.9 97.1 210.423.2 51.1 LOJ.7 224.622.6 49.4 98.7 219.022.4 48.1 97.8 2m. 123.1 49.1 IOL 8 21L 9
10.q 24.~ 63.6 162.31?.u 25.3 63.s 162.nIn.~ 2s.o 6s.3 162.2u. n 25.8 66.8 lss.2u. 1 27.1 fi6.3 L2a.on. 4 27.8 69.3 321.7
gU..1 27.3 Ijs. 19s.sm 2 29.1 69.6 3.2s.1IL.3 27.7 70.0 1s5.3
4I.I.. 27.8 70.4 193.8n. a 2s.% 73.5 201.433.6 ’23.3 73.3 196.011.5 27.9 72..9 187.8m. n 2s.7 76.3 190.1
E. z 33.4 79.8 179.3 3.5.5 34.3 90.2 178.6 Is.4 33.9 79.1 179.1 E. s 34.9 80.4 169.9 15.&7 :5.,g 79.8 2G2.2 le.2 s8.9 83..6 23s.9 LE.Q 33.1 8%@ 203.8 16,.1 37.c1 S2.6 209.g
nle.. 38.7 W. 9 209.8 1$.n ~& ./ S2.7 207.0 m 2 37.5 25.8 213.5 w 9 .%.8 s Q 202.2 m s 36..$ 94.7 202.3
16.3 37.4 Sg.3 203.5
2*.2 +6.5 102.1 204.4m..% 47.5 1’2.3 2C2.72L 5 L?.o KY?.3 204.222.0 4%1 lQ1.0 125.5gp.2 4% 9 S9.8 2&% 922.7 so.s lm. 0 213.622.2 <~.9 97.6 21.3.122.5 49.a 99.9 21s.62?.2 4s.3 99.7 222.42?.1 439 99.6 218.222.3 49.8 Igl.8 230.021.8 d% 4 103 n 223.921.6 47.4 99.4 23.3.9~~.~ ‘is. 103.0 217.35

--------------------------------------
-----------------------------------------
--------------------------------
----------------------------------------
---------------------------
-----------------------------------------
------------------------------------
---------------------------------------
-----------------------------------------
-----------------------------------------
---------------------------------------
-----------------------------------------
8 MONTHLY VITAL STATISTICS REPORT
Table 4. DEATH RATES BY AGE, COLOR, AND SEX UNITED STATES, 1960-73—Con.
IRates per 1,(KY)population in specified Ero.p)
. All Under 1-4 5-14 S-24 25-34 55-44 43-54 55-64 S5-74 75-84 15 years
Color, sex, and yew ages1 1 year years years years years years years fews years ma me P
WHITE, FEMALE
19732-----------------------------------------T
13.4 0.6 0.3 0.6 0.8 1.6 4.4 10.0
I
23.2 65.8 166.9e. 2 19722J3 - 8.2 13.4 0.6 0.3 0.6 0.6 1.9 4.4 10.0 24.2 66.2 166.6 1971~----------------------------------------- 8.1 13.2 0.7 0.3 0.6 0.8 1.9 4.5 10.0 23.9 65.8 166.3 197F 8.1 16.1 0.6 0.3 0.6 0.8 1.9 4.6 10.1 24.7 67.0 159.8 1969------------------------------------------ 6.2 16.4 0.6 0.3 0.6 0.6 2.0 4.5 10.1 25.5 66.9 198.0 1968------------------------------------------ 8.2 16.6 0.8 0.3 0.6 0.8 2.0 4.7 10.4 26.2 66.9 200.11967------------------------------------------ 8.0 16.7 0.8 0.3 0.6 0.8 1.9 4.6 10.1 23.9 67.6 167.01966------------------------------------------ 6.1 17.3 0.a 0.3 0.6 0.9 1.9 4.6 10.2 26.7 70.2 202.71965----------” 8.0 17.9 0.8 0.3 0.6 0.9 1.9 4.6 10.2 26.4 70.6 202.11964------------------------------------------ 8.0 18.5 0.9 0.3 0.6 0.9 1.9 4.6 10.3 26.7 71.1 200.019634i 8.1 19.0 0.9 0.3 0.6 0.9 1.9 4.6 10.5 27.3 73.9 206.619624----------------------------------------- 8.0 19.1 0.9 0.3 0.5 0.9 1.9 4.6 10.4 27.1 73.8 199.7
4 196C------------------------------------------ 8.0 20.1 1.c 0.3 0.5 0.9 1.9 4.6 10.8 27.8 77.0 164.8
ALL OTI+ZR
1973~----------------------------------------- 9.1 30.2 1.2 % 5 1.9 3.3 6.1 l?.4 24.0 447 74.2 121.4 19722,3----------- 9.2 31.3 1.2 0.5 2.0 3.5 6.4 L?.6 24.1 44.9 73.4 116.5 19712----------------------------------------- 9.2 32.5 1.3 0.5 2.1 3.6 6.5 3.2.4 23.6 44.1 72.7 116.9 197F----------------------------------------- 9.4 36.0 1.3 0.5 2.0 3.5 6.6 12.9 24.3 44.9 75.1 107.5 1686------------------------------------------ 9.6 32.0 1.3 0.6 2.1 3.7 7.1 13.2 26.2 35.6 69.3 99.6 196& 9.9 33.6 1.4 0.6 1.9 3.a 7.2 13.5 27.3 57.7 71.2 11.1.5 1967------------------------------------------ 9.4 35.4 1.4 0.6 1.7 3.5 6.7 12.9 25.5 53.7 67.3 108.5
9.7 38.8 1.5 0.6 1.7 3.5 6.s 13.2 26.4 55.2 71.2 120.0 1965------------------------------------------ 9.7 40.2 1.5 0.6 1.6 3.4 6.6 L3.o 26.6 32.6 70.2 1.23.5 198+----------------------------------------- 9.7 40.6 1.6 0.6 1.6 3.3 6.6 13.2 27.1 50.6 69.6 1.2e.. o 19634----- 10.1 41.3 1.7 0.6 1.6 3.2 6.5 13.2 27.9 53.0 74.4 145.7 19624----------------------------------------- 9.8 41.2 1.7 0.6 1.6 3.1 6.3 l?.9 27.0 49.7 72.0 144.0 1981------------------------------------------ 9.6 40.8 1.7 0.6 1.3 3.1 6.2 12.7 26.6 47.1 70.1 142.3 196&----------------------------------------- 10.1 46.3 1.9 0.6 1.6 3.2 6.3 13.4 27.7 47.8 76.3 136.1
ALL OTHER, MALE
1973=----------------------------------------- 10.e 33.4 1.4 0.7 2.6 5.0 8.2 E. 9 30.7 54.6 89.7 136.1 16722>s 11.0 34.4 1.3 0.6 3.0 5.1 8.7 16.4 30.7 54.9 89.4 133.3 16712----------------------------------------- 10.9 36.1 1.4 0.7 3.1 5.2 8.5 E. 7 30.1 53.8 67.5 3.33.5 167&’ 11,2 40.2 1.4 0.7 3.0 5.0 8.7 16.5 30,5 54.7 89.6 114.1 1969------------------------------------------ 11.3 35.4 1.4 0.7 3.0 5.2 9.4 16.9 32.5 66.5 84.1 101.7 1966------------------------------------------ l.).. 36.9 1.5 0.7 2.8 5.2 9.2 17.0 33.6 89.8 85.1 11.5.6
1961------------------------------------------ 7.8 19.3 0.9 0.3 0.5 0.a 1.9 4.3 10.3 27.0 -/3. 192.0
6 1967------------------------------------------ 10.9 38.8 1.5 0.7 2.5 4.6 8.5 16.1 30.6 65.0 79.1 114.3 m 1686------------------------------------------ 11.3 42.6 1.8 0.1 4.6 8.5 18.3 31.6 66.9 82.1 127.0 1965------------------------------------------ 11.1 44.5 1.6 0.7 :; 4.4 8.1 15.9 31.3 63.8 al.3 130.7 196+----------------------------------------- 11.1 45.1 1.7 0.7 2.1 4.3 8.1 3.5.7 31.3 61.4 79.2 134.3 19634 11.3 46.0 1.9 0.7 2.2 4.0 7.6 15.7 31.8 64.4 65.0 161.6 19624----------------------------------------- 11.2 45.6 1.8 0.7 2.1 3.9 7.4 3.5.3 30.5 59.5 80.5 161.0 1961------------------------------------------ 10.9 45.2 1.8 0.7 2.1 3.8 7.2 14.7 30.0 56.z 78.2 155.9 1960------------------------------------------ 11.3 51.9 2.1 0.6 2.1 3.9 7.3 3.5.5 31.5 58.6 86.6 132.4
ALL O’lTUiR,FEMALE
19732----------------------------------------- 7.6 27.o 1.1 0.4 1.0 1.9 4.4 8.3 18.2 38.6 62.9 ill.219722JS 7.6 26.2 1.1 0.4 1.0 2.1 4.6 9.3 16.3 36.8 61.6 109.4
7 19702----------------------------------------- 7.8 31.7 1.2 0.4 ?“1 2.2 4.9 9.8 18.9 36.8 63.6 102.9 1966------------------------------------------ 8.0 26.6 1.2 0.4 1.1 2.4 5.2 10.0 20.6 46.1 58.5 68.1 1968------------------------------------------ 8.3 30.2 1.2 0.4 1.1 2.5 5.5 10.3 21.5 47.6 60.9 106.9 1967------------------------------------------ 7.9 32.0 1.2 0.4 1.0 2.5 5.1 10.1 20.6 44.1 57.4 1D4.1 1966------------------------------------------ 3.3 35.n 1.4 0.5 , 1.0 2.5 5.3 10.4 21.4 45.2 62.2 114.6 19=------------------------------------------ 6.2 36.~ 1.4 9.5 1.‘1 2.5 5.4 10.4 22.2 42.9 60.6 117.9 1964------------------------------------------ 8.3 36.1 1.5 Q.5 1.0 2.5 5.3 10.9 23.0 41.4 61.3 123.3
7
19712 7.6 29.0 1.1 0.4 1.1 2.2 4.a 9.5 16.3 36.3 62.0 I.I.?.
19634----------------------------------------- ‘?. 36.5 1.$ 0.5 1.0 2.6 5.5 11.0 24.2 43.1 65.4 137.119624----------------------------------------- 9.5 36.6 1.5 0.5 1.1 2.5 5.4 10.7 23.7 41.2 64.4 134.B
6.4 36.4 1.6 0.5 1.1 2.5 5.3 10.6 23.4 3a.9 62.9 L32.o1960------------------------------------------ 9.7 4Q.7 1.7 m 5 1.1 2.6 5.5 11.4 24.1 39.8 67.1 329.7
%Sgures for age not stated included in “All ages” but not distributed mong age wcmps.2Excludes deaths of nonresidents of the United States.‘Based m 8 50-pez’centsmple of deaths.4Figures by color excludes data for residents of New Jersey.
------------------------------------------------
--------------
--------------------------------------------------------
--------------------------------------------------
------------------------------------------------------------------------------------------
-------------------------------------------------
-------------------
-----------------------------------------------------------------------
-----------------------
-------------------------------------------------
----------------------------------------------------------------------
-------------------------------------------
---------------------------
---------------------------------------------------
---------------------------------------------------------
-----------------------------
---------------------------
-------------------------
---------------------------------------------------------
------------------------------------------------------
----------------------------------------------------------
e MONTHLY VITAL STATISTICS REPORT 9
Table 5. DEATHS AND DEATH RATES FOR MAJOR CA?JSES OF DEATH FOR THE UNITED STATES, EACH REGION, DIVISION, AND STATE: BY
COLOR AND SEX FOR THE 7JNITED STATES 1973
[Zy plrwr, of re.i,,nc’,. . R.tes Fr 100,CLW estimated ~pula.tionRefers on !:rto rezidcnt deathz occurrin~ witnin the Lhfttd Stxte:. Ex hi..: fc?ti. 1 d’,zih~r)ur,,bersIn e%ch colcm-zex rrci!nanflnrez. I:umberz aft. r mu.c. of death m-c c-.terc.r.! of the Zichth Revizi.sn,International Classification of Diseases,
1, La?tcd, 1365] - -
J31z,cmc: d hexrt All resident: l.iotorvehicle(339-39 s,402 ,4.4,
41O-’4Z!9 (E:02-E349) ,.cide”ts (ES1O-W323))
km, :andureaCo 2.x,
Unitei %atrx-----------------
,,,@le--
Fcmsle--White---------------
l,>le-.--
Fcmzlc--All other-----------
l,~le---
Fcmsle--
2ic@0ns:
OorthcxstI!orthCentk%l
Wet---------------—
COW2!62A2T
New Ensle.ndl.icliixWcw E2mpsMreVermontM.smtchuzettzLihodcIclundComecticut
Mlddlc AtlanticllcvYork--------------------—-----Km Jcrs,zyPcnn::rlvnrilo
Immi CIXTRAL 7htIh’th Ccutr.al
Ohh----------------------------
b%m.r-----— IUkoiz:.fic~fl:=,
Xiz?,m-zin--------------------------Wlzt.I:;rtkl l------------------c.:r,tr~12.?2?M2QJL2------------------------
:Uczmrf---------------------------Corth Blast>----------------------Couth D,Iktw--------------------t:cbrzl----.-.--.-------—-------
:WfH
SO,uth.ntlnmtic Cfll% x----------------------------IJlqrlmd-----------.-------—----DIstrIct or Cc$lmbia---------------Vir@nichht ,Vir@ninLiorthcxralin->------------------South Cwolir.&--------------------GeOr@ a----------------------------Flori&----------------------------
E1zt South Ccntrsl~MitUC$JTenncxecAlabu~----------------------------Missiecippi
West South CentralArkurszbuiGim2--------------------------Oklahoma‘IexaJ----—
Maunt%in!.:ontarriI&ihoWyoming---------------------------Colorado
Wew Mexico
Arizona ----------------------------
Utah-------------------------------Wevxkk
Pacific,Wachin@an--------------------------OregonCaliforniaAlazkiI+awaii
::JT.C Jr Kumber Rzte
214,313 M?! .1 55,511 26..5
S1l.s 3s,94?. 39.1 111.9 15,570 14.5 102.7 47,9s1 26.2 91.2 %1,370 38.4
2.M.7 13,611 14.5 33.1 7,5:0 2s.1 Sal 5,571 43.5 ~J.3 1,353 14.0
I I
s,!.s 9,203 1s.5 10s.G 14,729 25,6 i12.6 21,159 32.1 83.1 10,420 29.5
22,623 97.9 5,549 2,250 18.5 1,343 116.3 567 236 23.0 1,393 102.5 332 144 1s.2 81C 92.0 309 123 26.5
11,075 99.7 2,702 1,043 17.9 1.933 ~~.1 450 154 15.8, 5;457 93.7 1,150 55a 17.9 72,140 33.4 15,193 6,953 13.5
‘55>4= 87.5 G>a% 3,083 16.9 14,004 ,69.6 2,s87 1,321 ~7..3
~51i?2, 105.5 5,460 2,549 21.4
68,095 99.0 19,993 9,815 24.0M.LE3 101.6 4,9s2 2,340 21.8
2..7.5.2 2,%2 1,569 29.5:s.5 5,103 2.469 22.087.7 4,637 2;282 25.2
IJ22.8 “,. L7.9.5 9,93.: 4,914 29.4 1C9.,4 2,120 1,04s 26.3 .723.9 1,751 853 2s.4
li5.G 2,sil 1,.’+53 30.5
lc3.9 332 219 34.2 lCE.5 51L 269 39.1 126.1 323 425 27.6 124.1 1,ZC3 645 zB.4
, .~~ 1,165 25.3
I 107.3 30.9 !:3.6 21.7 E.:.7 21.C 17.1 13.: .,? ~~.7,.7]
Uz.,., ~;.~
LI1.z ~~.~
11?,.< ~:.~
1-62- 37.3.’1?1.; q~.~
1:2.1 ~,:.g
12;.: ~~.~
123.’: :,j.7
1?3..: 39.5135.2 ,Io.3
107.Z ~~.:
151.1 $:.2
$3 K1.1lC’1.124.’3 S3.F
?7.5 30.9
75.3 :,493 K1.2
1;054 9s.2 320 44.4
1,009 96.1 320 41.6
44s 82.7 157 4,4.5 2,849 73.0 S63 27.2
1.,192 63.1 571 51.6
2,8s1 781. B~2 43.3s1,059 67.5 3.53 39.9e,:! 2<1.5 212 3s.7
42,Xcl 93.7 6,327 25.3 5,652 ~3.5 570 25.4 :,C,57 115.3 66j1 29.7
31,949 32.3 5,1!39 25.2 2!12 23.5 72 zl.e 901 54.7 135 16.2
5
5
10
15
20
25
30
35
------------------------------------------------------------------------------------------------------
------------------------------------------------------------------------------
MONTHLY VITAL STATISTICS REPORT
Table 6. DEATHS FROM 69 SELECTED * [Refers only to resident deaths occurring within
:
Cause of death (Ei@h Revision, InternationeJ Classification of Diseases, Adapted, 1%5) Total Under 1 year
1 All causes 1,973,00: 35,581
2 [email protected] and awbiasis-----------------------------------.--------------------------------------------OO4,OO6 64 8 ~ 3nteritisand other diarrheal diseases--------------------------------------------------------------------------OO8,OO9 2,322 690 4 Tuberculosis,all fom8------------------------------------------------------------------------------------------OlO-Ol9 3,875 12
Tuberculosis of respiratory system-----------------------------------------------------------------------------OlO-Ol2 3,009 6 6 Tuberculosis, other f0ms-------------------------------------------------------------------------------.------Ol3-Ol9 886 6
~ 7 ihOOPin&cou&-------------------------------------------------------------------------------------------------------O33 38 Wreptococcal sore throat and scarlet fever----------------------------------------------------------------------.---O34 2C 2
1 itiections---------------------------------------------------------------------------------------------O 3m 90 Septicetia-----------------------------------------------------------------------------------------------------------O3S 4,560 SOS
11 \cute po1iowelitis----------------------------------------------------------------------------------------------O4O-O43 10
12 4easles--------------------------------------------------------------------------------------------------------------os5 22 4 13 :yphilisMa lts seque1ae----------------------------------------------------------------------------------------o9o-o97 393 9 14 >ther infective and wrasitic diseases--------------------------------------------------------------Remin&rof 000-136 4,067 311
4alignantneoplasms, including neoplasme of lymphatic and hematopoietic tissues----------------------------------l4O-2O9 351,055 134 16 Malignant neoplasm. of buccal cavity md phaqm---------------------------------------------------------------l4O-l49 7,622 17 Malignant “eoplasms of digestive organs and peritoneum--------------------------------------------------------l5O-l59 96,549 15 18 Malignant neoplasms of resplratow sy.tem-----------------------------------------------------------.----------160-lS3 79,335 19 Malignant “eQplamI of breast--.-----------.--------------.-------.--------------.----------------------------------l74 32.14?
M9.11gnantneoplaems of genik.1 or8ans--------------------------------------------------------------------------l8O-l87 42;591 21 Mali~”ant neoplamns of urinary or&ans--------------------------------------------------------------------------l88,l69 15.077 22 Malig”a”t neoplasm, of all othw a“clunspecified sites-------------------------------------------------l7O-l73,l9O-196 42;693 61 23 kukemia-------------------------------------------------------------------------------------------------------2Ok2O7 14,478 40 24 Other neoplasm o? 1ymph3tic a“d hemcitopoietictiosues-----------------------------------------.-.-----2OO-203,2O8,2Og 16,567 7
knlgn neopl.asmsand neoplasms of unspecified mture--------------------------------------------.--------.--.----2lv-239 5>013 46 26 ~iabetesmellitu8-----------------------------------------------------------------------.-------------..-------------23o 38.208 16 27 Witaminoses and other nutritional deficiencies------------------------------------------------------------------26O-269 2;576 104 28 lnemias----------------------------------------------------------------------------------------------------------28O-285 3,31s 56 29 leningitis-----------------------.------.-----.-------------------------------------------------.-----------.--------320 1,523 492
9 ,6eningococca 36
bjor cardiovascular tiseases-----------------.----------.----.-------------------------------_--------.----..---39o-448 1,037,492 87331 Diseases of hee+-----------------------------------------------------------------------------‘9O-398,4O2,4O4,41O-429 757,075 70832 A<?tiverheunw.ticfever and chronic rheumatic heart di8ease----------------------------------------------..---36O-398 13,739 3 33 Iiypertensiveheart tisease---------------------------------.----------------------------------.------------------4o2 7,268 2 34 Hypertensive heart a“d renal disease-----------------------.-----.----..------.--------------------------.----.--4O4 5>515
Ischemic heart disease-------------------------------.----..----..-----------------------------_---------.---4lo-4l3 684,066 29 36 Acute mpocardial infarction------------------------------.-----------------.-------------------_------------.--4lo 351,662 19 37 Other acute and subacute forms of ischemic heart disease----------------------------------------------------.--4ll 4;503 1 38 Chronic ischemic heart disea8e---------------------------------------------------------------------------------412 327,722 9 39 Angina pect0tis----------------------------------------------------------------------------.------------------4L3 179 4C Chronic disease of endocardf.um and other myocardial insufriciency-----------------.----.--------------------.424-428 5,137 35 41 All other forms of heart diseasc-----------------------------------------------------------------42O.423,425-427,429 41,350 639 42 Wpertens ion---------------------..----..----.----.----------.-----.----------------..---------------------4OO,~~,4O~ 7,428 1 43 Cerebrovascul.ardiseaseo--------------------------------------------------------------------------------------43O-438 214,313 133 44 Cerebral hemorrhage----------------------------------------------------------------------------------------.-----43l 33,908 38 45 Cerebral tkombosis----------------------------------------------------------------------------------------------433 36,64S 6 46 Cerebral embo1i8m------------------------------------------------------------------------------------------------434 967 1 47 All other cerebrovascular diseases-------------------------------------------------------------------43O,432,435-438 122,789 68 48 Arteriosc1ero.is---------------------------------------------------------------------------------------------------44O 32,617 49 Other diseases of arteries, arterioles, and caPillaries------..----.-----------.-------------------------------44l-448 26,059 31
m Icutebronchitis and bronchiolitis----------------------.-----------------------------------------------.-----.------466 903 170 51 :“flue”zaand PneUmonia---------------------------------------------------------------.------------------47O-474,480-466 62,559 3,362 52 Inf1uenza-----------------------------------------------------------------------------------------------------47O-474 5,131 52 53 Fneuwnia-----------------------------------------------------------------------------------------------------.48O-486 57,428 3,510
54 Bronchitis,emphysema, and asthM---------------..--------------------.---------------.----_----------_-------_--490-493 29,708 96 35 Chronic and unqualif’iw bronchitie-----------.---------------------------------------------------.----.-------.49O,49l 5,547 67 56 EmPtiSe~------------------------------------------------.----------.-----.---------..----...---..-----------------492 22,249 17 57 A,thM---------------------------------------------------------.-----.---------.-----..----.-----..---..----.----.-493 1,912 12 38 ‘epticulcer-------------------------------------------------------.---------------_------_----------------------53l.533 7,686 36
59 itis--------------------.-------------------------------------------------------------.----.-------------54O-S+3 1,066 12 60 [erniaand intestinal obstruction----------------------------------------------------------------------------53O-553,56O 6;746 477 61 !Irrhosisof 1iver--------..--------------.-----------..-------------------------------_-----------------------------s7l 33;330 3a 62 !holelithiasis,cholecystitis .a”dcho1angitis----------------.---.----------------------..-.--..----.----.------574,375 3,422 1 63 Iephritisand neptiosiz----------.---.-----.----------------------------------.--------------.-.----.----.-------b~-584 8,338 20
tppe"dic
syndrome----------------.----.----.----------.-----------------------------------38O-5el 1,536 20 65 Chronic and unqualified nephritis and renal sclerosis----------------------------------------------------------582-504 6,60Q
66 :nfectiormof kibey------------------------------.-----.----.-----.--------------.----------------------------------sgo 6,134 6 67 kperplesie of prostate--------------------------------------------------.----------.-------------.--.---------------6OO 1,589 6B !ompl.i
64 Acute nephritis and mphrotic
cations of Pregnancy, childbirth, and the perwri"m-------------------------------------------------------63O-678 471 69 Abotiions-----------------------------.------.---.-----------------------------------------------_-------------E4O-645 36 70 Other complications of pregnancy, childbirth, and the puerperium--------------------------------------63O-639,65O,678 441
71 !OngenitalaOmlies ---------------------------------------------------------------------------------------------74O-759 14,062 8,953 ‘1? !ertaincauses of mortality in early infmcy-------------------------------------------------760-769.2,769.4-772,774-778 30,503 30,391 73 Birth injury, difficult labor, and other a“oxic and hypoxic cotitionfi---------------------------------764-768,772,776 16,935 16,882 74 Other causes of mort31ity In early infmcy--------------------------------------------------------Remlnder of 760-778 13,570 13,509 75 ,Wmptomsend ill-defined co. Mtions 7s0-796 30,399 4,2U8 76 ,11other diseases---------------------------------------------------------------------------------------------Residual 114,751 2,010
77 ,ccidents------------------------------------------------------------------------------------------------------E8OO-E949 115,S21 1,6917Q Motiorvehicle eccidents--------------------------------------------------------------------------------------E8lO-E823 53,511 32679 All other accidents--------------------------------------------------------------------------------E8OO-E807,E82S-E949 60,310 1,365,,, !uicide------------------------------------------------------------------.----.-.--..-----.----------.-----..---E95O-E959 25,118 ...,:, loticide-------------------------------------------------------------------------------------------------------E96O-E978 20,465 161!iZ ltherextemral causeB------------------------------------------------------------------------------------------E68O-E999 5,050 90

10
20
30
40
50
60
70
MONTHLY VITAL STATISTICS REPORT 11
CAUSES, BY AGE UNITED STATES, 1973
the United St@,eA. Excludes fetal dcakh>]
1-4 yecm years years yews yem. yearsT year. year. and over stated r
10.843 15,9e2 49,457 43.717 67.2S7 166.016 3Nl,577 454,661 514,236 2B4,1OO 546 1=z-6 11 2 2 5 7 3 9 9 2 2
13s 41 42 23 44 9e 171 278 47s 317 2 3 16 10 ZLl 96 281 E04 EE2 985 749 248 2 4 5 2 19 63 232 479 677 742 592 200 2 5 11 e 11 33 49 125 195 223 167 48 6
5-14 15-24 25-34 5s-44 43-s4 55-64 6s-74 75-e4 Es year. not
3 z 1 2 1 1 4 2 z 8 67 41 6 12 16 17 13 .-, z 9 76 77 m 14Z 359 586 91’2 l,OIZ 542 -
2 1 3 1 L - 11
7 7 z
5 1 1 6
22 94 146 89 Z3 --
12 13
1s; Z89 268 264 Z76 462 590 606 544 27Z 1 14
2,092 4,.437 12,747 43,070 82,844 101,525 77,011 Z3,326 34 1s 13 44 244 1,Z76 z,363 z,1s7 1>m 44Z - 16 26 5:0 2,064 8,852 20,739 Z9 ,501 Z6,160 8.489 11 17 22 2s0 2,545 11>804 24,198 Z3;507 lZ,685 Z;2Z7 4 18 3 495 2.244 6.439 s.291 7,630 5,136 1,855 - 19
12 Z7 312 64Z l;316 4;363 7;879 11,994 11,857 3,979 7 79 28 66 273 1,284 3,260 4,872 4,433 1,518 1 21 7s6 1>004 1,122 2,Z37 5,62S 9,737 lo,ea2 .9,103 2,796 7 22 35s 741 S72 669 1,223 Z,Z27 3,320 3,285 1,134 1 23 Zzb 53s 69(s 952 2,202 4,151 5>632 4,139 956 3 24
62 148 131 179 332 675 1.C28 1.174 914 31.2 3 25 14 11
74 12
192 17
563 26
1,043 se
Z>798 101
11;Z85 448
11,650 795
4,008 780
3 1
26 27
7
93 12% 1?1 143 122 197 615 909 548 1 28 220 97 53. 39 64 137 16Z 96 28 r Z9
,Ml 665 1,791 4,357 17,727 64.896 147.7.79 Z53,689 3S6,781 Z08,837 156 286 394 1,103 2,858 13,756 120;623 193,179 233,985 136,629 120 31 3.7 75 Z07 377 830 3,531 3,726 Z>307 68Z - 32 2 z 9 47 161 1,133 1,8Z6 2,Z54 1,Z39 2 33
8 2 38
6 203
14 1,458 10,9%
4e7 107,802
1,081 176,Z33
Z,vlo Z15,424
1,680 1Z5.389
- 34 107 35
1 17 134 1>003 7.686 71;075 102,4Z2 97,815 39;4Z0 54 36 1 9 29 “139 “564 970 1,160 1,033 575 2 37
7 20 60 424 3,126 13,803 35,729 72,604 116,526 83,363 51 32 2 4 17 ze 47 50 31 - 39
35 39 93 104 169 390 663 93U 1>431 1,227 1 224 24(J 5s5 8s8 1,581 3,e92 7,007 9,383 10,539 6:39Z 10 I41 2 2 20 96 Z5S 311 927 2.419 1;588 1 4Z
I-43 Z3Z 539 1,19s 3,177 9,Z25 46;938 79;967 5Z,1Z6 Z8 43 368
76 13
149 31
316 51,
1,044 179
Z,981 1,05L
8,470 1Z,Z29
10,173 23,364
5,166 15,7Z0
7 44 4 45
1 3 7 16 4e ZZB 353 181 1 46 ,37 142 3s6 824 1,938 5,143 26,011 46,077 31,039 16 47
2 4 39 Z65 1;158 4,Z79 lZ,357 14,51.I. 2 4s 37 127 201 497 1,461 3,964 7>690 8,053 3,983 5 49
22 29 63 3.03 147 166 96 -7s3 E3S 1>578 3>4S1 6,03Z 10,849 19,163 14,039 13 51
52 c.!> 123 239 491 974 1,714 1,368 - 5Z 717 em 1,45s 3.222 5,!311 9,875 17,449 L3,471 13 53
132 4.s2 6,042 10,492 8,18LJ 2,171 3 54 22 m 1,011 1,735 1,603 613 - 55 14 28 4,636 8,348 6,3C1 1,475 3 56 104 !34 395 409 476 83 - 57
6 411 103 1,473 2>084 1,994 ae4 1 5a
48 47 53 98 199 98 - 59 39 25
95 1 ,Zol
165 4,4M
40Z 9>305
821 10,U4
1,418 5,s98
I,Z29 3Z5
2 8 61
1 27 57 174 ~~6 ez7 719 - 6Z 66 268 4Z2 862 1,459 Z>019 1,012 z 63 23 26 37 FA 122 269 39s 163 1 64 41 15Z 231 554 740 1,190 1,b31 1,601 e45 1 65
2 19 47 133 273 716 1,473 2,097 1,330 1 66 a 70 334 691 486 - 67
6 174 213 2 1 - 88 16 1.? 7 - 69
6 lds 200 74 2 1 -
I>xm 842 64s 417 423 454 355 199 59 14 71 13 7 4 2 1 8 2 5 63 72 a 2 3 1 1 2 z 2 z? 73 5 5 1 L z 6 3 3% 74
37(J 250 1>S09 1, 40s 1,881 5,170 4,519 5,113 4,659 3,Z3S 57 75 1,081 1,487 3>160 3,719 8,065 12,016 19,883 z7,538 26,419 11,327 30 76
.,s46 8,102 26,550 14,4ZU 10,3m ll,61e il,441 10,243 10,409 6,5s9 82 77 1>672 4,124 1S,032 8,620 3,393 5,444 4,772 3,S32 2,661 56% 29 78 2>674 3,97.9 8,51’9 5,s00 4,937 G.174 6>669 6,351 7,768 6,023 53 79
... .L57 4,098 4,237 3,739 4;634 5,921 Z,617 1,3s3 3Z4 6 au 342 4Z5 5>18Z 5,41J4 3,618 2,632 1,319 763 329 53 35 81148 167 967 841 737 737 617 3e6 Z07 80 23 8Z
I
-----
------------------------------------------------------
--------------------------------------------------------------
-----------------------------------------------------------------------------------------------------
..-. .—. .. . . . .----- - .-.--,--- — 12 MC)N1 HLY VI IAL SIAI IS I 1(25 KtiWKl
Table 7. DEATHS RATES FOR 69 SELECTED
[Refers only to resident deaths occurrins tithfn the United State.. &cludes
Under 1Cause of death (Eighth Revision, International Classification of Diseases, .4d@ed, 1965) Total
yeai-
1 All cause fi------------------------------------------------------------------------------------------------------ 940.2 1,.905.2
2 Bacillary dysentery and aebi8sis-------------------------.-----------------------------------------------------OO4,OO6 0.0 0.3 3 En;e~itis and other diar.heal di8eases--------------------------------------------------------------------------OO8,OO9 1.1 22.4 & T“berculoais, R.11fOW -----------------------------------010-019 1.8 0,4
5 6
----------------------010-012Tuberculosis of refipiratmy sy6tm ------------------------------------------------------------------------------------013-019!ltberculo,ie,.ther fO~S -------------------------------------------------------
1.4 0.4
0.2 0.2
7 Whooping cwh------------------------------------------------------------------------------------------------------033 0.0 0.2
8 Streptococcal sore throat and scaxlet fever------------------------------------------------------------------------.O34 0.0 0.1 9 Meninsococc’aJinfectious--------------------------------------------------------------------------------.-----------O36 0.2 2.9
10 septfcetia --.-----------------------------------------038 2.2 28.1
H. Acute p0li0welitis--------------------------------------------------------------------------------------------*O-O43 0.0
12
of gmit~orgm8-------------------------------------------------------------------------l8O-l87 20.3
21 Miwat ~eopwsms Of WinW6rg~s-------------------------------------------------------------------------lS8,l89 7.6 0.2 22 Maligmnt neoplssrnsof all other and unspecified 8ites------------------------------------------------l7O-l73,l9O-l99 20.3 2.0 23 Letiaia------------------------------------------------------------------------------------------------------2O4-2O7 6.9 1.3 24 Gther neoplasnw of lymphaticarrdhematopoietic ti,sues------------------------------------------------29O-203,238,Z09 6.3 0.2
25 Benign nsoplasms and neoplasm of unspecified natwe------------------------------------------------------------2lO-23S 2.4 1.6 26 Diabetes melli+u6---------------------------------------------------------------------------------------------------25O 16.2 0.5 27 Avitmnlnofiesand other nutritional def1ciencie6-----------------------------------------------------------------26O-269 1.2 3.4 28 hdas---------------------------------------------------------------------------------------------------------28o-285 1.6 1.8 29 Meni~ti6----------------------------------------------------------------------------------------------------------3?O 0.7 1s.o
30 Ms.jorcardiovascular diseases---------------------------------------.---------.-------------------.-------------3gOws 494.4 28.4 31 Diseases of he&-----------------------------------------------------------------------------39O-39S,4O2/4O4,4lO42S 360.s 23.0 32 Active rheumatic fever and.chronic rheumatic heart UDeeBe--------------------------------------------------390-398 6.5 0.1 33 Metiensive h& disease-------------------------------------------------------------------------------------4O2 3.3 0.1 34 Hypertensive heart and ren&disease---------------------------------------------------------------------------4O4 2.6 35 Ischemic heart diseffie-------------------------------------------------------------------------------------4lO4l3 326.0 0.9 36 Acute wocardial lnfmcti0n---------------------------------------------------------.------------------------+l0 167.6 0.6 37 Other acute and subacute forms of ischendc hezrk dlse=e-----------------------------------------------------4~ 2.1 0.0 36 Chronic ischen!icheart disease----------------------------------------------.----------------.---------------+l2 156.2 0.3 39 ikgina pect0tis------------------------------------------------------------------.---------------------------4l3 0.1 40 Chronic disease o? endocsxdium and other myoca.rdialinsufficlency------------------------------------------424,42S 2.4 1.1 41 .41.lutherfores of heart dise=e---------------------------------------------------------------42O423,425427,42S 19.7 20.8 42 ~etiensi0n---------------------------------------------------------------------------------------------4OO,4Ol,4O3 0.0 43 Cerebrwe.scular diseases-------------------------------------------------------------------------------------43O438 10::: 4.3 44 Cerebral haonbqe--------------------------------------------------------------------------------------------+= 18.2 1.9 43 Cerebral ttiabosie--------------------------------------------------------------------------------------------433 27.0 0.2 46 Cerebral abolism----------------------------------------------------------------------------------------------434 0.5 0.0 47 All other cerebrowcular disewes-----------------------------------------------------------------43O,432,43543E 58.5 2.2 48 WWi0SClW0BiS-------------------------------------------------------------------------------------------------44O 15.5 49 Other disease6 of arteries, e.rterioles,and caIill&es------------------------------------------------------44l44B 12.4 1.0
50 Acute bronchitis mdbDnchiOlitiB--------------------------------------.---.----------.-------------------------.-d46 0.4 5.5 51 Influenza and pnenonia--------------------------------------------------------------------------------47O+74,48O486 29.8 115.7 52 Innuenza----------------------------------------------------------------------------------------------------47O474 2.4 1.7 53 fiemmi8-----------------------------------------------------------------------------------------------------4SO486 27.4 114.0
54 Bronchitis, eMPWS~, end astk------------------------------------------------------------------------------49o493 14.2 3.1 55 Chronic and ungus.lffiedbronchftis---------------------------------------------------------------------------49O,49l 2.6 2.2 56 bpmsaa------------------------------------------------------------.-....---.-.---.----------------------------4g2 10.6 0.6 57 &tti-----------------------------------------------------------------------------------------------------------493 0.9 0.4 58 Peptic ticer--------------------------------------------------------..----------..----.-.-.-.-------------------53l-533 3.7 1.2
Measles-------------------------------------------------------------------------------------------------------------O55 0.0 0.1 13 14
sw~~s @i*. ,eque~--------------------------------------------------------------------------------------d9o-o97 Other infective endpaxasitic diseases-------------------------------------------------------------R*inder of-000-136
0.2 1.9
0.3 10.1
M Mal.ignentneoplasms, including neoplasm of lymphatic andhematopoietic tissues---------------------------------l4O-2O9 167.3 4.4 16 Malignant neoplasm of buccal cavity and Pm--------------------------------------------------------------l40-l49 3.7
17 Malignant neoplasm of digestive orsans and Paitonem--------------------------------------------------------l5O-E9 46.0 0.5
18 Malignant neoplasms Ofrespiratow sYfim---------------------------------------------------------------------l6O-l63 37.s 0.1 19 M31.ignantneoplwm 0fbreati--------------------------------------------------------------------------------------l74 15.3 20 Mign* “eoplasms
59 Appenticitie----------------------------------------------------------------------------------------------------54O-543 0.5 0.46. Hernieand intemtirml obstmction--------------------------------------------------------------------------+5O-553,560 3.2 15.5 61 Cirrhosis of liEr--------------------------------------------------------------------------------------------------57l 1.5.9 1.2 62 Cholelithiasis, cholecyztitis end ehol~ti~-------------------------------------------------------------------374,575 1.6 0.0 63 Nephritis mdneptio8i8-----------------------------------------------------------------------------------------58O-5& 4.0 0.6 84 Acute nephritis andnepbrotlc BP&me------------------------------------------------------------------------56O-58l 0.7 0.6 65 Chronic end unqualified nephritis and renal sclemsis---------------------------------------------------------582-584 3.2
66 Infections of kitiq------------------------------------------------------------------------------------------------59O 2.9 0.2 67 Hyperplasia of prn6tate---------------------------------------------------------------------------------------------6OO 0.8 68 Complkations ofpregm.ncy, childbirth, mdthepuevetim------------------------------------------------------63O-678 0.2 69 &0tii0"S-----------------------------------------------------------------------------------------------------64O-645 0.0 7? Other complic&tion8 of pregnancy, childbirth, and the puwefim--------------------------------------63O-639,65O-678 0.2
71 Congenital adies--------------------------------------------------------------------------------------------74O-759 6.7 290.8 72 Certain causes ofmorte.lity in early infmcy------------------------------------------------76O-769.2,769.4-772,774y778 14.5 967.0 73 Birth injury, difficult labor, end othef anotic and b3T0Xic C0nditions--------------------------.-----764-768,772,776 S.1 548.3 74 Other causes of mortality in early infancy------------------------------------------------.------Remainderof 760-778 6.5 438.773 Symptoms and ill-defined con&tions-----------------------------------------------------------------------------78O-796 14.5 136.776 All other tise-es---------------------------------------------------------------------------------------------%sidti 54.7 65.3
77 kcidents 55.2 54.9 70 ~~otorveh%cle ~ctdents-.-----------------------------------------------------------------------------------~$:~ 26.3 10.6 79 AU other accidents-------------------------------------------------------------------------------~OO-~O7,M25-E949 28.7 44.3 Em Sticide-------------------------------------------------------------------------------------------------------W5O-E959 12.0 ... 81 Hdcide------------------------------------------------------------------------------------------------------E960-E978 9.8 S.2 82 Other exterml. causes-----------------------------------------.-------.-..-..--...-.-------.---------------.--EgSO-Eggg 2.4 2.9

MONTHLY VITAL STATISTICS REPORT 13
CAUSES, BY AGE: UNITED STATES, 1973
fetnl d.xths. R&c; per lCO,QOO estimated p.pul.tion in .pccified EMU~
1-4 2.4-24 25-34 35-M 45-54 55-54 63-74 75-34
ycaml YCO.J.-S years yearn ycm yea-s yeaJ-s y.s?UT
79.5 ==41 0.0 O.c 0.0 0.0 0.0 0.0 0.0 0.1 0.1 0.1 2 La 0.1 0.1 0.1 0.2 0.4 0.9 2.1 7.3 19.4 5 0.1 0.0 0.1 0.5 1.2 2.5 4.5 7.3 Il.. 15.2 ,4
41.0 129.3 13?i6 235.!3 697.4 1,611.9 3,440.0 7,932.1——
6 !3.0 0.0 0.0 0.2 1.0 2.0 3.5 5.6 9.0 12.3 5 0.1 O.c 0.0 0.1 0.2 0.5 1.0 1.7 2.6 2.9 6
-17 O.c 0.0 0.0 0.0 0.0 0.0 0.0 0.0 0.1 e
0.s 0.1 0.1 0.0 0.1 0.1 0.1 0.1 0.1 0.1 9 0.6 0.1 c.2 0.3 0.6 1.5 3.0 6.9 2.5.6 27.7 10
0.0 0.0 0.0 0.0 0.0 - rl
0.1 0.0 0.0 - 12 0.0 0.0 0.0 0.0 0.1 0.5 1.1 1.4 1.4 13
1.4 0.7 0.7 0.9 1.2 1.9 3.1 4-6 8.4 16.7 14
6.4 5.4 7.5 15.6 56.1 1’30.9 430.0 769.1 1,167.9 1,435.3 15 0.0 0.0 0.2. 0.2 1.1 5.4 12.3 16.5 16.7 27.1 16 0.1 0.1 0.4 1.8 9.1 37.2 107.6 223.2 403.5 520.8 17 0.0 iJ.1 0.1 1.0 11.2 49.6 125.6 193.0 195.7 236.6 2.6
O.c 0.1 1.7 9.9 27.0 43.0 57.7 79.5 S-3.8 19 0.1 0.1 0.6 2.3 6.7 18.3 40.9 90.7 1s2.9 244.1 20 0.4 0.2 0.1 0.2 1.2 5.4 16.9 36.9 68.4 93.1 21 2.a 1.9 2.6 3.9 9.s 25.6 50.5 82.3 125.o 171.5 22 2.4 2.s 1.9 2.0 2.9 5.1 1-1.6 25.1 50.4 69.6 23 0.5 0.6 1.4 2.4 4.2 9.3 21.5 42.8 63.8 58.7 24
0.5 0.4 0.3 0.6 1.5 2.8 5.3 B.9 14.1 19.6 25 0.1 0.2 0.5 2.0 4.6 11.8 34.1 25.4 179.7 245.9 26 0.1 O.c 0.0 0.1 0.2 0.4 1.1 3.4 ?.2.3 47,9 27 0.6 0.3 0.4 0.5 0.5 0.8 1.8 4.7 14.0 33.8 2a 1.6 0..2 0.1 0.1 0.3 0.6 0.7 1.2 3..5 2..729
3.2 4.6 13.3 78.0 272,6 764.4 1.919.4 5.194.8 12.812.1130 2.1 2.9 10.0 60.5 224.5 626.0 1;461.6 3;609.2 8;382.1 31 0.1 0.5 1.3 3.7 8.3 18.3 2s.2 35.6 41.8 32 0.0 0.3 0.2 0.7 2.4 5.9 13.8 34.8 77.2 33
0.0 0.0 0.2 0.8 2.5 6.2 31.0 103.1 34 0.1 0.1 0.5 5.1 48.3 194.9 559.5 1,333.4 3.322.9 7,692.8 33 0.0 0.0 0.3 ‘5.5 33.8 3.34.5 368.9 “774.9 1;508.8 2,418.4 36
0.0 0.0 0.1 0.7 2.4 5.0 8.8 15.9 35.3 37 0.1 0.1 0.2 1.3 X3.7 58.0 123.4 549.3 1,797.4 3,237.0 38
0.0 0.0 0.1 0.1 0.4 0.8 1.9 39 0.3 0.1 0.2 0.4 0.7 1.6 3.4 7.0 22.4 75.3 40 1.6 0.6 1.5 3.0 7.0 16.3 36.4 71.0 162.6 392.1 41 0.0 0.0 0.1 0.3 1.1 2.1 4.8 12.1 37.3 97.4 42 1.0 0.6 1.4 4.2 14.0 38.8 106.9 355.1 1,233.3 3,197.9 43 0.3 0.2 0.4 1.1 4.6 12.5 28.2 64.1 156.9 316.9 44 0.1 0.0 0.1 0.2 0.8 4.4 20.7 92.5 360.4 964.4 45
46 0.7 0.4 0.9 2.9 8.5 21.6 57.4 196.6 710.7 1,905.5 47
0.0 0.0 0.2 1.1 6.0 32.4 190.6 890.2 48 0.1 0.1 0.3 0.7 2.2 1.1 20.6 56.2 124.2 244.4 49
0..s 0.0 0.0 0.1 0.1 0.3 0.5 1.1 2.6 5.9 50 5.9 3..4 2.0 3.1 6.9 14.5 31.6 82.1 295.6 910.4 51 0.2 0.1 0.1 0.2 0.5 1.0 2.3 7.4 26.4 63.9 52 5.7 1.3 1.9 2.9 6.4 X3.5 29.1 74-7 269.2 826.4 53
0.5 0.2 0.4 0.5 2.0 7.7 31.4 79.4 2.26.2 133.2 54 0.3 0.1 0.1 0.1 0.4 1.3 5.2 13.1 24.7 37.6 55 0.0 0.0 0.0 0.1 0.8 5.2 24.1 63.2 97.2 90.5 56 0.1 0.1 0.3 0.3 0.8 1.2 2.1 3.1 4.3 5.1 57 0.0 0.0 0.1 0.4 1.2 3.3 7.6 13.6 30.8 54.2 58
0.1 0.1 0.1 0.1 0.2 0.4 1.0 2.0 3.5 6.0 59 0.3 0.1 0.2 0.3 0.7 1.7 4.3 10.7 30.9 7s.4 60 0.1 0.1 0.4 4.2 19.4 39.1 52.5 44.6 28.8 19.9 61 0.0 0.0 0.0 0.1 0.3 0.7 2.0 6.3 16.7 44.1 62 0.2 0.2 0.5 0.9 1.9 3.6 7.6 15.3 31.0 62.1 63 0.1 0.1 0.1 0.1 0.3 0.5 1.4 2.9 6.3 10.0 64 0.1 0.1 0.4 0.8 1.6 3.1 6.2 12.3 24.7 52.1 65
0.0 0.0 0.1 0.2 0.6 1.1 3.7 I.1.l 32.2 61.6 68 0.0 0.4 2.5 10.7 29.8 67
0.0 0.3 0.7 0.4 0.0 0.0 - 68 0.0 0.0 0.0 - 69
0.; 0.4 0.7 0.3 0.0 0.0 - 70 I
9.6 2.2 1.7 1.5 1.6 1.9 2.4 2.7 2.9 3.6 n 0.1 0.0 0.0 0.0 0.0 0.0 0.1 0.@ 0.3 72 0.1 0.0 0.0 0.0 0.0 0.0 0.0 0.0 0.1 73 0.0 0.0 0.0 0.0 0.0 0.0 0.2 74 2.7 0.6 3.9 4.9 8.3 13.5 23.5 38.7 71.9 196.9 75 7.9 3.s 8.2 lz.1 26.7 50.5 103.3 208.4 407.5 694.8 76
31.9 20.8 Ea.9 50.7 45.4 48.8 59.4 77.5 163.6 40!.2 77 12.5 10.6 46.8 50.3 23.7 22.9 24.8 29.4 40.7 34.7 78 19.6 10.2 22.1 20.4 21.7 25.9 34.6 48.1 119.6 369.5 79 ... 0.4 10.6 14.8 16.4 19.5 20.3 19.8 21.4 19.9 80 2.5 1.1 2.3.4 19.0 13.9 11.1 7.9 5.8 5.1 3.4 81 1.1 0.4 2.5 3.0 3.J 3.3 3.2 2.9 3.2 3.7 82
0.0 0.(3 0.0 0.1 0.2 0.7 1.7 5.4 ‘J.l.l

--------------------
14 MONTHLY VITAL STATISTICS REPORT
Table 8. DEATHS AND DEATH RATES FOR 69 SELECTED
[Refersonly t. resident deaths occurring within the United States. Excludes
Total
Cause of death (Eighth Revision, International Classification Both sexes Male Female
of DiBeaBes, Adapted, 1965)
Nmmber Rate Nwnber Rate Number Rate
All causes-------------------------------------------------------------------------- 1,973,003 940.2 1,096,795 1,072.9 676,200 014.2
Bncil.l.arydysentery and mebiasi8---------------------------------------------------0O4,OO6 64 0.0 34 0.0 30 0.0 Enteritis and other diarrheal diseases----------------------------------------------OO8,OO9 2,322 1.1 1,068 1.0 1,2S4 1.2 Tuberculosis, all fores--.--------------------.---.-----.--.--..--------------------olo-Ol9 3,875 1.6 2,707 2.6 1,168 1.1 Tuberculosis of respiratory systew-----------------------------------------------Ol+Ol2 3,009 1.4 2,182 2.1 827 0. B Tuberculosis, other foms------------------------------------------.---.----------OU-Ol9 866 0.4 323 0.3 341 0.3
Whooping c0u@--------------------------------------------------------------------------O33 5 0.0 z 0.0 3 0.0 Streptococcal sore throat and scmlet feveP--------------------------------------------O34 20 0.0 6 0.0 12 0.0 Meningococcal infecti0ns------------------------------------------------------.---------O36 330 0.2 185 0.2 145 0.1 Septicmia----------------------------------------------------..------------------------036 4,560 2.2 2,433 2.4 2,127 2.0 Acute poliowelitis-----------------------------------------------------------------O4GO43 10 0.0 8 0.0 2 0.0
MeSles---------------------------------------------------------------------------------O55 23 0.0 2.6 0.0 7 0.0 Swhilis and its sequelae----------------------------------------------------------O9GO97 393 0.2 265 0.3 126 0.1 Othei-infective and parasitic disease8---------------------------------Remeinderof 00C-336 4,0.37 1.9 2,o9o 2.0 1,977 1.8
Meli.gnantneoplasms, including neoplasm8 oflwnphatic and hematopoietic tissues-----209-2O9 351,055 167.3 191,320 167.1 2.59,733 146.4 Mali@ant n,0plaSm6 of buccal cavity and pharyw---------------------------------l4C-l49 7,822 3.7 5,553 5.4 2,269 2.1 Mal.ignantnec@asms of disestive organs and peritonew---------------------------l3O-l39 96,549 46.0 51,070 50.0 45,479 42.3 Malignant “eoplasms of respiratory system------------------------------,---------X&Z3 79,335 37.0 62,717 61.3 16,618 15.4 Mali&nant neoplasm of breas&---------------------------------------------------------l74 32,143 15.3 293 0.3 31,850 29.6 Mali@ant ne0pb3J?18of genital Orgas----------------------------------------------l8O-l87 42,591 20.3 19,864 19.4 22,727 21.1 Malignant neoplasms of urinary orgas---------------------------------------------l88,l89 3.3,877 10,601 10.4 5,276 4.9 Malignant neoplasm of all other and unspe.cifiedsites--------------------l7Gl73,l9O-l99 42,693 2::: 22,342 21.9 20,331 18.9 Leukmia--------------------------------------------------------------------------2OG2O7 14,478 6.9 8,262 8.1 6,23A 5.s Other neoplasm of lymphatic and hematopoietic tissues--------------------2OC-2O3,2O8,2O9 19,567 9.3 10,618 10.4 8,949 S.3
Benign neoplasma and neoplama of unspecified nsture--------------------------------2lO-239 5,013 2.4 2,450 2.4 2,563 2.4 Diabetes meUitu-----------------------------------.-----------------------------------25o 38,208 IA.2 15,669 15.3 22,539 20.9 Atitmnhoses and other nutritional de?iciencies-------------------------------------26&269 2,576 1.2 1,Om 1.1 L,493 1.4 ~mias-----------------------------------------------------------------------------2@@265 3,31a 1.6 1,569 1.5 1,749 1.6 Menin~itis------------------------------------------------------------------------------32O 1,323 0.7 642 0.6 681 0.6
Major ce,rdiove.scular
Active rheumatic fever and chronic rheumatic heart disease----------------------39&396 13,739 6.5 6,172 6.0 7,567 7.0 Wwrtensive heart tieeas*---------------------------------------------------------4O2 7,268 3.5 2,920 2.9 4,348 4.0 Hypertensive heart mdrenti disease------------------------------------------------404 5,515 2.6 2,558 2.5 2,657 2.7 Ischemic heert disea~---------------------------------------------------------4lO-4B 684,066 326.0 386,978 378.5 297,088 276.0 Acute myocardial i"farction-------------------------------------------------------4lO 351,662 167.6 220,543 22.5.7 l?ll,
diseases-------------------------------------------------------39G448 1,037,492 494.4 551,395 539.4 486,097 431.7Diseases .f heart-------------------------------------------------390-396,4O2,404,4l+429 737,075 360.s 424,455 415.2 332,620 309.1 m
1.19 2.21.6 Other acute and subacute form of ischemic heart disease--------------------------42.l 4,303 2.1 2,82.2 2.8 1,621 1.5 Chronic ischemic heart disease----------------------------------------------------4L2 327,722 156.2 163,444 2.39.9 164,270 152.6 Angina pectoris-------------------------------------------------------------------4~ 179 0.1 109 0.1 70 0.1
Chronic disease of endocardium and other myocardial insw?ficiency---------------424,426 3,137 2.4 2,462 2.4 2,675 2.5 All other forms of heart dise86e------------------------------------42&423,425-427,429 41,350 19.7 23,365 22.9 17,983 16.7
Hmertensi0n------------------------------------------------------------------4oo,4oL,4o3 7,426 3.3 3,726 3.6 3,702 3.4 Cerebrwascular tieeases-----.----------------------------------------------------43%438 214,31.3 102.1 93,838 91.s 120,475 IJ.1.9
Cerebral h-orrhage-----------------------------------------------------------------43l 33,909 2.6.2 15,561 3.5.2 10,348 17.0 Cerebral thrmbosis---.-------------------------------------------------------------433 56,648 27.0 24,374 23.6 32,274 30.0 Cerebral abolisw------------------------------------------------------------------434 967 0.3 429 0.4 338 0.5 All other cerebrwescular diseases---------.----------------------------430,432,435-43S 122,789 38.5 53,374 52.3 69,3?.5 64.4
Arterioscler.sis----------------------------------------------------------------------44O 32,617 2.5.5 1.3,402 2.3.1 19,213 17.9 Other diseases of arteries, arterioles, and capillaryes---------------------------441-448 26,059 12.4 15,974 15.6 10>083 9.4
Acute brcmchitis mdbronchiolitis------------------------.-----------------------------466 905 0.4 493 0.5 412 0.4 Influewz.amdpewonia----------------------------------------------------A7OA74,48O486 62,559 29.8 34,224 33.5 28,335 26.3 Influenza------------------------------------------------.-----.------------------47+474 5,3..31 2.4 2>408 2.4 2,723 2.5 bew0nia-------------------------------------------------------------------------48G4e6 57,426 27.4 31,616 31.1 23,612 23.8
Bronchitis, emphysema, and astba----------------------------------.----------------49@493 29,708 14.2 22,740 22.2 6,968 6.5 Chronic end unqualified bronchitis------------------------------------------------49O,49l 5,547 2.6 3,913. 3.6 1,636 1.5 why,aa-----------------------------------------------------------------------------492 22,249 10.6 18,010 17.6 4,239 3.6 Asttia--------------------------------------------------------------------------------493 1,912 0.9 S19 0.s 1,063 1.0
Peptic ticeP-----------------------------------------------------------------------53l-533 7,686 3.7 4,974 4.9 2,714 2.5
Appendicitis------------------------------------------------------------------------54@343 1,066 0.5 663 0.6 403 0.4 Hernia and intestinal.obstncti."-----------------------------------------------55O-533,56O; 6,746 3.2 3,006 2.9 3,740 3.5 Cirrhosis .f Ever----------------------------------------------------------------------57l 33,350 15.9 21,782 21.3 11,566 10.7
@nd choW*i, --------------------------------------574,575 3,422 1.6 1,531 1.5 1,891 1.6 Neph,itis and nephrosis-------------------------------------------------------------58&584 8,336 4.0 4,460 4.4 3,676 3.6 Acute neph?itis and nephrotic a~drm~-------------------------------------------5BO,58l 1,536 0.7 066 0.6 670 0.6 Chronic and unqualified nephritis and renal sclerosi8-----------------------------5S2-584 6,800 3.2 3,594 3.5 3,206 3.0
Infections of kitiey-------------------------------------------------------.-.----------59O 6,2.34 2.9 2,569 2.5 3,545 3.3 Hyperplasi. of prostate--------.-----------------------------------.-------------------6o0 1,569 0. e 1,589 1.6 ... ... Complications of pre@ancy, childbirth, end the puerperiw-------------------------63O-678 477. 0.2 ... ... 477 0.4 Abortions-------------------------------------------------------------------------64O-645 36 0.0 ... ... 3s 0.0 Other .Omplicationa of pregnancy, childbirth, and the puerperium----------63C-639,65C-679 441 0.2 ... ... 441 0.4
Ch.Le2.itUasis, chOI.ecYfl*itiB
Congenital.m0m&ies----------------------------------------------------------------74o-759 14,062 6.7 7,556 7.4 6,503 6.0 Certain cawes of mortality in ewly infancy 76C-769.2,769.4-772,774-778 30,503 14.5 17,806 17.4 ls,697 u. e Birth injury, difficult labor, and other snoxic .?.ndhmoxic ccmditions----776B,772,776776 16,933 6.1 10,251 2.0.0 6,682 6.2 Other causes of mortality in early infsncy---------------------------R6mainderof 76C-776 13>370 6.3 7,333 7.4 6,03.5 5.6
swnPtoms and ill-defined co.dition8-------------------------------------------------7W-796 30,39!? 14.3 18>203 17.8 3.2,196 .U.3 All other disease* ----------------------------------------------------------------Residuti 114,751 34.7 64,172 62.8 50,579 47.0 m Accidents--------------------------------.----------------------------------------EBOO-~49 3J.5,62.1 55.2 60,466 76.7 35,352 32.SMotor vehicle accidents---------------------------------------------------------E6l&E623 55,311 26.5 39,941 39.1 15,370 l&.3
7S2 3A.4 Suicid&--------.----------------------------------------------------------------E95GE959 25,11P 12.0 18,108 17.7 7,010 6.5 H0miCid&-------------------------------------------------------------------------E96o-E978 20,465 9.6 15,840 2.3.5 4,625 4.3 Other external causeB------------------------------------------------------------E98+E999 5,050 2.4 3,443 3.4 1,607 1.5
All other accidents---------------------------------------------------E8O&E8O7,E825-~49 60,310 28.7 40,526 39.6 2.S,

MONTHLY VITAL STATISTICS REPORT
CAUSES,BY COLOR AND SEX UNITED STATES, 1973
fct.1dmth.. Rates per 1,000 eztiutcd Fapuhtion in .pcified WOW]
— — Whtte All Oth.J
l?athmv.es I?Ale Femle 2.sthcexes II Wle Female
mmber kite IIvmber Rate Ihm.ber Pate Number Rate Nvmber Re.t9
1,728,40 944.2 957,918 1,071.2 770,437 623.0 ?44,59 912.S 13s,877 1,094.6 105,721 735., 1
1— — —
0.0 28 0.0 M 0.0 1, !2.1 6 0.0 12 o. 2 1, 8i. 2>66,
1.0 1.s
799 l,e49
0.9 2.1
1,004 el.4
1-1 0.9
31! 1>2.U
1.9 4.5
269 SW
2.1 6.7
2s0 334
1.1 2.!
3 4
2,03! 1.1 1,467 1.6 569 0.6 97: 715 5-6 259 1.{ 5 62 0.3 3S2 0.4 245 0.3 23! ::: 143 1.1 96 o,’ 6
i 0.0 0.0
2 7
0.0 0.0
3 11
0.0 0.0
J G .0 1 0.0 1 0.(
7 a
27: 0.1 151 0.2 120 0.1 0.2 34 0.3 2s o.: 9 3,54’ 1.9 1,2392 2.1 1,665 1.8 1,01: 3.8 551 4.3 462 3.: 10
1[ 0.0 8 0.0 2 0.0 11
1! 21
0.0 0.1
13 146
0.0 0.2
6 67
0.0 0.1 E(
0.0 0.7
3 1?.9
c1.0 0.9
0 .( 12 0.’ 13
3,24! 1.8 1,699 1.9 1>560 3..7 81< 3.1 401 3.1 3.{ 14
312.77! 821!5;
85,m
170.9 :,.7
4g.a
169.s44 4;s10
44,87s
2.89.6 5.4
SJ.2
143.235 2;018
40,748
153.0 2.2
43.5
36,27t 994
10,92c
142 .s 3.7
40.a
21,776 743
6,165
170.1 5.8
48.4
16,500 231
4,731
117.! 15 1.( 16
33.1 17 711,75: :3.7 55,783 62.4 15,007 16.0 a,54: 31.9 6,934 54.2 1,611 11.: 18 29,26, 16.il 255 0.5 29,009 31.0 2>37$ 10.7 3s 0.3 Z.wi 20.: 19 36>44: 19.!3 16,911 18.9 19s3s 20.9 6,1M 22.9 2,953 23.1 3;189 22.{ 20 1.4,60( 39.16(
8.0 20.!3
9,S29 19,s23
11.0 22.3
4;777 18.237
5.1 19.5
1,27: 4,52:
4.7 16.9
772 2,413
6.0 18.8
499 2,1..7.4
3.( 21 13.: 22
13;23 7.2 7,553 8.4 5;697 6.1 l,zti 4.6 723 5.6 512 3.. 23 17,81 9.7 9,6L3 10.7 8,204 8.8 1,75( 6.5 1,00s 7.8 743 5.: 24
4,351 2.4 2,155 2.4 2,201 2.4 6fi 2.5 295 2.3 362 2.( 25 -Q,93 17.4 13,243 14.9 16.589 19.9 6,27[ 23.4 2,326 18.2 3,950 28.> 26 2,m 1.2 3$84 1.0 1;282 1.4 41C 1.5 129 1.6 2U 1.! 27 2,61( 1.4 1,20? 1.4 1,401 70E 2.6 360 2.s 348 2.: 28 1,04: 0.6 591 0.6 462 ;:; 4s[ 3..8 Zal 2.0 219 1.1 29
232,S3! 509.4 496,91!3 555.7 433,467 463.1 105,1CL 392.2 34,477 425.4 30,630 361.. 30 !3s4,35! 373.3 385,2B9 433.9 299,070 319.4 72,716 271.3 39,166 W3.9 33,550 239.: 31 12,5X 6.9 5,544 6.2 6,978 7.5 l,l?li 4.s 623 4.9 589 4.: 32 5,6Gi ?A 2,1ss 2.4 3;472 3.7 1,60Z 6.0 732 3.7 876 6.: 33 4,66( 2.5 2,Lw z.4 2>534 2.7 85: 3.2 432 3.4 423 3.( 34
G23,21’ :,40.5 3s4,222 396.1 268,99S 2.67.3 60,64$ 227.0 32,756 233.0 28,093 200.< 35 325,52.’ 177.s 205,614 229.9 1.19,903 lza .1 26,14: 97.5 14,929 33.6.6 11,216 80.1 36 3,90( 2.1 2,494 2.8 1,406 1.5 60: 2.2 388 3.0 -215 1.: 37
293,634 w
160.4 0.1
146,C09 1CJ5
163.3 0.1
147,625 61
157.7 0.1
34,086 l.!
327.2 0.0
17,433 4
136.2 0.0
16,653 9
119.c 33 0.3 39
4.455 2.4 2,109 2.4 2,347 2.3 fix 2.6 334 2.8 328 2.? 40 33;84: 1.9.5 19,101 21.4 14,744 15.7 7,50: 28.0 4,264 33.3 3,241 23.2 41 5>m 3.2 Z,wl 3.3 2,897 3.1 1,59C 5.9 785 6.1 605 5.[ 42
lfw>oz! 102.7 81,S30 91.2 106,494 2.2.3.7 26,28$ 99.1 12,.508 96.1 13,981 99.$ 43 28,85< 15.8 13,104 14.7 13,735 16.8 5,07C 1s.9 2,437 19.2 2,613 18.1 44 50,SE 27.S l?l,624 24.2 29,191 31.2 5,83: Z1.s 2>730 Z1.s 3,023 22.C 45
’29: 0.5 :,6S 0.4 500 0.5 82 0.3 44 0.3 32 0.? 46 107,43: 5s.7 46,417 51.9 61,068 65.2 3.5,304 57.1 7,057 35.1 6,247 58.s 47 W>2M 16.5 12>315 13.8 17,927 19.1 2,375 6.9 1,087 8.5 1,288 9.2 48 x, 9X 13.1 14,843 16.6 9,079 9.7 2,13? 8.0 1,131 8.8 1,006 7.2 49
0.4 0.5 0.4 12? 0.5 71 0.6 37 0.4 50 2.?.6 ~,~.~ 24,964 26.7 8,454 51.5 5,0a3 39.7 3,371 24.1 51 2.6 2.5 2,50s 2.7 4U 1.6 203 1.6 215 1.: 32
27.0 39.1 22,456 z~.o 8,03E 30.0 4,880 39.1 3,156 22.s 53
15.2 -11.CJ 6,464 5.9 1,879 7.0 1>375 10.7 504 3.e 54 2.s 4.1 1.5.45 1.7 341 1.3 233 2.0 91 0.7 53 11.s r3.1 4,063 4.3 1,022 4.0 910 7.1 170 1.2 36 0.8 0.7 8S3 0.9 455 1.7 22.2 1.7 243 1.7 57 3.5 5.0 ?,,503 2.7 74Z 2.s 532 4.2 23.2. 7..5 58
847 0.5 :,~.4 0.6 323 0.3 2M 0.8 139 1.1 80 0.6 59 5,861 3.2 2,552 2.9 3,309 3.5 835 3.3 434 3.5 431 3.1 60 27>816 15.2 18,372 20.5 9,444 10.1 5,554 20.6 3,410 26.6 2,124 13.2 61 ~>147 1.7 1,.422 1.6 1,725 1.s 275 1.0 109 0.9 166 1.2 62 6,05S 3.3 3>=1 3.7 2,727 2.9 2,278 3+.5 1,129 8.8 1,149 8.2 63 1>22.4 0.7 694 0.8 320 0.6 322 1.2 172 1.3 1s0 1.1 64 4,844 2.6 2,637 2.9 2,207 2.4 1,955 7.3 937 7.5 7.1 65
5,191 2.8 2,153 2..4 3,032 3.2 W5 5.5 430 3.4 313 3.7 66 1,407 0.s 1,407 1.6 .. . ... 1s2 0.7 182 1.4 ... .. . 67 27.4 0.1 .. . ... 274 0.3 2G3 0..9 ... ... 203 1.5 68 15 0.0 ... ... 15 0.0 21 0,1 ... ... 21 0.2 69 259 0.1 ... ... 239 0.3 182 0.7 ... ... lez 1.3 70
11,833 6,5 6,404 7.2 5,446 5.8 2,212 8.3 1,153 9.0 1,057 7.6 n 22,186 12.1 13,0s9 14.G 9,097 9.7 8,317 31.0 4,717 36.8 3,600 25.7 72 12,565 6.9 7,691 8.6 4,874 5.2 4,36% 16-3 2,5E72 20.0 l,eo9 12.9 73 9,621 5.3 5,398 6.0 4,223 4.5 3,949 14.7 2,1.57 16.8 1,732 12.8 74
21,174 17..6 12,761 14.3 B,413 9.0 9,225 %.4 5,442 42.5 3:783 27.0 75 39,171 53.6 54,727 61.2 43,444 46.4 16,580 61.9 9,445 73a 7;135 52..0 76
53.8 67>853 75.9 ~o>=0 32.7 17,318 64.6 12,616 98.5 4,702 33.6 77 26.2 34,370 32.4 15,8U 14.5 7,530 2s.1 5,371 43.5 1,959 14.0 78 27.6 35,4a3 37.4 17,039 18.2 9,78s 36.5 7,045 35.0 2,743 19.6 79 12.8 16,823 1.2.s 6,3.29 7.0 1>7G6 6.4 1,285 10.0 421 3.0 805.5 7,411 8.3 2,575 2.8 10,479 39.1 8.429 63.8 2,050 14.6 83. 2.0 2,505 2.8 1,246 1.3 1,299 4.8 7.3 361 2.6 82

------------------------------------------------------------------------------
-----------------------------------------------
-----------------------------------------------
-------------------------------------------------------------------------------------
------------------------------------------------------------------------------------
ERRATA April 1, 1975
PIQse substitute tiis page for page 16 i. your copy of Monthly Vital St.tktics Report, Vol. 23, * No. 11, Supplement (2), FchmaIT 10, 1975, “Summary R.POIS,~IPl Mor=fity.$~ti,tic,,197S”
16 MONTHLY VITAL STATISTICS REPORT
Table 9. DEATHS AND DEATR RATES FOR THE 10 LEADING CAUSES OF DEATH, BY COLOR AND SEP. UNITED STATES, 19’73
~efera only to restdent deaths occurring within the United States. Excludes fAIl deaths. Fates per 10C,OOO estimated population in specified group]
R*Orser Ce.uBeof death, color, and sex (Eighth Revision, International Classification of Disea.5efi,Adapted, 1S6S) Nvnber R2te
I I I
Total, both sexes-all cawes ---------------------------------------------------------------------------------- 1,973>003 940.2
1 Diseases of he@------------------------------------------------------------------------------39O-398,4O2,4O4,4lO429 737,075 360.8 2 h!alisnantneoplww, including neoplasm of lymphatic mdhmtqoietic tissues------------------------------.-l4O-2OS 331,033 167.3 3 CerebtowcIO-Ew disewes------------------------------------------------------------------------------------.-&3O438 214,313 102.1 & &c~aats---------.----..--.-------.-----.----.-----.-----..------------------------------------------------moo-m49 115,821 35.2
. . . M&.orvebicle =cidents------------------------------------------------------------------------------------~lO-D23 55,511 26.5
... AU oth=accidente E800-Es07,E825-E949 60,310 28.7 5 Inf2.uenzaand pnewtia-------------------------------------------------------------------------------47O474,48O+S6 62,559 29.8 6 Diabetes Ellitu8--------------------------------------------------------------------------------------------...--23O 38,20S 18.2 7 Cirrhosis of =ver-------------------------------------------------------------------------------------------------37l 33,350 15.s s Meti0sclerosis---------------------------------------------------------------------------------------.----.---..44O 32,617 15.5 9 Certain causes or nnrtality in early itiancy 760-769.2,769.4-772,774-778 30,503 14.3
10 Sruncbitis, emphysema, and atW------.-----------------------------------------------------------------------49O-493 29,70!3 14.2 ... All other cames----------------------------------------------------------------------------------------------&sidti 307,794 146.7
T!lite,mile+ill cawes ------------------------------------------------------------------------------------------ 937,918 1,071.2
1
2
rnse=es of heA--.---------------------------------------------------------------------------39O-398,4O2,4U,4lO~29
Malignent.eopl.ssms,Includlns neoplasinsof lwnphatlc end hematopoietic tissues--------------------------------l4O-2O9 363,289 169,544
430.9 189.6
3 Cerebrowscular disemes--------------------------------------...--...--------------..-----.---..---..---...--d3o-438 81,330 91.2 4 kcidents----------------------------------------------------------------------------------------------------moo-m4s 67,853 73.9
... Motor vehicle accidmt6---------.-------------------------------------------------------------------------.~lO-~23 34,370 38.4
... All.other ucide"ts------------------------------------------------------------------------------~OO-=O7,W23-~49 33,425 37.4 5 Influenza ad pnewnia---------------------------------------------.----.----.--------------.-.--.-..47o.474,*80-486 29,141 32.66 Srcmchltis, emphysema, and &ti-----------------------------------------------------------------------------d9Od93 21,325 23.97. Cfrrhosis of Hver-------------------------------------------------------------------------------------------------57l 16,372 20.38 Sufcide-------------------------------------------------.----.-----.--------------------..----..-------------Es5o.w5S 1S,823 18.09 Diabetes menit=--------------------------------------------------------------------------------------------------25O 13,343 14.9
.2,769.4-772,774-778 13,089 14.6 ... All other cawes---------------------------.---------------------------.----------------------------------.---%sLdti 141,56S 3.5s.3
White, female-ill causes-------------------------------------------------------------------------------------<-- 770,487 823.0
1 Diseues of heti-----------------------------------------------------------------------------39O-S9S,4O2,4~,4lO429 299,070 319.4 2 Malignant neopla.wns,including neoplamns of lymphatic ad hfmiatopoietictissues--------------------------------140-209 143,233 133.o 3 Cerebiwvascul.ardise-es--------------------------------------------------------------------------------------43O+3S 106,494 113.7 4 kcidents--.---------------...--.----------------------------------------------------------------------------E8OO-~49 30,630 32.7
... liltorvehicle wcidents---------------------------------------------:--------------------------------------~lO-~23 13,611 14.5
... All other wcidents------------------------------------------------------------------------------~0O-~O7,E823-~49 17,039 18.2 5 Influenza and pnemonia-------------------------------------------------------------------------------47O474,48O426 24,964 26.7 6 Diabetes mellitu8------------------------------------------------------------------------------------------------..25O 18,5s9 19.9 7 tie fiosclemsis----------------------------------------------------------------------.---------------------------44O 17,927 19.1 6 Cirrhosis of liwr-------------------------------------------------------------------------------------------------57l S,444 10.1 9 Certain causes of mortality in early fnfmcy-----------------------------------------------76O-769.2,769.4-772,l74-77S 9,097 9.7
10 Suicide-----------------------------------------------------------------------------------------------------ES5O-ES5S 6,5S9 7,0 ... All other cawes-----------------------------------------------------------------------------------------.-.-Residti 104,42S 116.8
10 Certain causes ofmotiality in wtiim~cy 760-7S9
All other, male-all causes 158,877 1,084.6
1 Diseases of heA---------------------------------------------------.--------------------------39O-398,4O2,4W,4lO+29 39,16S 305.s 2 MaJ.ignantneoplasm!, including neoplasms of lymphatic and hematopoietic tissues--------------------------------l4O-2O9 21,776 170.1 3 kcidats--------------------------------------------------------------------------------------------.-------WW.E949 12,216 98.3
... Motor vehicle =cidents-----------------------------------------------------------:------------------------WlO-ES23 3,371 43.5
... All other =cidents-------------------------------------------------------------------.-------.--~OO-WO7,W25-~49 7,045 33.0 4 Cerebmmscular disewee---------------------------------------------.-----.----------._-------..-----.------+3Od3s 12,30S 96.1 5 Hoticide--------------------------------------------------------.----------------------:---------------------~6O-~7S 8,429 65.8 6 Im23.uenzeend pnemonia--------------------------------------------------------------------.-------2--+7O+74,48O.48S 3,0s3 39.7 7 Certein causes of mortality ‘inearly infancy-----------------------------------------------760-769.2,769.4-772,774-776 4,717 36.S 8 Cirrhosis of l1ver-------------------------.---------------......----.----------.--.-..-.--.-----.--.-.----.---....37L 3,410 26.S 9 Diabetes m~litw--------.-----------------------------------------------------------------------------------------25O 2,326 18.2
10 Bronchitis, emphysema, and ffitw---------------------------------------------~-------------------------------49O493 1,375 10.7 ... ~&bercawes-------------------------------.--------------...--.-.----.----------.---.----..-.-..-------.Residw 27,S71 216.1
A2.lotber, f4e-~lcawea 105,721 753.4
1 Idse@aes of he&-----------------------------------------------------------------------------390-392,402,404,410-429 33,350 239.7 2 Malignant neoplasms, l.ncludingneqlasms of lymphatic sndbematopoletic tissues--------------------------------l4O-2OS 16,500 117.9 3 Cerebro.ca.sculardiSeffieS--------------------------------------------.--.-----------------.-----.-.--..--------d3Od38 13,961 99.9 4 keidats--------------------------------------------------------------------------------------------------~OO-~49 4>70s 33.6
... Motor vehicle accidat6--------.-----------------.-------------------------------------------.-----.-------~lO-W23 1,959 14.0
... All other ucidents--..---.----------------------------------------------------------------------~OO-WO7,m25-E949 2,743 19.6 5 Diabetes me~it"s--------------------------------------------------------------------------------------------------25O 3,950 2s.2 6 Certain’causes ofmortalityln ewlyinfmcy-----------------------------------------------76O-769.2,769.4.772,774-778 3,600 25.7 7 Influenza mdpnem.nia-------------------------------------..---------------------..-----.---.---..--470474,48Oq6 3,371 24.1 6 Cirrh0su3 of =ver------------------------------------------------------------------------------------------------*7l 2,124 13.2 9 %ticide--------------------------------------------------------------------------.--------------------------E96O-~78 2,050 14.6
10 tieti0sclerosis-----------------------------------------------------------------------------------------.------..40 1,2s8 9.2 ... All other cawes----------------------------------------------------------------------------------------------Residti 20,605 147.2
I I 1
w. .86..1*
mtable6,line6, totalfigure[n thissame issue, Car“Tuberculosis, other forms,’” should he changed
from 886 to 566.

--------------------------------------------------------------------------------
--------------------------------------------------------------------------
--
---------------------.
-------------
------------------------------------------------------
MONTHLY VITAL STATISTICS REPORT
Table10. DEATHS UNDER 1 YEAR AND INFANT MORTALITY RATES BY COIKIR,FOR 65 SELECTED CAUSES: UNITED STATES, 1973
[Refer. to resident withintheUnitedStates.ExcludescnO.Y deathsoccurring fetaldeaths]
ntmber Ratel Causeof death(Ei@th Revision, ClassificationInternational
ofDiseases,.4@ted,19.35)
Total White U othex Total 11 other
e.43.1 c!lusez 55,561 40,239 E, 34Z .,771. 1>377., 2,619.4
648Diarrhea!. d=
364
_
diseases------------------------------------------------------------.-------------O39 2e4 20.7 14.: 48.5klvxping 5 5cOur>-------------------------------------------------------------------------------~3 0.2 0.2 .lrleninGOcoccal 90 72infection8---------------------------.---------------------------.-------------O36 16 2.9 2.E 3.1
~—---------------------- 3Tetmuo-------- --.---------------------------------------------------OS~ 0.1 0.3805 557Septicmia--------------------.--------------------.-----------------------------------------038 24C 23.7 21.E 42.3
Viraltiseases 23.6 162 34 6.9 6.4 9.2Congenitalmhflis--.--.---------------------.--------.-----------------.--.---.--------~t079 090 9 4 : 0.3 0.2 0.9 Otherinfective Msease~-------------------------------------Ratinderandparasitic of OOf-136 3.s0 102 5E 5,1 4.C 9.9
including of QmphaticandhematopoieticMal@ant neoplasms, neoplasms tissues----------l4O-2O9 234 3.16 lE 4.3 4.5 3.1Beni@,necplasss ofunspecified 48andneoplazms nature-------------------------------------2lC-239 43. i 1.5 1.e 1.2
Diseases 20of thwus ~and--------------------------------------------------------------------2543.4 e 0.6 o.: 1.0 77 70Cysticflbrosis----.----------------------------------------------------------------------2=.O 7 2.5 2.i 1.2
of thebloodandblood-forming 236Diseases orgms-------------------------------------------28@289 163 7.5 6.4 12.5lieningitis---------------.-----------------------------------------------------------------320 1% 15.7 I.S.: 29.7492 318Otherdiseases ----------------------------32l-389of nervouswstem and sense orgms-----------. 417 323 94 23.3 ls.7 16.0
Acuteupperrespiratory lslWectim+--------------------------------------------------.--46s465 78 42 3.9 3.1 7.3Bronchitis 237andbr0nti0Mtis--------------------------------------------------------466,49O,49l2.s9 6t 7.6 6.6 Il.6Influenza 3,562 sandpn-otia----.-----------------------------------------------------47+474,48+4e62,24 1,3E 2.13. 86.2 224.1~fluenza---------------.----------------------.---------------.----.-----------_---47+47452 30 22 1.7 1.2 3.6m-0nia--------------------------------.--------------------------------.------_----4eS4e63,310 2,219 1,293 2.1.1.9 87.C 220.3
Otherchronicinterstititi 38~emmia-------.---.--------------------------.-----------------5l7 32 1.2 1.? 1.0 of respiratory 526A7.1otherdiseases system-------.----------------.--------492,493,5~5X,5~,5l9 357 16: 2.6.6 14.c 28,8
Herniaandimtestind. 477obstmction-.-----------------.---..---------------------------55G553,56O3el 96 2.5.2 14.$ 16.4d“odenitis, andcolitisof noninfectiousGastritis, enteritis, origin----------------535,56l,S6349 23 2E 1.6 0.s 4.4
Otherdiseases system-------------------------- 335 217 3-3.6 10.7 e.5 20.1of digestive 52c-534,536,557,340-543,562,5e4-377
anaties---------------------------------.----------------------------------74&759C.msenitti 8,953 7,458 1,495 265.4 292.4 255.1bacephtius---------------------------.-----------------.-------------------------------74O764 71d 6~ 25.0 2e.3 Q. 6
445 404epinabifida------------------------------------.--------.----------.------------------__-74l 41 14.2 ls.~ 7.0Congenital 439 354tidrocephtius------------------------------------------------------------------742 85 14.0 I&s 14.5Otherc.angenital of central. --------------------743,744336 269 4e lo.e Il.3ancmzlies nervoussystemandeye----.-.
awmdies ofhea+--.----------. 3,3s%Congenital -----------------------.----_----_----.------746 2,749 6ti 106.9 107.E 103.3ncm.liesOfcirctiataWsWtm-----------------------------------------747Othercongetitala 642 327 lx 20.5 20.7 19.6
Congenital ofrespiratoq~ 573.9.ncnm.2.ie2 syst~------------------------------------------------748 46e 104 1s.3 1.S.4 17.7ananzl.ies smt~.-------.--------.--------------------------749-75lCongenital ofdigestive 465 364 101 14.a 14.3 17.2
COnnenital of zenitourinam 324ancmalies =sta-------------------------------------------752.753 2eo 44 10.3 11.c 7.3 Congenital syst----------------------------------.-----73+7S6anties ofcausculoekeletal 305 259 ‘K 9.7 10.2 7.9
95 79Down’stiseas+-----.--------------------------------------------------------------------759.3 IE 3.0 3.1 2,7Othercongenital affecting 994nyndranes multiplesystems-----------------.7739C-739.2,739.4-739.9 au X31 31.7 31.9 30-9Otherandunspecified aces------------.-.--------------------------745,757,75econgenital 193 2-Ss 40 6.2 6.1 6.8
Certaincausesofmorte.lity 76C-769.2,in emly infancy------------------------- 769.4772,774776 30,391 22.104 e,2e7 968.e 866.5 1$414.3 chroniccirculator2nd.. diseases 9nenitourinzn’v inmothez-----------------------------------76O 6 1 0.3 0.3 0.2
unrelatedOthermaternticonditions to [email protected] 2e7 236 51 9.1 9.3 8.7 smhflL*------------. .---------..——— --------------------------------7fi1.o1 1 0.0 0.0.“.. -
me~itW.----------------.--------.--..---.-------------.--------------------76l.lDiabetes 143 lsz 21 4.6 4.e 3.68ube~a---------.----------------------------------------------------------------------76l.3 0.3 0.410. 10.423othermatern~conditions to preg.-nancy---- 761.2,761.4761.unrelated 7,761.9 3.33 3.03 30 4.2 4.C 5.1
Tvxelda of plwnancy--------- ---------. X39--------------------------------------------------762 97 42 4.4 3.e 7.2ifatemal andintrapartun! 190antepartum itiection--.--------.-_------------------------------763 X36 54 6.1 5.3 9.2Difficult 448 7b~r..----.-------------------.--------------------------------------------76+76a356 92 14.3 14-C 3.3PWithmentionofbirthinjtuy(.O-.3) 1.S8 96 30 4.1 3.e 5.1WithoutmentionofbirthinJuIY(.&,.9 320)---------------------------------------------------- 256 62 10.2 10.1 10.6
Allothercomplications andchildbirth--- 769.4,769ofpregnancy ----------769.0-769.2, .5,769.9 3,455 2,543 922 Llo.1 99.7 3.55.6ConditionofP1.ztcenta 1,31e----.---------------------------------------------------.-------77o 1:049 269 42.0 41.1 45,8
Of umbilical ----.. 295COllditiOIIS COti-.-----------. ---.------------------._-----------------.77l -237 3e 9.4 9,3 9.98irthinjurywithoutmentionof cause-------------------------------------.-------------77z 1,3oe 544 59.0 51.3 92.6I,e52Eemowic diseaseof newborn----------------.-------------------------.---------------774,77s 374 326 4e I.1.s lS.6Ii@inemembrane -----------. 4,467disease ------.---------------------------------------------776.l 3,539 926 142.4 X38.7 E::Re@X?.tOIYdistress 4,091Smd~~-----.---..------------.------------------------------------776.23,098 993 i50.4 121.4 3.69.5
ofnewborn, 5,3eoAcphyxia wqecified---------------------.----------------_----------------776.3 3,7ea 1,S92 171.5 148.5 271.7Allothermxi. nndhypo.tic mt elsewhe=Ck+3ifiBble--.-------73,776746.3,776.4conditions 644 439 203 ‘20.5 17.2 35.0Immaturity, S,369wq-fied-------------------..----.----------------------------------------777 3,seo 1,789 171.2 140.3 303.3
1 1Po$tmttity-----------------------------------------------------------------------------77a.l 0.0 0.03iem0rrh3sic 453diceaseof newbom------.--------------------------.---.---_---------------776.2 324 329 14.4 2.2.7 22.0A2J.otherconditions 1,62.8of ne.tim----------------------.----------------------77o.o,778.3,n8.91,039 580 51.6 40.7 99.0
SW@OQE andiD.-defined --------------------. ---------------7cmtitions-----------. -----. e~7g6 4,zoe 2,844 1,364 134.1 103.6 266.9Accldentc-----------------------:-------------------.----------------------------------~O3~491,691 1,2.51 540 53.9 45,1 92.2Inhzlati.on of feedOX.otherobjectcausingobst~cti~nor .guffocaticm---E92.,E912l2or ingestion 485 326 139 ls.5 3.2.6 27.1Accidental ctifocatio"----. 336mechanical ---------------------------------------------------D~ 229 107 10.7 9.0 2-S.3Otheraccidental e70cauces----------------------------------------------------mo&E9lo,E9l+B49 596 274 27.7 23.4 46-8
161 99fimicid--------------------------------------------.---------------------------------m6+E97e 62 5.1 3.9 10.6All.othercauses--------------. 1,472--------------------------------------------------------Residu~ 966 506 46.9 37.9 86.4
lPer100,000livebirthsin specifiedsroup.

-----------------
------------------------------------------------------------
18 MONTHLY VITAL STATISTICS REPORT
Table 11. MATERNAL DEATHS AND MATERNAL MORTALITY RATES FOR SELECTED CAUSES, BY COLOR UNITED STATES, 1973
[k!a.temel deaths are those a,ai.znedto Complications of pregnancy, childbirth, and the Puerperium, estewry nu’ahers630-678 of the Eighth Revision, Interns-‘cIonalC1.assifice.tio.of Diseases, Adapted, 1983. Rates per 100,000 live births in specified group]
— Nvnber of deaths Mmttiityrate
Csu,e of aoath
Total white J-1other Total White AU otherIComplications prew+mv, chlla.bitih,and the puewerium---------------------63U-678 477 274 203 L3.2 10.7 34.6of
— _
Ectqic pre~acy------------------------------------------------------------------------63l 46 25 21 1.5 -+- 1.0 3.6
Toxemia of pregnancy and the p.erperium, except abortion with tOx~a---------------636 -639 13J 57 34 3.5 2.2 9.2
Hemorrhage of pregnancy and chll&itih-------------------------------------------632,651-653 80 40 20 1.9 1.6 3.4
Ahotiions------------------------------------------------------------------.---------&0-645 36 15 21 1.1 0.6 3.6
Abortions induced for legal indications-------------------.------------------------aO,64l 8 5 3 0.3 0.2 0.5
Abortions induced for other reasow----------------------------------------------------642 l-l 2 9 0.4 0.1 1.5
Spontaneous abotiion---------------------------------.---------------------------------m3 3 1 2 0.1 0.0 0.3
Other and unspecified abortions----------------------------------------------------,645 14 7 7 0.4 0.3 1.2
Sepsis of childbirth and the pue~erim------------------------------------------670,67l,673 98 64 34 3.1 2.5 5.8
All other complications of pregnancy, childbirth, and the puevetim--------------------------------------------------63O,633-635,654-662,672,674-678 124 72 52 4.0 2.8 8.9
Delivexy without mention .f cwlicatiow---------: --------------------. ffiO 2 I 1 0.1 0.0 0.2
Table 12. AGE-ADJUSTED DEATH RATES FOR SPECIFIED CAUSES, BY COLOR AND SEX UNITED STATES, 19’73
[Refersonly to resident deaths o.curringwithln the United State6. Excludes fetal deeth.. Zased on age-specific death rates per 100,000 estimated midyearpqmlation in specified WOW. Cmnp”ted by the direct method, using as the standard population the age distribution of the total population Of the Unitedstates as enumerated in 1940]
Total white All other m Cause of death (Eighth Revision, International Classification
Of Diseases, A88pted, 1963) Seth E&h
I Both
Male Wm31e Mle Female Male ‘male sexes sexes sexes
.. .——— 874.1 423.7 953.1 3.206.7 738.9
. . _ M&jm’ cardiovasculm diseases---------------------_------------------xg&446 328.9 434.2 240.6 317.9 428.7 228.8 4s2.0 477.0 339.3
Oise&ses of heart----------------------------------38G398,4W,4O4,41*429 244.4 339.3 187.4 239.9 339.1 160.3 279.8 344.7 225.8 ?mertension---------------------------------------------------4OO,&0l,4O3 2.4 2.9 2.0 1.9 2.4 1.3 8.4 7.1 3.9 Cerebrovascular diseases------------------.------------------------43&438 83.7 70.4 38.5 58.6 66.3 54.5 88.7 106.7 93.8 Arteriosclerosis---.----------------..-.-..-----------.---------..---..44o 8.0 8.9 7.3 8.0 9.0 7.2 7.8 8.3 -1.2
Malignant neoplasm, imluding neoplasm of Qmphatic and hematopoietic tissues-----------------------------------------------14+2~ 130.7 160.1 1C8.7 127.7 1.36.2 108.8 156.4 185.9 124.3
Accidents-------------------------------.------.-.-.---.-----------E8@E948 31.7 77.4 27.4 49.5 73.6 26.4 67.5 106.8 33.2 Motor vehicle accidmts------------------.-.-.--------.-----.----E8l&E=3 26.4 59.3 14.0 26.0 38.4 14.0 30.0 47.8 14.4 AU other accidenis-----.-.---.----------------.-------E8OWE8O7,E825-E949 23.3 38.0 13.3 23.5 35.2 12.4 37.8 59.0 18.8
Tnflumza and pemni&---.----------------------.----------47&474,48G496 20.1 26.6 1.,.2 18.5 24.6 14.0 31.4 42.3 22.3 Cirrhosis of liver---.----------------..--..--.-----------.------..------57l E. 0 20.9 9.9 13.7 1.6.3 8.7 25.3 33.8 18.0
9
All causes 692.9 911.7 51.3.1 659.3 --+-
Diabetes mellit"s---.----------------------.-----------------.-----------25O 1.3.2 l.c. 13.3 11.8 1.2.0 11.6 25.3 21.1 28.8S@c!de-----------------------------------------..---...-----------E95&E959 E. 0 18.0 6.6 1.2.6 3.8.7 7.1 7.2 Il.6 3.3Hoticide-------------------.----------.-----.----------------------E96&E978 10.5 16.7 4.5 5.7 8.7 2.8 44.4 77.1 16.0Bronchitis, emphysema, ma a~th~-------------------------------..--49~493 10.4 18.2 4.5 10.6 3.6.8 4.6 7.3 12.0 3.8~berculosis, all fOms----------------------------------------------0l&Ol9 1.5 2.4 0.8 1.1 1.7 0.6 5.2 8.1 2.7

---
MONTHLY VITAL STATISTICS REPORT
SYMBOLS
Data not available---------------------------------------
Category not applicable-------–---------------–--– . . .
Quantity zero --------------------------------------------- -
Quantity more than Obut less than 0.05 ----- 0.0
Figure does not meet standards of reliabilityy or precision ---------------------------- *