final draft transportation task force report 3.16.15
TRANSCRIPT
TRANSPORTATION TASK FORCE REPORT 2015
Idaho Governor’s Office of Energy Resources
304 N. 8th Street, Suite 250 P.O. Box 83720
Boise, Idaho 83720-0199 Phone: 208-332-1660
Website: www.energy.idaho.gov

2
TRANSPORTATION TASK FORCE REPORT
2015
Submitted to the Idaho Strategic Energy Alliance Board of Directors
Prepared by the ISEA Transportation Task Force

3
ISEA TRANSPORTATION TASK FORCE Chair:
Scott Stokes - Idaho Department of Transportation
Members:
Neil Colwell - Avista
Byron Defenbach - Intermountain Gas
Jon Van Gerpen - University of Idaho
Charlie Jones - Stinker Station
Kent McCarthy - Idaho Power Company
Jim Francfort - Idaho National Laboratory
Matt Shirk - Idaho National Laboratory
Jess Byrne – Idaho Department of Environmental Quality
Chrissy Bowers – Idaho Department of Commerce
Calvin Fillmore - Diamond Line Delivery
Jon Wadsworth – Blu LNG
Rachele Klein - Republic Services

4
Contents
ISEA TRANSPORTATION TASK FORCE ....................................................................................................... 3
Executive Summary ......................................................................................................................................... 7
TRANSPORTATION FUELS ........................................................................................................................... 8
Petroleum-based Fuels ............................................................................................................................... 8
VEHICLES ..................................................................................................................................................... 28
REGULATORY CONSIDERATIONS .............................................................................................................. 41
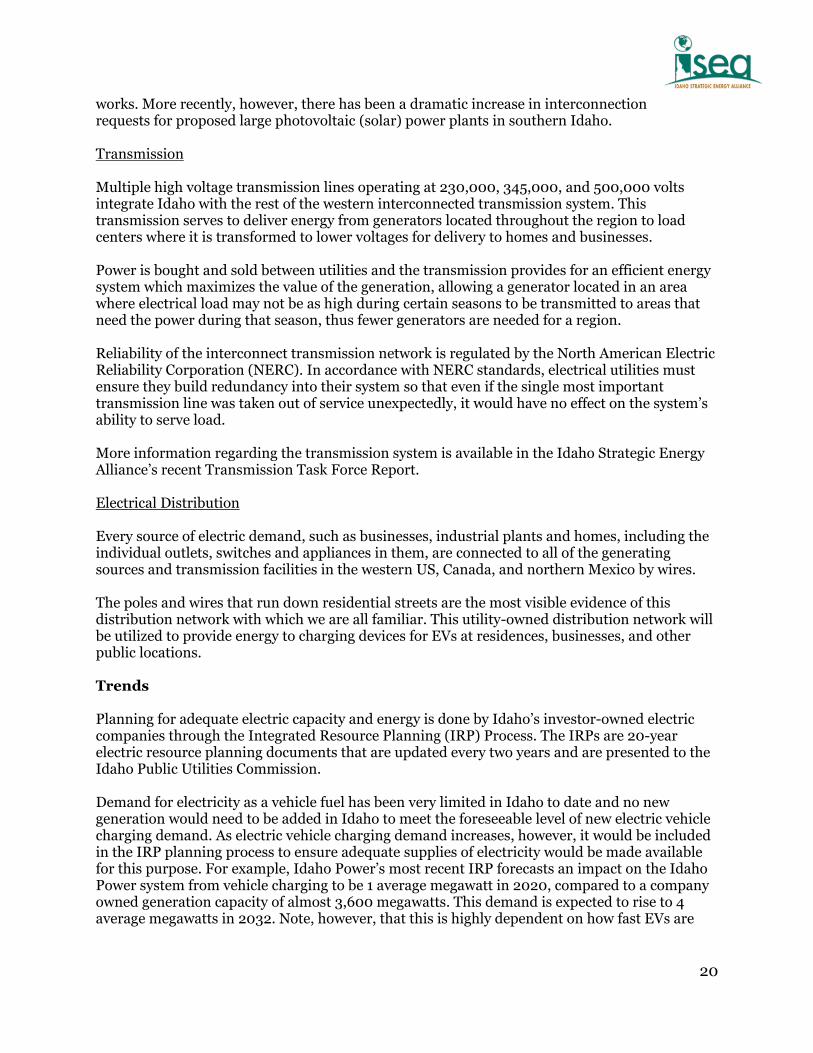
Figure 1. Petroleum and Transportation Fuel Pipelines .................................................................. 9 Figure 2. Gasoline and Diesel Consumption, (Transportation Sector) 1960-2012 (U.S. Energy Information Administration) .......................................................................................................... 10 Figure 3. Idaho Motor Vehicle Registrations, 2003-2013 (Idaho Transportation Department) .. 11 Figure 4. Idaho Annual Vehicle Miles Traveled for the State System with the Interstate System, 1990-2013 (Idaho Transportation Department) ............................................................................ 12 Figure 5. Electric Vehicle Effects on Household Energy Demand ................................................. 22 Figure 6. Battery Electric Vehicle .................................................................................................... 32 Figure 7. Plug-in Hybrid .................................................................................................................. 33 Figure 8. Hybrid Electric Vehicle .................................................................................................... 34 Figure 9. Typical Fuel Cell for use in a Fuel Cell Vehicle ............................................................... 34 Figure 10. Two Examples of AC Level 1 Electric Vehicle Supply Equipment ................................ 35 Figure 11. Two Examples of AC Level 2 Electric Vehicle Supply Equipment ................................ 36 Figure 12. Two Examples of DC Level 2 DC Fast Chargers ............................................................ 36 Figure 13. Plug-in electric vehicle charging station locations in the State of Idaho as reported by DOE Alternative Fuels Data Center ................................................................................................ 38 Figure 14. PlugShare map of PEV charging locations in the State of Idaho .................................. 39 Figure 15. Historical and projected fuel economy standards from 1976 through 2025 ................ 42 Figure 16. Treasure Valley Ozone, Design Value versus Standard ................................................ 45

5
Acronyms
AC Alternating Current
ASME American Society of Mechanical Engineers
AVMT Annual Vehicle Miles of Travel
BEV Battery Electric Vehicle
BPA Bonneville Power Administration
BTU British Thermal Unit
CAFÉ Corporate Average Fuel Economy
CHAdeMO "CHAdeMO" is a trade name of a quick charging method that this Association is proposing globally as an industry standard. “CHAdeMO" is an abbreviation of "CHArge de MOve", equivalent to "charge for moving", and is a pun for "O cha demo ikaga desuka" in Japanese, meaning "Let's have a tea while charging" in English1
CNG Compressed Natural Gas
DC Direct Current
DEQ Idaho Department of Environmental Quality
DOE U.S. Department of Energy
DOT U.S. Department of Transportation
EISA Energy Independence and Security Act
EPA U.S. Environmental Protection Agency
EREV Extended Range Electric Vehicle
EV Electric Vehicle
EVSE Electric Vehicle Supply Equipment
FCEV Fuel Cell Electric Vehicle
FCV Fuel Cell Vehicle
FFV Flexible Fuel Vehicle
GGE Gasoline Gallon Equivalent
GHG Greenhouse Gas
HEV Hybrid Electric Vehicle
ICE Internal Combustion Engine
IGC Intermountain Gas Company
INL Idaho National Laboratory
IPUC Idaho Public Utilities Commission
IRP Integrated Resource Planning
kW Kilowatt
1 www.chademo.com/01_What_is_CHAdeMO.html

6
kWh Kilowatt-hour
LDC Local Distribution Company
LNG Liquefied Natural Gas
LPG Liquefied Petroleum Gas
MY Model Year
NAAQS National Ambient Air Quality Standards
NG Natural Gas
NGV Natural Gas Vehicle
NEMA National Electrical Manufacturers Association
NERC North American Electric Reliability Corporation
NHTSA National Highway Traffic Administration
OEM Original Equipment Manufacturer
PADD Petroleum Administration for Defense District
PERC Propane Education and Research Council
PEV Plug-in Electric Vehicle
PHEV Plug-in Hybrid Electric Vehicle
RFS Renewable Fuel Standard
SAE Society of Automotive Engineers
V Volt
WCSB Western Canadian Sedimentary Basin

7
EXECUTIVE SUMMARY Transportation is a major component of energy use in Idaho. The U.S. Energy Information Administration points out that in 2012 the transportation sector accounted for 25.6% of the end use energy consumption in Idaho. With this in mind, the Idaho Strategic Energy Alliance formed the Transportation Task Force and tasked this group with preparing a report that provided thorough, data-driven information on vehicles, fuels, and fuel infrastructure in Idaho, including insights on trends and potential opportunities and risks in the future. Such information and insights would help stakeholders and policy makers to better understand energy aspects of transportation in Idaho and to make decisions that support a secure, reliable, stable, and affordable transportation energy system that protects the environment, fosters energy efficiency, and promotes sustainable economic growth. The scope of this report is limited to roadway transportation, specifically light-, medium-, and heavy-duty vehicles, their fuels, and fuel infrastructure. It does not address air, rail, or ship transportation, although these areas could be the subject of a future report. The following are some of the important facts and insights in this report:
While petroleum-based fuels provided 95.5% of transportation energy in Idaho, the use of alternative fuels such as compressed natural gas, liquefied natural gas, propane, and electricity is increasing.
There is no commercial petroleum production or refineries in Idaho; all of the petroleum-based fuels consumed in Idaho are produced elsewhere.
The growth of domestic petroleum production has resulted in a significant decline in petroleum imports; in fact, North America (U.S., Canada, and Mexico) could become petroleum independent in the next few years.
The cost of petroleum-based fuels is highly dependent upon the world-wide cost of petroleum.
Fuel consumption by light-duty vehicles in the U.S. peaked in 2004, due to increases in vehicle fuel economy and decreasing miles driven; such trends may be occurring in Idaho, but currently miles driven are still increasing.
Idaho is one of the nation’s leaders in the introduction and deployment of liquefied natural gas as a substitute for diesel fuel in heavy-duty vehicles.
Demand for electricity as a vehicle fuel has been limited in Idaho to date; with no additional generation being needed to meet the foreseeable level of new electric vehicle demand.
Alternate fuels are often less expensive than petroleum-based fuels, but growth of alternatively fueled vehicles is constrained by higher vehicle purchase costs and, in some cases, limited fuel infrastructure.
Technology improvements are decreasing the cost of alternatively fueled vehicles and improving fuel economy for all types of vehicles.
The trend with all hydrocarbon fuels is for increased fuel economy (Corporate Average Fuel Economy standards, CAFE).
As alternatively fueled vehicles become more common and as gasoline and diesel fueled vehicles become more fuel efficient there will be fewer emissions and air quality will benefit.

8
TRANSPORTATION FUELS
Petroleum-based Fuels
Gasoline and diesel are the primary petroleum-based motor vehicle fuels. They are obtained by fractional distillation of petroleum at a refinery. On average, one barrel (42 gallons) of petroleum provides about 20 gallons of gasoline and 12 gallons of diesel fuel2, the specific amount is dependent upon the composition of the petroleum and the operation of the refinery. One gallon of diesel contains about 13% more energy than a gallon of gasoline.3 Current Situation The transportation sector accounted for 25.6% of the end use energy consumption in Idaho in 2012.4 Petroleum-based fuels provided 95.5% of this energy (natural gas as a transportation fuel provided 4.5%).5 The Petroleum Administration for Defense District (PADD) is an organizational structure that originated during World War II to help organize the allocation of fuels derived from petroleum. PADDs are still used today for data collection purposes. There are five PADDs in the country. Idaho is in PADD 4, which consists of Colorado, Idaho, Montana, Utah, and Wyoming. This PADD has the lowest petroleum consumption and the second lowest petroleum production in the country. There is no commercial petroleum production and there are no refineries in Idaho. In comparison to other PADDs, PADD 4 has a small population, thin infrastructure, and difficult terrain with long distances, which affects infrastructure development. Gasoline produced in PADD 4 exceeds demand, which is declining. Excess gasoline is exported out of PADD 4. Diesel is in short supply. In 2013, diesel production in PADD 4 equaled demand, but diesel demand is increasing. Most motor fuel, gasoline and diesel, comes into Idaho via the Northwest Pipeline from Salt Lake City area refineries. This 760 mile pipeline runs from Salt Lake City, UT to Spokane, WA. Along this route there are fuel storage terminals in Burley, Pocatello, and Boise. The Yellowstone Pipeline runs from Billings, MT to Spokane, WA. Northern Idaho receives petroleum products from terminals in Pasco, Spokane, and occasionally Missoula. Both pipelines generally operate at capacity on at least a seasonal basis during the late spring and summer months when demand for gasoline and diesel is at its highest. These pipelines are regulated as common carriers (public utilities). Some gasoline and diesel is shipped into Idaho by truck and some diesel is shipped into the state by railcar (gasoline is never shipped by railcar due to its volatility). Trucks are also used to ship fuels from storage terminals to fuel stations
2 American Oil and Gas Historical Society 3 Alternate Fuels Data Center, GREET model, Argonne National Laboratory 4 U.S. Energy Information Administration 5 U.S. Energy Information Administration

9
Idaho is one of the few states that allows the use of conventional motor gasoline (gasoline not containing ethanol); however, most gasoline sold in the state contains 10% ethanol since the more populated states around Idaho require oxygenated gasoline. Taxes are levied on the sales of gasoline and diesel fuels. The federal tax on gasoline is 18.4 cents/gallon and on diesel it is 24.4 cents per gallon. Idaho taxes both gasoline and diesel at 25.0 cents/gallon. Trends The growth in domestic production has contributed to a significant decline in petroleum imports. U.S. crude oil production was 7.4 million barrels/day in 2013 and is projected to be 8.5 million barrels/day in 2015.6 The top five sources of imported petroleum in 2012 were Canada, Saudi Arabia, Mexico, Venezuela, and Russia.7 The share of fuel consumption met by net imports fell from 60% in 2005 to 33% in 2013; it is expected to decline to 20% in 2015, which would be the lowest level since 1968.8 The price of petroleum-based transportation fuels is highly dependent upon the market price of a barrel of crude oil, which tends to be volatile. Since July 2014, the price of a barrel of West
6 U.S. Energy Information Administration 7 U.S. Energy Information Administration 8 U.S. Energy Information Administration
Figure 1. Petroleum and Transportation Fuel Pipelines

10
Texas Intermediate crude oil has decreased from about $100 per barrel to below $50 per barrel in January 2015. During this time the price of gasoline (NY Mercantile Exchange) dropped from $2.70 per gallon to below $1.40 per gallon. Based on a constant crude oil price, it is projected that over the next few years the annual average gasoline price will remain fairly stable while annual average prices of diesel are expected to increase due to short supply and increasing demand.9
Figure 2. Gasoline and Diesel Consumption, (Transportation Sector) 1960-2012
(U.S. Energy Information Administration)
Figure 2 shows the consumption of gasoline and diesel fuels in Idaho. Since 2007, the consumption of motor vehicle fuel (gasoline and diesel combined) in Idaho has remained roughly level (with the exception of declines in 2008 and 2009 presumably due to the recession). The consumption of gasoline is expected to decline (due largely to increasing vehicle fuel economy) while consumption of diesel fuel is expected to continue to increase.10 For both fuels, there has been a large decrease in the rate of growth of consumption from previous years, despite an increase in motor vehicle registrations in Idaho (Figure 3).
9 Private communication, Charley Jones, Stinker Stores 10 Private communication, Charley Jones, Stinker Stores
0
2,000
4,000
6,000
8,000
10,000
12,000
14,000
16,000
18,000
1960
1962
1964
1966
1968
1970
1972
1974
1976
1978
1980
1982
1984
1986
1988
1990
1992
1994
1996
1998
2000
2002
2004
2006
2008
2010
2012
Thousand Barrels
Year
Idaho Transportation Sector Energy Consumption
Diesel Motor Gasoline

11
A recent national study of light-duty vehicles11 showed that the gallons of fuel consumed in the United States peaked in 2004 (138.8 billion gallons), the number of miles driven peaked in 2006 (2,773 billion miles), and the number of vehicles registered peaked in 2008 (236.4 million vehicles). Despite population growth, the amount of fuel consumed by light-duty vehicles in the United States decreased by 11% during the period 2004 (the year of maximum consumption) through 2012 (last year of the study). As such, fuel consumption in the United States by light-duty vehicles may never exceed the 2004 peak. Figure 4 shows the annual vehicle miles of travel (AVMT) in Idaho for the state and interstate road systems, which is based on actual travel counts. (Non-state road AVMT data is not included in this figure since AVMT for these roads is calculated based on fuel consumption; total AVMT including non-state roads is approximately 1.84 times the data shown in Figure 3 or almost 16 billion miles in 2013.) Annual vehicle miles of travel increased from 1990 through 2007, but at a declining rate. From 1990-1999, the average annual rate of increase was 4.0%; from 2000-2007 it increased at an annual average rate of 1.9%. In 2008 there was a 5.0% decrease in AVMT, presumably due to the recession. Since 2009, AVMT has increased at an average annual rate of 0.9%. These data suggest that AVMT will continue to increase but at a much lower rate than during 1990-2007.
11 Has Motorization in the U.S. Peaked? Part 5: Update Through 2012, University of Michigan Transportation Research Institute, UMTRI-2014-11, April 2014
Figure 3. Idaho Motor Vehicle Registrations, 2003-2013 (Idaho Transportation Department)
1,150,000
1,200,000
1,250,000
1,300,000
1,350,000
1,400,000
1,450,000
1,500,000
1,550,000
1,600,000
2003 2004 2005 2006 2007 2008 2009 2010 2011 2012 2013
Registrations
Year
Idaho Motor Vehicle Registrations

12
Figure 4. Idaho Annual Vehicle Miles Traveled for the State System with the Interstate System, 1990-
2013 (Idaho Transportation Department)
Impacts and Opportunities North America could become petroleum independent in the next few years; although the United States is expected to continue to import petroleum, although at declining rates. The development and use of new oil production techniques is significantly increasing domestic supply. The development and use of new oil production techniques, such as fracking, is significantly increasing domestic supply. Declining demand for gasoline (and for total motor fuels) will result in declining fuel tax revenues, affecting funding available for highway construction and maintenance. Declining fuel consumption will result in lower automotive emissions. Increases in public transit would further reduce overall petroleum fuel usage in Idaho, but this effect would be small. Biofuels
Current Situation Biofuel production in the U.S. is strongly affected by the Renewable Fuel Standard (RFS), which specifies the amount of renewable fuel that must be purchased for blending with petroleum-based fuels. The RFS acknowledges the potential for renewable fuels to help reduce dependence on foreign oil and greenhouse gas emissions. At the present time, there is considerable uncertainty about the amounts of renewable fuel to be produced for blending with petroleum-based fuels due to proposals being considered by the Environmental Protection Agency to lower production targets. Ethanol and biodiesel are the only biofuels that have achieved commercial status.
0
1,000
2,000
3,000
4,000
5,000
6,000
7,000
8,000
9,0001990
1991
1992
1993
1994
1995
1996
1997
1998
1999
2000
2001
2002
2003
2004
2005
2006
2007
2008
2009
2010
2011
2012
AVMT (m
illion m
iles)
Year
Idaho Annual Average Miles of Travel (AVMT)State System with Interstate System

13
Ethanol production in the United States is approximately 13.5 billion gallons per year. This is roughly equal to 10% of the gasoline production so further increases in ethanol production will require wide-spread use of ethanol-gasoline blends above E10. The EPA has authorized E15 to be used in 2001 model year and newer vehicles but the fuel is not widely available. Many flexible fuel vehicles (FFVs) have been manufactured that can use E85 (85% ethanol and 15% gasoline), but FFVs typically get about 15-30% fewer miles per gallon when fueled by E85 and this reduction in fuel economy may not be fully recognized in the fuel price. Most U.S. ethanol is made from corn, although small amounts are made from sugar, grain sorghum, potatoes, and wheat. Idaho currently has one operating ethanol plant in Burley producing about 60 million gallons of fuel-grade ethanol per year. Biodiesel consumption in the U.S. in 2013 was about 1.8 billion gallons. About 1.37 billion gallons were produced domestically and the rest was imported. Biodiesel is produced from vegetable oils and animal fats with soybean oil and distiller’s corn oil from ethanol plants representing the two largest sources of feedstock. Most biodiesel is blended in diesel fuel at 5% or less. Some applications, such as municipal bus fleets are using 20% blends and some mining vehicles are fueled with 100% biodiesel. Biodiesel is available in Idaho but mostly from out-of-state sources. The state has several small biodiesel producers but operation is intermittent and their sales are too small to impact the state fuel market. Most vehicle OEMs (Original Equipment Manufacturers) accept biodiesel blend levels up to B20 (20% biodiesel and 80% diesel fuel). The benefits of biodiesel are less diesel smoke and lower greenhouse gas emissions. Trends Future growth in corn-based ethanol is expected to be minimal due to Renewable Fuel Standard targets being achieved. Additional ethanol production is expected to come from cellulosic sources such as wood chips, wheat straw, and municipal solid waste, but industry growth has been slow due to unfavorable economics. For biodiesel, the supply of feedstock vegetable oil, animal fat, and recycled cooking oil limits future growth opportunities. The future of biodiesel in Idaho will be based on the availability of water and land to grow the crops used in producing the fuel. Important considerations are whether fuel production will affect the availability of land and water for food production. Impacts and Opportunities The first production facilities for ethanol from cellulosic sources are being built in the Midwestern states and will use corn stover and dedicated energy crops such as switch-grass. However, as this technology develops, Idaho’s plentiful supplies of wheat straw, sugar beet pulp, and wood waste should attract ethanol producers to the state. The current version of the Renewable Fuel Standard calls for ethanol consumption to reach 20% of the gasoline supply by 2022. Due to a lack of feedstocks, biodiesel growth is likely to be more modest. While the Idaho crops of canola and rapeseed produce high quality biodiesel, their value as premium food oils generally make them too costly for

14
fuel production. Because most oils and fats are byproducts of protein production, their supply tends to follow different market dynamics than the petroleum industry. Natural Gas
Natural gas is the cleanest burning fossil fuel. It is a naturally occurring mixture of combustible gases, principally methane (CH4), found in porous geologic formations beneath the surface of the earth. It is produced or extracted by drilling into those underground formations or reservoirs and then moving the gas through gathering systems and pipelines to customers in often far away locations. Idaho has two Local Distribution Companies (LDC’s): Intermountain Gas Company (IGC) in Boise, and Avista in Spokane, Washington. Intermountain Gas Company serves the southern part of the state; Avista serves northern Idaho. As a transportation fuel, natural gas is used in a compressed form, compressed natural gas (CNG) or as liquefied natural gas (LNG). Both compression and liquefaction are methods employed to increase the amount of natural gas that can be carried on the vehicle and thus increase its range. While CNG is used directly in an internal combustion engine, LNG must first be vaporized before it can be burned in the internal combustion engine, but this is a rapid and efficient process. Current Situation Supply Idaho is fortunate to be located in between two of the most prolific gas producing regions in North America. The first, the Western Canadian Sedimentary Basin (WCSB) in Alberta and northeastern British Columbia supplies on average approximately 55-60% of Idaho’s natural gas. The other region, known as the “Rockies”, includes many different producing basins in the states of Wyoming, Colorado, and Utah where the remainder of the Idaho’s supplies are sourced. Pipeline capacity availability suggests that Idaho’s LDC’s do not expect to drastically change their historical purchase patterns. Interstate Pipeline Capacity Idaho’s access to the gas produced in these basins is wholly dependent upon the availability of pipeline capacity to move that gas from those supply basins to the LDC systems. Idaho is well positioned in regards to pipeline capacity as this region has multiple interstate pipeline options providing ample capacity to transport gas from the areas where it is produced to end-use customers who consume the gas. Firm transportation capacity provides a mechanism whereby a pipeline will reserve the right, on behalf of a designated and approved shipper, to receive a specified amount of natural gas supplies delivered by that shipper at designated points on its pipeline system and subsequently redeliver that volume to particular delivery point(s) as designated by the shipper. Idaho is served by four different pipeline systems including the Williams Northwest Pipeline (“Northwest” or “NWP”). Northwest’s facilities essentially run from the Four Corners area north to western Wyoming, across Southern Idaho to Western Washington. The pipeline then continues up the I-5 corridor where it interconnects with Spectra Energy, a Canadian pipeline in British Columbia, near Sumas, Washington where it receives natural gas produced in northeast British Columbia. Gas supplies produced in the province of Alberta are delivered to Northwest

15
via the Gas Transmission Northwest (GTN) pipeline near Stanfield, Oregon. Northwest also connects with other U.S. pipelines and gathering systems in several western U.S. states (“Rockies”) where it receives gas produced in basins located Wyoming, Utah, Colorado, and New Mexico. All activity regarding transportation of natural gas supplies through any part of the interstate pipeline grid continues to be under the review and regulatory oversight of the Federal Energy Regulatory Commission (FERC). For in-state regulatory matters, the Idaho Public Utilities Commission (“IPUC”) provides oversight and oversees all aspects of natural gas service to IGC’s and Avista’s customers. Storage The LDC’s utilize self-owned or shared storage facilities to store excess natural gas supply during periods of low customer demand, saving it for use during high demand periods. Idaho LDC’s utilize storage capacity in four different facilities from western Washington to northeastern Utah. Two are operated by Northwest: one is an underground project located near Jackson Prairie, WA, and the other is liquefied natural gas (LNG) facility located near Plymouth, WA. IGC also leases capacity from Questar Pipeline’s Clay Basin underground storage field, and also operates its own LNG facility located in Nampa, ID. These storage locations allow LDC’s to inject excess gas into storage during off-peak periods and then hold it for withdrawal whenever the need arises. The advantage is three-fold: one, the LDC’s can serve the extreme winter peak while minimizing year-round firm gas supplies; two, storage allows the LDC’s to minimize the amount of the year-round interstate capacity resource, and helps them to use existing capacity more efficiently; and three, storage provides a natural price hedge against the typically higher winter gas prices. The LDC’s generally utilize their diverse storage assets to offset winter load requirements, provide peak load protection and, to a lesser extent, for system balancing. The geographic and operational diversity of the storage facilities utilized offers the LDC’s and their customers a level of efficiency, economics and security not otherwise achievable. Geographic diversity provides security should pipeline capacity become constrained in one particular area. The lower commodity costs and flexibility of underground storage allows the LDC’s the flexibility to determine the best use of other supply alternatives such as winter baseload supplies. There are only two public compressed natural gas (CNG) vehicle refueling stations in Idaho (one each in Boise and Nampa). However, various municipal and commercial fleets have their own CNG refueling stations for their vehicles. Liquefied natural gas (LNG) storage facilities make use of a process that super cools and liquefies gaseous methane under pressure until it reaches approximately minus 260°F. Liquefied natural gas occupies 600 times less volume compared to its gaseous state and so it is an efficient method for storage to meet peak requirements for natural gas. Because of the cost and cycle characteristics, LNG withdrawals by the LDC’s are typically reserved for "needle" peaking during very cold weather events or for system integrity events.

16
LNG is safe and non-toxic; it is non-corrosive and will only burn when vaporized to a 5-15% concentration with air. Because of the characteristics of liquid, its natural propensity to boil-off, and the enormous amount of energy stored, LNG is normally stored in cryogenic steel tanks. Liquefying natural gas is, relatively-speaking, a time-consuming process, the compression and storage equipment is costly, and liquefaction requires large amounts of added energy. It typically requires as much as one unit of natural gas burned as fuel for every three to four units liquefied. Also, a full liquefaction cycle may take 5 – 6 months to complete. Because of the high cost and length of time involved filling a typical LNG facility, it is typically “cycled” only once per year and is reserved for peaking purposes. As such, the unit cost of natural gas stored as LNG is more expensive. Similarly, LNG used for vehicle refueling has a higher unit cost than the natural gas itself. Vaporization, or the process of changing the liquid back into the gaseous state, on the other hand, is a very efficient process. Under typical atmospheric and temperature conditions, the natural state of methane is gaseous and lighter than air as opposed to the dense state in its liquid form. Consequently, vaporization requires little energy and can happen very quickly. Vaporization of LNG at a storage facility is usually accomplished by utilizing pressure differentials by opening and closing of valves in concert with some hot-water bath units. The higher pressure LNG is vaporized as it is warmed and is then allowed to push itself into the lower pressure distribution system. Potential LNG daily withdrawal rates are normally large and, as opposed to the long liquefaction cycle, a typical full withdrawal cycle may last 10 days or less at full rate. Liquefied natural gas is also stored at facilities for vehicle fueling. In this case, LNG is transferred on demand from the refueling facility to the vehicle’s cryogenic tanks. Idaho is currently one of our nation’s leaders in the introduction and deployment of LNG fueling for heavy-duty transportation vehicles. Blu LNG has seven public LNG fueling stations along the interstate corridor (located in Nampa, Boise, Jerome, Raft River, American Falls, Pocatello, and Idaho Falls). IGC is one of Blu’s major LNG suppliers filling LNG tankers at its Nampa LNG facility. Supply Trends Improved technologies for finding and producing non-traditional natural gas supplies have led to huge increases in gas supplies during this decade. Today, reserve and production forecasts predict ample and growing natural gas supplies because of shale gas. Shale gas produced in the mid-section of the U.S. has displaced production from more traditional supply basins in Canada and the Gulf Cost. There have been some perceived environmental issues relating to shale gas
This is one of 7 new LNG stations opened and
operated in Idaho by Blu LNG.

17
production but most studies indicate that if done properly, shale gas can be produced safely. Customers now enjoy the lowest natural gas prices in years due to the increased supply with the production of shale gas. The recent shale gas production increase in the U.S. mid-continent has forced Alberta natural gas producers to seek additional U.S. export markets. Thus Alberta-supply prices are now very competitive, or even lower than Rockies-supply prices. Idaho will continue to utilize a significant amount of Alberta supplies in its portfolio. Rockies-supply has historically been the second largest source of supply for IGC because of the ever-growing reserves and production from the region. The Rockies natural gas supply is readily available, comparatively inexpensive and highly reliable. Recently-developed natural gas production is underway in southwestern Idaho. IGC is currently delivering a small portion of this newly-developed Idaho natural gas supply to its customers in new Plymouth, Idaho. Interstate Pipeline Capacity Trends Because natural gas must flow along pipelines with finite flow capabilities, frequently demand cannot be met from a market’s preferred basin. Competition among markets for these preferred gas supplies can cause capacity bottlenecks and these bottlenecks often result in pricing variations between basins supplying the same market area. In the short to medium term, producers in constrained basins invariably must either discount or in some fashion differentiate their product in order to compete with other also constrained supplies. In the longer run however, disproportionate regional pricing encourages capacity enhancements on the interstate pipeline grid, from producing areas with excess supply, to markets with constrained delivery capacity. Such added capacity nearly always results in a more integrated, efficient delivery system that tends to eliminate or at least minimize such price variances. Consequently, new pipeline capacity - or expansion of existing infrastructure – in western North America has increased take-away capacity out of the WCSB and the Rockies, providing producers with access to higher priced markets in the Midwest and in California. Therefore, less-expensive gas supplies once captive to the Northwest region of the continent now have greater access to the national market resulting in less favorable price differentials for the Pacific Northwest market. Today, wholesale prices at the major trading points supplying the Pacific Northwest region are trending towards equilibrium indicative of a fungible commodity. At the same time, new shale gas production in the mid-continent is beginning to displace traditionally higher-priced supplies from the Gulf coast which, from a national perspective, appears to be causing an overall softening trend in natural gas prices with less regional differentials. So today the Idaho LDC’s are in an increasingly mega-regional marketplace where market conditions across the continent - including pipeline capacities - can, and often do affect regional supply availability and pricing dynamics. While gas supplies are readily available and national prices show a short-term softening trend, Idaho is increasingly competing with markets that have historically paid higher prices to obtain gas supplies and are actively building capacity to access the traditionally lower-priced supplies in the Rockies. In the long run, many forecasts predict tightening price differentials across the continent.

18
Impacts and Opportunities Natural gas is an excellent transportation fuel because it is: plentiful, affordable, domestically produced, and stably priced. In most states, natural gas is roughly half the cost of gasoline and diesel on an energy basis. We have a 200+ year supply readily available in the United States with even greater reserves available in North America. With its stable pricing, natural gas has proven somewhat immune to the fuel spikes we have experienced with gasoline and diesel. This allows businesses a high degree of accuracy when budgeting and forecasting fuel costs. Barriers to Natural Gas as a Transportation Fuel
There are a limited number of public CNG or LNG fueling stations in Idaho. Currently, there are two public CNG stations – one in Ada County and one in Canyon County; both are close to I-84. There are currently seven public LNG stations located along interstate corridors in Idaho, mainly serving the heavy-duty transportation market. The high cost of building a new CNG ($400,000 to 1.7 million) or LNG ($2 to 4 million) fueling station is a concern. Investors want to know if they will sell enough natural gas fuel to be profitable before they build a station while vehicle users want to know that there are fueling options available before investing in natural gas vehicles (NGV’s).
Stations must be built with access to natural gas pipeline. Since the federal highway excise tax is based on volume, not energy content, LNG is
taxed at 170% of the rate of diesel on an energy equivalent basis. More technicians need to be trained to service NGV’s. More maintenance facilities need to be modified to service NGV’s, with the addition of
additional ventilation and methane alarms. With respect to LNG, Idaho tax structure disincentivizes its use as a fuel, taxing it higher
than the equivalent tax to diesel (specific to LNG) Electricity as a Transportation Fuel Electricity has been used as a transportation fuel since before the 20th century. In fact, in the early 1900s, most non-horse drawn taxis in New York City were battery powered. Electricity lost its preeminence once infrastructure was put in place to deliver inexpensive and abundant gasoline. Modern increases in gasoline prices, a desire to stop importing foreign oil, and the environmental superiority of electric vehicles has increased the interest in electric vehicle (EV) ownership and has caused utilities to begin planning to produce and deliver energy for vehicle use. Current Situation The electric delivery infrastructure is already in-place to supply energy to a great number of electric vehicles. EV owners can plug their cars into 120 volt outlets to recharge their batteries overnight or charging equipment can be installed at residences at reasonable prices to provide quicker charging of vehicles. Charging equipment for public use can be installed at employer parking lots, pay-to-park facilities, at existing gas stations, or other places that are deemed convenient or profitable. Existing laws may need to be amended, however, to allow for third parties to sell electricity to the public from charging equipment owned by the third party.

19
Generation Electric generation, transmission and distribution systems of the utilities that serve customers in Idaho are fully integrated. Electricity is generated in direct proportion to how much is needed at any point in time. If usage increases, generation is increased to match the demand. If usage decreases, generation is throttled back simultaneously. The supply of electricity for all purposes in Idaho is adequate and comes from a variety of sources, including baseload resources such as coal and natural gas-fired generation along with a large amount of hydroelectric and other renewable generation. Alternative electric generation sources such as wind and solar are difficult to predict but are integrated into the operation of the electric grid as they produce energy. Wind generation mostly occurs at night and can provide an opportunity for charging of vehicles during the nighttime hours. That is, electric vehicles can act as a “sink” for the excess wind energy at night. Electric generation, however, whatever the source, is always integrated with other generation sources and must be balanced to electric loads. If energy is being produced in excess to what was anticipated, the excess energy is sold into the surplus electricity market at prices that vary widely, including selling it for less than what was paid to the producers. Location of electric generation facilities, such as in-state versus out-of-state, is immaterial to the supply of electricity owned or controlled by Idaho’s investor-owned and cooperative electric utilities. In 2012, however, 65% of Idaho’s net electricity generation came from in-state resources12 fueled by hydro, natural gas, and wind with the remainder coming from generation located in the northwest and intermountain west. In the case of investor-owned utilities, a mix of generation resources located in a variety of states are owned, controlled, and operated as a single system. Prices of the generated energy are not greatly affected by the location of the generator. A more significant factor is usually the age of the facility combined with the operational economics of the specific project that determine the price ranges of power provided. Availability of generation can be affected by a variety of factors that are associated with the type of fuel used for generation. The investor-owned utilities, however, own or control sufficient resources to meet Idaho’s domestic needs. In addition, the utilities have contracts with other suppliers located in the western US and Canada to transfer power in and out of the region as necessary. Idaho’s publicly owned utilities generally receive their electricity through the Bonneville Power Administration, the federal agency that markets power from the network of dams on the Columbia and Snake rivers, and from other electricity producing projects. Idaho’s publicly owned utilities receive this power through long-term contracts with BPA to ensure a secure supply of electricity to Idaho’s more rural areas. These contracts have been in place for decades and are sufficient to meet the current needs of the cooperatives. Generation to serve new loads, however, is the responsibility of the cooperatives and they have a variety of options they can pursue to meet new loads. Generation of electricity from alternative energy sources inside Idaho expanded significantly from 2008 until 2012. The generation came primarily from wind power projects that received significant government subsidies and favorable pricing that investor-owned utilities were required to purchase under federal law. The pricing of those projects changed significantly because of altered governmental policies and as a result there are few new wind projects in the
12 U.S. Department of Energy, Energy Information Administration, www.eia.gov/state/?sid=ID
20
works. More recently, however, there has been a dramatic increase in interconnection requests for proposed large photovoltaic (solar) power plants in southern Idaho. Transmission Multiple high voltage transmission lines operating at 230,000, 345,000, and 500,000 volts integrate Idaho with the rest of the western interconnected transmission system. This transmission serves to deliver energy from generators located throughout the region to load centers where it is transformed to lower voltages for delivery to homes and businesses. Power is bought and sold between utilities and the transmission provides for an efficient energy system which maximizes the value of the generation, allowing a generator located in an area where electrical load may not be as high during certain seasons to be transmitted to areas that need the power during that season, thus fewer generators are needed for a region. Reliability of the interconnect transmission network is regulated by the North American Electric Reliability Corporation (NERC). In accordance with NERC standards, electrical utilities must ensure they build redundancy into their system so that even if the single most important transmission line was taken out of service unexpectedly, it would have no effect on the system’s ability to serve load. More information regarding the transmission system is available in the Idaho Strategic Energy Alliance’s recent Transmission Task Force Report. Electrical Distribution Every source of electric demand, such as businesses, industrial plants and homes, including the individual outlets, switches and appliances in them, are connected to all of the generating sources and transmission facilities in the western US, Canada, and northern Mexico by wires. The poles and wires that run down residential streets are the most visible evidence of this distribution network with which we are all familiar. This utility-owned distribution network will be utilized to provide energy to charging devices for EVs at residences, businesses, and other public locations. Trends Planning for adequate electric capacity and energy is done by Idaho’s investor-owned electric companies through the Integrated Resource Planning (IRP) Process. The IRPs are 20-year electric resource planning documents that are updated every two years and are presented to the Idaho Public Utilities Commission. Demand for electricity as a vehicle fuel has been very limited in Idaho to date and no new generation would need to be added in Idaho to meet the foreseeable level of new electric vehicle charging demand. As electric vehicle charging demand increases, however, it would be included in the IRP planning process to ensure adequate supplies of electricity would be made available for this purpose. For example, Idaho Power’s most recent IRP forecasts an impact on the Idaho Power system from vehicle charging to be 1 average megawatt in 2020, compared to a company owned generation capacity of almost 3,600 megawatts. This demand is expected to rise to 4 average megawatts in 2032. Note, however, that this is highly dependent on how fast EVs are

21
adopted in Idaho and this forecast will be updated every two years as part of the normal IRP cycle. As stated earlier in this document, efficient high voltage transmission can reduce the need for additional generation. For reasons discussed in the generation section, the near to mid-term forecast electric vehicle load will not increase the need to build more transmission beyond that required by normal, forecasted load growth. And like generation, transmission needs are addressed in the IRP process. The biggest affects EVs will have on the electric system are likely to occur on the lower voltage distribution system and they will mostly be felt at the residential level. Recent studies have shown that charging an EV at home can increase the overall energy use by up to 20% in a typical home. Depending on the EV charging station capability and the level of charging the EV demands, a typical EV adds from 1.6 kilowatts up to 6.6 kilowatts of additional household load. By comparison, a typical central air conditioner is around 3.5 kilowatts. Thus, at times an EV could essentially double the load drawn by a household. While most service transformers feeding homes can accommodate this additional load, it is expected that EVs will tend to cluster in neighborhoods much like the experience with (non plug-in) hybrid electric vehicles in the past decade. When more than one EV is fed from a single service transformer, it becomes more likely that transformer will become overloaded and need replacing. The electric utility industry experienced a similar situation in the 1970s as central air conditioners became common. If an EV owner chooses to charge their vehicle immediately upon coming home from work in the early evening, the EV load may coincide with other household loads such as air conditioning, clothes drying and dish washing. This could tend to exacerbate a home’s peak loading. Figure 5 below shows the effect a Chevrolet Volt has on a typical Idaho house on a peak summer day where the owner chose to begin charging immediately upon returning from work. Note this graph is from a home in Boise. As bad as this seems, electric vehicle charging load is a fairly simple load to shift to off-peak, late night and early morning hours when there is lower load on the service transformer.

22
Figure 5. Electric Vehicle Effects on Household Energy Demand
Idaho has yet to see any impacts from commercially available vehicle charging. These applications would include charging stations made available to the general public at airports, traditional gas stations, highway rest stops, downtown parking lots, or similar places. Charging installations might be made available by various large employers for their employees. Given the relatively short driving range for EVs, a system of charging stations would be required to provide an equivalent experience to that of a gasoline powered vehicle. Under current Idaho law, however, only entities regulated by the Idaho Public Utilities Commission can sell electricity directly to the public. A significant market test of a system of publically available charging stations has been completed in Washington and Oregon, called the West Coast Electric Highway (http://westcoastgreenhighway.com/). The initial project was intended to include California where work is still underway. In short, the project includes a coordinated system of 57 charging stations at 25 to 60-mile intervals primarily along the I-5 Corridor from Canada to southern Oregon, some stations outside of Portland along I-84, and some smaller state highways in Oregon. Fifty-five of the 57 stations use fast charging facilities that can charge a car’s battery to 80% capacity in 30 minutes or less, while the remaining two stations use a “Level 2” charger that requires 2 -10 hours to recharge a battery. Installation of the charging equipment averaged from $10,000-$25,000 per station, and customers were able to purchase monthly subscriptions priced at $19.99. All of the charging stations were owned and operated by one entity, AeroVironment, Inc., which received electric bills from all of the charging stations totaling more than $10,000 per month. Approximately two-thirds of the combined electric bills came from “demand” charges. The fast charging equipment uses significant electric capacity. Normal household current is delivered at 120 volts. A small electric space heater typically draws approximately 1.5kW. Fast chargers convert power delivered at 480 volts to a direct current charge that delivers up to 50kW at 120 Amps. In order to provide this amount of power, utility tariffs generally require the collection of a “demand” charge that helps to offset the investment in the equipment required to

23
provide this amount of output at one location, increasing the cost above the usual per kilowatt-hour charge for the electricity alone. Utilization of the facilities along the West Coast Electric Highway in this market test indicate that working out a sustainable business model has been a challenge in the early years of the program (2011 – 2014). Impacts and Opportunities Electric vehicles are fueled with a regional product that offers environmental benefits over gasoline while using a diversity of fuel sources. EV’s charging with Idaho’s prominently natural gas, hydro-electric, and renewable resources provide a significant reduction in well to wheel CO2 production compared to gasoline fueled vehicles and similar comparisons can be made concerning other tailpipe emissions. Charging an EV with the low electricity prices in Idaho, the costs are equivalent to about $1/gallon gasoline. The electric infrastructure in Idaho is well positioned to support ownership of EVs which to date has proven to be extremely limited. The supply of electricity is more than adequate to charge electric vehicles and even significant growth in the EV market would not create a specific need for additional generation or transmission facilities beyond what is being planned in the Integrated Resource Plans of Idaho’s investor-owned utilities. The situation is similar for the cooperative electric utilities in Idaho. If EV ownership were to rapidly increase in Idaho it might cause a utility to review the impact of the timing of the vehicle charging to its peak demand times. A utility might need to propose a time-of-use electric tariff to encourage this charging to take place during the nighttime hours when wholesale electric costs are lower and electricity is more available from its own generating facilities. At current EV ownership levels, however, these considerations seem to be in the distant future. Publicly available EV charging in Idaho is also very constrained, generally due to the low market demand for such service. Idaho state law does create an impediment, but not a total ban, on third-party delivery of electricity through commercially available EV charging stations. Idaho code requires that “electric companies” that sell electricity directly to the public are subject to the jurisdiction of the Idaho Public Utilities Commission (IPUC) for the setting of electric prices. Any entity that might own an EV charging station, other than a regulated utility company, would be considered an electric company and come under the jurisdiction of the IPUC. This would require the IPUC to establish the market price for electricity at EV charging stations. The law also prohibits the “sale for resale” of electricity to ensure that an entity cannot evade IPUC jurisdiction. To remove these impediments and make EV charging stations readily available from companies other than regulated utility companies, Idaho could consider amending its laws to provide an exemption for electricity sales to the public through non-regulated EV charging stations. This approach has been used in a number of other states. If Idaho made public policy decisions that it wanted to encourage the ownership of EVs or the expansion of commercially available charging stations, it could provide a variety of incentives to accomplish these goals. The experience of other states and the West Coast Electric Highway experiment can provide sufficient data to infer potential effects in Idaho. Other Fuels

24
Propane Autogas (Liquefied Petroleum Gas – LPG) Sources: Propane Education Research Council, EPA Alternative Fuels Data Center, Autogas for America An affordable, clean, safe, American-made fuel, propane is a gas normally compressed and stored as a liquid. It is most commonly used for heating homes and other buildings, for cooking, and as a fuel for various engines such as mowers, forklifts, and light- to medium-duty vehicles. However, its applications are rapidly growing due to new technology developments. Propane is nontoxic, colorless, and virtually odorless; an identifying odor is added so it can be detected. Propane is also sometimes known as liquefied petroleum gas, or LPG. When used as vehicle fuel propane is known as propane autogas. Why Propane? Though historically associated with other crude oil products, such as a gasoline or diesel fuel, propane differs from these fuels in several critical ways:
Propane prices have fallen relative to gasoline, diesel fuel, and home heating oil due to the growing supply.
Propane is a cleaner-burning, lower-carbon fuel than other petroleum-based products such as gasoline or diesel because it burns hotter and more efficiently.
Propane is abundant and domestic (in 2011, domestic propane production from natural gas plant liquids exceeded consumer demand for the first time). Propane is an abundant bridge fuel, making it a clean-burning alternative to gasoline and diesel that can address energy challenges while long-term renewable technologies are developed.
While both autogas and compressed natural gas (CNG) are domestic, abundant, and less expensive than gasoline, autogas systems are significantly less expensive to implement. A CNG fueling station costs between $400,000 and $1,700,000 while a comparable autogas station costs between $45,000 and $175,000.
Who Uses Propane? In the U.S., propane is used in 48 million households as well as many businesses for water and space heating, indoor and outdoor cooking, clothes drying, and backup power. Additionally, many industries increasingly choose propane to cost-effectively fuel vehicles and equipment while lowering emissions.
On-Road Vehicles. Propane autogas is an approved clean alternative fuel under the Clean Air Act of 1990 and the third most popular vehicle fuel worldwide behind gasoline and diesel. Propane is commonly used to fuel buses, light- and medium-duty trucks, vans, shuttles, taxicabs, and police and government vehicles.
Professional Landscape Equipment. More than 15 models of propane-powered commercial lawn mowers are available today from industry-leading brands.
Agricultural Equipment. More than 1.2 billion gallons of propane were sold for agricultural use in 2009 in the United States. This includes propane that is used to run pumps and engines, heat buildings, and dry and process crops.
How is Propane Distributed? Propane is widely available and easily portable. Unlike natural gas fueling stations, propane infrastructure does not require access to a natural gas pipeline, allowing for fueling station installation even in remote locations. For on-road use, there are more fueling stations in the U.S.

25
for propane autogas vehicles than there are for vehicles of any other alternative fuel except electricity. Propane is the only alternative fuel with public fueling stations in every state.
Propane as a Vehicle Fuel Propane, also known as Liquefied Petroleum Gas (LPG), or Propane Autogas when used for on-road vehicles, is considered an alternative fuel under the Energy Policy Act of 1992. Propane autogas offers a higher octane rating than gasoline, however it does have a slightly lower fuel economy, due to the lower British thermal unit (Btu) content of propane as compared to gasoline — it takes more fuel to create the same amount of energy. This higher fuel usage is offset by significant cost savings with propane versus gasoline or diesel. Since 2010, propane retail prices in North America have averaged 41% below those of gasoline and diesel. Propane prices are expected to continue to remain very competitive with gasoline, diesel fuel, and distillate fuel oil as propane supply continues to increase. Annually, about 550 million gallons of propane are used as a transportation fuel in the U.S. Fueling Infrastructure Ease of refueling a propane autogas vehicle has helped grow the use of this alternative fuel. With thousands of refueling stations across the U.S., a robust national infrastructure is in place to support its implementation as a primary fuel. In addition, some fleets choose to work with their local propane marketer to establish a propane autogas refueling infrastructure on-site at little or no cost. There are 25 public propane autogas fueling stations in Idaho and over 2,650 nationwide13. Propane Supply and Outlook Propane is primarily a byproduct of domestic natural gas processing, though some propane is produced from crude oil refinement. In recent years, a sea-change has taken place in North American propane supply. As recently as 2010, the propane market relied on imports to meet domestic demand. Today, domestic production exceeds demand, with exports rising as quickly as capacity will allow. U.S. propane supplies are becoming increasingly abundant due in large part to increased supplies of natural gas. Between 2005 and 2011, U.S. production of propane from natural gas processing plants and refineries grew from 12.4 billion gallons to 13.8 billion gallons. The primary driver of this expanding supply has been the growth in propane production from domestic natural gas liquids, which increased from 7.7 billion gallons in 2005 (the lowest level since 1991) to 9.7 billion gallons in 2011. In 2012, the U.S. produced about 15 billion gallons of propane, including almost 11 billion gallons of propane from natural gas liquids. This dramatic increase in production from gas processing plants has had a powerful impact on America’s propane balance of trade. In 2005 the U.S. imported more than 20 percent of its total propane supply, including nearly 1.2 billion gallons of propane from outside North America, and an additional 2 billion gallons from Canada. By 2011, imports from outside North America declined to just over 300 million gallons, while imports from Canada declined to 1.5 billion gallons. However, the U.S. also exported 1.9 billion gallons, and became a net exporter of propane. The changing supply picture has flipped propane’s perceived place in the fuels basket. Long seen
13 Alternate Fuels Data Center, www.afdc.energy.gov

26
as a crude oil derivative, with the same supply security issues as other petroleum products, more than 70 percent of total U.S. propane supply now comes from domestic natural gas liquids production. In 2012, propane produced in the U.S. from domestic natural gas liquids and crude oil resources exceeded total consumer propane demand.
Hydrogen as a Transportation Fuel Several stored forms of hydrogen could be considered for transportation fuel: gas, liquid, slush, and metal hydrides. The most common way to store hydrogen onboard a vehicle is as a compressed gas, though it requires significant volume compared to liquid fuels. Two common methods of producing hydrogen are reforming of hydrocarbons such as methane and methanol, and electrolysis of water. Reforming of hydrocarbons, although today the most common and economical way of hydrogen production, results in carbon dioxide (a greenhouse gas) as a byproduct. Electrolysis of water produces only hydrogen and oxygen, in addition to any upstream emissions due to power production, and may be of interest to an electric utility company as a means of improving its load factor and strategically increasing energy sales. In contrast to centralized manufacturing of hydrogen and use of tube trailers for delivery (as in gasoline distribution), the electrolysis process can be used with the existing electric distribution system to produce relatively small quantities of hydrogen during off-peak periods at the point of use. Hydrogen Fuel Cell Infrastructure and Delivery Systems As of April 2014, there were a total of 12 hydrogen fueling stations reported in the United States,14 with 10 reported in California and one each in Connecticut and South Carolina. However, there may be two additional stations that have not been added to the DOE database, with one in Washington D.C. and the other in New York State. There are no hydrogen fueling stations in Idaho. Announcements have been made by organizations that they are in various stages of siting additional hydrogen stations, mostly in California. Fuel cell vehicles (FCVs) require very high purity (greater than 99%) hydrogen in order to avoid damage to the fuel cell in the vehicle. While hydrogen and FCVs have many attractions as a transportation fuel, construction of stations and the economics of for-profit operations and capital payback make it unlikely commercial companies will be constructing large numbers of hydrogen stations in Idaho in the near term. While there is much hydrogen production in the United States, especially in the Gulf Coast area, this is often of a lesser purity level than that required for FCVs. In addition, piping infrastructure for shipping hydrogen is mostly limited to the Gulf Coast area of the United States. Various organizations, including the Idaho National Laboratory (INL), have tested and operated internal combustion engine (ICE) vehicles that operate on hydrogen and blends of hydrogen and compressed national gas.15 The use of ICEs allowed lower purity hydrogen to be used, which resulted in lower fuel costs and lower vehicle capital costs. However, compared to PEVs, HEVs and ICEs, the hydrogen ICEs and FCVs, were generally much more expensive to purchase. While there were originally cold weather impacts on FCV operations, more recent announcements16 suggest that this problem has been overcome.
14 www.afdc.energy.gov/fuels/stations_counts.html 15 http://avt.inl.gov/hydrogen.shtml 16 www.greencarreports.com/news/1090078_toyota-touts-cold-weather-performance-of-hydrogen-fuel-cells

27
Comparing Fuel Cell Vehicle and Plug-in Electric Vehicle Fueling Infrastructure While fueling infrastructure for Plug-in Electric Vehicles (PEVs) is much less expensive than FCVs, FCVs have some advantages over PEVs. The most significant are vehicle driving range per fueling event and “fill” or “charge” times. Generally, most of today’s PEVs have ranges of less than 100 miles. The exception is the Tesla PEV which when equipped with its largest battery pack option, is reported to have a range of more than 200 miles per charge. However, some fuel cell vehicles report ranges per fueling event of up to 300 miles. It is in the area of fueling infrastructure complexity, cost and footprint that PEVs have an advantage. Level 2 Electric Vehicle Supply Equipment (EVSE) intended for residential charging can be purchased for less than $1,00017 each and they can be installed for an average of $1,30018 each. Publicly sited commercial Level 2 EVSE, depending on features, have hardware costs that generally range from about $1,000 to as high as $7,000 each, but there are many options under $3,000 dollars for the EVSE hardware. Installation costs for commercial EVSE averaged $4,00019 for the several thousand commercial Level 2 EVSE installed for the INL’s EV Project. DC fast charger costs are harder to quantify, but they appear to generally range from approximately $20,000 to $40,000 for the hardware costs, and past installation costs have averaged about $21,000.20 It should be noted that there can be significant cost variations for EVSE and DC fast charger installations, as installation requirements are extremely site dependent and they can prove to be extremely expensive if existing infrastructure has to be moved or additional electric service has to be brought to a site. As to additional infrastructure deployment, private consumers and fleet owners will likely continue to install “at home” or “fleet home” charging infrastructure at their own expanse. A potential role for the state of Idaho in the area of home base charging infrastructure would be to consider policy changes for supporting the installation of more home and business charging infrastructure. In the area of public charging, private companies will likely be the parties installing charging infrastructure, including workplace charging. Analysis by the INL21 22 has shown that PEV drivers that have the option to charge at home and at work will only charge their PEV elsewhere 1 to 2% of the time on days they go to work. Therefore, consideration should be given to supporting the installation of workplace charging infrastructure through policy, if a decision is made to activity support faster PEV deployment. Hydrogen stations have been constructed in much smaller numbers than electric charging infrastructure, so there is not as large a sample to use for estimating hydrogen station costs. However, one study23 found that the capital costs to site and construct a hydrogen fueling station ranged from $2.65 million to $5.05 million per station. Hydrogen station hardware costs alone were reported in the media for a hydrogen station as being between $500,000 and $5 million each.24
17 .google.com/#q=electric+vehicle+chargers&tbm=shop and www.homedepot.com/s/car%2520charger?NCNI-5 18 http://avt.inl.gov/pdf/prog_info/vss137Francfort2014.pdf 19 http://avt.inl.gov/pdf/prog_info/vss137Francfort2014.pdf 20 http://avt.inl.gov/pdf/prog_info/vss137Francfort2014.pdf 21 http://avt.inl.gov/pdf/EVProj/ChargingLocation-WorkplaceVoltsMar2014.pdf 22 http://avt.inl.gov/pdf/EVProj/ChargingLocation-WorkplaceLeafsMar2014.pdf 23 www.nrel.gov/docs/fy13osti/56412.pdf 24 www.caranddriver.com/features/pump-it-up-we-refuel-a-hydrogen-fuel-cell-vehicle-hydrogen-filling-stations-are-still-rare-page-3

28
Transportation Fuel Costs Table 1 shows the U.S. average price in gasoline gallon equivalents ($/GGE) for various transportation fuels on July 1, 2014 as provided by the Alternative Fuels Data Center (www.afdc.energy.gov). Note that these prices provide a comparison for one point in time and that prices can vary considerably over time. Consider for example the recent decrease in gasoline price with the decline in the world crude oil price. The Alternative Fuels Data Center does provide price data over time for those interested in looking at historical price variation.
Table 1. U.S. Average Price in Gasoline Gallon Equivalents, July 1, 2014 (Alternative Fuels Data Center)
Fuel Price ($/GGE) Gasoline $3.70 Diesel $3.51 Ethanol $4.56 Biodiesel (B20) $3.63 Biodiesel (B99-B100) $4.18 Natural Gas (CNG) $2.17 Propane $4.241 Electricity $1.192
(Note in the table above (1) the propane price listed reflects the weighted average of “primary” and “secondary” stations; primary stations have dedicated vehicle services and tend to be less expensive and (2) the electricity price listed uses average residential electricity prices and converts them to a gasoline gallon equivalent (GGE) price by using a rate of 33.7 kWh per GGE and then reducing the price by a factor of 3.4 because electric motors are 3.4 times as efficient on a BTU basis as an internal combustion engine.)
VEHICLES Petroleum Fueled Vehicles
At every level of on-road transportation vehicle usage from light-duty personal applications to heavy-duty commercial/industrial/military tasks, the prevailing power technology is the internal-combustion (IC) engine. Internal combustion engines (ICEs) consist of two main types: spark-ignited units which use gasoline, gasoline/ethanol blends, natural gas, and propane as their main fuel; and compression-ignited engines which use diesel fuel, bio-diesel fuel, and diesel/natural gas blends as their main fuel. Spark-ignited engines dominate the range from light- to medium-duty, while most heavy-duty vehicles are compression-ignited diesel variants. One common characteristic in most IC vehicles is that the engine is directly coupled to the driving wheels via some transmission system to provide propulsion. Gasoline has not been the major fuel for heavy-duty vehicle use due to the low torque a gasoline motor produces compared to the diesel motor; it is not able to provide the foot pounds of torque required to pull heavy loads. The life of a gasoline motor compared to a diesel is also shorter and typically has more maintenance cost associated with it. These issues have made gasoline an uneconomical source of fuel in the heavy duty haul application.

29
The trends with diesel and all hydrocarbon fuels are for further regulations to decrease the greenhouse gases they emit. These regulations are leading to changes in engine manufacturing as well as changes in the refinery process. The regulation changes continue to put increased upward pricing pressure on diesel and the engines that burn the diesel. These regulatory changes could decrease demand between regional markets and increase the cost of items that require transportation for end consumption. In the case of internal combustion (IC) hybrid vehicles, the IC engine is used to provide mechanical power to the vehicle’s drive wheels, in addition to generating electricity for the typical hybrid vehicle’s supplemental electric propulsion system. A hybrid’s IC engine also provides charging of the hybrid’s onboard battery which can propel the vehicle for short distances at slow speeds on electric power alone, not using the IC engine. Plug-in hybrids are similar, but they have a larger battery that can be fully charged by grid current, as well as the IC engine. This larger battery can propel a plug-in hybrid at highway speeds for distances of generally 20 to 40 miles, without using the IC engine. Both of the preceding IC-engine hybrid vehicle types are dependent on their onboard fuel supply at least for distances beyond hybrid or plug-in hybrid battery ranges. Natural Gas Fueled Vehicles How do Natural Gas Vehicles (NGV’s) Work? The internal combustion engines on these vehicles can either be “dedicated” meaning they burn only natural gas, or “bi-fuel” which means the engine can run on natural gas or gasoline. With both engine types, natural gas is either carried as CNG or LNG, stored in tanks mounted on or in the vehicle. As gas is needed, it passes from the storage tanks through a specific system into the fuel injectors. The fuel injectors meter the fuel into the engine’s intake manifold near the intake valve. Studies show vehicles using natural gas have the same power and performance as their gasoline or diesel counterparts, although this was not historically the case. Why Natural Gas Vehicles?
Although CNG vehicles are more expensive than gasoline or diesel powered vehicles ($3 – 10K more for a CNG vehicle and up to $50k more for a comparable LNG heavy duty truck), the total cost of ownership (TCO) is generally less because they are more affordable to operate. The price spread between diesel/gasoline and natural gas fuels is generally the most important factor in fleet adoption. Maintenance costs for natural gas vehicles are generally lower than other vehicle types due to the longer intervals between scheduled services.
CNG vehicles are safer for technicians to service because natural gas fuels dissipate when released, as opposed to gasoline or diesel which pool on the ground and present fire and inhalation risks.
Use of natural gas as a transportation fuel reduces our dependency on foreign oil. There are significant environmental benefits to using natural gas – reduced greenhouse
gas emissions and pollutants. Natural gas burning engines have lower carbon emissions than their diesel or gasoline powered counterparts; however, during fueling any natural gas released, which is principally methane (CH4), is roughly twenty times more efficient at trapping heat in the atmosphere than carbon dioxide (CO2). Natural gas vehicles also emit lower levels of harmful particulates and other emissions including sulfur dioxide, nitrogen oxide, and volatile organic compounds (i.e. benzene, xylene, etc.).

30
In the event of an accident, natural gas will quickly dissipate, where diesel or gasoline will spill on the ground, and require hazardous material cleanup.
Compressed Natural Gas (CNG) Vehicles Trends in Compressed Natural Gas (CNG) Vehicles In southwestern Idaho (Ada and Canyon Counties) there are light-, medium- and heavy- duty fleets utilizing CNG, including: delivery trucks, taxis, contractor’s vehicles, transit buses, and refuse/recycling trucks. Additionally, there are numerous privately owned CNG sedans (primarily from Honda, Ford, and Chevrolet). From the light-duty, non-commercial private vehicle perspective, CNG vehicles will continue on a slow path to widespread usage as more automakers manufacture affordable CNG vehicles and public fueling sites become more available. Certain urban areas with public fueling will see some light-duty private CNG growth in mainly local-commuting applications. Home refueling would facilitate light-duty CNG deployment but to date are not widely available and are relatively expensive. Industry R&D is underway to develop and commercialize more affordable home fueling appliances. In the medium-duty/commercial arena, particularly when the fleet vehicle returns to an operator-owned fueling station base, there is great potential for CNG vehicle growth. Urban mass-transit buses, school buses, airport shuttles, taxis, local-delivery fleets, garbage trucks, forklifts, road and landscape maintenance, and municipal/utility vehicles all can make great use of natural gas fueling. Their relatively long life and ownership period or miles-driven contributes significantly to the economic justification of the extra cost of the vehicles, as well as the fueling station. Fleets have relatively easy economic justification for having their own private fueling stations at their operating base. Vehicle operators can collaborate to share fueling facilities, further contributing to the economic justification of CNG usage. Additionally, these private stations can very easily offer public fueling, since the capital cost is already justified by the private fleet usage. Natural gas utilities in Idaho are reluctant to construct public natural gas fueling stations at this time unless there is a significant fleet fueling opportunity and commitment. There is some uncertainty as to whether Idaho’s utility regulators will allow all utility customers to provide a subsidy for motor vehicle fueling.
What are the Barriers to CNG Vehicles?
There are a limited number of public CNG fueling stations in Idaho. Currently, there are two public stations – one in Ada County and one in Canyon County. Both are close to I-84. There are currently 7 public LNG stations located along the I-84 corridor.
More technicians need to be trained to service CNG vehicles. More maintenance facilities need to be modified to service CNG vehicles (additional
ventilation and methane alarms). The federal excise tax on LNG needs to be revised to reflect energy content instead of
volume sold. Experts agree that the current taxing structure for natural gas as a transportation fuel is too high (based on the energy content) compared to gasoline and diesel.

31
Summary Using CNG as a transportation fuel is environmentally prudent and financially savvy – particularly with fleets. The incremental capital investment made in a CNG fleet can be recouped fairly quickly, resulting in an overall cost savings over the life of the vehicle compared to the gasoline/ diesel counterparts. Furthermore, businesses with CNG fleets have a competitive advantage because:
They can bid projects lower without reducing profits if fuel is a large operating cost component (i.e. taxis, couriers, transit busses, etc.).
Federal, State and local government agencies support the use of low emission vehicles. Private businesses and public agencies in the United States all stand to benefit from
decisions that increase our energy independence and reduce our dependency on foreign oil. Using a domestically produced, affordable, plentiful fuel like natural gas is a meaningful step towards achieving this goal.
Privately owned, light-duty CNG vehicle use will continue to grow in the Treasure Valley and around other parts of the state as gasoline and diesel prices continue to rise and CNG fuel becomes more widely available along our main corridors. Liquefied Natural Gas (LNG) Vehicles Liquefied Natural Gas (LNG) is a clean, efficient domestic fuel that is used in the transportation of heavy-duty vehicles. Domestic natural gas is taken from the pipeline and cooled until it becomes a liquid. LNG is stored in cryogenic tanks and provides a high energy density, stable transportation fuel. Although higher, the price of LNG is significantly more stable than the price of compressed natural gas because only a fraction of the cost of producing LNG comes from the cost of the natural gas used to make it. Trends in LNG Vehicles In the heavy-duty over-the-road long-distance transportation market, NGV’s are making significant inroads, especially using liquefied natural gas (LNG) instead of compressed natural gas (CNG). The more energy dense LNG fuel supply carried by a large tractor-trailer rig displaces far less payload than the equivalent fuel capacity of a bundle of CNG cylinders. And although the cryogenic LNG tanks are much more expensive per unit than CNG cylinders, only one or two per tractor are needed, as opposed to a dozen or more the heavier and bulkier CNG cylinders. Cost is the biggest incentive to use LNG as a vehicle fuel. Although LNG trucks cost considerably more than a conventional diesel truck ($20K to $50K more) the significant cost savings in fuel provide a lower total cost of ownership (over time fuel costs are second in expenses to driver costs). The cryogenic tank package on an LNG truck is very robust, and construction of the tanks is approved by the DOT. The rigorous testing required makes them extremely unlikely to leak in the event of an accident. If there is a release of LNG to the ground, river, or lake, the product would quickly dissipate and require no cleanup. Some trucking customers are now requiring that contractors hauling their products reduce their emissions and carbon footprint. Also, many retailers are also now requiring it as part of their sustainability plan. LNG is a viable means to do this. The port of Long Beach in California requires that any vehicle on the port use an alternative fuel.

32
What Are the Barriers to LNG Vehicles?
The cost to purchase a new LNG truck is $25-50K more expensive than a comparably equipped diesel truck. Excise and sales tax are also paid on this equipment.
Servicing the trucks requires facilities to be retrofitted to allow for natural gas vehicles to be serviced inside. These costs are challenging for new customers to invest in the trucks, as the incremental cost to upgrade their shops may be another $100-500K or more depending on the layout.
The LNG fueling network is incomplete. There are areas where there are good networks
(the Idaho interstate corridor is one), but a truck can only be based and used in a region that has the fuel network infrastructure to support it.
Summary Idaho has seen a tremendous growth in the LNG vehicle market since 2012. Multiple fleets have converted all of their vehicles to LNG and there are seven open and operating public LNG stations in Idaho. Most of these fleets are either directly farming, or farming related. This growth is equal to that of any other state in the United States in terms of new public station openings. This change has the net effect of taking the equivalent to 10,000 cars off the road from an emissions perspective. Electric Drive Vehicles Hybrid electric vehicles are commonplace throughout Idaho and increasing numbers of plug-in electric vehicles (PEVs) are also being seen on Idaho roadways, and this includes around a dozen Tesla battery electric vehicles (BEVs), with most believed to be in the Boise area. Because of the distances between Idaho’s major cities, BEVs will mostly be used for commuting unless a DC fast charger network is developed in Idaho. Plug in hybrid electric vehicles (PHEVs) and extended range electric vehicles (EREVs) are likely to be the more common PEV technologies purchased in Idaho for intercity travel, due to the advantage of extending the vehicle range with the use of the ICE onboard the vehicles. Plug-in Electric Vehicle Technologies
“Electric Vehicles” is a term often used by the general public to describe any type of vehicle that is “plugged in”, or “connected” to the electric grid for the purpose of recharging the vehicle’s traction battery pack. The term most commonly used to describe "plugged in”, or “connected” vehicles by automotive, regulatory, and governmental groups is “plug-in electric vehicles”, or PEVs, and this is the term used in this section. PEVs normally fit within one of the three following technology designs:
Figure 6. Battery Electric Vehicle
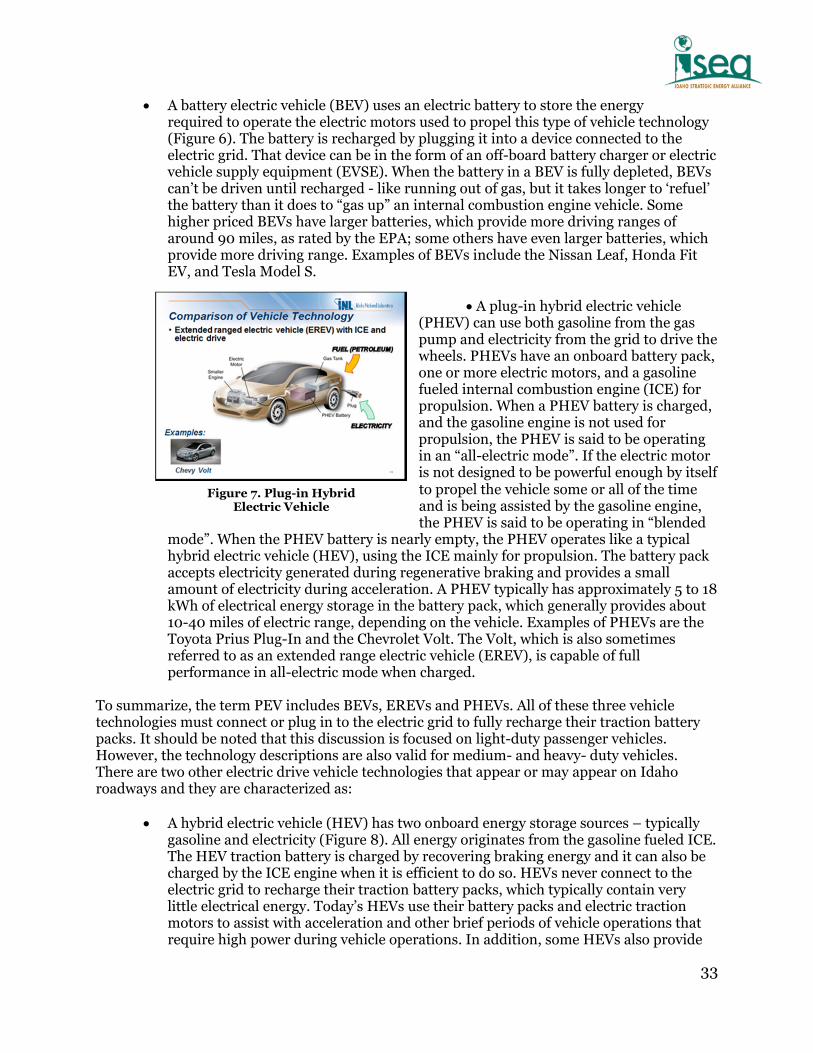
33
Figure 7. Plug-in Hybrid Electric Vehicle
A battery electric vehicle (BEV) uses an electric battery to store the energy required to operate the electric motors used to propel this type of vehicle technology (Figure 6). The battery is recharged by plugging it into a device connected to the electric grid. That device can be in the form of an off-board battery charger or electric vehicle supply equipment (EVSE). When the battery in a BEV is fully depleted, BEVs can’t be driven until recharged - like running out of gas, but it takes longer to ‘refuel’ the battery than it does to “gas up” an internal combustion engine vehicle. Some higher priced BEVs have larger batteries, which provide more driving ranges of around 90 miles, as rated by the EPA; some others have even larger batteries, which provide more driving range. Examples of BEVs include the Nissan Leaf, Honda Fit EV, and Tesla Model S.
A plug-in hybrid electric vehicle
(PHEV) can use both gasoline from the gas pump and electricity from the grid to drive the wheels. PHEVs have an onboard battery pack, one or more electric motors, and a gasoline fueled internal combustion engine (ICE) for propulsion. When a PHEV battery is charged, and the gasoline engine is not used for propulsion, the PHEV is said to be operating in an “all-electric mode”. If the electric motor is not designed to be powerful enough by itself to propel the vehicle some or all of the time and is being assisted by the gasoline engine, the PHEV is said to be operating in “blended
mode”. When the PHEV battery is nearly empty, the PHEV operates like a typical hybrid electric vehicle (HEV), using the ICE mainly for propulsion. The battery pack accepts electricity generated during regenerative braking and provides a small amount of electricity during acceleration. A PHEV typically has approximately 5 to 18 kWh of electrical energy storage in the battery pack, which generally provides about 10-40 miles of electric range, depending on the vehicle. Examples of PHEVs are the Toyota Prius Plug-In and the Chevrolet Volt. The Volt, which is also sometimes referred to as an extended range electric vehicle (EREV), is capable of full performance in all-electric mode when charged.
To summarize, the term PEV includes BEVs, EREVs and PHEVs. All of these three vehicle technologies must connect or plug in to the electric grid to fully recharge their traction battery packs. It should be noted that this discussion is focused on light-duty passenger vehicles. However, the technology descriptions are also valid for medium- and heavy- duty vehicles. There are two other electric drive vehicle technologies that appear or may appear on Idaho roadways and they are characterized as:
A hybrid electric vehicle (HEV) has two onboard energy storage sources – typically gasoline and electricity (Figure 8). All energy originates from the gasoline fueled ICE. The HEV traction battery is charged by recovering braking energy and it can also be charged by the ICE engine when it is efficient to do so. HEVs never connect to the electric grid to recharge their traction battery packs, which typically contain very little electrical energy. Today’s HEVs use their battery packs and electric traction motors to assist with acceleration and other brief periods of vehicle operations that require high power during vehicle operations. In addition, some HEVs also provide

34
all-electric propulsion, but normally for very short distances compared to PEVs. All of today’s major OEMs produce HEVs and they are very common to Idaho’s roadways. Examples include the Honda Insight, Toyota Prius, and Ford Fusion Hybrid.
Figure 8. Hybrid Electric Vehicle
A fuel cell vehicle (FCV) has similarities to PEV propulsion systems in that a FCV uses either one or more electric motors to propel, or drive, the vehicle, and there is
normally an energy storage device such as a battery pack on board the vehicle as well. The largest difference between FCVs and PEVs is the type of the external fuel they use and how they generate the electricity required to propel the FCV. A FCV has a fuel cell (Figure 9) onboard the vehicle in order to generate electricity. Fuel cells generally use oxygen from the air and hydrogen from a storage tank onboard the vehicle to create an electrochemical reaction in the fuel cell producing electricity. This electricity can then power the electric drive motor(s) and recharge the onboard battery pack. While hydrogen is the most common off-board fuel added to the FCV for energy storage, other fuel cell designs can use other fuels such as natural gas. However, using natural gas in a FCV would
require a more complex and expensive fueling system onboard the vehicle. Because of the scarcity of hydrogen fueling stations in Idaho, it is not likely that fuel cell vehicles will be present in Idaho in large numbers in the near future. Examples of FCVs are the Honda FCX Clarity and the Toyota FCV. It should be noted that FCVs are also sometimes referred to as a fuel cell electric vehicle (FCEV).
Figure 9. Typical Fuel Cell for
use in a Fuel Cell Vehicle
35
PEV purchase costs today range from approximately $23,00025 to $93,00026 per vehicle, with the higher priced vehicles generally having greater ranges per charge and more features. However, there are various state and federal tax incentives that can reduce the purchase price of a PEV. The federal incentive can be as high as $7,50027 per PEV. The most recent FCV costs ranged from $60,000 to $93,000, which is approximately the same price range for purchasing a Tesla BEV. Plug-in Electric Vehicle (PEV) Fuel Infrastructure and Delivery Systems There are currently two types of technologies for transferring electricity from the electric grid to a PEV and they are: 1) conductive charging which employs a “plug” or “cord/connector set”, and a receptacle onboard the vehicle – this method employs a metal-to-metal contact connection, and 2) wireless power transfer (WPT) which is also referred to by some as wireless charging or inductive charging. As the name implies, electricity is transferred wirelessly, without a metal-to-metal connection. Both technologies are discussed below. Conductive Charging There are currently three types of charging infrastructure commonly used to charge PEVs. They include AC Level 1, AC Level 2, and DC Fast Charging. Both AC Levels 1 and 2 are standardized, meaning that any recent charge cord should work with any recent PEV. Design of the connector for DC fast charging remains to be standardized as a single design in the US, and three protocols currently are in use. The most common charging methods in use today are listed below. AC (On-board vehicle charger)
o Level 1: 120V AC (up to 16 Amps, ~ 1.92kW Max) (Figure 10) o Level 2: 240V AC (up to 80 Amps, ~ 20kW Max) (Figure 11)
DC Fast Charging (Off-board vehicle charger) o Three types in the U.S. – many current stations provide up to 50kW (Figure 12)
Figure 10. Two Examples of AC Level 1 Electric Vehicle Supply Equipment
25 www.edmunds.com/mitsubishi/i-miev/2014/?sub=hatchback 26 www.edmunds.com/tesla/model-s/2014/?sub=sedan 27 www.irs.gov/Businesses/Plug-In-Electric-Vehicle-Credit-(IRC-30-and-IRC-30D)

36
Figure 11. Two Examples of AC Level 2 Electric Vehicle Supply Equipment
Figure 12. Two Examples of DC Level 2 DC Fast Chargers
A charger is the device that converts AC grid electricity to DC power at the current and voltage levels needed to charge a vehicle’s traction battery pack. Most PEVs have onboard chargers to convert the AC power to DC. Energy is normally supplied to the vehicle via a charging station, also known as electric vehicle supply equipment (EVSE). Vehicles that are DC fast charged use off-board fast chargers. The fast chargers are located off-board the vehicle because of the large size and high cost of the fast charger hardware, which must convert AC power to DC power at high currents. A further discussion of the benefits and best places to site each of the most commonly used charging infrastructure is discussed below.
AC Level 1 supplies AC electricity to the on-board DC Charger where the PEV’s power electronics convert the AC to DC. Level one uses 110 VAC and the plug and cord set that is used should be connected, or plugged into a commercial grade NEMA (National Electrical Manufacturers Association) wall outlet and a dedicated electric service branch circuit. The standard outlet in a residential garage is not designed for the greater number of plug-ins and un-plugs that are typical when charging a vehicle at home. In addition, they are not designed for the continuous, higher power flows associated with Level 1

37
charging of PEVs. Therefore, the 110 VAC outlet should be commercial grade. Many PEV users only use Level 1 when using the charge cord typically provided with the PEV, which can be used for emergency charging or visiting a location without charging stations. For PHEVs with small battery packs, such as the Toyota Prius Plug-in, this level of charging can be perfectly suitable given that the slow charge rate is suitable for the small onboard battery pack. However, charge times can range from 6+ hours for a PHEV or EREV to 24+ hours for BEVs requiring a full recharge. BEVs with very large battery packs, such as some Tesla models, would require 40+ hours to fully recharge the battery pack at Level 1 charging. Therefore, while a PEV could be charged during Level 1 on a daily basis, dissatisfaction can occur if the PEV does not fully charge within the allowed time between vehicle operations. Level 1 is sometimes used at residences and for work place charging. However, research by the Idaho National Laboratory has shown that when Level 1 and Level 2 are available at the work place, Level2 is overwhelming preferred.28
AC Level 2 also supplies AC electricity to the vehicle’s on-board DC Charger with the AC to DC conversion again taking place via the vehicle’s power electronics subsystem. The charge times normally range from 2 hours (PHEV) to 8 hours (BEV) for a full recharge. Level 2 EVSE is often the norm for residential charging and it is a good choice for non-home locations such as malls, movie theatres and the work place, as full or near full recharging can normally occur relatively quickly.
Off-board DC fast chargers directly charge the vehicle battery pack without having to convert the electricity from AC to DC onboard the vehicle. This conversion occurs in the off-board DC fast charger. However, during DC fast charging, the vehicle charging controller still controls the battery pack charge rate by communicating limits to the off-board charger. Depending on the individual vehicle efficiency, DC fast charging provides 2 to 4 miles of additional electric range per minute of charging. DC fast charging is suitable for inter-city travel corridors as well as intra-city use at locations such as convenience stores, supermarkets, and fast food restaurants because of the ability to quickly add additional electricity to a PEV battery pack.
It should be noted that there are currently three types of DC fast charger and connector standards in the United States. In addition to the CHAdeMO standard and CHAdeMO specific connector generally used for EVs produced by Asian based automotive manufacturing companies, Tesla is using their own connector design. There is also a third DC fast charger with its unique connector technology, the SAE Combo Connector, which is generally used for EVs produced in the United States and Europe. Unfortunately, PEVs designed for one DC fast charging technology generally cannot use another technology. The exception to this is the PEVs from Tesla. The Tesla PEV can use a connector converter that allows charging via the other two fast charger designs. Wireless Charging Wireless charging, which is also referred to as wireless power transfer or inductive charging, is a method to recharge a PEV, normally from a primary coil on the ground into a secondary coil on the bottom of the vehicle. There is not a metal-to-metal or cord-to-receptacle connection, hence the term wireless charging. This is an emerging charging technology. However, this is not a charging technology that can be ordered with a vehicle from an original equipment manufacturer (OEM) today. It should be noted that there are third party companies that provide wireless charging systems for a limited number of vehicles, and several OEMs have made
28 http://avt.inl.gov/pdf/EVProj/WorkplaceEVSEUtilizationAtFacebookJun2014.pdf

38
announcements about future wireless charging options. Internet Resources for Identifying PEV Charging Locations in the State of Idaho The U.S. Department of Energy’s (DOE) Alternative Fuels Data Center29 identifies nine charging locations (Table 2) in the State of Idaho, with a total of 16 charge ports (plug and connector set) at the nine locations (Figure 13). The PEV enthusiasts’ website PlugShare also has an interactive webpage that allows users to find charging infrastructure in the State of Idaho.30 There is only one DC fast charger in Idaho at this time (orange colored tag in Figure 14). However, the PlugShare internet map also lists golf cart charging locations as well as RV electrical hookups, which would not be compliant with safety standards so are not the optimal locations for charging PEVs. The PlugShare map provides site-specific detailed information when individual tags are clicked on. The PlugShare map also shows residential charging stations that owners have agreed to share with other EV owners.
Figure 13. Plug-in electric vehicle charging station locations in the State of Idaho as reported by DOE Alternative Fuels Data Center
29 www.afdc.energy.gov/fuels/electricity_locations.html 30 www.plugshare.com/

39
Table 2. Plug-in Electric Vehicle Charging Stations Locations
Fuel Type
Station Name Street Address City Station Phone EV Level2 EVSE Num
Electric Dennis Dillon Nissan 8727 Fairview Ave Boise 208-388-4404 1
Electric HP BOISE 11311 Chinden Blvd Boise 888-758-4389 4
Electric Joe Hall Nissan 1617 21st St Lewiston 208-746-2391 1
Electric Boise Airport 3201 Airport Way Boise 208-343-8761 4
Electric Ron Sayer Nissan 1175 N Woodruff Ave
Idaho Falls 208-523-0603 1
Electric Electrical Training Center - Joint Apprenticeship and Training Committee
121 E 34th St Boise 208-384-0538 1
Electric Dan Wiebold Ford 5707 E Gate Blvd Nampa 866-759-3436 1
Electric SpringHill Suites 2250 W Seltice Way Coeur d'Alene
208-667-2212 2
Electric Idaho Falls Power 140 S Capital Ave Idaho Falls 208-612-8439 1
Figure 14. PlugShare map of PEV charging locations in the State of Idaho
General Discussion Hybrid electric vehicles are commonplace throughout Idaho and increasing numbers of PEVs are also being seen on Idaho roadways, and this includes around a dozen Tesla BEVs, with most believed to be in the Boise area. Because of the distances between Idaho’s major cities, BEVs will mostly be used for commuting unless a DC fast charger network is developed in Idaho. Tesla has

40
announced they will deploy a few DC fast chargers in Idaho during 2014 and 2015.31 However, only Tesla vehicles will be allowed to use these units. PHEVs and EREVs are likely to be the more common PEV technologies purchased in Idaho for longer distance travel, due to the advantage of extending the vehicle range with the use of the ICE onboard the vehicles. As to additional infrastructure deployment, private consumers and fleet owners will likely continue to install “at home” or “fleet home” charging infrastructure at their own expense. A potential role for the state of Idaho in the area of home base charging infrastructure would be to consider policy changes for supporting the installation of more home and business charging infrastructure. In the area of public charging, private companies will likely be the parties installing charging infrastructure, including workplace charging. Analysis by the INL32 33 has shown that PEV drivers that have the option to charge at home and at work will only charge their PEV at non-home or non-work locations 1 to 2% of the time on days they go to work. Additionally, workplace charging stations provides an opportunity to charge EVs for workers who live in multiunit housing where home charging stations aren’t normally available. Propane Fueled Vehicles Recent developments have improved the outlook for propane use in internal combustion engines. These developments include the availability of new emissions-certified engines, widening spreads between propane and conventional fuel prices, and the growing acceptance of propane vehicles by commercial vehicle fleet operators. With crude oil, gasoline, and diesel fuel prices projected to remain high to the end of the decade, propane’s price advantage should help drive continuing growth in this engine fuel segment. Types of Propane Vehicles According to the Propane Education and Research Council (PERC), there are more than 147,000 on-road propane vehicles in the United States. Many are used in fleet applications, such as police cars, shuttles, and school buses. The availability of new light- and medium-duty propane vehicles has surged in recent years, especially for fleet use. Propane vehicles can either be OEM vehicles or conversions from gasoline vehicles. Engines and fueling systems are also available for heavy-duty vehicles such as street sweepers, Type A and Type C school buses, and up to and including Class 7 trucks. More than 15 million vehicles run on propane autogas worldwide. Low maintenance costs are one reason behind propane's popularity for use in light-duty vehicles, such as pickup trucks and taxis, and for heavy-duty vehicles, such as school buses. Propane's high octane rating (104 to 112 compared with 87 to 92 for gasoline) and low carbon and oil contamination characteristics have resulted in documented engine life of up to two times that of gasoline engines. Maintenance of propane fleet vehicles requires no modifications of existing facilities. There are two different ways vehicles may be powered by propane autogas — Dedicated and Dual-Fuel:
Dedicated Propane vehicles, fueled only by propane autogas, can be converted from gasoline powered vehicles or can be delivered direct from select Original Equipment Manufacturers. The average autogas conversion costs about $8,000.
Dual-Fuel vehicles have two fuel systems, installed by certified technicians, and can run
31 www.teslamotors.com/supercharger 32 http://avt.inl.gov/pdf/EVProj/ChargingLocation-WorkplaceVoltsMar2014.pdf 33 http://avt.inl.gov/pdf/EVProj/ChargingLocation-WorkplaceLeafsMar2014.pdf

41
on either propane autogas or gasoline. Smaller propane tanks must be used, resulting in a lower percentage of total range provided by propane, but where propane infrastructure is inadequate, the vehicle can operate on gasoline as well.
Propane autogas vehicles operate in a similar way as gasoline fueled vehicles. Only a few modifications to the vehicle must be made, including a pressurized fuel tank, fueling receptacle, fuel lines, and injectors. The fuel system can be one of two types: Vapor Injected or Liquid Injected.
With Vapor Injected systems, liquid propane travels along a fuel line into the engine compartment. The supply of propane to the engine is controlled by a regulator or vaporizer, which converts the liquid propane to a vapor, and mixes it with filtered air before being drawn into the combustion chamber where it is burned to produce power, similar to the vapor injection used in gasoline engines.
Liquid Injected propane systems were developed to overcome problems with early generation vapor injected systems. Liquid Injected engines do not vaporize the propane. Instead, it is injected into the combustion chamber in liquid form. Liquid injection systems have also proven to be highly reliable in terms of power, engine durability, and cold starting in harsh environments.
Propane autogas vehicles have a long driving range — more than 250 percent farther than compressed natural gas. This is due to a number of reasons, including the fact that propane autogas requires a smaller storage vessel than other pressurized alternative fuels to go the same distance. Propane is stored as a liquid in a relatively low-pressure tank (about 150-200 psi). Propane autogas vehicles meet the same standards for safety as conventionally fueled vehicles. Propane autogas vehicle tanks are constructed from carbon steel under code developed by the American Society of Mechanical Engineers (ASME4196), are 20 times more puncture resistant, and can withstand far more pressure than typical gasoline, methanol, or ethanol tanks.
REGULATORY CONSIDERATIONS Environmental Regulations The most relevant environmental regulations affecting Idaho’s current fleet of on-road vehicles are the Corporate Average Fuel Economy (CAFE) and the Greenhouse Gas Emissions standards, set by the US Department of Transportation (DOT) and the US Environmental Protection Agency (EPA), respectively. These regulations will continue to significantly impact both the type and variety of on-road vehicles offered by manufacturers as they try to meet the increasing fuel efficiency and emission standards. First enacted by Congress in 1975, CAFE standards are intended to reduce energy consumption by increasing the fuel economy of cars and light trucks. Though these standards have been in place for decades, the DOT through the National Highway Traffic Safety Administration (NHTSA) has recently set standards to increase CAFE levels rapidly over the next several years. Similarly, through a joint final rulemaking with NHTSA, EPA has recently developed greenhouse gas (GHG) emissions standards under the Clean Air Act aimed at reducing the quantity of GHG emissions coming from on-road vehicles. Medium- and heavy-duty vehicles are covered by different standards, still established by EPA and the NHTSA.

42
Greenhouse Gas Emissions and CAFE Standards for Light-Duty Vehicles34 For light-duty vehicles, EPA establishes national GHG emissions standards under the Clean Air Act, and NHTSA establishes national CAFE standards under the Energy Policy and Conservation Act, as amended by the Energy Independence and Security Act (EISA). On October 15, 2012, EPA and NHTSA issued final rules extending this national program to further reduce GHG emissions and improve fuel economy for model years (MYs) 2017 through 2025 passenger cars and light trucks. These new standards for MYs 2017-2025 represent a significant increase to the existing standards for MYs 2012–2016. Figure 15 shows historical and projected fuel economy standards from 1976 through 2025.
Figure 15. Historical and projected fuel economy standards from 1976 through 2025
EPA’s standards apply to passenger cars, light-duty trucks, and medium-duty passenger vehicles in MYs 2017 through 2025. The final standards are projected to result in an average industry fleet-wide level of 163 grams carbon dioxide (CO2) per mile in MY 2025, which is equivalent to 54.5 miles per gallon (mpg) if achieved exclusively through fuel economy improvements. According to EPA, light-duty vehicles are currently responsible for nearly 60 percent of U.S. transportation-related petroleum use and GHG emissions.
34 www.epa.gov/otaq/climate/documents/420f12051.pdf

43
In addition to establishing specific GHG emissions and fuel economy standards, these rules provide for temporary incentives for the manufacture of electric vehicles, plug-in hybrid electric vehicles, fuel cell vehicles, and dedicated and dual-fuel compressed natural gas vehicles. These incentives are in the form of multipliers that allow a vehicle to count as more than one vehicle in the manufacturer’s compliance calculation. Greenhouse Gas Emissions Standards and Fuel Efficiency Standards for Medium- and Heavy-Duty Engines and Vehicles35 EPA and NHTSA have each adopted complementary standards under their respective authorities covering medium- and heavy-duty vehicles with MYs 2014–2018. Together these standards form a comprehensive Heavy Duty National Program. The agencies have adopted standards for CO2 emissions (EPA) and fuel consumption (NHTSA) tailored to each of three main regulatory categories: (1) combination tractors (commonly known as semi-trucks); (2) heavy-duty pickup trucks and vans; and (3) vocational vehicles. EPA has also adopted standards to control hydrofluorocarbon (HFC) leakage from air conditioning systems in pickups and vans and combination tractors. Also exclusive to the EPA program are EPA’s nitrous oxide and methane standards that apply to all heavy-duty engines, pickups, and vans. For purposes of the Heavy Duty National Program, the heavy-duty fleet incorporates all on-road vehicles rated at a gross vehicle weight at or above 8,500 pounds and the engines that power them, except those covered by the current GHG emissions and CAFE standards for MY 2012–2016 passenger vehicles. Heavy-duty vehicles include both work trucks and commercial medium- and heavy-duty on-highway vehicles as defined by the EISA. Heavy-duty engines affected by the final standards are generally those installed in commercial medium- and heavy-duty trucks and buses. The agencies’ scopes are the same except that EPA is including recreational on-highway vehicles (RVs or motorhomes) within its rulemaking, while NHTSA is not. Trailers are not covered under these rules due to the infancy of the program and the agencies’ limited experience working in a compliance context with the trailer manufacturing industry. However, because trailers do impact the fuel consumption and CO2 emissions from combination tractors, and because of the opportunities for reductions, the agencies intend to include them in a future rulemaking. National Ambient Air Quality Standards (NAAQS)36 The Clean Air Act, which was last amended in 1990, requires EPA to set National Ambient Air Quality Standards (40 CFR part 50) for pollutants considered harmful to public health and the environment. The Clean Air Act identifies two types of NAAQS: primary standards provide public health protection—including protecting the health of "sensitive" populations such as asthmatics, children, and the elderly—and secondary standards provide public welfare protection, including protection against decreased visibility and damage to animals, crops, vegetation, and buildings. EPA has set NAAQS for six principal pollutants, which are called "criteria" pollutants: carbon monoxide, lead, nitrogen dioxide, ozone, particulate matter (both fine and course), and sulfur dioxide (Table 3). Units of measure for the standards are parts per million (ppm) by volume, parts per billion (ppb) by volume, and micrograms per cubic meter of air (µg/m3).
35 www.epa.gov/otaq/climate/documents/420f11031.pdf 36 www.epa.gov/air/criteria.html

44
Table 3. Criteria Pollutants
Pollutant Primary/
Secondary Averaging
Time Level Form
Carbon Monoxide
Primary 8-hour 9 ppm Not to be exceeded more than once per
year 1-hour 35 ppm
Lead Primary and secondary
Rolling 3-month average
0.15 μg/m3 Not to be exceeded
Nitrogen Dioxide
Primary 1-hour 100 ppb 98th percentile of 1-hour daily maximum concentrations, averaged over 3 years
Primary and secondary
Annual 53 ppb Annual mean
Ozone
Primary and secondary
8-hour 0.075 ppm Annual fourth-highest daily maximum 8-hour concentration, averaged over 3 years (referred to as the design value)
Particle Pollution
PM2.5
Primary Annual 12 μg/m3 Annual mean, averaged over 3 years
Secondary Annual 15 μg/m3 Annual mean, averaged over 3 years
Primary and secondary
24-hour 35 μg/m3 98th percentile, averaged over 3 years
PM10 Primary and secondary
24-hour 150 μg/m3 Not to be exceeded more than once per year on average over 3 years
Sulfur Dioxide
Primary 1-hour 75 ppb 99th percentile of 1-hour daily maximum concentrations, averaged over 3 years
Secondary 3-hour 0.5 ppm Not to be exceeded more than once per year
Air quality monitoring is required for these criteria pollutants in areas throughout the nation, including Idaho. When ambient pollutant levels exceed any of these standards, an area is designated as a nonattainment area and regulatory requirements go into effect to bring the area back into attainment. Vehicle emissions are one of many sources of air pollutants. Vehicle emissions are created from the incomplete combustion of gasoline or diesel. Other factors such as emission controls, engine design, and vehicle maintenance may affect vehicle emissions. Vehicles emit many pollutants into the air, including carbon monoxide, carbon dioxide, hydrocarbons, nitrogen oxides, sulfur oxides, and volatile organic compounds. These pollutants then combine to form secondary pollutants such as fine particulate matter (PM2.5) and ozone. While emissions from an individual vehicle may be minimal compared to an industrial source, emissions from many vehicles can have a serious impact on air quality.

45
Emission Standards in Idaho Of particular interest to Idaho, especially in the Treasure Valley, are the contributions that on-road vehicles make to summertime ozone levels. The Treasure Valley airshed is often close to exceeding the ozone NAAQS. EPA is under court order to propose a new ozone standard by December 1, 2014, and to finalize a new standard by October 1, 2015. The current standard is 0.075 ppm and on November 25, 2014, EPA proposed revising the standard in the range of 0.065 ppm to 0.070 ppm.37 Besides the obvious health effects, difficulty meeting the NAAQS is also a concern because of possible designation as a nonattainment area by EPA. States strive to attain and maintain compliance with NAAQS to protect public health, promote economic growth, avoid the potential loss of federal highway funding, and avoid the time and cost required to develop and implement plans to retain compliance. In Idaho, the Department of Environmental Quality (DEQ) is responsible for statewide air quality monitoring and ensuring attainment with the NAAQS. Figure 16 compares the Treasure Valley’s ozone design value with the NAAQS between 2005 and 2013. The figure also identifies the range that has been proposed for a new ozone standard.
Figure 16. Treasure Valley Ozone, Design Value versus Standard
Emissions Testing Programs In an effort to avoid nonattainment designation, in April 2008, the Idaho Legislature enacted and the governor signed into law Idaho Code §39-116B, “Vehicle Inspection and Maintenance Program.” This statute established the groundwork for requiring vehicle emissions testing in
37 www.epa.gov/glo/pdfs/20141125proposal.pdf
0
10
20
30
40
50
60
70
80
2005 2006 2007 2008 2009 2010 2011 2012 2013
Ozone (parts per billion)
Treasure Valley Ozone Design Value vs. Standard
Standard
DesignValue
Range of Proposed Standard

46
areas of the state where air quality is compromised (85% or greater of any NAAQS) and motor vehicle emissions constitute one of the top two contributing sources to the pollution. Currently, the Treasure Valley airshed meets the criteria specified in the law, as data show that vehicle emissions constitute one of the top two emission sources contributing to ozone concentrations in the valley. Ada County’s vehicle emissions testing program began in 1984; the program is managed by the Ada County Air Quality Board. In June 2010, under Idaho Code §39-116B, vehicle emissions testing also became a requirement in Canyon County and the city of Kuna in Ada County. DEQ contracts with a private vendor to operate the program in Canyon County and the city of Kuna. All vehicles subject to emissions testing must be tested every two years in an effort to ensure they are maintained and functioning properly to avoid excessive emissions. Under Idaho’s law, the following vehicles must be tested:
Model year 1981–1995 gas-powered vehicles, using the two-speed idle (TSI) method Model year 1996 and newer gas-powered vehicles more than five years old, using the on-
board diagnostic (OBD) method Model year 1981–1997 diesel-powered vehicles, using the snap acceleration method Model year 2008 and newer diesel-powered vehicles more than five years old, using the
OBD method
The following vehicles do not need to be tested: Electric or hybrid motor vehicles Motor vehicles with a model year less than five years old Motor vehicles with a model year older than 1981 Classic automobiles as defined by Idaho Code Motor vehicles with a maximum vehicle gross weight of less than 1,500 pounds Motor vehicles registered as motor homes as defined by Idaho Code Motorized farm equipment Registered motor vehicles engaged solely in the business of agriculture
Failure to obtain a required emissions test may result in revocation of the vehicle's registration. Waivers are available under certain conditions. Implications/Impacts Federal fuel efficiency and GHG emission standards are projected to increase significantly in the coming years. These regulations will impact the type and variety of new on-road vehicles available for purchase in Idaho. As pressure increases on manufacturers to improve fuel efficiency and reduce GHG emissions, costs for developing new technologies will likely increase as well. The cost of alternative fueled vehicles may become more competitive with petroleum-fueled vehicles. As on-road vehicles become more fuel efficient and emit less air pollution, air quality will benefit, especially in more densely populated areas of Idaho such as the Treasure Valley. Renewable Fuel Standard (RFS) The Renewable Fuel Standard (RFS) was created in 2005 by amendments to the federal Energy Policy Act and included relatively modest targets for displacement of petroleum-based fuels with renewable alternatives. The requirements were greatly expanded in 2007 by the Energy Independence and Security Act and have been labeled RFS2. RFS2 established a target for

47
displacement of 36 billion gallons of petroleum-based fuel by 2022, which was estimated to be about 20% of total gasoline consumption. RFS2 partitions renewable fuels into categories based on their source and their calculated reduction in greenhouse gases. The reduction in greenhouse gases is based on a comprehensive life cycle analysis of the fuel including its production, processing, transportation, and utilization. For example, a category known as renewable biofuel, including mostly corn-based ethanol, is required to have a 20% reduction in greenhouse gases compared with petroleum-based fuel. This category reaches a maximum requirement of 15 billion gallons in 2015 and then stays at that value through 2022. Another category, known as advanced biofuel, is required to have a 50% reduction in greenhouse gases. This category started at a relatively low level in 2009 but was expected to increase rapidly as ethanol from ligno-cellulosic sources (wood, straw, switchgrass, corn stover) becomes available. Ethanol from these sources has lagged behind targets and the Environmental Protection Agency (EPA) has had to adjust targets to lower levels. Some fuels, such as corn-based ethanol (renewable biofuel) and biodiesel (biomass-based diesel) have exceeded their mandated targets every year. Enforcement for RFS2 occurs through requirements that suppliers of petroleum-based fuels provide documentation to EPA that they have purchased amounts of renewable fuel corresponding to a percentage of their total fuel production. This documentation takes the form of Renewable Identification Numbers (RINs), which are like serial numbers for renewable fuels that are generated by the fuel producers. The RINs pass to the petroleum refiners when they purchase the renewable fuel for blending with their products and are then submitted to the EPA to prove compliance with the law. These RINS can be separated from the fuel and are traded on a secondary market like other commodities. Because of the lag in the development of a ligno-cellulosic ethanol industry, EPA is currently reevaluating the annual mandate levels for all of the renewable fuels in the RFS2. This is causing considerable uncertainty in the renewable fuel industry because initial proposals indicated that mandate levels may be reduced for all of the fuel categories. This uncertainty is expected to continue well into 2015. Idaho Alternative Fuel Laws and Incentives Source: EPA Alternative Fuels Data Center Alternative Fuels Tax Exemption and Refund
State excise tax does not apply to some special fuels, including gaseous special fuels. Special fuels include compressed and liquefied natural gas, liquefied petroleum gas (propane), hydrogen, and fuel suitable for use in diesel engines. In addition, state excise tax paid on special fuels used in motor vehicles that the state or federal government owns or leases may be refunded, as long as the tax was originally paid directly to a special fuel vendor. The tax refund is not available for special fuels registered motor vehicles use while idling. Idling means a period of time greater than 15 minutes when the motor vehicle is stationary with the engine operating. (Reference Idaho Statutes 63-2401, 63-2402, and 63-2423) Alternative Fuels Tax or Fee
An Idaho excise tax applies to special fuels at a rate of $0.25 per gallon on a gasoline gallon equivalent (GGE) basis with the exception of liquefied petroleum gas (propane), which is taxed

48
on a diesel gallon equivalent basis. Special fuels include compressed natural gas (CNG), liquefied natural gas, propane, hydrogen, and fuel suitable for use in diesel engines. In lieu of paying an excise tax on gaseous motor fuels, owners of vehicles powered by CNG, propane, or hydrogen may pay an annual fee. The fee is based on gross vehicle weight rating (GVWR) as follows:
GVWR Fee Less than or equal to 8,000 pounds (lbs.) $60 8,001-16,000 lbs. $89 16,001-26,000 lbs. $179 26,001 lbs. or more $208
Vehicle owners must purchase permits from gaseous fuels vendors and display the provided decal as evidence that the annual fee has been paid in lieu of the excise tax. Permits for vehicles that are converted to gaseous fuels after July 1 in any year are subject to a prorated fee. (Reference Senate Bill 2338, 2014, and Idaho Statutes 63-2401 and 63-2424) Propane Board and Dealer Requirements The Idaho Liquefied Petroleum Gas (LPG) Public Safety Act established the LPG Board and requires that LPG (propane) dealers meet education, experience, and examination qualifications, and hold a valid individual license. Each propane fueling facility must be licensed. A fee of up to $500 is required for each license application, original license, and annual license renewal. (Reference Idaho Statutes 54-5301 to 54-5317) Idaho Law: For-Profit EV Charging Stations Are Currently Subject to State Regulation as Public Utilities State resale prohibitions align with general regulatory policies allocating exclusive service territory as part of the regulatory compact. Under the regulatory compact, utilities are granted a monopoly to provide essential services to their customers. In exchange for this monopoly status, utilities are subject to pervasive regulation related to their service, rates, and entry into the market.38 To this end, Idaho has territorial allocation statutes39 that are designed to prevent the duplication of utility facilities and promote efficient, economic and safe use of those facilities, while providing adequate and reasonable service to customers. These statutes require Idaho Public Utility Commission approval of all agreements allocating service territory and they prohibit a person from offering, constructing, or extending utility service in or into an allocated territory.
For-profit EV charging stations located in Idaho are currently considered to be “public utilities”40 subject to the jurisdiction of the Idaho Public Utilities Commission (“IPUC”). Idaho Code §§ 61-118, -119, and -129 require that “electric corporations” managing any “electric plant” for compensation in Idaho be regulated under the Public Utilities Laws as a “public utility” both
39 I.C. §§ 61-526, 61-332 et. seq. and ORS 758.400 et. seq.

49
when electric service is performed and the commodity delivered directly to the public, and where the service is performed or the commodity delivered to any corporation, who in turn, either directly or indirectly performs the services or delivers the commodity to or for the public.
See Re Application of Portland General Electric Company for an Investigation into Least-Cost Plan Plant Retirement, Dockets DR 10, UE 88, UM 989, Order No. 08-487 at 4 (Sept. 30, 2008) (“As monopoly providers of essential services, public utilities are subject to government control over entry, service, and rates.”); see also U.S. Gypsum, Inc. v. Ind. Gas Co., 735 N.E.2d 790, 797 (Ind. 2000) (regulatory compact “arises out of a ‘bargain’ struck between the utilities and the state. As a quid pro quo for being granted a monopoly in a geographical area for the provision of a particular good or service, the utility is subject to regulation by the state to ensure that it is prudently investing its revenues in order to provide the best and most efficient service possible to the consumer.”); PacifiCorp v. Public Service Comm’n of Wyoming, 103 P.3d 862, 871 (Wyo. 2004) (“the compact is a theoretical agreement between the utilities and the state in which, as a quid pro quo for being granted a monopoly in a geographical area for the provision of a particular good or service, the utility is subject to regulation by the state to ensure that it is prudently investing its revenues in order to provide the best and most efficient service possible to the consumer.”); Office of Public Utility Counsel v. Public Utility Comm’n of Texas, 104 S.W.3d 225, 227-28 (Tex. App. 2003) (“Under a fully regulated system, an electricity utility enters into a “regulatory compact” with the public: in return for a monopoly over electricity service in a given area; the utility agrees to provide service to all requesting customers and to charge only the retail rates set by the Commission.”). I.C. §§ 61-526, 61-332 et. seq. and ORS 758.400 et. seq.
I.C. §§ 61-118, -119, and -129. EV Tax Credits The federal government provides a tax credit of up to $7,500 for qualifying electric vehicle purchases, the size of which is dependent on battery size. IRS Code Section 30D provides a tax credit for Plug-in Electric Drive Motor Vehicles and is equal to $2,500 plus, for a vehicle that draws propulsion energy from a battery with at least 5 kWh of capacity, $417, plus an additional $417 for each kWh of battery capacity in excess of 5 kWh. The total credit allowed is limited to $7,500. The credit begins to phase out for a manufacturer’s vehicles when at least 200,000 qualifying vehicles have been sold for use in the United States. The federal government also provided a tax credit toward the purchase and installation of electric vehicle charging equipment. The Alternative Fuel Vehicle Refueling Property Credit provided a tax credit equal to 30% of the purchase price and installation of the charging station. This tax credit was set to expire at the end of 2013 but was extended by the Tax Increase Prevention Act (H.R. 5771) through 2014.