final basin management action planupper wakulla river and wakulla springs basin management action...
TRANSCRIPT

FINAL BASIN MANAGEMENT ACTION PLAN
for the Implementation of the
Total Maximum Daily Load for Nutrients (Biology) by the Florida Department of Environmental Protection in the Upper Wakulla River and Wakulla Springs Basin
prepared by the
Division of Environmental Assessment and Restoration Water Quality Restoration Program
Florida Department of Environmental Protection Tallahassee, FL 32399
in cooperation with the
Upper Wakulla River and Wakulla Springs Basin Technical Stakeholders
October 2015

FINAL Upper Wakulla River and Wakulla Springs Basin Management Action Plan – October 2015
Page i of xv
ACKNOWLEDGMENTS
The Florida Department of Environmental Protection adopted the Upper Wakulla River and Wakulla
Springs Basin Management Action Plan by Secretarial Order as part of its statewide watershed
management approach to restore and protect Florida’s water quality. The plan was developed in
cooperation with the Upper Wakulla River and Wakulla Springs Basin stakeholders, identified below,
with participation from affected local, regional, and state governmental interests; elected officials and
citizens; and private interests.
FLORIDA DEPARTMENT OF ENVIRONMENTAL PROTECTION Jonathan P. Steverson, Secretary
UPPER WAKULLA RIVER AND WAKULLA SPRINGS BASIN PARTICIPANTS
CATEGORY NAME OF ENTITY
RESPONSIBLE STAKEHOLDERS
Agricultural Producers Leon County Wakulla County City of Tallahassee Florida Department of Transportation District 3 Gadsden County Jefferson County City of Gretna City of Midway City of Quincy Town of Havana Federal Correctional Institution, Tallahassee Florida Agricultural and Mechanical University Florida State University Tallahassee Community College Talquin Electric Cooperative
RESPONSIBLE AGENCIES
Florida Department of Agriculture and Consumer Services Florida Department of Environmental Protection, including Wakulla Springs State Park Florida Department of Health Leon County Health Department Northwest Florida Water Management District Wakulla County Health Department
OTHER INTERESTED STAKEHOLDERS
1000 Friends of Florida Citizens Florida Department of Economic Opportunity Friends of Wakulla Springs Wakulla Springs Alliance

FINAL Upper Wakulla River and Wakulla Springs Basin Management Action Plan – October 2015
Page ii of xv
For additional information on Total Maximum Daily Loads and the watershed management approach in
the Upper Wakulla River and Wakulla Springs Basin, contact:
Moira Rojas Homann, Basin Coordinator Florida Department of Environmental Protection Water Quality Restoration Program, Watershed Planning and Coordination Section 2600 Blair Stone Road, Mail Station 3565 Tallahassee, FL 32399-2400 Email: [email protected] Phone: (850) 245–8460
FINAL Upper Wakulla River and Wakulla Springs Basin Management Action Plan – October 2015
Page iii of xv
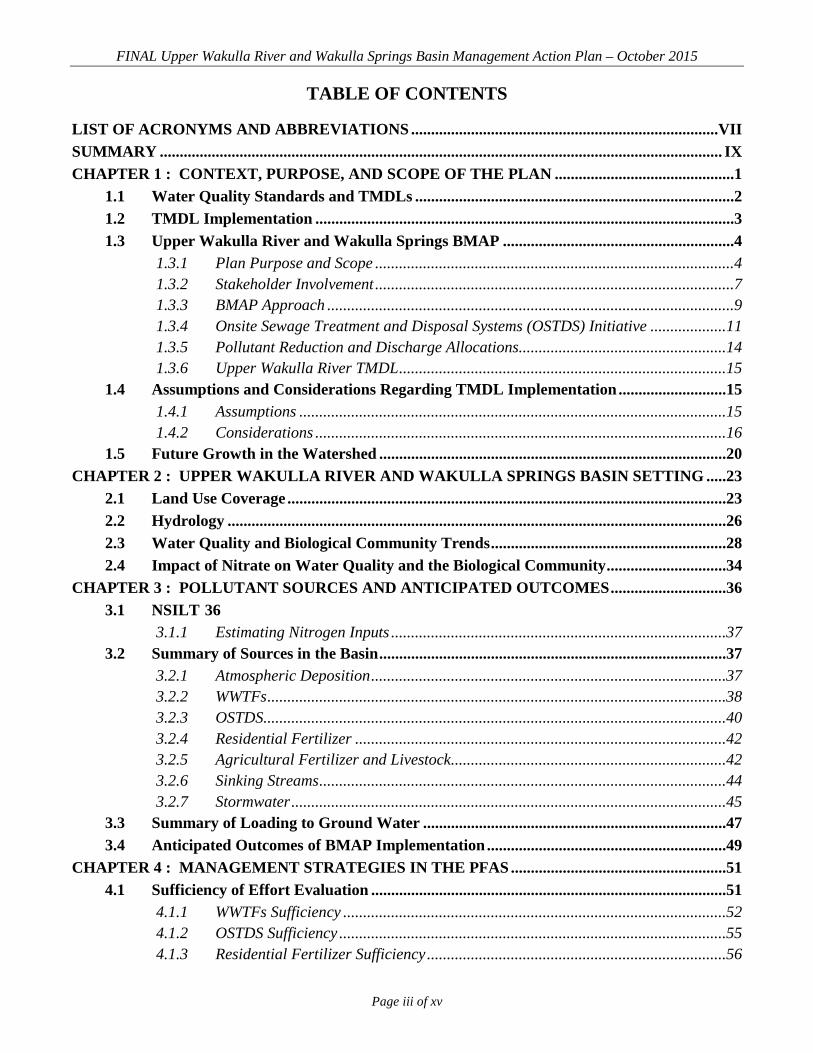
TABLE OF CONTENTS
LIST OF ACRONYMS AND ABBREVIATIONS .............................................................................VII SUMMARY ............................................................................................................................................. IX CHAPTER 1 : CONTEXT, PURPOSE, AND SCOPE OF THE PLAN .............................................1
1.1 Water Quality Standards and TMDLs ................................................................................2 1.2 TMDL Implementation .........................................................................................................3 1.3 Upper Wakulla River and Wakulla Springs BMAP ..........................................................4
1.3.1 Plan Purpose and Scope ..........................................................................................4 1.3.2 Stakeholder Involvement ..........................................................................................7 1.3.3 BMAP Approach ......................................................................................................9 1.3.4 Onsite Sewage Treatment and Disposal Systems (OSTDS) Initiative ...................11 1.3.5 Pollutant Reduction and Discharge Allocations....................................................14 1.3.6 Upper Wakulla River TMDL ..................................................................................15
1.4 Assumptions and Considerations Regarding TMDL Implementation ...........................15 1.4.1 Assumptions ...........................................................................................................15 1.4.2 Considerations .......................................................................................................16
1.5 Future Growth in the Watershed .......................................................................................20 CHAPTER 2 : UPPER WAKULLA RIVER AND WAKULLA SPRINGS BASIN SETTING .....23
2.1 Land Use Coverage ..............................................................................................................23 2.2 Hydrology .............................................................................................................................26 2.3 Water Quality and Biological Community Trends ...........................................................28 2.4 Impact of Nitrate on Water Quality and the Biological Community ..............................34
CHAPTER 3 : POLLUTANT SOURCES AND ANTICIPATED OUTCOMES .............................36 3.1 NSILT 36
3.1.1 Estimating Nitrogen Inputs ....................................................................................37 3.2 Summary of Sources in the Basin .......................................................................................37
3.2.1 Atmospheric Deposition .........................................................................................37 3.2.2 WWTFs ...................................................................................................................38 3.2.3 OSTDS....................................................................................................................40 3.2.4 Residential Fertilizer .............................................................................................42 3.2.5 Agricultural Fertilizer and Livestock.....................................................................42 3.2.6 Sinking Streams ......................................................................................................44 3.2.7 Stormwater .............................................................................................................45
3.3 Summary of Loading to Ground Water ............................................................................47 3.4 Anticipated Outcomes of BMAP Implementation ............................................................49
CHAPTER 4 : MANAGEMENT STRATEGIES IN THE PFAS ......................................................51 4.1 Sufficiency of Effort Evaluation .........................................................................................51
4.1.1 WWTFs Sufficiency ................................................................................................52 4.1.2 OSTDS Sufficiency .................................................................................................55 4.1.3 Residential Fertilizer Sufficiency ...........................................................................56

FINAL Upper Wakulla River and Wakulla Springs Basin Management Action Plan – October 2015
Page iv of xv
4.1.4 Agricultural Fertilizer and Livestock Sufficiency ..................................................57 4.1.5 Stormwater Sufficiency ..........................................................................................58 4.1.6 Other Strategies .....................................................................................................59
4.2 Stakeholder Management Strategies..................................................................................61 CHAPTER 5 : MANAGEMENT STRATEGIES OUTSIDE THE PFAS ........................................74
5.1 Agriculture............................................................................................................................74 5.2 City of Gretna Management Strategies .............................................................................77 5.3 City of Quincy Management Strategies .............................................................................77 5.4 FAMU Management Strategies ..........................................................................................77 5.5 Federal Correctional Institution, Tallahassee Management Strategies..........................78 5.6 FSU Management Strategies ...............................................................................................78 5.7 Gadsden County Management Strategies .........................................................................79 5.8 Talquin Electric Cooperative Management Strategies ....................................................80 5.9 TCC Management Strategies ..............................................................................................82 5.10 Town of Havana Management Strategies ..........................................................................83 5.11 Leon County Management Strategies Outside the PFAs .................................................83 5.12 City of Tallahassee Management Strategies Outside the PFAs .......................................84
CHAPTER 6 : ASSESSING PROGRESS AND MAKING CHANGES ...........................................85 6.1 Tracking Implementation ...................................................................................................85 6.2 Adaptive Management Measures .......................................................................................86 6.3 Water Quality Monitoring ..................................................................................................87
6.3.1 Monitoring Objectives ...........................................................................................87 6.3.2 Water Quality Monitoring Parameters, Frequency, and Network ........................87 6.3.3 Biological Monitoring ............................................................................................92 6.3.4 Data Management and Assessment .......................................................................93 6.3.5 Quality Assurance/Quality Control .......................................................................93
6.4 Research Studies ..................................................................................................................94 6.5 Commitment to Plan Implementation ...............................................................................95
APPENDICES ..........................................................................................................................................96 Appendix A: Rule 62-304(2), F.A.C., the Upper Wakulla River TMDL ...................................97 Appendix B: City of Tallahassee Stormwater Treatment Projects in the Upper
Wakulla River and Wakulla Springs Basin .........................................................98 Appendix C: Potential Funding Sources ....................................................................................102 Appendix D: Details on the SCI ..................................................................................................106 Appendix E: Bibliography of Key References and Websites ...................................................108
FINAL Upper Wakulla River and Wakulla Springs Basin Management Action Plan – October 2015
Page v of xv
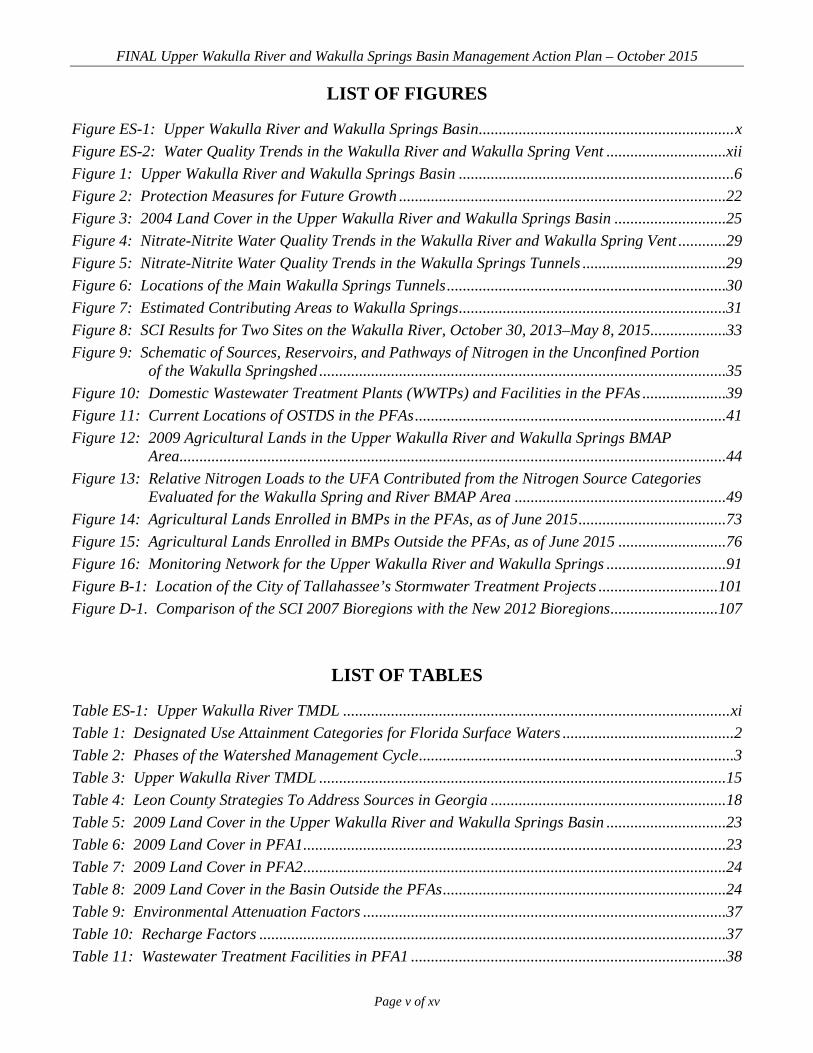
LIST OF FIGURES
Figure ES-1: Upper Wakulla River and Wakulla Springs Basin ................................................................ x Figure ES-2: Water Quality Trends in the Wakulla River and Wakulla Spring Vent ..............................xii Figure 1: Upper Wakulla River and Wakulla Springs Basin .....................................................................6 Figure 2: Protection Measures for Future Growth ..................................................................................22 Figure 3: 2004 Land Cover in the Upper Wakulla River and Wakulla Springs Basin ............................25 Figure 4: Nitrate-Nitrite Water Quality Trends in the Wakulla River and Wakulla Spring Vent ............29 Figure 5: Nitrate-Nitrite Water Quality Trends in the Wakulla Springs Tunnels ....................................29 Figure 6: Locations of the Main Wakulla Springs Tunnels ......................................................................30 Figure 7: Estimated Contributing Areas to Wakulla Springs ...................................................................31 Figure 8: SCI Results for Two Sites on the Wakulla River, October 30, 2013–May 8, 2015...................33 Figure 9: Schematic of Sources, Reservoirs, and Pathways of Nitrogen in the Unconfined Portion
of the Wakulla Springshed ......................................................................................................35 Figure 10: Domestic Wastewater Treatment Plants (WWTPs) and Facilities in the PFAs .....................39 Figure 11: Current Locations of OSTDS in the PFAs ..............................................................................41 Figure 12: 2009 Agricultural Lands in the Upper Wakulla River and Wakulla Springs BMAP
Area .........................................................................................................................................44 Figure 13: Relative Nitrogen Loads to the UFA Contributed from the Nitrogen Source Categories
Evaluated for the Wakulla Spring and River BMAP Area .....................................................49 Figure 14: Agricultural Lands Enrolled in BMPs in the PFAs, as of June 2015 .....................................73 Figure 15: Agricultural Lands Enrolled in BMPs Outside the PFAs, as of June 2015 ...........................76 Figure 16: Monitoring Network for the Upper Wakulla River and Wakulla Springs ..............................91 Figure B-1: Location of the City of Tallahassee’s Stormwater Treatment Projects ..............................101 Figure D-1. Comparison of the SCI 2007 Bioregions with the New 2012 Bioregions ...........................107
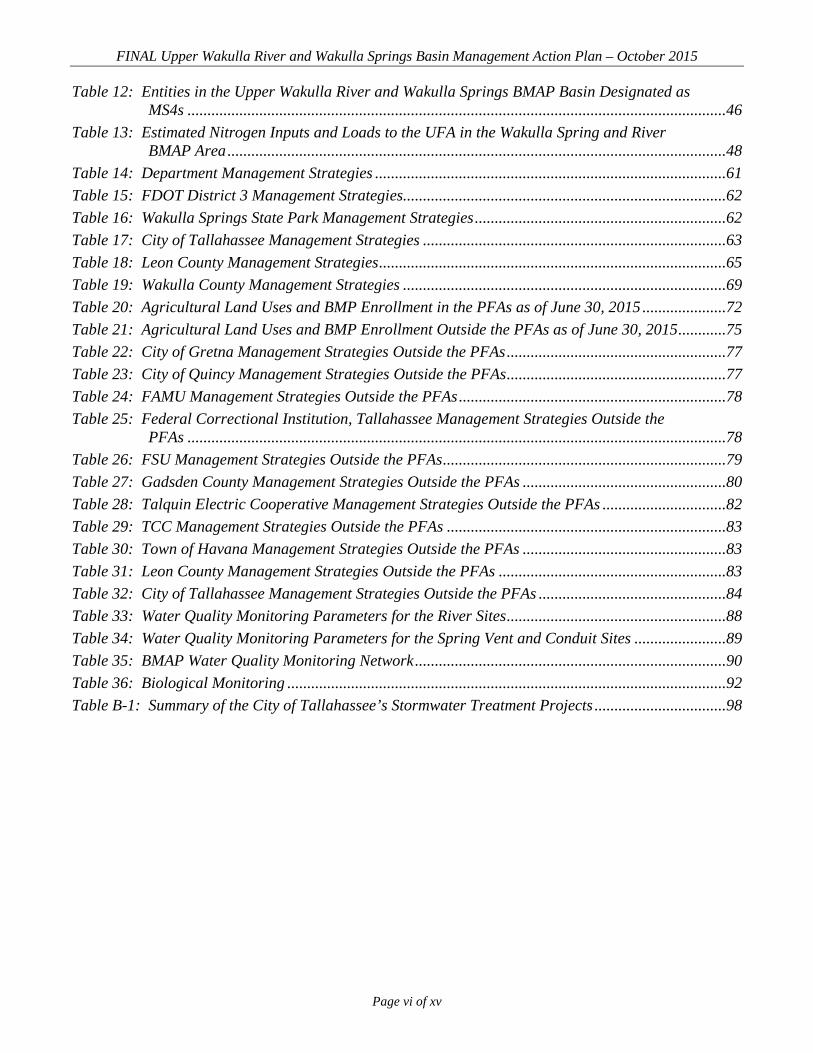
LIST OF TABLES
Table ES-1: Upper Wakulla River TMDL ................................................................................................. xi Table 1: Designated Use Attainment Categories for Florida Surface Waters ...........................................2 Table 2: Phases of the Watershed Management Cycle ...............................................................................3 Table 3: Upper Wakulla River TMDL ......................................................................................................15 Table 4: Leon County Strategies To Address Sources in Georgia ...........................................................18 Table 5: 2009 Land Cover in the Upper Wakulla River and Wakulla Springs Basin ..............................23 Table 6: 2009 Land Cover in PFA1 ..........................................................................................................23 Table 7: 2009 Land Cover in PFA2 ..........................................................................................................24 Table 8: 2009 Land Cover in the Basin Outside the PFAs .......................................................................24 Table 9: Environmental Attenuation Factors ...........................................................................................37 Table 10: Recharge Factors .....................................................................................................................37 Table 11: Wastewater Treatment Facilities in PFA1 ...............................................................................38
FINAL Upper Wakulla River and Wakulla Springs Basin Management Action Plan – October 2015
Page vi of xv
Table 12: Entities in the Upper Wakulla River and Wakulla Springs BMAP Basin Designated as MS4s .......................................................................................................................................46
Table 13: Estimated Nitrogen Inputs and Loads to the UFA in the Wakulla Spring and River BMAP Area .............................................................................................................................48
Table 14: Department Management Strategies ........................................................................................61 Table 15: FDOT District 3 Management Strategies.................................................................................62 Table 16: Wakulla Springs State Park Management Strategies ...............................................................62 Table 17: City of Tallahassee Management Strategies ............................................................................63 Table 18: Leon County Management Strategies .......................................................................................65 Table 19: Wakulla County Management Strategies .................................................................................69 Table 20: Agricultural Land Uses and BMP Enrollment in the PFAs as of June 30, 2015 .....................72 Table 21: Agricultural Land Uses and BMP Enrollment Outside the PFAs as of June 30, 2015 ............75 Table 22: City of Gretna Management Strategies Outside the PFAs .......................................................77 Table 23: City of Quincy Management Strategies Outside the PFAs .......................................................77 Table 24: FAMU Management Strategies Outside the PFAs ...................................................................78 Table 25: Federal Correctional Institution, Tallahassee Management Strategies Outside the
PFAs .......................................................................................................................................78 Table 26: FSU Management Strategies Outside the PFAs .......................................................................79 Table 27: Gadsden County Management Strategies Outside the PFAs ...................................................80 Table 28: Talquin Electric Cooperative Management Strategies Outside the PFAs ...............................82 Table 29: TCC Management Strategies Outside the PFAs ......................................................................83 Table 30: Town of Havana Management Strategies Outside the PFAs ...................................................83 Table 31: Leon County Management Strategies Outside the PFAs .........................................................83 Table 32: City of Tallahassee Management Strategies Outside the PFAs ...............................................84 Table 33: Water Quality Monitoring Parameters for the River Sites .......................................................88 Table 34: Water Quality Monitoring Parameters for the Spring Vent and Conduit Sites .......................89 Table 35: BMAP Water Quality Monitoring Network ..............................................................................90 Table 36: Biological Monitoring ..............................................................................................................92 Table B-1: Summary of the City of Tallahassee’s Stormwater Treatment Projects .................................98

FINAL Upper Wakulla River and Wakulla Springs Basin Management Action Plan – October 2015
Page vii of xv
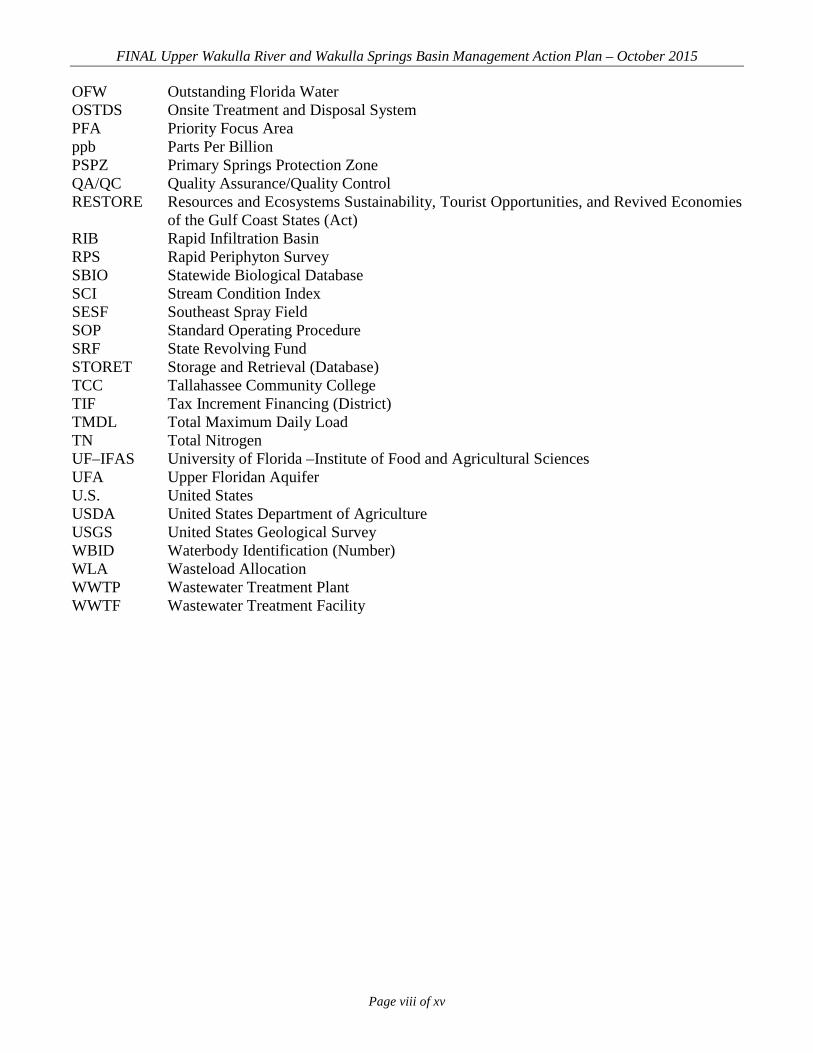
LIST OF ACRONYMS AND ABBREVIATIONS AVA Aquifer Vulnerability Assessment AWT Advanced Wastewater Treatment BMAP Basin Management Action Plan BMP Best Management Practice CASTNET Clean Air Status and Trends Network CFR Code of Federal Regulations CR County Road DEAR Division of Environmental Assessment and Restoration Department Florida Department of Environmental Protection DO Dissolved Oxygen EPA United States Environmental Protection Agency ERP Environmental Resource Permit F.A.C. Florida Administrative Code FAMU Florida Agricultural and Mechanical University FAR Florida Administrative Register FDACS Florida Department of Agriculture and Consumer Services FDOH Florida Department of Health FDOT Florida Department of Transportation FGS Florida Geological Survey F.S. Florida Statutes FSU Florida State University FWRA Florida Watershed Restoration Act FYN Florida Yards and Neighborhoods GIS Geographic Information Systems gpd Gallons Per Day HA Habitat Assessment IWR Impaired Surface Waters Rule kg/yr Kilograms Per Year LA Load Allocation LDI Low-Impact Development LID Low-Impact Development LIDAR` Light Detection and Ranging LVS Linear Vegetation Survey MFLs Minimum Flows and Levels Mgd Million Gallons Per Day mg/L Milligrams Per Liter MS4 Municipal Separate Storm Sewer System N Nitrogen NADP National Atmospheric Deposition Program NELAP National Environmental Laboratory Accreditation Program NNC Numeric Nutrient Criteria NOI Notice of Intent NPDES National Pollutant Discharge Elimination System NSILT Nitrogen Source Inventory and Loading Tool NWFWMD Northwest Florida Water Management District
FINAL Upper Wakulla River and Wakulla Springs Basin Management Action Plan – October 2015
Page viii of xv
OFW Outstanding Florida Water OSTDS Onsite Treatment and Disposal System PFA Priority Focus Area ppb Parts Per Billion PSPZ Primary Springs Protection Zone QA/QC Quality Assurance/Quality Control RESTORE Resources and Ecosystems Sustainability, Tourist Opportunities, and Revived Economies
of the Gulf Coast States (Act) RIB Rapid Infiltration Basin RPS Rapid Periphyton Survey SBIO Statewide Biological Database SCI Stream Condition Index SESF Southeast Spray Field SOP Standard Operating Procedure SRF State Revolving Fund STORET Storage and Retrieval (Database) TCC Tallahassee Community College TIF Tax Increment Financing (District) TMDL Total Maximum Daily Load TN Total Nitrogen UF–IFAS University of Florida –Institute of Food and Agricultural Sciences UFA Upper Floridan Aquifer U.S. United States USDA United States Department of Agriculture USGS United States Geological Survey WBID Waterbody Identification (Number) WLA Wasteload Allocation WWTP Wastewater Treatment Plant WWTF Wastewater Treatment Facility
FINAL Upper Wakulla River and Wakulla Springs Basin Management Action Plan – October 2015
Page ix of xv
SUMMARY
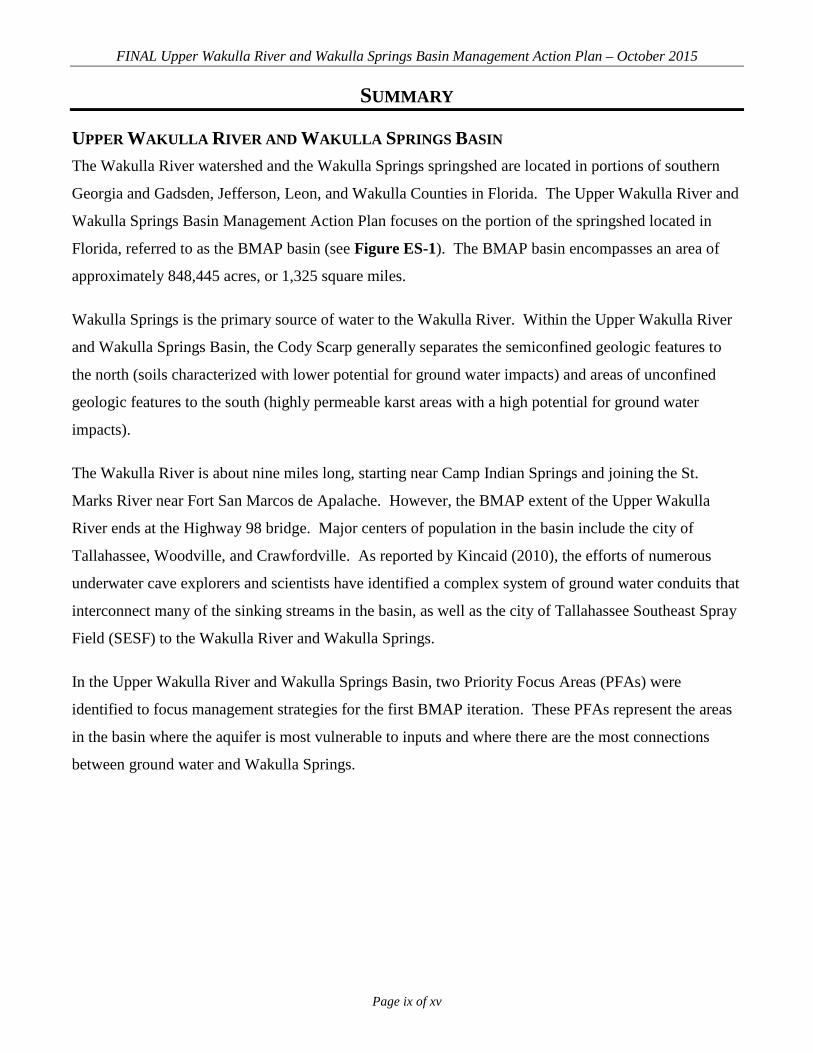
UPPER WAKULLA RIVER AND WAKULLA SPRINGS BASIN The Wakulla River watershed and the Wakulla Springs springshed are located in portions of southern
Georgia and Gadsden, Jefferson, Leon, and Wakulla Counties in Florida. The Upper Wakulla River and
Wakulla Springs Basin Management Action Plan focuses on the portion of the springshed located in
Florida, referred to as the BMAP basin (see Figure ES-1). The BMAP basin encompasses an area of
approximately 848,445 acres, or 1,325 square miles.
Wakulla Springs is the primary source of water to the Wakulla River. Within the Upper Wakulla River
and Wakulla Springs Basin, the Cody Scarp generally separates the semiconfined geologic features to
the north (soils characterized with lower potential for ground water impacts) and areas of unconfined
geologic features to the south (highly permeable karst areas with a high potential for ground water
impacts).
The Wakulla River is about nine miles long, starting near Camp Indian Springs and joining the St.
Marks River near Fort San Marcos de Apalache. However, the BMAP extent of the Upper Wakulla
River ends at the Highway 98 bridge. Major centers of population in the basin include the city of
Tallahassee, Woodville, and Crawfordville. As reported by Kincaid (2010), the efforts of numerous
underwater cave explorers and scientists have identified a complex system of ground water conduits that
interconnect many of the sinking streams in the basin, as well as the city of Tallahassee Southeast Spray
Field (SESF) to the Wakulla River and Wakulla Springs.
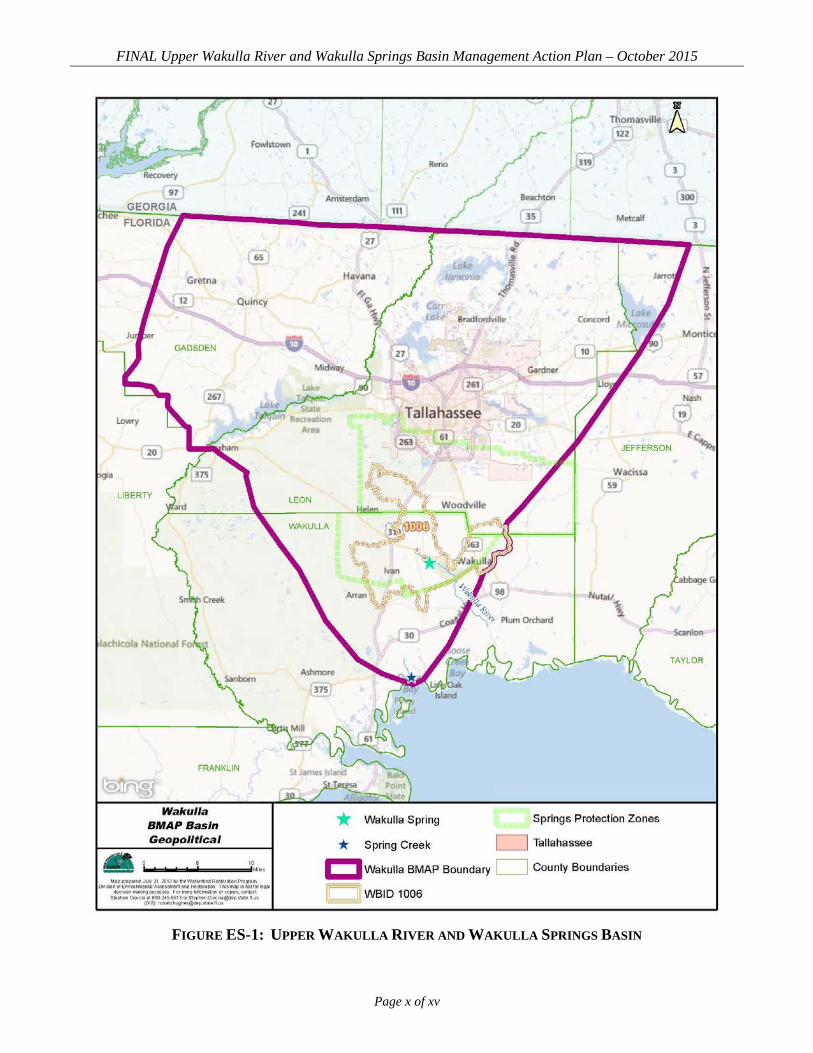
In the Upper Wakulla River and Wakulla Springs Basin, two Priority Focus Areas (PFAs) were
identified to focus management strategies for the first BMAP iteration. These PFAs represent the areas
in the basin where the aquifer is most vulnerable to inputs and where there are the most connections
between ground water and Wakulla Springs.
FINAL Upper Wakulla River and Wakulla Springs Basin Management Action Plan – October 2015
Page x of xv
FIGURE ES-1: UPPER WAKULLA RIVER AND WAKULLA SPRINGS BASIN
FINAL Upper Wakulla River and Wakulla Springs Basin Management Action Plan – October 2015
Page xi of xv
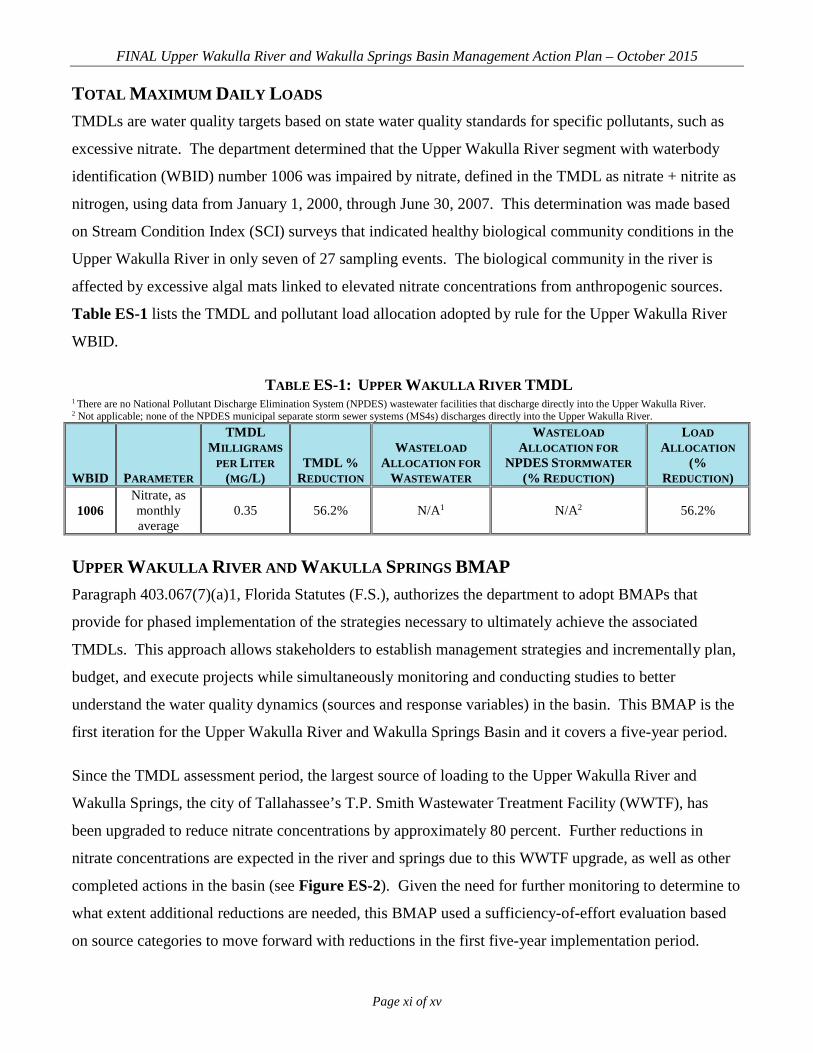
TOTAL MAXIMUM DAILY LOADS TMDLs are water quality targets based on state water quality standards for specific pollutants, such as
excessive nitrate. The department determined that the Upper Wakulla River segment with waterbody
identification (WBID) number 1006 was impaired by nitrate, defined in the TMDL as nitrate + nitrite as
nitrogen, using data from January 1, 2000, through June 30, 2007. This determination was made based
on Stream Condition Index (SCI) surveys that indicated healthy biological community conditions in the
Upper Wakulla River in only seven of 27 sampling events. The biological community in the river is
affected by excessive algal mats linked to elevated nitrate concentrations from anthropogenic sources.
Table ES-1 lists the TMDL and pollutant load allocation adopted by rule for the Upper Wakulla River
WBID.
TABLE ES-1: UPPER WAKULLA RIVER TMDL 1 There are no National Pollutant Discharge Elimination System (NPDES) wastewater facilities that discharge directly into the Upper Wakulla River. 2 Not applicable; none of the NPDES municipal separate storm sewer systems (MS4s) discharges directly into the Upper Wakulla River.
WBID PARAMETER
TMDL MILLIGRAMS
PER LITER (MG/L)
TMDL % REDUCTION
WASTELOAD ALLOCATION FOR
WASTEWATER
WASTELOAD ALLOCATION FOR
NPDES STORMWATER (% REDUCTION)
LOAD ALLOCATION
(% REDUCTION)
1006 Nitrate, as monthly average
0.35 56.2% N/A1 N/A2 56.2%
UPPER WAKULLA RIVER AND WAKULLA SPRINGS BMAP Paragraph 403.067(7)(a)1, Florida Statutes (F.S.), authorizes the department to adopt BMAPs that
provide for phased implementation of the strategies necessary to ultimately achieve the associated
TMDLs. This approach allows stakeholders to establish management strategies and incrementally plan,
budget, and execute projects while simultaneously monitoring and conducting studies to better
understand the water quality dynamics (sources and response variables) in the basin. This BMAP is the
first iteration for the Upper Wakulla River and Wakulla Springs Basin and it covers a five-year period.
Since the TMDL assessment period, the largest source of loading to the Upper Wakulla River and
Wakulla Springs, the city of Tallahassee’s T.P. Smith Wastewater Treatment Facility (WWTF), has
been upgraded to reduce nitrate concentrations by approximately 80 percent. Further reductions in
nitrate concentrations are expected in the river and springs due to this WWTF upgrade, as well as other
completed actions in the basin (see Figure ES-2). Given the need for further monitoring to determine to
what extent additional reductions are needed, this BMAP used a sufficiency-of-effort evaluation based
on source categories to move forward with reductions in the first five-year implementation period.

FINAL Upper Wakulla River and Wakulla Springs Basin Management Action Plan – October 2015
Page xii of xv
FIGURE ES-2: WATER QUALITY TRENDS IN THE WAKULLA RIVER AND WAKULLA SPRING VENT
Using information on sources in the basin, the stakeholders in the PFAs were asked to submit
management strategies to reduce nitrate loading from the sources they are responsible for managing.
The department then compared the strategies provided with the sources in the PFAs to evaluate whether
each of the existing sources was sufficiently addressed for the first BMAP iteration and whether
strategies were in place or would be put into place to reduce nitrate sources. Where needed, the
department requested additional details and strategies from the responsible stakeholders to assess
sufficiency for the first BMAP iteration.
To ensure sufficiency for addressing onsite sewage treatment and disposal systems (OSTDS), the
department is undertaking an OSTDS Initiative, in cooperation with the Florida Department of Health
(FDOH), city of Tallahassee, Leon County, Wakulla County, and other parties. The objective of the
OSTDS Initiative is to identify and implement effective, financially feasible strategies to reduce nutrient
loads from OSTDS sources. The department and stakeholders will identify options for addressing
OSTDS loading, identify effective strategies for the Upper Wakulla River and Wakulla Springs Basin,

FINAL Upper Wakulla River and Wakulla Springs Basin Management Action Plan – October 2015
Page xiii of xv
establish educational and outreach programs, determine responsibilities, and identify funding sources
and an implementation schedule for the management strategies.
For the first five years of BMAP implementation, collectively the management strategies included in the
BMAP are sufficient and reasonable to address nitrate loading in the PFAs to the Upper Wakulla River
and Wakulla Springs Basin. Additional management strategies may be required in the next BMAP
iteration unless more current water quality data indicate that the designated uses have been achieved.
The requirements of this BMAP are enforceable by the department. For point sources to surface waters,
both WWTFs and MS4s, the BMAP and required TMDL reductions are also enforceable through
NPDES or state permits. For non-MS4 sources, the BMAP requirements and TMDL reductions are
enforceable under Section 403.067, F.S. Furthermore, an agricultural nonpoint source discharger
included in a BMAP must demonstrate compliance with required reductions by either implementing the
appropriate best management practices (BMPs) or conducting water quality monitoring prescribed by
the department or a water management district that demonstrates compliance with state water quality
standards.
GOAL OF THE BMAP The goal of the BMAP is to restore Wakulla Springs and the Upper Wakulla River to a sustainable
biological community that is resilient to the impacts of existing and continuing human use and
development on the land from which Wakulla Springs draws its waters. The BMAP addresses
anthropogenic sources in the basin that have resulted in impairment of the ecological community of the
Upper Wakulla River to the extent that the TMDL target is met. Management strategies in the BMAP
have been developed to make progress towards the TMDL targets for allowable nitrate-nitrogen
concentration (0.35 mg/L) and recovery of the biological impairment to meet the department’s Class III
biology criteria in the impaired segment and therefore, to meet the waterbody’s designated uses.
KEY ELEMENTS OF THE BMAP This BMAP addresses the key elements required by the Florida Watershed Restoration Act (FWRA),
Chapter 403.067, F.S., including the following:
Document how the public and other stakeholders were encouraged to participate or
participated in developing the BMAP (Section 1.3.1).

FINAL Upper Wakulla River and Wakulla Springs Basin Management Action Plan – October 2015
Page xiv of xv
Identify the mechanisms by which potential future increases in pollutant loading will be
addressed (Section 0).
Document management strategies to achieve the TMDLs (Chapter 4 and Chapter 5).
Document the implementation schedule, feasible funding strategies, responsibilities,
and milestones (Chapter 4 and Chapter 5).
Identify monitoring, evaluation, and a reporting strategy to evaluate reasonable progress
over time (Section 6.3).
ANTICIPATED OUTCOMES OF BMAP IMPLEMENTATION Through the implementation of management strategies and additional source assessment in this BMAP,
stakeholders expect the following outcomes:
Continued improvement in the water quality conditions in the Upper Wakulla River and
Wakulla Springs.
Decreased loading of the target pollutant (nitrate).
Increased coordination, such as through the OSTDS Initiative and annual meetings,
among state and local governments and within divisions of local governments in
problem solving for water quality restoration.
Determination of effective management strategies through the stakeholder decision-
making and priority-setting processes.
Enhanced public awareness of pollutant sources, pollutant impacts on water quality, and
corresponding corrective actions.
Enhanced understanding of basin hydrology, water quality, and pollutant sources.
BMAP COST Costs were provided for 29 percent of the management strategies identified in the PFAs. For those
strategies with provided costs, the estimated total cost is more than $299,151,300. Of this total,
$235,873,000 has been spent on projects completed since 2004, $11,845,500 has been spent on ongoing
projects, and $51,432,800 could be spent on planned or proposed projects. In addition, costs were

FINAL Upper Wakulla River and Wakulla Springs Basin Management Action Plan – October 2015
Page xv of xv
provided for 33 percent of the strategies identified outside the PFAs, with an estimated total cost of
almost $9,520,000. Of this cost, $7,570,000 has been spent on completed projects and $1,200,000 could
be spent on proposed projects. Some of these cost estimates may include operations and maintenance
for structural projects.
The funding sources for the management strategies range from local contributions to legislative
appropriations. Stakeholders will continue to explore new opportunities for funding assistance to ensure
that the strategies listed in this BMAP can be maintained at the necessary level of effort.
BMAP FOLLOW-UP AND COMMITMENT TO IMPLEMENTATION The department will work with stakeholders to organize the monitoring data and track management
strategy implementation. The results of these efforts will be used to evaluate whether the BMAP is
effective in reducing nitrate concentrations and loads in the basin. In addition to activities for the
OSTDS Initiative, the Upper Wakulla River and Wakulla Springs stakeholders will meet approximately
annually after BMAP adoption to follow up on plan implementation, share new information, and
continue to coordinate on TMDL-related issues. More frequent meetings may be held, if needed.
The stakeholders have committed to implementing the management strategies included in this BMAP
and to work together to attain the Upper Wakulla River TMDL.

FINAL Upper Wakulla River and Wakulla Springs Basin Management Action Plan – October 2015
Page 1 of 110
Chapter 1: CONTEXT, PURPOSE, AND SCOPE OF THE PLAN
The Upper Wakulla River and Wakulla Springs Basin is located in the Big Bend area of Florida in
Gadsden, Jefferson, Leon, and Wakulla Counties. The Upper Wakulla River and Wakulla Springs are
designated as Outstanding Florida Waters (OFWs), and are important resources that have been affected
by nitrate loading from anthropogenic sources in the basin. To address nitrate impacts to the aquatic
biological community in this impaired water, the Florida Department of Environmental Protection
adopted a Total Maximum Daily Load to reduce nitrate inputs to the river and springs. The largest
source of water to the Wakulla River is Wakulla Springs. The river and springs are a very dynamic
ground water and surface water–fed system.
This Basin Management Action Plan represents the joint efforts of multiple stakeholders to prepare
strategies for water quality restoration for the Upper Wakulla River and Wakulla Springs to work
towards achieving the adopted TMDL. The BMAP includes management strategies to reduce nitrate
concentrations in the Upper Wakulla River, targeted at restoring the natural aquatic biological
community, along with a monitoring plan to guide effective long-term restoration efforts. The BMAP
was developed as part of Florida’s TMDL Program. Stakeholder involvement is critical to the success
of the TMDL Program.
Stakeholder involvement is particularly essential to develop, gain support for, and secure commitments
in a BMAP. The department invited all interested stakeholders to participate in the Upper Wakulla
River and Wakulla Springs BMAP development and facilitated participation to ensure that all voices
were heard and opinions considered. This approach resulted in the use of a phased implementation
process to achieve the TMDL targets. The first five-year BMAP iteration is expected to achieve
discernible results through the actions outlined in this document.
To determine progress towards achieving the TMDL target for the allowable nitrate-nitrogen
concentration in the impaired segment, the nitrate-nitrogen concentrations at the BMAP monitoring
stations will be evaluated using a methodology similar to that used to develop the TMDL nitrate-
nitrogen target (0.35 milligrams per liter [mg/L]). The month and monitoring station location with the
highest average concentration will be compared with the target of 0.35 mg/L to determine the percent
reduction achieved to date, and whether the target concentration has been achieved. The TMDL target

FINAL Upper Wakulla River and Wakulla Springs Basin Management Action Plan – October 2015
Page 2 of 110
for recovery from the biological impairment will be evaluated based on whether the impaired segment
meets the department’s Class III biology criteria and therefore, the waterbody’s designated uses.
This chapter describes the TMDL Program, stakeholder involvement in BMAP development, BMAP
purpose and scope, BMAP approach, the TMDL addressed, assumptions and considerations identified
during BMAP development, and future growth in the basin.
1.1 WATER QUALITY STANDARDS AND TMDLS Florida’s water quality standards are designed to ensure that surface waters can be used for their
designated purposes, such as drinking water, recreation, wildlife, habitat, and agriculture. Currently,
most surface waters in Florida, including those in the Upper Wakulla River Basin, are categorized as
Class III waters, meaning they must be suitable for recreation and must support the propagation and
maintenance of a healthy, well-balanced population of fish and wildlife. Table 1 shows all designated
use categories.
TABLE 1: DESIGNATED USE ATTAINMENT CATEGORIES FOR FLORIDA SURFACE WATERS * Class I and II waters include the uses of the classifications listed below them. ** Surface water classification for waters in the Upper Wakulla River Basin.
CATEGORY DESCRIPTION Class I* Potable water supplies Class II* Shellfish propagation or harvesting
Class III** Recreation, propagation and maintenance of a healthy, well-balanced population of fish and wildlife
Class III-Limited
Fish consumption, recreation or limited recreation, and/or propagation and maintenance of a limited population of fish and wildlife
Class IV Agricultural water supplies Class V Navigation, utility, and industrial use (no current Class V designations)
Under Section 303(d) of the federal Clean Water Act, every two years each state must identify its
“impaired” waters, including estuaries, lakes, rivers, and streams, that do not meet their designated uses
and are not expected to improve before the next 303(d) list is prepared for the basin. The department is
responsible for developing this 303(d) list of impaired waters in Florida.
Florida’s 303(d) list identifies waterbody segments that do not meet the state’s water quality standards
and are thus considered impaired. In Florida, the four most common water quality concerns are
nutrients, oxygen-demanding substances, mercury, and fecal coliforms. The 303(d)-listed waterbody
segments are candidates for more detailed assessments of water quality to determine whether they are

FINAL Upper Wakulla River and Wakulla Springs Basin Management Action Plan – October 2015
Page 3 of 110
impaired according to state statutory and rule criteria. The department develops and adopts TMDLs for
the waterbody segments it identifies as impaired and for which a causative pollutant has been identified.
A TMDL is the maximum amount of a specific pollutant that a waterbody can assimilate while
maintaining its designated uses.
The water quality evaluation and decision-making processes for listing impaired waters and establishing
TMDLs are authorized by Section 403.067, Florida Statutes (F.S.), known as the Florida Watershed
Restoration Act (FWRA), and contained in Florida’s Identification of Impaired Surface Waters Rule
(IWR) (Chapter 62-303, Florida Administrative Code [F.A.C.]). The impaired waterbody addressed in
this BMAP, the Upper Wakulla River, is a Class III water. The TMDL for the Upper Wakulla has been
established and addresses the nitrate + nitrite as the nitrogen concentration target required for this
waterbody to maintain a healthy aquatic biological community per the Class III designated use.
TMDLs are developed and implemented as part of a watershed management cycle that rotates through
the state’s 52 river basins every five years to evaluate waters, determine impairments, and develop and
implement management strategies to restore impaired waters to their designated uses. Table 2
summarizes the five phases of the watershed management cycle.
TABLE 2: PHASES OF THE WATERSHED MANAGEMENT CYCLE PHASE ACTIVITY
Phase 1 Preliminary evaluation of water quality.
Phase 2 Strategic monitoring and assessment to verify water quality impairments.
Phase 3 Development and adoption of TMDLs for waters verified as impaired.
Phase 4 Development of management strategies to achieve the TMDL(s).
Phase 5 Implementation of TMDL(s), including monitoring and assessment.
1.2 TMDL IMPLEMENTATION Rule-adopted TMDLs may be implemented through BMAPs, which contain strategies to reduce and
prevent pollutant discharges into impaired waterbodies through various cost-effective means. During
Phase 4 of the watershed management cycle, the department and the affected stakeholders in the various
basins jointly develop BMAPs or other implementation approaches. Based on practical considerations,
a basin may have more than one BMAP. The FWRA contains provisions that guide the development of
BMAPs and other TMDL implementation approaches.

FINAL Upper Wakulla River and Wakulla Springs Basin Management Action Plan – October 2015
Page 4 of 110
Stakeholder involvement is critical to the success of the TMDL Program and varies with each phase of
implementation to achieve different purposes. The BMAP development process is structured to achieve
cooperation and consensus among a broad range of interested parties. As indicated in the statute, the
department invites stakeholders to participate in the BMAP development process and encourages public
participation and consensus to the greatest practicable extent. The department must hold at least one
noticed public meeting in the basin to discuss and receive public comments during the planning process.
1.3 UPPER WAKULLA RIVER AND WAKULLA SPRINGS BMAP
1.3.1 PLAN PURPOSE AND SCOPE The purpose of this BMAP is to implement nitrate reductions to achieve the Upper Wakulla River
TMDL. This plan outlines management strategies that have provided or will provide nitrate reductions
and a schedule for implementation for the first five-year BMAP iteration. The BMAP also details a
monitoring approach to measure progress towards the nitrate target concentration and improvement in
the health of the river’s biological community. Stakeholders will meet approximately annually to
review progress made towards achieving the TMDL.
In 2009, the department adopted a nutrient TMDL for the Upper Wakulla River, the segment with
waterbody identification (WBID) number 1006. Based on potentiometric maps of ground water levels,
the Wakulla Springs springshed is located in portions of southern Georgia and Gadsden, Jefferson,
Leon, and Wakulla Counties in Florida. Based on topographic maps and surficial water features, the
Upper Wakulla River surface watershed extends into Leon and Wakulla Counties. The Upper Wakulla
River and Wakulla Springs BMAP focuses on the portion of the springshed located in Florida (see
Figure 1). The BMAP basin encompasses an area of approximately 848,445 acres, or 1,325 square
miles, which is larger than the basin area included in the TMDL. The BMAP basin boundary was
extended based on information from basin studies, potentiometric surface maps, and feedback from
stakeholders.
1.3.1.1 Priority Focus Areas In the Upper Wakulla River and Wakulla Springs Basin, two Priority Focus Areas (PFAs) were
identified to focus management strategies for the first BMAP iteration (see Figure 1). These PFAs
represent the areas in the basin where the aquifer is most vulnerable to pollutant inputs, where ground
water travels the fastest, and where there is a known connectivity between ground water pathways and

FINAL Upper Wakulla River and Wakulla Springs Basin Management Action Plan – October 2015
Page 5 of 110
Wakulla Springs. The PFAs were identified using information on the areas classified as “most” and
“more” vulnerable from the Leon County Aquifer Vulnerability Assessment (AVA) (Baker et al. 2007)
and Wakulla County AVA (Baker et al. 2009). Development of the PFA boundaries did not take
surface features or land use activities into account. The PFAs provide a guide for focusing strategies
where science suggests these efforts will best benefit the spring.
PFA1 is the primary area of concern for sources contributing to the nitrate impairment. This area has
either documented evidence or the highest probability of regularly contributing loading to the ground
water flows to Wakulla Springs. PFA1 has the highest probability for surficial infiltration and
contribution to ground water based on information in the AVA reports. This area also has the most
direct and fastest ground water travel times to Wakulla Springs, based on dye trace studies conducted in
the basin.
PFA2 is the secondary area of concern for sources contributing to the nitrate impairment. This area also
has a high probability for surficial infiltration to ground water and contribution to Wakulla Springs,
based on the AVA reports. However, this area has a more intermittent contribution to ground water
flows to the springs, based on dye trace studies in the basin.
FINAL Upper Wakulla River and Wakulla Springs Basin Management Action Plan – October 2015
Page 6 of 110
FIGURE 1: UPPER WAKULLA RIVER AND WAKULLA SPRINGS BASIN

FINAL Upper Wakulla River and Wakulla Springs Basin Management Action Plan – October 2015
Page 7 of 110
1.3.2 STAKEHOLDER INVOLVEMENT The BMAP process engages local stakeholders and promotes coordination and collaboration to address
the nitrate reductions to achieve the Upper Wakulla River TMDL. The following stakeholders are
responsible for load reductions and monitoring in the PFAs:
Agriculture.
City of Tallahassee.
Florida Department of Agriculture and Consumer Services (FDACS).
Florida Department of Environmental Protection, including Wakulla Springs State Park.
Florida Department of Health (FDOH).
FDOH in Wakulla County.
Florida Department of Transportation (FDOT) District 3.
Leon County.
Leon County Health Department.
Northwest Florida Water Management District (NWFWMD).
Wakulla County.
In addition, the following entities are responsible for load reductions in the basin but outside the PFAs:
City of Gretna.
City of Midway.
City of Quincy.
Federal Correctional Institution, Tallahassee.
FINAL Upper Wakulla River and Wakulla Springs Basin Management Action Plan – October 2015
Page 8 of 110
Florida Agricultural and Mechanical University (FAMU).
Florida State University (FSU).
Gadsden County.
Jefferson County.
Tallahassee Community College (TCC).
Talquin Electric Cooperative.
Town of Havana.
In addition to the responsible stakeholders above, several other interested parties and entities
participated in the Upper Wakulla River and Wakulla Springs BMAP meetings, as follows:
1000 Friends of Florida.
Citizens.
Florida Department of Economic Opportunity.
Friends of Wakulla Springs.
Wakulla Springs Alliance.
In January 2013, the department initiated the BMAP development process and held a series of technical
meetings involving stakeholders and the general public. The purpose of these meetings was to consult
with stakeholders to gather information about the basin and identify specific management strategies that
would reduce nitrate loading. Technical meetings were used to gather information, identify potential
sources, define management strategies currently under way or planned, and develop the BMAP contents
and actions to reduce nitrate loading with the ultimate goal of achieving the TMDL. All technical
meetings were open to the public and noticed in the Florida Administrative Register (FAR). Technical
meetings were held regularly throughout the BMAP development process on the following dates:

FINAL Upper Wakulla River and Wakulla Springs Basin Management Action Plan – October 2015
Page 9 of 110
January 18, 2013.
February 22, 2013.
March 28, 2013.
April 18, 2013.
May 16, 2013.
June 25, 2013.
August 15, 2013.
September 19, 2013.
October 31, 2013.
August 21, 2014.
In addition to technical meetings, the department met with responsible stakeholders in one-on-one
meetings to discuss different aspects of the BMAP, such as management strategies. Stakeholders were
also encouraged to contact department staff via phone and email to participate in forming the plan. A
public workshop on the BMAP was also held on August 31, 2015. The public workshop was noticed in
the Tallahassee Democrat.
Except as specifically noted in subsequent sections, this BMAP document reflects the department’s
approach to achieving the TMDL based on its research and input from stakeholders, along with public
input from workshops and meetings held to discuss key aspects of the TMDL and BMAP development.
1.3.3 BMAP APPROACH The BMAP provides for phased implementation under Paragraph 403.067(7)(a)1, F.S. The management
actions and adaptive management approach described in the BMAP will address nitrate reductions, and
the process will continue until the TMDL target is attained. The phased BMAP approach allows for the
implementation of management strategies designed to achieve incremental reductions, while
simultaneously monitoring and conducting studies to better understand the water quality dynamics in the
FINAL Upper Wakulla River and Wakulla Springs Basin Management Action Plan – October 2015
Page 10 of 110
basin. The total reductions to achieve the Upper Wakulla River TMDL will be addressed in five-year
increments.
A nitrogen source inventory and loading tool (NSILT) was developed in support of the BMAP decision
making process (Section 3.3). The NSILT was developed from an extensive review of literature on
nitrogen sources and migration/transformation to the aquifer and eventually to the Upper Wakulla River
and Wakulla Springs. The NSILT provides the best available assessment of where nitrogen is currently
being applied in the BMAP area and is contributing to elevated nitrogen concentrations in the Upper
Wakulla River and Wakulla Springs Basin. The NSILT is intended to assist stakeholders and the
department in identifying locations where future projects will have the greatest impact in reducing
nitrogen loads.
Since the TMDL assessment period, the largest sources of loading to the Upper Wakulla River and
Wakulla Springs, which comprise the city of Tallahassee’s wastewater treatment facility (WWTF) and
Southeast Spray Field (SESF), have been upgraded to reduce nitrate concentrations applied to the land
surface. Current data indicate that these upgrades have reduced total nitrogen (TN) loading to the SESF
by 80 percent, or about 214,939 kilograms per year (kg/yr) (Section 4.1.1 for more details). The Upper
Wakulla River and Wakulla Springs Basin is a ground water–driven system, resulting in a lag time
between nitrate reductions from management strategy implementation and a change in water quality in
the river and springs. Therefore, further reductions in nitrate concentrations are expected in the river
and springs due to the completed actions.
Given the progress in load reductions made to date, and the need for further monitoring to determine to
what extent additional reductions are needed, this BMAP used a sufficiency-of-effort evaluation rather
than detailed allocations to move forward with reductions in the first five-year iteration. It is not
currently feasible to assign detailed allocations for nutrient loads to surface water and ground water in
the PFAs. At present, the specific load reductions needed from management strategies benefiting the
springshed were not calculated due to the complexities of fate and transport of pollutants in the
springshed and the uncertainty associated with expected reductions from some measures.
Using information on sources in the basin (see Section 3.1), stakeholders in the PFAs were asked to
submit management strategies to reduce nitrate loading from the sources they are responsible for
managing. The department then compared the strategies provided with the sources in the PFAs to
FINAL Upper Wakulla River and Wakulla Springs Basin Management Action Plan – October 2015
Page 11 of 110
evaluate whether each of the existing sources was sufficiently addressed for the first BMAP iteration
and whether strategies were in place or would be put into place to reduce future nitrate sources. Where
needed, the department requested additional details and strategies from the responsible stakeholders to
ensure sufficiency for the first BMAP iteration.
Collectively, the management strategies included in the BMAP are sufficient to address nitrate loading
in the PFAs to the Upper Wakulla River and Wakulla Springs Basin over the next five years. Chapter 4
describes these strategies. Stakeholders outside the PFAs also provided management strategies,
described in Chapter 5. After Year 4 of BMAP implementation, the department will evaluate available
water quality data to determine progress towards the nitrate target. Discussions will then be held with
responsible stakeholders to identify additional strategies for the next BMAP iteration, as needed.
1.3.4 ONSITE SEWAGE TREATMENT AND DISPOSAL SYSTEMS (OSTDS) INITIATIVE With the major reductions made in WWTF loading in the basin, OSTDS presently contribute more
nitrogen to ground water than all other source categories evaluated in the BMAP area. The department
understands that the selection of management strategies to reduce OSTDS loads requires sufficient time
for stakeholders to consult with local decision makers, plan implementation timelines, consider funding
sources—especially state and federal grant funding—and budget available funds. To reduce this source
of loading in the future, the department, along with FDOH, the city of Tallahassee, Leon County,
Wakulla County, and other parties, will develop a comprehensive and sustainable plan with nitrogen-
reducing projects that focus on OSTDS sources. This plan will be developed through the OSTDS
Initiative.
The objective of the OSTDS Initiative is to identify effective, financially feasible strategies to reduce
existing loading and prevent future nutrient loading from OSTDS sources. The department and
stakeholders will identify options for addressing OSTDS loading, identify effective management and
engineering strategies to reduce loading from OSTDS in the Upper Wakulla River and Springs Basin,
establish education and outreach programs that provide area residents with information about OSTDS
systems and their effect on Wakulla Springs, determine responsibilities and legal parameters, and
identify funding sources and an implementation schedule for the management strategies and any facility
construction.

FINAL Upper Wakulla River and Wakulla Springs Basin Management Action Plan – October 2015
Page 12 of 110
The OSTDS Initiative will result in comprehensive and sustainable management and engineering
strategies for nitrogen reduction from OSTDS for Leon County, Wakulla County, and the city of
Tallahassee as applicable. These projects can be separate, shared, or implemented in collaboration with
any combination of these jurisdictions.
1.3.4.1 General Direction for the OSTDS Initiative The department will facilitate the organization of an advisory committee that will include
representatives from FDOH, Leon County, Wakulla County, the city of Tallahassee, and other vested
stakeholders such as homeowners, private utilities, and environmental or community groups, from the
Wakulla Springs BMAP area. This advisory committee, which has no binding authority upon any
individual entity, will be tasked with three main objectives, as follows, to meet the goal of developing
and implementing management strategies necessary to reduce nutrient loading from OSTDS in a
realistic time frame:
1. Identify, collect, and evaluate credible scientific information pertinent to the nutrient
impact of OSTDS on Wakulla Springs.
2. Develop a public education plan that at a minimum provides area residents with
reliable and understandable information about OSTDS systems and their effect on
Wakulla Springs.
3. Develop an OSTDS plan that identifies cost-effective and financially feasible projects
that target nutrient load reductions from OSTDS systems needed to implement the
TMDL.
An initial technical meeting will be held within three months of BMAP adoption to present the
methodology and geographic information system (GIS) data to prioritize areas where OSTDS pose the
greatest risk based on the number of these systems in aggregate, soil drainage conditions, aquifer and
surface water vulnerability, proximity to the spring, and ground water travel time
Within three years from the date of BMAP adoption, the advisory committee, in conjunction with the
department, will finalize an OSTDS plan that identifies specific projects and schedules to achieve
nutrient load reductions. The plan will be adopted as part of the BMAP and will be consistent with
BMAP obligations required in a National Pollutant Discharge Elimination System (NPDES) municipal

FINAL Upper Wakulla River and Wakulla Springs Basin Management Action Plan – October 2015
Page 13 of 110
separate storm sewer system (MS4) permit. The advisory committee may consider as necessary the
following components in order to achieve the load reductions:
The inventory and geographic distribution of OSTDS in the priority areas, including
Leon County’s Primary Springshed Protection Zone and Wakulla County’s Primary
Springshed Protection Zone. Existing systems and areas where future growth is
expected should be included.
Existing and planned wastewater treatment and collection facilities, including the
parcels currently being served and existing and design capacities.
The nutrient reductions from OSTDS necessary to achieve the TMDL.
Projects that are in process, shovel-ready prior to the end of this first five-year BMAP
cycle, and in priority geographic areas. A list of these projects and management
strategies, including a schedule for implementation, will be submitted to the department
and as appropriate, incorporated into the OSTDS plan.
Reduction goals may be achieved in multiple ways, including the connection of existing
OSTDS to central WWTFs, the use of cluster systems, educational strategies,
requirements for new development to be served by central wastewater service, the
adoption of technologies recommended by FDOH’s Nitrogen Reduction Study, or other
strategies that may be appropriate. The strategies will be prioritized based on their
effectiveness and feasibility, taking into account the financial needs of local service
providers and impacts on homeowners.
Projects in any long-range capital plans, including consideration of wastewater
management or facilities plan(s).
The timing of the implementation of plan components may change depending on legislative direction,
state and local funding, and the potential use of the Resources and Ecosystems Sustainability, Tourist
Opportunities and Revived Economies of the Gulf Coast States (RESTORE) Act. This plan will be
reviewed and updated annually to include flexibility to substitute projects due to funding availability.

FINAL Upper Wakulla River and Wakulla Springs Basin Management Action Plan – October 2015
Page 14 of 110
1.3.5 POLLUTANT REDUCTION AND DISCHARGE ALLOCATIONS
1.3.5.1 Categories for Rule Allocations The rules adopting TMDLs must establish reasonable and equitable allocations that will alone, or in
conjunction with other management and restoration activities, attain the TMDLs. Allocations may be to
individual sources, source categories, or basins that discharge to the impaired waterbody. The
allocations in rule identify either how much pollutant discharge each source designation may continue to
contribute (discharge allocation), or the load or percentage of its loading the source designation must
reduce (reduction allocation). Currently, the TMDL allocation categories are as follows:
Wasteload Allocation (WLA) is the allocation to point sources permitted under the
NPDES Program. It includes the following:
o Wastewater Allocation is the discharge allocation to industrial and domestic WWTFs.
o NPDES Stormwater Allocation is the allocation to NPDES stormwater permittees that
operate MS4s. These permittees are treated as point sources under the TMDL
Program.
Load Allocation (LA) is the allocation to nonpoint sources, including agricultural
runoff and stormwater from areas that are not included in an MS4 permit.
The TMDL did not specify WLAs to NPDES WWTFs or MS4s because there are no WWTFs and MS4s
with discharges into the Upper Wakulla River WBID (Department 2012a). However, this BMAP
includes WWTFs and MS4s discharges in the Upper Wakulla River and Wakulla Springs Basin.
1.3.5.2 Allocations Implemented by the BMAP The FWRA, Section 403.067, F.S., states that the BMAP must equitably allocate pollutant reductions to
individual basins, as a whole to all basins, or to each identified point source or category of nonpoint
sources, as appropriate. Allocations are determined based on a number of factors listed in the FWRA,
including cost-benefit, technical and environmental feasibility, implementation time frames, and others.
The adopted TMDL (see Section 1.3.6) sets the allocations, as a percent reduction, to the nonpoint
source category (LA) to achieve the target concentration of 0.35 mg/L of nitrate + nitrite in the Upper
Wakulla River. This BMAP implements the TMDL allocations for the nonpoint sources by assigning
the TMDL target as a whole to all basins. However, the BMAP initially focuses on achieving the
FINAL Upper Wakulla River and Wakulla Springs Basin Management Action Plan – October 2015
Page 15 of 110
TMDL target in the PFAs, and includes more stringent nitrogen limitations for WWTFs that discharge to
land surface infiltration and contribute nitrogen loading to ground water in PFA1. More detailed
allocations may be developed, if needed, for the next BMAP iteration.
The main sources of loading to the Upper Wakulla River come from the surrounding springshed, and the
0.35 mg/L nitrate + nitrite target concentration is also the criterion for springs. Therefore, the reductions
associated with the strategies in this BMAP will improve the quality of both the Upper Wakulla River
and Wakulla Springs.
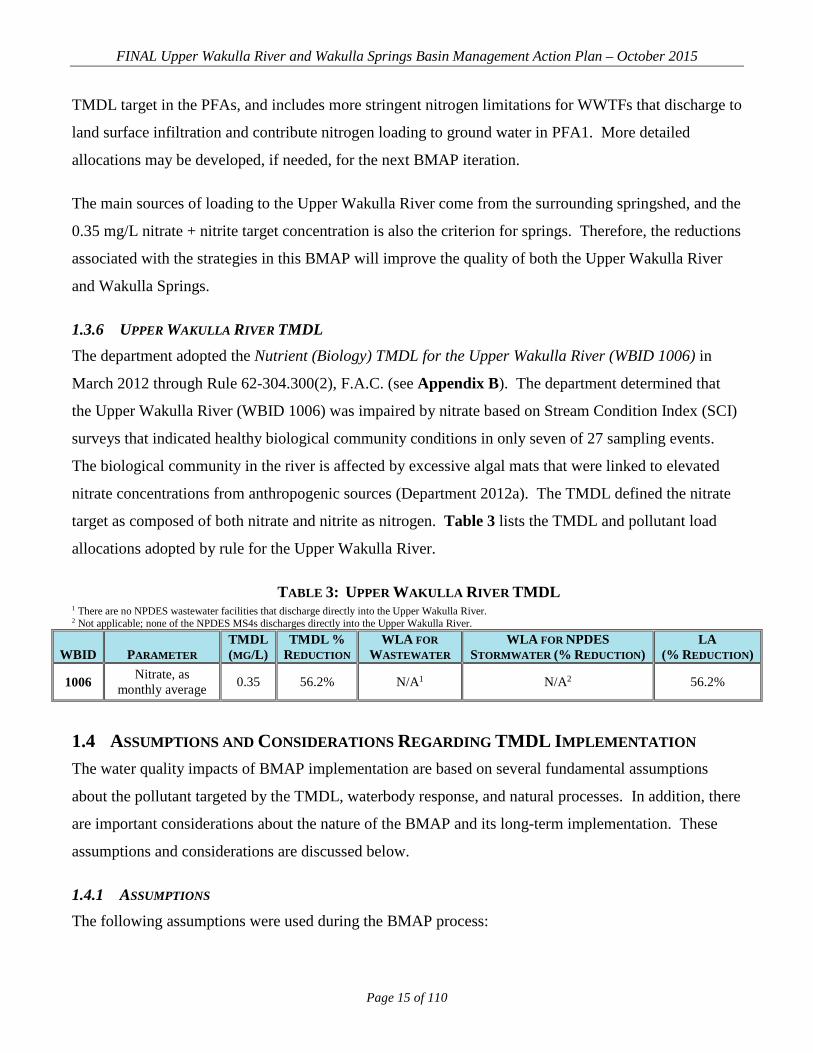
1.3.6 UPPER WAKULLA RIVER TMDL The department adopted the Nutrient (Biology) TMDL for the Upper Wakulla River (WBID 1006) in
March 2012 through Rule 62-304.300(2), F.A.C. (see Appendix B). The department determined that
the Upper Wakulla River (WBID 1006) was impaired by nitrate based on Stream Condition Index (SCI)
surveys that indicated healthy biological community conditions in only seven of 27 sampling events.
The biological community in the river is affected by excessive algal mats that were linked to elevated
nitrate concentrations from anthropogenic sources (Department 2012a). The TMDL defined the nitrate
target as composed of both nitrate and nitrite as nitrogen. Table 3 lists the TMDL and pollutant load
allocations adopted by rule for the Upper Wakulla River.
TABLE 3: UPPER WAKULLA RIVER TMDL 1 There are no NPDES wastewater facilities that discharge directly into the Upper Wakulla River. 2 Not applicable; none of the NPDES MS4s discharges directly into the Upper Wakulla River.
WBID PARAMETER TMDL (MG/L)
TMDL % REDUCTION
WLA FOR WASTEWATER
WLA FOR NPDES STORMWATER (% REDUCTION)
LA (% REDUCTION)
1006 Nitrate, as monthly average 0.35 56.2% N/A1 N/A2 56.2%
1.4 ASSUMPTIONS AND CONSIDERATIONS REGARDING TMDL IMPLEMENTATION The water quality impacts of BMAP implementation are based on several fundamental assumptions
about the pollutant targeted by the TMDL, waterbody response, and natural processes. In addition, there
are important considerations about the nature of the BMAP and its long-term implementation. These
assumptions and considerations are discussed below.
1.4.1 ASSUMPTIONS The following assumptions were used during the BMAP process:

FINAL Upper Wakulla River and Wakulla Springs Basin Management Action Plan – October 2015
Page 16 of 110
Reductions in nitrate concentrations in the Upper Wakulla River and Wakulla Springs
will result in improved biological communities, including a reduction in the amount of
algae present in the river.
The largest source of nitrate loading to the Upper Wakulla River is through Wakulla
Springs. Therefore, management strategies that reduce nitrate loading to ground water
were the priority for this BMAP iteration, including more stringent nitrogen limitations
for WWTFs that discharge to land surface infiltration and contribute nitrogen loading to
ground water in PFA1.
The scope of the TMDL did not include the adjacent Wakulla Springs vent area (WBID
1006X), and therefore these waters are not applicable for determining achievement of
the restoration targets. Although the TMDL did not include the upstream Wakulla
Springs vent area, the BMAP incorporates Wakulla Springs and its contributing
springshed in the BMAP area. This is based on the integral role of the springshed as the
primary source of water inflow to the Upper Wakulla River.
The BMAP focuses on reductions and management strategies in two PFAs. The PFAs
were identified using best available information on the most vulnerable aquifer areas
and ground water pathways to determine where management strategies would be most
beneficial to improving water quality in the Upper Wakulla River and Wakulla Springs.
Pollutant loads contributed in the PFAs are considered to result in the largest magnitude
and most immediate impacts to the Upper Wakulla River. In future iterations, the PFAs
may be refined using the latest data. The areas of the basin outside the PFAs also
contribute loading to the river and springs, but to a much lesser magnitude than the
areas in the PFAs. Depending on water quality changes in the Upper Wakulla River
and Wakulla Springs, additional management strategies in the area outside the PFAs
may be required in future BMAP iterations.
1.4.2 CONSIDERATIONS This BMAP requires that all stakeholders in the basin implement the management strategies set forth in
this document within the first five-year BMAP cycle. However, the full attainment of the TMDL target
will be a long-term process. In evaluating the need for future projects from individual entities, the

FINAL Upper Wakulla River and Wakulla Springs Basin Management Action Plan – October 2015
Page 17 of 110
department will take into consideration past reduction efforts from particular sources. While many of
the projects and activities contained in the BMAP are recently completed or currently ongoing, many
projects will require time to design, secure funding, and construct. However, funding was considered, to
the extent practicable, when determining the schedule for meeting BMAP requirements. Although
strategic funding can be problematic, funding limitations do not affect the requirement that each entity in
the PFAs must implement the management strategies listed in the BMAP in order to cumulatively
achieve water quality standards.
However, the full implementation of this BMAP will be a long-term process, adaptively managed in
five-year cycles. Since BMAP implementation is a long-term process, the TMDL established for the
basin will likely not be achieved in the first five-year iteration. It is understood that waterbodies can
respond differently to the reduced concentrations and loading. Regular follow-up and continued
coordination and communication by stakeholders will be essential to ensure the implementation of
management strategies and assessment of effects. Additional management strategies required to achieve
the TMDL will, if necessary, be developed as part of the second BMAP iteration. During the BMAP
process, the following items were identified that could be addressed in future watershed management
cycles to ensure that future BMAPs use the most accurate information:
Water Quality Standards – Since the department adopted the Upper Wakulla River
TMDL, numeric nutrient criteria (NNC) were established for both streams and springs.
For future evaluations to determine whether the Upper Wakulla River and Wakulla
Springs Basin is meeting water quality standards, the department will use these NNC.
The BMAP monitoring plan (see Section 6.3) was designed to collect the data
necessary for these new evaluations. These standards require both the TMDL target
nitrate concentration and a healthy biological community to be attained to meet the
TMDL. If the nutrient target has been achieved but the biological community is not
responding, the Upper Wakulla River would still be considered impaired. The
department would then have to determine if the nitrate target should be modified or if
another factor is causing the impairment.
Basin Boundary – The BMAP basin boundary was determined using information from
studies in the basin that delineated boundaries based on potentiometric surface data,
FINAL Upper Wakulla River and Wakulla Springs Basin Management Action Plan – October 2015
Page 18 of 110
water level measurements, and dye trace studies. The available boundaries were
compiled by the department, and the BMAP basin boundary was identified with input
from stakeholders. In future iterations of the BMAP, the basin boundaries may be
modified based on new evidence and better science.
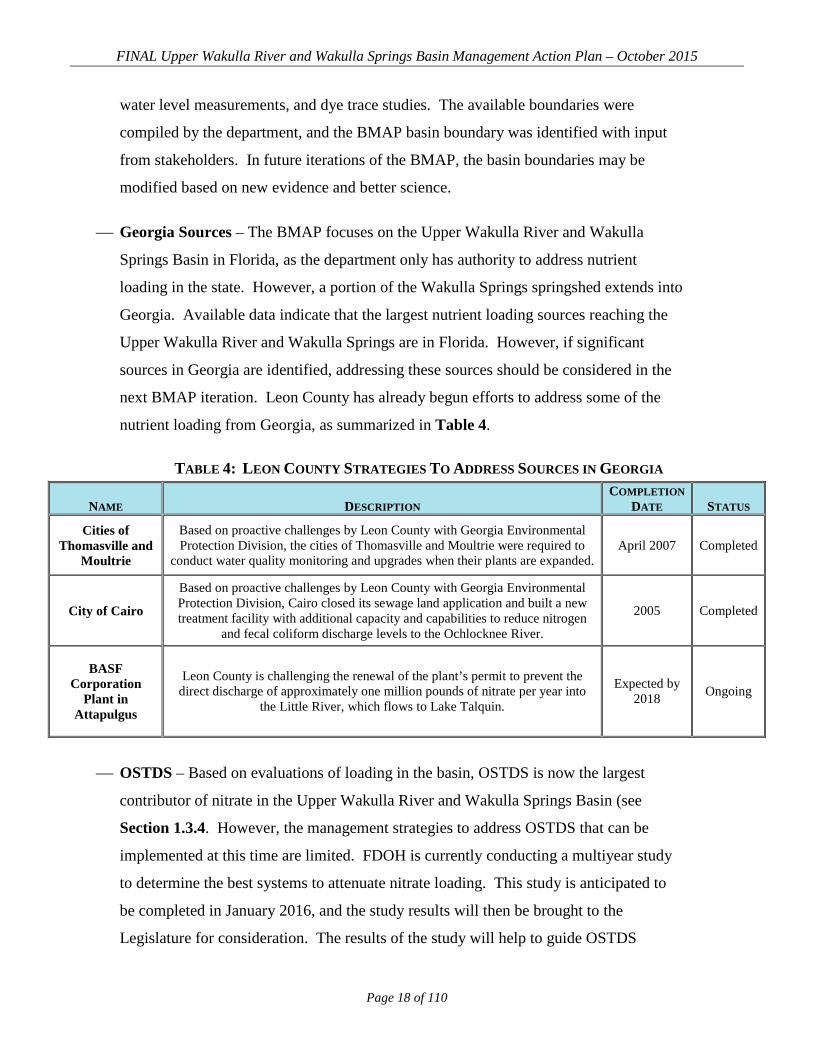
Georgia Sources – The BMAP focuses on the Upper Wakulla River and Wakulla
Springs Basin in Florida, as the department only has authority to address nutrient
loading in the state. However, a portion of the Wakulla Springs springshed extends into
Georgia. Available data indicate that the largest nutrient loading sources reaching the
Upper Wakulla River and Wakulla Springs are in Florida. However, if significant
sources in Georgia are identified, addressing these sources should be considered in the
next BMAP iteration. Leon County has already begun efforts to address some of the
nutrient loading from Georgia, as summarized in Table 4.
TABLE 4: LEON COUNTY STRATEGIES TO ADDRESS SOURCES IN GEORGIA
NAME DESCRIPTION COMPLETION
DATE STATUS
Cities of Thomasville and
Moultrie
Based on proactive challenges by Leon County with Georgia Environmental Protection Division, the cities of Thomasville and Moultrie were required to
conduct water quality monitoring and upgrades when their plants are expanded. April 2007 Completed
City of Cairo
Based on proactive challenges by Leon County with Georgia Environmental Protection Division, Cairo closed its sewage land application and built a new treatment facility with additional capacity and capabilities to reduce nitrogen
and fecal coliform discharge levels to the Ochlocknee River.
2005 Completed
BASF Corporation
Plant in Attapulgus
Leon County is challenging the renewal of the plant’s permit to prevent the direct discharge of approximately one million pounds of nitrate per year into
the Little River, which flows to Lake Talquin.
Expected by 2018 Ongoing
OSTDS – Based on evaluations of loading in the basin, OSTDS is now the largest
contributor of nitrate in the Upper Wakulla River and Wakulla Springs Basin (see
Section 1.3.4. However, the management strategies to address OSTDS that can be
implemented at this time are limited. FDOH is currently conducting a multiyear study
to determine the best systems to attenuate nitrate loading. This study is anticipated to
be completed in January 2016, and the study results will then be brought to the
Legislature for consideration. The results of the study will help to guide OSTDS

FINAL Upper Wakulla River and Wakulla Springs Basin Management Action Plan – October 2015
Page 19 of 110
management strategies in the basin. In the meantime, the department will work with
responsible local stakeholders and FDOH in the OSTDS Initiative (see Section 1.3.4) to
identify appropriate management strategies and funding sources to address OSTDS
loading.
Authority To Address OSTDS – To successfully implement the strategies that will be
identified through the OSTDS Initiative, some stakeholders have expressed a need for
the authority for local governments to address OSTDS loading, and this authority will
need to come from the Florida Legislature. Any rules initiated by stakeholders cannot
be less stringent than any state rules for OSTDS. During the first BMAP iteration,
proposed legislation may be drafted by local stakeholders, in collaboration with
interested parties, such as the Wakulla Springs Alliance.
Lake Swallets –Several lakes in the basin have known sinkholes that drain to ground
water. In the next BMAP iteration, if data are available, the nitrate loads from these
lakes could be considered and management strategies to address the loading identified,
as needed.
Management Strategy Implementation – The department will consider the
management strategies listed in this BMAP and the associated nitrogen reductions in the
next BMAP iteration when identifying the additional load reductions required to meet
the TMDL and which sources should implement strategies to achieve the necessary
reductions.
Increases in Wastewater Volume in the PFAs – Through future development and the
connection of OSTDS to central wastewater treatment systems, the amount of treated
wastewater discharged in the PFAs may increase. The department will evaluate if there
is a net increase in treated wastewater discharge in the PFAs as part of the OSTDS
Initiative, and determine if additional strategies are needed to address any additional
wastewater loading for the second BMAP iteration.

FINAL Upper Wakulla River and Wakulla Springs Basin Management Action Plan – October 2015
Page 20 of 110
1.5 FUTURE GROWTH IN THE WATERSHED The FWRA requires BMAPs to “identify the mechanisms by which potential future increases in
pollutant loading will be addressed.” Since the TMDL reductions are based on decreasing loads from
past development, it is important that loads from new development are well controlled. Although future
development may meet state and local standards, the development may still add nutrient loading to the
Upper Wakulla River and Wakulla Springs Basin. To ensure that future growth does not add to the
degradation of these waterbodies, local governments must be proactive in controlling loads from future
growth.
This BMAP relies on strategies from stakeholders that help to minimize loading from future sources.
The city of Tallahassee and Leon County have enacted ordinances to establish a Primary Springs
Protection Zone (PSPZ) that reduces development in the urban fringe in the PSPZ and allows
development in the urban area only to the extent permitted by the future land use map. Wakulla County
has a similar ordinance that establishes the Wakulla Springs Special Planning Area (see Figure 2).
Wakulla County has a comprehensive plan policy that requires advanced wastewater treatment (AWT)
(3 mg/L for TN) for any WWTF or spray field located in the special planning area. Leon County has
proposed an amendment to its code to require AWT in the PSPZ for any WWTF.
The city of Tallahassee, Leon County, and Wakulla County each have fertilizer use ordinances.
Tallahassee and Leon County have existing education and outreach programs to educate the public about
fertilizer use, and Wakulla County will add public outreach activities. The city of Tallahassee and Leon
County also have pet waste management ordinances to help reduce impacts from pet waste in the basin.
Leon County adopted countywide land development regulations, which include the city of Tallahassee,
that exceed state stormwater standards, and the county is also planning to create a low-impact
development (LDI) ordinance to further address loads from new development. Wakulla County has
comprehensive land use policies for certain future developments in the county, such as the Northeast
Wakulla Sustainable Community, tjat require higher stormwater treatment levels and a no net increase in
nutrients. FDOT has a program to avoid mapped karst caves when constructing stormwater treatment
ponds that will help to reduce loading to ground water from future projects. Wakulla Springs State Park
also has educational and outreach programs to educate the public about the importance of the river and
springs.

FINAL Upper Wakulla River and Wakulla Springs Basin Management Action Plan – October 2015
Page 21 of 110
In addition to the items that will be developed through the OSTDS Initiative (see Section 1.3.4), Leon
County has proposed an effort to sewer in the PSPZ, if funding becomes available. Leon County is also
proposing to modify its code for OSTDS, as needed, based on the results of the FDOH study. Wakulla
County has an adopted Comprehensive Plan policy requiring advanced nitrogen reducing onsite systems
on parcels of certain sizes. Wakulla County is also proposing to sewer three historical neighborhoods, if
funding becomes available, removing approximately 2,251 OSTDS that could occur through future
development, in addition to the 1,330 OSTDS already in use.
The strategies listed above would help to reduce nitrate loading from future development for a variety of
sources. The sufficiency of this BMAP relies on these management strategies.
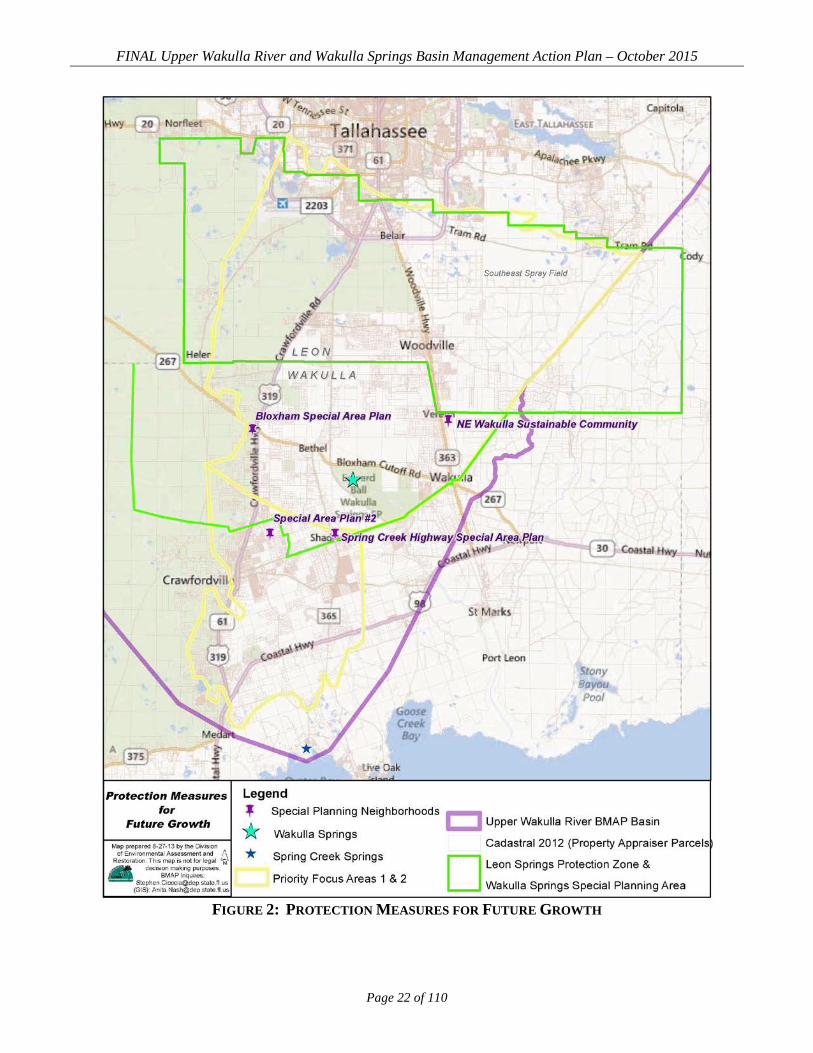
FINAL Upper Wakulla River and Wakulla Springs Basin Management Action Plan – October 2015
Page 22 of 110
FIGURE 2: PROTECTION MEASURES FOR FUTURE GROWTH

FINAL Upper Wakulla River and Wakulla Springs Basin Management Action Plan – October 2015
Page 23 of 110
Chapter 2: UPPER WAKULLA RIVER AND WAKULLA SPRINGS BASIN SETTING
2.1 LAND USE COVERAGE Land cover categories for the Upper Wakulla River and Wakulla Springs Basin were aggregated using
the simplified Level 1 codes, shown in Table 5. Natural lands including upland nonforested, upland
forests, water, and wetlands make up 84.1 percent of the acreage in the basin. Urban land uses including
urban and built-up; barren land; and transportation, communication, and utilities makes up 9.1 percent of
the basin. The remaining 6.7 percent is agricultural land uses. Figure 3 shows the distribution of land
uses in the Upper Wakulla River and Wakulla Springs Basin.
TABLE 5: 2009 LAND COVER IN THE UPPER WAKULLA RIVER AND WAKULLA SPRINGS BASIN - = Empty cell/no data
LEVEL 1 LAND COVER CODE LAND COVER DESCRIPTION ACRES % TOTAL
1000 Urban and Built-Up 66,045.7 7.8% 2000 Agriculture 57,105.6 6.7% 3000 Upland Nonforested 51,270.2 6.0% 4000 Upland Forests 449,521.9 53.0% 5000 Water 19,838.5 2.3% 6000 Wetlands 193,613.0 22.8% 7000 Barren Land 806.5 0.1% 8000 Transportation, Communication, and Utilities 10,255.2 1.2%
- TOTAL 848,456.6 100.0% In PFA1, 88.8 percent of the area is natural lands, 7.9 percent is urban lands, and 3.4 percent is
agricultural lands, as shown in Table 6.
TABLE 6: 2009 LAND COVER IN PFA1 - = Empty cell/no data
LEVEL 1 LAND
COVER CODE LAND COVER DESCRIPTION ACRES % TOTAL 1000 Urban and Built-Up 5,435.0 5.3% 2000 Agriculture 3,508.6 3.4% 3000 Upland Nonforested 9,294.4 9.0% 4000 Upland Forests 73,194.9 70.8% 5000 Water 918.9 0.9% 6000 Wetlands 8,318.7 8.1% 7000 Barren Land 179.9 0.2% 8000 Transportation, Communication, and Utilities 2,476.9 2.4%
- TOTAL 103,327.3 100.0%

FINAL Upper Wakulla River and Wakulla Springs Basin Management Action Plan – October 2015
Page 24 of 110
In PFA2, 77.6 percent of the area is natural lands, 15.3 percent is urban lands, and 7.0 percent is
agricultural lands, as shown in Table 7.
TABLE 7: 2009 LAND COVER IN PFA2 - = Empty cell/no data
LEVEL 1 LAND
COVER CODE LAND COVER DESCRIPTION ACRES % TOTAL 1000 Urban and Built-Up 4,285.7 14.4% 2000 Agriculture 2,095.9 7.0% 3000 Upland Nonforested 2,477.1 8.3% 4000 Upland Forests 17,510.1 58.9% 5000 Water 161.1 0.5% 6000 Wetlands 2,956.2 9.9% 7000 Barren Land 47.3 0.2% 8000 Transportation, Communication, and Utilities 207.6 0.7%
- TOTAL 29,741.0 100.0% For the portion of the basin outside the PFAs, 83.8 percent is natural lands, 9.1 percent is urban lands,
and 7.2 percent is agricultural lands, as shown in Table 8.
TABLE 8: 2009 LAND COVER IN THE BASIN OUTSIDE THE PFAS - = Empty cell/no data
LEVEL 1 LAND COVER CODE LAND COVER DESCRIPTION ACRES % TOTAL
1000 Urban and Built-Up 56,325.0 7.9% 2000 Agriculture 51,501.1 7.2% 3000 Upland Nonforested 39,498.7 5.5% 4000 Upland Forests 358,816.9 50.2% 5000 Water 18,758.5 2.6% 6000 Wetlands 182,338.1 25.5% 7000 Barren Land 579.3 0.1% 8000 Transportation, Communication, and Utilities 7,570.7 1.1%
- TOTAL 715,388.3 100.0%
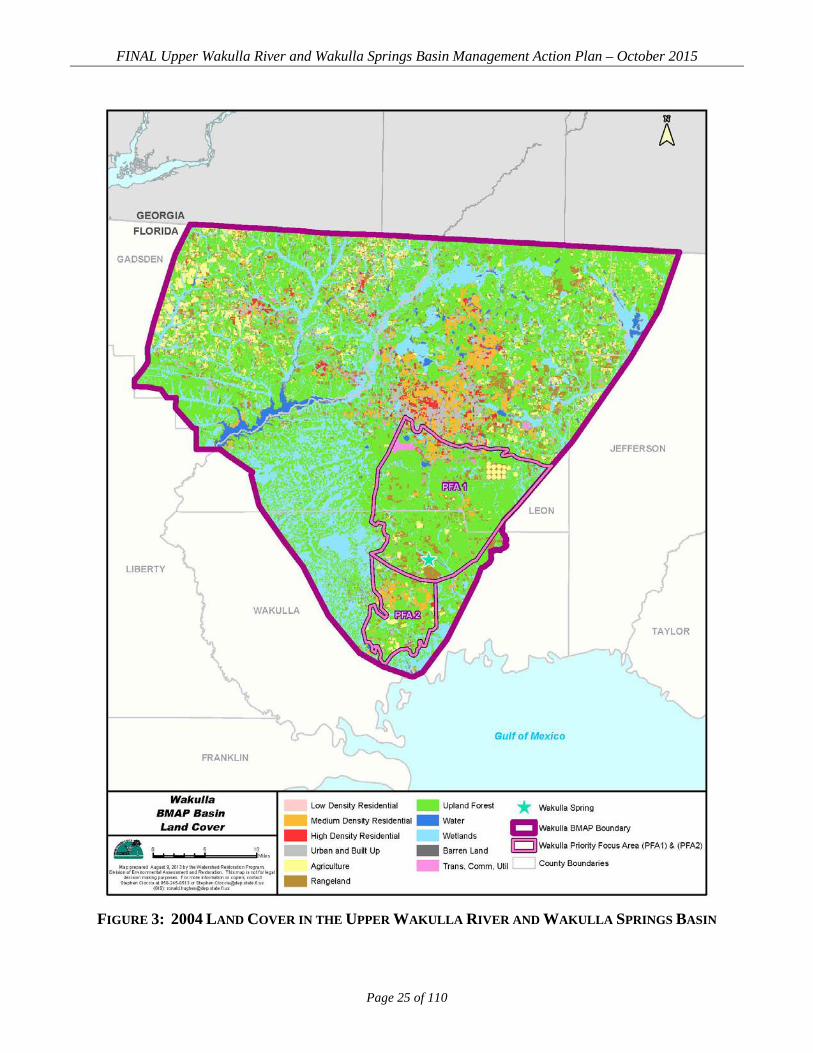
FINAL Upper Wakulla River and Wakulla Springs Basin Management Action Plan – October 2015
Page 25 of 110
FIGURE 3: 2004 LAND COVER IN THE UPPER WAKULLA RIVER AND WAKULLA SPRINGS BASIN

FINAL Upper Wakulla River and Wakulla Springs Basin Management Action Plan – October 2015
Page 26 of 110
2.2 HYDROLOGY In the Wakulla springshed, ground water occurs primarily in the Floridan aquifer, a vast carbonate
aquifer system that is present throughout virtually all of Florida, as well as southern parts of Alabama
and Georgia. The Floridan is the source of water for potable supply, irrigation, and industrial uses
throughout most of the region. Wakulla Springs, located in the Ocala Karst District of the Woodville
Karst Plain, is the primary source of the Wakulla River. In the Wakulla River watershed, the Cody
Scarp generally separates the semiconfined and unconfined geologic areas. In the northernmost portion
of the Wakulla springshed, the Floridan aquifer is confined by a thick overburden of sediment and/or
clay that helps to protect against contamination. Moving southward, breaches are present in the
confining layer, mainly sinkholes, which provide pathways for recharge and the introduction of
contaminants. The unconfined or poorly confined regions of the Floridan aquifer (regions with less than
25 feet of sediment cover) extend slightly north of the Cody Scarp into the southern part of the city of
Tallahassee urban area and southward towards the Gulf Coast.
This southern portion of the springshed is situated in the Woodville Karst Plain, which is part of the
Gulf Coastal Lowland physiographic region. It extends from the southern edge of the city of
Tallahassee to the Gulf of Mexico, in southeastern Leon County and eastern Wakulla County. Its
northern border, the Cody Scarp, formed about 100,000 years when ocean levels rose. Capped by less
than 20 feet of quartz sands, the Woodville Karst Plain gently slopes toward the Gulf. The porous sands
allow water to move rapidly to the underlying soluble carbonates (limestone) that are present at or near
the land surface, recharging the Floridan aquifer in the area. Over time, this acidic water has dissolved
the limestone, resulting in karst terrain characterized by abundant springs, sinks, sinking streams, karst
windows (collapsed segments of underground streams), swallets (caves or holes that swallow a stream),
and dolines (collapsed caves), in addition to a well-developed system of tunnels or conduits.
These features result in areas where ground water has direct access from the surface (via sinkholes) and
surface waters whose pathways often flow beneath the sand and limestone surface layer (sinking
streams), merging with ground water. The karst subsurface is also characterized by expansive areas of
extremely porous formations, due to this limestone surface layer dissolution. This results in a large and
extensive cave system and tunnel/conduit network that provides direct pathways and allows short travel
times for surface runoff through ground water to the spring vent at the headwaters of the Wakulla River
(Peer Review Committee 2005). As reported by Kincaid (2010), the efforts of numerous underwater
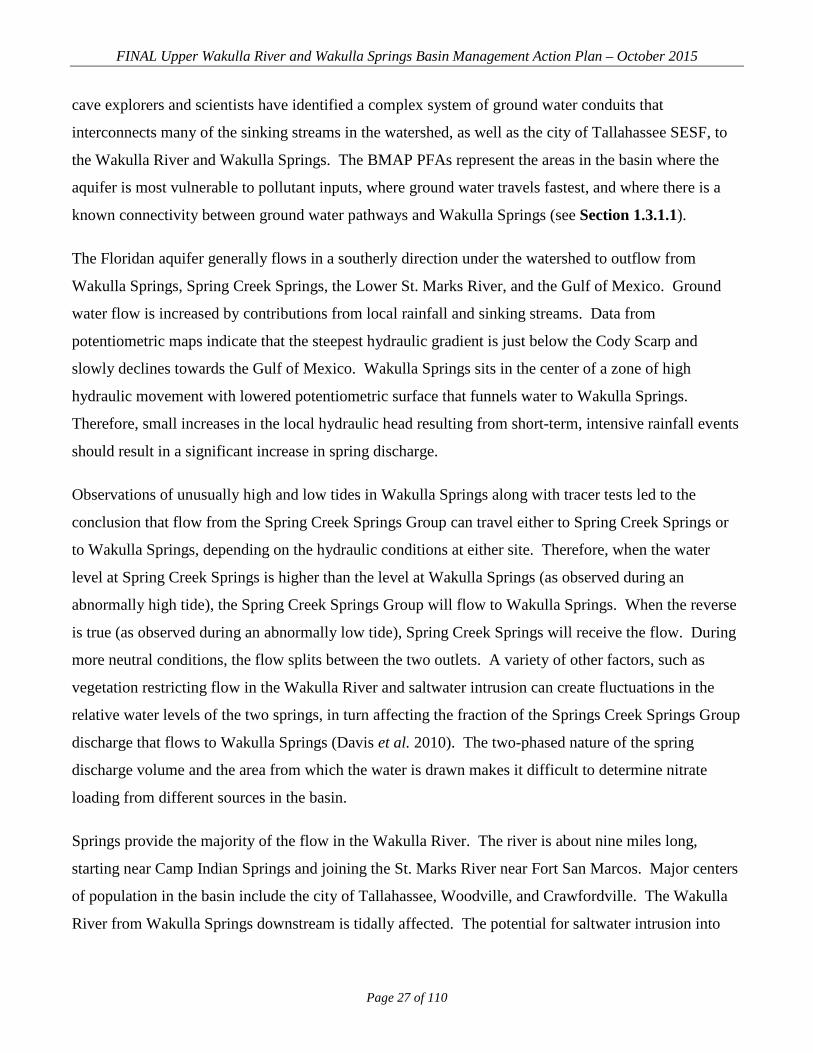
FINAL Upper Wakulla River and Wakulla Springs Basin Management Action Plan – October 2015
Page 27 of 110
cave explorers and scientists have identified a complex system of ground water conduits that
interconnects many of the sinking streams in the watershed, as well as the city of Tallahassee SESF, to
the Wakulla River and Wakulla Springs. The BMAP PFAs represent the areas in the basin where the
aquifer is most vulnerable to pollutant inputs, where ground water travels fastest, and where there is a
known connectivity between ground water pathways and Wakulla Springs (see Section 1.3.1.1).
The Floridan aquifer generally flows in a southerly direction under the watershed to outflow from
Wakulla Springs, Spring Creek Springs, the Lower St. Marks River, and the Gulf of Mexico. Ground
water flow is increased by contributions from local rainfall and sinking streams. Data from
potentiometric maps indicate that the steepest hydraulic gradient is just below the Cody Scarp and
slowly declines towards the Gulf of Mexico. Wakulla Springs sits in the center of a zone of high
hydraulic movement with lowered potentiometric surface that funnels water to Wakulla Springs.
Therefore, small increases in the local hydraulic head resulting from short-term, intensive rainfall events
should result in a significant increase in spring discharge.
Observations of unusually high and low tides in Wakulla Springs along with tracer tests led to the
conclusion that flow from the Spring Creek Springs Group can travel either to Spring Creek Springs or
to Wakulla Springs, depending on the hydraulic conditions at either site. Therefore, when the water
level at Spring Creek Springs is higher than the level at Wakulla Springs (as observed during an
abnormally high tide), the Spring Creek Springs Group will flow to Wakulla Springs. When the reverse
is true (as observed during an abnormally low tide), Spring Creek Springs will receive the flow. During
more neutral conditions, the flow splits between the two outlets. A variety of other factors, such as
vegetation restricting flow in the Wakulla River and saltwater intrusion can create fluctuations in the
relative water levels of the two springs, in turn affecting the fraction of the Springs Creek Springs Group
discharge that flows to Wakulla Springs (Davis et al. 2010). The two-phased nature of the spring
discharge volume and the area from which the water is drawn makes it difficult to determine nitrate
loading from different sources in the basin.
Springs provide the majority of the flow in the Wakulla River. The river is about nine miles long,
starting near Camp Indian Springs and joining the St. Marks River near Fort San Marcos. Major centers
of population in the basin include the city of Tallahassee, Woodville, and Crawfordville. The Wakulla
River from Wakulla Springs downstream is tidally affected. The potential for saltwater intrusion into

FINAL Upper Wakulla River and Wakulla Springs Basin Management Action Plan – October 2015
Page 28 of 110
the ground water system exists, as the Floridan aquifer is directly connected to the Gulf of Mexico
(Department 2012a).
2.3 WATER QUALITY AND BIOLOGICAL COMMUNITY TRENDS The Upper Wakulla River was found to be impaired based on failing SCI scores between February 2000
and May 2007. The poor biological community scores were due to the fact that sensitive taxa were
affected by the smothering of substrate by hydrilla, occasional low dissolved oxygen (DO), and slightly
elevated conductivity. The water quality data collected during this time indicated that ammonia levels
(mostly below detection) and phosphorus levels (averaging 0.03 mg/L) generally represented excellent
conditions, while nitrate concentrations were elevated from anthropogenic sources. Therefore, the
Upper Wakulla River was found to be impaired for nitrates, as evidenced by an aquatic biological
community impacted by excessive hydrilla growth and algal mats (Department 2012a).
The highest nitrate concentration is found at the spring vent, and the nitrate concentration decreases as
the water moves downriver (see Figure 4). When comparing the data from the TMDL verified period
(2000–07) with more recent data (2008–15), nitrate concentrations at the vent are declining. In the
ground water caves and tunnels that feed Wakulla Spring, nitrate concentrations were higher in B- and
C-Tunnels than in the Main Tunnel, indicating that other sources of flow to the springs are diluting the
concentrations observed at the spring vent (see Figure 5). The data from K-Tunnel (see the location in
Figure 6) indicate lower nitrate levels; this tunnel may be diluting flows from the other tunnels. B-, C-,
D-, and K-Tunnels continue to show mean nitrate + nitrite concentrations above the target concentration
of 0.35 mg/L. B-, C-, and D-Tunnels are the major contributors (see Figure 5), with the highest mean
nitrate concentration in B-Tunnel. These tunnels bring contributing flows from the SESF and Ames
Sink to the Upper Wakulla River and Wakulla Springs. However, there are declining trends in nitrate
concentrations in B-, C-, and D-Tunnels. (Department 2013d). The K-Tunnel nitrate concentrations
reached levels below the target concentration of 0.35 mg/L in 2014 and early 2015 (see Figure 5).
Figure 7 shows the contributing area to Wakulla Springs in Florida.
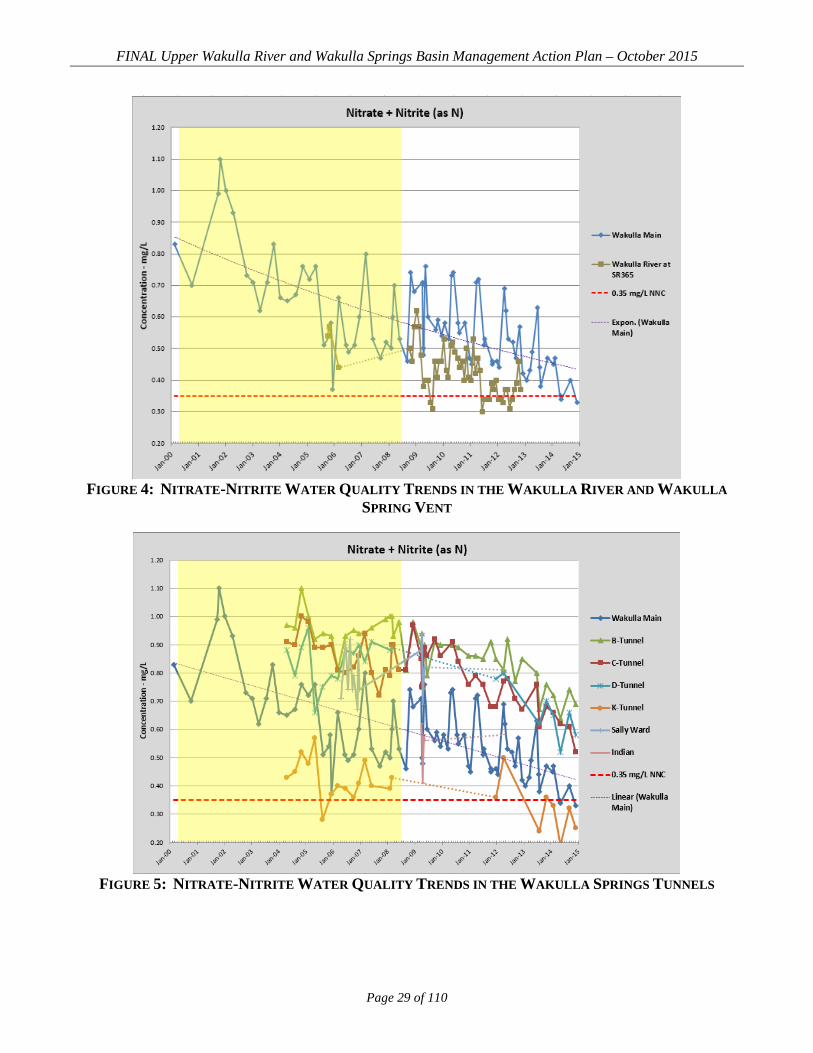
FINAL Upper Wakulla River and Wakulla Springs Basin Management Action Plan – October 2015
Page 29 of 110
FIGURE 4: NITRATE-NITRITE WATER QUALITY TRENDS IN THE WAKULLA RIVER AND WAKULLA
SPRING VENT
FIGURE 5: NITRATE-NITRITE WATER QUALITY TRENDS IN THE WAKULLA SPRINGS TUNNELS

FINAL Upper Wakulla River and Wakulla Springs Basin Management Action Plan – October 2015
Page 30 of 110
FIGURE 6: LOCATIONS OF THE MAIN WAKULLA SPRINGS TUNNELS

FINAL Upper Wakulla River and Wakulla Springs Basin Management Action Plan – October 2015
Page 31 of 110
FIGURE 7: ESTIMATED CONTRIBUTING AREAS TO WAKULLA SPRINGS
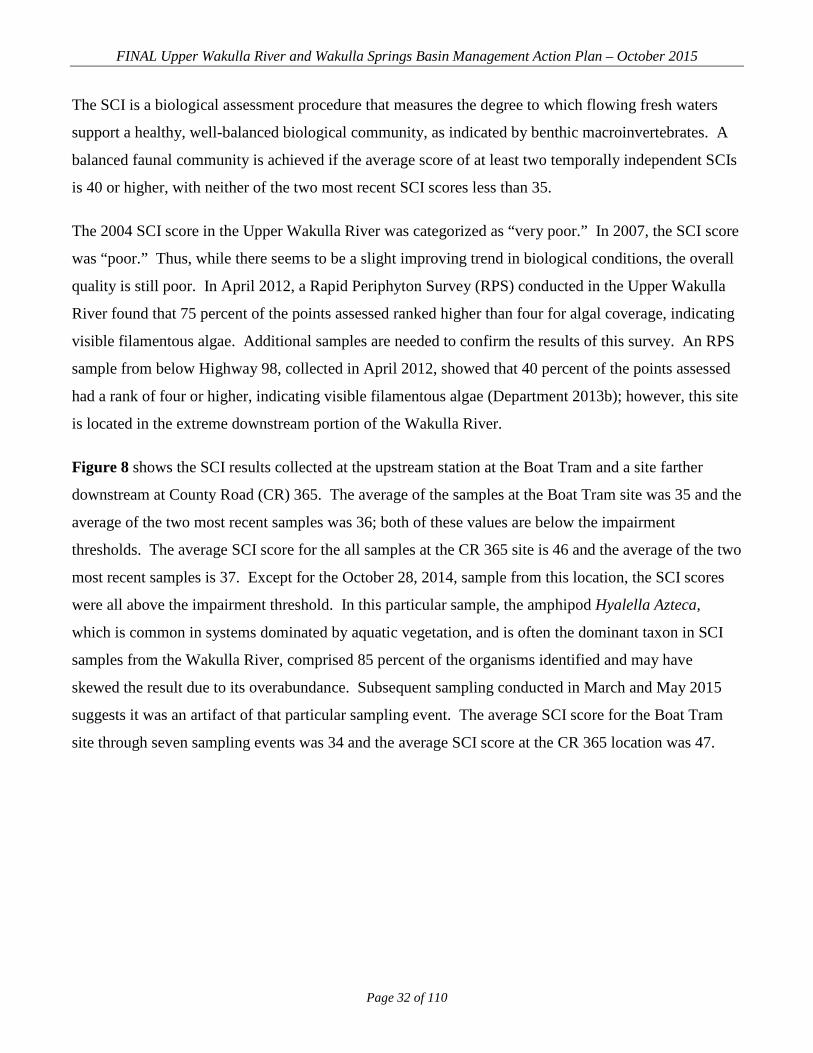
FINAL Upper Wakulla River and Wakulla Springs Basin Management Action Plan – October 2015
Page 32 of 110
The SCI is a biological assessment procedure that measures the degree to which flowing fresh waters
support a healthy, well-balanced biological community, as indicated by benthic macroinvertebrates. A
balanced faunal community is achieved if the average score of at least two temporally independent SCIs
is 40 or higher, with neither of the two most recent SCI scores less than 35.
The 2004 SCI score in the Upper Wakulla River was categorized as “very poor.” In 2007, the SCI score
was “poor.” Thus, while there seems to be a slight improving trend in biological conditions, the overall
quality is still poor. In April 2012, a Rapid Periphyton Survey (RPS) conducted in the Upper Wakulla
River found that 75 percent of the points assessed ranked higher than four for algal coverage, indicating
visible filamentous algae. Additional samples are needed to confirm the results of this survey. An RPS
sample from below Highway 98, collected in April 2012, showed that 40 percent of the points assessed
had a rank of four or higher, indicating visible filamentous algae (Department 2013b); however, this site
is located in the extreme downstream portion of the Wakulla River.
Figure 8 shows the SCI results collected at the upstream station at the Boat Tram and a site farther
downstream at County Road (CR) 365. The average of the samples at the Boat Tram site was 35 and the
average of the two most recent samples was 36; both of these values are below the impairment
thresholds. The average SCI score for the all samples at the CR 365 site is 46 and the average of the two
most recent samples is 37. Except for the October 28, 2014, sample from this location, the SCI scores
were all above the impairment threshold. In this particular sample, the amphipod Hyalella Azteca,
which is common in systems dominated by aquatic vegetation, and is often the dominant taxon in SCI
samples from the Wakulla River, comprised 85 percent of the organisms identified and may have
skewed the result due to its overabundance. Subsequent sampling conducted in March and May 2015
suggests it was an artifact of that particular sampling event. The average SCI score for the Boat Tram
site through seven sampling events was 34 and the average SCI score at the CR 365 location was 47.

FINAL Upper Wakulla River and Wakulla Springs Basin Management Action Plan – October 2015
Page 33 of 110
FIGURE 8: SCI RESULTS FOR TWO SITES ON THE WAKULLA RIVER, OCTOBER 30, 2013–MAY 8, 2015
To determine the source of the nitrate loading in the basin, the department collected data between March
and December 2011 from the different tunnels around Wakulla Springs and from the springs themselves.
Using information on nitrogen isotopes to correlate to sources, the data indicated that the A- and K-
Tunnels in the south and west had a much lower wastewater signature than the B-, C-, and D-Tunnels in
the north and east. The springs also showed a significant wastewater nitrate signature. These data had a
nitrogen isotope signature in the wastewater/manure signature field (Department 2013c).
To determine if the nitrate is coming from humans or livestock, another tracer is needed. The
department uses sucralose as a tracer for human sources. Sucralose is the main ingredient in Splenda®,
and studies from around the world have detected sucralose in ground water with human wastewater
influences. Sucralose is very stable, passes through wastewater treatment into the final effluent, and is
not affected by chlorination or tertiary treatment. Sucralose has the added advantage that it is never used
in animal feed and is therefore not expected to be present in the byproducts of animal waste. The
median sucralose levels in the A- and K-Tunnels, based on data from 2011 to 2012, were only slightly
above the detection limit, which is 0.01 parts per billion (ppb). The B-, C-, and D- Tunnels had
sucralose concentrations between 0.033 and 0.035 ppb, indicating human influence from the north and
east. This is consistent with findings from other studies in the basin (Department 2013c).

FINAL Upper Wakulla River and Wakulla Springs Basin Management Action Plan – October 2015
Page 34 of 110
2.4 IMPACT OF NITRATE ON WATER QUALITY AND THE BIOLOGICAL COMMUNITY Nitrate appears to be the crucial nutrient feeding the growth of algae and hydrilla in the Upper Wakulla
Springs and Wakulla River. It is a common form of combined nitrogen in most natural surface fresh
waters and some ground water in Florida. Nitrate occurs naturally but is also produced by human
activities. Most plants cannot directly use nitrogen in its molecular form but instead use nitrogen in the
form of either nitrate or ammonium. The primary natural sources of nitrate on the earth’s surface
include volcanic activity, lightning, and biological fixation. In biological fixation, molecular nitrogen is
fixed by a special bacterium associated with certain plants, notably legumes, sugarcane, and some ferns,
and may be further oxidized to nitrate by other bacteria. Nitrate is also produced from the breakdown of
animal manure and dead plants (Peer Review Committee 2005).
Human activities are greatly increasing the amount of nitrogen cycling between the living world and the
soil, water, and atmosphere. In fact, humans have already doubled the rate of nitrogen entering the land-
based nitrogen cycle, and that rate is continuing to climb. Elevated concentrations of nitrate in ground
water commonly result from agricultural and urban land use practices in ground water recharge areas.
The proximity of these areas to points of discharge (i.e., springs) can result in elevated nitrate levels in
surface waters. Nitrate ions are mobile in ground water and surface water. There are essentially no
solubility constraints on the amounts found in ground water because the nitrate ion does not sorb to soils
or rock, and thus nitrate can move freely through the soil and the ground water system.
In surface waters, nitrate acts as a fertilizer for aquatic plants. Nitrate levels much less than 1 mg/L can
cause a significant shift in the balance of spring ecological communities. With an overly abundant
supply of nutrients, aquatic plants and algae grow rapidly, filling the water with thick masses of green
vegetation. Oxygen in the water is used up, leading to negative impacts to the aquatic community (Peer
Review Committee 2005).
Increasing nitrate levels in the Floridan aquifer in the Woodville Karst Plain in Leon and Wakulla
Counties, as well as in water emanating from Wakulla Springs, are a significant ecological concern.
Because a spring is a discharge point, the quality of spring water can be considered characteristic of a
large cross-section of the aquifer. An increase in nitrate concentration in Wakulla Springs can be
interpreted either as a widespread increase in nitrate concentration in the ground water from a large area

FINAL Upper Wakulla River and Wakulla Springs Basin Management Action Plan – October 2015
Page 35 of 110
of the aquifer (resulting, for example, from septic systems), or as a significant increase in one or a few
specific inputs (such as a WWTF).
Nitrate sources for Wakulla Springs appear to be a combination of both types. Figure 9 illustrates the
sources, reservoirs, and pathways of nitrogen in the unconfined portion of the Wakulla springshed.
Under a thin veneer of sand lies a limestone matrix whose voids are saturated with ground water below
the water table. The horizontal striping indicates the water-filled conduit that conveys water and
pollutants to Wakulla Springs. The large checkered arrow denotes stormwater and sinking streams.
Inputs of nitrate consist of atmospheric deposition, fertilizers, septic systems, land spraying, and
residuals. Reservoirs consist of soils, vegetation, and livestock. Sinks of nitrogen (not illustrated)
include the harvesting and decay of vegetation and removal of livestock. The nitrogen that enters
ground water finds its way to Wakulla Springs (Peer Review Committee 2005).
FIGURE 9: SCHEMATIC OF SOURCES, RESERVOIRS, AND PATHWAYS OF NITROGEN IN THE UNCONFINED PORTION OF THE WAKULLA SPRINGSHED

FINAL Upper Wakulla River and Wakulla Springs Basin Management Action Plan – October 2015
Page 36 of 110
Chapter 3: POLLUTANT SOURCES AND ANTICIPATED OUTCOMES
The TMDL includes estimates of nitrate loading in the Upper Wakulla River and Wakulla Springs Basin
from WWTFs, OSTDS, fertilizer, livestock, atmospheric deposition, sinking streams, and stormwater.
Since atmospheric deposition is considered a mostly uncontrollable source, the TMDL did not require
reductions from this source. The contributions from sinking streams, including Munson Slough, Fisher
Creek, Black Creek, and Lost Creek, were minimal and thought to be temporary in response to large
rainfall events (Chelette et al. 2002). Therefore, the BMAP focuses on addressing nitrate loading from
WWTFs, OSTDS, fertilizer, livestock, and stormwater. Additional details about the sources in the basin
and the NSILT that was developed to estimate the contribution from nutrient sources applied at the land
surface are provided in the subsections below.
3.1 NSILT The NSILT is a GIS- and spreadsheet-based tool that provides estimates of the relative contribution of
nitrogen from various sources, including the following:
Atmospheric deposition.
WWTFs.
Septic tanks.
Farm fertilizer.
Urban fertilizer.
Livestock.
Sinking streams.
The department prepared the NSILT as a tool to identify areas where nitrogen source reduction efforts
could be focused to achieve the most beneficial and cost-effective effect on water quality. The general
approach for the NSILT is to characterize groundwater recharge, identify categories of land use that are
potential nitrogen sources, estimate nitrogen input at the land surface, and calculate the estimated
nitrogen load to ground water.

FINAL Upper Wakulla River and Wakulla Springs Basin Management Action Plan – October 2015
Page 37 of 110
3.1.1 ESTIMATING NITROGEN INPUTS The first step in the NSILT process is to estimate the nitrogen input to the land surface for each of the
land use categories in the basin (see Section 2.1). Attenuation factors were then applied to the input to
land surface based on the various environmental processes that could transform nitrogen in the
subsurface, such as denitrification, nitrification of ammonia, uptake by vegetation, and mineralization of
organic nitrogen. The final step to estimate the nitrogen load is to apply an areal weighting factor based
on the rate of recharge to ground water, resulting in the estimated nitrogen loads to ground water. The
factors used in the NSILT are summarized in Table 9 and Table 10 (Eller et al. 2014).
TABLE 9: ENVIRONMENTAL ATTENUATION FACTORS
SOURCE CATEGORY ATTENUATION
FACTOR Atmospheric Deposition 90%
WWTFs 60% Septic Tanks 40%
Farm Fertilizer 70% Urban Fertilizer 80%
Livestock 75% Sinking Streams 20%
TABLE 10: RECHARGE FACTORS RECHARGE FACTOR Unconfined 90%
Semiconfined 40% Confined 10%
3.2 SUMMARY OF SOURCES IN THE BASIN
3.2.1 ATMOSPHERIC DEPOSITION Atmospheric deposition rates (both wet and dry) were estimated for the BMAP area. The wet deposition
rate was estimated using the Quincy (FL14) and Sumatra (FL23) monitoring stations from the National
Atmospheric Deposition Program (NADP). The dry deposition rate was estimated from the Sumatra
(SUM156) monitoring station (also the location of the FL23 station) from the Clean Air Status and
Trends Network (CASTNET). The annual average TN deposition from these sites was estimated from
2009 through 2012. Based on this information, the average atmospheric deposition rate was 2.80
kilograms of TN per hectare (Eller et al. 2014).

FINAL Upper Wakulla River and Wakulla Springs Basin Management Action Plan – October 2015
Page 38 of 110
3.2.2 WWTFS There are 23 permitted WWTFs in the basin. TN effluent concentrations were obtained from the
discharge monitoring reports for each facility. If only nitrate data were collected, these data were used
to project the TN concentration. For facilities that did not collect TN or nitrate data, an estimate of 8.97
mg/L of TN was used. For facilities without flow data, 50 percent of the design capacity was used.
Based on the most current available data for each facility, the estimated total input of nitrogen from
wastewater facilities to the BMAP area was 71,484 kg/yr of TN (Eller et al. 2014).
During the TMDL assessment period, the largest WWTF load was the city of Tallahassee’s T.P. Smith
Water Reclamation Facility and Spray Field, located in PFA1. The city completed the upgrade to AWT
by spring 2015; however, since November 2012, the facility has met the AWT permit requirements of 3
mg/L TN. This upgrade has resulted in large reductions of TN from the effluent applied to the land
surface at the spray field (see Section 4.1.1 for additional details). In addition, the city removed
biosolids application in the basin (see Section 4.1.1), further reducing the impacts of the WWTF in the
basin.
Also, located in PFA1 are four smaller WWTFs (Table 11 and Figure 10). During the first BMAP
iteration, the department will work with existing WWTFs in PFA1 to determine if any reductions are
required to help address the Upper Wakulla River impairment (see Section 4.1.1 for more details).
TABLE 11: WASTEWATER TREATMENT FACILITIES IN PFA1
FACILITY PERMIT NUMBER
DESIGN CAPACITY (MILLION GALLONS PER
DAY [MGD]) DISPOSAL METHOD T.P. Smith Water Reclamation Facility FLA010139 26.5 Spray field
Woodville Elementary School FLA010136 0.01 Rapid infiltration basin (RIB)
DISC Village FLA010137 0.03 Spray field Winco Utilities, Inc. FLA016544 0.495 Spray field
Lake Bradford Estates FLA010148 0.043 Absorption beds In 1995, the United States Environmental Protection Agency (EPA) authorized the department to
implement the NPDES Program to permit wastewater discharges to state surface water, including
industrial and domestic wastewater facilities. Permits are issued under the applicable provisions of
Chapter 403, F.S., and appropriate rules in Chapter 62-600, F.A.C., with applicable sections of 40 Code
of Federal Regulations (CFR) incorporated by reference. These regulations, rules, and statutes give the
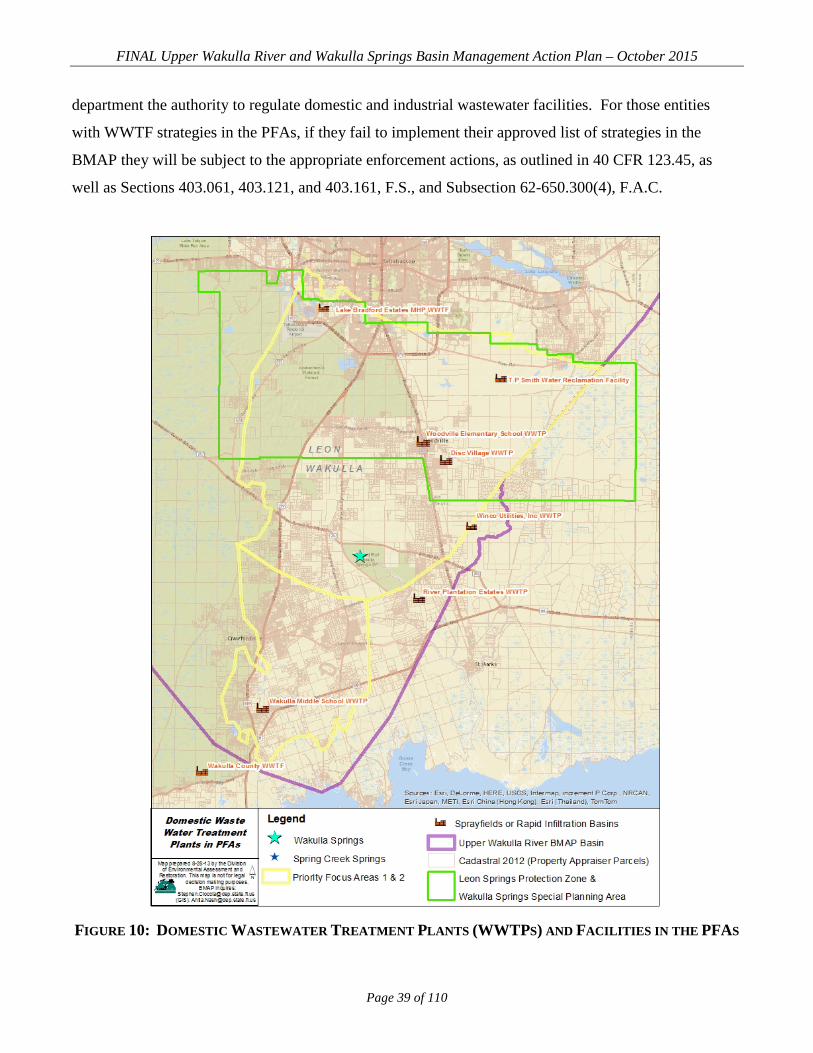
FINAL Upper Wakulla River and Wakulla Springs Basin Management Action Plan – October 2015
Page 39 of 110
department the authority to regulate domestic and industrial wastewater facilities. For those entities
with WWTF strategies in the PFAs, if they fail to implement their approved list of strategies in the
BMAP they will be subject to the appropriate enforcement actions, as outlined in 40 CFR 123.45, as
well as Sections 403.061, 403.121, and 403.161, F.S., and Subsection 62-650.300(4), F.A.C.
FIGURE 10: DOMESTIC WASTEWATER TREATMENT PLANTS (WWTPS) AND FACILITIES IN THE PFAS
FINAL Upper Wakulla River and Wakulla Springs Basin Management Action Plan – October 2015
Page 40 of 110
3.2.3 OSTDS OSTDS, or septic systems, are commonly used where central sewer does not exist. When properly sited,
designed, constructed, maintained, and operated, OSTDS are a safe means of disposing of domestic
waste (Department 2012a). However, in karst areas, such as the PFAs in the Upper Wakulla River and
Wakulla Springs Basin, the nitrate contributions from OSTDS to ground water can be significant. A
septic system study was conducted by FSU’s Department of Earth, Ocean, and Atmospheric Science in
the Woodville area, which is located in southern Leon County and northern Wakulla County (Harden et
al. 2010). FSU researchers injected dye into two shallow wells and then collected samples at several
springs and Wakulla tunnels. Dye was recovered in Wakulla Spring, Sally Ward Spring, Indian Springs,
and the six tunnels. Based on the distances from the two wells (5.2 and 6.0 miles) to Wakulla Springs,
the dye traveled at a rate of about 327 feet (100 meters) per day (Department 2012b).
The NSILT found approximately 52,446 OSTDS within the BMAP boundary (16,173 OSTDS in the
unconfined recharge area, 22,005 in the semiconfined recharge area, and 14,268 in the confined recharge
area). Approximately 9,640 septic tanks are located in PFA1 and 5,062 septic tanks in PFA2 (see
Figure 11). Based on the 2010 United States Census, there are 2.48 people per household in Leon
County, 2.93 people per household in Wakulla County, 2.74 people per household in Gadsden County,
and 2.61 people per household in Jefferson County. FDOH estimates that there is an average annual
input of 4.5 kg of nitrogen (N) per person from a septic tank. Based on this information, the OSTDS
contribution to the land surface in the BMAP area is estimated to be 615,463 kg/yr of N (Eller et al.
2014).
With the reduction in loading from the city of Tallahassee WWTF, OSTDS are now the largest source of
nitrates to ground water, contributing more than one-third of the estimated loading (Figure 12;
Department 2013a). Strategies to address OSTDS loading will be determined through the OSTDS
Initiative (see Section 1.3.4).
It is important to note that there are varying estimates of the number of OSTDS in the Upper Wakulla
River and Wakulla Springs Basin. OSTDS estimates are also included in Lombardo (2011), Chelette
(2002), the FDOH model (2009), and local government reports. As part of the OSTDS Initiative, a more
refined estimate of the number of septic tanks in each PFA will be determined.

FINAL Upper Wakulla River and Wakulla Springs Basin Management Action Plan – October 2015
Page 41 of 110
FIGURE 11: CURRENT LOCATIONS OF OSTDS IN THE PFAS
FINAL Upper Wakulla River and Wakulla Springs Basin Management Action Plan – October 2015
Page 42 of 110
3.2.4 RESIDENTIAL FERTILIZER Fertilizer used on lawns and landscaping in residential areas can contribute to nitrate loading to ground
water. The NSILT used FDACS fertilizer sales data to determine the annual amount of fertilizer sold in
each county included in the contributing area for nonfarm applications. The percentage of urban land
use from the contributing area was compared with the total urban areas for the entire county to adjust the
county-specific data to the contributing area boundary. The fertilizer sales data also include information
on the amount of TN in fertilizer sold. Using these data, urban fertilizer contributes approximately
226,204 kg/yr of N in the BMAP basin. Leon County, Wakulla County, and the city of Tallahassee have
implemented fertilizer ordinances and educational programs to help address this source (see Chapter 4).
3.2.5 AGRICULTURAL FERTILIZER AND LIVESTOCK For the agricultural fertilizer amounts, the department took the acreage for each agricultural commodity
type in the basin, based on 2009 land use coverage, and multiplied the acreage by the University of
Florida–Institute of Food and Agricultural Sciences (UF–IFAS) recommended fertilizer application
rates. The result is an estimate of 560,784 kg/yr of N in the BMAP area (Eller et al. 2014).
To estimate the contribution from livestock in the BMAP basin, the NSILT used the United States
Department of Agriculture (USDA) Census of Agriculture, which is conducted every five years. This
census provides the number of livestock by animal for each county. To adjust the data from each county
to fit the BMAP area, the department determined the percentage of land uses in the each county in the
basin considered to be livestock lands. The estimate for the number of each livestock animal type is
multiplied by literature values of the waste factors in lbs/day of N for each animal. Based on these
estimates, livestock contribute 338,946 kg/yr of N in the BMAP area (Eller et al. 2014).
The city of Tallahassee implemented management practice changes during the TMDL assessment period
to eliminate the application of fertilizer on the SESF, where crops are grown. This change in
management practice resulted in another significant reduction in the amount of TN applied in the basin.
Based on 2009 land cover, non-forestry agriculture makes up about 4 percent of the acreage in the PFAs
(see Figure 12). The majority of agriculture in the PFAs comprises pasture and rangeland, followed by
hayfields and field crops. There are also smaller numbers of horse farms, row crops, other grove types,
nurseries and vineyards, ornamental nurseries, and tree nurseries. Outside the PFAs, nonforestry

FINAL Upper Wakulla River and Wakulla Springs Basin Management Action Plan – October 2015
Page 43 of 110
agriculture constitutes about 7 percent of the acreage, with pasture and rangeland making up the
majority of the agricultural lands. Hayfields and row, field, and mixed crops are the next most common
types of agriculture. FDACS is working with producers in the basin to enroll them in the appropriate
best management practice (BMP) programs. During this process, FDACS determines whether
agricultural operations are appropriate for enrollment, such as those in commercial production.
Unimproved pasture with no animals, fallow lands, and other lands not in production are not eligible for
enrollment. A large portion of the remaining acreage identified as agricultural in the land use data is
likely to be noncommercial and potentially inappropriate for BMP enrollment. FDACS will attempt to
identify noncommercial and out-of-production lands in the first phase of the BMAP.
Lands identified as not in production may result in an agricultural load reduction “credit,” depending on
the specific circumstances. The department and FDACS will work together to identify small residential
farms that may be addressed through UF–IFAS Extension and/or BMPs developed by the department,
such as the small horse farm BMP manual recently published. Where FDACS identifies clear errors in
land use data, such as golf courses classified as agriculture, the total agricultural acreages estimated for
the BMAP basin will decrease by that amount, and the changes will be incorporated during annual
updates.
Agricultural enforcement for BMAP actions is based on the FWRA, which states that nonpoint source
dischargers who fail either to implement the appropriate BMPs or conduct water quality monitoring
prescribed by the department or a water management district that demonstrates compliance with water
quality standards may be subject to enforcement action by either of those agencies. All agricultural
nonpoint sources in the BMAP area are statutorily required either to implement FDACS-adopted BMPs
or to conduct water quality monitoring that demonstrates compliance with state water quality standards.

FINAL Upper Wakulla River and Wakulla Springs Basin Management Action Plan – October 2015
Page 44 of 110
FIGURE 12: 2009 AGRICULTURAL LANDS IN THE UPPER WAKULLA RIVER AND WAKULLA SPRINGS
BMAP AREA
3.2.6 SINKING STREAMS In karst areas, sinkholes can form and capture the flow of surface streams. Water from these sinking
streams, also known as swallets, can have a detrimental impact on ground water quality. There are four
prominent sinking streams in the BMAP area: Lost Creek, Black Creek, Munson Slough, and Fisher
Creek. To assess the nitrogen inputs attributed to these streams, the department evaluated the discharge
data, as well as nitrogen concentrations, from these streams. Discharge data for Fisher Creek (Station
02326993) and Lost Creek (Station 02327033) were obtained from the United States Geological Survey
(USGS) National Water Information System. Discharge data were available for 2007–09 for Fisher
Creek and for 2002–07 for Lost Creek. The NWFWMD maintains a gaging station located on Munson
FINAL Upper Wakulla River and Wakulla Springs Basin Management Action Plan – October 2015
Page 45 of 110
Slough, and data from 2002–10 were obtained by request. Black Creek does not have an active gaging
station, but discharge data were provided from a water quality study conducted from March 2009 to
May 2009. All four sinking streams are located in the unconfined recharge area in the BMAP basin.
Based on the data collected, the estimated TN loading from the sinking streams is 3,867 kg/yr for Fisher
Creek, 31,865 kg/yr for Lost Creek, 7,034 kg/yr for Black Creek, and 3,652 kg/yr for Munson Slough
(Eller et al. 2014).
3.2.7 STORMWATER Stormwater runoff is the responsibility of MS4s and urban nonpoint sources, and these entities are
described in detail below.
3.2.7.1 MS4s Several stakeholders in the basin are regulated by the Florida NPDES stormwater program because they
discharge stormwater and qualify as an MS4. While there are no direct contributions from these MS4s
to the Upper Wakulla River watershed (WBID 1006), the MS4s are located in the Upper Wakulla River
and Wakulla Springs BMAP area. An MS4 is a conveyance or system of conveyances such as roads
with stormwater systems, municipal streets, catch basins, curbs, gutters, ditches, constructed channels,
or storm drains that are designed or used for collecting or conveying stormwater. An MS4 can be
operated by municipalities, counties, drainage districts, colleges, military bases, or prisons, to name a
few examples. By definition, the components of an MS4 system do not include waters of the state of
Florida or of the United States. Instead, the MS4 ultimately discharges into such waters.
The basic requirements of the program serve as a foundation for the stormwater management efforts of
these communities. The EPA developed the federal NPDES stormwater permitting program in two
phases. Phase I, which began in 1990, addresses large and medium MS4s located in incorporated areas
and counties with populations of 100,000 or more, as well as specific industrial activities. Phase II,
which started in 1999, addresses small MS4s that are designated according to population and other
criteria established in federal and state rules. Small MS4s include those located in an urbanized area
with a population of at least 50,000 people and/or those serving a population of 1,000 or more people
per square mile.
In October 2000, the EPA authorized the department to implement the NPDES stormwater permitting
program in the state. This permitting has remained separate from state Stormwater/Environmental

FINAL Upper Wakulla River and Wakulla Springs Basin Management Action Plan – October 2015
Page 46 of 110
Resource Permit (ERP) Programs and local stormwater/water quality programs, which have their own
regulations and permitting requirements. Florida’s rules for MS4s can be found in Chapters 62-4, 62-
620, 62-621 and 62-624, F.A.C.
Table 12 lists the entities in the Upper Wakulla River and Wakulla Springs Basin currently designated
as MS4s.
TABLE 12: ENTITIES IN THE UPPER WAKULLA RIVER AND WAKULLA SPRINGS BMAP BASIN DESIGNATED AS MS4S
MS4 PERMIT PHASE PERMITTEE PERMIT NUMBER
I Leon County FLS000033 I FDOT District 3 FLS000033 I City of Tallahassee FLS000034 II FSU FLR04E051 II FAMU FLR04E095
II Federal Correctional Institution, Tallahassee FLR04E096 All NPDES permits, including MS4 permits, must be consistent with the requirements of adopted
TMDLs. Paragraph 403.067(7)(b), F.S., prescribes the criteria for TMDL implementation. In
accordance with this section, the implementation of a TMDL or BMAP for holders of NPDES MS4
permits must be achieved to the maximum extent practicable, through the use of BMPs or other
management strategies. The implementation of BMPs consistent with the provisions of the stormwater
management program required under an MS4 permit constitutes compliance with the standard of
reducing pollutants to the maximum extent practicable for discharges to unimpaired waters. However,
MS4s must also continue to assess and adjust their list of approved management strategies to achieve the
greatest reduction of pollutants practicable to protect receiving waters in accordance with an adopted
TMDL or BMAP.
Entities that fail to implement their list of approved strategies in order to reduce pollutants to the
maximum extent practicable standard will be subject to enforcement action in accordance with Sections
403.067, 403.121, 403.141, and 403.161, F.S., and Subsection 62-650.300(4), F.A.C. In addition, both
Phase I and Phase II MS4 permits include provisions for revising the effluent limitations, monitoring
requirements, and stormwater management programs to meet applicable TMDL allocations that are
consistent with the assumptions and requirements of the adopted BMAP.

FINAL Upper Wakulla River and Wakulla Springs Basin Management Action Plan – October 2015
Page 47 of 110
3.2.7.2 Urban Nonpoint Sources Reductions in loads carried by stormwater that are separate from discharges by a permitted MS4 were
established in the “load allocation” component of the TMDL. Subsubparagraph 403.067(7)(b)2.f, F.S.,
prescribes the pollutant reduction actions required for nonagricultural pollutant sources that are not
subject to NPDES permitting. These “non-MS4” sources must also implement the pollutant reduction
requirements detailed in a BMAP. The entities that may be responsible for reducing nonpoint sources in
the Upper Wakulla River and Wakulla Springs Basin are as follows:
Gadsden County.
Jefferson County.
Wakulla County.
City of Gretna.
City of Midway.
City of Quincy.
Town of Havana.
Failure by a nonpoint source to reduce loadings, as required in a BMAP, can result in enforcement
action by the department under Subparagraph 403.067(7)(b)2(h), F.S. The department can designate an
entity as a regulated Phase II MS4 if its discharges are determined to be a significant contributor of
pollutants to surface waters of the state in accordance with Rule 62-624.800, F.A.C. The designation of
an entity as a Phase II MS4 can occur when a TMDL has been adopted for a waterbody or segment into
which the entity discharges the pollutant(s) of concern. If an entity is designated as a regulated Phase II
MS4, it is subject to the conditions of the Phase II MS4 Generic Permit.
3.3 SUMMARY OF LOADING TO GROUND WATER The total nitrogen input applied to the land surface described above was multiplied by the environmental
attenuation and recharge factors shown in Table 9 and Table 10, respectively. Table 13 lists the inputs,
the intermediate step with attenuation factors applied, and the final estimated loads to the upper Floridan
aquifer (UFA) with both attenuation and recharge factors applied.

FINAL Upper Wakulla River and Wakulla Springs Basin Management Action Plan – October 2015
Page 48 of 110
Based on these calculations, approximately 342,048 kg/yr of N enters ground water in the BMAP basin.
The relative contribution of major sources of nitrogen to ground water is described in Figure 13,
including controllable sources such as septic tanks, farm fertilizer, livestock, urban fertilizer, and
WWTFs (Eller et al. 2014).
TABLE 13: ESTIMATED NITROGEN INPUTS AND LOADS TO THE UFA IN THE WAKULLA SPRING AND RIVER BMAP AREA

FINAL Upper Wakulla River and Wakulla Springs Basin Management Action Plan – October 2015
Page 49 of 110
FIGURE 13: RELATIVE NITROGEN LOADS TO THE UFA CONTRIBUTED FROM THE NITROGEN SOURCE
CATEGORIES EVALUATED FOR THE WAKULLA SPRING AND RIVER BMAP AREA
3.4 ANTICIPATED OUTCOMES OF BMAP IMPLEMENTATION With the implementation of the management strategies outlined in this BMAP, reductions in the nutrient
loads to the Upper Wakulla River and Wakulla Springs Basin are expected to decrease the contribution
of nitrate to the river and springs. The following outcomes are expected from BMAP implementation:
Continued improvement in water quality conditions in the Upper Wakulla River and
Wakulla Springs.
Decreased loading of the target pollutant (nitrate).
Increased coordination, such as through the OSTDS Initiative and annual meetings,
among state and local governments and within divisions of local governments in
problem solving for water quality restoration.
Determination of effective management strategies through the stakeholder decision-
making and priority-setting processes.

FINAL Upper Wakulla River and Wakulla Springs Basin Management Action Plan – October 2015
Page 50 of 110
Enhanced public awareness of pollutant sources, pollutant impacts on water quality, and
corresponding corrective actions.

FINAL Upper Wakulla River and Wakulla Springs Basin Management Action Plan – October 2015
Page 51 of 110
Chapter 4: MANAGEMENT STRATEGIES IN THE PFAS
“Management strategies” refers to the suite of activities that the responsible Upper Wakulla River and
Wakulla Spring BMAP entities will be conducting to achieve nitrate reductions. These strategies
include structural and nonstructural activities. Under Paragraph 403.067(7)(a), F.S., a BMAP is
required to integrate the appropriate management strategies available to the state through existing water
quality protection programs to achieve the TMDLs. In the case of this BMAP, management strategies
relate to standards for WWTFs, a process to address the management and mitigation of impact from
OSTDS, residential fertilizer use, agricultural BMPs, and stormwater management.
The stakeholders submitted strategies that have been completed since January 1, 2004, and are planned
within the first five-year BMAP iteration. January 1, 2004, was selected as the starting point for the
BMAP strategies because it is the midpoint of the verified period used to determine impairment in the
Upper Wakulla River. Since the Upper Wakulla River and Wakulla Springs Basin is a ground water–
driven system, the department reasoned that due to the delay between reduction strategies and detection
of the results that the full benefits of the management strategies completed during the TMDL verified
period were not seen in the water quality data. Therefore, these projects have provided additional
benefits during the latter portion of the verified period to the Upper Wakulla River and Wakulla Springs
and should be listed in the BMAP.
The management strategies were submitted to provide reasonable assurance to the department that each
responsible entity has a plan on how to reduce nitrate concentrations. The sections below outline the
strategies submitted by the stakeholders in the PFAs.
4.1 SUFFICIENCY OF EFFORT EVALUATION The tables in Section 4.2 list the management strategies to reduce nitrate concentrations in the PFAs.
The nitrate load reduction strategies outlined in the project tables, including the activities highlighted
below, are expected to reduce nitrate concentrations and improve water quality in the Upper Wakulla
River and Wakulla Springs. As water quality improves as a result of these strategies, and as more data
are collected to show the nitrate concentrations and health of the biological community in the Upper
Wakulla River and Wakulla Springs, future BMAP iterations may recommend different or additional
strategies. For this BMAP iteration, the full implementation of the management strategies listed in the
tables for the PFAs is sufficient to significantly reduce nitrate concentrations and make substantial
FINAL Upper Wakulla River and Wakulla Springs Basin Management Action Plan – October 2015
Page 52 of 110
progress towards meeting the TMDL target. The sufficiency of this BMAP relies on these management
strategies; by inclusion in the BMAP, it is required that they remain in effect without substantial
revision, as determined by the department.
4.1.1 WWTFS SUFFICIENCY The largest point source facility identified in the TMDL was the city of Tallahassee’s T.P. Smith Water
Reclamation Facility and Spray Field. In 2008, the city began to upgrade the WWTF to meet AWT
standards. The target TN concentration in the effluent was achieved ahead of schedule in November
2012, reducing TN from about 12 mg/L to less than 3 mg/L. Therefore, this facility has met the
requirement to achieve the 3.0 mg/L effluent TN concentration and meets the Upper Wakulla River
TMDL.
The change in TN concentration removed approximately 214,939 kg/yr of TN from application at the
spray field. It should be noted that the 214,939 kg/yr reduction is based on the permitted flow and
concentration for the treatment facility. The actual flow and concentration are much lower, such that the
actual load reduction achieved is much greater, on the order of 280,000 kg/yr. The greater reduction
value is not used in the sufficiency evaluation because the city is entitled by permit to increase its flow
to 26.5 mgd, which will in turn increase the TN discharged. Because the BMAP uses the smaller
reduction value, the increase in TN load that occurs with growth is already accounted for in determining
compliance with the TMDL and will not constitute an increase in load for BMAP purposes.
The city also removed its WWTF biosolids application from the basin, resulting in a reduction of
169,347 kg/yr of TN that was previously applied to the land in the basin. In addition, the city has a
program to assess and rehabilitate the sewer collection system in the older parts of the system. Of the
total 895 miles of sewer system, 356 miles are part of the older system. Approximately 7 percent of the
older system sewer lines are in PFA1. The assessment of the older system will be completed by the end
of 2014, and the rehabilitation of the system will be completed by 2021.
Wakulla County has an adopted comprehensive plan policy that requires AWT (3 mg/L) for any WWTF
or spray field located in the Wakulla Springs Special Planning Area. The county conducts routine
inspections and maintenance of the sewer collection system throughout the county. Wakulla County is
proposing to upgrade its WWTF for improved treatment and to connect OSTDS to central sewer in
PFA2. The current WWTF provides secondary treatment, and the proposed upgrade would be to AWT.

FINAL Upper Wakulla River and Wakulla Springs Basin Management Action Plan – October 2015
Page 53 of 110
The Upper Wakulla River and Wakulla Springs BMAP requires the following:
Existing WWTFs with a permitted capacity of 100,000 gallons per day (gpd) or greater
and all new WWTFs permitted by the department, after the adoption of this BMAP,
with a discharge, reuse, or land application site in PFA1 shall achieve an annual average
final effluent TN concentration of no greater than 3.0 mg/L.
Existing WWTFs permitted by the department, with a discharge, reuse, or land
application site in PFA1 with a permitted capacity less than 100,000 gpd and greater
than or equal to 20,000 gpd, shall achieve an annual average final effluent TN
concentration of no greater than 6.0 mg/L.
Existing WWTFs permitted by the department with a discharge, reuse, or land
application site in PFA1 with a permitted capacity less than 20,000 gpd shall achieve an
annual average final effluent TN concentration of no greater than 10.0 mg/L.
Based on currently available data and analysis, these effluent limitation requirements are appropriate to
protect ground water quality and prevent contribution to water quality impairment in the Upper Wakulla
River. Existing WWTFs are those facilities permitted by the department on or before the date of BMAP
adoption.
As a part of BMAP implementation, the department will evaluate requests from existing WWTFs to
determine whether the TN effluent limits established above may be modified or waived as described in
Section 4.1.1.1 below. The owners of existing WWTFs which have not already achieved permit
limitations equal to or more stringent than those required above will be given the opportunity to
demonstrate reasonable assurance that the reuse or land application project would not cause or
contribute to a violation of the 0.35 mg/L nitrate concentration established by the Upper Wakulla River
TMDL. Should the department concur with the reasonable assurance demonstration request (as
specified in Section 4.1.1.1), the TN effluent limitation established here may be modified or waived.
For the first BMAP iteration, the largest source of WWTF loading has been addressed, the department is
implementing new treatment requirements for WWTFs in PFA1, and the responsible entities have plans
to improve sewer collection systems and prevent future loading from WWTFs. Thus the department
determined that these strategies sufficiently address nitrate loading from the WWTFs in the PFAs.
FINAL Upper Wakulla River and Wakulla Springs Basin Management Action Plan – October 2015
Page 54 of 110
4.1.1.1 Reasonable Assurance Demonstration Those WWTFs which are permitted by the department on or before the date of BMAP adoption and
which have not already achieved permit limitations equal to or more stringent than those required in
Section 4.1.1, will be given the opportunity to demonstrate reasonable assurance that the reuse or land
application project would not cause or contribute to a violation of the 0.35 mg/L nitrate concentration at
the spring vent established by the Upper Wakulla River TMDL. The permittee must submit this request
to the department’s Northwest District Office – Wastewater Program staff prior to or at the time of
permit application. The demonstration must be based on relevant water quality data, physical
circumstances, or other site-specific credible information needed to show a nitrate concentration no
greater than 0.35 mg/L at the spring vent. This demonstration may include factors such as the
following:
Dilution.
Site-specific geological conditions.
Research/studies, including dye tracer tests.
Ground water transport modeling.
The demonstration will be jointly reviewed by appropriate staff from the following department
programs: Northwest District Office – Wastewater Program, Florida Geological Survey (FGS), and
Division of Environmental Assessment and Restoration (DEAR). If the department’s review results in
concern that the reuse or land application site effluent is reaching karst conduits, additional information
may be necessary for a final determination of the necessary TN effluent limit. The final decision of
demonstration of reasonable assurance will be made by the Northwest District Director in conjunction
with input from FGS and DEAR staff.
If the TN final effluent limit, as described in Section 4.1.1, is modified or waived subsequent to the
demonstration of reasonable assurance, the permit will include effluent monitoring requirements for TN
and ground water monitoring requirements from the Floridan aquifer for nitrate as nitrogen. At each
permit renewal, the demonstration of reasonable assurance will be reviewed by the departmental
programs previously identified in the joint review to reasonably assure that the reuse or land application
would not cause or contribute to a violation of the 0.35 mg/L nitrate concentration at the spring vent

FINAL Upper Wakulla River and Wakulla Springs Basin Management Action Plan – October 2015
Page 55 of 110
established by the Upper Wakulla River TMDL. This review will include the original data obtained
during the initial demonstration as well as any new data that have been obtained since permit issuance.
4.1.2 OSTDS SUFFICIENCY Prior to the completion of the OSTDS Initiative identified in Section 1.3.4, the following activities will
be implemented by stakeholders. Leon County will prepare a GIS inventory of the OSTDS located in
the county, revise its septic system ordinance to require greater separation between the drainfield and
seasonal high water table to reduce the amount of nitrate that enters ground water, and install
educational kiosks about septic systems at the Woodville Community Center. The county will review
the results of the FDOH study on nitrate-reducing OSTDS and modify its code, if appropriate, in the
OSTDS Initiative process.
Subsequent to the development of the OSTDS Plan, the county and department will identify septic
systems in the PFAs that are not feasible to connect to central sewer, and develop a funding plan and
schedule to assist homeowners with upgrading to advanced nitrate-reducing systems, if such
technologies are available. The city of Tallahassee and Leon County have enacted ordinances to
establish the PSPZ, which reduces development in the urban fringe in the PSPZ and allows development
in the urban area only to the extent permitted by the future land use map. In addition, the county is
proposing to sewer within the PSPZ to remove OSTDS, depending on project and funding approval
through the county’s sales tax process.
As part of the Alternatives to Sewer Solutions Study (included in the 2014 extension of the local sales
tax), Leon County and the city have agreed to study and develop preferred options for management
alternatives to traditional OSTDS in the unincorporated areas of Leon County, including the PSPZ. This
project will identify preferred options for responsible management entities, including recommendations
for financing and management structures for identified preferred options; recommend regulatory
measures; and identify other issues related to OSTDS financing. The comprehensive management and
engineering plan resulting from this project will provide direction for proposing sewer or cluster
projects, for which funding is also available through the sales tax process.
This strategy would result in a large TN reduction when infrastructure projects are completed and
connections occur. The department will identify state and federal funds to minimize connection fees for
homeowners.

FINAL Upper Wakulla River and Wakulla Springs Basin Management Action Plan – October 2015
Page 56 of 110
Wakulla County has an adopted comprehensive plan policy that requires advanced nitrogen-reducing
OSTDS on parcels smaller than five acres in the Wakulla Springs Special Planning Area; within 150 feet
of a surface water, swallet, or other karst feature, or within 300 feet of a first- or second-magnitude
spring; and on all parcels less than 0.229 acres in size. Wakulla County is pursuing funding for planned
sewer in Greiner's Addition, Magnolia Gardens, and Wakulla Gardens; this could remove the existing
1,330 septic systems and an estimated potential 2,251 additional systems in the future. The county is
seeking funding to inspect and repair old, damaged, and failing OSTDS in the Wakulla Springs Basin.
The county is also looking to form a tax increment financing (TIF) district for the Crawfordville area to
fund improvements, including basic infrastructure. Additionally, the county continues the effort to
modify the development code to require upgraded designs for new home construction.
Wakulla Springs State Park sewered its property in 1992, removing all OSTDS in the park except for
one septic system serving the gatehouse. This wastewater treatment system is a performance-based
treatment system with a high nitrogen removal efficiency.
In addition, the department, FDOH, city of Tallahassee, Leon County, and Wakulla County will work
together through the OSTDS Initiative to identify effective management strategies for the basin, and to
develop the strategies and milestones. By the end of the first five-year BMAP iteration, the responsible
stakeholders will have already begun to implement or will be ready to implement agreed-on OSTDS
reduction strategies.
Based on the adopted and planned measures and actions resulting from the OSTDS Initiative, OSTDS
sources will be sufficiently addressed for the first iteration of the BMAP. Depending on water quality
trends, additional efforts may be needed in future BMAP iterations to address OSTDS.
4.1.3 RESIDENTIAL FERTILIZER SUFFICIENCY The city of Tallahassee has a fertilizer use ordinance and an educational program. Based on surveys
conducted after the ordinance was adopted and educational efforts began, the city determined that the
number of households applying fertilizer decreased by 49 percent between 2007 and 2012. In addition,
for those households still applying fertilizer, the amount applied per household decreased by 27 percent.
FINAL Upper Wakulla River and Wakulla Springs Basin Management Action Plan – October 2015
Page 57 of 110
FDOT District 3 has eliminated fertilizer use for turf maintenance along the roadways in the basin and is
therefore no longer a source of fertilizer, except during the establishment of new turfgrass. This
fertilizer cessation removed about 4,640 kg/yr of TN applied to the land surface.
Leon County has a fertilizer ordinance for commercial applicators and is considering modifying the
ordinance to reduce nitrogen application rates in areas south of the Cody Scarp, if allowable by Florida
law. The county also has an educational and outreach program that provides the public with information
about fertilizer use through the Florida Yards and Neighborhoods (FYN) Program, the distribution of
pamphlets, presentations, and workshops.
Wakulla County has an adopted fertilizer use ordinance that adopts the model ordinance on Florida-
friendly fertilizer use on urban landscapes. The county is also planning to add fertilizer management
educational and outreach efforts.
The responsible stakeholders have strategies in place to reduce/remove fertilizer use; therefore, these
strategies are collectively sufficient to address sources of residential fertilizer during the first BMAP
iteration.
4.1.4 AGRICULTURAL FERTILIZER AND LIVESTOCK SUFFICIENCY In 2007, the city of Tallahassee eliminated fertilizer application on the SESF where crops are grown,
resulting in a reduction of 61,500 kg/yr of TN previously applied to the land.
Iin the PFAs, approximately 5,766.52 acres are in agricultural land use, of which 1,308.85 acres, or 22.7
percent, were enrolled in FDACS BMP programs as of June 30, 2013. During the first BMAP iteration,
FDACS plans to enroll additional producers in BMPs, with an enrollment target in the PFAs of 90
percent of the total agricultural acres. Adjustments may be made to the total agricultural acreage in the
PFAs may be necessary as FDACS assesses the current uses of those areas identified as agricultural land
uses.
It is important to understand that even if all targeted agricultural operations are enrolled, not all of the
acreage listed as agriculture (Table 20) will be included in enrollment figures. The Notices of Intent
(NOIs) will document the estimated total number of acres where applicable BMPs are implemented, not
the entire parcel acreage. This is because land use data can include nonproduction acres (such as
buildings, parking lots, and fallow acres) that will not be counted on the NOIs submitted to FDACS.
FINAL Upper Wakulla River and Wakulla Springs Basin Management Action Plan – October 2015
Page 58 of 110
Significant amounts of acreage may also need to be enrolled, such as lands not actively involved in
commercial agriculture (operations conducted as a business). There are often areas of low-density
residential uses on large parcels of grassed land, or land that was but is no longer in commercial
agricultural production. This information is impossible to discern in the photo interpretation process
used to generate the land use data. Local governmental, NWFWMD, or departmental BMPs may
address these noncommercial sources.
For these reasons, attaining 90 percent enrollment of the current agricultural land use acreage may
constitute full enrollment of the operations appropriate to enroll. Therefore, this percentage may need to
be adjusted based on further analysis of land use data and additional information collected during the
enrollment process. FDACS will address this matter in future BMAP annual reports as needed.
Agricultural enforcement for BMAP actions is based on the FWRA, which states that nonpoint source
dischargers who fail either to implement the appropriate BMPs or conduct water quality monitoring
prescribed by the department or a water management district that demonstrates compliance with water
quality standards may be subject to enforcement action by either of those agencies. All agricultural
nonpoint sources in the BMAP area are statutorily required either to implement FDACS-adopted BMPs
or to conduct water quality monitoring that demonstrates compliance with state water quality standards.
With the implementation of these strategies, agricultural fertilizer and livestock nitrate loading in the
PFAs will be sufficiently addressed for the first BMAP iteration.
4.1.5 STORMWATER SUFFICIENCY The city of Tallahassee has a pet waste ordinance and an educational program that reaches out to the
public about pet waste management. Since the adoption of the ordinance and the implementation of the
educational efforts, the city found that 34 percent of dog owners began picking up after their pets. In
addition, the city has constructed over 70 various stormwater treatment capital improvement projects
throughout the city since 2004 (see Appendix C).
FDOT District 3 has implemented street sweeping of its curb and gutter roads in urbanized areas through
contracts with Leon County and the city of Tallahassee. District 3 is also working with the department
to investigate the use of innovative nitrogen removal technologies for future projects in the PFAs.

FINAL Upper Wakulla River and Wakulla Springs Basin Management Action Plan – October 2015
Page 59 of 110
Leon County enacted a pet waste ordinance in 2011 that includes an educational program to promote the
clean up of pet waste. The county also adopted irrigation and landscaping ordinances. The county
participates in the FYN Program, which provides education and outreach to the public. The county
adopted land development regulations in 2012, including minimum environmental regulations
countywide that exceed state stormwater standards. These minimum countywide regulations also apply
in the city of Tallahassee. The county also adopted comprehensive plan amendments that reduced
allowable development in the urban fringe areas, in order to focus development in the urban areas. In
addition, the county is proposing to develop a low-impact development (LID) program that would
provide incentives to reduce nitrogen loading to surface and ground waters.
Leon County has also completed several stormwater improvement projects. The county constructed two
stormwater retrofit ponds in Harbinwood Estates and planted/stabilized 1,200 linear feet of channel.
The county constructed the 10-acre Fuller Road Regional Facility as a stormwater retrofit project at
Interstate 10 and United States (U.S.) Highway 27. The county removed a 15-acre nutrient sediment
dam and stabilized Munson Slough as part of the Lake Munson erosion and flood protection upgrades.
The county also maintains the stormwater system in accordance with the MS4 permit and sweeps 762
miles of roads annually, removing approximately 51.3 kg/yr of TN.
Wakulla County has adopted comprehensive plan policies that establish special area plans for three
projects in the Wakulla Springs Basin. These policies require nitrate loading analyses for development
and establish standards for stormwater, karst feature protections, landscaping, and open space.
These strategies together will sufficiently address stormwater nitrate loading for the first BMAP
iteration.
4.1.6 OTHER STRATEGIES Stakeholders have also implemented or are planning to implement studies, protection measures, and
source control efforts that will help improve water quality in the Upper Wakulla River and Wakulla
Springs Basin.
The city of Tallahassee and Leon County both have an ordinance identifying the PSPZ. The city of
Tallahassee adopted comprehensive plan amendments that reduced the amount of development allowed

FINAL Upper Wakulla River and Wakulla Springs Basin Management Action Plan – October 2015
Page 60 of 110
in urban fringe areas inside the PSPZ and requires a no net increase in dwelling units from the future
land use map in the PSPZ.
FDOT District 3 has implemented a protection measure that avoids constructing stormwater treatment
ponds directly over mapped karst caves. A 300-foot buffer is provided around these known karst caves.
Leon County conducts water quality sampling at 73 sites and uses the data in annual water quality
reports to help prioritize water quality project needs. The county completed a study on Woodville
recharge aquifer protection using a grant from the EPA and is also planning to create annual Wakulla
Springs status reports for the Board of County Commissioners. In addition, the county has purchased
land to protect sinks in the basin and has an adopted aquifer wellhead protection ordinance, a litter
control program, and an Adopt-A-Road program.
Leon County and Wakulla County prepared AVA reports (Baker et al. 2007; Baker et al. 2009) to
determine the most vulnerable areas in each county. The city of Tallahassee, Leon County, and
Wakulla County funded a study (Lombardo 2011) to identify options for addressing OSTDS loading.
Wakulla County has a springs protection ordinance identifying the Wakulla Springs Special Planning
Area and is considering the expansion of this area based on geologic vulnerability. The county has
ordinances that requires karst buffers and ground water extraction limitations. Wakulla County also has
comprehensive plan policies that set standards for the Northeast Wakulla Sustainable Community; work
to develop solutions to restore the health of Wakulla Springs; protect the functions of ground water
recharge areas, springs, and springsheds; and encourage development in Crawfordville with connection
to sewer service. The county’s litter control ordinance prohibits litter and dumping along roadways and
waterways.
In addition, Wakulla Springs State Park conducts several educational and outreach programs to educate
the public about the Wakulla River and Wakulla Springs. The Learning in Florida’s Environment
Program occurs annually with middle-school students. The Project Learning Tree Program also occurs
annually and involves nature activities with elementary school students. The Green Guide Class is an
environmental education program to train Green Guides to conduct river wildlife surveys, aquatic
studies on the river, and tree identification. Wakulla Springs State Park also participates in the annual
Wakulla Wildlife Festival and hosts a variety of Park Ranger programs.
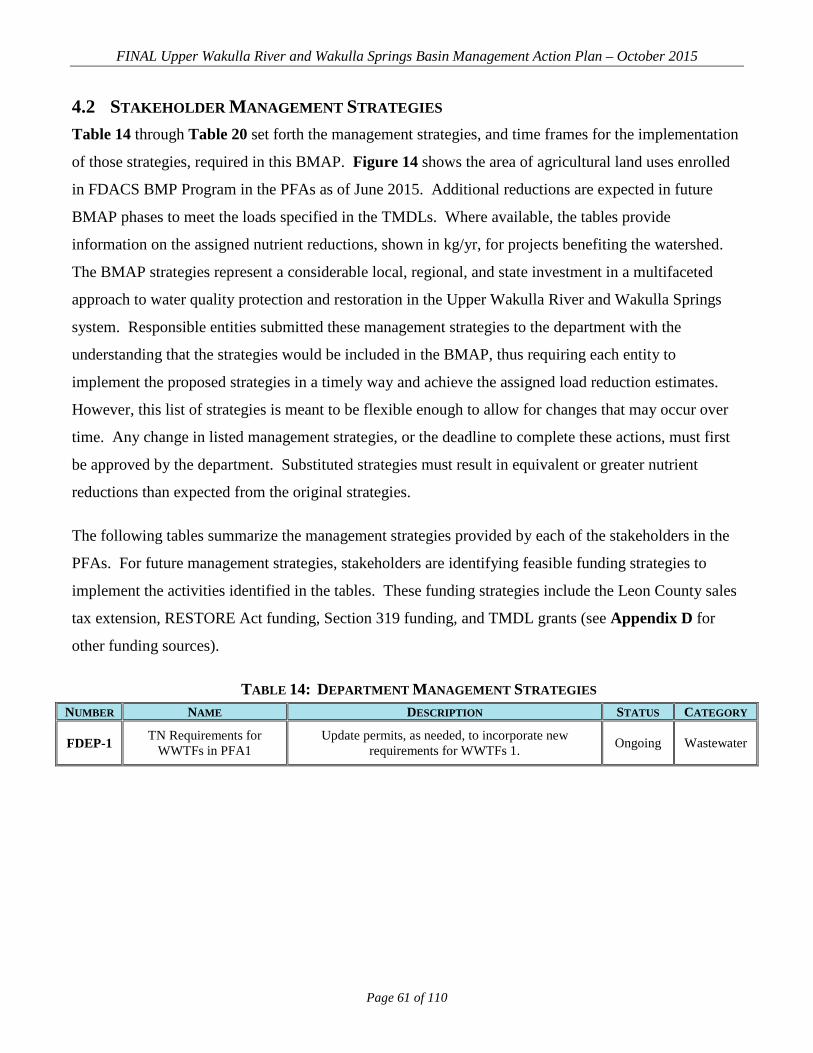
FINAL Upper Wakulla River and Wakulla Springs Basin Management Action Plan – October 2015
Page 61 of 110
4.2 STAKEHOLDER MANAGEMENT STRATEGIES Table 14 through Table 20 set forth the management strategies, and time frames for the implementation
of those strategies, required in this BMAP. Figure 14 shows the area of agricultural land uses enrolled
in FDACS BMP Program in the PFAs as of June 2015. Additional reductions are expected in future
BMAP phases to meet the loads specified in the TMDLs. Where available, the tables provide
information on the assigned nutrient reductions, shown in kg/yr, for projects benefiting the watershed.
The BMAP strategies represent a considerable local, regional, and state investment in a multifaceted
approach to water quality protection and restoration in the Upper Wakulla River and Wakulla Springs
system. Responsible entities submitted these management strategies to the department with the
understanding that the strategies would be included in the BMAP, thus requiring each entity to
implement the proposed strategies in a timely way and achieve the assigned load reduction estimates.
However, this list of strategies is meant to be flexible enough to allow for changes that may occur over
time. Any change in listed management strategies, or the deadline to complete these actions, must first
be approved by the department. Substituted strategies must result in equivalent or greater nutrient
reductions than expected from the original strategies.
The following tables summarize the management strategies provided by each of the stakeholders in the
PFAs. For future management strategies, stakeholders are identifying feasible funding strategies to
implement the activities identified in the tables. These funding strategies include the Leon County sales
tax extension, RESTORE Act funding, Section 319 funding, and TMDL grants (see Appendix D for
other funding sources).
TABLE 14: DEPARTMENT MANAGEMENT STRATEGIES NUMBER NAME DESCRIPTION STATUS CATEGORY
FDEP-1 TN Requirements for WWTFs in PFA1
Update permits, as needed, to incorporate new requirements for WWTFs 1. Ongoing Wastewater

FINAL Upper Wakulla River and Wakulla Springs Basin Management Action Plan – October 2015
Page 62 of 110
TABLE 15: FDOT DISTRICT 3 MANAGEMENT STRATEGIES N/A = Not applicable * The estimated reductions are based on the amount of TN applied to the land surface and do not represent the nitrate loading to ground water.
NUMBER NAME DESCRIPTION STATUS
ESTIMATED REDUCTIONS
(KG/YR OF TN)* CATEGORY
FDOT-1 Fertilizer Cessation Eliminated fertilizer use for ongoing turf
maintenance in entire basin, including areas outside PFAs.
Complete 4,640.0 Residential Fertilizer
FDOT-2 Street Sweeping Contract for street sweeping of FDOT curb and gutter roads in urbanized areas of Leon
County and city of Tallahassee. Ongoing 284.6 Stormwater
FDOT-3 Innovative Nitrogen
Removal Technologies
Investigating use of innovative nitrogen removal technologies as part of present work
program in PFAs. Planned N/A Stormwater
FDOT-4 Avoidance of Mapped Karst
Caves
Avoid constructing ponds directly over mapped karst caves by providing 300-foot
buffer. Ongoing N/A Protection
Measure
TOTAL ESTIMATED REDUCTIONS = 4,924.6 KG/YR OF TN
TABLE 16: WAKULLA SPRINGS STATE PARK MANAGEMENT STRATEGIES NUMBER NAME DESCRIPTION COST STATUS CATEGORY
WP-1 Learning in
Florida's Environment
Annual environmental education program with three outdoor field activities to investigate biodiversity of park wildlife: (1) river wildlife survey to observe and record wildlife on river, (2) aquatic study of Wakulla River to collect macroinvertebrates and others, and (3) aquatic
study of Cypress Dome to collect macroinvertebrates and others. Students develop hypotheses related to habitat to
investigate diversity of park aquatic wildlife. Total of 180 6th grade middle school students participated over four
field trip days (45 students per day).
17 staffing days Ongoing Education
WP-2 Project Learning Tree
Annual environmental education program with three participatory nature activities involving 320 elementary
school students.
2 staffing days Ongoing Education
WP-3 Green Guide Class
Annual environmental education program with 24 Green Guides in training. Four outdoor field activities to
investigate biodiversity of park wildlife: (1) river wildlife survey to observe and record wildlife on river, (2) aquatic study of Wakulla River to collect macroinvertebrates and
others, (3) aquatic study of Cypress Dome to collect macroinvertebrates and others, and (4) tree identification
workshop. Occurs over two field trip days.
3 staffing days Ongoing Education
WP-4 Wakulla Wildlife Festival
Annual environmental education program with bird of prey and reptile shows, over 25 nature related exhibits, seven nature field trips, and over 2,500 park visitors of all ages. All-day event to promote environmental awareness and
nature appreciation.
24 staffing days Ongoing Education
WP-5 Park Ranger Programs
Monthly morning nature walks, annual songbird walk, annual photographers’ tour, annual medicinal plant walk,
and annual Swift Night Out!
3.5 staffing days Ongoing Education
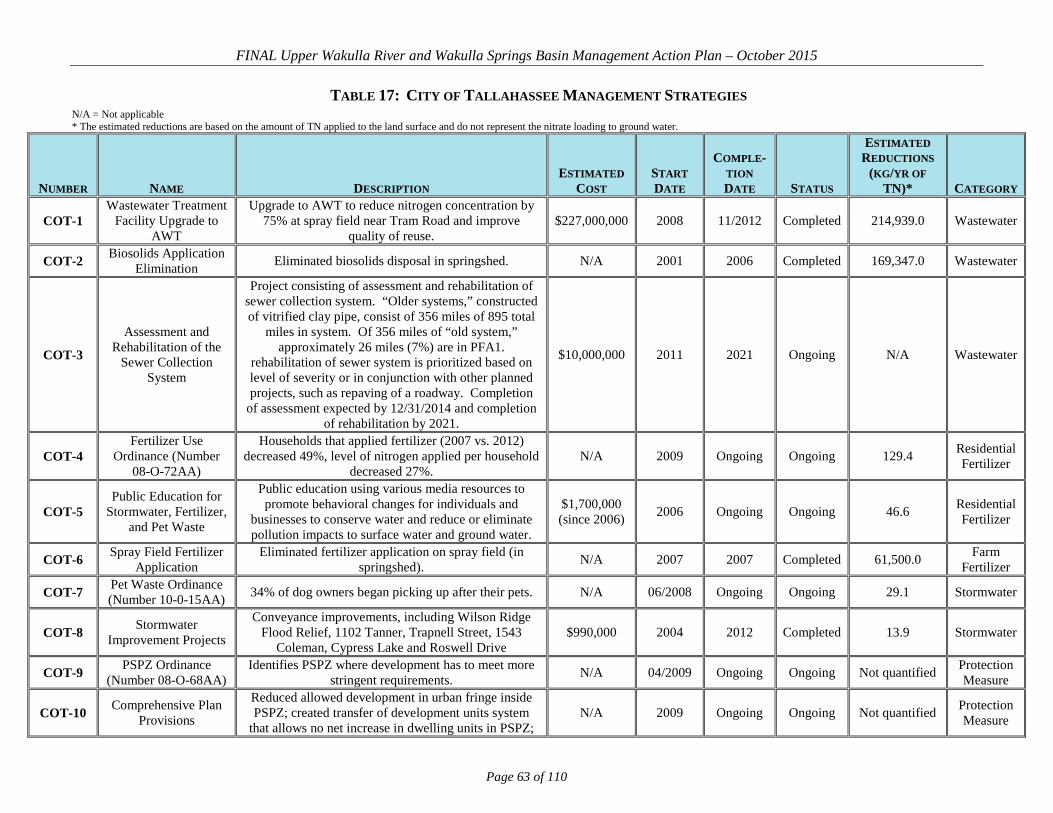
FINAL Upper Wakulla River and Wakulla Springs Basin Management Action Plan – October 2015
Page 63 of 110
TABLE 17: CITY OF TALLAHASSEE MANAGEMENT STRATEGIES N/A = Not applicable * The estimated reductions are based on the amount of TN applied to the land surface and do not represent the nitrate loading to ground water.
NUMBER NAME DESCRIPTION ESTIMATED
COST START DATE
COMPLE-TION DATE STATUS
ESTIMATED REDUCTIONS
(KG/YR OF TN)* CATEGORY
COT-1 Wastewater Treatment
Facility Upgrade to AWT
Upgrade to AWT to reduce nitrogen concentration by 75% at spray field near Tram Road and improve
quality of reuse. $227,000,000 2008 11/2012 Completed 214,939.0 Wastewater
COT-2 Biosolids Application Elimination Eliminated biosolids disposal in springshed. N/A 2001 2006 Completed 169,347.0 Wastewater
COT-3
Assessment and Rehabilitation of the
Sewer Collection System
Project consisting of assessment and rehabilitation of sewer collection system. “Older systems,” constructed of vitrified clay pipe, consist of 356 miles of 895 total
miles in system. Of 356 miles of “old system,” approximately 26 miles (7%) are in PFA1.
rehabilitation of sewer system is prioritized based on level of severity or in conjunction with other planned projects, such as repaving of a roadway. Completion
of assessment expected by 12/31/2014 and completion of rehabilitation by 2021.
$10,000,000 2011 2021 Ongoing N/A Wastewater
COT-4 Fertilizer Use
Ordinance (Number 08-O-72AA)
Households that applied fertilizer (2007 vs. 2012) decreased 49%, level of nitrogen applied per household
decreased 27%. N/A 2009 Ongoing Ongoing 129.4 Residential
Fertilizer
COT-5 Public Education for
Stormwater, Fertilizer, and Pet Waste
Public education using various media resources to promote behavioral changes for individuals and
businesses to conserve water and reduce or eliminate pollution impacts to surface water and ground water.
$1,700,000 (since 2006) 2006 Ongoing Ongoing 46.6 Residential
Fertilizer
COT-6 Spray Field Fertilizer Application
Eliminated fertilizer application on spray field (in springshed). N/A 2007 2007 Completed 61,500.0 Farm
Fertilizer
COT-7 Pet Waste Ordinance (Number 10-0-15AA) 34% of dog owners began picking up after their pets. N/A 06/2008 Ongoing Ongoing 29.1 Stormwater
COT-8 Stormwater Improvement Projects
Conveyance improvements, including Wilson Ridge Flood Relief, 1102 Tanner, Trapnell Street, 1543
Coleman, Cypress Lake and Roswell Drive $990,000 2004 2012 Completed 13.9 Stormwater
COT-9 PSPZ Ordinance (Number 08-O-68AA)
Identifies PSPZ where development has to meet more stringent requirements. N/A 04/2009 Ongoing Ongoing Not quantified Protection
Measure
COT-10 Comprehensive Plan Provisions
Reduced allowed development in urban fringe inside PSPZ; created transfer of development units system
that allows no net increase in dwelling units in PSPZ; N/A 2009 Ongoing Ongoing Not quantified Protection
Measure

FINAL Upper Wakulla River and Wakulla Springs Basin Management Action Plan – October 2015
Page 64 of 110
NUMBER NAME DESCRIPTION ESTIMATED
COST START DATE
COMPLE-TION DATE STATUS
ESTIMATED REDUCTIONS
(KG/YR OF TN)* CATEGORY
(Conservation Element Policy 4.2.5)
and allows transfer of development rights from rural to urban fringe areas into Woodville.
COT-11/LC-29
Alternatives to Sewer Solutions Study
Funding to study and develop preferred options for management alternatives to traditional OSTDS in
unincorporated areas of Leon County, including PSPZ; identify preferred options for responsible management entities, including recommendations for financing and management structures for identified preferred options; recommend regulatory measures; identify other issues
related to sewage treatment and disposal system financing.
Unknown 2018 2019
Adopted in Sales
Tax Project
List
Planning for comprehensive
long-term reduction for
development in unincorporated
area
OSTDS
TOTAL COST = $239,690,000 TOTAL ESTIMATED REDUCTIONS = 446,005.0 KG/YR OF TN

FINAL Upper Wakulla River and Wakulla Springs Basin Management Action Plan – October 2015
Page 65 of 110
TABLE 18: LEON COUNTY MANAGEMENT STRATEGIES N/A = Not applicable * The estimated reductions are based on the amount of TN applied to the land surface and do not represent the nitrate loading to ground water. ** The estimated project cost is only for adding the sewer force main in the PSPZ. There will be additional costs for the homeowners to connect to the sewer system. *** The estimated reductions for this project are for a one-time removal of nutrients. Therefore, the benefits from this project will not occur on an annual basis.
NUMBER NAME DESCRIPTION ESTIMATED
COST START DATE
COMPLE-TION DATE STATUS
ESTIMATED REDUCTIONS
(KG/YR OF TN)* CATEGORY
LC-1 Sewering in PSPZ
County identified project both in its adopted sewer master plan and water and sewer interlocal agreement
with city as targeted area for sewer. Funds for project are available through county’s share of
Blueprint Water Quality Funding supported by local infrastructure sales tax, subject to annual budget and
appropriation.
$24,500,000** 2020 2025 Proposed
Reductions will be calculated
as part of OSTDS Initiative
OSTDS
LC-2 Septic Tank Inventory Preparation of GIS inventory of all septic systems in Leon County. $50,000 2013 2015 Proposed N/A OSTDS
LC-3 Septic Tank Repairs Proposed revision to septic tank ordinance to require
repairs to have minimum of 24 inches separation between drainfield and seasonal high water table.
Staff time 2015 2016 Proposed N/A OSTDS
LC-4 Septic Tank Nitrogen
Removal Requirements
Pending results of FDOH evaluation of passive systems, as referenced in Section 381.0065(4)(x), F.S, county shall(1) review results of this Florida study of nitrogen-reducing, performance-based OSTDS, including passive systems; (2) identify
passive systems regulated under Section 381.0065, F.S., approved by state for permitting and appropriate for use in Leon County; (3) evaluate factors such as
cost and operational feasibility of such passive systems; and (4) develop proposed amendment to
code of laws requiring the of appropriate systems for new construction in PSPZ.
Staff time 2015 2017 Proposed N/A OSTDS
LC-5 Septic Tank Education
Add educational kiosks at Woodville Community Center to explain how septic systems work. $2,500 2015 2016 Proposed 21.7 OSTDS
LC-6
Enacted Comprehensive
Fertilizer Ordinance (Number 09-34)
Requires commercial applicators to follow set of BMPs for fertilizer application. Staff time 2009 2009 Completed 12.4 Residential
Fertilizer
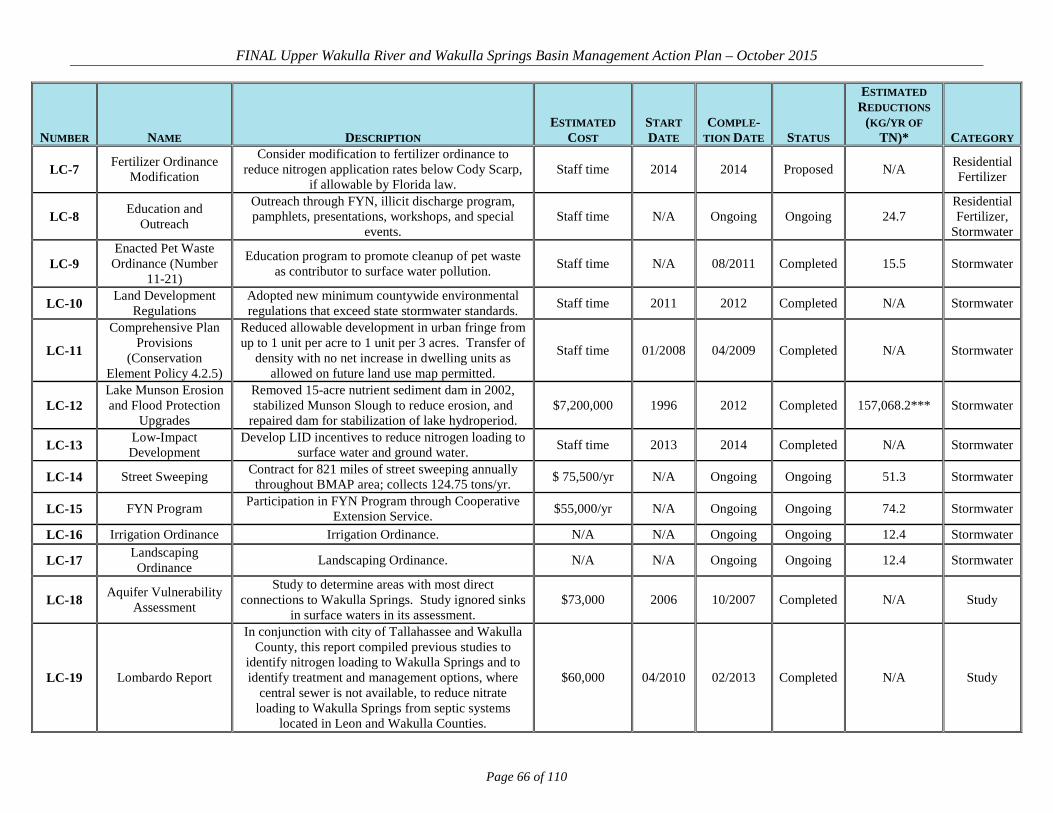
FINAL Upper Wakulla River and Wakulla Springs Basin Management Action Plan – October 2015
Page 66 of 110
NUMBER NAME DESCRIPTION ESTIMATED
COST START DATE
COMPLE-TION DATE STATUS
ESTIMATED REDUCTIONS
(KG/YR OF TN)* CATEGORY
LC-7 Fertilizer Ordinance Modification
Consider modification to fertilizer ordinance to reduce nitrogen application rates below Cody Scarp,
if allowable by Florida law. Staff time 2014 2014 Proposed N/A Residential
Fertilizer
LC-8 Education and Outreach
Outreach through FYN, illicit discharge program, pamphlets, presentations, workshops, and special
events. Staff time N/A Ongoing Ongoing 24.7
Residential Fertilizer,
Stormwater
LC-9 Enacted Pet Waste
Ordinance (Number 11-21)
Education program to promote cleanup of pet waste as contributor to surface water pollution. Staff time N/A 08/2011 Completed 15.5 Stormwater
LC-10 Land Development Regulations
Adopted new minimum countywide environmental regulations that exceed state stormwater standards. Staff time 2011 2012 Completed N/A Stormwater
LC-11
Comprehensive Plan Provisions
(Conservation Element Policy 4.2.5)
Reduced allowable development in urban fringe from up to 1 unit per acre to 1 unit per 3 acres. Transfer of
density with no net increase in dwelling units as allowed on future land use map permitted.
Staff time 01/2008 04/2009 Completed N/A Stormwater
LC-12 Lake Munson Erosion and Flood Protection
Upgrades
Removed 15-acre nutrient sediment dam in 2002, stabilized Munson Slough to reduce erosion, and
repaired dam for stabilization of lake hydroperiod. $7,200,000 1996 2012 Completed 157,068.2*** Stormwater
LC-13 Low-Impact Development
Develop LID incentives to reduce nitrogen loading to surface water and ground water. Staff time 2013 2014 Completed N/A Stormwater
LC-14 Street Sweeping Contract for 821 miles of street sweeping annually throughout BMAP area; collects 124.75 tons/yr. $ 75,500/yr N/A Ongoing Ongoing 51.3 Stormwater
LC-15 FYN Program Participation in FYN Program through Cooperative Extension Service. $55,000/yr N/A Ongoing Ongoing 74.2 Stormwater
LC-16 Irrigation Ordinance Irrigation Ordinance. N/A N/A Ongoing Ongoing 12.4 Stormwater
LC-17 Landscaping Ordinance Landscaping Ordinance. N/A N/A Ongoing Ongoing 12.4 Stormwater
LC-18 Aquifer Vulnerability Assessment
Study to determine areas with most direct connections to Wakulla Springs. Study ignored sinks
in surface waters in its assessment. $73,000 2006 10/2007 Completed N/A Study
LC-19 Lombardo Report
In conjunction with city of Tallahassee and Wakulla County, this report compiled previous studies to
identify nitrogen loading to Wakulla Springs and to identify treatment and management options, where
central sewer is not available, to reduce nitrate loading to Wakulla Springs from septic systems
located in Leon and Wakulla Counties.
$60,000 04/2010 02/2013 Completed N/A Study

FINAL Upper Wakulla River and Wakulla Springs Basin Management Action Plan – October 2015
Page 67 of 110
NUMBER NAME DESCRIPTION ESTIMATED
COST START DATE
COMPLE-TION DATE STATUS
ESTIMATED REDUCTIONS
(KG/YR OF TN)* CATEGORY
LC-20 Water Quality Sampling Sample 73 sites in 13 lakes, 27 streams, and 2 rivers. $250,000 N/A Continuous Ongoing N/A Study
LC-21 Preparation of Annual Water Quality Report
Prepare and publish annual water quality report to document health of natural systems and use it to
prioritize water quality project needs. $15,000/yr N/A
Available in summer
of each year
Ongoing N/A Study
LC-22 Woodville Recharge Aquifer Protection
Study
EPA grant to study 60-square-mile Woodville Recharge Basin for flooding, water quality, and
aquifer protection. $300,000 2005 2007 Completed N/A Study
LC-23 Annual Wakulla Springs Status Report
Commitment to developing annual status report on Wakulla Springs for Board of County
Commissioners. Staff time 01/2014 01/2018 Ongoing N/A Study
LC-24 Established Primary Springs Protection
Zone (Number 09-12)
Enacted to establish defined area for enforcement for additional water quality protection in this zone. Staff time 2006 03/2009 Completed Not quantified Protection
Measure
LC-25 Eight Mile Pond
Acquisition of 132 acres immediately upstream of Ames Sink to preserve/protect sink. Property acquired through environmental permitting as
mitigation for Florida Gas Transmission Line linear impacts.
Staff time 2009 07/2010 Completed N/A Protection Measure
LC-26 Aquifer Wellhead
Protection Ordinance (Number 07-20)
Includes Aquifer Protection Program. Staff time N/A 07/2007 Completed N/A Protection Measure
LC-27 Litter Control Program
Maintain 2,316 miles of right-of-way, collecting 78.4 tons of waste. Staff time N/A Ongoing Ongoing N/A
Other Source Control
LC-28 Adopt-A-Road Program
Maintain 112 miles of right-of-way, collecting 2.11 tons of trash. N/A N/A Ongoing Ongoing N/A
Other Source Control

FINAL Upper Wakulla River and Wakulla Springs Basin Management Action Plan – October 2015
Page 68 of 110
NUMBER NAME DESCRIPTION ESTIMATED
COST START DATE
COMPLE-TION DATE STATUS
ESTIMATED REDUCTIONS
(KG/YR OF TN)* CATEGORY
LC-29/ COT-11
Alternatives to Sewer Solutions Study
Funding to study and develop preferred options for management alternatives to traditional OSTDS in unincorporated areas of Leon County, including PSPZ; identify preferred options for responsible
management entities, including recommendations for financing and management structures for identified preferred options; recommend regulatory measures; identify other issues related to sewage treatment and
disposal system financing.
Unknown 2018 2019
Adopted in Sales
Tax Project
List
Planning for comprehensive
long-term reduction for
development in unincorporated
area
OSTDS
TOTAL COST = $32,581,000 TOTAL ESTIMATED REDUCTIONS = 157,609.0 KG/YR OF TN

FINAL Upper Wakulla River and Wakulla Springs Basin Management Action Plan – October 2015
Page 69 of 110
TABLE 19: WAKULLA COUNTY MANAGEMENT STRATEGIES N/A = Not applicable TBD = To be determined * The estimated reductions are based on the amount of TN applied to the land surface and do not represent the nitrate loading to ground water.
NUMBER NAME DESCRIPTION ESTIMATED
COST START DATE
COMPLE-TION DATE STATUS
ESTIMATED REDUCTIONS
(KG/YR OF TN)* CATEGORY
WC-1
Comprehensive Plan
Infrastructure Policy 1.3.6
Requires AWT for any WWTF or spray field located in Wakulla Springs Special Planning Area. N/A 2006 Ongoing Ongoing Not quantified Wastewater
WC-2
Otter Creek WWTP
Upgrade and Capacity
Expansion
Upgrading and expanding capacity of Otter Creek WWTP from 0.6 to 1.2 mgd (funding secured through
USDA Rural Development loan/grant) $12,000,000 2015 TBD
Preliminary Engineering Plan is being revised and design in process
Not quantified WC-2
WC-3 Public
Education on OSTDS
Provide citizens and officials with best available information for decision making regarding use of
OSTDS and decentralized wastewater systems to reduce nutrients in ground water to springs.
N/A 2007 2007 Completed Not quantified OSTDS
WC-4
Comprehensive Plan
Infrastructure Policy 1.3.7
Requires nitrogen-reducing septic systems on parcels smaller than five acres in Wakulla Springs Special
Planning Area; within 150 feet of surface water, swallet, or other karst feature, or within 300 feet of first- or
second-magnitude spring; and on all parcels less than 0.229 acres in size.
N/A 2012 Ongoing Ongoing Not quantified OSTDS
WC-5
Magnolia Gardens Central
Sewer Installation –
Phase I
Planned central sewer installation for Magnolia Gardens Phase I. There are potentially 180 existing septic
system connections projected. Conceptual planning for Phases II and III is ongoing.
$4,300,000 Not finalized
Not finalized
Partially funded Not quantified OSTDS
WC-6
Wakulla Gardens Central
Sewer Installation –
Phase I
Planned central sewer installation for Wakulla Gardens Phase I. There are potentially 90 existing septic system connections projected. Conceptual planning for Phases
II and III is ongoing.
$4,300,000 Not finalized
Not finalized
Partially funded Not quantified OSTDS
WC-7
Greiner's Addition
Central Sewer Installation
Planned central sewer installation for Greiner's Addition neighborhood.
Not yet funded Unknown Unknown Not yet funded Not quantified OSTDS
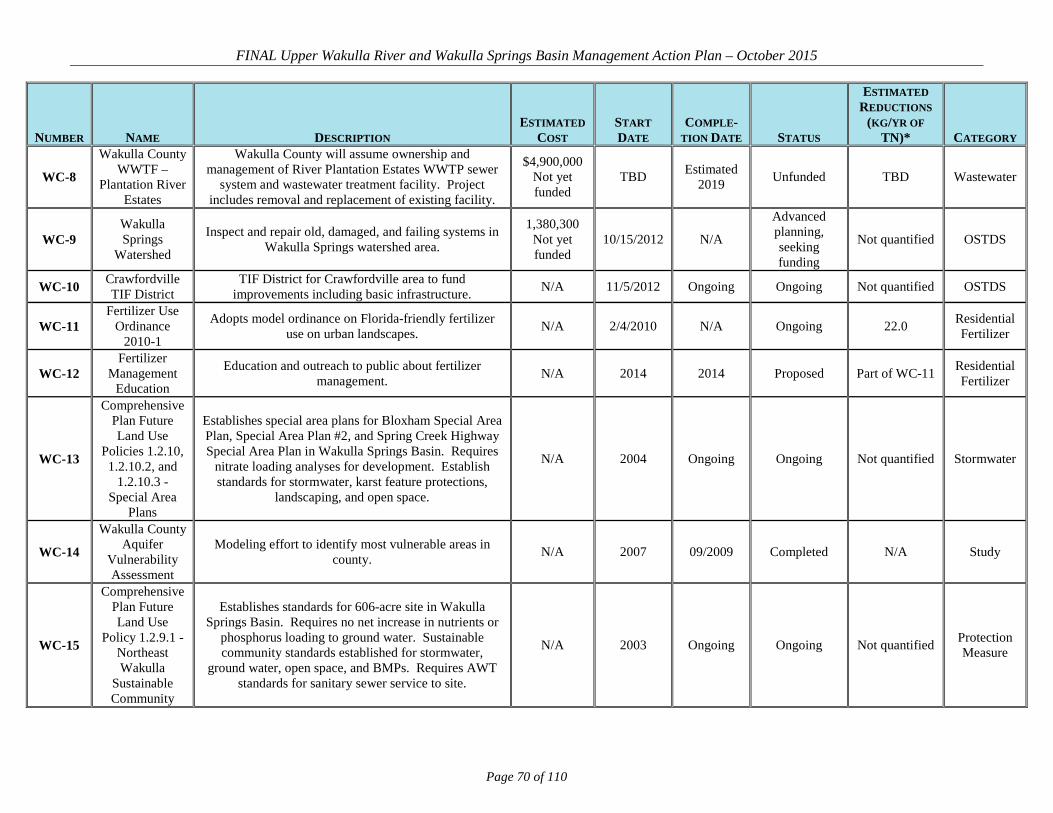
FINAL Upper Wakulla River and Wakulla Springs Basin Management Action Plan – October 2015
Page 70 of 110
NUMBER NAME DESCRIPTION ESTIMATED
COST START DATE
COMPLE-TION DATE STATUS
ESTIMATED REDUCTIONS
(KG/YR OF TN)* CATEGORY
WC-8
Wakulla County WWTF –
Plantation River Estates
Wakulla County will assume ownership and management of River Plantation Estates WWTP sewer
system and wastewater treatment facility. Project includes removal and replacement of existing facility.
$4,900,000 Not yet funded
TBD Estimated 2019 Unfunded TBD Wastewater
WC-9 Wakulla Springs
Watershed
Inspect and repair old, damaged, and failing systems in Wakulla Springs watershed area.
1,380,300 Not yet funded
10/15/2012 N/A
Advanced planning, seeking funding
Not quantified OSTDS
WC-10 Crawfordville TIF District
TIF District for Crawfordville area to fund improvements including basic infrastructure. N/A 11/5/2012 Ongoing Ongoing Not quantified OSTDS
WC-11 Fertilizer Use
Ordinance 2010-1
Adopts model ordinance on Florida-friendly fertilizer use on urban landscapes. N/A 2/4/2010 N/A Ongoing 22.0 Residential
Fertilizer
WC-12 Fertilizer
Management Education
Education and outreach to public about fertilizer management. N/A 2014 2014 Proposed Part of WC-11 Residential
Fertilizer
WC-13
Comprehensive Plan Future Land Use
Policies 1.2.10, 1.2.10.2, and
1.2.10.3 - Special Area
Plans
Establishes special area plans for Bloxham Special Area Plan, Special Area Plan #2, and Spring Creek Highway Special Area Plan in Wakulla Springs Basin. Requires
nitrate loading analyses for development. Establish standards for stormwater, karst feature protections,
landscaping, and open space.
N/A 2004 Ongoing Ongoing Not quantified Stormwater
WC-14
Wakulla County Aquifer
Vulnerability Assessment
Modeling effort to identify most vulnerable areas in county. N/A 2007 09/2009 Completed N/A Study
WC-15
Comprehensive Plan Future Land Use
Policy 1.2.9.1 - Northeast Wakulla
Sustainable Community
Establishes standards for 606-acre site in Wakulla Springs Basin. Requires no net increase in nutrients or
phosphorus loading to ground water. Sustainable community standards established for stormwater,
ground water, open space, and BMPs. Requires AWT standards for sanitary sewer service to site.
N/A 2003 Ongoing Ongoing Not quantified Protection Measure

FINAL Upper Wakulla River and Wakulla Springs Basin Management Action Plan – October 2015
Page 71 of 110
NUMBER NAME DESCRIPTION ESTIMATED
COST START DATE
COMPLE-TION DATE STATUS
ESTIMATED REDUCTIONS
(KG/YR OF TN)* CATEGORY
WC-16
Ordinance 2006-58 (Multiple
Objectives and Policies in
Comprehensive Plan
Conservation and Future Land Use Elements )
Add karst buffers; require nitrate loading study for proposed development greater than one acre (if karst feature on site is found to have direct connection to aquifer); incorporate FYN practices and landscaping
standards that promote native vegetation for new subdivisions; reduce nitrates from public facilities; and
address stormwater, water conservation, wastewater facilities, treated wastewater reuse, and natural water
flows.
N/A 2006 Ongoing Ongoing Not quantified Protection Measure
WC-17
Comprehensive Plan
Conservation Objective 12.0
Develop solutions to restore health of Wakulla Springs by reducing pollutants in ground water and
implementing policies for Wakulla Springs Special Planning Area.
N/A 2010 Ongoing Ongoing Not quantified Protection Measure
WC-18
Comprehensive Plan
Conservation Policy 12.1
Establishes transfer of development rights policy to encourage development in Crawfordville with
connection to sewer service, no future land use map amendments in PSPZ shall be permitted that would
result in net increase in residential density above two units per acre; fertilizer restrictions based on FYN
Program.
N/A 2010 Ongoing Ongoing N/A Protection Measure
WC-19
Comprehensive Plan
Conservation Policy 12.2
County will consider expanding Wakulla Springs Special Planning Area based on geological vulnerability. N/A 2010 Ongoing Ongoing N/A Protection
Measure
WC-20
Comprehensive Plan
Infrastructure Objective 2.5
To protect functions of ground water recharge areas, springs, and springsheds. N/A 1995 Ongoing Ongoing Not quantified Protection
Measure
WC-21 Ground Water
Extraction Ordinance
Requests NWFWMD to establish minimum flows and levels (MFLs) for Wakulla Springs and requests
NWFWMD to deny permits to transport water from Wakulla Springs springshed and Ochlockonee and St.
Marks Rivers.
N/A N/A 6/18/2012 Ongoing N/A Protection Measure
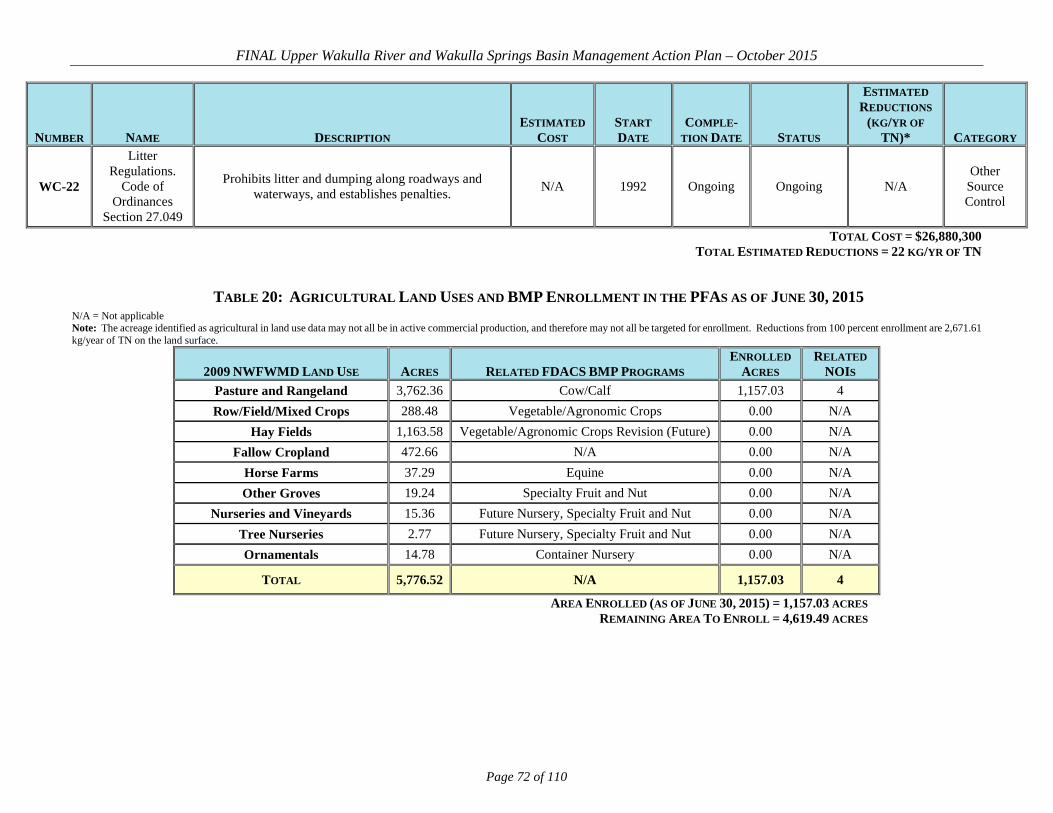
FINAL Upper Wakulla River and Wakulla Springs Basin Management Action Plan – October 2015
Page 72 of 110
NUMBER NAME DESCRIPTION ESTIMATED
COST START DATE
COMPLE-TION DATE STATUS
ESTIMATED REDUCTIONS
(KG/YR OF TN)* CATEGORY
WC-22
Litter Regulations.
Code of Ordinances
Section 27.049
Prohibits litter and dumping along roadways and waterways, and establishes penalties. N/A 1992 Ongoing Ongoing N/A
Other Source Control
TOTAL COST = $26,880,300 TOTAL ESTIMATED REDUCTIONS = 22 KG/YR OF TN
TABLE 20: AGRICULTURAL LAND USES AND BMP ENROLLMENT IN THE PFAS AS OF JUNE 30, 2015 N/A = Not applicable Note: The acreage identified as agricultural in land use data may not all be in active commercial production, and therefore may not all be targeted for enrollment. Reductions from 100 percent enrollment are 2,671.61 kg/year of TN on the land surface.
2009 NWFWMD LAND USE ACRES RELATED FDACS BMP PROGRAMS ENROLLED
ACRES RELATED
NOIS Pasture and Rangeland 3,762.36 Cow/Calf 1,157.03 4 Row/Field/Mixed Crops 288.48 Vegetable/Agronomic Crops 0.00 N/A
Hay Fields 1,163.58 Vegetable/Agronomic Crops Revision (Future) 0.00 N/A Fallow Cropland 472.66 N/A 0.00 N/A
Horse Farms 37.29 Equine 0.00 N/A Other Groves 19.24 Specialty Fruit and Nut 0.00 N/A
Nurseries and Vineyards 15.36 Future Nursery, Specialty Fruit and Nut 0.00 N/A Tree Nurseries 2.77 Future Nursery, Specialty Fruit and Nut 0.00 N/A Ornamentals 14.78 Container Nursery 0.00 N/A
TOTAL 5,776.52 N/A 1,157.03 4
AREA ENROLLED (AS OF JUNE 30, 2015) = 1,157.03 ACRES REMAINING AREA TO ENROLL = 4,619.49 ACRES
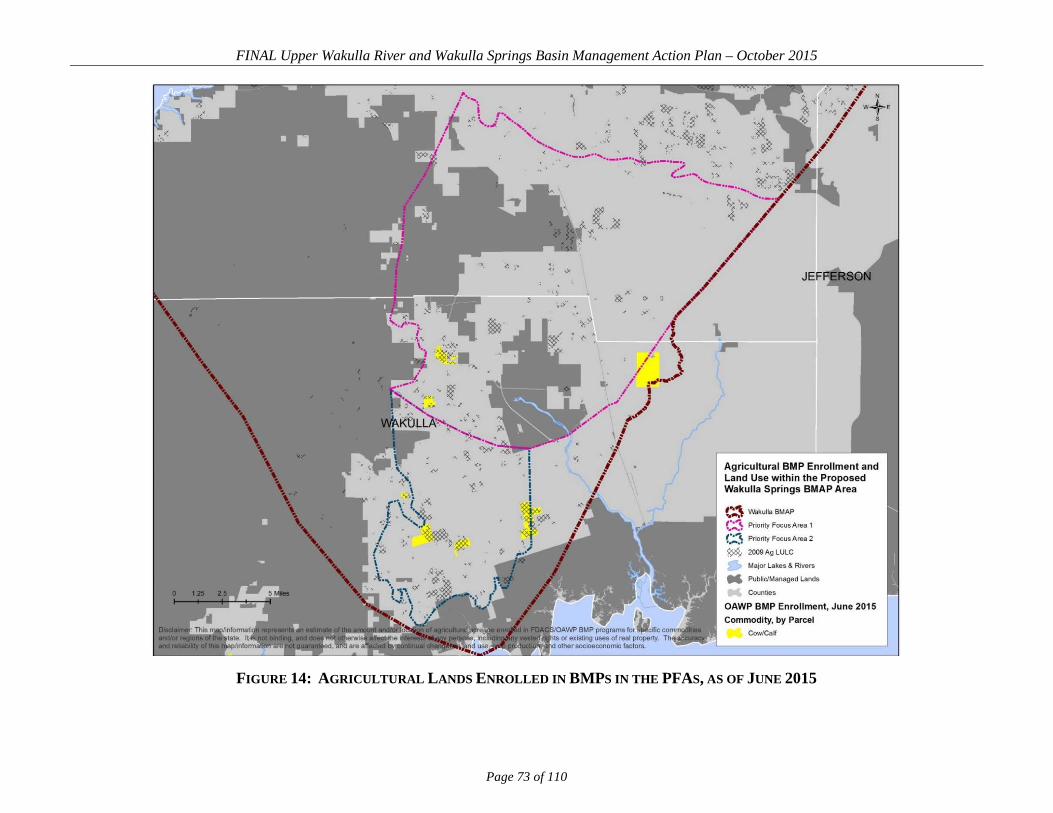
FINAL Upper Wakulla River and Wakulla Springs Basin Management Action Plan – October 2015
Page 73 of 110
FIGURE 14: AGRICULTURAL LANDS ENROLLED IN BMPS IN THE PFAS, AS OF JUNE 2015
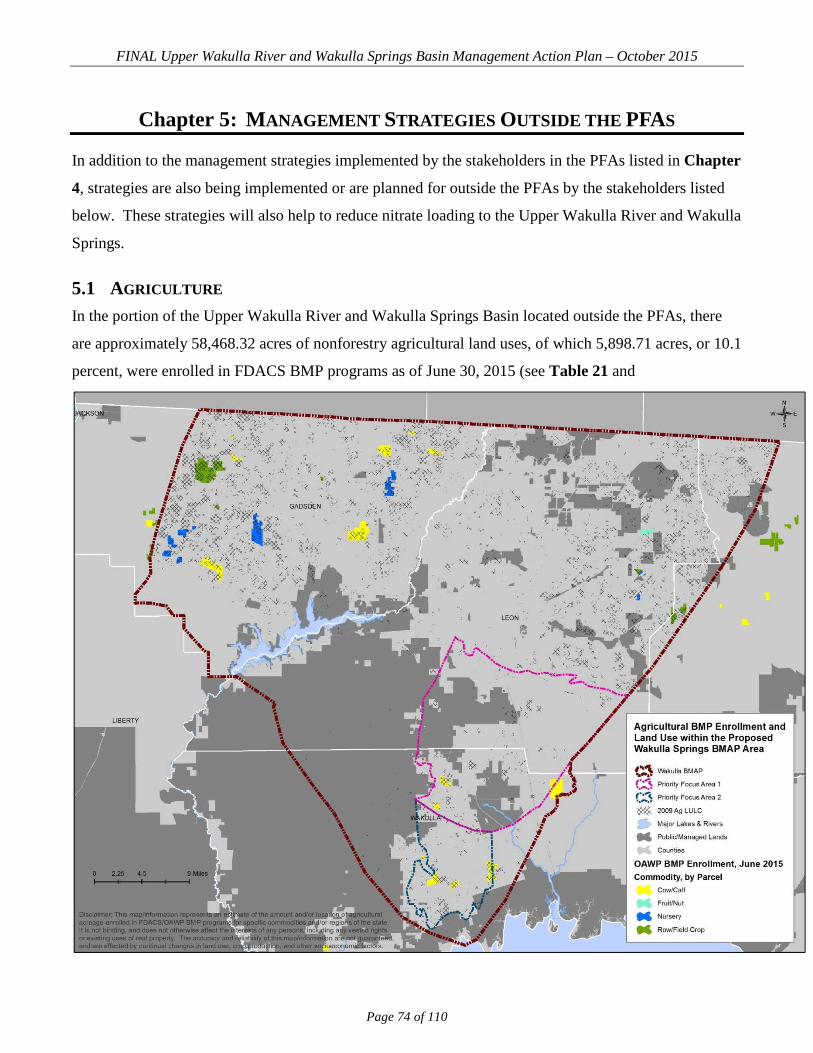
FINAL Upper Wakulla River and Wakulla Springs Basin Management Action Plan – October 2015
Page 74 of 110
Chapter 5: MANAGEMENT STRATEGIES OUTSIDE THE PFAS
In addition to the management strategies implemented by the stakeholders in the PFAs listed in Chapter
4, strategies are also being implemented or are planned for outside the PFAs by the stakeholders listed
below. These strategies will also help to reduce nitrate loading to the Upper Wakulla River and Wakulla
Springs.
5.1 AGRICULTURE In the portion of the Upper Wakulla River and Wakulla Springs Basin located outside the PFAs, there
are approximately 58,468.32 acres of nonforestry agricultural land uses, of which 5,898.71 acres, or 10.1
percent, were enrolled in FDACS BMP programs as of June 30, 2015 (see Table 21 and
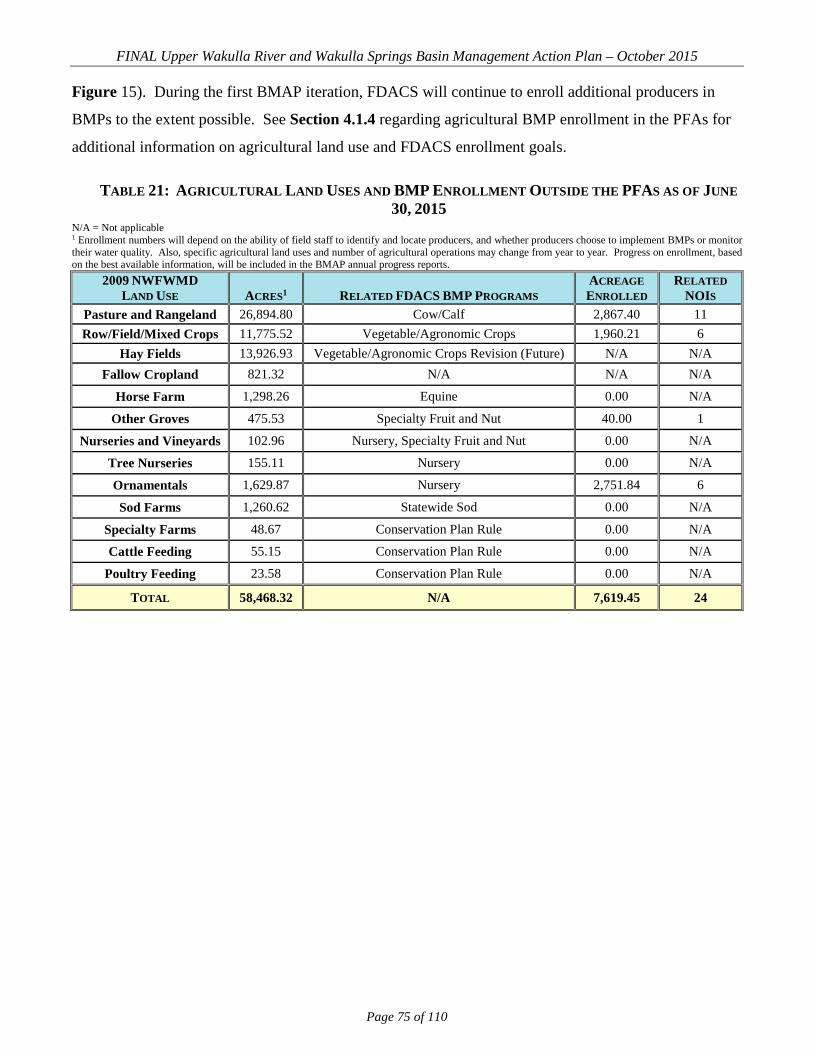
FINAL Upper Wakulla River and Wakulla Springs Basin Management Action Plan – October 2015
Page 75 of 110
Figure 15). During the first BMAP iteration, FDACS will continue to enroll additional producers in
BMPs to the extent possible. See Section 4.1.4 regarding agricultural BMP enrollment in the PFAs for
additional information on agricultural land use and FDACS enrollment goals.
TABLE 21: AGRICULTURAL LAND USES AND BMP ENROLLMENT OUTSIDE THE PFAS AS OF JUNE 30, 2015
N/A = Not applicable 1 Enrollment numbers will depend on the ability of field staff to identify and locate producers, and whether producers choose to implement BMPs or monitor their water quality. Also, specific agricultural land uses and number of agricultural operations may change from year to year. Progress on enrollment, based on the best available information, will be included in the BMAP annual progress reports.
2009 NWFWMD LAND USE ACRES1 RELATED FDACS BMP PROGRAMS
ACREAGE ENROLLED
RELATED NOIS
Pasture and Rangeland 26,894.80 Cow/Calf 2,867.40 11 Row/Field/Mixed Crops 11,775.52 Vegetable/Agronomic Crops 1,960.21 6
Hay Fields 13,926.93 Vegetable/Agronomic Crops Revision (Future) N/A N/A Fallow Cropland 821.32 N/A N/A N/A
Horse Farm 1,298.26 Equine 0.00 N/A
Other Groves 475.53 Specialty Fruit and Nut 40.00 1
Nurseries and Vineyards 102.96 Nursery, Specialty Fruit and Nut 0.00 N/A
Tree Nurseries 155.11 Nursery 0.00 N/A
Ornamentals 1,629.87 Nursery 2,751.84 6
Sod Farms 1,260.62 Statewide Sod 0.00 N/A
Specialty Farms 48.67 Conservation Plan Rule 0.00 N/A
Cattle Feeding 55.15 Conservation Plan Rule 0.00 N/A
Poultry Feeding 23.58 Conservation Plan Rule 0.00 N/A
TOTAL 58,468.32 N/A 7,619.45 24

FINAL Upper Wakulla River and Wakulla Springs Basin Management Action Plan – October 2015
Page 76 of 110
FIGURE 15: AGRICULTURAL LANDS ENROLLED IN BMPS OUTSIDE THE PFAS, AS OF JUNE 2015
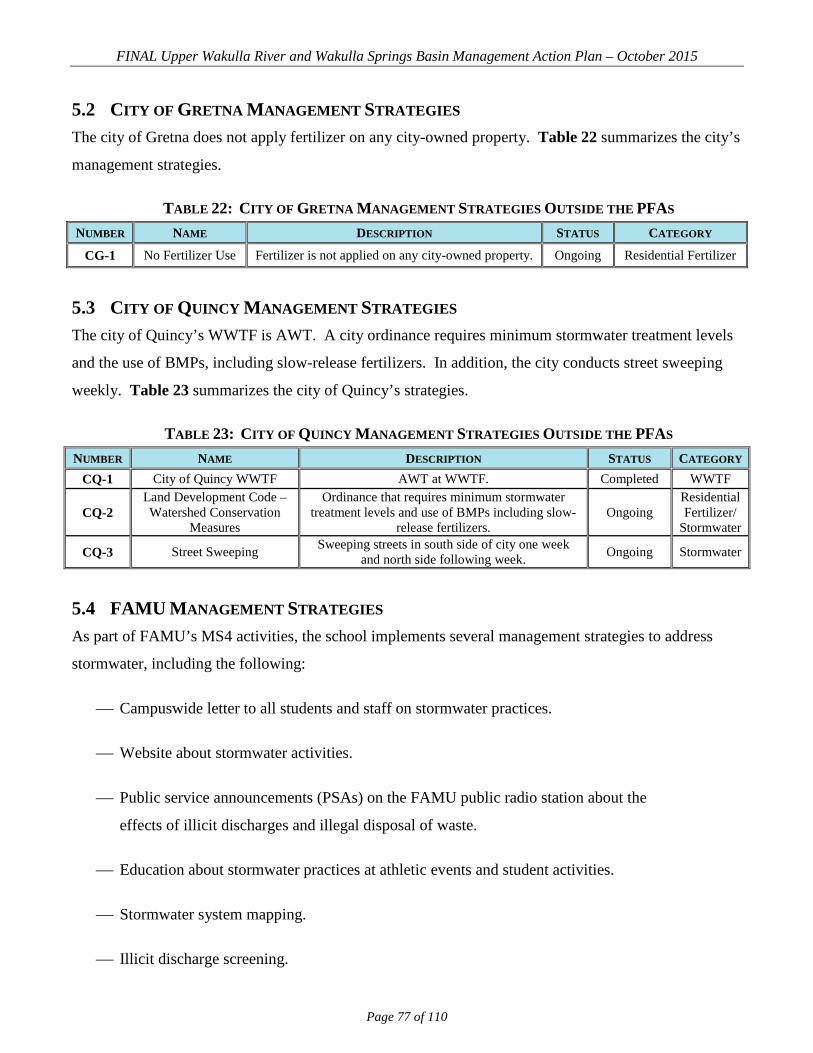
FINAL Upper Wakulla River and Wakulla Springs Basin Management Action Plan – October 2015
Page 77 of 110
5.2 CITY OF GRETNA MANAGEMENT STRATEGIES The city of Gretna does not apply fertilizer on any city-owned property. Table 22 summarizes the city’s
management strategies.
TABLE 22: CITY OF GRETNA MANAGEMENT STRATEGIES OUTSIDE THE PFAS NUMBER NAME DESCRIPTION STATUS CATEGORY
CG-1 No Fertilizer Use Fertilizer is not applied on any city-owned property. Ongoing Residential Fertilizer
5.3 CITY OF QUINCY MANAGEMENT STRATEGIES The city of Quincy’s WWTF is AWT. A city ordinance requires minimum stormwater treatment levels
and the use of BMPs, including slow-release fertilizers. In addition, the city conducts street sweeping
weekly. Table 23 summarizes the city of Quincy’s strategies.
TABLE 23: CITY OF QUINCY MANAGEMENT STRATEGIES OUTSIDE THE PFAS NUMBER NAME DESCRIPTION STATUS CATEGORY
CQ-1 City of Quincy WWTF AWT at WWTF. Completed WWTF
CQ-2 Land Development Code – Watershed Conservation
Measures
Ordinance that requires minimum stormwater treatment levels and use of BMPs including slow-
release fertilizers. Ongoing
Residential Fertilizer/
Stormwater
CQ-3 Street Sweeping Sweeping streets in south side of city one week and north side following week. Ongoing Stormwater
5.4 FAMU MANAGEMENT STRATEGIES As part of FAMU’s MS4 activities, the school implements several management strategies to address
stormwater, including the following:
Campuswide letter to all students and staff on stormwater practices.
Website about stormwater activities.
Public service announcements (PSAs) on the FAMU public radio station about the
effects of illicit discharges and illegal disposal of waste.
Education about stormwater practices at athletic events and student activities.
Stormwater system mapping.
Illicit discharge screening.

FINAL Upper Wakulla River and Wakulla Springs Basin Management Action Plan – October 2015
Page 78 of 110
Stormwater system inspections and maintenance.
Street sweeping.
Table 24 summarizes FAMU’s management strategies.
TABLE 24: FAMU MANAGEMENT STRATEGIES OUTSIDE THE PFAS NUMBER NAME DESCRIPTION STATUS CATEGORY
FAMU-1 NPDES MS4 Permit Stormwater system maintenance and education. Ongoing Stormwater
5.5 FEDERAL CORRECTIONAL INSTITUTION, TALLAHASSEE MANAGEMENT STRATEGIES
The Federal Correctional Institution, Tallahassee maintains approximately 255 catch basins/stormwater
drains that make up the MS4 system. These catch basins/stormwater drains are inspected quarterly. In
addition, no fertilizer is applied on the facility grounds. Table 25 summarizes the Federal Correctional
Institution, Tallahassee’s management strategies.
TABLE 25: FEDERAL CORRECTIONAL INSTITUTION, TALLAHASSEE MANAGEMENT STRATEGIES OUTSIDE THE PFAS
NUMBER NAME DESCRIPTION STATUS CATEGORY FCI-1 NPDES MS4 Permit Stormwater system inspection and maintenance. Ongoing Stormwater FCI-2 No Fertilizer Use Fertilizer is not applied on facility grounds. Ongoing Fertilizer
5.6 FSU MANAGEMENT STRATEGIES FSU has a fertilizer rule in its University Master Plan that requires the use of slow-release fertilizers
and/or carefully managed fertilizer application times to minimize the leaching of nutrients to ground
water. Dehydrated cow manure with a 2-1-2 analysis is used when planting, and a 15-0-15 mix with
half of the nitrogen water-insoluble is used twice a year on turfgrass in high-priority areas such as
athletic fields.
Through the MS4 permit, FSU also implements several management strategies to address stormwater
including the following:
Newsletter distributed several times per year to all faculty and staff through the mail
and also electronically.
Website about stormwater activities.

FINAL Upper Wakulla River and Wakulla Springs Basin Management Action Plan – October 2015
Page 79 of 110
On-campus PSAs.
Base map of the entire campus stormwater drainage system.
Illicit discharge policies.
Stormwater hotline for faculty, staff, students, and visitors to report potential violations.
Litter control and grounds maintenance.
Table 26 summarizes FSU’s management strategies.
TABLE 26: FSU MANAGEMENT STRATEGIES OUTSIDE THE PFAS N/A = Not applicable
NUMBER NAME DESCRIPTION START DATE STATUS CATEGORY
FSU-1 Fertilizer Rule in University Master
Plan
Use slow-release fertilizers and/or carefully managed fertilizer applications to ensure
maximum root uptake and minimal surface water runoff or leaching to ground water.
2008 Ongoing Fertilizer
FSU-2 NPDES MS4 Permit
Stormwater system maintenance and education. N/A Ongoing Stormwater
5.7 GADSDEN COUNTY MANAGEMENT STRATEGIES Gadsden County has a comprehensive plan policy that requires a 100-foot setback for OSTDS from
surface waters and wetlands, helping to minimize loading from OSTDS to surface waterbodies. The
county also has a policy that requires water and sewer connection for any new development that occurs
within 0.25 miles of available service that will help to reduce the number of OSTDS installed in the
future in the areas of central sewer connection. In addition, the county has a policy requiring a 50-foot
natural buffer around jurisdictional wetlands, rivers, creeks, streams, and lakes. Gadsden County has
adopted minimum procedures, policies, and design standards to manage stormwater runoff, known as
the Gadsden County Stormwater Policy and Procedures Manual. The county’s stormwater pollution
abatement requirements are increased by 50 percent (1.5 times the normal treatment requirements) for
facilities discharging into waterways and waterbodies recognized by the state as requiring special
protection. Table 27 summarizes Gadsden County’s management strategies.

FINAL Upper Wakulla River and Wakulla Springs Basin Management Action Plan – October 2015
Page 80 of 110
TABLE 27: GADSDEN COUNTY MANAGEMENT STRATEGIES OUTSIDE THE PFAS
NUMBER NAME DESCRIPTION STATUS CATEGORY
GC-1 Comprehensive Plan Policy 4.5.1 and 5.2.11 in Infrastructure and Conservation Element
Requires 100-foot setback for OSTDS from wetlands, creeks, streams, lakes,
etc. Ongoing OSTDS
GC-2 Comprehensive Plan Policy 5.2.4 and 5.2.11 in Conservation Element
Requires 50-foot natural buffer around all jurisdictional wetlands. Ongoing Protection
Measure
GC-3 Comprehensive Plan Infrastructure Element Water and sewer connection required
for new development within 0.25 miles of available service.
Ongoing Wastewater
GC-4 Section 3.4 Special Drainage Basins - Water Quality (Pollution Abatement) in Stormwater
Policies and Procedures Manual
Requires 1.5 times normal treatment requirement. Ongoing Stormwater
5.8 TALQUIN ELECTRIC COOPERATIVE MANAGEMENT STRATEGIES Talquin Electric Cooperative completed a project on Highway 267 to add central sewer, eliminating
OSTDS for an existing motel and two future hotels. It also added a sewer system along Beech Ridge
Trail in Leon County, removing 12 homes from OSTDS. Talquin is currently in the process of
abandoning the Oyster Bay WWTP, removing the plant’s discharge from the coastal area. The sewer
collection system associated with this WWTP will be connected to Wakulla County’s WWTF. Talquin
is also looking to obtain funding to upgrade the Gadsden East WWTP to add a treatment wetland,
resulting in zero effluent discharge from this facility.

FINAL Upper Wakulla River and Wakulla Springs Basin Management Action Plan – October 2015
Page 81 of 110
Table 28 summarizes Talquin’s management strategies.

FINAL Upper Wakulla River and Wakulla Springs Basin Management Action Plan – October 2015
Page 82 of 110
TABLE 28: TALQUIN ELECTRIC COOPERATIVE MANAGEMENT STRATEGIES OUTSIDE THE PFAS * The estimated reductions are based on the amount of TN applied to the land surface and do not represent the nitrate loading to ground water.
NUMBER NAME DESCRIPTION ESTIMATED
COST COMPLE-
TION DATE STATUS
ESTIMATED TN
REDUCTION* CATEGORY
TEC-1 Oyster Bay
WWTP Abandonment
Decommissioned to connect coastal area
sewer system to Wakulla County's sewer system in
effort to move WWTP away from coastal areas.
$750,000 9/1/2013 Construction 100% Wastewater
TEC-2 Gadsden East WWTP
Construct treatment wetland by retrofitting three existing RIBs and
building additional treatment cells, so te
wetland has zero effluent discharge. Wetland's
nitrogen reduction will be achieved through te
natural wetland process and will require very little energy for operation and
maintenance.
$200,000 12/31/2013 Planned; seeking funding
98% Wastewater
TEC-3 Highway 267 Sewer
Partnership with Gadsden County and city of
Quincy to provide central sewer system to Highway 267/I-10 interchange for existing motel and two
future , eliminating OSTDS.
$400,000 06/2008 Completed 80% Wastewater
TEC-4 Beech Ridge Trail Sewer
Sewer system along Beech Ridge Trail to
remove approximately 12 homes from OSTDS.
$40,000 12/2004 Completed 80% Wastewater
TOTAL ESTIMATED COST = $1,390,000
5.9 TCC MANAGEMENT STRATEGIES In spring 2012, TCC stopped applying fertilizer on the main campus. The previous applications were
between 2,000 and 2,400 pounds of 18-0-18 fertilizer to the centipede sod throughout the campus each
spring. In addition, TCC cut in half the amount of fertilizer used on the athletic fields. The new
application rate is 300 pounds of fertilizer on the baseball field and 100 pounds of fertilizer on the
softball and intramural fields, applied three times per year. TCC will continue this reduction in fertilizer
application on the main campus and athletic fields. Table 29 summarizes TCC’s management
strategies.

FINAL Upper Wakulla River and Wakulla Springs Basin Management Action Plan – October 2015
Page 83 of 110
TABLE 29: TCC MANAGEMENT STRATEGIES OUTSIDE THE PFAS
NUMBER NAME DESCRIPTION START DATE STATUS CATEGORY
TCC-1 Fertilizer Cessation
Cessation of fertilizer application on main campus and reduction of application on athletic
fields by half. 12/2012 Ongoing Residential
Fertilizer
5.10 TOWN OF HAVANA MANAGEMENT STRATEGIES The town of Havana conducts quarterly sweeping of all the streets within the town limits, helping to
reduce the amount of pollutants that run off from the roads. Table 30 summarizes the town of Havana’s
management strategies.
TABLE 30: TOWN OF HAVANA MANAGEMENT STRATEGIES OUTSIDE THE PFAS NUMBER NAME DESCRIPTION STATUS CATEGORY
TH-1 Street Sweeping Quarterly street sweeping of all town roads. Ongoing Stormwater
5.11 LEON COUNTY MANAGEMENT STRATEGIES OUTSIDE THE PFAS In addition to the activities conducted by the county in the PFA, the county has constructed stormwater
retrofits and acquired land for preservation and wetland rehydration projects, as summarized in Table
30.
TABLE 31: LEON COUNTY MANAGEMENT STRATEGIES OUTSIDE THE PFAS * The estimated reductions are based on the amount of TN applied to the land surface and do not represent the nitrate loading to ground water.
NUMBER NAME DESCRIPTION ESTIMATE
D COST COMPLE-
TION DATE STATUS
ESTIMATED REDUCTIONS
(KG/YR OF TN)* CATEGORY
LC-29 Harbinwood
Estates Ponds
Constructed two stormwater retrofit ponds and
planted/stabilized 1,200 linear feet of channel.
$2,980,000 06/2008 Completed 108.0 Stormwater
LC-30 Fuller Road
Regional Facility
Constructed 10-acre stormwater retrofit facility at Interstate-10
and Highway 27. $800,000 03/2010 Completed 208.2 Stormwater
LC-31 Fred George
Basin Acquisition
Acquisition of 166 acres, including Fred George Sink, for preservation/protection of sink.
$2,600,000 2012 Completed N/A Protection Measure
LC-32
Fred George Basin
Wetland Rehydration
Wetland rehydration through grade restoration and
construction of trash racks at inflow points are planned to
improve water quality prior to runoff entering Fred George
Sink.
$200,000 (survey), $800,000 (construc-
tion)
2019 Planned N/A Protection Measure
TOTAL ESTIMATED COST = $7,380,000 TOTAL ESTIMATED REDUCTIONS = 316.2 KG/YR OF TN
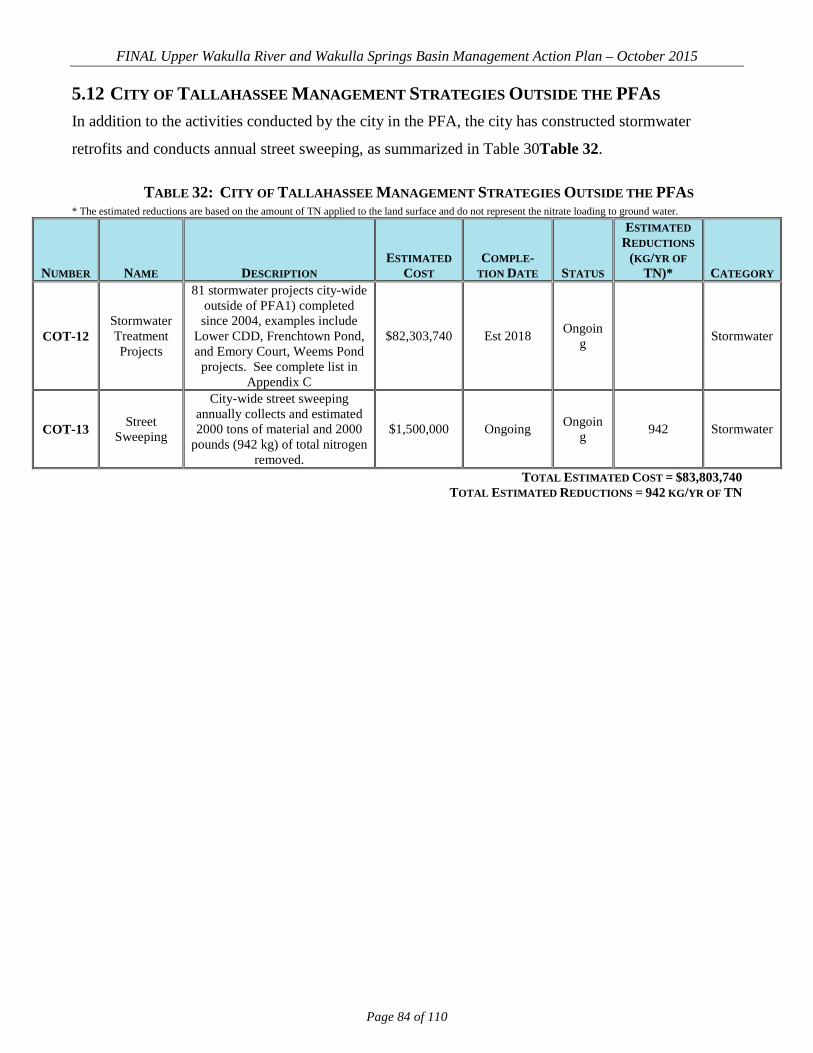
FINAL Upper Wakulla River and Wakulla Springs Basin Management Action Plan – October 2015
Page 84 of 110
5.12 CITY OF TALLAHASSEE MANAGEMENT STRATEGIES OUTSIDE THE PFAS In addition to the activities conducted by the city in the PFA, the city has constructed stormwater
retrofits and conducts annual street sweeping, as summarized in Table 30Table 32.
TABLE 32: CITY OF TALLAHASSEE MANAGEMENT STRATEGIES OUTSIDE THE PFAS * The estimated reductions are based on the amount of TN applied to the land surface and do not represent the nitrate loading to ground water.
NUMBER NAME DESCRIPTION ESTIMATED
COST COMPLE-
TION DATE STATUS
ESTIMATED REDUCTIONS
(KG/YR OF TN)* CATEGORY
COT-12 Stormwater Treatment Projects
81 stormwater projects city-wide outside of PFA1) completed since 2004, examples include
Lower CDD, Frenchtown Pond, and Emory Court, Weems Pond
projects. See complete list in Appendix C
$82,303,740 Est 2018 Ongoing Stormwater
COT-13 Street Sweeping
City-wide street sweeping annually collects and estimated 2000 tons of material and 2000
pounds (942 kg) of total nitrogen removed.
$1,500,000 Ongoing Ongoing 942 Stormwater
TOTAL ESTIMATED COST = $83,803,740 TOTAL ESTIMATED REDUCTIONS = 942 KG/YR OF TN

FINAL Upper Wakulla River and Wakulla Springs Basin Management Action Plan – October 2015
Page 85 of 110
Chapter 6: ASSESSING PROGRESS AND MAKING CHANGES
Successful BMAP implementation requires commitment and follow-up. In the commitment to plan
implementation (see Section 6.5), stakeholders have expressed their intention to carry out the plan,
monitor its effect, and continue to coordinate within and across jurisdictions to achieve water quality
targets. Stakeholders have committed to and are required to implement the assigned projects and
activities in the first five-year phase of this BMAP. The FWRA requires that an assessment be
conducted every five years to determine whether there is reasonable progress in achieving pollutant load
reductions. This chapter contains the water quality monitoring component sufficient to make this
evaluation.
6.1 TRACKING IMPLEMENTATION The department will work with stakeholders to track project implementation and organize the
monitoring data collected each year. The project and monitoring information will be presented in an
annual report. In addition to activities for the OSTDS Initiative, the Upper Wakulla River and Wakulla
Springs stakeholders have agreed to meet approximately every 12 months after the adoption of the
BMAP to follow up on plan implementation, share new information, and continue to coordinate on
TMDL-related issues. The following types of activities may occur at annual meetings:
Implementation Data and Reporting –
o Collect project implementation information from stakeholders, MS4 permit reporting,
WWTF upgrade plans, and FDACS agricultural BMP enrollment and compare with the
BMAP schedule.
o Discuss the data collection process, including any concerns and possible improvements
to the process.
o Review the monitoring plan implementation, as detailed in Section 6.3.
o Department will annually collect FDOH OSTDS data by county and by PFA areas to
track new, repaired, and upgraded systems and will provide the information to
stakeholders.
Sharing New Information –
o Report on results from water quality and biological monitoring and trend information.
FINAL Upper Wakulla River and Wakulla Springs Basin Management Action Plan – October 2015
Page 86 of 110
o Provide updates on new management strategies in the basin that will help reduce
nutrient loading.
o Identify and review new scientific developments in addressing nutrient loads and
incorporate any new information into annual progress reports.
Coordinating TMDL-Related Issues –
o Provide updates from the department on the basin cycle and activities related to any
impairments, TMDLs, and BMAP.
o Obtain reports from other basins where tools or other information may be applicable to
the Upper Wakulla River and Wakulla Springs TMDL.
Covering all of these topics is not required for the annual meetings, but this list provides examples of the
types of information that should be considered for the agenda to assist with BMAP implementation and
improve coordination among the agencies and stakeholders.
6.2 ADAPTIVE MANAGEMENT MEASURES Adaptive management involves setting up a mechanism for making adjustments in the BMAP when
circumstances change or feedback indicates the need for a more effective strategy. Adaptive
management measures include the following:
Procedures to determine whether additional cooperative strategies are needed.
Criteria/processes for determining whether and when plan components need revision
due to changes in costs, environmental impacts, social effects, watershed conditions, or
other factors.
Descriptions of stakeholders’ role after BMAP completion.
Key components of adaptive management to share information and expertise are tracking plan
implementation, monitoring water quality and pollutant loads, and holding periodic meetings. BMAP
execution will be a long-term process, and some projects will extend beyond the first BMAP phase. For
example, during the first iteration, the OSTDS Initiative will be implemented to identify what strategies
are most applicable to the basin to reduce nitrate loading, determine a timeline for future strategies, and
identify which stakeholders are responsible for implementing the necessary strategies in the next BMAP
iteration.
FINAL Upper Wakulla River and Wakulla Springs Basin Management Action Plan – October 2015
Page 87 of 110
The department and stakeholders will track implementation efforts and monitor water quality to measure
effectiveness and ensure BMAP compliance. The stakeholders will meet approximately every 12
months to discuss implementation issues, consider new information, and, if the basin is not projected to
meet the TMDL, determine additional corrective actions. Information on the implementation of
management strategies will be collected annually from the participating entities and organized into
reports. The stakeholders will review these reports to assess progress towards meeting the BMAP goals.
6.3 WATER QUALITY MONITORING
6.3.1 MONITORING OBJECTIVES Focused objectives are critical for a monitoring strategy to provide the information needed to evaluate
implementation success. The primary objectives of the monitoring strategy for the Upper Wakulla River
and Wakulla Springs Basin are described below, and will be used to evaluate the success of the BMAP:
Track trends in nitrate concentrations and loads in the Upper Wakulla River and
Wakulla Springs.
Track trends in the biological communities in the Upper Wakulla River.
6.3.2 WATER QUALITY MONITORING PARAMETERS, FREQUENCY, AND NETWORK To achieve the first objective above, the monitoring strategy focuses on collecting the suggested
parameters included in Table 32 for the river sites and Table 33 for the spring vent and conduit sites.
The core parameters are directly related to the impairment in the Upper Wakulla River and Wakulla
Springs Basin. Supplemental parameters and field parameters are monitored primarily to support the
interpretation of core water quality parameters. At a minimum, the core parameters will be tracked to
determine progress towards meeting the TMDL.

FINAL Upper Wakulla River and Wakulla Springs Basin Management Action Plan – October 2015
Page 88 of 110
TABLE 33: WATER QUALITY MONITORING PARAMETERS FOR THE RIVER SITES PARAMETER TYPE PARAMETER NAME
Core Nitrate + Nitrite (as N)
Ammonia (as N) Kjeldahl Nitrogen
Supplemental
Chlorophyll-a Total Organic Carbon
Total Phosphorus Chloride Sulfate
Fluoride Calcium
Magnesium Sodium
Potassium Alkalinity Hardness
Turbidity (lab) Specific Conductance (lab)
Color (true) Total Suspended Solids Total Dissolved Solids
Field
Water Temperature pH
Specific Conductance Dissolved Oxygen
Sample Depth Secchi Depth
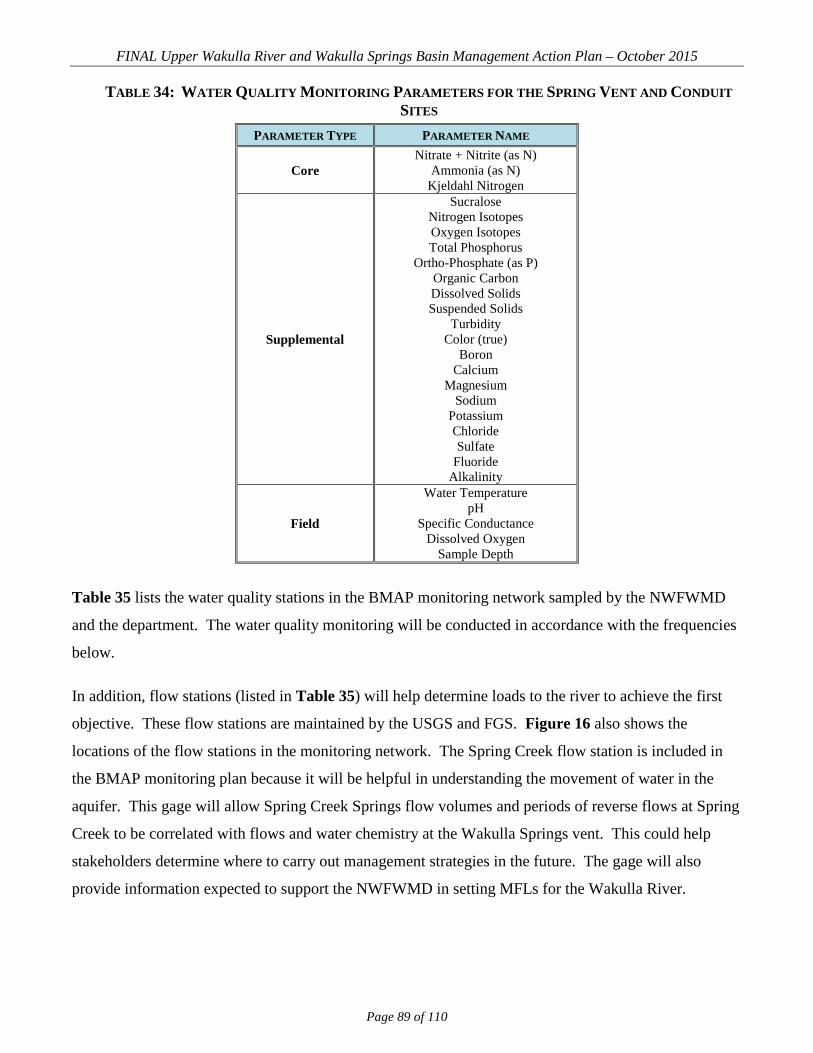
FINAL Upper Wakulla River and Wakulla Springs Basin Management Action Plan – October 2015
Page 89 of 110
TABLE 34: WATER QUALITY MONITORING PARAMETERS FOR THE SPRING VENT AND CONDUIT SITES
PARAMETER TYPE PARAMETER NAME
Core Nitrate + Nitrite (as N)
Ammonia (as N) Kjeldahl Nitrogen
Supplemental
Sucralose Nitrogen Isotopes Oxygen Isotopes Total Phosphorus
Ortho-Phosphate (as P) Organic Carbon Dissolved Solids Suspended Solids
Turbidity Color (true)
Boron Calcium
Magnesium Sodium
Potassium Chloride Sulfate
Fluoride Alkalinity
Field
Water Temperature pH
Specific Conductance Dissolved Oxygen
Sample Depth Table 35 lists the water quality stations in the BMAP monitoring network sampled by the NWFWMD
and the department. The water quality monitoring will be conducted in accordance with the frequencies
below.
In addition, flow stations (listed in Table 35) will help determine loads to the river to achieve the first
objective. These flow stations are maintained by the USGS and FGS. Figure 16 also shows the
locations of the flow stations in the monitoring network. The Spring Creek flow station is included in
the BMAP monitoring plan because it will be helpful in understanding the movement of water in the
aquifer. This gage will allow Spring Creek Springs flow volumes and periods of reverse flows at Spring
Creek to be correlated with flows and water chemistry at the Wakulla Springs vent. This could help
stakeholders determine where to carry out management strategies in the future. The gage will also
provide information expected to support the NWFWMD in setting MFLs for the Wakulla River.

FINAL Upper Wakulla River and Wakulla Springs Basin Management Action Plan – October 2015
Page 90 of 110
TABLE 35: BMAP WATER QUALITY MONITORING NETWORK
SAMPLING ENTITY STATION ID STATION NAME STATION TYPE FREQUENCY SITE
ESTABLISHED
NWFWMD S587 Spring Vent Recorder – discharge 15-minute 05/1997
NWFWMD S587 Spring Vent Water quality vent Quarterly 04/2000
NWFWMD S266 Upper Bridge Water quality river Monthly 08/2009
Department S266 200 meters
Downstream of Upper Bridge
Water quality river Twice per year (with biology) 01/2014
Department S98
Half Mile Downstream of Spring Vent @ Boat Maintenance
Tram
Water quality river Twice per year (with biology) 01/2014
NWFWMD S556 Recreation Area Boat Dock Water quality river Monthly 10/2013
NWFWMD S556 Recreation Area Boat Dock
Recorder – temperature, conductance
Hourly 03/1999
NWFWMD S98 Boat Maintenance Tram Recorder – stage 5-minute 12/1987
Department 9695 Spring Vent Water quality vent Quarterly 09/2001
Department 20383 B-Tunnel Water quality conduit Quarterly 04/2004
Department 20385 C-Tunnel Water quality conduit Quarterly 04/2004
Department 20387 D-Tunnel Water quality conduit Quarterly 04/2004
Department 20388 AD-Tunnel Water quality conduit Quarterly 04/2004
Department 20340 K-Tunnel Water quality conduit Quarterly 04/2004
Department 20381 AK-Tunnel Water quality conduit Quarterly 04/2004
Department S556 Recreation Area Boat Dock Nitrate meter Continuous 12/2013
USGS 02327022 Wakulla River near Crawfordville, FL Flow Continuous 10/2004
Department B_TUNNEL B-Tunnel Flow 15-Minute 12/2003 Department C_TUNNEL C-Tunnel Flow 15-Minute 12/2003 Department D_TUNNEL D-Tunnel Flow 15-Minute 02/2004 Department AD_TUNNEL AD-Tunnel Flow 15-Minute 02/2004 Department K_TUNNEL K-Tunnel Flow 15-Minute 02/2004 Department AK_TUNNEL AK-Tunnel Flow 15-Minute 02/2004
USGS 02327031 Spring Creek Gage Flow Continuous 10/2013

FINAL Upper Wakulla River and Wakulla Springs Basin Management Action Plan – October 2015
Page 91 of 110
FIGURE 16: MONITORING NETWORK FOR THE UPPER WAKULLA RIVER AND WAKULLA SPRINGS

FINAL Upper Wakulla River and Wakulla Springs Basin Management Action Plan – October 2015
Page 92 of 110
6.3.3 BIOLOGICAL MONITORING To meet the second monitoring plan objective, several types of biological monitoring will be carried out
to assess the health of the Upper Wakulla River. An RPS will be conducted to assess the abundance and
variety of algae in the river. A Linear Vegetation Survey (LVS) will be conducted to assess the types
and density of vegetation present in the river and to identify the native versus non-native species. An
SCI will be conducted to measure the number of different organisms present in the river. In addition,
Habitat Assessments (HA) will be conducted to assess the river conditions and habitat present to support
the SCI evaluation. Water quality samples will also be collected with the biological monitoring. Table
36 summarizes the biological monitoring, and Figure 16 shows the locations for this sampling.
TABLE 36: BIOLOGICAL MONITORING SAMPLING
ENTITY TYPE OF
MONITORING STATION ID LOCATION FREQUENCY START DATE
NWFWMD RPS S266 200 meters Downstream of Upper Bridge Twice per year 10/2013
NWFWMD LVS S266 200 meters Downstream of Upper Bridge Twice per year 10/2013
NWFWMD SCI S266 200 meters Downstream of Upper Bridge Twice per year 10/2013
NWFWMD HA S266 200 meters Downstream of Upper Bridge Twice per year 10/2013
Department RPS S266 200 meters Downstream of Upper Bridge Twice per year 01/2014
Department LVS S266 200 meters Downstream of Upper Bridge Twice per year 01/2014
Department SCI S266 200 meters Downstream of Upper Bridge Twice per year 01/2014
Department HA S266 200 meters Downstream of Upper Bridge Twice per year 01/2014
NWFWMD RPS S98 Half Mile Downstream
of Spring Vent @ Boat Maintenance Tram
Twice per year 10/2013
NWFWMD LVS S98 Half Mile Downstream
of Spring Vent @ Boat Maintenance Tram
Twice per year 10/2013
NWFWMD SCI S98 Half Mile Downstream
of Spring Vent @ Boat Maintenance Tram
Twice per year 10/2013
NWFWMD HA S98 Half Mile Downstream
of Spring Vent @ Boat Maintenance Tram
Twice per year 10/2013
Department RPS S98 Half Mile Downstream
of Spring Vent @ Boat Maintenance Tram
Twice per year 01/2014
Department LVS S98 Half Mile Downstream
of Spring Vent @ Boat Maintenance Tram
Twice per year 01/2014

FINAL Upper Wakulla River and Wakulla Springs Basin Management Action Plan – October 2015
Page 93 of 110
SAMPLING ENTITY
TYPE OF MONITORING STATION ID LOCATION FREQUENCY
START DATE
Department SCI S98 Half Mile Downstream
of Spring Vent @ Boat Maintenance Tram
Twice per year 01/2014
Department HA S98 Half Mile Downstream
of Spring Vent @ Boat Maintenance Tram
Twice per year 01/2014
6.3.4 DATA MANAGEMENT AND ASSESSMENT The Florida Storage and Retrieval (STORET) database serves as the primary repository of ambient
water quality data for the state of Florida. The department pulls water quality data used for impaired
water evaluations and TMDL development directly from the STORET database. Ambient water quality
data collected as part of the BMAP will be uploaded into STORET for long-term storage and
availability. Water quality data will be uploaded to STORET at least once every six months, upon
completion of the appropriate quality assurance/quality control (QA/QC) checks.
The biological data will be stored in the Statewide Biological (SBIO) database, which is also a
department database. The biological data will be uploaded at least once every six months, after the
appropriate QA/QC checks.
The water quality and biological data will be analyzed during BMAP implementation to determine
trends in water quality and the health of the biological community. To determine progress towards
achieving the TMDL target for allowable nitrate-nitrogen concentrations in the impaired segment, the
nitrate-nitrogen concentrations at the BMAP monitoring stations will be evaluated using a methodology
similar to that used to develop the TMDL nitrate-nitrogen target. The month and monitoring station
location with the highest average concentration will be compared with the TMDL target of 0.35 mg/L to
determine the percent reduction achieved to date, and whether the target concentration has been
achieved. The TMDL target for recovery of the biological impairment will be evaluated using the
ability of the impaired segment to meet the department’s Class III biology criteria.
6.3.5 QUALITY ASSURANCE/QUALITY CONTROL Stakeholders participating in the monitoring plan must collect water quality data in a manner consistent
with the department’s standard operating procedures (SOPs) for QA/QC. The most current version of
these procedures is available online. For BMAP-related data analyses, entities should use National
Environmental Laboratory Accreditation Conference National Environmental Laboratory Accreditation

FINAL Upper Wakulla River and Wakulla Springs Basin Management Action Plan – October 2015
Page 94 of 110
Program (NELAP)–certified laboratories or other labs that meet the certification and other requirements
outlined in the SOPs.
6.4 RESEARCH STUDIES During the BMAP process, stakeholders identified several research items they would like to pursue, if
funding becomes available. These research topics include the following:
Determine the nitrate contributions to Wakulla Springs during the reverse flow scenario
where portions of the Spring Creek springshed flow to Wakulla Springs using data
collected by the NWFWMD and by potentially increasing the frequency of monitoring
in the conduits that reverse flow.
Conduct a dye trace study in Crawfordville to determine the contributions from septic
systems during the reverse flow scenario where portions of the Spring Creek springshed
flow to Wakulla Springs.
Evaluate the drinking water well data to identify wells with high nitrate concentrations
and conduct further research to determine the source(s) of these high concentrations.
Update the potentiometric surface data for the basin to better define the boundary; this
will likely be performed for NWFWMD’s MFLs modeling.
Run the AVA model for the entire BMAP basin, and incorporate the Light Detection
and Ranging (LIDAR) data from Wakulla County.
Verify the effectiveness of agricultural BMPs in the Upper Wakulla River and Wakulla
Springs Basin.
Monitor before and after project implementation, as desired, to determine the nitrate
reduction benefits of the projects.
Add nitrate data loggers to the river water quality sampling locations (Upper Bridge and
Recreation Area Boat Dock) to obtain better information about how nitrate
concentrations change in the river.
FINAL Upper Wakulla River and Wakulla Springs Basin Management Action Plan – October 2015
Page 95 of 110
Develop a water budget and nutrient transport model for the Upper Wakulla River and
Wakulla Springs Basin.
Determine the effects of saltwater intrusion and sea-level rise on the biological
community in the Upper Wakulla River and Wakulla Springs.
Measure color, using ultraviolet-visible light absorption spectrophotometry, in the
Upper Wakulla River to determine the effects on water quality and the biological
community.
Create an Aquifer Watch Program for the Upper Wakulla River and Wakulla Springs
Basin to gather additional water quality data on ground water in the basin.
Assess the nitrate contributions to ground water from sinkholes in the basin.
6.5 COMMITMENT TO PLAN IMPLEMENTATION Paragraph 403.067(7), F.S., lays out the mechanisms for BMAP implementation. While the BMAP is
linked by statute to permitting and other enforcement processes that target individual entities, successful
implementation mandates that local stakeholders willingly and consistently work together to attain
adopted TMDLs. This collaboration fosters the sharing of ideas, information, and resources. The
stakeholders have demonstrated their willingness to confer with and support each other in their efforts.

FINAL Upper Wakulla River and Wakulla Springs Basin Management Action Plan – October 2015
Page 96 of 110
APPENDICES
FINAL Upper Wakulla River and Wakulla Springs Basin Management Action Plan – October 2015
Page 97 of 110
APPENDIX A: RULE 62-304(2), F.A.C., THE UPPER WAKULLA RIVER TMDL
(2) Upper Wakulla River. The nitrate TMDL to address the biological impairment is an in-stream
monthly mean concentration of 0.35 mg/L and is allocated as follows:
(a) The WLA for wastewater sources is not applicable.
(b) The WLA for discharges subject to the department’s NPDES Municipal Stormwater Permitting
Program is not applicable.
(c) The LAs for nonpoint sources are to address anthropogenic sources in the basin such that in-stream
nitrate concentrations meet the TMDL target, which, based on the mean concentrations from the 2002-
2007 period, will require a 56.2 percent reduction of nitrate at sources contributing to the observed
biological impairment.
(d) The Margin of Safety is implicit.
(e) While the WLA and LAs for nitrate have been expressed as the concentration and percent reduction
needed to attain the applicable Class III biology criterion, it is the combined reductions from both
anthropogenic point and nonpoint sources that will result in the required reduction of in-stream nitrate
concentrations. However, it is not the intent of the TMDL to abate natural background conditions.

FINAL Upper Wakulla River and Wakulla Springs Basin Management Action Plan – October 2015
Page 98 of 110
APPENDIX B: CITY OF TALLAHASSEE STORMWATER TREATMENT PROJECTS IN THE UPPER WAKULLA RIVER AND WAKULLA SPRINGS BASIN
TABLE B-1: SUMMARY OF THE CITY OF TALLAHASSEE’S STORMWATER TREATMENT PROJECTS
PROJECT NAME STATUS PROJECT TYPE MAP LABEL
Northeast Ditch At Lonnbladh Rd Complete/Constructed Channel Stabilization SW01 Frenchtown SW Improvements Master Plan Complete/Constructed Wet Detention w/ Storm Drain Improvements SW02 Campus Circle Complete/Constructed Wet Detention w/ Storm Drain Improvements SW03 Connie Drive Complete/Constructed Channel Stabilization w/ Sd Improvements SW04 Call Street & Cadiz Street Complete/Constructed Dry Detention w/ Sd Improvements SW05 SPI - Royal Oaks Channel Lining Phase 1B Complete/Constructed Conveyance Improvement SW06 SPI - Salmon Dr Ditch Lining (1706 Salmon Drive) Complete/Constructed Conveyance Improvement SW07
SPI - O'Brien Drive Drainage Improvements (Phase 1) Complete/Constructed Conveyance Improvement SW08
Betton/Cline/Chamberlin Complete/Constructed Conveyance Improvement SW09
SPI - Shamrock North Drng Imp Complete/Constructed Conveyance Improvement; Includes $ From Spi. SW10
SPI - Ivan Drive Drainage Improvements Planned/Proposed Conveyance Improvement SW11 SPI - Hutchinson Road Drainage Complete/Constructed Conveyance Improvement SW12 SPI - Arkansas Street Drainage Improvements Planned/Proposed Stormdrain Improvements SW13 SPI - Shamrock-Foxford Drainage Improvements Planned/Proposed Conveyance Improvement SW14
SPI - 2018 Lee Avenue Planned/Proposed Stormdrain Improvements SW15 SPI - Glendale Neighborhood Drainage Improvements Planned/Proposed Stormdrain Improvements SW16
Pickett Court Area Stormwater Complete/Constructed Will Be Revived At A Later Date. SW17 Upper West Ditch Stormwater Facility Planned/Proposed Sedimentation Basin SW18 Royal Oaks Creek Study (Royal Oaks Stormwater Imp) Planned/Proposed Channel Stabilization SW19
Meginnis Creek at Sharer Road Complete/Constructed Channel Stabilization SW20 Chapel Drive Stormwater Improvements Complete/Constructed Stormdrain Improvements SW21 Emory Court & Dupont Drive Area Flood Relief Complete/Constructed Channel Stabilization SW22 East Georgia St/Meridian St Stormwater Improvement Complete/Constructed Stormdrain Improvements SW23
Upper Lake Lafayette NRF Complete/Constructed Alum SW24 Ford Street Drainage Improvements Complete/Constructed Stormdrain Improvements SW25 Lafayette Park Stormwater Outfall Phase II Complete/Constructed Stormdrain Improvements SW26 Lafayette Park Stormwater Outfall Phase I Complete/Constructed Dry Detention SW27 Park Avenue Tributary #1 Drainage Improvement Complete/Constructed Wet Detention & Channel Stabilization SW28
Inglewood Neighborhood Drainage Improvements Active/Designed Stormdrain Improvements SW29
Greenwood SWMF (part of Frenchtown Master Plan) Active/Designed Wet Detention SW30
Killarney Way at Shamrock Stormwater Improvements Complete/Constructed Wet Detention w/ Storm Drain Improvements SW31
Karen Lane Drainage Improvements Complete/Constructed Stormdrain Improvements SW32 Lower CDD Erosion Control Project Planned/Proposed Channel Stabilization SW33
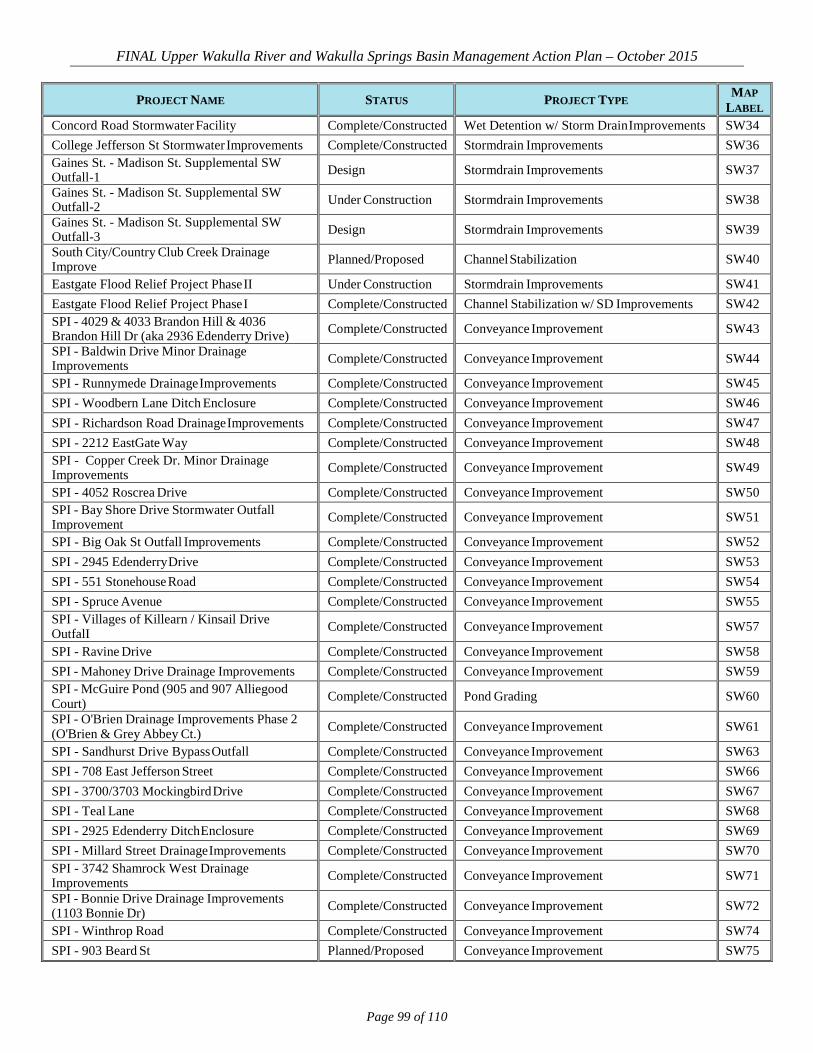
FINAL Upper Wakulla River and Wakulla Springs Basin Management Action Plan – October 2015
Page 99 of 110
PROJECT NAME STATUS PROJECT TYPE MAP LABEL
Concord Road Stormwater Facility Complete/Constructed Wet Detention w/ Storm Drain Improvements SW34 College Jefferson St Stormwater Improvements Complete/Constructed Stormdrain Improvements SW36 Gaines St. - Madison St. Supplemental SW Outfall-1 Design Stormdrain Improvements SW37
Gaines St. - Madison St. Supplemental SW Outfall-2 Under Construction Stormdrain Improvements SW38
Gaines St. - Madison St. Supplemental SW Outfall-3 Design Stormdrain Improvements SW39
South City/Country Club Creek Drainage Improve Planned/Proposed Channel Stabilization SW40
Eastgate Flood Relief Project Phase II Under Construction Stormdrain Improvements SW41 Eastgate Flood Relief Project Phase I Complete/Constructed Channel Stabilization w/ SD Improvements SW42 SPI - 4029 & 4033 Brandon Hill & 4036 Brandon Hill Dr (aka 2936 Edenderry Drive) Complete/Constructed Conveyance Improvement SW43
SPI - Baldwin Drive Minor Drainage Improvements Complete/Constructed Conveyance Improvement SW44
SPI - Runnymede Drainage Improvements Complete/Constructed Conveyance Improvement SW45 SPI - Woodbern Lane Ditch Enclosure Complete/Constructed Conveyance Improvement SW46 SPI - Richardson Road Drainage Improvements Complete/Constructed Conveyance Improvement SW47 SPI - 2212 EastGate Way Complete/Constructed Conveyance Improvement SW48 SPI - Copper Creek Dr. Minor Drainage Improvements Complete/Constructed Conveyance Improvement SW49
SPI - 4052 Roscrea Drive Complete/Constructed Conveyance Improvement SW50 SPI - Bay Shore Drive Stormwater Outfall Improvement Complete/Constructed Conveyance Improvement SW51
SPI - Big Oak St Outfall Improvements Complete/Constructed Conveyance Improvement SW52 SPI - 2945 Edenderry Drive Complete/Constructed Conveyance Improvement SW53 SPI - 551 Stonehouse Road Complete/Constructed Conveyance Improvement SW54 SPI - Spruce Avenue Complete/Constructed Conveyance Improvement SW55 SPI - Villages of Killearn / Kinsail Drive OutfalI Complete/Constructed Conveyance Improvement SW57
SPI - Ravine Drive Complete/Constructed Conveyance Improvement SW58 SPI - Mahoney Drive Drainage Improvements Complete/Constructed Conveyance Improvement SW59 SPI - McGuire Pond (905 and 907 Alliegood Court) Complete/Constructed Pond Grading SW60
SPI - O'Brien Drainage Improvements Phase 2 (O'Brien & Grey Abbey Ct.) Complete/Constructed Conveyance Improvement SW61
SPI - Sandhurst Drive Bypass Outfall Complete/Constructed Conveyance Improvement SW63 SPI - 708 East Jefferson Street Complete/Constructed Conveyance Improvement SW66 SPI - 3700/3703 Mockingbird Drive Complete/Constructed Conveyance Improvement SW67 SPI - Teal Lane Complete/Constructed Conveyance Improvement SW68 SPI - 2925 Edenderry Ditch Enclosure Complete/Constructed Conveyance Improvement SW69 SPI - Millard Street Drainage Improvements Complete/Constructed Conveyance Improvement SW70 SPI - 3742 Shamrock West Drainage Improvements Complete/Constructed Conveyance Improvement SW71
SPI - Bonnie Drive Drainage Improvements (1103 Bonnie Dr) Complete/Constructed Conveyance Improvement SW72
SPI - Winthrop Road Complete/Constructed Conveyance Improvement SW74 SPI - 903 Beard St Planned/Proposed Conveyance Improvement SW75

FINAL Upper Wakulla River and Wakulla Springs Basin Management Action Plan – October 2015
Page 100 of 110
PROJECT NAME STATUS PROJECT TYPE MAP LABEL
SPI - Limerick Drive Stormwater Outfall Improvements Under Construction Conveyance Improvement SW76
SPI - Devils Dip Drainage Improvements Active/Designed Conveyance Improvement SW77 SPI - 2713 Bedford Way Complete/Constructed Conveyance Improvement SW78 SPI - Armistead Road Drainage Maintenance Complete/Constructed Conveyance Improvement SW79 SPI - Shannon Foxford Drainage Improvements Planned/Proposed Conveyance Improvement SW80 SPI - Faringdon Drive (2764 Farringdon Dr) Complete/Constructed Conveyance Improvement SW81 SPI - Shamrock North & Edenderry Complete/Constructed Conveyance Improvement SW82 SPI - Short Street Improvements Planned/Proposed Conveyance Improvement SW83 Killarney Way at Shamrock Stormwater Improvements Complete/Constructed Wet Detention w/ Storm Drain Improvements SW84
SPI - Bradford Road Stormwater Outfall Under Construction Conveyance Improvement SW85 Middlebrooks Circle Conveyance Improvements Complete/Constructed Channel Stabilization SW86 Pensacola-MLK Drainage Improvements Complete/Constructed Stormdrain Improvements SW87
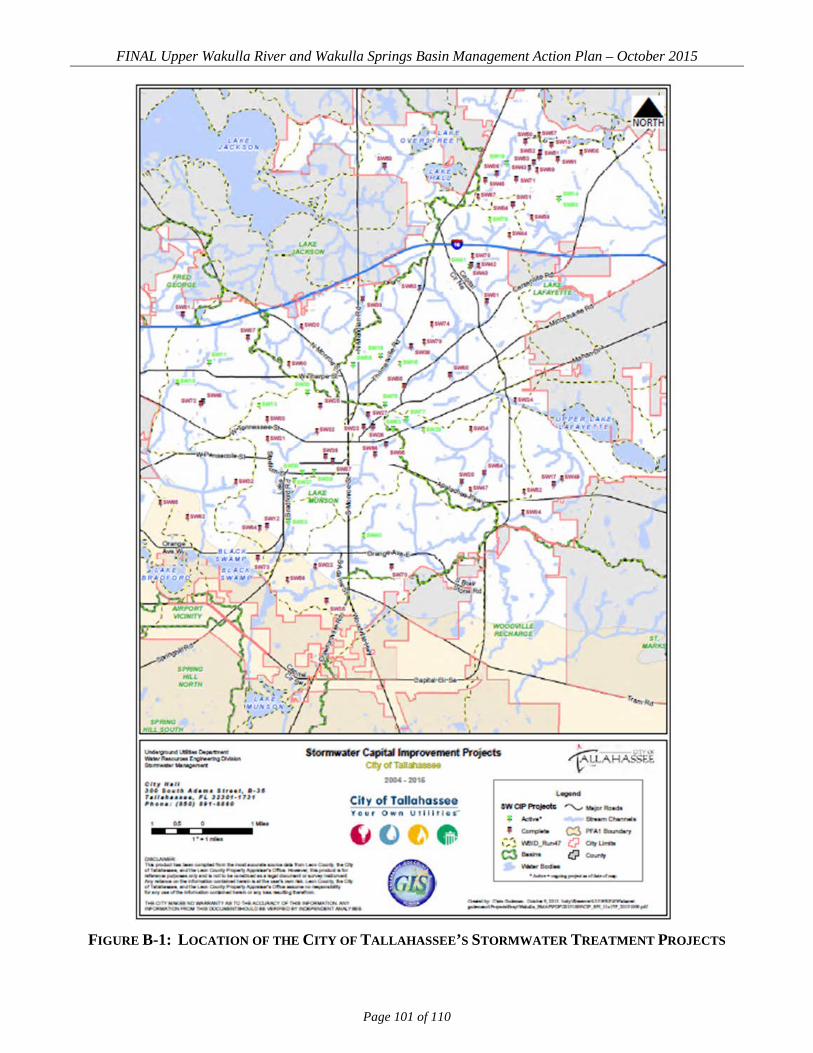
FINAL Upper Wakulla River and Wakulla Springs Basin Management Action Plan – October 2015
Page 101 of 110
FIGURE B-1: LOCATION OF THE CITY OF TALLAHASSEE’S STORMWATER TREATMENT PROJECTS

FINAL Upper Wakulla River and Wakulla Springs Basin Management Action Plan – October 2015
Page 102 of 110
APPENDIX C: POTENTIAL FUNDING SOURCES
A BMAP must identify feasible funding strategies for implementing the management strategies
presented. This appendix provides a list of potential funding sources.
The Clean Water State Revolving Fund (SRF) loan program provides low-interest loans to local
governments to plan, design, and build or upgrade wastewater, stormwater, and nonpoint source
pollution prevention projects. Certain agricultural best management practices may also qualify for
funding. Discounted assistance for small communities is available. Interest rates on loans are below
market rates and vary based on the economic wherewithal of the community. The Clean Water SRF is
Florida’s largest financial assistance program for water infrastructure.
The Drinking Water SRF loan program provides low-interest loans to local governments and certain
private utilities to plan, design, and build or upgrade drinking water systems. Discounted assistance for
small communities may be available. Interest rates on loans are typically 40 percent below market
rates.
The Small Community Wastewater Facilities Grants Program provides grants to fund the
construction of wastewater facilities in municipalities with 10,000 or fewer people and per capita
income levels below Florida’s average per capita income. A local match is required. The program is
linked to the Clean Water SRF loan program outlined above, and is highly competitive.
Florida’s Section 319 grant program administers funds received from the EPA to implement projects
or programs that reduce nonpoint sources of pollution. Projects or programs must benefit Florida’s
priority watersheds (“impaired waters”), and local sponsors must provide at least a 40 percent match or
in-kind contribution. Eligible activities include t h e demonstration and evaluation of urban and
agricultural stormwater BMPs, stormwater retrofits, and public education.
TMDL water quality restoration grants for projects related to the implementation of TMDLs may be
available through periodic legislative appropriations to the department. When funds are available, the
program prioritizes stormwater retrofit projects to benefit impaired waters, somewhat along the lines of
the Section 319 grant program listed above.
The Florida Legislature may solicit applications directly for Community Budget Issue Request
projects, including water projects, in anticipation of upcoming legislative sessions. This process is an
opportunity to secure legislative sponsorship of project funding through the state budget. The
FINAL Upper Wakulla River and Wakulla Springs Basin Management Action Plan – October 2015
Page 103 of 110
Legislature may coordinate applications with the department. In other years, the Legislature will not
solicit projects but may include them in the budget in any event. Contact your local legislative
delegation to determine whether there are opportunities available to fund your project. Information on
contacting Senators and Representatives is available online.
A number of other programs at both the state and federal levels offer the possibility of water
infrastructure funding. These include the following:
Florida Department of Economic Opportunity Small Cities Community Development Block Grant
Program funds are available annually for water and sewer projects that benefit low- and moderate-
income persons. Monies also may be available for water and sewer projects that serve a specific “job-
creating entity” as long as most of the jobs created are for people with low or moderate incomes. More
information is available online.
The Florida Rural Water Association Loan Program provides low-interest bond or bank financing
for community utility projects in coordination with the department’s SRF programs discussed above.
Other financial assistance may also be available. ook for the links to “Funding” and “Long-Term
Financing.”
The Enterprise Florida program is a resource for a variety of public and private projects and activities,
including those in rural communities, to facilitate the creation, capital investment, and strengthening
and diversification of local economies by promoting tourism, trade, and economic development. The
various Enterprise Florida programs and financial incentives are intended, among other things, to
provide additional financial assistance to enable communities to better access other infrastructure
funding programs. Contact information is available from the “Contact Us” link at the top of the web
page.
Florida’s five regional water management districts also offer financial assistance for a variety of
water-related projects, for water supply development, water resource development, and surface water
restoration. Assistance may be provided from ad valorem tax revenues or from periodic legislative
appropriations for Alternative Water Supply Development and Surface Water Improvement and
Management projects. The amount of funding available, matching requirements, and types of assistance
may vary from year to year. For information on funding opportunities, contact the water management
district with jurisdiction in your area—a map and links to each of the districts are available online.
FINAL Upper Wakulla River and Wakulla Springs Basin Management Action Plan – October 2015
Page 104 of 110
The United States Department of Commerce Economic Development Administration Public Works
and Development Facilities Program provides funding to help distressed communities in economic
decline revitalize, expand, and upgrade their physical infrastructure to attract new industry, encourage
business expansion, diversify local economies, and generate or retain long-term, private sector jobs and
investment. The program focuses on redeveloping existing infrastructure.
The USDA Rural Development Rural Utilities Service Guaranteed and Direct Loans and Grants
Program provides a combination of loans and grants for water, wastewater, and solid waste projects to
rural communities and small incorporated municipalities. Some nonprofit entities also may be eligible.
Congress’s State and Tribal Assistance Grant Program provides the opportunity to secure
Congressional sponsorship of project funding, including water project funding, through the annual
federal budget process. The program’s stated purpose is to strengthen state, local governments, and
tribal abilities to address environmental and public health threats while furthering environmental
compliance. You may want to consider contacting your Representatives or Senators for assistance in
pursuing funding.
Grants.gov is the official federal website for information on more than 1,000 federal grant programs.
The site includes an automatic email notification system for keeping apprised of federal grant
opportunities.
The Catalog of Federal Domestic Assistance provides a database of all federal programs available to
state and local governments; public, quasipublic, and private profit and nonprofit organizations and
institutions; specialized groups; and individuals. There are a variety of sources of niche funding that
may be appropriate to your situation. There are also private funding sources (endowments, private
trusts, etc.) that may, on occasion, fund water-related projects; a variety of sources to investigate these
opportunities are available on the web.
The Florida Resource Directory provides a searchable directory of information about and links to
many state and federal programs with resources available to help local communities. Funding for water-
related projects is just one of many types of assistance identified here.
If you are interested in disaster relief, your first contacts should be to Florida’s Division of Emergency
Management or your county emergency management agency, and the Federal Emergency

FINAL Upper Wakulla River and Wakulla Springs Basin Management Action Plan – October 2015
Page 105 of 110
Management Agency at 1.800.621.FEMA (3362), where the process for securing disaster-related
infrastructure assistance begins.
FINAL Upper Wakulla River and Wakulla Springs Basin Management Action Plan – October 2015
Page 106 of 110
APPENDIX D: DETAILS ON THE SCI
The SCI is a biological assessment procedure that measures the degree to which flowing fresh waters
support a healthy, well-balanced biological community, as indicated by benthic macroinvertebrates. A
balanced faunal community is achieved if the average score of at least two temporally independent SCIs
is 40 or higher, with neither of the two most recent SCI scores less than 35.
When the SCI bioregions were initially developed in 1992, there were relatively few data available for
some of the bioregions, particularly the eastern portion of the Panhandle region. The department has
subsequently collected thousands of new SCIs throughout the state. In addition, better GIS tools now
available allow more accurate spatial resolution. In 2012 the department undertook a reanalysis of the
SCI regions to better define the macroinvertebrate expectations across the state. The reanalysis of the
SCI regionalization indicated that the Panhandle bioregion should be divided into the Panhandle West
and Big Bend bioregions because they have significantly different taxa at reference sites .During the SCI
reevaluation, the bioregion boundaries were also redrawn to be consistent with watershed boundaries.
The original bioregion boundaries bisected watersheds, which meant that the biological expectation in
some streams changed upstream or downstream of an imaginary line across the stream. Greater detail
concerning the reanalysis of the SCI bioregions and the results of that evaluation are provided in
Appendix B of the Technical Support Document.1 As part of the reassessment, the SCI equations were
also updated and SCI scores were recalculated. The original listing of the Wakulla River was based on
earlier versions of the SCI. This report uses the revised regions and equations for what is now referred
to as the SCI-2012 (Figure D-1).
1 Florida Department of Environmental Protection. March 2013. Technical Support Document: Derivation of dissolved oxygen criteria to protect aquatic life in Florida’s fresh and marine waters. DEP-SAS-001/13. Tallahassee, FL.

FINAL Upper Wakulla River and Wakulla Springs Basin Management Action Plan – October 2015
Page 107 of 110
FIGURE D-1. COMPARISON OF THE SCI 2007 BIOREGIONS WITH THE NEW 2012 BIOREGIONS

FINAL Upper Wakulla River and Wakulla Springs Basin Management Action Plan – October 2015
Page 108 of 110
APPENDIX E: BIBLIOGRAPHY OF KEY REFERENCES AND WEBSITES
KEY REFERENCES Baker, A.E., A.R. Wood, J.R. Cichon, and J.L. Johnson. July 2007. The Leon County Aquifer
Vulnerability Assessment. Prepared for the Leon County Board of County Commissioners in
fulfillment of Leon County Project No. BC-06-21-06-53.
Baker, A.E., A.R. Wood, and J.R. Cichon. September 2009. The Wakulla County Aquifer Vulnerability
Assessment. Prepared for the Florida Department of Environmental Protection as part of the Florida
Aquifer Vulnerability Assessment (FAVA) Phase II Project, Contract No. RM059.
Chelette, A., T.R. Pratt, and B.G. Katz. April 2002. Nitrate loading as an indicator of nonpoint source
pollution in the Lower St. Marks-Wakulla Rivers watershed. Water Resources Special Report 02-1.
Northwest Florida Water Management District.
Davis, J.H., B.G. Katz, and D.W. Griffin. 2010. Nitrate-N movement in groundwater from the land
application of treated municipal wastewater and other sources in the Wakulla Springs springshed,
Leon and Wakulla Counties, Florida, 1966-2018. United States Geological Survey Scientific
Investigations Report 2010-5099.
Florida Department of Environmental Protection:
———. 2001. Basin status report: Ochlockonee and St. Marks. Tallahassee, FL: Watershed
Planning and Coordination Section, Bureau of Watershed Management.
———. 2012a. TMDL report: Nutrient (biology) TMDL for the Upper Wakulla River (WBID
1006). Tallahassee, FL: Division of Water Resource Management, Bureau of Watershed
Management.
———. 2012b. Kincaid, T, G. Davies, C. Werner, and R. DeHan. Demonstrating
interconnection between a wastewater application facility and a first magnitude spring in a
karstic watershed: Tracer study of the Southeast Farm Wastewater Reuse Facility, Tallahassee,
Florida. Tallahassee, FL: Florida Geological Survey.
———. 2013a. Eller, K., B. Katz, and R. Hicks. Wakulla Springs Basin nitrogen sourcing
inventory. Tallahassee, FL: Ground Water Management Section. PowerPoint presentation.

FINAL Upper Wakulla River and Wakulla Springs Basin Management Action Plan – October 2015
Page 109 of 110
———. 2013b. Jackson, J. Wakulla River biological assessments. Tallahassee, FL: Standards
and Assessment Section. PowerPoint presentation.
———. 2013c. Katz, B. Using nitrogen isotopes to identify sources of nitrogen in the Wakulla
Springs Basin. Tallahassee, FL: Ground Water Management Section. PowerPoint presentation.
———. 2013d. Maddox, G. Summary of water quality data and the existing monitoring
network: Current & recent nitrate trends in Wakulla Springs and River. Tallahassee, FL:
Ground Water Management Section. PowerPoint presentation.
———. July 2014. Eller, K., and B. Katz. Nitrogen source inventory and loading estimates for the
Wakulla Spring Contributing Area. Tallahassee, FL: Ground Water Management Section.
Florida Department of Health. 2009. Hall, P., and S.J. Clancy. The Florida statewide inventory of
onsite sewage treatment and disposal systems (OSTDS): Final draft report and database. Prepared
for the Florida Department of Health, Bureau of Onsite Sewage Programs, by EarthSTEPS and
GlobalMind. Available: http://www.doh.state.fl.us/environment/ostds/research/07
Harden, H., B. Katz, D. Griffin, P. McMahon, E. Wade, R. Hicks, and J. Chanton. March 18, 2010.
Fate of effluent-borne contaminants beneath septic tank drainfields overlying a karst aquifer.
Journal of Environmental Quality.
Kincaid, T. 2010. Understanding Florida’s karst results & lessons learned from the Woodville Karst
Plain research. GeoHydros LLC, 27 Keystone Ave., Reno, NV 89503. PowerPoint presentation.
Lombardo Associates, Inc. November 2011. Onsite sewage treatment and disposal and management
options – Final report for Wakulla Springs, Leon County, Wakulla County & City of Tallahassee, FL.
188 Church St., Newton, MA 02458.
Peer Review Committee. December 2005. Degradation of water quality at Wakulla Springs, Florida:
Assessment and recommendations. Report of the Peer Review Committee on the Workshop Solving
water pollution problems in the Wakulla springshed of north Florida, May 12-13, 2005, Tallahassee,
FL.
FINAL Upper Wakulla River and Wakulla Springs Basin Management Action Plan – October 2015
Page 110 of 110
STORMWATER AND WATER QUALITY PROTECTION WEBSITES LIST OF LOCAL AND REGIONAL STORMWATER AND WATER QUALITY PROTECTION WEBSITES AND EMBEDDED LINKS
NWFWMD LIST OF STATE STORMWATER AND WATER QUALITY PROTECTION WEBSITES
General Portal for Florida Department Watershed Management TMDL Program BMPs, Public Information, and Environmental Education Resources NPDES Stormwater Program Nonpoint Source Funding Assistance Surface Water Quality Standards Identification of Impaired Surface Waters Rule STORET Program Criteria for Surface Water Quality Classifications FDACS Office of Agricultural Water Policy FDACS Adopted Agricultural BMPs City of Tallahassee and Leon County Comprehensive Plan Wakulla County Comprehensive Plan LIST OF NATIONAL STORMWATER AND WATER QUALITY PROTECTION WEBSITES
Center for Watershed Protection EPA Office of Water EPA Region 4 (Southeast United States) Clean Water Act History USGS: Florida Waters