final 2015 progress report · acknowledgments this 2015 final progress report for the lake...
TRANSCRIPT

FINAL 2015 PROGRESS REPORT
for the Lake Okeechobee
Basin Management Action Plan
prepared by the Division of Environmental Assessment and Restoration
Water Quality Restoration Program Florida Department of Environmental Protection
with participation from the
Lake Okeechobee Stakeholders
July 2016
2600 Blair Stone Road Mail Station 3575
Tallahassee, FL 32399-2400

Final 2015 Progress Report for the Lake Okeechobee Basin Management Action Plan, July 2016
Page 2 of 87
ACKNOWLEDGMENTS
This 2015 Final Progress Report for the Lake Okeechobee Basin Management Action Plan was prepared as part of a statewide watershed management approach to restore and protect Florida's water quality. It was prepared by the Florida Department of Environmental Protection with participation from the Lake Okeechobee stakeholders, listed in the table on the next page.
For additional information on the watershed management approach in the Lake Okeechobee Basin, contact:
Sara Davis, Basin Coordinator Florida Department of Environmental Protection Watershed Restoration Program, Watershed Planning and Coordination Section 2600 Blair Stone Road, Mail Station 3565 Tallahassee, FL 32399-2400 Email: [email protected] Phone: (850) 245–8825

Final 2015 Progress Report for the Lake Okeechobee Basin Management Action Plan, July 2016
Page 3 of 87
List of Lake Okeechobee Basin Management Action Plan participants
Type of Governmental or
Private Entity Participant
Counties
Glades Highlands
Martin Okeechobee
Orange Osceola
Polk
Municipalities
City of Avon Park City of Kissimmee City of Edgewood
City of Okeechobee City of Orlando City of Sebring
Special Districts
Okeechobee Utility Authority Istokpoga Marsh Watershed Improvement District
Reedy Creek Improvement District Spring Lake Improvement District
Agencies
Florida Department of Agriculture and Consumer Services Florida Department of Environmental Protection
South Florida Water Management District Southwest Florida Water Management District
St. Johns River Water Management District Florida Department of Transportation District 1 Florida Department of Transportation District 4 Florida Department of Transportation District 5
Other Interested Parties
Agriculture Archbold Biological Station
Audubon of Florida Conservancy of Southwest Florida
Everglades Foundation Florida Fruit and Vegetable Association
Florida Farm Bureau Lee County Board of County Commissioners
Lykes Ranch U.S. Department of Agriculture Natural Resources Conservation Service
One Florida Foundation Soil Water Engineering Technology, Inc.
Southeast Milk, Inc. Sugar Cane Growers Cooperative of Florida

Final 2015 Progress Report for the Lake Okeechobee Basin Management Action Plan, July 2016
Page 4 of 87
TABLE OF CONTENTS LIST OF ACRONYMS AND ABBREVIATIONS .....................................................................7 SECTION 1 : INTRODUCTION ...............................................................................................11
1.1 Purpose of the Report ..............................................................................................11 1.2 Total Maximum Daily Load (TMDL) for the Lake Okeechobee Basin ..............11 1.3 Responsible Parties and Key Stakeholders............................................................11 1.4 Assumptions and Considerations Regarding TMDL Implementation ...............12
1.4.1 Assumptions ...................................................................................................12 1.4.2 Considerations ................................................................................................12
SECTION 2 : ACTIVITIES DURING THE REPORTING YEAR .......................................14 2.1 Coordinating Agency Projects and Initiatives ......................................................14 2.2 SFWMD Activities ...................................................................................................18
2.2.1 Taylor Creek/Nubbin Slough Sub-watershed Projects ...................................19 2.2.2 Upper and Lower Kissimmee Sub-watershed Projects ..................................19 2.2.3 Dispersed Water Management (DWM) Program ...........................................20 2.2.4 Other Restoration Strategies ...........................................................................20
2.3 Florida Department of Transportation (FDOT) Activities ..................................21 2.3.1 District 1 .........................................................................................................21 2.3.2 District 5 .........................................................................................................21
2.4 Agricultural Activities .............................................................................................22 2.4.1 Project Updates ...............................................................................................22 2.4.2 WAM Updates ................................................................................................22 2.4.3 Land Use Updates ..........................................................................................23 2.4.4 Agricultural BMPs/BMP Enrollment .............................................................23 2.4.5 BMP Compliance Assistance .........................................................................24
2.5 City, County, and Special District Activities .........................................................32 2.5.1 City of Kissimmee ..........................................................................................32 2.5.2 City of Orlando ...............................................................................................32 2.5.3 Orange County ...............................................................................................32 2.5.4 Spring Lake Improvement District (SLID) ....................................................32
2.6 Summary of Accomplishments ...............................................................................33 SECTION 3 : WATER QUALITY MONITORING ................................................................34
3.1 Water Quality Monitoring ......................................................................................34 3.1.1 Monitoring Objectives ....................................................................................34 3.1.2 Data Management and Assessment ................................................................34 3.1.3 Water Quality Analyses ..................................................................................35
SECTION 4 : OTHER EFFORTS .............................................................................................36 4.1 Lake Tohopekaliga Nutrient Reduction Plan (NRP) ............................................36
4.1.1 Background ....................................................................................................36

Final 2015 Progress Report for the Lake Okeechobee Basin Management Action Plan, July 2016
Page 5 of 87
4.1.2 NRP Development ..........................................................................................38 4.1.3 NRP Elements ................................................................................................39
4.2 Management Strategies for the Southern Sub-watersheds ..................................40 APPENDICES ..............................................................................................................................42
Appendix A: Projects To Achieve the TMDL ...................................................................42 Appendix B: BMAP Monitoring Network ........................................................................78 Appendix C. Website References .......................................................................................87
LIST OF FIGURES
Figure ES-1. Lake Okeechobee Sub-watersheds ...........................................................................10 Figure 1. BMP enrollment in the Lake Okeechobee Watershed as of December 31, 2015 ..........31 Figure 2. Lake Tohopekaliga Watershed .......................................................................................37 Figure B-1. Water quality monitoring network for the Lake Okeechobee Watershed ..................86
LIST OF TABLES
Table 1. Coordinating Agency initiatives ......................................................................................14 Table 2. Projects under development with the Coordinating Agencies .........................................16 Table 3a. Agricultural acreage and BMP enrollment for the Fisheating Creek Sub-watershed ....25 Table 3b. BMP enrollment and future enrollment requirements for the Fisheating Creek Sub-
watershed ......................................................................................................................25 Table 4a. Agricultural acreage and BMP enrollment for the Indian Prairie Sub-watershed .........26 Table 4b. BMP enrollment and future enrollment requirements for the Indian Prairie Sub-
watershed ......................................................................................................................26 Table 5a. Agricultural acreage and BMP enrollment for the Lake Istokpoga Sub-watershed ......27 Table 5b. BMP enrollment and future enrollment requirements for the Lake Istokpoga Sub-
watershed ......................................................................................................................27 Table 6a. Agricultural acreage and BMP enrollment for the Lower Kissimmee Sub-watershed..28 Table 6b. BMP enrollment and future enrollment requirements for the Lower Kissimmee Sub-
watershed ......................................................................................................................28 Table 7a. Agricultural acreage and BMP enrollment for the Taylor Creek/Nubbin Slough Sub-
watershed ......................................................................................................................29 Table 7b. BMP enrollment and future enrollment requirements for the Taylor Creek/Nubbin
Slough Sub-watershed ..................................................................................................29 Table 8a. Agricultural acreage and BMP enrollment for the Upper Kissimmee Sub-watershed ..30 Table 8b. BMP enrollment and future enrollment requirements for the Upper Kissimmee Sub-
watershed ......................................................................................................................30 Table A-1. Projects in the Fisheating Creek Sub-watershed .........................................................43 Table A-2. Projects in the Indian Prairie Sub-watershed ...............................................................44

Final 2015 Progress Report for the Lake Okeechobee Basin Management Action Plan, July 2016
Page 6 of 87
Table A-3. Projects in the Lake Istokpoga Sub-watershed ............................................................45 Table A-4. Projects in the Lower Kissimmee Sub-watershed .......................................................47 Table A-5. Projects in the Taylor Creek/Nubbin Slough Sub-watershed ......................................50 Table A-6. Projects in the Upper Kissimmee Sub-watershed ........................................................53 Table A-7. Projects under development with the Coordinating Agencies.....................................73 Table A-8. Other initiatives ...........................................................................................................76 Table B-1. BMAP monitoring network .........................................................................................79

Final 2015 Progress Report for the Lake Okeechobee Basin Management Action Plan, July 2016
Page 7 of 87
LIST OF ACRONYMS AND ABBREVIATIONS ACF Autosampler Flow-Corrected ac-ft Acre-Feet ACT Autosampler Composite Time Proportional BCC Board of County Commissioners BMAP Basin Management Action Plan BMP Best Management Practice CBIR Community Budget Issue Request CDS Continuous Deflective Separation (Unit) CERP Comprehensive Everglades Restoration Plan cfs Cubic Feet Per Second CIB Curb Inlet Basket C&SF Central and South Florida CY Calendar Year DEP Florida Department of Environmental Protection DWM Dispersed Water Management EAA Everglades Agricultural Area EAAPD Everglades Agricultural Area Protection District ERP Environmental Resource Permit F.A.C. Florida Administrative Code FAVT Floating Aquatic Vegetation Treatment FDACS Florida Department of Agriculture and Consumer Services FDOT Florida Department of Transportation FRESP Florida Ranchlands Environmental Services Project FWCC Florida Fish and Wildlife Conservation Commission FY Fiscal Year FYN Florida Yards and Neighborhoods GIS Geographic Information System HSPF Hydrologic Simulation Program – FORTRAN HWTT Hybrid Wetland Treatment Technologies IDS Integrated Delivery Schedule kg/yr Kilograms Per Year KRRP Kissimmee River Restoration Project lbs/yr Pounds Per Year LOPA Lake Okeechobee Protection Act LOPP Lake Okeechobee Protection Plan LOW Lake Okeechobee Watershed LOWCP-P2TP Lake Okeechobee Watershed Construction Project Phase II Technical Plan MOU Memorandum of Understanding MS4 Municipal Separate Storm Sewer System MSTU Municipal Services Taxing Unit mt Metric Tons mt/yr Metric Tons Per Year NEEPP Northern Everglades and Estuaries Protection Program NE PES Northern Everglades Payment for Environmental Services

Final 2015 Progress Report for the Lake Okeechobee Basin Management Action Plan, July 2016
Page 8 of 87
NNC Numeric Nutrient Criteria NOI Notice of Intent NPDES National Pollutant Discharge Elimination System NRCS Natural Resources Conservation Service NRP Nutrient Reduction Plan NSBB Nutrient Separating Baffle Box OAWP Office of Agricultural Water Policy PES Payment for Environmental Services POR Period of Record PSA Public Service Announcement QA/QC Quality Assurance/Quality Control RCID Reedy Creek Improvement District SFER South Florida Environmental Report SFWMD South Florida Water Management District SLID Spring Lake Improvement District SR State Road SRF State Revolving Fund STA Stormwater Treatment Area STORET Storage and Retrieval (Database) SWET Soil and Water Engineering Technology, Inc. SWFWMD Southwest Florida Water Management District TBD To Be Determined TMDL Total Maximum Daily Load TN Total Nitrogen TP Total Phosphorus TSI Trophic State Index TSS Total Suspended Solids UF–IFAS University of Florida Institute of Food and Agricultural Sciences USACE U.S. Army Corps of Engineers USDA U.S. Department of Agriculture USGS U.S. Geological Survey WAM Watershed Assessment Model WBID Waterbody Identification (Number) WCD Water Control District WMA Water Management Alternative WY Water Year

Final 2015 Progress Report for the Lake Okeechobee Basin Management Action Plan, July 2016
Page 9 of 87
SUMMARY
TOTAL MAXIMUM DAILY LOADS (TMDLS)
In 2001, the Florida Department of Environmental Protection (DEP) adopted the total phosphorus (TP) TMDL for Lake Okeechobee after nine segments in Lake Okeechobee were identified as impaired by TP. The TMDL is a total annual phosphorus load to Lake Okeechobee of 140 metric tons per year (mt/yr), of which 35 mt/yr are estimated to fall directly on the lake through atmospheric deposition. The remaining 105 mt/yr of TP are allocated to the entire Lake Okeechobee Watershed (LOW), which consists of nine sub-watersheds (Figure ES-1). The attainment of the TMDL will be calculated using a five-year rolling average of the monthly loads calculated from measured flow and concentration values. As DEP refines its load estimation model, sub-watershed expectations may be developed for future basin management action plan (BMAP) iterations.
ACTIVITIES DURING THE REPORTING PERIOD
During the year following BMAP adoption, numerous efforts to improve water quality in the LOW have progressed. In addition to site-specific projects, the Coordinating Agencies—DEP, the South Florida Water Management District (SFWMD), and the Florida Department of Agriculture and Consumer Services (FDACS)—have continued work on other initiatives that will achieve nutrient reductions in the LOW.
SUMMARY OF LOAD REDUCTIONS
Phase I of the Lake Okeechobee BMAP will be carried out over a period of ten years. As this report reflects activities only one year into the ten-year phase, reductions beyond those included in the BMAP are not quantified or included in this report. Much of the progress tracked over the first year of BMAP implementation has been on larger-scale initiatives and projects.
During the reporting period, the Florida Department of Transportation (FDOT) began construction on 6 projects and added 2 new projects in the LOW. The City of Orlando completed 1 project, Orange County added 4 new projects, and the Spring Lake Improvement District (SLID) added 1 project to its plan during the reporting period. Counties, municipalities, and other stakeholders continued to plan and implement water quality projects and management strategies in the watershed.

Final 2015 Progress Report for the Lake Okeechobee Basin Management Action Plan, July 2016
Page 10 of 87
Figure ES-1. Lake Okeechobee Sub-watersheds

Final 2015 Progress Report for the Lake Okeechobee Basin Management Action Plan, July 2016
Page 11 of 87
Section 1: INTRODUCTION
1.1 PURPOSE OF THE REPORT This is the first annual Progress Report for the Lake Okeechobee Basin Management Action Plan (BMAP). Section 2 describes the activities that occurred during the period from January 1, 2015, through December 31, 2015. Section 3 describes the water quality monitoring that occurred during the reporting period. Section 4 describes other initiatives and projects in the Lake Okeechobee Watershed (LOW) that aim to reduce nutrient loading to the lake.
1.2 TOTAL MAXIMUM DAILY LOAD (TMDL) FOR THE LAKE OKEECHOBEE BASIN
The Florida Department of Environmental Protection (DEP) adopted the total phosphorus (TP) TMDL for Lake Okeechobee in 2001, after nine segments with waterbody identification (WBID) numbers in Lake Okeechobee were identified as impaired by TP: WBIDs 3212A, 3212B, 3212C, 3212D, 3212E, 3212F, 3212G, 3212H, and 3212I. The TMDL is a total annual phosphorus load to Lake Okeechobee of 140 metric tons per year (mt/yr), of which 35 mt/yr are estimated to fall directly on the lake through atmospheric deposition. The remaining 105 mt/yr of TP are allocated to the entire LOW, which consists of nine sub-watersheds (Figure ES-1). The attainment of the TMDL will be calculated using a 5-year rolling average of the monthly loads calculated from measured flow and concentration values. As DEP refines its load estimation model, sub-watershed expectations may be developed for future BMAP iterations.
1.3 RESPONSIBLE PARTIES AND KEY STAKEHOLDERS The BMAP process engages local stakeholders and promotes coordination and collaboration to address the reductions for TP. In February 2013, DEP initiated the BMAP development process and held a series of technical meetings involving stakeholders and the general public. DEP requested that stakeholders provide information on activities and projects that would reduce nutrient loading. For this first BMAP phase, the reductions are spread over approximately a ten-year period in order for the Coordinating Agencies—DEP, the South Florida Water Management District (SFWMD), and the Florida Department of Agriculture and Consumer Services (FDACS)— to develop additional projects to help meet the TMDL. Periodic updates to the BMAP will be conducted during the ten-year time frame, as necessary and appropriate.
This report includes projects in the six northern sub-watersheds that were completed, planned, or ongoing since 2009. However, DEP recognizes that stakeholders throughout the watershed have implemented stormwater management projects as well as statutorily mandated diversions away from Lake Okeechobee prior to 2009 and that these efforts have benefitted water quality. Additional reductions will be included in future BMAP updates, as DEP continues to work with stakeholders to identify new projects. Appendix A lists projects that will be implemented under this first phase of the BMAP.

Final 2015 Progress Report for the Lake Okeechobee Basin Management Action Plan, July 2016
Page 12 of 87
1.4 ASSUMPTIONS AND CONSIDERATIONS REGARDING TMDL IMPLEMENTATION
The water quality impacts of BMAP implementation are based on several fundamental assumptions about the pollutants targeted by the TMDLs, modeling approaches, waterbody response, and natural processes. In addition, there are important considerations about the nature of the BMAP and its long-term implementation. These assumptions and considerations are listed below, and more details can be found in the Lake Okeechobee BMAP.
1.4.1 Assumptions The following assumptions were used during the BMAP process:
• For calendar years (CY) 2001–12, the six northern sub-watersheds contributed 89.1 % of the TP load and 88.3 % of the discharge to Lake Okeechobee (SFWMD 2014). Therefore, DEP decided to focus on these sub-watersheds during this initial BMAP iteration.
• Certain best management practices (BMPs) were assigned provisional nutrient reduction benefits for load reductions in this BMAP iteration while additional research is conducted to quantify their effectiveness. These estimated reductions may change in future BMAP iterations, as additional research results become available.
• Nutrient reduction benefits (shown in Appendix A) of the stakeholders' projects were calculated using the best available methodologies. Project-specific monitoring, where available, will be used to verify DEP's calculations, and reduction benefits may be adjusted as necessary.
1.4.2 Considerations This BMAP requires stakeholders to implement their projects to achieve reductions within the specified period. However, the full implementation of this BMAP will be a long-term, adaptively managed process. While some of the projects and activities contained in the BMAP were recently completed or are currently ongoing, several projects require more time to design, secure funding, and construct.
Since BMAP implementation is a long-term process, the TMDL established for this basin is not likely to be achieved in the first ten-year iteration. It is understood that waterbodies may respond differently to the implementation of BMPs, and thus regular follow-up and continued coordination and communication by stakeholders will be essential to ensure the implementation of management strategies and assessment of incremental effects.

Final 2015 Progress Report for the Lake Okeechobee Basin Management Action Plan, July 2016
Page 13 of 87
During the BMAP process, several items were identified that should be addressed in future watershed management cycles to ensure that future BMAPs use the most accurate information. The following items are discussed in more detail in the BMAP:
• Land uses.
• Watershed boundaries.
• The Watershed Assessment Model (WAM)/load estimation tool.
• The complexity of the problem.
• Legacy phosphorus.
• Downstream attenuation factors.
• Attenuation factors.
• Elevated TP identification.
• Upstream TMDLs and Kissimmee Chain of Lakes TMDLs.
• Total nitrogen (TN).
• Previous restoration efforts.

Final 2015 Progress Report for the Lake Okeechobee Basin Management Action Plan, July 2016
Page 14 of 87
Section 2: ACTIVITIES DURING THE REPORTING YEAR
Sections 2.1 through 2.5 describe the accomplishments over the past year. Many of the activities that occurred during this first annual reporting period focused on projects and initiatives listed in the BMAP. In each annual report, newly identified projects are added to the project tables. Several individual projects have been added since BMAP adoption, and stakeholders and the Coordinating Agencies continue work on the individual projects shown in the tables in Appendix A.
2.1 COORDINATING AGENCY PROJECTS AND INITIATIVES During the reporting period, a host of restoration work in the LOW moved forward. In addition to site-specific projects, the Coordinating Agencies continued work on other initiatives to achieve nutrient reductions in the LOW. Table 1 provides updates on those initiatives listed in the Lake Okeechobee BMAP.
Table 1. Coordinating Agency initiatives Initiative Explanation Start Date Update
Comprehensive Everglades Restoration
Plan (CERP) planning
The SFWMD will consider reinitiating the formulation of
storage components of LOW project.
However, this requires concurrence from the U.S. Army Corps of Engineers (USACE)
(Federal Partner).
Summer 2016
The LOW Project is a component of the CERP that will identify regional-scale features north of Lake Okeechobee to improve the quantity, quality, timing, and distribution of
flows to better manage lake water levels and reduce undesirable discharges to downstream estuaries. Since the Lake Okeechobee BMAP was adopted, the LOW Project Implementation Report has been identified as one of the next CERP studies to be conducted as identified in the
USACE Integrated Delivery Schedule (IDS). It is anticipated that work by the USACE and SFWMD on this
planning effort will begin in summer 2016. The initial stage of the planning effort will include developing the overall scope for the plan. The planning process is anticipated to take approximately three years to complete. The LOW
Construction Project Phase II Technical Plan relies heavily on the LOW Project to help achieve the plan goals of
maintaining the lake within an ecologically desirable range and minimizing undesirable discharges to the Northern
Estuaries.
Owner-implemented
BMP verification
FDACS and DEP are developing a plan for
BMP verification.
Spring 2015
FDACS is currently working with DEP to identify possible sites that have implemented owner-implemented and cost-shared BMPs. FDACS has reviewed the historical data for
these sites, and the two agencies will work to select the most appropriate sites and begin monitoring in 2016.

Final 2015 Progress Report for the Lake Okeechobee Basin Management Action Plan, July 2016
Page 15 of 87
Initiative Explanation Start Date Update
Cost-share BMP
effectiveness verification
FDACS and DEP are developing an
approach to evaluate the effectiveness of
various types of cost-share projects.
Fall 2015
In late 2015, FDACS contracted with Soil and Water Engineering Technology, Inc. (SWET) to assess the
treatment efficiencies (TP and TN reductions in concentration and loads) as well as the storage capacities of various common cost-share BMPs in the LOW. The TP and
TN reductions for the evaluated cost-share BMPs will be provided to DEP, so revised nutrient-reduction benefits can be attributed to cost-share BMPs included in this BMAP.
FDACS will also use the TP and TN reductions and storage capacities to review future cost-share applications and maximize the nutrient reduction potential that can be
achieved with the available cost-share dollars.
WAM revisions
The Coordinating Agencies are
developing a contract to revise WAM to complete model domain setup for
northern region and 3 southern sub-
watersheds of LOW. Estimated completion
date is a year after adoption of BMAP. DEP will work to
develop targets based on this information.
Fall 2014
In early 2015, FDACS contracted with SWET to revise the WAM, which was used as the basis for the BMAP load
estimation tool. This effort was jointly funded by the SFWMD and DEP. Under this contract, SWET updated the model datasets and extended the WAM simulation period
through 2013 for all six sub-watersheds north of Lake Okeechobee. A literature review and draft work plan for the sensitivity and uncertainty analyses were also developed as
well as a work plan for the expansion of the WAM to include the three southern sub-watersheds.
In late 2015, the contract was amended to allow SWET to complete model validation and a final sensitivity analysis
and uncertainty analysis. The model will then be recalibrated for the six northern sub-watersheds. In addition
to the work in the northern sub-watersheds, DEP and FDACS are funding the expansion of the WAM to include
the East, South, and West Lake Okeechobee Sub-watersheds.
The WAM revisions are expected to be completed in fall
2016. DEP will use the revisions to refine the load estimation tool and to incorporate the East, South, and West
Lake Okeechobee Sub-watersheds into the tool.
Water quality monitoring
As DEP develops a monitoring plan for
the BMAP, consideration is being given to areas with on-
the-ground projects/BMPs to
evaluate water quality improvements.
In progress
BMAP monitoring plan stations have been verified, with data providers and locations confirmed, and appropriate
updates made to the revised monitoring network in Appendix B. DEP is working with additional potential data
providers to evaluate the possible inclusion of new monitoring sites. During the reporting period, DEP
confirmed and mapped the locations of projects and BMPs to optimize monitoring efforts.
Alternative BMP nutrient
reduction projects
North of Lake Okeechobee
Winter 2014/2015
The Coordinating Agencies have begun building a team to identify possible new strategies. The first quarterly meeting
is expected to occur in summer 2016.

Final 2015 Progress Report for the Lake Okeechobee Basin Management Action Plan, July 2016
Page 16 of 87
Initiative Explanation Start Date Update
In-lake strategies:
muck scraping and tilling
In Lake Okeechobee Fall 2014
Potential for inclusion as BMAP project(s) during low lake levels if drought conditions occur and if project logistics
(e.g., planning, permitting, contracting) are able to be implemented timely for work to be conducted. The
SFWMD Low Water Level Habitat Enhancement Plan drafted for the lake in November 2015 may inform this
initiative. The SFWMD draft plan (November 2015) was submitted to DEP in March 2016 (see Section 2.2.4).
Table 2 lists projects under development with the Coordinating Agencies. The projects are in various stages of planning, but the Coordinating Agencies will continue to work to gather details and implement these projects during the first BMAP phase.
Table 2. Projects under development with the Coordinating Agencies Note: These attenuated project reductions are calculated specifically to estimate the reductions at the inflow to Lake Okeechobee.
Project Name Sub-watershed Status Schedule
Istokpoga Marsh Watershed
Improvement District – Phase II
Indian Prairie
A Memorandum of Understanding (MOU) exists for this project between FDACS, SFWMD, Istokpoga Marsh Watershed Improvement District, and
Highlands County for the project. FDACS has identified funds to cover
Phase II of the project.
Work will begin in 2016.
Lakeside Ranch Stormwater Treatment
Area (STA) Phase II
Taylor Creek/ Nubbin Slough
This phase includes a southern STA and a second pump station (S-191A)
to manage rim canal levels during periods of high water flow and
potentially to recirculate lake water back to the STA for additional TP
removal. Under Phase II, the construction of the southern STA is
under way; however, the construction of the
S-191A pump station is contingent on future funding.
The southern STA is anticipated to be
completed by 2018. Once funded, the pump station is estimated to be completed in three
years.
MacArthur Agro-Ecology Research
Center "Buck Island" Ranch/Rafter T Realty,
Inc.
Lake Istokpoga
Both Northern Everglades–Payment for Environmental Services
(NE PES-2) contracts were executed in December 2014. Both Rafter T
Ranch (SFWMD-11) and Buck Island Ranch (SFWMD-23) are in the
operational phase.
Under NE PES-2, Rafter T Ranch became
operational in December 2014, and Buck Island Ranch
became operational in December 2015.
Brighton Valley – Lykes Indian Prairie
FDACS is currently funding the engineering of the Brighton Valley project, located in the Indian Prairie Sub-watershed. The design is in its final stages as changes had to be
incorporated to address archaeological issues.
Construction will begin in 2016; completion is
expected in 2017.

Final 2015 Progress Report for the Lake Okeechobee Basin Management Action Plan, July 2016
Page 17 of 87
Project Name Sub-watershed Status Schedule
Rolling Meadows Wetland Restoration –
Phase II Upper Kissimmee
Land has been acquired and planning started. Phase II of this project, which
involves the further restoration of approximately 580 acres of wetlands,
is contingent on future funding.
Once funded, project work is estimated to be
completed in two to three years.
Inactive Dairies – Lagoon Remediation
Taylor Creek/ Nubbin Slough
and Indian Prairie
FDACS worked with a dairy in the LOW to partially remediate its
lagoon. The soil was spread on the field for crops to use the nutrients
from the excavated soil. The stormwater is routed back to the
remediated pond to minimize discharges and is reused to reduce ground water withdrawals. In the
future, the dairy will finish the excavation and remediation of the
entire site.
1. Identify areas that need remediation activities/talk to
landowners. (Winter 2014/2015–Summer
2015)
2. Procure contractors/ conduct work. (Winter
2015/2016–Spring 2016)
3. Analyze data.
(yearly)
PL-566 Funded/ Fisheating Creek
Structure Indian Prairie
The USACE is working with the U.S. Department of Agriculture (USDA)
Natural Resources Conservation Service (NRCS) to develop various
alternatives. FDACS has set aside up to $1 million to fund this effort. The
NRCS, FDACS, and USACE are working with landowner groups to determine the type of structure that will be used to replace the existing
structure and the elevation of the new structure.
1. NRCS plans to reapply for different funding. (Fall 2014)
2. If funding is
obtained, work will be conducted. (To be
determined)
3. Water quality benefit calculations will be
done. (To be determined)
S.R. 710 Regional Project
Taylor Creek/ Nubbin Slough
and Indian Prairie
The feasibility study was completed. The Coordinating Agencies are
reviewing the study to determine the best project design.
1. The final feasibility study was completed on
October 22, 2014.
2. Work will be implemented. (To be
determined)

Final 2015 Progress Report for the Lake Okeechobee Basin Management Action Plan, July 2016
Page 18 of 87
Project Name Sub-watershed Status Schedule
Legislative Cost-Share Appropriation Program
($10 million annually for 7 years)
All
FDACS has conducted two rounds of solicitations for dairy project
proposals. The first solicitation occurred in fall 2014. Eight projects were selected for cost-share, and the cost-share funding allocated for these projects totaled $3,710,801.25. These
8 projects consist of 3 stormwater improvement projects, the
construction of waste management systems for 4 new free stall barns,
and 1 project that involved installing a seepage interceptor system adjacent
to a ditch that drained off-site.
The second solicitation for dairy projects occurred in fall 2015. Four
projects were selected for cost-share, and the cost-share funding allocated
for these projects totaled $2,750,451.89. These 4 projects
consist of 1 stormwater improvement project, the construction of the waste management systems for 7 new free
stall barns, and 1 project that involves constructing a sand lane for a dairy's
waste management system. Another 6 projects have been identified as
potential candidates for cost-share funding. FDACS is currently
negotiating with the producers that submitted these 6 projects to
determine if cost-share funding is suitable for these projects. FDACS
has also worked with DEP to develop a methodology for calculating the
nutrient reduction benefits associated with these projects. Once all
necessary information is obtained from the dairies, FDACS will provide the nutrient reduction benefits to DEP
for inclusion in the BMAP.
1. Develop plan and present to DEP
annually.
2. Implement projects once funds are
available.
3. Conduct the same exercise annually.
2.2 SFWMD ACTIVITIES During the reporting period, the SFWMD was involved in numerous restoration activities in the LOW. Regional projects with both water storage and water quality benefits also progressed. The following sections describe highlights and advancements made in key SFWMD-led projects in the LOW during the reporting period. Further information on progress in the LOW is also reported in the 2016 South Florida Environmental Report (SFER) – Volume I, Chapter 8, and Volume III, Appendix 4-1.

Final 2015 Progress Report for the Lake Okeechobee Basin Management Action Plan, July 2016
Page 19 of 87
2.2.1 Taylor Creek/Nubbin Slough Sub-watershed Projects Lakeside Ranch STA (LR-STA). Expedited under the Northern Everglades and Estuaries Protection Program (NEEPP), this project is a 2,700-acre STA in western Martin County on lands adjacent to Lake Okeechobee. The LR-STA Project is designed in two phases. Phase I (SFWMD-03) included a northern STA and an inflow pump station, which began operating in 2012. Phase II includes a southern STA and a second pump station (S-191A) to manage rim canal levels during high water flow periods and potentially to recirculate lake water back to the STA for additional TP removal. Under Phase II, the construction of the Southern STA is currently under way. However, the construction of the S-191A pump station is contingent on future funding. During CY 2015, LR-STA Phase I removed 12.5 mt of TP, or 70 % of the total load received, exceeding its designed removal rate of 9 mt/yr.
Taylor Creek STA (TC-STA). This STA (SFWMD-01) is located on the SFWMD-owned Grassy Island Ranch along the banks of Taylor Creek. As part of the Lake Okeechobee Critical Restoration Projects, the purpose of the TC-STA is to remove TP loads from the Taylor Creek drainage basin. The TC-STA facility was constructed in 2006, and flow-through operation began in 2008. In CY 2015, the STA retained 1.5 mt of TP, or almost 60 % of the load received.
Nubbin Slough STA (NS-STA). This STA (SFWMD-02) is located on SFWMD-owned lands at the New Palm Dairy site along the banks of Nubbin Slough. As part of the Lake Okeechobee Critical Restoration Projects, the purpose of the NS-STA is to remove TP loads from the Nubbin Slough drainage basin. NS-STA construction was completed in 2006, but this STA remained inoperable until needed construction modifications and repairs were more recently completed. In March 2015, the USACE transferred the STA to the SFWMD. Start-up monitoring is currently under way. Once the start-up monitoring requirement for TP reduction is achieved, then flow-through operation will begin.
2.2.2 Upper and Lower Kissimmee Sub-watershed Projects Kissimmee River Restoration and Kissimmee River Headwaters Revitalization. The main goal of the Kissimmee River Restoration Project (KRRP) (SFWMD-05) is to restore ecological integrity to approximately one-third of the river and its floodplain that existed before the Kissimmee River was channelized in the 1960s. The project involves acquiring more than 102,000 acres of land in the river's floodplain and headwaters, backfilling 22 miles of the C-38 Canal, reconnecting remnant sections of the original river channel, removing 2 water control structures, modifying portions of the river's headwaters, and implementing the Headwaters Regulation Schedule to meet the project hydrologic criteria needed to meet the KRRP ecological goals. The first three construction phases of restoration were completed between 2001 and 2009. Reach 3 backfilling was awarded in fiscal year (FY) 2015 and is currently in progress. All project construction is scheduled for completion in 2020.

Final 2015 Progress Report for the Lake Okeechobee Basin Management Action Plan, July 2016
Page 20 of 87
During 2015, real estate acquisition for the Kissimmee River Headwaters Revitalization Project (SFWMD-22) also progressed. This project is a major component of the overall KRRP restoration effort. The project will increase regulatory stages and change the operating schedule on three major waterbodies in the Kissimmee Chain of Lakes. It is designed to increase storage in the headwater lakes to provide appropriate flow patterns to the restored Kissimmee River floodplain upon completion of restoration construction and land acquisition (expected date 2020), and the increased storage is also expected to improve the quantity and quality of littoral habitat in the headwater lakes. Further details on Kissimmee River Restoration efforts are available in the 2016 SFER – Volume I, Chapter 9.
Rolling Meadows – Phases I and II. The purpose of this project is to restore the historical Lake Hatchineha floodplain wetlands and habitat in the Rolling Meadows property, which was purchased jointly by the SFWMD and DEP as part of the Kissimmee Headwaters Revitalization Project. The project will also provide ancillary water quality, timing, and distribution benefits. In 2015, Phase I (SFWMD-06) design and permitting was finalized. Construction began in November 2015, with expected completion by December 2016. Project construction includes the installation of water control structures throughout the Rolling Meadows property. These structures will facilitate the hydration and restoration of approximately 1,900 acres of previously impacted floodplain on Lake Hatchineha. Phase II of this project, which involves the further restoration of approximately 580 acres of wetlands, is contingent on future funding.
2.2.3 Dispersed Water Management (DWM) Program During the reporting period, efforts continued to expand opportunities for DWM in the Northern Everglades watersheds, in which private landowners manage water on parts of their property to aid in water retention/storage or nutrient load reduction. There is 1 DWM project in construction and 12 operational DWM projects in the Lake Okeechobee BMAP. As a notable example, Nicodemus Slough (SFWMD-21) became operational in 2015. Currently, this DWM project has the largest estimated annual storage benefit (33,860 acre-feet per year [ac-ft/yr]) of any single DWM project in the Lake Okeechobee BMAP. Further information on individual Lake Okeechobee BMAP DWM projects is available in Appendix A and on the SFWMD website.
2.2.4 Other Restoration Strategies CERP LOW Project. CERP provides a framework and guide to restore, protect, and preserve the water resources of central and southern Florida, including the Everglades. The USACE is the Federal Partner, and the SFWMD is the Local Sponsor. The LOW Project is a component of CERP that will identify regional-scale features north of Lake Okeechobee to improve the quantity, quality, timing, and distribution of flows to better manage lake water levels and reduce undesirable discharges to downstream estuaries.
Since the Lake Okeechobee BMAP was adopted, the LOW Project Implementation Report has been identified as one of the next CERP studies to be conducted as identified in the USACE IDS.

Final 2015 Progress Report for the Lake Okeechobee Basin Management Action Plan, July 2016
Page 21 of 87
It is anticipated that work by the USACE and SFWMD on this planning effort will begin in summer 2016. The initial stage of the planning effort will include developing the overall scope for the plan, and the planning process will take approximately three years to complete. The Lake Okeechobee Watershed Construction Project Phase II Technical Plan relies heavily on the LOW Project to help achieve the plan goals of maintaining the lake within an ecologically desirable range and minimizing undesirable discharges to the Northern Estuaries.
Lake Okeechobee Low Water Level Habitat Enhancement Plan. Consistent with the final Lake Okeechobee BMAP, the SFWMD finalized the Low Water Level Habitat Enhancement Plan for the lake in November 2015. The intent of the plan is to provide information to help guide the future formulation of event-specific (times when drought conditions result in low lake levels) habitat enhancement project plans. This plan is not a phosphorus reduction project required by DEP's BMAP for Lake Okeechobee, and no loading reductions have been assigned to the potential ecological restoration activities described in the plan. The report identifies and describes potential habitat enhancement projects, lake stage triggers required to commence work, potential project partners, estimated costs, and requisite permits. This planning approach incorporates lessons learned from previous work for consideration into the development of new projects to help maximize benefits to aquatic habitat. While the focus of the plan and the potential projects within are not water quality improvements, their implementation will benefit the overall ecological health of Lake Okeechobee. The SFWMD reserves the option to propose the projects as identified as in the Low Lake Level Plan as potential mitigation for low lake levels, if needed. The SFWMD draft plan (November 2015) was submitted to DEP in March 2016.
2.3 FLORIDA DEPARTMENT OF TRANSPORTATION (FDOT) ACTIVITIES 2.3.1 District 1 FDOT District 1 began construction on the State Road (SR) 70 roadway improvement projects (FDOT1-01 and FDOT1-02). A total of nine wet detention ponds and three dry retention ponds are anticipated to be constructed. Construction is expected to be completed in spring 2017. FDOT District 1 continues to implement its street sweeping program on sections of curb and gutter roadways located in the LOW. Appendix A includes updated street sweeping calculations for 2015.
2.3.2 District 5 FDOT District 5 began construction on Projects FDOT5-1, FDOT5-2, FDOT5-3, FDOT5-4, and FDOT5-12 during the reporting period. These include the construction of 4 wet detention ponds along SR 15 (Hoffner Road/Avenue) and 1 wet detention pond along SR 600 (U.S. Highway 17-92). In addition, the construction of 2 wet detention ponds associated with the widening of SR 500 from Eastern Avenue to Nova Road began in fall 2015. Both projects (FDOT5-26 and

Final 2015 Progress Report for the Lake Okeechobee Basin Management Action Plan, July 2016
Page 22 of 87
FDOT5-27) are projected to be completed in fall 2017, and FDOT estimates these ponds will reduce a total of 0.016 mt/yr (15.91 kilograms per year [kg/yr]) of TP.
2.4 AGRICULTURAL ACTIVITIES FDACS currently has seven field staff who work with producers on BMP notice of intent (NOI) enrollment and implementation in the SFWMD region. Some FDACS activities include initial NOI enrollment, follow-up technical assistance, BMP cost-share, BMP implementation assurance visits, the management of water quality and water supply projects and contracts, and coordination with the SFWMD on agriculture-related permitting questions. These staff also participate in the development of various BMAPs in the SFWMD region.
2.4.1 Project Updates FDACS provided updates on water quality and water supply projects with which it is involved in contract or project management. Table A-1 through Table A-7 and Section 2 include some project-specific updates, and additional updates are provided below.
Hybrid Wetland Treatment Technology (HWTT). This water treatment technology comprises both biological and chemical processes to remove nutrients such as TP and TN, as well as other chemical constituents, from the water. There are 5 existing HWTT facilities in the LOW. During the reporting period, operations at one of the facilities (Grassy Island) were increased to 30 cubic feet per second (cfs). The TP load reductions at the five HWTT facilities in the LOW ranged from 60 % to 92 % during the 2015 reporting period.
Floating Aquatic Vegetation Tilling (FAVT). FAVT is a water treatment technology that uses biological processes to remove nutrients. Shallow wetland systems are created and are stocked with native floating aquatic vegetation. Nutrients are removed as the plants grow, and further reduction takes place in submerged aquatic vegetation cells. A location in the Fisheating Creek Sub-watershed has been identified for a FAVT project, and permitting of the facility is under way.
BMP Verification. FDACS is currently working with DEP to identify possible sites that have implemented owner-implemented and cost-shared BMPs. FDACS has reviewed the historical data for these sites, and the two agencies will work to select the most appropriate sites and begin monitoring in 2016.
2.4.2 WAM Updates In early 2015, FDACS contracted with SWET to revise the WAM, which was used as the basis for the BMAP load estimation tool. This effort was jointly funded by the SFWMD and DEP. Under this contract, SWET updated the model datasets and extended the WAM simulation period through 2013 for all six sub-watersheds north of Lake Okeechobee. A literature review

Final 2015 Progress Report for the Lake Okeechobee Basin Management Action Plan, July 2016
Page 23 of 87
and draft work plan for the sensitivity and uncertainty analyses were also developed, as well as a work plan for the expansion of the WAM to include the three southern sub-watersheds.
In late 2015, the contract was amended to include the completion of model validation and a final sensitivity analysis and uncertainty analysis. Following the validation and sensitivity and uncertainty analyses, the model is being recalibrated for the six northern sub-watersheds. In addition to the work in the northern sub-watersheds, DEP and FDACS are funding the expansion of the WAM domain to include the three southern sub-watersheds: East, South, and West Lake Okeechobee.
The WAM revisions are expected to be completed in fall 2016. DEP will use the revisions to refine the load estimation tool and to incorporate the East, South, and West Lake Okeechobee Sub-watersheds into the tool.
2.4.3 Land Use Updates The existing BMAP load estimation tool uses the SFWMD 2008–09 land use coverage that was modified in 2013 to include local expert knowledge of dairy operations. Due to the constantly evolving nature of agriculture, FDACS has began conducting an assessment of the agricultural land uses in the 2008–09 SFWMD geodatabase. To date, FDACS has completed ground-truthing exercises for the Taylor Creek/Nubbin Slough, Indian Prairie, and Fisheating Creek Sub-watersheds. It has begun efforts to ground-truth agricultural land uses in the Lake Istokpoga Sub-watershed and will continue this exercise for both the Lower Kissimmee and Upper Kissimmee Sub-watersheds, as well as the three sub-watersheds south of Lake Okeechobee.
2.4.4 Agricultural BMPs/BMP Enrollment Landowners who sign NOIs are agreeing to implement applicable BMPs on their enrolled properties. For purposes of estimating nutrient reductions from agriculture, all agricultural lands are assumed to be enrolled in the FDACS BMP Program, excluding properties enrolled in FDACS BMPs prior to 2009. The NOIs will document the estimated total number of acres on which applicable BMPs are implemented, not the entire parcel acreage. This is because some parcels contain nonproduction acres (such as buildings, parking lots, and fallow acres) that will not be counted on the NOIs submitted to FDACS. In addition, FDACS BMPs are not targeted toward noncommercial agricultural activities.
In the LOW, FDACS has 1,789,771.5 acres enrolled in BMP programs for citrus, cow/calf, dairy, equine, fruit/nut, nursery, row/field crop, and sod. Of this acreage, 909,650 acres are enrolled on lands classified as agriculture, according to the 2008–09 land use data used by DEP to develop the load estimation tool. Table 3a and Table 3b through Table 8a and Table 8b summarize the land use data figures for agriculture in the six northern sub-watersheds, the acreage associated with commodity types addressed by BMP manuals, the acres enrolled in BMP programs, and the additional acreage necessary to meet 100 % enrollment in the LOW. Figure 1

Final 2015 Progress Report for the Lake Okeechobee Basin Management Action Plan, July 2016
Page 24 of 87
shows the acres in the Lake Okeechobee BMAP area enrolled in the FDACS BMP Program as of December 31, 2015.
2.4.5 BMP Compliance Assistance In spring 2015, DEP and FDACS agreed to commence the compliance assistance effort for the Lake Okeechobee BMAP to ensure that agricultural landowners are aware of their statutory responsibility to implement BMPs in the BMAP area. While all agricultural operations in the BMAP areas for which FDACS has adopted a BMP manual are required by statute to enroll or monitor, this joint compliance assistance effort is concentrated where it will be most effective.
FDACS began the Lake Okeechobee compliance assistance effort in the Taylor Creek/Nubbin Slough Sub-watershed. The Florida Department of Revenue parcel data were used to generate a list of unenrolled properties that had a greenbelt exemption, that were 50 acres or greater in area (except nurseries, which were included regardless of acreage due to their generally smaller size), and that were known to be commercial agriculture (greater than $1,000 per year in gross sales).
FDACS sent a compliance assistance letter to 124 property owners in May 2015, and responses were received from 114 owners (a 92 % response rate). These responses resulted in an additional 33,394 acres of enrollment under 59 new NOIs (these enrolled acres may include land not classified as agriculture according to the 2008–09 SFWMD land use coverage).
In 2016, FDACS sent a second letter to the nonresponders. Information on landowners who failed to respond to the second letter was provided to DEP, and an initial compliance assistance letter was mailed from DEP in April 2016.
In August 2015, FDACS commenced the compliance assistance effort in the Indian Prairie Sub-watershed. Letters were sent to 94 property owners. As of January 2016, 35 responses (a 37 % response rate) were received. These responses resulted in an additional 14 new NOIs that cover 14,900 acres.
A second letter was sent to the nonresponders, and this compliance assistance process will continue in the Indian Prairie Sub-watershed and the remaining northern sub-watersheds. FDACS plans to begin the compliance assistance efforts in the Fisheating Creek Sub-watershed in summer 2016.

Final 2015 Progress Report for the Lake Okeechobee Basin Management Action Plan, July 2016
Page 25 of 87
Table 3a. Agricultural acreage and BMP enrollment for the Fisheating Creek Sub-watershed 1 The acreage enrolled includes the total acres with natural areas that fall within enrolled areas. Overlapping records are not duplicated. Estimated acreage is based on the lesser of the enrolled NOI acres or the calculated clipped parcel acres, to determine an approximate percentage of land mass enrolled in each of the sub-watersheds.
Table 3b. BMP enrollment and future enrollment requirements for the Fisheating Creek Sub-watershed 1 The acreage enrolled includes the total acres with natural areas that fall within enrolled areas. Overlapping records are not duplicated. Estimated acreage is based on the lesser of the enrolled NOI acres or the calculated clipped parcel acres, to determine an approximate percentage of land mass enrolled in each of the sub-watersheds.
Category Acres Total 2009 Acres 174,547.80
Acreage Enrolled as of December 31, 20081 26,307.32 Acreage Enrolled January 1, 2009–December 31, 20151 118,764.80
Total Acreage Enrolled (as of December 31, 2015) 145,072.12 Remaining Acres To Enroll 29,475.68

Final 2015 Progress Report for the Lake Okeechobee Basin Management Action Plan, July 2016
Page 26 of 87
Table 4a. Agricultural acreage and BMP enrollment for the Indian Prairie Sub-watershed 1 The acreage enrolled includes the total acres with natural areas that fall within enrolled areas. Overlapping records are not duplicated. Estimated acreage is based on the lesser of the enrolled NOI acres or the calculated clipped parcel acres, to determine an approximate percentage of land mass enrolled in each of the sub-watersheds. 2 Sod farms are enrolled in an additional eight NOIs under the statewide Sod BMP Program.
Table 4b. BMP enrollment and future enrollment requirements for the Indian Prairie Sub-watershed 1 The acreage enrolled includes the total acres with natural areas that fall within enrolled areas. Overlapping records are not duplicated. Estimated acreage is based on the lesser of the enrolled NOI acres or the calculated clipped parcel acres, to determine an approximate percentage of land mass enrolled in each of the sub-watersheds.
Category Acres Total 2009 Acres 218,170.3
Acreage Enrolled as of December 31, 20081 8,100.4 Acreage Enrolled January 1, 2009-December 31, 20151 154,562.1
Total Acreage Enrolled (as of December 31, 2015) 162,662.5 Remaining Acres To Enroll 55,507.8

Final 2015 Progress Report for the Lake Okeechobee Basin Management Action Plan, July 2016
Page 27 of 87
Table 5a. Agricultural acreage and BMP enrollment for the Lake Istokpoga Sub-watershed 1 The acreage enrolled includes the total acres with natural areas that fall within enrolled areas. Overlapping records are not duplicated. Estimated acreage is based on the lesser of the enrolled NOI acres or the calculated clipped parcel acres, to determine an approximate percentage of land mass enrolled in each of the sub-watersheds.
Table 5b. BMP enrollment and future enrollment requirements for the Lake Istokpoga Sub-watershed 1 The acreage enrolled includes the total acres with natural areas that fall within enrolled areas. Overlapping records are not duplicated. Estimated acreage is based on the lesser of the enrolled NOI acres or the calculated clipped parcel acres, to determine an approximate percentage of land mass enrolled in each of the sub-watersheds.
Category Acres Total 2009 Acres 130,577.2
Acreage Enrolled as of December 31, 20081 25,137.1 Acreage Enrolled January 1, 2009-December 31, 20151 71,306.2
Total Acreage Enrolled (as of December 31, 2015) 96,443.3 Remaining Acres To Enroll 34,069.5

Final 2015 Progress Report for the Lake Okeechobee Basin Management Action Plan, July 2016
Page 28 of 87
Table 6a. Agricultural acreage and BMP enrollment for the Lower Kissimmee Sub-watershed 1 The acreage enrolled includes the total acres with natural areas that fall within enrolled areas. Overlapping records are not duplicated. Estimated acreage is based on the lesser of the enrolled NOI acres or the calculated clipped parcel acres, to determine an approximate percentage of land mass enrolled in each of the sub-watersheds. 2 Sod farms are enrolled in one additional NOI under the statewide Sod BMP Program.
Table 6b. BMP enrollment and future enrollment requirements for the Lower Kissimmee Sub-watershed 1 The acreage enrolled includes the total acres with natural areas that fall within enrolled areas. Overlapping records are not duplicated. Estimated acreage is based on the lesser of the enrolled NOI acres or the calculated clipped parcel acres, to determine an approximate percentage of land mass enrolled in each of the sub-watersheds.
Category Acres Total 2009 Acres 216,259.1
Acreage Enrolled as of December 31, 20081 80,488.2 Acreage Enrolled January 1, 2009-December 31, 20151 82,862.0
Total Acreage Enrolled (as of December 31, 2015) 163,350.2
Remaining Acres To Enroll 52,908.9

Final 2015 Progress Report for the Lake Okeechobee Basin Management Action Plan, July 2016
Page 29 of 87
Table 7a. Agricultural acreage and BMP enrollment for the Taylor Creek/Nubbin Slough Sub-watershed 1 The acreage enrolled includes the total acres with natural areas that fall within enrolled areas. Overlapping records are not duplicated. Estimated acreage is based on the lesser of the enrolled NOI acres or the calculated clipped parcel acres, to determine an approximate percentage of land mass enrolled in each of the sub-watersheds.
Table 7b. BMP enrollment and future enrollment requirements for the Taylor Creek/Nubbin Slough Sub-watershed 1 The acreage enrolled includes the total acres with natural areas that fall within enrolled areas. Overlapping records are not duplicated. Estimated acreage is based on the lesser of the enrolled NOI acres or the calculated clipped parcel acres, to determine an approximate percentage of land mass enrolled in each of the sub-watersheds.
Category Acres Total 2009 Acres 140,906.5
Acreage Enrolled as of December 31, 20081 46,032.6 Acreage Enrolled January 1, 2009-December 31, 20151 66,622.3
Total Acreage Enrolled (as of December 31, 2015) 112,655.0 Remaining Acres To Enroll 28,251.5

Final 2015 Progress Report for the Lake Okeechobee Basin Management Action Plan, July 2016
Page 30 of 87
Table 8a. Agricultural acreage and BMP enrollment for the Upper Kissimmee Sub-watershed 1 The acreage enrolled includes the total acres with natural areas that fall within enrolled areas. Overlapping records are not duplicated. Estimated acreage is based on the lesser of the enrolled NOI acres or the calculated clipped parcel acres, to determine an approximate percentage of land mass enrolled in each of the sub-watersheds.
Table 8b. BMP enrollment and future enrollment requirements for the Upper Kissimmee Sub-watershed 1 The acreage enrolled includes the total acres with natural areas that fall within enrolled areas. Overlapping records are not duplicated. Estimated acreage is based on the lesser of the enrolled NOI acres or the calculated clipped parcel acres, to determine an approximate percentage of land mass enrolled in each of the sub-watersheds.
Category Acres Total 2009 Acres 275,010.4
Acreage Enrolled as of December 31, 20081 14,031.0 Acreage Enrolled January 1, 2009-December 31, 20151 108,312.7
Total Acreage Enrolled (as of December 31, 2015) 122,343.7 Remaining Acres To Enroll 152,666.7

Final 2015 Progress Report for the Lake Okeechobee Basin Management Action Plan, July 2016
Page 31 of 87
Figure 1. BMP enrollment in the Lake Okeechobee Watershed as of December 31, 2015
Final 2015 Progress Report for the Lake Okeechobee Basin Management Action Plan, July 2016
Page 32 of 87
2.5 CITY, COUNTY, AND SPECIAL DISTRICT ACTIVITIES 2.5.1 City of Kissimmee Kissimmee provides outreach and education to private and public groups, such as citizens, students, and businesses. The Public Education Coordinator visited several elementary schools to display the Enviroscape Model to show the overall effect of different types of pollution that enter waterbodies and ground water through stormwater conveyance. City staff also attended local college Earth Day events with display tables set up to focus on recycling and stormwater education. Other events included speaking/participating at different summer camps, City of Kissimmee's School of Government, Public Works Week, and Great Outdoors Day. Each event included presentations and giveaways tailored to the audience.
2.5.2 City of Orlando During the reporting period, Orlando completed the Lake Angel Drainage Improvement project (ORL-6) in September 2015. This project expanded the permanent pool volume of Lake Angel and included the installation of three baffle boxes in the main inflow pipes. Calculation errors were also discovered in the BMAP tables for Orlando's TP/TN reductions, and these reduction estimates have been corrected in the project tables in Appendix A.
2.5.3 Orange County Orange County has identified multiple new projects for water quality improvements, including four (OC-29 through OC-32) added to the BMAP. During the reporting period, construction on some BMPs began.
2.5.4 Spring Lake Improvement District (SLID) The original STA project (SLID-1) in the northern SLID stormwater management system was broken out into three phases. Phase 1 includes design, surveying, permitting, site preparation, and partial construction of the overall project, and DEP Agreement No. G0377 awarded a grant of $624,000 for this phase. The excavation of the wet detention area and a portion of the northeast shallow marsh area have been completed as part of Phase 1. Completion is anticipated by September 30, 2016. SLID has acquired additional funding, and project change orders have been issued for Phases 2 and 3. The additional funding to complete the original three phases was obtained via legislative appropriation and the State Revolving Fund (SRF) Loan Program. The total cost for Phases 1 through 3 is $3,126,265.
SLID has proposed the Phase 4 expansion (SLID-2) of the existing STA within an additional 60 acres of unimproved contiguous lands. The expansion will include the construction of a wetland marsh system as part of the STA and will work to optimize treatment capabilities. The expanded STA will provide additional water quality treatment benefits (for total suspended solids [TSS], TN, and TP) prior to discharge into Arbuckle Creek. Phase 4 includes surveying, engineering

Final 2015 Progress Report for the Lake Okeechobee Basin Management Action Plan, July 2016
Page 33 of 87
design, permitting, bidding, construction, engineering services during construction, and project administration, and will cost $2,586,358.
2.6 SUMMARY OF ACCOMPLISHMENTS During the reporting period, FDOT District 5 began construction on five projects (FDOT5-1, FDOT5-2, FDOT5-3, FDOT5-4, FDOT5-12) and added two new projects (FDOT5-26 and FDOT5-27) in the LOW. FDOT District 1 began construction on two projects (FDOT1-01 and FDOT1-02), and continued to implement street sweeping on sections of curb and gutter roadways in the LOW. Orange County added four new projects (OC-29 through OC-32 ) to its plan. During the reporting period, SFWMD-led BMAP projects and other restoration initiatives progressed (see Section 2.2). Additionally, under the DWM Program SFWMD added one new project, Buck Island Ranch Water Management Alternative (WMA) (NE PES-2) (SFWMD-23). Orlando completed one project (ORL-6), and SLID added one project (SLID-2) to its plan during the reporting period. In addition, the reduction potential for agricultural BMP program enrollment of 100 % of eligible acres was updated based on the December 2015 enrollment information provided by FDACS.
Table A-1 through Table A-6 include the status of the Lake Okeechobee BMAP projects that have been completed and are under way. Efforts on the projects and initiatives in Table A-7 and Table A-8 will continue to follow the schedules set out in the BMAP, and project details will be updated as information becomes available.

Final 2015 Progress Report for the Lake Okeechobee Basin Management Action Plan, July 2016
Page 34 of 87
Section 3: WATER QUALITY MONITORING
The Lake Okeechobee BMAP monitoring plan was designed to enhance the understanding of basin loads, identify areas with high nutrient concentrations, and track water quality trends. The information gathered through the monitoring plan will measure progress towards achieving the TMDL and provide a better understanding of watershed loading. The BMAP monitoring plan is designed to be flexible enough to account for new information as it becomes available, and efforts are under way to make improvements to the monitoring plan according to the following schedule:
• Identify areas with regional projects already in place. (Complete)
• Evaluate areas where additional water quality data are needed. (Once WAM complete.)
• Identify lead entity for monitoring efforts. (Spring 2017–Summer 2017)
• Finalize monitoring plan. (During BMAP Phase I, Fall 2018)
Efforts are also under way to incorporate additional stations not already included in the monitoring network, and to update existing monitoring network station names and locations where necessary. Appendix B provides an updated BMAP monitoring plan.
3.1 WATER QUALITY MONITORING 3.1.1 Monitoring Objectives The primary objective of the monitoring strategy for the LOW is to continue to track trends in TP loads and concentrations by sub-watershed. Secondary objectives are tracking trends in TN loads and concentrations by sub-watershed, identifying areas in the watershed with elevated TP loading to better focus management efforts, and measuring the effectiveness of individual or collective projects in reaching TMDL target-pollutant loadings. The stations included in the BMAP monitoring network are not specifically BMAP stations—i.e., the data they generate are also used for other purposes—but the data collected at these sites will be used to monitor the effectiveness of the BMAP.
3.1.2 Data Management and Assessment The Florida Storage and Retrieval (STORET) Database serves as the primary repository of ambient water quality data for the state. DEP impaired waters evaluations are based on water quality data from STORET. Ambient water quality data collected as part of the BMAP will be uploaded into STORET for long-term storage and availability. All BMAP data providers have agreed to upload ambient water quality data to STORET at least once every six months, upon completion of the appropriate quality assurance/quality control (QA/QC) checks. The SFWMD

Final 2015 Progress Report for the Lake Okeechobee Basin Management Action Plan, July 2016
Page 35 of 87
will input its data into STORET at least once per year. Table B-1 shows the latest sample date within the reporting period with available phosphorus data in STORET. U.S. Geological Survey (USGS) stations are included in the monitoring network for available flow data, and the most recent flow data within the reporting period are shown for USGS stations.
3.1.3 Water Quality Analyses After each year of BMAP implementation, the water quality data will be analyzed to complement other analyses already under way in the LOW. The selection of an appropriate data analysis method depends on the frequency, spatial distribution, and period of record (POR) available from existing data. Specific statistical analyses were not identified during BMAP development, and thus commonly accepted methods of data analysis will be used that are consistent with the TMDL model.
As required by NEEPP, the SFWMD monitors water quality and flow (inflows to and outflows from Lake Okeechobee) at SFWMD-operated control structures and maintains a long-term water quality monitoring network in the LOW. The SFWMD continued its water quality sampling program throughout the watershed during the 2015 reporting period.
Further information on the monitoring and data results from the Lake Okeechobee Watershed Protection Program are reported in the 2016 SFER – Volume I, Chapter 8. The 2016 SFER includes various water quality analyses in the Lake Okeechobee BMAP area. However, these analysis are based on a water year (WY) (WY2015 is May 1, 2014, through April 30, 2015) rather than the BMAP reporting period (January 1, 2015, through December 31, 2015). Some of these analyses relate to the primary and secondary objectives of the LOW monitoring strategy, and some analyses are consistent with the method for calculating the attainment of the TMDL (a five-year rolling average).

Final 2015 Progress Report for the Lake Okeechobee Basin Management Action Plan, July 2016
Page 36 of 87
Section 4: OTHER EFFORTS
4.1 LAKE TOHOPEKALIGA NUTRIENT REDUCTION PLAN (NRP)
Within the Lake Okeechobee BMAP boundary, restoration efforts have been ongoing under the Lake Tohopekaliga NRP. This plan, accepted by DEP in December 2011, includes many efforts that parallel those in the Lake Okeechobee BMAP, and some that benefit Lake Okeechobee in addition to benefitting Lake Tohopekaliga. This section includes some general information on the Lake Tohopekaliga NRP.
4.1.1 Background Lake Tohopekaliga is a 22,000-acre lake located in Osceola County in central Florida. It has a long history of management activities that have altered the lake's natural hydrology and water quality over time. In the 2010 list of impaired waters, DEP listed Lake Tohopekaliga (Figure 2) as impaired for nutrients based on an increasing trend in the Trophic State Index (TSI), which is representative of a total measure of algal biomass in the lake.
Following discussions between Osceola County, Kissimmee, and DEP, it was the county and city's opinion that an algal-based analysis such as the TSI was not the most appropriate tool for assessing the lake's impairment. Based on additional information gathered by DEP in reviewing the city and county's concerns, DEP determined that the cause of impairment for the lake is an imbalance of flora, based on the presence of abundant hydrilla. At that time, the Florida Water Quality Standards (Chapter 62‐302, Florida Administrative Code [F.A.C.]) provided a narrative nutrient criterion (Subsection 62‐302.530[47], F.A.C.), which was applied to impaired waters assessments using Rule 62‐303.350, F.A.C.
DEP's decision to rely on the narrative nutrient criterion is due to the abundant growth of hydrilla present in the lake, as determined from hydrilla biocover data collected by the Florida Fish and Wildlife Conservation Commission (FWCC) since 2001. Florida has since developed and implemented numeric nutrient criteria (NNC) for lakes.
Although not the focus of the impairment listing, East Lake Tohopekaliga, which is hydraulically connected to Lake Tohopekaliga, was also impaired for nutrients based on the TSI. East Lake Tohopekaliga, however, does not have an overabundance of hydrilla.

Final 2015 Progress Report for the Lake Okeechobee Basin Management Action Plan, July 2016
Page 37 of 87
Figure 2. Lake Tohopekaliga Watershed

Final 2015 Progress Report for the Lake Okeechobee Basin Management Action Plan, July 2016
Page 38 of 87
Lake Tohopekaliga has been highly managed since the 1960s, and local stakeholders thought that an appropriate measure of impairment for the lake should take into account the long‐term management activities. Stakeholders contended that a TMDL based on the TSI would not accurately set appropriate water quality targets for the lake due to the complex interactions between ambient water quality, hydrilla, and management activities that still are not completely understood. It was also believed that past lake management (i.e., lake level control, hydrilla coverage) may have contributed to the decline in water quality over time. Currently one of the primary functions of hydrilla in Lake Tohopekaliga is to support the endangered snail kite population, and the FWCC is managing the hydrilla for that purpose.
4.1.2 NRP Development During negotiations, DEP agreed that more research and a better understanding of lake nutrient dynamics were needed before appropriate water quality targets could be set for the lake. In addition to modifying the cause for impairment, DEP would also consider modifying the lake's assessment status from Category 5 (i.e., water quality standards are not attained and a TMDL is required) to Category 4e (i.e., impaired, but recently completed or ongoing restoration activities are under way to restore the designated uses of the waterbody) if assurance was provided that measures were being put in place to reduce nutrient loading to the lake.
As a result of this decision, local stakeholders embarked on the development of an NRP for Lake Tohopekaliga to address DEP's requirements to facilitate the change in assessment category (i.e., Category 5 to Category 4e). Stakeholders included Osceola County, Kissimmee, St. Cloud, Orlando, Orange County, and FDOT District 5. Several agency partners participated in the development of the NRP and provided technical support, including DEP, SFWMD, FWCC, FDACS, Florida Farm Bureau, Reedy Creek Improvement District (RCID), and University of Florida Institute of Food and Agricultural Sciences (UF–IFAS).
The purposes of the Lake Tohopekaliga NRP were to document local efforts to achieve nutrient reductions and to provide additional time to assess the complex relationships in the lake, including the relationships among nutrients, TSI, macrophytes, and other factors. The NRP does the following:
• Defines baseline nutrient loading to the lake (by entity).
• Documents projects and activities identified since 2009 that result in overall nutrient reduction to Lake Tohopekaliga.
• Identifies research needs to improve the understanding of nutrient dynamics in the lake, with an emphasis on how the overgrowth and management of aquatic plants have affected nutrient concentrations and interactions.

Final 2015 Progress Report for the Lake Okeechobee Basin Management Action Plan, July 2016
Page 39 of 87
Stakeholders regulate stormwater discharges through the enforcement of National Pollutant Discharge Elimination System (NPDES) municipal separate storm sewer system (MS4) permits. These permits contain many elements, some of which include the identification of illicit discharges, public outreach and education, and local ordinances. Federal and state agencies are authorized and/or mandated to cooperatively manage hydrology, aquatic plants, and fisheries habitat in the lake in consultation with local stakeholders. It is a goal of the NRP that state agencies and local stakeholders continue to collaborate to determine how nonpoint source pollution, lake level control, aquatic plant management, and fisheries habitat improvement interact, and the overall combined effect on the lake's water quality.
4.1.3 NRP Elements To satisfy DEP requirements, the Lake Tohopekaliga NRP contained the following elements:
• Pollutant Load Analysis – This was done using geographic information system (GIS) tools and an existing Hydrologic Simulation Program – FORTRAN (HSPF) Model previously developed by DEP for TMDL modeling in the Upper Kissimmee River Basin. The purpose of this task was to identify the relative pollutant load contributions by stakeholder in the basin.
• Identification of Management Actions To Reduce Pollutant Loading – The stakeholders in the watershed provided information on projects and programs that were already in place or will be implemented in the future to reduce nutrients to the lake in the first five years of the NRP. These management actions are in one of two major categories: (1) projects completed since 2009 (baseline condition); and (2) planned projects and programs.
• Establishment of Research Priorities – During the formulation of the NRP, it was evident that more research was needed to set appropriate water quality targets for Lake Tohopekaliga and to define the balanced condition for the lake. Knowledge gaps were identified and research questions were formulated that were revisited by stakeholders once an extensive literature search on hydrilla–nutrient interactions was completed.
• Water Quality Monitoring Plan – A monitoring plan was designed to enhance the understanding of basin pollutant loading, identify areas with high nutrient concentrations, and track water quality trends. Stakeholders cooperatively and routinely sample throughout the watershed at strategic locations defined by a monitoring network.

Final 2015 Progress Report for the Lake Okeechobee Basin Management Action Plan, July 2016
Page 40 of 87
• Stakeholder Coordination – Extensive stakeholder coordination was required throughout the development of the plan. Due to regulatory deadlines, the plan had to be developed over a period of a few months, and stakeholder coordination was key to the plan's successful endorsement. Including DEP as a stakeholder in the process was also integral to the plan's acceptance and success.
DEP accepted the Lake Tohopekaliga NRP in December 2011. It was the first plan of its kind to be developed in the state. Subsequent to the plan's acceptance, the assessment category for both Lake Tohopekaliga and East Lake Tohopekaliga was modified from Category 5 (i.e., water quality standards are not attained and a TMDL is required) to Category 4e (i.e., impaired, but recently completed or ongoing restoration activities are under way to restore the designated uses of the waterbody). As part of the ongoing implementation of the NRP, stakeholders and technical support partners have done the following:
• Initiated and executed the monitoring plan.
• Met periodically to discuss the implementation of management actions.
• Revisited and further refined research priorities.
• Provided biennial progress reports to DEP.
4.2 MANAGEMENT STRATEGIES FOR THE SOUTHERN SUB-WATERSHEDS Although this phase of the BMAP focuses on the northern sub-watersheds, the three southern sub-watersheds are included in the BMAP. The latter contribute a comparatively smaller percentage of overall loadings to Lake Okeechobee, and their flow into the lake is largely diverted in directions other than towards the lake. The three southern sub-watersheds have implemented BMPs in the BMAP area, and other management strategies have been implemented and will continue under this BMAP. Once the WAM is refined to incorporate the three southern sub-watersheds, the BMAP will take into account the specific benefits of pollutant load reductions achieved by these BMPs and management strategies.
Entities in the three southern sub-watersheds are implementing various urban BMPs. The Cities of Clewiston, Belle Glade, South Bay, and Pahokee, as well as Hendry and Palm Beach Counties (and other entities such as FDOT and the Northern Palm Beach County Improvement District) are in compliance with the the NPDES MS4 Stormwater Program.
Agricultural producers in the southern sub-watersheds are required to participate in the SFWMD program under Chapter 40E-63, F.A.C. Under this program, BMPs have been implemented and routinely verified since the early 1990s. Figure 1 identifies these early implementation areas that
Final 2015 Progress Report for the Lake Okeechobee Basin Management Action Plan, July 2016
Page 41 of 87
subsequently enrolled in an FDACS BMP program, along with other lands enrolled in a FDACS BMP program in the southern sub-watersheds.
Furthermore, the Everglades Agricultural Area Protection District (EAAPD), in coordination with UF–IFAS, special districts, and the SFWMD, continued to provide regularly scheduled producer-specific educational programs in the southern sub-watersheds for the implementation of agricultural BMPs. During the reporting period, the EAAPD hosted programs on February 27, 2015 (Sugarcane Grower Nutritional Workshop); April 23, 2015 (Everglades Agricultural Area [EAA] Phosphorus BMP Training in Spanish); and May 1, 2015 (Controlled Release Fertilizer as a BMP on Vegetable Production in South Florida).
The Sediment Removal/Canal Cleaning cost-share pilot project with the SFWMD has been completed since BMAP adoption. The original project scope envisioned cleaning 11.3 miles of canals in the East Beach Water Control District (WCD). At the end of the 3-year period, the scope was exceeded by 58 %. Sediments were removed from 14.1 miles of canals and floating aquatic vegetation removed from 3.7 miles of canals, for a total of 17.8 miles of operations. In August 2015, the SFWMD approved the construction of the Bolles Cross Canal Improvements to enhance flexibility for moving stormwater from the EAA into the STAs to improve the quality of water before it reaches the Everglades. The SFWMD is nearing the completion of the first segment of the Bolles Canal conveyance improvement project and has completed the design for the next phase. The state is cost-sharing with private landowners to replace a bridge that has been a major impediment to conveying water to the east and west. This project will provide water managers with flexibility in optimizing the use of the new A-1 Flow Equalization Basin, including reducing the potential need for emergency pumping of stormwater into the lake.

Final 2015 Progress Report for the Lake Okeechobee Basin Management Action Plan, July 2016
Page 42 of 87
APPENDICES
APPENDIX A: PROJECTS TO ACHIEVE THE TMDL The tables below set forth the required projects and time frames for implementation in this BMAP. Additional reductions will be necessary in future BMAP updates to meet the TMDL. The tables provide information on the attenuated nutrient reductions attributed to each individual project, shown in mt/yr and kg/yr. These projects and activities were submitted to DEP with the understanding that they would be included in the BMAP, thus setting the expectation for each entity to implement the proposed projects and activities to achieve the assigned load reduction estimates in the specified time frames. Any change in listed projects and activities, or the deadline to complete these actions, must first be approved by DEP. Substituted projects must result in equivalent or greater nutrient reductions than expected from the original projects.
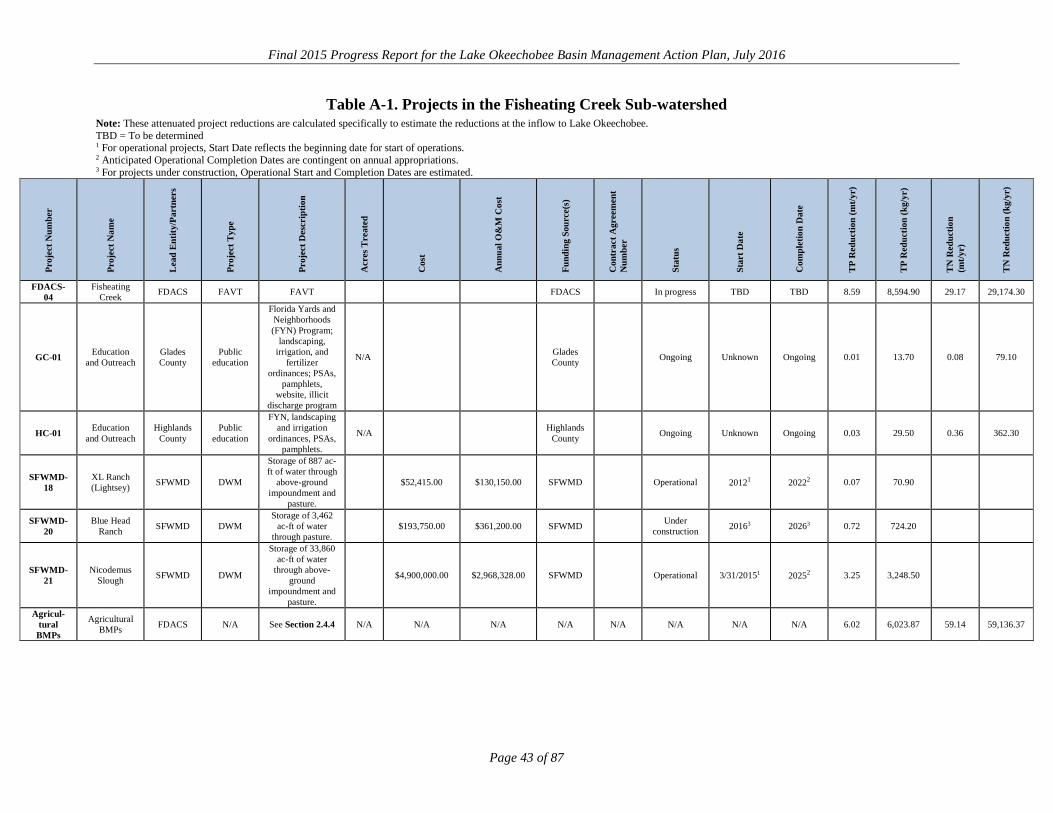
Final 2015 Progress Report for the Lake Okeechobee Basin Management Action Plan, July 2016
Page 43 of 87
Table A-1. Projects in the Fisheating Creek Sub-watershed Note: These attenuated project reductions are calculated specifically to estimate the reductions at the inflow to Lake Okeechobee. TBD = To be determined 1 For operational projects, Start Date reflects the beginning date for start of operations. 2 Anticipated Operational Completion Dates are contingent on annual appropriations. 3 For projects under construction, Operational Start and Completion Dates are estimated.
Proj
ect N
umbe
r
Proj
ect N
ame
Lea
d E
ntity
/Par
tner
s
Proj
ect T
ype
Proj
ect D
escr
iptio
n
Acr
es T
reat
ed
Cos
t
Ann
ual O
&M
Cos
t
Fund
ing
Sour
ce(s
)
Con
trac
t Agr
eem
ent
Num
ber
Stat
us
Star
t Dat
e
Com
plet
ion
Dat
e
TP
Red
uctio
n (m
t/yr)
TP
Red
uctio
n (k
g/yr
)
TN
Red
uctio
n (m
t/yr)
TN
Red
uctio
n (k
g/yr
)
FDACS-04
Fisheating Creek FDACS FAVT FAVT FDACS In progress TBD TBD 8.59 8,594.90 29.17 29,174.30
GC-01 Education and Outreach
Glades County
Public education
Florida Yards and Neighborhoods (FYN) Program;
landscaping, irrigation, and
fertilizer ordinances; PSAs,
pamphlets, website, illicit
discharge program
N/A Glades County Ongoing Unknown Ongoing 0.01 13.70 0.08 79.10
HC-01 Education and Outreach
Highlands County
Public education
FYN, landscaping and irrigation
ordinances, PSAs, pamphlets.
N/A Highlands County Ongoing Unknown Ongoing 0.03 29.50 0.36 362.30
SFWMD-18
XL Ranch (Lightsey) SFWMD DWM
Storage of 887 ac-ft of water through
above-ground impoundment and
pasture.
$52,415.00 $130,150.00 SFWMD Operational 20121 20222 0.07 70.90
SFWMD-20
Blue Head Ranch SFWMD DWM
Storage of 3,462 ac-ft of water
through pasture. $193,750.00 $361,200.00 SFWMD Under
construction 20163 20263 0.72 724.20
SFWMD-21
Nicodemus Slough SFWMD DWM
Storage of 33,860 ac-ft of water
through above-ground
impoundment and pasture.
$4,900,000.00 $2,968,328.00 SFWMD Operational 3/31/20151 20252 3.25 3,248.50
Agricul-tural
BMPs
Agricultural BMPs FDACS N/A See Section 2.4.4 N/A N/A N/A N/A N/A N/A N/A N/A 6.02 6,023.87 59.14 59,136.37

Final 2015 Progress Report for the Lake Okeechobee Basin Management Action Plan, July 2016
Page 44 of 87
Table A-2. Projects in the Indian Prairie Sub-watershed Note: These attenuated project reductions are calculated specifically to estimate the reductions at the inflow to Lake Okeechobee. TBD = To be determined 1 For operational projects, Start Date reflects the beginning date for start of operations. 2 Anticipated Operational Completion Dates are contingent on annual appropriations. 3 For projects under construction, Operational Start and Completion Dates are estimated.
Proj
ect N
umbe
r
Proj
ect N
ame
Lea
d E
ntity
/Par
tner
s
Proj
ect T
ype
Proj
ect
Des
crip
tion
Acr
es T
reat
ed
Cos
t
Ann
ual O
&M
C
ost
Fund
ing
Sour
ce(s
)
Con
trac
t A
gree
men
t N
umbe
r
Stat
us
Star
t Dat
e
Com
plet
ion
Dat
e
TP
Red
uctio
n (m
t/yr)
TP
Red
uctio
n (k
g/yr
)
TN
Red
uctio
n (m
t/yr)
TN
Red
uctio
n (k
g/yr
)
GC-02 Education and Outreach Glades County Public
education
FYN; landscaping, irrigation, and
fertilizer ordinances; PSAs,
pamphlets, website, illicit
discharge program
N/A Glades County Ongoing Unknown Ongoing 0.04 38.50 0.4 413.90
HC-02 Education and Outreach Highlands County Public
education
FYN, landscaping and irrigation
ordinances, PSAs, pamphlets.
N/A Highlands County Ongoing Unknown Ongoing 0.03 29.60 0.4 415.20
IMWID-01
Istokpoga Marsh
Watershed Improvement
District
Istokpoga Marsh Watershed
Improvement District/
Highlands County, Southwest Florida
Water Management District
(SWFWMD), DEP, FDACS
STA STA 711 Unknown Planned and funded TBD TBD 0.7 698.00
SFWMD-10
West Waterhole
Marsh SFWMD DWM
Storage of 4,848 ac-ft of water
through above-ground
impoundment.
$50,000.00 $493,750.00
Florida Ranch-lands
Environ-mental
Services Project
(FRESP)
Operational 6/30/20061 20162 4.17 4,166.40 20.6 20,619.50
SFWMD-12
Buck Island Ranch
(NE PES-1) SFWMD DWM
Storage of 1,573 ac-ft of water
through pasture. $1,928.00 $173,600.00 SFWMD Operational 5/4/20121 20222 1.09 1,087.20
Not quanti-
fied
Not quantified
SFWMD-23
Buck Island Ranch WMA (NE PES-2)
SFWMD DWM Storage of 620 ac-ft of water
through pasture. SFWMD Operational 12/31/20151 20262 0.71 710
Not quanti-
fied
Not quantified
Agricul-tural
BMPs
Agricultural BMPs FDACS N/A See Section 2.4.4 N/A N/A N/A N/A N/A N/A N/A N/A 6.72 6,720.28 121.27 121,273.68

Final 2015 Progress Report for the Lake Okeechobee Basin Management Action Plan, July 2016
Page 45 of 87
Table A-3. Projects in the Lake Istokpoga Sub-watershed Note: These attenuated project reductions are calculated specifically to estimate the reductions at the inflow to Lake Okeechobee. TBD = To be determined 1 For operational projects, Start Date reflects the beginning date for start of operations. 2 Anticipated Operational Completion Dates are contingent on annual appropriations.
Proj
ect N
umbe
r
Proj
ect N
ame
Lea
d E
ntity
/Par
tner
s
Proj
ect T
ype
Proj
ect
Des
crip
tion
Acr
es T
reat
ed
Cos
t
Ann
ual O
&M
C
ost
Fund
ing
Sour
ce(s
)
Con
trac
t A
gree
men
t N
umbe
r
Stat
us
Star
t Dat
e
Com
plet
ion
Dat
e
TP
Red
uctio
n (m
t/yr)
TP
Red
uctio
n (k
g/yr
)
TN
Red
uctio
n (m
tyr)
TN
Red
uctio
n (k
g/yr
)
AP-01 Avon Park
Street Sweeping
City of Avon Park
Street sweeping Street sweeping. N/A City of Avon
Park Ongoing Unknown Ongoing 0.0 4.50 0.01 11.20
AP-02
Lake Tulane Stormwater
Improvement Project
City of Avon Park/ SWFWMD
Swales
Runoff will be captured in series of swales that will
allow runoff to percolate into sandy soils,
preventing further degradation of Lake Tulane.
32.1 City of Avon
Park/ SWFWMD
Envisioned, not funded TBD TBD 0.0 1.70 0.02 16.20
AP-03
Lake Isis Stormwater
Improvement Project
City of Avon Park/ SWFWMD
Wet detention
pond
Runoff will be captured in
lakeside swale and r-designed pond that will allow
runoff to percolate into sandy soils,
preventing further degradation of
Lake Isis.
37.1 City of Avon
Park/ SWFWMD
Envisioned, not funded TBD TBD 0.0 0.50 0.0 4.90
HC-03 Education and Outreach
Highlands County
Public education
FYN, landscaping and irrigation
ordinances, PSAs, pamphlets.
N/A Highlands County Ongoing Unknown Ongoing 0.16 155.20 6.58 6,580.70
HC-05 Lake June
Stormwater Project
Highlands County/
SWFWMD
Online retention
Conceptual plan includes
installation of 450 feet of 24-inch French drain in
four contributing basins.
43.3 $440,000.00
SWFWMD and
Highlands County
Planned and funded TBD TBD Not
quantified Not
quantified Not
quantified Not
quantified
HC-06 Lake Clay
Stormwater Project
Highlands County/
SWFWMD
Online retention
600 feet of 24-inch on-line French
drain for parking lot subbasin; 300
feet of 24-inch on-line French drain will treat street
subbasin.
26.60 $330,000.00 $1,973.00
SWFWMD and
Highlands County
Completed Unknown 2013 0.00 1.30 0.02 24.10

Final 2015 Progress Report for the Lake Okeechobee Basin Management Action Plan, July 2016
Page 46 of 87
Proj
ect N
umbe
r
Proj
ect N
ame
Lea
d E
ntity
/Par
tner
s
Proj
ect T
ype
Proj
ect
Des
crip
tion
Acr
es T
reat
ed
Cos
t
Ann
ual O
&M
C
ost
Fund
ing
Sour
ce(s
)
Con
trac
t A
gree
men
t N
umbe
r
Stat
us
Star
t Dat
e
Com
plet
ion
Dat
e
TP
Red
uctio
n (m
t/yr)
TP
Red
uctio
n (k
g/yr
)
TN
Red
uctio
n (m
tyr)
TN
Red
uctio
n (k
g/yr
)
PC-01 Education and Outreach
Polk County
Public education
FYN, fertilizer ordinance, PSAs,
pamphlets, website, illicit
discharge inspection program.
N/A Polk County Ongoing Unknown Ongoing 0.04 38.80 1.09 1,086.90
SEB-01
Little Lake Jackson Off-
line Alum Injection
Stormwater Treatment
City of Sebring/
Highlands County
Alum injection
Stormwater is diverted through
underground culvert, alum is
injected and water settles for 7 days in detention pond. Treated water is released to Little
Lake Jackson.
0.00 $231,494.00 $18,500.00
DEP 319 grant,
SWFWMD, City of
Sebring, and Highlands
County Board of County Commis- sioners
Ongoing Unknown 2011 Not quantified
Not quantified
Not quantified
Not quantified
SEB-02 Street Sweeping
City of Sebring
Street sweeping
Street sweeping to collect 602,940
lbs/yr of material. N/A $35,000.00 City of
Sebring Ongoing Unknown Ongoing 0.05 50.90 0.12 118.40
SFWMD-11
Rafter T Ranch SFWMD DWM
Storage of 1,298 ac-ft of water
through above-ground
impoundment and pasture.
$431,524.00 $92,490.00 FRESP Operational 12/12/20141 20242 0.09 89.80 Not quantified
Not quantified
SLID-01
SLID Improve-
ments Phases 1-3
SLID STA Treatment of
runoff through STA.
3016 $3,126,265.00 $60,000.00 SLID and
DEP Section 319 Grant
G0377 Planned and funded Unknown Unknown 0.00 4.5 0.03 32.9
SLID-02
SLID Improve-
ments Phase 4
SLID STA
Expansion of existing STA
(Project SLID-1) to include wetland
marsh system. Expanded STA
will provide additional water quality treatment benefits prior to discharge into
Arbuckle Creek.
2308 $2,586,357.95
SFWMD Local
Cooperative Funding
Program and SRF
Planned Unknown Unknown Not quantified
Not quantified
Not quantified
Not quantified
Agricultural
BMPs
Agricultural BMPs FDACS N/A See Section 2.4.4 N/A N/A N/A N/A N/A N/A N/A N/A 1.56 1,557.10 114.13 114,133.47

Final 2015 Progress Report for the Lake Okeechobee Basin Management Action Plan, July 2016
Page 47 of 87
Table A-4. Projects in the Lower Kissimmee Sub-watershed Note: These attenuated project reductions are calculated specifically to estimate the reductions at the inflow to Lake Okeechobee. 1 For operational projects, Start Date reflects the beginning date for start of operations. 2 Anticipated Operational Completion Dates are contingent on annual appropriations. 3 Combined cost is shown for both Kissimmee River Restoration Project (SFWMD-05) and Kissimmee River Headwaters Revitalization Project (SFWMD-22). 4 Dixie Ranch is also listed as SFWMD-15 (Table A-5, Taylor Creek/Nubbin Slough Sub-watershed), as it extends over both sub-watersheds.
Proj
ect N
umbe
r
Proj
ect N
ame
Lea
d E
ntity
/Par
tner
s
Proj
ect T
ype
Proj
ect
Des
crip
tion
Acr
es T
reat
ed
Cos
t
Ann
ual O
&M
C
ost
Fund
ing
Sour
ce(s
)
Con
trac
t A
gree
men
t N
umbe
r
Stat
us
Star
t Dat
e
Com
plet
ion
Dat
e
TP
Red
uctio
n (m
tyr)
TP
Red
uctio
n (k
g/yr
)
TN
Red
uctio
n (m
t/yr)
TN
Red
uctio
n (k
g/yr
)
HC-04 Education
and Outreach
Highlands County
Public education
FYN, landscaping and
irrigation ordinances,
PSAs, pamphlets.
N/A Highlands County Ongoing Unknown Ongoing 0.14 136.00 0.54 538.60
OSC-11 Education Osceola County
Public education
FYN; landscaping,
irrigation, fertilizer, and
pet waste management ordinances;
PSAs; pamphlets;
website; illicit discharge program.
N/A Unknown Ongoing Unknown Ongoing 0.00 2.50 0.02 24.40
PC-02 Education
and Outreach
Polk County
Public education
FYN, fertilizer ordinance,
PSAs, pamphlets,
website, illicit discharge inspection program.
N/A Polk County Ongoing Unknown Ongoing 0.02 22.70 0.41 408.90

Final 2015 Progress Report for the Lake Okeechobee Basin Management Action Plan, July 2016
Page 48 of 87
Proj
ect N
umbe
r
Proj
ect N
ame
Lea
d E
ntity
/Par
tner
s
Proj
ect T
ype
Proj
ect
Des
crip
tion
Acr
es T
reat
ed
Cos
t
Ann
ual O
&M
C
ost
Fund
ing
Sour
ce(s
)
Con
trac
t A
gree
men
t N
umbe
r
Stat
us
Star
t Dat
e
Com
plet
ion
Dat
e
TP
Red
uctio
n (m
tyr)
TP
Red
uctio
n (k
g/yr
)
TN
Red
uctio
n (m
t/yr)
TN
Red
uctio
n (k
g/yr
)
SFWMD-04
Otter Slough
Restoration SFWMD Restoration
This project included five
ditch plugs and removal of two berms. It helps
attenuate regional
stormwater runoff, as well as providing
nutrient reductions due to plant uptake from overland flows. In 2011 LOPP, it was estimated to
create 71 ac-ft of storage.
500 SFWMD Completed 2008 2009 0.01 5.60 Not quantified
Not quantified
SFWMD-05
Kissimmee River
Restoration SFWMD Restoration
Restore ecological
integrity by restoring 40
miles of meandering
river and more than 12,000
miles of wetlands
through design and construction
of physical project features
coupled with application of
optimized hydrologic conditions.
25,000 $780,000,000.003 SFWMD and USACE Under
Construction 1999 2020 17.75 17,748.00 Not quantified
Not quantified
SFWMD-13 Dixie West SFWMD DWM
Storage of 315 ac-ft of water
through pasture. $7,228.00 $51,500.00 SFWMD Operational 8/6/20121 20222 0.23 230.50 Not
quantified Not
quantified
SFWMD-14
Dixie Ranch4 SFWMD DWM
Storage of 856 ac-ft of water
through pasture. $17,015.00 $146,500.00 SFWMD Operational 8/6/20121 20222 0.13 133.70 Not
quantified Not
quantified
SFWMD-17
Willaway Cattle &
Sod SFWMD DWM
Storage of 229 ac-ft of water
through above-ground
impoundment.
$325,494.00 $1,879.00 SFWMD Operational 6/28/20131 20232 0.11 114.40 Not quantified
Not quantified

Final 2015 Progress Report for the Lake Okeechobee Basin Management Action Plan, July 2016
Page 49 of 87
Proj
ect N
umbe
r
Proj
ect N
ame
Lea
d E
ntity
/Par
tner
s
Proj
ect T
ype
Proj
ect
Des
crip
tion
Acr
es T
reat
ed
Cos
t
Ann
ual O
&M
C
ost
Fund
ing
Sour
ce(s
)
Con
trac
t A
gree
men
t N
umbe
r
Stat
us
Star
t Dat
e
Com
plet
ion
Dat
e
TP
Red
uctio
n (m
tyr)
TP
Red
uctio
n (k
g/yr
)
TN
Red
uctio
n (m
t/yr)
TN
Red
uctio
n (k
g/yr
)
SFWMD-19
Triple A Ranch SFWMD DWM
Storage of 397 ac-ft of water
through above-ground
impoundment.
$322,186.00 $28,500.00 SFWMD Operational 5/21/20151 20252 0.08 78.60 Not quantified
Not quantified
Agricul-tural
BMPs
Agricul-tural BMPs FDACS N/A See Section
2.4.4 N/A N/A N/A N/A N/A N/A N/A N/A 5.68 5,683.42 78.85 78,851.78

Final 2015 Progress Report for the Lake Okeechobee Basin Management Action Plan, July 2016
Page 50 of 87
Table A-5. Projects in the Taylor Creek/Nubbin Slough Sub-watershed Note: These attenuated project reductions are calculated specifically to estimate the reductions at the inflow to Lake Okeechobee. TBD = To be determined 1 For operational projects, Start Date reflects the beginning date for start of operations. 2 Anticipated Operational Completion Dates are contingent on annual appropriations. 3 For projects under construction, Operational Start and Completion Dates are shown as "TBD." 4 Original construction completed in 2006; construction modifications and repairs done from 2012-2015. 5 Dixie Ranch is also listed as SFWMD-14 (Table A-4, Lower Kissimee Sub-watershed), as it extends over both sub-watersheds.
Proj
ect N
umbe
r
Proj
ect N
ame
Lea
d E
ntity
/Par
tner
s
Proj
ect T
ype
Proj
ect
Des
crip
tion
Acr
es T
reat
ed
Cos
t
Ann
ual O
&M
C
ost
Fund
ing
Sour
ce(s
)
Con
trac
t A
gree
men
t N
umbe
r
Stat
us
Star
t Dat
e
Com
plet
ion
Dat
e
TP
Red
uctio
n (m
t/yr)
TP
Red
uctio
n (k
g/yr
)
TN
Red
uctio
n (m
t/yr)
TN
Red
uctio
n (k
g/yr
)
FDACS-01
Lemkin Creek FDACS HWTT
HWTT is combination of
wetland and chemical treatment
technologies designed mainly
to remove phosphorus at subbasin and parcel scales.
1,522.00 FDACS Operational Unknown 2009 0.15 151.60 0.65 652.10
FDACS-02 Wolff Ditch FDACS HWTT
HWTT is combination of
wetland and chemical treatment
technologies designed mainly
to remove phosphorus at subbasin and parcel scales.
1,930.00 FDACS Operational Unknown 2009 0.85 845.50 1.72 1,722.00
FDACS-03 Grassy Island FDACS HWTT
HWTT is combination of
wetland and chemical treatment
technologies designed mainly
to remove phosphorus at subbasin and parcel scales.
37,802.00 FDACS Completed Unknown 2010 5.55 5,547.30 8.37 8,373.10

Final 2015 Progress Report for the Lake Okeechobee Basin Management Action Plan, July 2016
Page 51 of 87
Proj
ect N
umbe
r
Proj
ect N
ame
Lea
d E
ntity
/Par
tner
s
Proj
ect T
ype
Proj
ect
Des
crip
tion
Acr
es T
reat
ed
Cos
t
Ann
ual O
&M
C
ost
Fund
ing
Sour
ce(s
)
Con
trac
t A
gree
men
t N
umbe
r
Stat
us
Star
t Dat
e
Com
plet
ion
Dat
e
TP
Red
uctio
n (m
t/yr)
TP
Red
uctio
n (k
g/yr
)
TN
Red
uctio
n (m
t/yr)
TN
Red
uctio
n (k
g/yr
)
FDACS-05
Nubbin Slough FDACS HWTT
HWTT is combination of
wetland and chemical treatment
technologies designed mainly
to remove phosphorus at subbasin and parcel scales.
FDACS Completed Unknown Unknown 0.55 554.60 0.37 370.90
FDACS-06
Mosquito Creek FDACS HWTT
HWTT is combination of
wetland and chemical treatment
technologies designed mainly
to remove phosphorus at subbasin and parcel scales.
FDACS Completed Unknown Unknown 0.48 475.60 0.60 602.10
FDOT1-01
SR 70 from 34th Avenue
to 80th Avenue
FDOT District 1
Wet detention pond
Six wet detention ponds. 57.40 FDOT Under
construction 10/6/2014 TBD 0.02 22.60 0.04 42.60
FDOT1-02
State Road 70 from 80th
Avenue to St. Lucie County
Line
FDOT District 1
Wet detention pond
Three wet detention ponds
and three dry retention swales.
31.40 FDOT Under construction 10/6/2014 TBD 0.02 17.50 0.04 39.40
FDOT1-03
Street Sweeping
FDOT District 1
Street sweeping Street sweeping. N/A FDOT Ongoing Unknown Ongoing 0.11 108.9 0.07 69.65
O-01 Douglas Park North
Okee-chobee County
Dry detention and
continuous deflective separation (CDS) unit
New roadside swales and
addition of three vortex
separators to existing swales
for water quality improvement.
66.3 Unknown Unknown TBD TBD 0.00 2.70 0.02 15.20
OK-02 Oak Park Okee-chobee County
Dry detention and CDS unit
Roadside swales with raised
inlets and two vortex
separators.
56.4 Unknown Unknown TBD TBD 0.00 2.20 0.01 14.40

Final 2015 Progress Report for the Lake Okeechobee Basin Management Action Plan, July 2016
Page 52 of 87
Proj
ect N
umbe
r
Proj
ect N
ame
Lea
d E
ntity
/Par
tner
s
Proj
ect T
ype
Proj
ect
Des
crip
tion
Acr
es T
reat
ed
Cos
t
Ann
ual O
&M
C
ost
Fund
ing
Sour
ce(s
)
Con
trac
t A
gree
men
t N
umbe
r
Stat
us
Star
t Dat
e
Com
plet
ion
Dat
e
TP
Red
uctio
n (m
t/yr)
TP
Red
uctio
n (k
g/yr
)
TN
Red
uctio
n (m
t/yr)
TN
Red
uctio
n (k
g/yr
)
OK-03 Southwest 21st Street
Okee-chobee County
Dry detention
Dry detention roadside swales
with raised inlets.
2.1 Unknown Unknown TBD TBD 0.00 0.10 0.00 0.50
OK-04
Southwest Drainage
Area Improvement
s
Okee-chobee County
Baffle box Installation of
sediment control boxes.
32.2 Unknown Unknown TBD TBD 0.00 0.40 0.00 0.30
OK-05
Okeechobee County 2008
Disaster Recovery
Community Development Block Grant
Okee-chobee County
Dry detention
Dry detention area to improve
water quality and alleviate
flooding.
17.2 Unknown Unknown TBD TBD 0.00 0.20 0.00 4.20
SFWMD-01 Taylor Creek SFWMD STA
Taylor Creek STA is two-celled STA.
118.00 $26,900,000.00 $50,000.00 SFWMD
and USACE
Operational 2004 2006 1.80 1,802.50 Not quantified
Not quantified
SFWMD-02
Nubbin Slough SFWMD STA
Nubbin Slough STA is larger of two pilot STAs
constructed north of lake. It
is two-celled enclosure.
773 Included in SFWMD-1 $100,000.00
SFWMD and
USACE
Completed, in operational
testing 2004 20154 6.19 6,193.60 Not
quantified Not
quantified
SFWMD-03
Lakeside Ranch Phase I
SFWMD STA
Phase I included construction of
1,200-acre STA, canal
improvements, and installation of S-650 pump
station.
$22,800,000.00 $341,000.00 SFWMD Operational 2009 2012 13.98 13.98 Not quantified
Not quantified
SFWMD-15 Dixie Ranch5 SFWMD DWM
Storage of 856 ac-ft of water
through pasture. $17,015.00 $146,500.00 SFWMD Operational 8/6/20121 20222 0.21 205.90 Not
quantified Not
quantified
Agricul-tural
BMPs
Agricultural BMPs FDACS N/A See Section
2.4.4 N/A N/A N/A N/A N/A N/A N/A N/A 7.69 7,689.79 50.19 50,185.85

Final 2015 Progress Report for the Lake Okeechobee Basin Management Action Plan, July 2016
Page 53 of 87
Table A-6. Projects in the Upper Kissimmee Sub-watershed Note: These attenuated project reductions are calculated specifically to estimate the reductions at the inflow to Lake Okeechobee. TBD = To be determined 1 For operational projects, Start Date reflects the beginning date for start of operations. 2 Anticipated Operational Completion Dates are contingent on annual appropriations. 3 For projects under construction, Start and Completion Dates are shown as "TBD." 4 Combined cost is shown for both Kissimmee River Restoration Project (SFWMD-05) and Kissimmee River Headwaters Revitalization Project (SFWMD-22). 5 Start date is shown for construction activities (widening/dredging C-35, C-36 and C-37, adding two gates to S-65, and breaching several local levees). 6 Implementation of new Headwaters Regulation Schedule is contingent upon completion of all restoration construction and land acquisition.
Proj
ect N
umbe
r
Proj
ect N
ame
Lea
d E
ntity
/Par
tner
s
Proj
ect T
ype
Proj
ect
Des
crip
tion
Acr
es T
reat
ed
Cos
t
Ann
ual O
&M
C
ost
Fund
ing
Sour
ce(s
)
Con
trac
t A
gree
men
t N
umbe
r
Stat
us
Star
t Dat
e
Com
plet
ion
Dat
e
TP
Red
uctio
n (m
tyr)
TP
Red
uctio
n (k
g/yr
)
TN
Red
uctio
n (m
t/yr)
TN
Red
uctio
n (k
g/yr
)
EW-01
Water Quality
Awareness Program
City of Edgewood
Public education
Water quality education and
awareness articles in city's
quarterly newsletter.
Various water quality–related informational
brochures, fliers, and other
publications displayed at city hall for public.
N/A $1,000.00 City of Edgewater Ongoing N/A Ongoing 0.00 0.60 0.02 17.30
FDOT5-01
239266-B SR 15
(Hoffner Road) From North of Lee
Vista Boulevard to West of SR
436 (Pond 2)
FDOT District 5
Wet detention pond
Add lanes and reconstruct. 4.80 Florida
Legislature Construction
started 8/10/15
Estimated start –
Summer 2015 2019 0.00 0.10 0.00 0.30
FDOT5-02
239266-A SR 15
Hoffner Avenue from West of SR
436 to Conway
Road (Pond 1)
FDOT District 5
Wet detention pond
Add lanes and reconstruct. 3.60 Florida
Legislature Constructed
started 8/10/2015
Estimated start –
Summer 2015 2019 0.00 0.10 0.00 0.90

Final 2015 Progress Report for the Lake Okeechobee Basin Management Action Plan, July 2016
Page 54 of 87
Proj
ect N
umbe
r
Proj
ect N
ame
Lea
d E
ntity
/Par
tner
s
Proj
ect T
ype
Proj
ect
Des
crip
tion
Acr
es T
reat
ed
Cos
t
Ann
ual O
&M
C
ost
Fund
ing
Sour
ce(s
)
Con
trac
t A
gree
men
t N
umbe
r
Stat
us
Star
t Dat
e
Com
plet
ion
Dat
e
TP
Red
uctio
n (m
tyr)
TP
Red
uctio
n (k
g/yr
)
TN
Red
uctio
n (m
t/yr)
TN
Red
uctio
n (k
g/yr
)
FDOT5-03
239266-C SR 15
Hoffner Avenue from West of SR
436 to Conway
Road (Pond 3)
FDOT District 5
Wet detention pond
Add lanes and reconstruct. 11.9 Florida
Legislature Construction
started 8/10/15
Estimated start –
Summer 2015 2019 0.00 0.50 0.01 6.70
FDOT5-04
239266-D SR 15
Hoffner Avenue from West of SR
436 to Conway
Road (Pond 4)
FDOT District 5
Wet detention pond
Add lanes and reconstruct. 11.4 Florida
Legislature Construction
started 8/10/15
Estimated start –
Summer 2015 2019 0.00 0.40 0.01 10.40
FDOT5-05
239535-F SR 50 from
Good Homes Road to Pine Hills Road (Pond 4)
FDOT District 5 Dry retention Add lanes and
reconstruct. 16.4 Florida Legislature Completed Unknown Unknown 0.00 0.70 0.00 3.90
FDOT5-06
416518-A Interstate-4
Braided Ramp from
U.S. 192 Interchange to Osceola Parkway
Interchange (Pond SE-1)
FDOT District 5
Wet detention pond
New road construction. 13.8 Florida
Legislature Completed Unknown Unknown 0.00 0.50 0.00 2.30
FDOT5-07
416518-B Interstate-4
Braided Ramp from
U.S. 192 Interchange to Osceola Parkway
Interchange (Pond SE-2)
FDOT District 5
Wet detention pond
New road construction. 6.1 Florida
Legislature Completed Unknown Unknown 0.00 0.20 0.00 0.70

Final 2015 Progress Report for the Lake Okeechobee Basin Management Action Plan, July 2016
Page 55 of 87
Proj
ect N
umbe
r
Proj
ect N
ame
Lea
d E
ntity
/Par
tner
s
Proj
ect T
ype
Proj
ect
Des
crip
tion
Acr
es T
reat
ed
Cos
t
Ann
ual O
&M
C
ost
Fund
ing
Sour
ce(s
)
Con
trac
t A
gree
men
t N
umbe
r
Stat
us
Star
t Dat
e
Com
plet
ion
Dat
e
TP
Red
uctio
n (m
tyr)
TP
Red
uctio
n (k
g/yr
)
TN
Red
uctio
n (m
t/yr)
TN
Red
uctio
n (k
g/yr
)
FDOT5-08
239682-A SR 500 (U.S. 17-92) from
Aeronau-tical Drive to
Budinger Avenue (Pond 1)
FDOT District 5
Wet detention pond
Add lanes and rehabilitate pavement.
26.5 Florida Legislature
Planned and funded – Est.
start date Spring 2016
Estimated start –
Summer 2015 2018 0.00 0.90 0.01 6.10
FDOT5-09
239682-B SR 500 (U.S. 17-92) From Aeronautical
Drive to Budinger Avenue (Pond 2)
FDOT District 5
Wet detention pond
Add lanes and rehabilitate pavement.
13.4 Florida Legislature
Planned and funded – Est.
start date Spring 2016
Estimated start –
Summer 2015 2018 0.00 0.50 0.00 3.50
FDOT5-10
239682-C SR 500 (U.S. 17-92) From Aeronautical
Drive to Budinger Avenue (Pond 3)
FDOT District 5
Wet detention pond
Add lanes and rehabilitate pavement.
15.80 Florida Legislature
Planned and funded – Est.
start date Spring 2016
Estimated start –
Summer 2015 2018 0.00 0.60 0.00 3.40
FDOT5-11
239682-D SR 500 (U.S. 17-92) From Aeronautical
Drive to Budinger Avenue (Pond 4)
FDOT District 5
Wet detention pond
Add lanes and rehabilitate pavement.
33.70 Florida Legislature
Planned and funded – Est.
start date Spring 2016
Estimated start –
Summer 2015 2018 0.00 1.10 0.01 6.70
FDOT5-12
418403-A, B SR 600 (U.S. 17-92) JYP from South of Portage Street to North of
Vine Street (U.S. 192)
(Ponds East and West)
FDOT District 5
Wet detention pond
Add lanes and reconstruct. 14.20 Florida
Legislature Construction
started 11/16/2015
Estimated start –
Summer 2015 2018 0.00 0.50 0.00 3.40
FDOT5-13
239454-A Widening of SR 436 from
SR 528 to SR 552
(Pond A)
FDOT District 5
Wet detention pond
Add lanes and reconstruct. 38.80 Florida
Legislature Completed Unknown 2010 0.00 0.30 0.00 0.90

Final 2015 Progress Report for the Lake Okeechobee Basin Management Action Plan, July 2016
Page 56 of 87
Proj
ect N
umbe
r
Proj
ect N
ame
Lea
d E
ntity
/Par
tner
s
Proj
ect T
ype
Proj
ect
Des
crip
tion
Acr
es T
reat
ed
Cos
t
Ann
ual O
&M
C
ost
Fund
ing
Sour
ce(s
)
Con
trac
t A
gree
men
t N
umbe
r
Stat
us
Star
t Dat
e
Com
plet
ion
Dat
e
TP
Red
uctio
n (m
tyr)
TP
Red
uctio
n (k
g/yr
)
TN
Red
uctio
n (m
t/yr)
TN
Red
uctio
n (k
g/yr
)
FDOT5-14
239635-A New Bridge SR 500 at
Reedy Creek (Pond 1)
FDOT District 5 Dry retention New bridge. 4.10 Florida
Legislature Completed Unknown 2010 0.00 0.00 0.00 0.60
FDOT5-15
239635-B New Bridge SR 500 at
Reedy Creek (Pond 2)
FDOT District 5
Wet detention pond New bridge. 7.60 Florida
Legislature Completed Unknown 2010 0.00 0.20 0.00 3.40
FDOT5-16
239663-A Widening of SR 530 from
SR 535 to Hoagland Boulevard (Pond 1)
FDOT District 5
Wet detention pond
Add lanes and reconstruct. 14.60 Florida
Legislature Completed Unknown 2010 0.00 0.60 0.00 2.10
FDOT5-17
239663-B Widening of SR 530 from
SR 535 to Hoagland Boulevard (Pond 2)
FDOT District 5
Wet detention pond
Add lanes and reconstruct. 17.90 Florida
Legislature Completed Unknown 2010 0.00 0.70 0.00 2.60
FDOT5-18
239663-C Widening of SR 530 from
SR 535 to Hoagland Boulevard (Pond 3)
FDOT District 5
Wet detention pond
Add lanes and reconstruct. 16.90 Florida
Legislature Completed Unknown 2010 0.00 0.70 0.00 2.30
FDOT5-19
239663-D Widening of SR 530 from
SR 535 to Hoagland Boulevard (Pond 4)
FDOT District 5
Wet detention pond
Add lanes and reconstruct. 12.60 Florida
Legislature Completed Unknown 2010 0.00 0.50 0.00 2.20
FDOT5-20
242436-A SR 400
Ramps at Gore
Avenue Retention
Pits (Pond 1 and 2)
FDOT District 5
Online dry retention Ramps. 9.80 Florida
Legislature Completed Unknown 2011 0.00 0.20 0.00 2.60
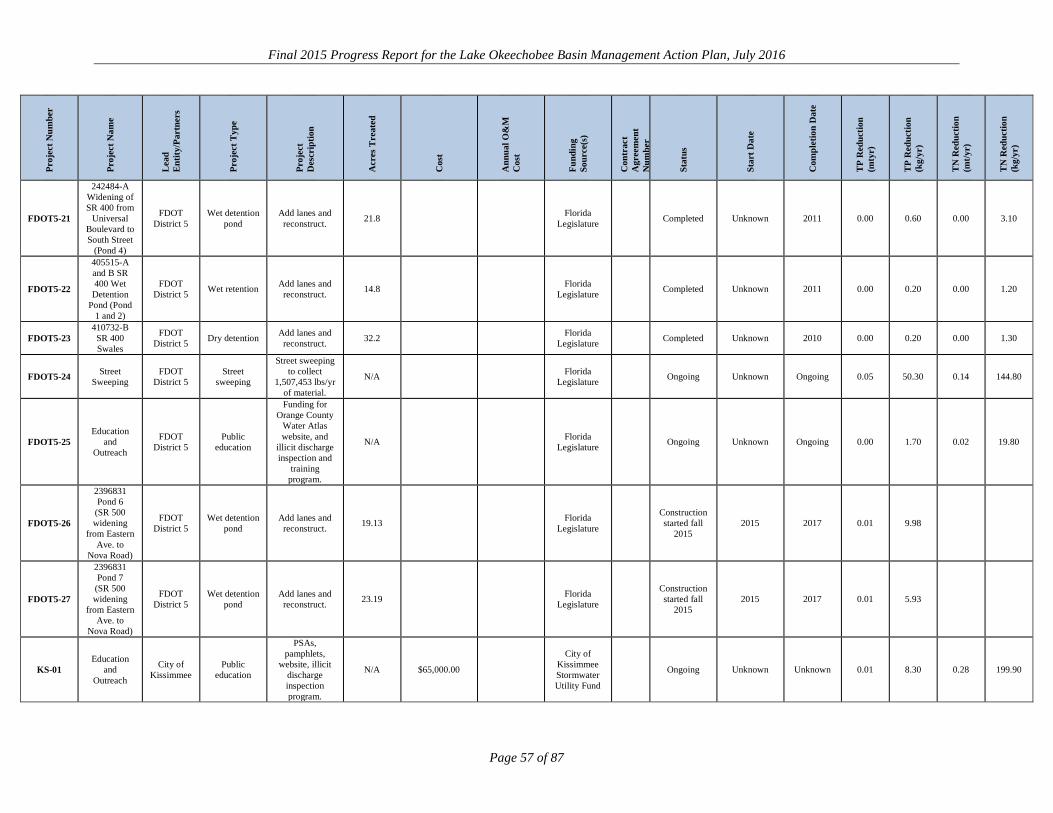
Final 2015 Progress Report for the Lake Okeechobee Basin Management Action Plan, July 2016
Page 57 of 87
Proj
ect N
umbe
r
Proj
ect N
ame
Lea
d E
ntity
/Par
tner
s
Proj
ect T
ype
Proj
ect
Des
crip
tion
Acr
es T
reat
ed
Cos
t
Ann
ual O
&M
C
ost
Fund
ing
Sour
ce(s
)
Con
trac
t A
gree
men
t N
umbe
r
Stat
us
Star
t Dat
e
Com
plet
ion
Dat
e
TP
Red
uctio
n (m
tyr)
TP
Red
uctio
n (k
g/yr
)
TN
Red
uctio
n (m
t/yr)
TN
Red
uctio
n (k
g/yr
)
FDOT5-21
242484-A Widening of SR 400 from
Universal Boulevard to South Street
(Pond 4)
FDOT District 5
Wet detention pond
Add lanes and reconstruct. 21.8 Florida
Legislature Completed Unknown 2011 0.00 0.60 0.00 3.10
FDOT5-22
405515-A and B SR 400 Wet
Detention Pond (Pond
1 and 2)
FDOT District 5 Wet retention Add lanes and
reconstruct. 14.8 Florida Legislature Completed Unknown 2011 0.00 0.20 0.00 1.20
FDOT5-23 410732-B
SR 400 Swales
FDOT District 5 Dry detention Add lanes and
reconstruct. 32.2 Florida Legislature Completed Unknown 2010 0.00 0.20 0.00 1.30
FDOT5-24 Street Sweeping
FDOT District 5
Street sweeping
Street sweeping to collect
1,507,453 lbs/yr of material.
N/A Florida Legislature Ongoing Unknown Ongoing 0.05 50.30 0.14 144.80
FDOT5-25 Education
and Outreach
FDOT District 5
Public education
Funding for Orange County
Water Atlas website, and
illicit discharge inspection and
training program.
N/A Florida Legislature Ongoing Unknown Ongoing 0.00 1.70 0.02 19.80
FDOT5-26
2396831 Pond 6
(SR 500 widening
from Eastern Ave. to
Nova Road)
FDOT District 5
Wet detention pond
Add lanes and reconstruct. 19.13 Florida
Legislature Construction started fall
2015 2015 2017 0.01 9.98
FDOT5-27
2396831 Pond 7
(SR 500 widening
from Eastern Ave. to
Nova Road)
FDOT District 5
Wet detention pond
Add lanes and reconstruct. 23.19 Florida
Legislature Construction started fall
2015 2015 2017 0.01 5.93
KS-01 Education
and Outreach
City of Kissimmee
Public education
PSAs, pamphlets,
website, illicit discharge inspection program.
N/A $65,000.00
City of Kissimmee Stormwater Utility Fund
Ongoing Unknown Unknown 0.01 8.30 0.28 199.90

Final 2015 Progress Report for the Lake Okeechobee Basin Management Action Plan, July 2016
Page 58 of 87
Proj
ect N
umbe
r
Proj
ect N
ame
Lea
d E
ntity
/Par
tner
s
Proj
ect T
ype
Proj
ect
Des
crip
tion
Acr
es T
reat
ed
Cos
t
Ann
ual O
&M
C
ost
Fund
ing
Sour
ce(s
)
Con
trac
t A
gree
men
t N
umbe
r
Stat
us
Star
t Dat
e
Com
plet
ion
Dat
e
TP
Red
uctio
n (m
tyr)
TP
Red
uctio
n (k
g/yr
)
TN
Red
uctio
n (m
t/yr)
TN
Red
uctio
n (k
g/yr
)
KS-02 Street Sweeping
City of Kissimmee
Street sweeping
Sweeping over 8,500 miles per year. Material is
not currently weighed, but
city is currently developing program to
weigh material.
N/A $50,000.00
City of Kissimmee Stormwater Utility Fund
Ongoing Unknown Unknown 0.10 100.40 0.00 277.60
KS-03 Lake Tivoli City of Kissimmee
Wet detention pond
Treatment for older existing
development as well as future
on-line development;
treatment provides 2.5
times proposed percent
impervious area
132.8 $300,000.00 Unknown Envisioned, not funded TBD TBD 0.00 0.00 0.01 0.00
KS-04
Lakefront Park
Redevelop-ment – Swales/
Rain Gardens
City of Kissimmee Dry detention
Swale/rain garden system with 2.07 acres of dry detention
14.2 $500,000.00 City of
Kissimmee General Fund
Started Unknown 2015 0.00 0.20 0.01 5.70
KS-05
Lakefront Park
Redevelop-ment –
Baffle Boxes
City of Kissimmee
2nd generation baffle box
3 nutrient-separating
baffle boxes and 3 filter boxes in lakefront park area. Intend to
install up to and additional 2
baffle boxes in next 5 years.
14.2
$394,267 completed; additional
$50,000 for future boxes
City of
Kissimmee General Fund
Started Unknown 2015 0.00 0.20 0.00 9.80
KS-06
Martin Luther King Boulevard Phase III
from Thacker
Avenue to Dyer
Boulevard
City of Kissimmee Dry detention
Construction of dry detention
with particular standards (side slopes, littoral
zones) per Federal
Aviation Administration for reduction of
bird strikes
5.5 $1,500,000.00 City of
Kissimmee General Fund
Started Unknown 2015 0.00 0.10 0.28 1.20

Final 2015 Progress Report for the Lake Okeechobee Basin Management Action Plan, July 2016
Page 59 of 87
Proj
ect N
umbe
r
Proj
ect N
ame
Lea
d E
ntity
/Par
tner
s
Proj
ect T
ype
Proj
ect
Des
crip
tion
Acr
es T
reat
ed
Cos
t
Ann
ual O
&M
C
ost
Fund
ing
Sour
ce(s
)
Con
trac
t A
gree
men
t N
umbe
r
Stat
us
Star
t Dat
e
Com
plet
ion
Dat
e
TP
Red
uctio
n (m
tyr)
TP
Red
uctio
n (k
g/yr
)
TN
Red
uctio
n (m
t/yr)
TN
Red
uctio
n (k
g/yr
)
OC-01 Education
and Outreach
Orange County
Public education
FYN; landscaping,
irrigation, fertilizer, and
pet waste management ordinances;
PSAs; pamphlets; Water Atlas
website; illicit discharge program.
N/A Orange Count Ongoing Unknown Ongoing 0.59 586.10 13.25 13,247.40
OC-02
Lake Conway
Street Sweeping
Orange County
Street sweeping
Street sweeping of 3,827 curb
miles annually N/A $44,015.00
Lake Conway Taxing District
(Municipal Services
Taxing Unit [MSTU])
Ongoing Unknown Ongoing 0.01 9.30 0.03 26.70
OC-03 Lake Holden
Street Sweeping
Orange County
Street sweeping
Street sweeping of 942 curb
miles annually N/A $15,198.00
Lake Holden Taxing District (MSTU)
Ongoing Unknown Ongoing 0.00 2.30 0.01 6.60
OC-04
Lake Jessamine
Street Sweeping
Orange County
Street sweeping
Street sweeping of 692 curb
miles annually N/A $11,003.00
Lake Jessamine
Taxing District (MSTU)
Ongoing Unknown Ongoing 0.00 1.70 0.00 4.80
OC-05
Shingle/ Boggy/Hart Basin Street Sweeping
Orange County
Street sweeping
Countywide street sweeping N/A Orange
County Ongoing Unknown Ongoing 0.00 0.70 0.00 2.10
OC-06 Lake Odell Curb Inlet
Basket (CIB)
Orange County CIB
Curb or grate inlet filter baskets to collect 902
lbs/yr of material
$3,000.00 $666.00 Orange County Ongoing Unknown Ongoing 0.00 0.00 0.00 0.10
OC-07 Lake
Conway CIB Existing
Orange County CIB
Curb or grate inlet filter baskets to
collect 16,169 lbs/yr of material
$50,000.00 $11,000.00
Lake Conway Taxing District (MSTU)
Ongoing Unknown Ongoing 0.00 0.40 0.00 2.00

Final 2015 Progress Report for the Lake Okeechobee Basin Management Action Plan, July 2016
Page 60 of 87
Proj
ect N
umbe
r
Proj
ect N
ame
Lea
d E
ntity
/Par
tner
s
Proj
ect T
ype
Proj
ect
Des
crip
tion
Acr
es T
reat
ed
Cos
t
Ann
ual O
&M
C
ost
Fund
ing
Sour
ce(s
)
Con
trac
t A
gree
men
t N
umbe
r
Stat
us
Star
t Dat
e
Com
plet
ion
Dat
e
TP
Red
uctio
n (m
tyr)
TP
Red
uctio
n (k
g/yr
)
TN
Red
uctio
n (m
t/yr)
TN
Red
uctio
n (k
g/yr
)
OC-08 Lake
Conway CIB New
Orange County CIB
Curb or grate inlet filter baskets to
collect 16,872 lbs/yr of material
$37,000.00 $5,328.00
Lake Conway Taxing District (MSTU)
Planned and funded TBD TBD 0.00 0.50 0.00 2.00
OC-09 Lake
Pineloch CIB
Orange County CIB
Curb or grate inlet filter baskets to
collect 4,158 lbs/yr of material
$18,000.00 $2,592.00 Orange County
General Fund Ongoing Unknown Ongoing 0.00 0.10 0.00 0.50
OC-10 Lake
Anderson CIB
Orange County CIB
Curb or grate inlet filter baskets to
collect 3,364 lbs/yr of material
$10,000.00 $1,440.00 Lake
Anderson MSTU
Ongoing Unknown Ongoing 0.00 0.10 0.00 0.40
OC-11 Lake Holden CIB
Orange County CIB
Curb or grate inlet filter baskets to
collect 27,602 lbs/yr of material
$41,000.00 $9,102.00
Lake Holden Taxing District (MSTU)
Ongoing Unknown Ongoing 0.00 0.70 0.00 3.30
OC-12 Lake
Jessamine CIB
Orange County CIB
Curb or grate inlet filter baskets to
collect 13,025 lbs/yr of material
$110,000.00 $24,420.00
Lake Jessamine
Taxing District (MSTU)
Ongoing Unknown Ongoing 0.00 0.30 0.00 1.60
OC-13 Lake Floy CIB
Orange County CIB
Curb or grate inlet filter baskets to
collect 4,835 lbs/yr of material
$10,000.00 $1,440.00 Lake Floy MSTU Ongoing Unknown Ongoing 0.00 0.10 0.00 0.60
OC-14 Lake Cane CIB
Orange County CIB
Curb or grate inlet filter baskets to
collect 3,845 lbs/yr of material
$14,000.00 $2,016.00 Orange County
General Fund Ongoing Unknown Ongoing 0.00 0.10 0.00 0.50
OC-15 Lake Odell CIB
Orange County CIB
Curb or grate inlet filter baskets to collect 904
lbs/yr of material
$3,000.00 $432.00 Orange County
General Fund Ongoing Unknown Ongoing 0.00 0.00 0.00 0.10

Final 2015 Progress Report for the Lake Okeechobee Basin Management Action Plan, July 2016
Page 61 of 87
Proj
ect N
umbe
r
Proj
ect N
ame
Lea
d E
ntity
/Par
tner
s
Proj
ect T
ype
Proj
ect
Des
crip
tion
Acr
es T
reat
ed
Cos
t
Ann
ual O
&M
C
ost
Fund
ing
Sour
ce(s
)
Con
trac
t A
gree
men
t N
umbe
r
Stat
us
Star
t Dat
e
Com
plet
ion
Dat
e
TP
Red
uctio
n (m
tyr)
TP
Red
uctio
n (k
g/yr
)
TN
Red
uctio
n (m
t/yr)
TN
Red
uctio
n (k
g/yr
)
OC-16 Lake Tyler CIB
Orange County CIB
Curb or grate inlet filter
baskets $11,000.00 $1,440.00 Unknown Ongoing Unknown Ongoing 0.00 0.00 0.00 0.00
OC-17 Lake Down CIB
Orange County CIB
Curb or grate inlet filter baskets to
collect 16,934 lbs/yr of material
$56,000.00
Windermere Water and Navigation
Control District (MSTU)
Planned and funded 2013 Unknown 0.00 0.50 0.00 2.00
OC-18 Lake Tibet CIB
Orange County CIB
Curb or grate inlet filter baskets to
collect 13,494 lbs/yr of material
$31,000.00
Windermere Water and Navigation
Control District (MSTU)
Planned and funded 2013 Unknown 0.00 0.40 0.00 1.60
OC-19 Lisa
Waterway CDS
Orange County CDS unit
Treats runoff from Orange
Avenue $225,000.00 $5,362.00
Lake Conway Taxing District (MSTU)
Ongoing Unknown Ongoing 0.00 0.30 0.00 1.50
OC-20 Randolph
Avenue CDS Unit
Orange County CDS unit
Treats runoff from Randolph
Avenue 0.00 Unknown Completed Unknown Completed 0.00 0.00 0.00 0.00
OC-21 Randolph Avenue
Stormceptor
Orange County Stormceptor Stormceptor 0.00 Unknown Completed Unknown Prior to
2014 0.00 0.00 0.00 0.10
OC-22 Randolph Avenue
Pond
Orange County Dry detention Dry detention
pond 0.00 Unknown Completed Unknown Prior to 2014 0.00 0.00 0.00 0.40
OC-23 Lake Mary Jess Pond
Orange County/ FDOT
District 5, City of
Edgewood, DEP
Wet detention pond
Wet retention pond created from canal
31.20 $534,795.00 $8,000.00
FDOT District 5,
City of Edgewood
Completed Unknown 2013 0.00 2.90 0.01 13.10
OC-24 Lake Odell Sediment
Sump
Orange County
Retention BMPs
Small sump that collects
sediment from roadway, with
estimated 12,000 lbs/yr of
material
$33,300.00 $1,500.00 Orange County
General Fund Completed 2013 2014 0.00 0.40 0.00 1.20
OC-25
Lake Jennie Jewell
Nutrient Separating Baffle Box
(NSBB)
Orange County NSBB
Construct NSBB-
containing media
9.1 $145,000.00 $2,500.00
Orange County Board
of County Commis-sioners (BCC)
60 % Design 2015 2017 0.00 4.10 0.02 20.40

Final 2015 Progress Report for the Lake Okeechobee Basin Management Action Plan, July 2016
Page 62 of 87
Proj
ect N
umbe
r
Proj
ect N
ame
Lea
d E
ntity
/Par
tner
s
Proj
ect T
ype
Proj
ect
Des
crip
tion
Acr
es T
reat
ed
Cos
t
Ann
ual O
&M
C
ost
Fund
ing
Sour
ce(s
)
Con
trac
t A
gree
men
t N
umbe
r
Stat
us
Star
t Dat
e
Com
plet
ion
Dat
e
TP
Red
uctio
n (m
tyr)
TP
Red
uctio
n (k
g/yr
)
TN
Red
uctio
n (m
t/yr)
TN
Red
uctio
n (k
g/yr
)
OC-26
Lake Anderson
Mobile Alum
Injection
Orange County
Alum injection
Storm pond enhancement
with alum 0.00 $75,000.00 $11,000.00
Orange County
General Fund Planned and
funded 2014 2016 0.01 12.20 0.26 257.60
OC-27
Lake Jessamine
Surface Alum
Orange County
Alum injection
Whole-lake alum treatment 0.00 $246,000.00
Lake Jessamine
Taxing District (MSTU)
Completed Unknown 2013 0.00 4.50 0.07 71.70
OC-28
Lake Down Alum
Treatment Facility
Orange County
Alum injection
Alum injection into canal
entering Lake Down
378.80 $2,000,000 15,000
Windermere Water and Navigation
Control District
(MSTU) and DEP Grant
Completed 2014 2016 0.02 21.30 0.56 555.10
OC-29
Lake Conway
Hydrologic and Nutrient
study
Orange County Assessment ID nutrient
sources $172,000.00 Orange
County – MSTU
Ongoing 2015 TBD Not
quantified
Not quanti-
fied
Not quan-tified
Not quantifie
d
OC-30
Lake Jennie Jewel inlet
CIB Installation
Orange County CIB
Install baskets in stormwater
inlets 35 $9,360.00 $1.10 Orange
County BCC Installed Unknown 2015 0.0 0.20 0.0 0.33
OC-31 Jewell-Gatlin NSBB
Orange County NSBB
Construct NSBB
containing media
70.4 $165,000.00 $2,500.00 Orange County BCC In planning TBD TBD
Not quantifie
d
Not quanti-
fied
Not quan-tified
Not quantifie
d
OC-32 Lake Gem Mary
Orange County
Assessment/ Source ID
ID Impairment Sources and
provide BMP recommenda-
tions
Orange County BCC Ongoing Unknown 2016
Not quantifie
d
Not quanti-
fied
Not quantifie
d
Not quantifie
d
ORL-01
18th Street/ Parramore Ave Baffle
Box
City of Orlando
2nd generation baffle box
Baffle box installed to
remove gross pollutants, including
organic debris, sediment, and
litter.
4.60 $578,138.00
City of Orlando
Stormwater Utility +
50 % cost funded from
SFWMD grant
Completed Unknown 2009 0.00 0.00 0.00 3.30

Final 2015 Progress Report for the Lake Okeechobee Basin Management Action Plan, July 2016
Page 63 of 87
Proj
ect N
umbe
r
Proj
ect N
ame
Lea
d E
ntity
/Par
tner
s
Proj
ect T
ype
Proj
ect
Des
crip
tion
Acr
es T
reat
ed
Cos
t
Ann
ual O
&M
C
ost
Fund
ing
Sour
ce(s
)
Con
trac
t A
gree
men
t N
umbe
r
Stat
us
Star
t Dat
e
Com
plet
ion
Dat
e
TP
Red
uctio
n (m
tyr)
TP
Red
uctio
n (k
g/yr
)
TN
Red
uctio
n (m
t/yr)
TN
Red
uctio
n (k
g/yr
)
ORL-02
19th Street/ Parramore
Avenue Baffle Box
City of Orlando
2nd
generation baffle box
Baffle box installed to
remove gross pollutants, including
organic debris, sediment, and
litter.
9.90 Part of project ORL-1
City of Orlando
Stormwater Utility +
50 % cost funded from
SFWMD grant
Completed Unknown 2009 0.00 0.10 0.01 7.10
ORL-03
Pine Street/ Orange
Blossom Trail
Corridor Stormwater Improve-
ments
City of Orlando
2nd generation baffle box
Installation of 1,800 feet of
stormwater pipe from Pine Street to Lake Lorna
Doone, including baffle
box.
11.50 $577,822.00
City of Orlando
Stormwater Utility +
50 % cost funded by
Community Budget Issue
Request (CBIR) grant
Completed Unknown 2010 0.00 0.30 0.00 2.80
ORL-04
Lake Holden Terrace/ Albert Shores
Sanitary Compo-
nents
City of Orlando
Septic tank phaseout
Sanitary infrastructure installed for septic tank
conversions. 11 of 77 homes converted.
0.00 $3,522,911.00
City of Orlando
Wastewater Division, City of Orlando
Stormwater Utility, Orlando Utility
Commission
Completed Unknown 2012 0.00 0.00 0.00 0.00
ORL-05
Lake Holden Terrace/ Albert Shores
Stormwater Compo-
nents
City of Orlando
2nd generation baffle box
Two baffle boxes and one Storm Flo unit
installed in stormwater
infrastructure for capturing
organic debris, sediment, and
litter; stormwater
infrastructure added to alleviate flooding.
76.40 Part of ORL-4
City of Orlando
Wastewater Division, City of Orlando
Stormwater Utility, Orlando Utility
Commission
Completed Unknown 2012 0.00 1.00 0.04 39.30

Final 2015 Progress Report for the Lake Okeechobee Basin Management Action Plan, July 2016
Page 64 of 87
Proj
ect N
umbe
r
Proj
ect N
ame
Lea
d E
ntity
/Par
tner
s
Proj
ect T
ype
Proj
ect
Des
crip
tion
Acr
es T
reat
ed
Cos
t
Ann
ual O
&M
C
ost
Fund
ing
Sour
ce(s
)
Con
trac
t A
gree
men
t N
umbe
r
Stat
us
Star
t Dat
e
Com
plet
ion
Dat
e
TP
Red
uctio
n (m
tyr)
TP
Red
uctio
n (k
g/yr
)
TN
Red
uctio
n (m
t/yr)
TN
Red
uctio
n (k
g/yr
)
ORL-06
Lake Angel Drainage Improve-
ments
City of Orlando
Wet detention pond
Expand permanent pool volume of Lake
Angel and install three
baffle boxes in main inflow
pipes.
87 $2,000,000.00
City of Orlando
Stormwater Utility + EPA
grant
Completed 2005 2015 0.00 0.50 0.02 16.60
ORL-07
Cemex-South
Division Avenue
Roadway and
Drainage Improve-
ments
City of Orlando
2nd generation baffle box
Pave unimproved
access road to industrial park
and install baffle box to
capture sediment; install
curbing along additional areas
of Division Avenue to allow street sweepers to effectively capture more sediment in
Lake Holden Basin.
52.6 $1,500,000.00
City of Orlando
Stormwater Utility
Planned and
funded – start date 2017
2017 TBD 0.00 1.30 0.01 12.70
ORL-08
Lake Pineloch
Basin Inlet Baskets
City of Orlando
Catch basin inserts/
inlet filters
32 inlet baskets installed to
remove gross pollutants, including
organic debris, sediment and
litter; 49.9 cubic yds/yr of material
collected.
$40,480.00 $11,735.00
City of Orlando
Stormwater Utility
Ongoing Unknown Ongoing 0.01 4.80 0.02 14.00
ORL-09 Clear Lake Basin Inlet
Baskets
City of Orlando
Catch basin inserts/
inlet filters
29 inlet baskets installed to
remove gross pollutants, including
organic debris, sediment and
litter; 39.7 cubic yds/yr of material
collected.
$8,550.00 $8,332.00 City of Orlando Ongoing Unknown Ongoing 0.01 3.70 0.02 11.20

Final 2015 Progress Report for the Lake Okeechobee Basin Management Action Plan, July 2016
Page 65 of 87
Proj
ect N
umbe
r
Proj
ect N
ame
Lea
d E
ntity
/Par
tner
s
Proj
ect T
ype
Proj
ect
Des
crip
tion
Acr
es T
reat
ed
Cos
t
Ann
ual O
&M
C
ost
Fund
ing
Sour
ce(s
)
Con
trac
t A
gree
men
t N
umbe
r
Stat
us
Star
t Dat
e
Com
plet
ion
Dat
e
TP
Red
uctio
n (m
tyr)
TP
Red
uctio
n (k
g/yr
)
TN
Red
uctio
n (m
t/yr)
TN
Red
uctio
n (k
g/yr
)
ORL-10 Lake Lorna
Doone Basin Inlet Baskets
City of Orlando
Catch basin inserts/
inlet filters
16 inlet baskets installed to
remove gross pollutants, including
organic debris, sediment and
litter; 34.8 cubic yds/yr of material
collected.
$17,755.00 $8,673.00 City of Orlando Ongoing Unknown Ongoing 0.01 3.30 0.02 10.00
ORL-11 Lake Mann Basin Inlet
Baskets
City of Orlando
Catch basin inserts/
inlet filters
44 inlet baskets installed to
remove gross pollutants, including
organic debris, sediment and
litter; 38.4 cubic yds/yr of material
collected.
$48,826.00 $3,566.00 City of Orlando Ongoing Unknown Ongoing 0.01 3.70 0.03 10.80
ORL-12
Lake Rabama
Basin Inlet Baskets
City of Orlando
Catch basin inserts/
inlet filters
16 inlet baskets installed to
remove gross pollutants, including
organic debris, sediment and
litter; 20.0 cubic yds/yr of material
collected.
$14,720.00 $7,752.00 City of Orlando Ongoing Unknown Ongoing 0.01 2.00 0.02 5.60
ORL-13 Rock Lake Basin Inlet
Baskets
City of Orlando
Catch basin inserts/
inlet filters
10 inlet baskets installed to
remove gross pollutants, including
organic debris, sediment and
litter; 48.1 cubic yds/yr of material
collected.
$8,550.00 $9,706.00 City of Orlando Ongoing Unknown Ongoing 0.00 4.60 0.01 13.60

Final 2015 Progress Report for the Lake Okeechobee Basin Management Action Plan, July 2016
Page 66 of 87
Proj
ect N
umbe
r
Proj
ect N
ame
Lea
d E
ntity
/Par
tner
s
Proj
ect T
ype
Proj
ect
Des
crip
tion
Acr
es T
reat
ed
Cos
t
Ann
ual O
&M
C
ost
Fund
ing
Sour
ce(s
)
Con
trac
t A
gree
men
t N
umbe
r
Stat
us
Star
t Dat
e
Com
plet
ion
Dat
e
TP
Red
uctio
n (m
tyr)
TP
Red
uctio
n (k
g/yr
)
TN
Red
uctio
n (m
t/yr)
TN
Red
uctio
n (k
g/yr
)
ORL-14 Lake Sunset Basin Inlet
Baskets
City of Orlando
Catch basin inserts/
inlet filters
8 inlet baskets installed to
remove gross pollutants, including
organic debris, sediment and
litter; 17.4 cubic yds/yr of material
collected.
$8,550.00 $11,451.00 City of Orlando Ongoing Unknown Ongoing 0.01 1.70 0.02 4.80
ORL-15
Walker Lagoon
Basin Inlet Baskets
City of Orlando
Catch basin inserts/
inlet filters
16 inlet baskets installed to
remove gross pollutants, including
organic debris, sediment and
litter; 20.5 cubic yds/yr of material
collected.
$17,755.00 $7,049.00 City of Orlando Ongoing Unknown Ongoing 0.01 2.00 0.02 5.60
ORL-16 Street Sweeping
City of Orlando
Street sweeping
Street sweeping within all public
roads in city limits; 14,126 cubic yds/yr of
material collected.
N/A $850,000.00
City of Orlando
Stormwater Utility
Ongoing Unknown Ongoing 0.09 1,151.00 0.26 3,308.00
ORL-17 Public Education
City of Orlando
Public education
FYN; landscaping,
irrigation, and pet waste
management ordinances;
PSAs; pamphlets;
website; illicit discharge program.
N/A $80,000.00
City of Orlando
Stormwater Utility
Ongoing Unknown Ongoing 0.21 206.70 3.44 3,440.00
OSC-01 Narcoossee
Road IB Pond 2 and 3
Osceola County
Wet detention pond
Roadway widening. 29.3 Unknown Completed Unknown 2011 0.00 0.20 0.01 5.70
OSC-02
Narcoossee Rodd III
Pond C3A & C3B
Osceola County
Wet detention pond
Roadway widening. 20.5 Unknown Completed Unknown 2012 0.00 0.10 0.00 3.80

Final 2015 Progress Report for the Lake Okeechobee Basin Management Action Plan, July 2016
Page 67 of 87
Proj
ect N
umbe
r
Proj
ect N
ame
Lea
d E
ntity
/Par
tner
s
Proj
ect T
ype
Proj
ect
Des
crip
tion
Acr
es T
reat
ed
Cos
t
Ann
ual O
&M
C
ost
Fund
ing
Sour
ce(s
)
Con
trac
t A
gree
men
t N
umbe
r
Stat
us
Star
t Dat
e
Com
plet
ion
Dat
e
TP
Red
uctio
n (m
tyr)
TP
Red
uctio
n (k
g/yr
)
TN
Red
uctio
n (m
t/yr)
TN
Red
uctio
n (k
g/yr
)
OSC-03
Narcoossee Road III Pond D3
Comp
Osceola County
Wet detention pond
Roadway widening. 24.3 Unknown Completed Unknown 2012 0.00 0.20 0.00 3.70
OSC-04
Narcoossee Road III Pond E1 Comp
Osceola County
Wet detention pond
Roadway widening. 22.4 Unknown Completed Unknown 2012 0.00 0.10 0.00 2.40
OSC-05
Neptune Road I -
Ponds 100, 200, and 300
Osceola County
Wet detention pond
Road improvement. 226.8 Unknown Completed Unknown 2010 0.01 8.30 0.22 219.30
OSC-06 Old Wilson Road Pond
D002-P
Osceola County
Online retention
Road improvement. 55.8 Unknown Completed Unknown 2012 0.00 0.60 0.02 18.90
OSC-07 Old Wilson Road Pond
D004-P
Osceola County
Online retention
Road improvement. 18.7 Unknown Completed Unknown 2012 0.00 0.30 0.02 19.80
OSC-08 Old Wilson Road Pond
E002-P
Osceola County
Online retention
Road improvement. 12.5 Unknown Completed Unknown 2012 0.00 0.70 0.02 21.30
OSC-09
Stewart Street
Regional Pond
Retrofit
Osceola County
Wet detention pond
Regional pond retrofit. 2,249.2 Unknown Completed Unknown 2009 0.07 70.40 1.75 1,747.00
OSC-10 Education Osceola County
Public education
FYN; landscaping,
irrigation, fertilizer, and
pet waste management ordinances;
PSAs; pamphlets;
website; illicit discharge program.
N/A Unknown Ongoing Unknown Ongoing 0.32 321.60 10.61 10,612.30
OSC-12
East Lake Reserve
Stormwater Reuse
Osceola County
Stormwater reuse
Stormwater reuse for landscape
irrigation from Pond A1 (9.1A).
130.8 Homeowners Association Ongoing Unknown Ongoing 0.01 5.50 0.37 365.40
OSC-13
Neptune Road
Stormwater Reuse
Osceola County
Stormwater reuse
Stormwater reuse for landscape
irrigation from Ponds 100/101
and 300.
35.7 $640,690.00 $26,000.00 Operations Ongoing Unknown Ongoing 0.00 1.10 0.02 24.90
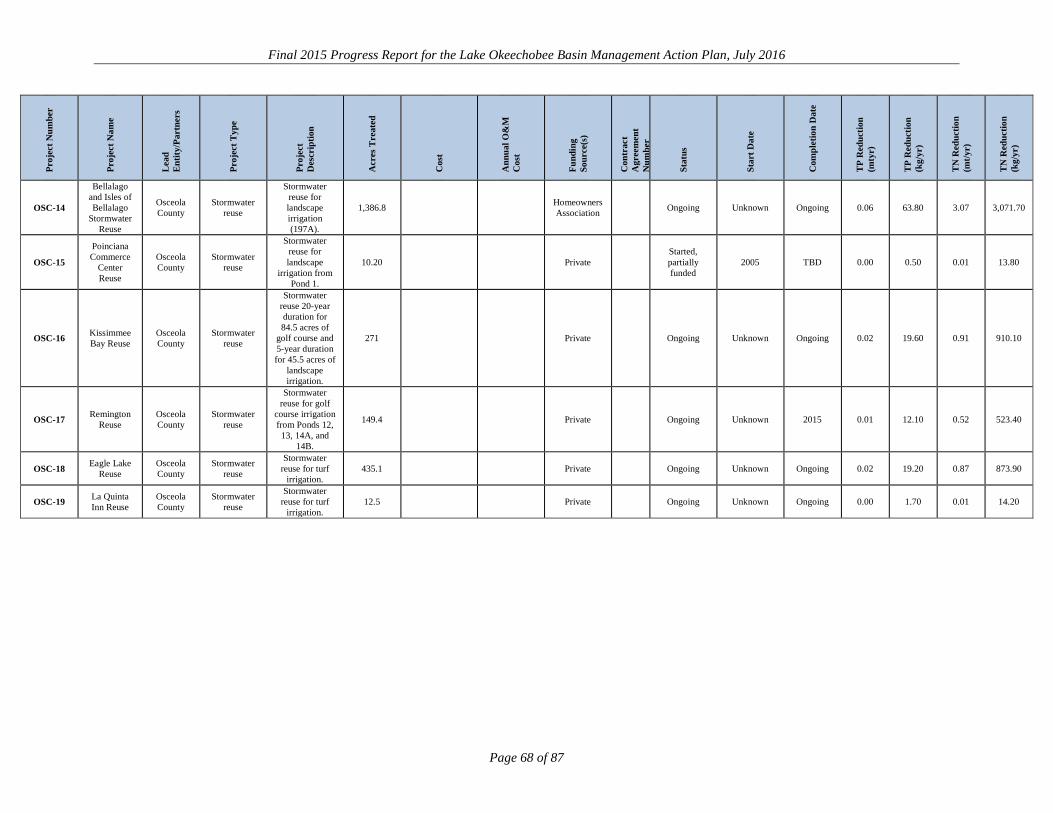
Final 2015 Progress Report for the Lake Okeechobee Basin Management Action Plan, July 2016
Page 68 of 87
Proj
ect N
umbe
r
Proj
ect N
ame
Lea
d E
ntity
/Par
tner
s
Proj
ect T
ype
Proj
ect
Des
crip
tion
Acr
es T
reat
ed
Cos
t
Ann
ual O
&M
C
ost
Fund
ing
Sour
ce(s
)
Con
trac
t A
gree
men
t N
umbe
r
Stat
us
Star
t Dat
e
Com
plet
ion
Dat
e
TP
Red
uctio
n (m
tyr)
TP
Red
uctio
n (k
g/yr
)
TN
Red
uctio
n (m
t/yr)
TN
Red
uctio
n (k
g/yr
)
OSC-14
Bellalago and Isles of Bellalago
Stormwater Reuse
Osceola County
Stormwater reuse
Stormwater reuse for landscape irrigation (197A).
1,386.8 Homeowners Association Ongoing Unknown Ongoing 0.06 63.80 3.07 3,071.70
OSC-15
Poinciana Commerce
Center Reuse
Osceola County
Stormwater reuse
Stormwater reuse for landscape
irrigation from Pond 1.
10.20 Private Started, partially funded
2005 TBD 0.00 0.50 0.01 13.80
OSC-16 Kissimmee Bay Reuse
Osceola County
Stormwater reuse
Stormwater reuse 20-year duration for 84.5 acres of
golf course and 5-year duration for 45.5 acres of
landscape irrigation.
271 Private Ongoing Unknown Ongoing 0.02 19.60 0.91 910.10
OSC-17 Remington Reuse
Osceola County
Stormwater reuse
Stormwater reuse for golf
course irrigation from Ponds 12, 13, 14A, and
14B.
149.4 Private Ongoing Unknown 2015 0.01 12.10 0.52 523.40
OSC-18 Eagle Lake Reuse
Osceola County
Stormwater reuse
Stormwater reuse for turf
irrigation. 435.1 Private Ongoing Unknown Ongoing 0.02 19.20 0.87 873.90
OSC-19 La Quinta Inn Reuse
Osceola County
Stormwater reuse
Stormwater reuse for turf
irrigation. 12.5 Private Ongoing Unknown Ongoing 0.00 1.70 0.01 14.20

Final 2015 Progress Report for the Lake Okeechobee Basin Management Action Plan, July 2016
Page 69 of 87
Proj
ect N
umbe
r
Proj
ect N
ame
Lea
d E
ntity
/Par
tner
s
Proj
ect T
ype
Proj
ect
Des
crip
tion
Acr
es T
reat
ed
Cos
t
Ann
ual O
&M
C
ost
Fund
ing
Sour
ce(s
)
Con
trac
t A
gree
men
t N
umbe
r
Stat
us
Star
t Dat
e
Com
plet
ion
Dat
e
TP
Red
uctio
n (m
tyr)
TP
Red
uctio
n (k
g/yr
)
TN
Red
uctio
n (m
t/yr)
TN
Red
uctio
n (k
g/yr
)
OSC-20
Lake Toho Regional
Water Storage Facility (Judge Farms)
Osceola County/ City of
Kissimmee
Stormwater reuse
Stormwater reuse. 5,883.00 Multiple
Planned-regional facility is
being coordinated with design
and construction
of larger adjoining project.
Stormwater facility has 3
phases. Phases 1 & 2 (Site develop-ment in con-
juncttion with construction of regional pond) are
anticipated to be completed
in 2018.
2015 2018 0.41 412.10 8.78 8,775.30
OSC-21 Street Sweeping
Osceola County
Street sweeping
Monthly street sweeping. - $60,000.00 Osceola
County Ongoing Unknown Completed 0.02 16.10 0.05 46.20
OSC-22
Buena-ventura
Lakes Golf Course Ponds
Osceola County
Wet detention pond
Two new lakes at golf course. 517.7 Osceola
County Completed Unknown Completed 0.00 2.00 0.01 6.00
OSC-23 Slaman Osceola County
Conservation area
Conservation areas. 32.2 Osceola
County Completed Unknown Prior to 2014 0.00 0.00 0.00 0.30
OSC-24 Jim Yates Osceola County
Conservation area
Conservation areas. 5.3 Osceola
County Completed Unknown Prior to 2014 0.00 0.50 0.00 3.20
OSC-25 Udstad Osceola County
Conservation area
Conservation areas. 5.9 Osceola
County Completed Unknown Prior to 2014 0.00 0.50 0.01 7.70
OSC-26 Proctor Osceola County
Conservation area
Conservation areas. 0.7 Osceola
County Completed Unknown Prior to 2014 0.00 0.10 0.00 0.30
OSC-27 Twin Oaks Osceola County
Conservation area
Conservation areas. 399.6 Osceola
County Completed Unknown Prior to 2014 0.05 47.00 0.26 264.90
OSC-28 Cherokee Point
Osceola County
Conservation area
Conservation areas. 178.6 Osceola
County Completed Unknown Prior to 2014 0.00 1.20 0.01 6.70
OSC-29 Encatada Resort
Osceola County
Stormwater reuse
Stormwater reuse for landscape
irrigation from pond.
57.6 Homeowners Association Planned and
funded TBD 2032 0.00 3.10 0.03 33.20

Final 2015 Progress Report for the Lake Okeechobee Basin Management Action Plan, July 2016
Page 70 of 87
Proj
ect N
umbe
r
Proj
ect N
ame
Lea
d E
ntity
/Par
tner
s
Proj
ect T
ype
Proj
ect
Des
crip
tion
Acr
es T
reat
ed
Cos
t
Ann
ual O
&M
C
ost
Fund
ing
Sour
ce(s
)
Con
trac
t A
gree
men
t N
umbe
r
Stat
us
Star
t Dat
e
Com
plet
ion
Dat
e
TP
Red
uctio
n (m
tyr)
TP
Red
uctio
n (k
g/yr
)
TN
Red
uctio
n (m
t/yr)
TN
Red
uctio
n (k
g/yr
)
OSC-30 Cypress Palms
Condos
Osceola County
Stormwater reuse
Stormwater reuse for landscape
irrigation from pond.
12.40 Homeowners Association Planned and
funded 2012 2032 0.00 1.00 0.01 10.40
OSC-31 Lake Pointe Osceola County
Stormwater reuse
Stormwater reuse for landscape
irrigation from pond.
150.20 Homeowners Association Planned and
funded 2012 TBD 0.01 5.90 0.32 322.30
OSC-32 Traditions at Westside
Osceola County
Stormwater reuse
Stormwater reuse for landscape
irrigation from pond.
21.70 Homeowners Association Planned and
funded 2011 TBD 0.00 2.30 0.02 19.70
PC-03 Education
and Outreach
Polk County
Public education
FYN, fertilizer ordinance,
PSAs, pamphlets,
website, illicit discharge inspection program.
N/A Polk County Ongoing Unknown Ongoing 0.12 118.80 4.44 4,438.10
PC-04
Sumica Preserve
Water Storage/
Hydrologic Restoration
Polk County/ SFWMD
DWM
Construction of gravel berm to store water on-site for wetland
restoration.
4,077.4 $42,850.00 $13,000.00 SFWMD Operational Unknown 2010 0.01 7.50 Not
quan-tified
Not quan-tified
SFWMD-06
Phase I Rolling
Meadows SFWMD Restoration
Goal of project is to restore
historical Lake Hatchineha floodplain
wetlands and habitat in Rolling
Meadows property, purchased
jointly with DEP.
1,900.00 $43,200,000.00 SFWMD and DEP Under
construction 2015 2016 0.07 65.10 Not
quan-tified
Not quan-tified

Final 2015 Progress Report for the Lake Okeechobee Basin Management Action Plan, July 2016
Page 71 of 87
Proj
ect N
umbe
r
Proj
ect N
ame
Lea
d E
ntity
/Par
tner
s
Proj
ect T
ype
Proj
ect
Des
crip
tion
Acr
es T
reat
ed
Cos
t
Ann
ual O
&M
C
ost
Fund
ing
Sour
ce(s
)
Con
trac
t A
gree
men
t N
umbe
r
Stat
us
Star
t Dat
e
Com
plet
ion
Dat
e
TP
Red
uctio
n (m
tyr)
TP
Red
uctio
n (k
g/yr
)
TN
Red
uctio
n (m
t/yr)
TN
Red
uctio
n (k
g/yr
)
SFWMD-07
Gardner-Cobb Marsh SFWMD Restoration
Located south of Cypress
Lake, project included
activities such as ditch plugs, berm removal,
exotic treatment, and
culvert replacement. It helps attenuate
regional stormwater runoff and
provide incidental nutrient
reductions due to plant uptake from overland
flows in marsh.
2,000.00 SFWMD Completed 2009 2010 0.01 5.20 Not
quan-tified
Not quan-tified
SFWMD-08
Rough Island SFWMD Restoration
Located southwest of Cypress Lake and west of C-
36 Canal, project included activities such as ditch plugs,
ditch filling, and exotic removal.
It helps attenuate regional
stormwater runoff and provides
incidental nutrient
reductions due to plant uptake from overland
flows. Estimated to
create 215 ac-ft of storage
1,000.00 SFWMD Completed 2009 2009 0.06 60.80 Not
quan-tified
Not quan-tified

Final 2015 Progress Report for the Lake Okeechobee Basin Management Action Plan, July 2016
Page 72 of 87
Proj
ect N
umbe
r
Proj
ect N
ame
Lea
d E
ntity
/Par
tner
s
Proj
ect T
ype
Proj
ect
Des
crip
tion
Acr
es T
reat
ed
Cos
t
Ann
ual O
&M
C
ost
Fund
ing
Sour
ce(s
)
Con
trac
t A
gree
men
t N
umbe
r
Stat
us
Star
t Dat
e
Com
plet
ion
Dat
e
TP
Red
uctio
n (m
tyr)
TP
Red
uctio
n (k
g/yr
)
TN
Red
uctio
n (m
t/yr)
TN
Red
uctio
n (k
g/yr
)
SFWMD-09
Oasis Marsh Restoration SFWMD Restoration
Oasis wetlands are located in floodplain of
southwest corner of Lake Kissimmee and site is mosaic of
dewatered wetlands and uplands. To
restore floodplain
function, four ditches totaling 2.4 acres in size were filled with
3,144 cubic yards of sediment
material from levee adjacent to site in spring
2010. Restoration of topography of Oasis Marsh will restore
approximately 77 acres of
wetlands and reconnect them to littoral zone
of Lake Kissimmee.
77.00 SFWMD Completed 2009 2010 0.20 195.30 Not
quan-tified
Not quan-tified
SFWMD-16
Lost Oak Ranch SFWMD DWM
Storage of 374 ac-ft of water
through pasture. $61,030.00 $55,000.00 SFWMD Operational 10/19/20151 20232 0.03 28.00
Not quan-tified
Not quan-tified
SFWMD-22
Kissimmee River
Headwaters Revitaliza-
tion
SFWMD Restoration
Land use change to
wetlands in project area.
7,200
Refer to Kissimmee
River Restoration
Project (SFMWD-05)4
SFWMD
Revised regulation schedule
completed; construction
and land acquisition in
progress
20005 20206 0.57 566.40 Not
quan-tified
Not quan-tified
Agricul-tural
BMPs
Agricultural BMPs FDACS N/A See Section
2.4.4 N/A N/A N/A N/A N/A N/A N/A N/A 3.30 3,295.55 169.78 169,783.10

Final 2015 Progress Report for the Lake Okeechobee Basin Management Action Plan, July 2016
Page 73 of 87
Table A-7. Projects under development with the Coordinating Agencies Note: These attenuated project reductions are calculated specifically to estimate the reductions at the inflow to Lake Okeechobee.
Project Name Sub-watershed Status
Estimated TP Reduction
(mt/yr)
Estimated TP Reduction
(kg/yr) Schedule
Istokpoga Marsh Watershed Improvement
District-Phase II Indian Prairie
A Memorandum of Understanding for this project
exists between FDACS, SFWMD, Istokpoga Marsh
Watershed Improvement District, and Highlands County. FDACS
has identified funds to cover Phase II of the project.
2 2,000 Work will begin in 2016.
Lakeside Ranch STA Phase II
Taylor Creek/ Nubbin Slough
This phase includes a southern STA and a second pump station (S-191A) to manage rim canal levels during high water flow
periods and potentially to recirculate lake water back to the STA for additional TP removal.
Under Phase II, the southern STA is under construction. However, the construction of the S-191A pump station is contingent on
future funding.
7.6 7,600
Southern STA is anticipated to be
completed by 2018. Once funded, the pump station
is estimated to be completed in three years.
MacArthur Agro-Ecology Research Center
"Buck Island" Ranch/Rafter T Realty,
Inc.
Lake Istokpoga Indian Prairie
Both NE PES-2 contracts were executed in December 2014. Both
Rafter T Ranch (SFWMD-11) and Buck Island Ranch (SFWMD-23) are in the
operational phase.
0.945 945
Under NE PES-2, Rafter T Ranch became
operational in December 2014, and Buck Island
Ranch became operational in December 2015.
Brighton Valley – Lykes Indian Prairie
FDACS is currently funding the engineering of the Brighton
Valley project, located in the Indian Prairie Sub-watershed.
The design is in its final stages as changes had to be incorporated to
address archeological issues.
7.7 7,700 Construction will begin in
2016; completion is expected in 2017.

Final 2015 Progress Report for the Lake Okeechobee Basin Management Action Plan, July 2016
Page 74 of 87
Project Name Sub-watershed Status
Estimated TP Reduction
(mt/yr)
Estimated TP Reduction
(kg/yr) Schedule
Rolling Meadows Wetland Restoration –
Phase II Upper Kissimmee
Land acquired and planning started. Phase II of this project,
which involves the further restoration of approximately 580 acres of wetlands, is contingent
upon future funding.
0.009 9
Once funded, project work is estimated to be
completed in two to three years.
Inactive Dairies – Lagoon Remediation
Taylor Creek/ Nubbin Slough and
Indian Prairie
FDACS worked with a dairy in the LOW to partially remediate
its lagoon. The soil was spread on the field for crops to use the
nutrients from the excavated soil. The stormwater is routed back to the remediated pond to minimize discharges and is reused to reduce ground water withdrawals. In the
future, the dairy will finish excavating and remediating the
entire site.
TBD TBD
1. Identify areas for remediation activities/talk
to landowners. (Winter 2014/2015–Summer
2015)
2. Procure contractors/conduct work.
(Winter 2015/2016– Spring 2016)
3. Analyze data. (Yearly)
PL-566 Funded/ Fisheating Creek
Structure Fisheating Creek
The USACE is working with the USDA-NRCS to develop various alternatives. FDACS has set aside
up to $1 million to fund this effort. The NRCS, FDACS, and
USACE are working with landowner groups to determine the type of structure that will be
used to replace the existing structure and the elevation of the
new structure.
0.88−2.65 883-2,648
1. NRCS plans to reapply for different funding. (Fall
2014)
2. If funding is obtained, work will be conducted.
(2015)
3. Water quality benefit calculations will be done.
(Fall 2015)
S.R. 710 Regional Project
Taylor Creek/ Nubbin Slough and
Indian Prairie
Feasibility study was completed. The Coordinating Agencies are
reviewing the feasibility study to determine the best project design.
TBD TBD
1. Final feasibility study was completed on October
22, 2014.
2. Work will be implemented. (To be
determined)

Final 2015 Progress Report for the Lake Okeechobee Basin Management Action Plan, July 2016
Page 75 of 87
Project Name Sub-watershed Status
Estimated TP Reduction
(mt/yr)
Estimated TP Reduction
(kg/yr) Schedule
Legislative Cost-Share Appropriation Program ($10 million annually for
7 years)
All
FDACS has conducted two rounds of solicitations for dairy
project proposals. The first solicitation occurred in fall 2014. Eight projects were selected for cost-share, and the cost-share
funding allocated for these projects totaled $3,710,801.25. These eight projects consist of three stormwater improvement
projects, the construction of waste management systems for
four new free stall barns, and one project that involved installing a
seepage interceptor system adjacent to a ditch that drained
off-site.
26.56 26,560
1. Develop plan and present to DEP annually.
2. Implement projects
once funds are available.
3. Conduct the same exercise annually.
TOTAL 45.65−47.46 45,652–47,461

Final 2015 Progress Report for the Lake Okeechobee Basin Management Action Plan, July 2016
Page 76 of 87
Table A-8. Other initiatives a Contingent on the USACE’s 3x3x3 compliance approval.
Initiative Explanation Schedule Start Date Completion
Date
CERP planning
The SFWMD will consider reinitiating formulation of the storage
components of the LOW project. However, this requires concurrence from the USACE (Federal Partner).
The initial stage of the planning effort will include developing the overall scope for the plan. The planning process is anticipated to take approximately three years to
complete. Summer 2016 2019a
Owner-implemented
BMP verification
FDACS and DEP are developing a plan for BMP verification.
1. Identify key BMPs for each commodity type in the basin. (Spring 2015)
2. Identify the locations of BMPs in basin. (Fall 2015)
3. Develop a monitoring plan/strategy. (Winter 2015/2016)
4. Identify willing owners. (Spring 2016)
5. Begin data collection. (Summer 2016)
6. Form a committee to review findings. (Winter 2016/2017)
7. Evaluate data. (Annually)
Spring 2015 Winter 2016/2017
Cost-share BMP effectiveness verification
FDACS and DEP are developing an approach to evaluate the effectiveness of various types of cost-share projects.
1. Identify key cost-share projects. (Fall 2015)
2. Identify locations for effectiveness evaluation. (Winter 2015/2016)
3. Develop the evaluation approach (monitoring/modeling/calculation). (Winter 2015/2016)
4. Implement cost-share projects. (Spring 2016)
5. Evaluate data. (Annually)
Fall 2015 Spring 2016

Final 2015 Progress Report for the Lake Okeechobee Basin Management Action Plan, July 2016
Page 77 of 87
Initiative Explanation Schedule Start Date Completion
Date
WAM revisions
Coordinating Agencies are developing a contract to revise the WAM to
complete the model domain set-up for the northern region and the 3 southern
sub-watersheds of the LOW. Estimated completion date: a year
after the adoption of the BMAP. DEP will work to develop revised
allocations and targets based on this information.
1. Develop scope of work for contract. (Fall 2014)
2. Execute contract. (Fall 2014)
3. Complete WAM efforts. (Winter 2015/2016)
4. Conduct sensitivity/uncertainty analyses. (Spring 2016)
5. Use WAM results to update sub-watershed existing loads and project nutrient reduction benefits in the northern sub-watersheds and to develop existing loads in the southern sub-watersheds and calculate project nutrient reduction benefits. (Fall 2016)
6. Conduct predrainage characterization (TBD, following results of fall 2016 model
revisions)
7. Identify elevated TP areas for additional project locations and prioritization. (Winter 2016/2017)
Fall 2014 Winter 2016/2017
Water quality monitoring
As DEP develops the monitoring plan for the BMAP, consideration is being
given to areas with on-the-ground projects/BMPs to evaluate water
quality improvements.
1. Identify areas with regional projects already in place. (Complete)
2. Evaluate areas with needs for additional water quality data. (Once WAM complete.)
3. Identify lead entity for monitoring efforts. (Spring 2017—Summer 2017)
4. Finalize monitoring plan. (Upon BMAP adoption)
In progress Fall 2018
Alternative BMP nutrient
reduction projects
North of Lake Okeechobee The Coordinating Agencies have begun building a team to identify possible new strategies. The first quarterly meeting is scheduled for July 2016.
Winter 2014/2015 TBD
In-lake strategies:
muck scraping and tilling
In Lake Okeechobee
Potential for inclusion as BMAP project(s) during low lake levels if drought conditions occur and if project logistics (e.g., planning, permitting, contracting) are able to be implemented timely for work to be conducted. The SFWMD Low Water
Level Habitat Enhancement Plan drafted for the lake in November 2015 may inform this initiative (see Section 2.2.4).
Fall 2014 TBD

Final 2015 Progress Report for the Lake Okeechobee Basin Management Action Plan, July 2016
Page 78 of 87
APPENDIX B: BMAP MONITORING NETWORK Table B-1 lists the stations included in the BMAP monitoring network. These stations are not specifically BMAP stations—i.e., the data they generate are also used for other purposes—but the data collected at these sites will be used to monitor the effectiveness of the BMAP. The water quality monitoring will be conducted in accordance with the frequencies below. The stations in the monitoring network are also shown in Figure B-1.

Final 2015 Progress Report for the Lake Okeechobee Basin Management Action Plan, July 2016
Page 79 of 87
Table B-1. BMAP monitoring network ACF = Autosampler flow-corrected ACT = Autosampler composite time proportional * As of December 2015, sampling frequencies were temporarily reduced. a Station has not yet been established in STORET. Upon completion of STORET setup, data will be uploaded under the STORET Station ID listed. b USGS station data available from USGS website. c Sampling location represents outflow from Lakeside Ranch STA. d Sampling location represents outflow from Taylor Creek STA.
Sampling Entity Station Name Florida STORET
Station ID Frequency Year Site
Established Sub-watershed
Date of Latest Sample in
Florida STORETb
City of Orlando Buck Lake BUCK Quarterly 1994 Upper Kissimmee 12/11/2014 City of Orlando Lake Fran FRAN Quarterly 1999 Upper Kissimmee 1/26/2015 City of Orlando Lake Mare Prairie MARE PRAIRIE Quarterly 1990 Upper Kissimmee 12/17/2014 City of Orlando Mud Lake MUD Quarterly 1994 Upper Kissimmee 12/11/2014 City of Orlando Turkey Lake (North) TURKEY NORTH Quarterly 1985 Upper Kissimmee 10/30/2014 City of Orlando Turkey Lake (South) TURKEY SOUTH Quarterly 1985 Upper Kissimmee 10/30/2014
City of Kissimmee East City Ditch Outfall MS 02a Quarterly 2007 Upper Kissimmee City of Kissimmee Mill Slough Outfall MS 03a Quarterly 2007 Upper Kissimmee
City of Kissimmee Bass Slough at Boggy Creek MS 04a Quarterly 2007 Upper Kissimmee
City of Kissimmee Bass Slough at Timothy Lane MS 05a Quarterly 2007 Upper Kissimmee
City of Kissimmee Mill Slough at Mill Run Boulevard MS 06a Quarterly 2007 Upper Kissimmee
City of Kissimmee West City Ditch at Hacienda Circle MS 13a Quarterly 2007 Upper Kissimmee
City of Kissimmee Shingle Creek at John Young Parkway MS 14a Quarterly 2007 Upper Kissimmee
City of Kissimmee Shingle Creek at Town Center Boulervard MS 15a Quarterly 2007 Upper Kissimmee
City of Kissimmee Shingle Creek at Yates Road MS 17a Quarterly 2007 Upper Kissimmee
Orange County Boggy Creek A (Tradeport) BCA Quarterly 1982 Upper Kissimmee 8/27/2015
Orange County Shingle Creek (Central FL Pkwy.) SCC Quarterly 1972 Upper Kissimmee 9/28/2015

Final 2015 Progress Report for the Lake Okeechobee Basin Management Action Plan, July 2016
Page 80 of 87
Sampling Entity Station Name Florida STORET
Station ID Frequency Year Site
Established Sub-watershed
Date of Latest Sample in
Florida STORETb
Orange County HART: Lake Hart Outflow at S-62 (Clap Sims Duda) XLKEHS62 Quarterly 2011 Upper Kissimmee 9/3/2015
Orlando/Orange County
Boggy Creek B (S.R. 527A) BCB Biannually
(winter and summer) 1999 Upper Kissimmee 7/19/2010
Orlando/ Orange County
Boggy Creek @ 527A City of Orlando Site aka bcb BCO Biannually
(winter and summer) 1999 Upper Kissimmee 6/9/2014
Orlando/ Orange County
Shingle Creek City of Orlando SCO Biannually
(winter and summer) 1999 Upper Kissimmee 8/11/2015
Osceola County ETO5253114 ETO5253114 Monthly, if flowing 2009 Upper Kissimmee 6/23/2015 Osceola County JUDGES_DCH JUDGES_DCH Monthly, if flowing 2011 Upper Kissimmee 5/5/2015 Osceola County PARTIN_CNL PARTIN_CNL Monthly, if flowing 2011 Upper Kissimmee 6/23/2015 Osceola County RUNNYMEDE RUNNYMEDE Monthly, if flowing 2011 Upper Kissimmee 6/23/2015
SFWMD A03 A03 Bimonthly (6 times/yr) 1981 Upper Kissimmee 6/8/2015 SFWMD ABOGGN ABOGGN Monthly* 1981 Upper Kissimmee 6/8/2015 SFWMD B02 B02 Bimonthly (6 times/yr) 1981 Upper Kissimmee 6/8/2015 SFWMD B06 B06 Bimonthly (6 times/yr) 1981 Upper Kissimmee 6/8/2015 SFWMD B09 B09 Bimonthly (6 times/yr) 1981 Upper Kissimmee 6/8/2015 SFWMD BNSHINGLE BNSHINGLE Monthly* 1981 Upper Kissimmee 6/8/2015 SFWMD BS-59 BS-59 Monthly* 1981 Upper Kissimmee 6/8/2015 SFWMD C03 C03 Bimonthly (6 times/yr) 1981 Upper Kissimmee 6/8/2015
SFWMD C38W C38W Biweekly, if flowing/ Monthly/Quarterly 1973 Indian Prairie 6/1/2015
SFWMD C41H78 C41H78 Weekly – ACT/
Biweekly, if flowing/ Monthly/Quarterly
2008 Indian Prairie 6/15/2015
SFWMD CL06283111 CL06283111 Biweekly, if flowing* 2006 Upper Kissimmee 6/30/2015 SFWMD CREEDYBR CREEDYBR Monthly* 1981 Upper Kissimmee 6/8/2015
SFWMD CULV10A CULV10A Biweekly, if flowing / Monthly/Quarterly 1973 East Lake Okeechobee 6/15/2015
SFWMD CULV5 CULV5 Biweekly, if flowing / Monthly/Quarterly 1973 Fisheating Creek 6/1/2015

Final 2015 Progress Report for the Lake Okeechobee Basin Management Action Plan, July 2016
Page 81 of 87
Sampling Entity Station Name Florida STORET
Station ID Frequency Year Site
Established Sub-watershed
Date of Latest Sample in
Florida STORETb
SFWMD CULV5A CULV5A Biweekly, if flowing / Monthly/Quarterly 1973 West Lake Okeechobee 6/1/2015
SFWMD D02 D02 Bimonthly (6 times/yr) 1981 Upper Kissimmee 6/8/2015 SFWMD E02 E02 Bimonthly (6 times/yr) 1981 Upper Kissimmee 6/8/2015 SFWMD ET05253114 ET05253114 Biweekly, if flowing* 2006 Upper Kissimmee 6/23/2015
SFWMD FECSR78 FECSR78 Biweekly, if flowing/ Monthly/Quarterly 1973 Fisheating Creek 6/1/2015
SFWMD INDUSCAN INDUSCAN Biweekly, if flowing/ Monthly/Quarterly 1973 South Lake Okeechobee 6/15/2015
SFWMD IOC IOCc Weekly recorded flow ACF/Biweekly grabs 2012 Within Lake 6/30/2015
SFWMD ISTK6 ISTK6 Bimonthly (6 times/yr)* 1998 Lake Istokpoga 5/11/2015
SFWMD KISSR0.0 KISSR0.0 Monthly 1986 Within Lake 6/3/2015
SFWMD KREA 30A/02273630 KREA 30A Biweekly, if flowing* 1988 Taylor Creek/ Nubbin Slough 8/20/2014
SFWMD KREA 98 KREA 98 Monthly 1997 Lower Kissimmee 6/17/2015 SFWMD L001 L001 Monthly 1986 Within Lake 6/3/2015 SFWMD L004 L004 Monthly 1986 Within Lake 6/3/2015 SFWMD L006 L006 Monthly 1986 Within Lake 6/2/2015 SFWMD L008 L008 Monthly 1986 Within Lake 6/3/2015
SFWMD L59E L59E Biweekly, if flowing/ Monthly/Quarterly 1973 Indian Prairie 6/1/2015
SFWMD L59W L59W Biweekly, if flowing/ Monthly/Quarterly 1973 Indian Prairie 6/1/2015
SFWMD L60E L60E Biweekly, if flowing/ Monthly/Quarterly 1973 Indian Prairie 6/1/2015
SFWMD L60W L60W Biweekly, if flowing/ Monthly/Quarterly 1973 Indian Prairie 6/1/2015
SFWMD L61E L61E Biweekly, if flowing/ Monthly/Quarterly 1973 Indian Prairie 6/1/2015
SFWMD LI02362923 LI02362923 Biweekly, if flowing* 2011 Lake Istokpoga 6/22/2015

Final 2015 Progress Report for the Lake Okeechobee Basin Management Action Plan, July 2016
Page 82 of 87
Sampling Entity Station Name Florida STORET
Station ID Frequency Year Site
Established Sub-watershed
Date of Latest Sample in
Florida STORETb
SFWMD LZ25A LZ25A Monthly 1981 Within Lake 6/2/2015 SFWMD LZ30 LZ30 Monthly 1986 Within Lake 6/2/2015
SFWMD MBOXSOU MBOXSOU Monthly – Stage dependent 1996 Within Lake 1/15/2015
SFWMD POLE3S POLE3S Monthly 1986 Within Lake 6/2/2015
SFWMD S127 S127 Biweekly, if flowing/ Monthly/Quarterly 1973 Indian Prairie 6/1/2015
SFWMD S129 S129 Biweekly, if flowing/ Monthly/Quarterly 1973 Indian Prairie 6/1/2015
SFWMD S131 S131 Biweekly, if flowing/ Monthly/Quarterly 1973 Indian Prairie 6/1/2015
SFWMD S133 S133 Biweekly, if flowing/ Monthly/Quarterly 1973 Taylor Creek/
Nubbin Slough 6/1/2015
SFWMD S135 S135 Biweekly, if flowing/ Monthly/Quarterly 1973 Taylor Creek/
Nubbin Slough 6/1/2015
SFWMD S154 S154 Weekly – ACT/
Biweekly, if flowing/ Monthly/Quarterly*
1973 Taylor Creek/ Nubbin Slough 6/15/2015
SFWMD S154C S154C Biweekly, if flowing/ Monthly/Quarterly 1973 Taylor Creek/
Nubbin Slough 5/4/2015
SFWMD S169 S169 Biweekly, if flowing/ Monthly/Quarterly 1973 South Lake Okeechobee 6/1/2015
SFWMD S191 S191 Weekly – ACF/
Biweekly, if flowing/ Monthly/Quarterly
1973 Taylor Creek/ Nubbin Slough 6/15/2015
SFWMD S2 S2
Weekly – ACF/ Biweekly, if
flowing/Monthly/ Quarterly/Event
1973 South Lake Okeechobee 6/1/2015
SFWMD S236 S236 Biweekly, if flowing/ Monthly/Quarterly 1979 South Lake Okeechobee 6/1/2015

Final 2015 Progress Report for the Lake Okeechobee Basin Management Action Plan, July 2016
Page 83 of 87
Sampling Entity Station Name Florida STORET
Station ID Frequency Year Site
Established Sub-watershed
Date of Latest Sample in
Florida STORETb
SFWMD S3 S3
Weekly – ACF/ Biweekly, if flowing/ Monthly/Quarterly/
Event
1981 South Lake Okeechobee 6/1/2015
SFWMD S308C S308C Biweekly, if flowing/ Monthly/Quarterly 1973 East Lake Okeechobee 6/15/2015
SFWMD S351 S351 Weekly – ACF 2000 South Lake Okeechobee 6/30/2015
SFWMD S352 S352 Weekly – ACF/
Biweekly, if flowing/ Monthly/Quarterly
2000 South Lake Okeechobee 6/30/2015
SFWMD S354 S354 Weekly – ACF 2000 South Lake Okeechobee 6/30/2015
SFWMD S392 S392d Weekly ACF/ Biweekly grabs 2006 Taylor Creek/
Nubbin Slough 6/30/2015
SFWMD S4 S4 Weekly ACF/
Biweekly, if flowing/ Monthly/Quarterly
1973 South Lake Okeechobee 6/15/2015
SFWMD S65 S65 Weekly –
ACT/Biweekly/ Quarterly grabs *
1973 Upper Kissimmee 6/17/2015
SFWMD S650 S650 Weekly ACF/ Biweekly grabs 2012 Taylor Creek/
Nubbin Slough 6/30/2015
SFWMD S65A S65A Weekly – ACT/
Biweekly/ Quarterly grabs *
1973 Lower Kissimmee 6/17/2015
SFWMD S65E S65E Weekly – ACF/
Biweekly/ Quarterly grabs
1973 Lower Kissimmee 6/17/2015
SFWMD S71 S71 Weekly – ACF/
Biweekly, if flowing/ Monthly
1973 Indian Prairie 6/15/2015
SFWMD S72 S72 Weekly – ACF/
Biweekly, if flowing/ Monthly
2007 Indian Prairie 6/1/2015
SFWMD S77 S77 Biweekly, if flowing/ Monthly 2007 Within Lake 6/24/2015

Final 2015 Progress Report for the Lake Okeechobee Basin Management Action Plan, July 2016
Page 84 of 87
Sampling Entity Station Name Florida STORET
Station ID Frequency Year Site
Established Sub-watershed
Date of Latest Sample in
Florida STORETb
SFWMD S84 S84 Biweekly, if flowing/ Monthly 2007 Indian Prairie 6/15/2015
SFWMD TCNS 201 TCNS 201 Biweekly, if flowing* 1988 Taylor Creek/ Nubbin Slough 12/9/2014
SFWMD TCNS 204 TCNS 204 Biweekly, if flowing* 1988 Taylor Creek/ Nubbin Slough 3/5/2015
SFWMD TCNS 207 TCNS 207 Biweekly, if flowing* 1988 Taylor Creek/ Nubbin Slough 12/9/2014
SFWMD TCNS 220 TCNS 220 Biweekly, if flowing* 1988 Taylor Creek/ Nubbin Slough 5/11/2015
SFWMD TCNS 222 TCNS 222 Biweekly, if flowing* 1988 Taylor Creek/ Nubbin Slough 5/26/2015
SFWMD TCNS 228 TCNS 228 Biweekly, if flowing* 1988 Taylor Creek/ Nubbin Slough 11/24/2014
SFWMD TCNS 230 TCNS 230 Biweekly, if flowing* 1988 Taylor Creek/ Nubbin Slough 10/15/2014
SFWMD TCNS 249 TCNS 249 Biweekly, if flowing* 1988 Taylor Creek/ Nubbin Slough 4/27/2015
SFWMD/USGS 02270500 02270500 Weekly – ACF 2005 Lake Istokpoga 6/24/2015 SFWMD/USGS 02273198 02273198 Weekly – ACF 2005 Lake Istokpoga 6/24/2015
SFWMD/USGS S390/02274325 S390 Weekly ACF/ Biweekly grabs 2006 Taylor Creek/
Nubbin Slough 6/30/2015
SFWMD/USGS TCNS 209/02274005 TCNS 209 Biweekly, if flowing* 1988 Taylor Creek/ Nubbin Slough 3/5/2015
SFWMD/USGS TCNS 213/02274010 TCNS 213 Biweekly, if flowing* 1988 Taylor Creek/ Nubbin Slough 6/10/2015
SFWMD/USGS TCNS 214/02274490 TCNS 214 Biweekly, if flowing* 1988 Taylor Creek/ Nubbin Slough 3/2/2015
SFWMD/USGS TCNS 217/02274505 TCNS 217 Biweekly, if flowing* 1988 Taylor Creek/ Nubbin Slough 6/24/2015
SFWMD/USGS 02255600 02255600 Biweekly, if flowing* 2005 Fisheating Creek 6/11/2015 SFWMD/USGS 02256500 02256500 Biweekly, if flowing* 2005 Fisheating Creek 6/11/2015 SFWMD/USGS 02272676 02272676 Biweekly, if flowing* 2005 Upper Kissimmee 6/10/2015

Final 2015 Progress Report for the Lake Okeechobee Basin Management Action Plan, July 2016
Page 85 of 87
Sampling Entity Station Name Florida STORET
Station ID Frequency Year Site
Established Sub-watershed
Date of Latest Sample in
Florida STORETb
SFWMD/USGS 02273230 02273230 Biweekly, if flowing* 2005 Indian Prairie 6/22/2015
SFWMD/USGS 02275197 02275197 Biweekly, if flowing* 2005 Taylor Creek/ Nubbin Slough 5/11/2015
SFWMD/USGS E04 E04 Bimonthly (6 times/yr) 1981 Upper Kissimmee 6/8/2015 SFWMD/USGS KREA 01/02272650 KREA 01 Biweekly, if flowing* 1986 Upper Kissimmee 3/5/2015
USGS Boggy Creek near Taft 02262900 Continuous 1959 Upper Kissimmee 4/28/2016
USGS Shingle Creek at Airport near Kissimmee 02263800 Continuous 1958 Upper Kissimmee 4/28/2016
USGS 2272650 02272650 Continuous 2003 Lower Kissimmee 4/28/2016 USGS 2273230 02273230 Continuous 2003 Indian Prairie 4/28/2016
USGS 2273630 02273630 Continuous 2003 Taylor Creek/ Nubbin Slough 4/28/2016
USGS 2274005 02274005 Continuous 2003 Taylor Creek/ Nubbin Slough 4/28/2016
USGS 2274010 02274010 Continuous 2003 Taylor Creek/ Nubbin Slough 4/28/2016
USGS 2274325 02274325 Continuous 2004 Taylor Creek/ Nubbin Slough 4/28/2016
USGS 2274490 02274490 Continuous 2003 Taylor Creek/ Nubbin Slough 4/28/2016
USGS 2274505 02274505 Continuous 2003 Taylor Creek/ Nubbin Slough 4/28/2016

Final 2015 Progress Report for the Lake Okeechobee Basin Management Action Plan, July 2016
Page 86 of 87
Figure B-1. Water quality monitoring network for the Lake Okeechobee Watershed

Final 2015 Progress Report for the Lake Okeechobee Basin Management Action Plan, July 2016
Page 87 of 87
APPENDIX C. WEBSITE REFERENCES
• DEP final TMDL documents: http://www.dep.state.fl.us/water/tmdl/final_tmdl.htm.
• DEP TMDL Program: http://www.dep.state.fl.us/water/tmdl/.
• DEP basin management action plans: http://www.dep.state.fl.us/water/watersheds/bmap.htm.
• 2016 SFER: http://www.sfwmd.gov/sfer.
• SFWMD website: http://www.sfwmd.gov