filter surveillance psw rocky mountain summit april 5 ... utility management... · filter...
TRANSCRIPT

Filter Surveillance
PSW Rocky Mountain Summit
April 5, 2016
Advanced Process Control and Optimization

Partnership for Safe Water
• Partnership for Safe Water mission:
– To improve the quality of drinking water
delivered to customers by optimizing water
system operations.
Overview
• Learning objectives
– Why should operators optimize filtration?
– How to Optimize Filter Performance
– How to measure the progress of optimization?
– What tools and techniques are needed?
• Necessary skills to assess filter performance/health
• Parameters used for comparison
3
Optimize Filters?• Optimize filter performance
– Minimize filter turbidities/particle counts (not just adding more chemical)
• Optimize Upstream Processes
• Develop Standard Operating Procedure for Filtration
• Optimize filter backwash – Ripening time
– Minimize initial spike
– Maximize filter run length
• Perform Filter Surveillance
4

Key to Good Filter Surveillance Program
• On-going– Filter Log review
– Backwash Observations
– Unit Filter Run Volume (UFRV)
– Review filter profiles as operational team
• Once per quarter (per season)– Adjust high flow rate for temperature
– Check media expansion – make adjustments
• Once per year– Visual observation of filter surface and components
– Probing media
– Solids retention analyses
– Core sampling
– Sieve analyses / media assessments
5

How is Progress Measured?
• Develop Filter Log
–DATA / TRENDS (On-going)
– Individual filter turbidity/Particle Counts (On-going)
– Filter run times (On-going)
–Uniform filter run volume (UFRV)
6
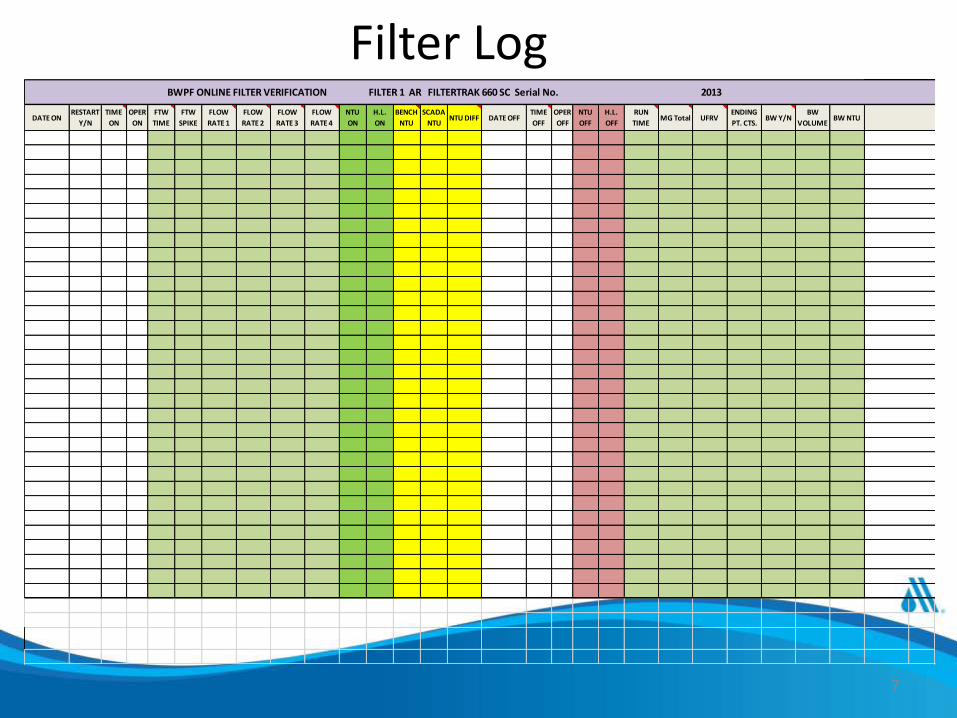
Filter LogDATE ON
RESTART
Y/N
TIME
ON
OPER
ON
FTW
TIME
FTW
SPIKE
FLOW
RATE 1
FLOW
RATE 2
FLOW
RATE 3
FLOW
RATE 4
NTU
ON
H.L.
ON
BENCH
NTU
SCADA
NTUNTU DIFF DATE OFF
TIME
OFF
OPER
OFF
NTU
OFF
H.L.
OFF
RUN
TIMEMG Total UFRV
ENDING
PT. CTS.BW Y/N
BW
VOLUMEBW NTU
BWPF ONLINE FILTER VERIFICATION FILTER 1 AR FILTERTRAK 660 SC Serial No. 2013
Comments
7
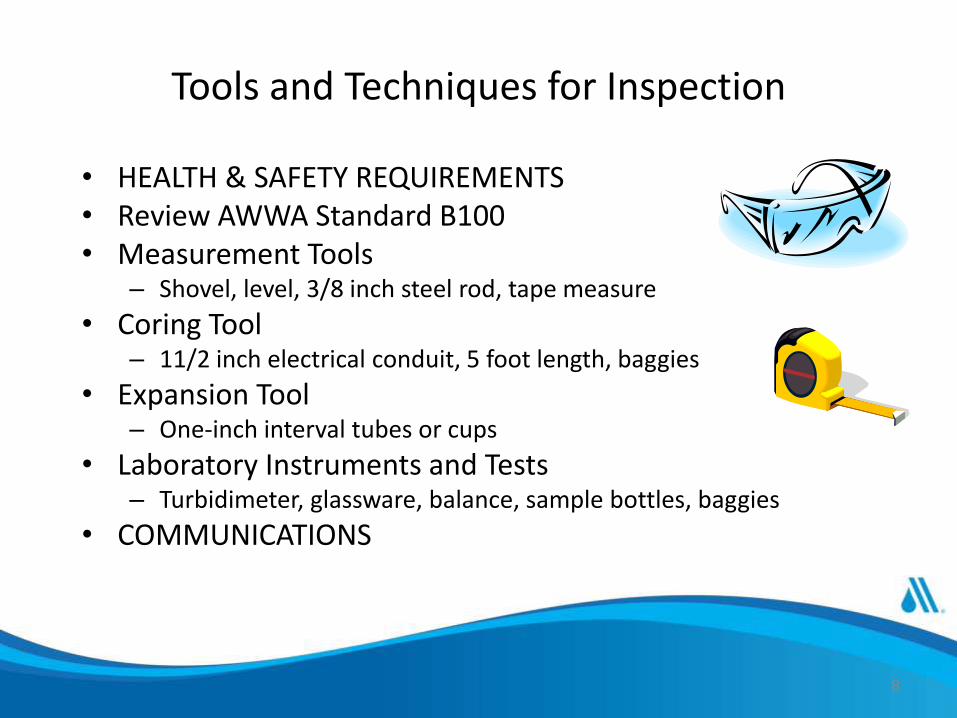
Tools and Techniques for Inspection
• HEALTH & SAFETY REQUIREMENTS• Review AWWA Standard B100• Measurement Tools
– Shovel, level, 3/8 inch steel rod, tape measure
• Coring Tool– 11/2 inch electrical conduit, 5 foot length, baggies
• Expansion Tool– One-inch interval tubes or cups
• Laboratory Instruments and Tests– Turbidimeter, glassware, balance, sample bottles, baggies
• COMMUNICATIONS
8

Safety Considerations• Is your filter a confined space?
• Do your filters require fall protection?
• Safe atmosphere down inside the filter box?
• Always use a ladder and practice ladder safety
• Make sure filter is drained before placing a piece of
plywood down to step on the media surface.
• Wear a hard hat and stay out from underneath the
bucket

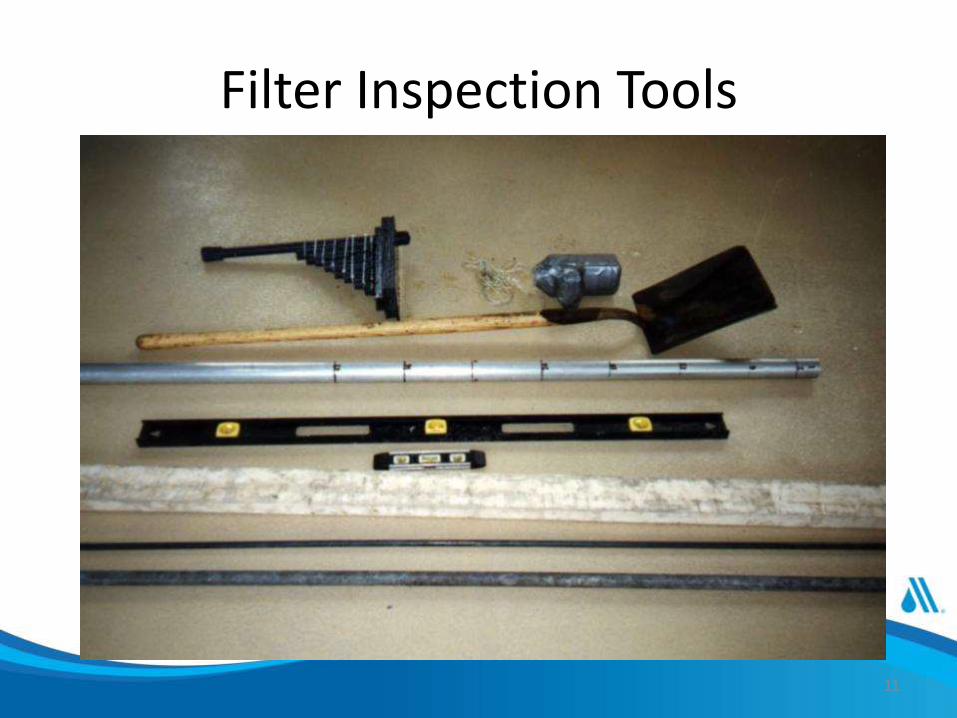
Filter Inspection Tools
11

Media Assessment
• Bed Depth Measurement (Drained Bed)– Know original specs
• Effective size - Uniformity Coefficient - Depth - L/D ratio
– Use a 3/8 inch steel rod to poke into media, or dig into it to measure depth• If filter is dual or mixed bed, note depth of each strata, and
depth of mixed interface
– Check to see if troughs are level, then measure distance from trough to bed - check for mounding
– Calculate L/D ratio - should be >1100 for low NTU production
12

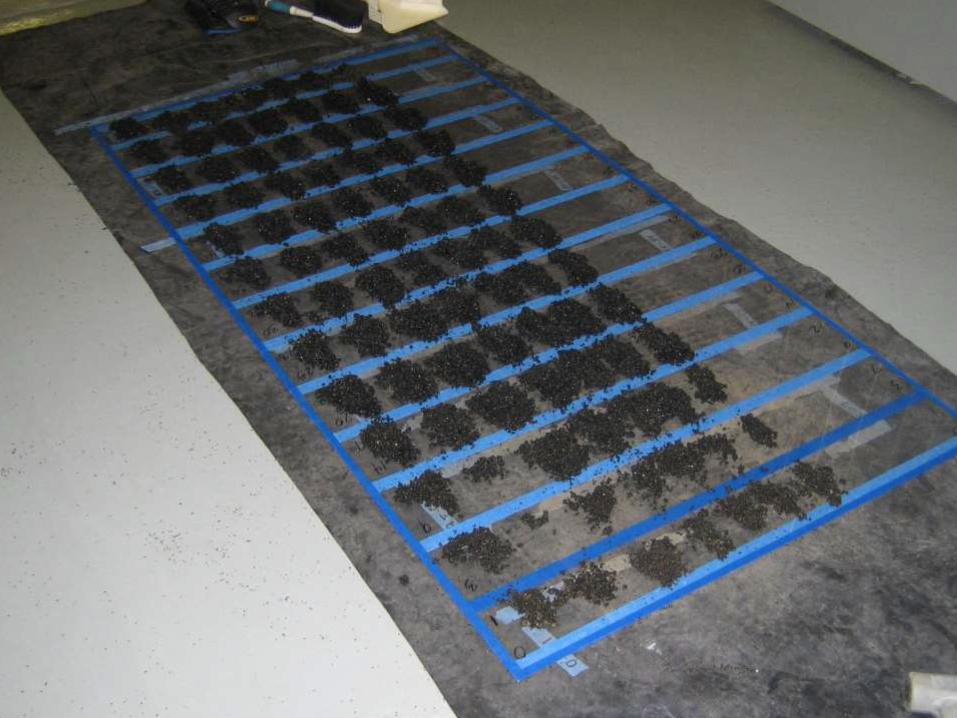
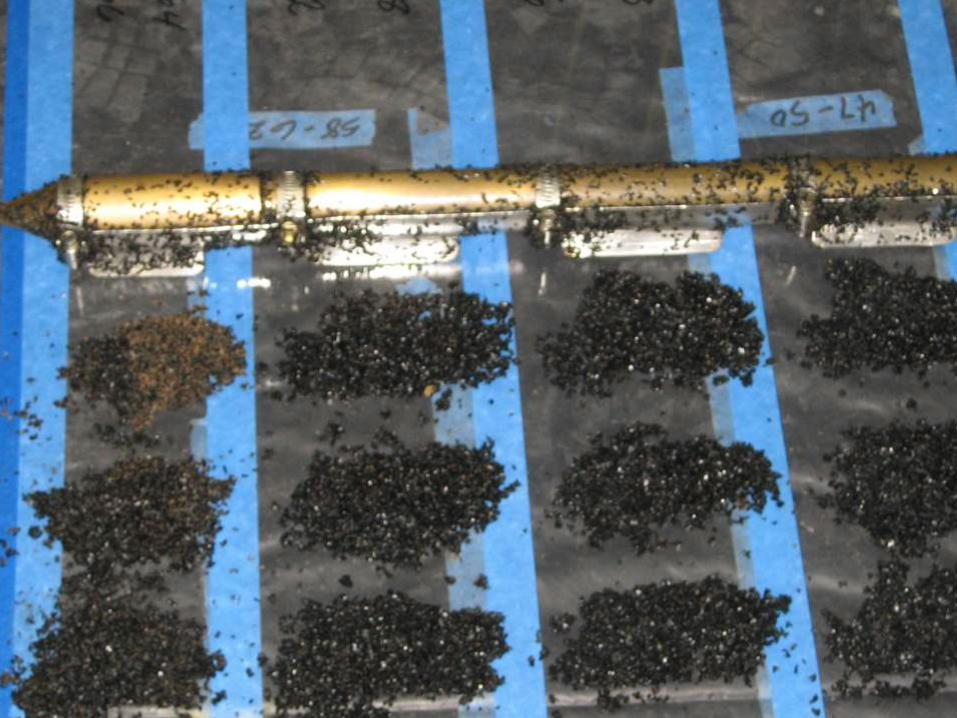
Core Sampling for Solids Retention
• Solids retention analysis best way to determine backwash effectiveness
• Use core sampling tool and baggies to obtain depth samples– Take samples at 0-2 inches, 2-6, 6-12, 12-
18, 18-24, etc., until all bed strata are sampled
– Sample before and after backwash– Wash 50 grams of each sample with 5
successive 100 mL washes of lab water– Measure turbidity of each X 2- plot on
graph as NTU/100 grams media
13

Lab Setup for Core Samples
• Turbidimeter
• Pan balance
• Baggies – before and after
• Glassware
• Lab water
• Weigh boats or other plastic cups
14

Guidelines – After Backwash• < 30 NTU
– Bed is too clean - examine wash rate and length - this bed will not ripen quickly
• 30 - 60 NTU – Well cleaned and ripened bed - no need for action
• 60 - 120 NTU – Slightly dirty bed - reschedule retention analysis soon
• > 120 NTU – Dirty bed - evaluate filter wash system and procedures
• > 300 NTU – Mudball problem - rehab bed
15

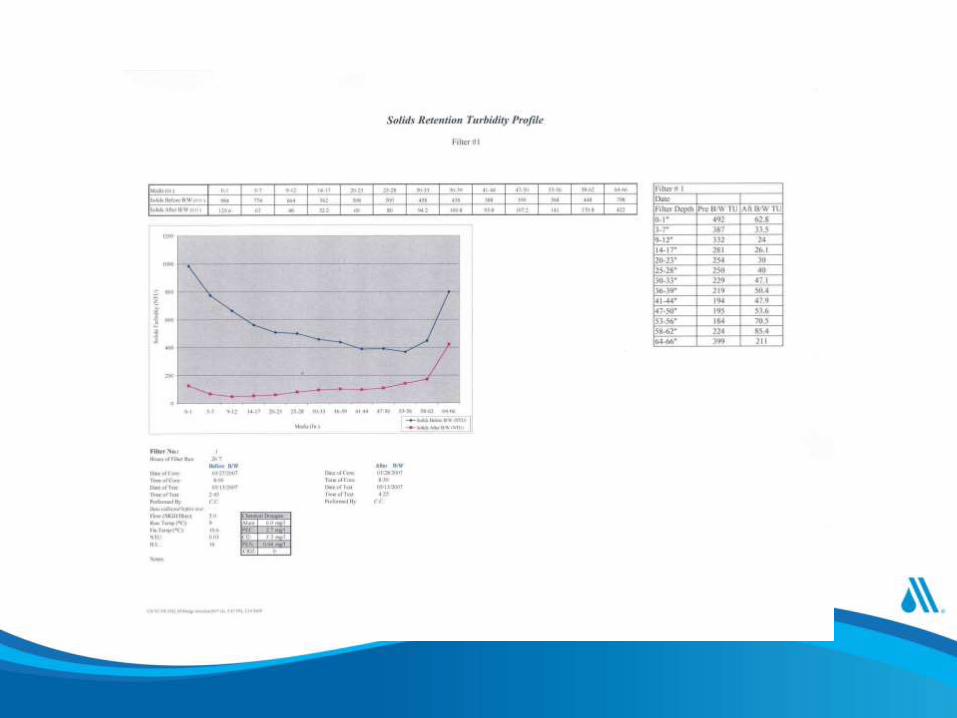
Solids Retention
• Measures the effectiveness of backwash
• Can show too little or too much backwash
• Change in historical solids retention is cause for concern
• Graph results for database 0
20
40
60
80
100
120
140
160
0-2 in 2-6 in 6-12 in 12-18 in 18-24 in 24-30 in
NT
U/1
00
gra
ms o
f m
ed
ia
Before
After
16


Backwash Waste Turbidity Analyses
• Too little / too much washing is a common problem
• After the first coring, and before the bed expansion measurement and second coring, the washwaterturbidity should be measured for duration of wash
• Sample at 1 minute intervals and analyze
• Graph results as NTU vs. time
• Record all data
– Volume of backwash, rates,
– Ramping intervals, operator habits
21

Washwater Turbidity Plot
• Turbidity vs. Time
• Helps prevent Excessive washing– Wastes washwater
– Strips ripening
• AWWA goal of 10 NTU
• This filter washed too long
0
50
100
150
200
250
300
1 min 2 min 3 min 4 min 5 min 6 min 7 min 8 min 9 min
NTU of Wash AWWA Standard
22

Bottles Ready for Backwash NTU Sampling
23

Operators Sampling Backwash Water
24

Bed Expansion Measurement with Expansion Tool
• Check high flow wash rate (seasonally adjusted)
• Desire 20 – 30% expansion
• Position and tie down the expansion tool so that it rests on top of the bed at the start of high rate backwash
• Wash bed under normal conditions and observe amount of expansion
25
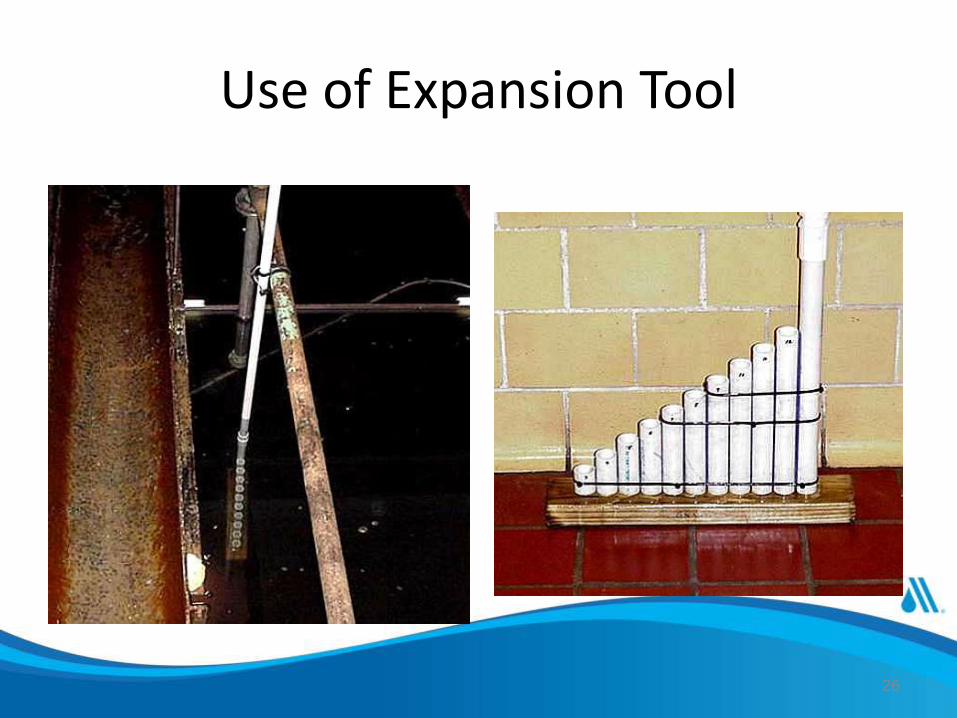
Use of Expansion Tool
26

27
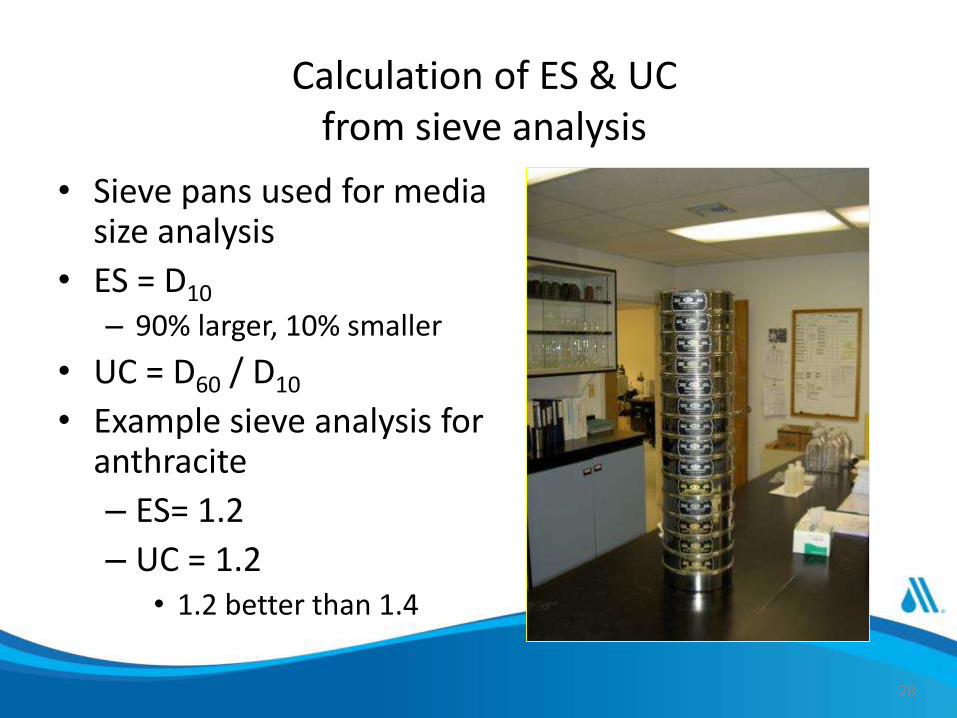
Calculation of ES & UC from sieve analysis
• Sieve pans used for media size analysis
• ES = D10
– 90% larger, 10% smaller
• UC = D60 / D10
• Example sieve analysis for anthracite
– ES= 1.2
– UC = 1.2• 1.2 better than 1.4
28
Customize Your Filter Surveillance
• Visually check underdrain
• Filter Valve confirmation
• Acid solubility
• Biofiltration Considerations
• Plant and filter specific considerations.
–Concrete condition of filter box
29

Filter Profile
• Graphical summary of filter performance for entire run
• Usually done with turbidity measurements -particles counts can be used
30
Filter Profile
0.00
0.03
0.06
0.09
0.12
0.15
0.18
0 200 400 600 800 1000 1200
Minutes into Filter Run
Tu
rbid
ity,
ntu

31
0.0
5.0
10.0
15.0
20.0
25.0
0.00
0.02
0.04
0.06
0.08
0.10
0.12
0.14
11/1/14 21:36 11/2/14 21:36 11/3/14 21:36 11/4/14 21:36 11/5/14 21:36 11/6/14 21:36 11/7/14 21:36 11/8/14 21:36
FLO
W (
MG
D)
& H
EAD
LOSS
(FT
)
TUR
BD
ITY
(N
TU)
BWPF WORST FILTER RUN PROFILE - November 2014Filter #1(Full Profile)
FTW TURBIDITY SERVICE TURBIDITY FLOW BW FLOW HEADLOSS Series5
See Detail 1
Turbidity
Filter-to-Waste (FTW) Turbidity
Backwash Flow
HighestTurbidity
0.058 NTU
Flow Headloss
See Detail 3
Mini BackwashFlow
See Detail 2

32
Worst Filter Run Report

Take Away Messages
• The Key to Operational Excellence is in the understanding of the smallest details of the plant.
33
• The Most Important Component to Any Optimization Effort is a tenacious, engaged Operator.
34
NO
COMPLACENCY