files.eric.ed.gov · ed 288 892-author title. institution. spons agency pub date grant. note....
TRANSCRIPT

ED 288 892-
AUTHORTITLE
INSTITUTION
SPONS AGENCY
PUB DATEGRANTNOTE
AVAILABLE FROM
PUB TYPE
EDRS PRICEDESCRIPTORS
IDENTIFIERS
DOCUMENT RESUME
TM 870 625
Johnson, Eugene G.; And OthersNational Assessment of Educational Progress: 1985-86Public-Use Data Tapes, Version 1.0. Users' Guide.National Assessment of Educational Progress,Princeton, NJ.Center for Education Statistics (OERI/ED),Washington, DC.Aug 87NIE-G-83-0011140p.; For related "Codebooks and Layouts," see TM870 626-628.National Assessment of Educational Progress,Educational Testing Service, Rosedale Road, CN 6710,Princeton, NJ 08541-6710 ($25.00).Guides - Non-Classroom Use (055)
MF01/PC06 Plus Postage.Academic Achievement; Computer Software; *ComputerStorage Devices; Data Analysis; *Databases; *DataCollection; Data Interpretation; EducationalAssessment; Elementary Secondary Education; LatentTrait Theory; *Magnetic Tapes; *National CompetencyTests; National Surveys; Questionnaires; ReadingTests; Sampling; *Statistical Analysis; TestingPrograms; Writing EvaluationBalanced Incomplete Block Spiralling; *NationalAssessment of Educational Progress
ABSTRACTThis document is the users' guide for Version 1.0 of
the Public-Use data tapes compiled by the Naticnal Assessment ofEducational Progress (NAEP), 1985-86. The Public-Use tapes areproduced to allow outside researchers access to the NAEP data. Thetapes accompanying this guide, one for grade 3/age 9, one for grade7/age 13, and one for grade 11/age 17, contain student responses tomathematics, science, computer competence, U.S. history, andliterature exercises, as well as responses to questionnaires fromstudents, teachers, and principals. Reading scores have been withheldfrom this 1.0 version, but will be included in later versions. Theguide includes: (1) background information on NAEP and the public-usetapes; (2) special considerations for users; (3) description of theassessment instrument design, sample selection, data collection, andscoring procedures; (4) reporting subgroups and other variables; (5)suggestions on conducting statistical analyses of the NAEP data; (6)content and format of the data tapes; and (7) suggestions for usingthe Statistical Package for the Social Sciences-K (SPSS-X) and SAScomputer software systems with this data. Appendices include a briefNAEP history and lists of related machine-readable data files andprinted reports. (JGL)
***********************************************************************
Reproductions supplied by EDRS are the best that can be madefrom the original document.
***********************************************************************

>-Ecu
owgo0 crcc 00- zw uj
uj0 CDI- toZ ''t
otle' 0 I0ico <4
..,
DL
w .7,-?- m
s
,-, 4 4i1
0
'' , ,1;';
;1,, '<
NOTICE
1
The 1935-86 National Assessment of Educational Progressincluded an assessment of reading achievement at threegrade/age levels. Because of changes in the assessmentprocedures, however, the psychometric properties of thereading results are not fully understood at present.Accordingly, reading achievement results have not beenincluded in the Version 1.0 data tapes pending thr resultsof currently ongoing analyses of the properties of thereading data.
3
,
NATIONAL ASSESSMENT OF EDUCATIONAL PROGRESS
1985-86 PUBLIC-USE DATA TAPES
VERSION 1.0
USERS' GUIDE
by
Eugene G. JohnsonDebra L. Kline
Norma A. NorrisAlfred M. Rogers
with contributions by
Laurel BarnettJohn L. BaroneJohn J. FerrisDavid S. FreundBruce A. Kaplan
August 1987
Benjamin F. KingJanet R. JohnsonRobert J. MislevyRebecca Zwick
Prepared for theOffice for Educational Research and Improvement.
Center for Education Statisticsunder Grant No. NIE-G-83-0011
by the National Assessment of Educational ProgressEducational Testing Service, Princeton, New Jersey

The National Assessment of Educational Progress is funded by the U. S. Department of Edu-cation under a grant to Educational Testing Service. National Assessment is an educationresearch project mandated by Congress to collect data over time on the performance ofyoung Americans in various learning areas. It makes available information on assessmentprocedures to state and local education agencies.
The Foundations of Literacy Project is funded by the National Endowment for the Humanitiesunder a grant to the Educational Excellence Network, Columbia University. The EducationalExcellence Network subcontracted the assessment of 17-year-old and 11th grade students'knowledge of history and literature to NAEP.
This document is baser, upon work performed pursuant to Grant No. NIE-G-83-001 1 of theOffice for Educational Research and Improvement. Center for Education Statistics. It doesnot, however, necessarily reflect the views of that agency.

NATIONAL ASSESSMENT OF EDUCATIONAL PROGRESS1985-86 PUBLIC -USE DATA TAPES, VERSION 1.0
USERS' GUIDE
Table of Contents
Index of Tables
Chapter 1 INTRODUCTION
ix
3
1.1 What is NAEP? 31.2 The 1985-86 NAEP 3
1.2.1 Sponsorship 31.2.2 Special Features 4
1.3 The NAEP Public-Use Data Tapes 41.4 The Package 41.5 Security and Confidentiality 61.6 Inquiries and Tape Orders 61.7 How to Use the Guide 7
Chapter 2 SPECIAL CONSIDERATIONS FOR USERS 11
2.1 Introduction 112.2 Grade/Age Sampling 112.3 Spiral Sample I I2.4 Bridge Samples 112.5 Reporting Subgroups and Other Variables 122.6 Using Weights 122.7 Error Estimation 12
Chapter 3 INSTRUMENT DESIGN 15
3.1 Introduction 153.2 Assessment Items 15
3.2.1 Mathematics 163.2.2 Science 163.2.3 Reading 173.2.4 Computer Competence 173.2.5 Literature 173.2.6 U.S. History 183.2.7 Common Background 18
3.3 Assembling Items into Instruments 193.3.1 Assembling items into Blocks 203.3.2 Assembling Blocks into Booklets 203.3.3 Spiralling and Bundling Booklets 21

3.4 Bridge Instruments (Booklets 1-5) 22
3.4.1 Change in Age Definition and Timeof Testing (Bridge A: Booklets 1-3) 23
3.4.2 Change in Mode of Administration(Bridge B: Booklets 4-5) 23
3.5 Questionnaires 243.5.1 Teacher 243.5.2 School Characteristics and Policy 243.5.3 Excluded Student 253.5.4 Computer Coordinator 25
3.6 Tabular Summary of Assessment Instruments 25
Chapter 4 SAMPLE SELECTION 43
4.1 Introduction 434.2 Grade/Age Definition 434.3 Bridge Samples 444.4 Sample Design 44
4.4.1 Primary Sampling Units 454.4.2 Schools 454.4.2, Assigning Sessions to Schools 464.4.4 Sampling Students 474.4.5 Sampling Excluded Students 474.4.6 Sampling Teachers 474.4.7 Sampling School Characteristics
and Computer Coordinators 484.5 Sample Weights 48
4.5.1 Base Weight 494.5.2 Adjustment of Base Weights for
Noiresponse 494.5.3 Trimming of Weights 51
4.5.4 Post-Stratification 524.5.5 The Final Student-Weight: The
Full Sample Weight 524.5.6 Weights Used for Variance Estimation 53
4.6 Tabular Summary of the 1985-86 Samples 53
Chapter 5 DATA COLLECTION AND SCORING 63
5.1 Introduction 635.2 Field Administration and Data Collection 635.3 Data Entry System 63
5.3.1 Editing 645.3.2 Multiple Responses 64
5.4 Professionally Scored Items 655.5 Quality Control 65
vi 7

Chapter 6 REPORTING SUBGROL PS AND OTHER VARIABLES 69
6.1 Introduction 696.2 Reporting Subgroups 69
6.2.1 Sex 696.2.2 Observed Race/Ethnicity 696.2.3 Imputed Race/Ethnicity 706.2.4 Size and Type of Cot.imunity 716.2.5 Parental Education 736.2.6 Region 746.2.7 Grade 756.2.8 Age 75
6.3 Other Variables 776.3.1 Principal Questionnaire 776.3.2 Quality Education Data (QED) 78
Chapter 7 CONDUCTING STATISTICAL ANALYSES OF1985-86 NAEP DATA 81
7.1 Introduction 817.2 Using Weights to Account.for Differential
Representation 827.2.1 The Spiral Samples of Students 837.2.2 The Bridge B Samples of Students 847.2.3 The Excluded Students from the
Spiral and Bridge B Assessments 847.2.4 The Bridge A Samples of Students 857.2.5 The Excluded Students from the
Bridge A Assessments 857.2.6 Other Weights 85
7.3 Procedures Used by NAEP to EstimateVariability (Jackknifing) 857.3.1 Degrees of Freedom of the
Jackknifed Variance Estimate 887.4 Approximations 897.5 A Note Concerning Multiple Comparisons 91
Chapter 8 CONTENT AND FORMAT OF THE DATA TAPES 95
8.1 Introduction 958.2 Raw Data Files 958.3 I ayouts 958.4 Codebooks 988.5 Machine-Readable Catalogs 1008.6 SPSS-X and SAS Control Statement Files 103
vii

Chapter 9 WORKING WITH SPSS-X AND SAS 109
9.1 Introduction 1099.2 SPSS-X and SAS Control Statement Files 1099.3 Creating SPSS-X System Files 1109.4 Creating SAS System Files 1129.5 Merging Files Under SPSS-X or SAS 1149.6 Computing the Estimated Variance of a
Mean (Jackknifing) Using SPSS-X or SAS 114
Appendix A NAEP HISTORY 123
Appendix B RELATED MACHINE-READABLE DATAFILES AND PRINTED REPORTS 129
viii

Index of Tables
Table 3-1 Potential and achieved block pairings acrosslearning areas 21
3-2 Block information, grade 3/age 9 263-3 Block information, grade 7/age 13 273-4 Block information, grade 11/age 17 283-5 Booklet content, grade 3/age 9 303-6 Booklet content, grade 7/age 13 313-7 Booklet content, grade 11/age 17 323-8 Target sample sizes by grade/age 333-9 Comparison matrix, grade 3/age 9 spiral booklets 343-10 Comparison matrix, grade 7/age 13 spiral booklets 353-11 Comparison matrix, grade 11/age 17 spiral booklets 363-12 Number of students administered each spiral
block and bridge booklet, grade 3/age 9 373-13 Number of students administered each spiral
block and bridge booklet, grade 7/age 13 383-14 Number of students administered each spiral
block and bridge booklet, grade I I/age 17 39
Table 4-1 The sampling subuniverses 454.2 Number of students by grade/age and assessment type 564-3 Number of spiral students, grade 3/age 9 574-4 Number of spiral students, grade 7/age 13 584-5 Number of spiral students. grade II/age i7 59
Table 6-1 Determining imputed race/ethnicity 726-2 Geographic regions 746-3 Comparison of MODGRD and DGRADE values 766-4 Comparison of MODAGE and DAGE values 76
Table 8-1 Code definitions 968-2 Block designations and file locations 998-3 Machine-readable catalog data layout 1018-4 Data file description, grade 3/age 9 1048-5 Data file description, grade 7/age 13 1058-6 Data file description. grade 11/age 17 106
Table 9 -I SPSS-X control statement synopsis 1 1 I9-2 SAS control statement synopsis 1139-3 Matching school and student files 1169-4 Matching teacher and student files 1169-5 Matching school and excluded student files 1179-6 Matching school, teacher and student files 1189-7 SPSS-X multi-weight standard error computation 1199-8 SAS multi-weight standard error computation 120
Table A-1 NAEP learning areas, grades. and agesassessed. 1969-1986 125
ix10

Chapter 1
INTRODUCTION
11

Chapter 1: INTRODUCTION
1.1 WHAT IS NAEP?
The National Assessment of Educational Progress (NAEP) is a continuing,congressionally mandated national survey of the knowledge, skills, under-standings, and attitudes of young Americans in major learning areas usuallytaught in school. Its primary goals are to detect and report the currentstatus of, as well as changes in, the educational attainments of youngAmericans, and to report long-term trends in those attainments. The pur-pose of NAEP is to gather Information which will aid educators, legisla-tors, and others in improving the educational experience of youth in theUnited States. It is the first ongoing effort to obtain comprehenctve anddependable achievement data on a national basis in a uniform, scientificmanner.
NAEP began in 1969 to survey American students agAl 9, 13, and 17annually in various subject areas; young adi'lts aged 26 to 35 were surveyedless frequently. Since the 1980-81 school year, budget restraints haveprompted a shift to biennial data collection. ;Al 1983-84, NAEP begansampling students by grade as well as age. More information about NAEP andits history are included in Appendix A.
1.2 THE 1985-86 NAEP
The 1985-86 assessment is a ample survey of achievement and attitudesin six learning areas: mathematics, science, reading, computer competence,literature, and U.S. history. N=.tional samples were drawn of students aged9, 13, and 17 and of the corresponding modal grades 3, 7, and 11.Achievement in literature and U.S. history was assessed for grade 11/age 17stuJents only.
The data were collected between November 4, 1985 and May 2, 1986; themajority of data collection activity occurred between February 17 and May2, 1986.
1.2.1 Sponsorship
The assessment was conducted by Educational Testing Service for theOffice for Educational Research and Improvement, Center for EducationStatistics. Assessments of achievement and attitudes in mathematics,science, reading, and computer understanding were funded by the U.S.nepartment of Education. The survey of achievement and attitudes of grade11/age 17 students in literature and U.S. history was subcontracted to NAEPby the Educational Excellence Network under a grant from the NationalEndowment for the Humanities.
3
12

1.2.2 Special Features
Because of the complexity of the NAEP design (see Chapters 3 and 4),data tape users should have some understanding of the design beforeperforming analyses. For example, because 1985-86 NAEP data were collectedby both age and grade, the user must decide which sample is appropriate fora particular analysis. Special characteristics of the assessment areoutlined in Chapter 2.
The data tapes contain sampling weights for each student. Theseweights should be used in statistical analyses. In addition, because ofthe complex sampling scheme, conventional methods of standard errorestimation do not produce optimum estimates. The NAEP sampling scheme alsoreduces the effectire degrees of freedom for statistical analysis. Theseissues are discussed in Chapter 7.
1.3 THE NAEP PUBLIC-USE DATA TAPES
Since 1975, NAEP has provided assessment data on computer tapes for useby outside researchers. In 1983 the format of the data tapes was refinedto make them easier to use. Version 1.0 of the 1985-86 data tapes can beused for descriptive and item level analyses. To enhance secondaryanalyses of mathematics, reading, and science data, plausible values, whichestimate individual proficiencies, will be added to Version 2.0 of the datatapes, scheduled for release in 1988.
These data tapes contain data only for the student and school samplesand weights only for the student samples; data for excluded students andteachers associated with students, and weights for schools, excludedstudents, and teachers associated with students will be included in thesecond version. The Version 2.0 data tapes will also include scores foropen-ended computer competence items.
1.4 THE PACKAGE
In addition to the computer tapes, NAEP provides a users' guide,printed layouts and codebooks describing each data file, microfiche copiesof item text, data file printouts, and learning area objectives booklets.
Data Tapes
Three data tapes, one for each grade/age, are included in the package.Version 1.0 of the data tapes contains:
student responses to mathematics, science, computercompetence, U.S. history, and literature exercises(Note: Achievement results for reading have been withheld
4 13

from the Version 1.0 tapes--see the noticr' at the front ofthis guide);
responses to questions about students' backgrounds,attitudes, and activities;
information about students' schools;
sampling weights for each student; and
SPSS-X and SAS control statement files.
The data tapes are available with the following standard tapecharacteristics:
Recording Density: 1600 or 6250 bytes per inchRecording Format: EBCDIC or ASCIIBlocking: Blocked or unblockedLabel: IBM standard, unlabeled, or ANSI
Content and format of the tapes are described in Chapter 8.
Codebooks
For each tape a codebook is included which provides the layout of thedata, a description of each variable, and a description of each raw datafile. The codebooks and their use are discussed in Chapter 8.
Printouts
Computer printouts containing the first 50 records of each data fileare also included in the package.
Microfiche
In addition to the response data contained on the tapes, the text ofall assessment items and survey questionnaires are provided on microfiche.These are color-coded by grade/age.
Objectives Booklets
NAEP develops educational objectives in all the areas it assesses. Thebooklets containing the objectives for the learning areas assessed in1985-86 are included in the package.
514

1.5 SECURITY AND CONFIDENTIALITY
NAEP releases some items for unrestricted public use. Other items arekept secure so they can be re-administered in future assessments to permitanalysis of trends in performance levels. To preserve the integrity ofNAEP, it is ..!ssential that these items remain secure. For the 1985-86assessment, the complete contents of the survey questionnaires will bereleased, as will all of the background and attitude items administered tostudents. However, achievement items in all learning areas will be heldsecure.
It is crucial to the long-term utility of NAEP that secure items not bepublished or used in other assessments or research projects. At the sametime, the utility of the data for secondary researchers is seriouslycompromised if item text is unavailable. Therefore, microfiche copies ofthe complete exercises have been included. To protect the confidentialityof secure items, users are asked to sign a nondisclosure agreement whenordering the tape package.
A second confidentiality issue involves subregional identifiers. Toprevent identification of individual respondents (which would violate thePrivacy Act), all subregional identifiers (schools, districts, counties,states, etc.) have been deleted from data files. Scrambled primarysampling unit (PSU), school, and respondent identification fields areincluded on the data files to permit unique identification of each recordand to permit aggregating data across exercise booklets at the school orPSU level.
1.6 INQUIRIES AND TAPE ORDERS
A list of data tapes available for previous NAEP assessments isprovided in Appendix B. If you have questions about the tapes and theiruse, or want to order a tape package, contact one of the followingindividuals.
Subject-Matter Inquiries
Douglas RhodesAssociate Director, NAEPEducational Testing ServiceRosedale RoadPrinceton, NJ 08541(609) 734-1464
Computer-Related Inquiries and Tape Orders
Norma NorrisSenior Research Data AnalystEducational Testing ServiceRosedale RoadPrinceton, NJ 08541(609) 734-5898
6
15

Tapes may be ordered for all grade/age groups or for individualgrade/age groups. Orders will be shipped with machine-readable data files,a users' guide, printed layouts and codebooks, microfiche copies of itemtexts, objectives booklets, and a printout of the first 50 records for eachdata file.
1.7 HOW TO USE THE GUIDE
Chapters 2 through 9 and the appendices provide detailed informationabout the 1985-86 assessment, the data tapes, and recommended methods ofworking with the data to perform analyses. A summary of these chaptersfollows.
Chapter 2: SPECIAL CONSIDERATIONS FOR USERS
The design features of the assessment that may be of specialconcern to researchers who wish to perform their own analyses ofthe data.
Chapter 3: INSTRUMENT DESIGN
The six learning areas assessed; assessment item descrip-tions; the contents of survey questionnaires; methods by whichitems were administered to students; and a tabular summary of theresults of item administration.
Chapter 4: SAMPLE SELECTION
The methods by which schools, students and teachers werechosen to be included in the assessment; the method by which somestudents were chosen for the sample but subsequently excluded fromthe assessment; the sampling weights included on the data tapes;and a tabular summary of the results of the sample selection.
Chapter 5: DATA COLLECTION AND SCORING
Procedures used for administering assessments; methods usedfor data entry and editing; how items were professionally scored;and methods used for quality control of the data.
Chapter 6: REPORTING SUBGROUPS AND OTHER VARIABLES
A description of the variables used for reporting; howreporting variables were derived; and a discussion of othervariables on the tapes that are not self-explanatory.
7 16

Chapter 7: CONDUCTING STATISTICAL ANALYSES WITH NAEP DATA
A discussion of the weights on the data tapes and how to usethem in different types of analyses; and methods for estimatingstandard errors and variances.
Chapter 8: CONTENT AND FORMAT OF THE DATA TAPES
A detailed description of the raw data files, layouts,codebooks, machine-readable catalogs, SPSS-X and SAS controlstatement files, printouts, and microfiche.
Chapter 9: WORKING WITH SPSS-X AND SAS
Procedures for creating SPSS-X and SAS system files, mergingfiles, and using the jackknife procedure to estimate standarderrors.
APPENDIX A provides information about the history of NAEP.
APPENDIX B lists machine-readable data files available forprevious assessments and printed NAEP reports available formathematics, reading, and science.
8

Chapter 2
SPECIAL CONSIDERATIONS FOR USERS
.18

Chapter 2: SPECIAL CONSIDERATIONS FOR USERS
2.1 Introduction
Because of the complexity of the NAEP design, it is important for usersto have some understanding of the design before performing analyses of thedata. The following sections highlight areas of potential importance tothe user in constructing analyses.
2.2 Grade/Age Sampling
The 1985-86 main assessment sampled students by grade as well as age,and includes three student cohorts: students who were either in the thirdgrade or nine years old (grade 3/age 9), students who were either in theseventh grade or thirteen years old (grade 7/age 13), and students who wereeither in the eleventh grade or seventeen years old (grade 11/age 17).
Each weighted sample of students of a given grade/age, when combinedwith the appropriate weighted sample of students excluded from participa-tion, is a representative sample of students of that grade/age in thenational population. In most cases, the grade/age estimate is of minorinterest; a researcher is more likely interested in the number of studentsat either a particular grade or a particular age.
Chapter 6 provides information about the NAEP variables th t are usedto determine grade and age for reporting purposes; Chapter 4 discussesgrade/age definition and the resulting student samples.
2.3 Spiral Sample
The term "spiral" is a short name for the Balanced Incomplete Block(BIB) Spiral method of assembling assessment items into instruments. Thismethod was developed to allow the study of the interrelationships among allitems within a learning area. As a result of this design, even though allitems are given to approximately the same number of students, no studentreceives all items.
The spiral design is discussed in Chapter 3, Section 3.3.
2.4 Bridge Samples
In addition to the spiral, or main, sample, the 1985-86 assessment alsoincluded a number of bridge samples which were used to assess the effect ofcertain changes from past assessments: changing the age definition of thetwo younger student cohorts, changing the time of year the two younger
11
19

student cohorts were tested, and changing the mode of administration forall three cohorts from tape recorder-assisted to pencil-and-paper.
The instruments used for the bridge assessments are discussed inChapter 3; the bridge samples are discussed in Chapters 4 and 7.
2.5 Reporting Subgroups and Other Variables
In addition to reporting national results, NAEP reports informationby several student subgroups. Some subgroup data (for example, L..videntethnicity) are derived from responses to two or more assessr.ent items.Chapter 6 defines the reporting subgroups and explains how their data arederived.
Some variables on the tapes are not taken from assessment instrumentsbut from other sources. For optimal use of the data from these variables,please see their explanations in Chapter 6.
2.6 Using Weights
In the NAEP sampling design, students do not have an equal probabilityof being selected. Therefore, as in all complex surveys, each student hasbeen assigned a sampling weight. When computing descriptive statistics orconducting inferential procedures, one should properly c, eight the data foreach student. Performance of statistical analyses without weights can leadto misleading results.
The weighted number of students responding to the spiral assessment orto any bridge booklet, in combination with the appropriate correspondingsamples of students excluded from the assessmeat, is an estimate of thenumber of students in the national population.
Chapter 7 provides an explanation of the weights on the data tapes andhow to use them in performing analyses.
2.7 Error Estimation
The NAEP sampling design involves the selection of clusters of studentswho come from the same school, as well as clusters of schools that comefrom the same geographical region. As a result, observations are notindependent of one another as they are in a simple random sample.Therefore, use of ordinary formulas for estimating the standard error ofsample statistics will result in values that are too small. Alternatemethods of computing standard errors are provided in Chapter 7.
Another effect of the sampling design is a reduction of the effectivedegrees of freedom, which in NAEP are a function of the number of clustersof primary sampling units and the number of strata in the design, ratherthan the number of subjects. Recommended formulas for obtaining degrees offreedom can be found in Chapter 7.
2012

Chapter 3
INSTRUMENT DESIGN
21

Chapter 3: INSTRUMENT DESIGN'
3.1 INTRODUCTION
In 1985-86, NAEP conducted a:. assessment of achievement and attitudesof over 100,000 grade 3/age 9, grade 7/age 13, and grade 11/age 17 studentsin the learning areas of reading, mathematics, science, and computercompetence, and over 10,000 grade 11/age 17 students in literature and U.S.history.
The assessment incorporated five types of instruments: studentassessment booklets, a teacher questionnaire, a school characteristics andpolicies questionnaire, a computer coordinator questionnaire, and aquestionnaire for excluded students.
This chapter will answer the following questions about the instrumentsused in the 1985-86 assessment:
What content areas were assessed in each ..laming area? Howwere attitudes and interests assessed? What is a commonbackground item? (3.2)
How were items arranged into assessment booklets? What isBIB spiralling? (3.3)
What are "bridge" assessment instruments and why were theyadministered? (3.4)
What are "excluded students"? What instruments were used tocollect data for teachers, schools, computer coordinators,and excluded students? (3.5)
For information about how schools, students, and teachers were selectedfor participation in the assessment, definition of the grade and agecategories included in the assessment, and final counts of parLicipants,see Chapter 4, "Sample Selection."
3.2 ASSESSMENT ITEMS
Of the six 1985-86 learning areas, mathematics, science, reading, andliterature were assessed in earlier years; assessments of computer
'Data collected from the Teacher Questionnaire and the Excluded StudentQuestionnaire, and sampling weights for schools, excluded students, andteachers associated with students are not contained on the Version 1.0 datatapes, but will be included in Version 2.0.
15
22

competence and U.S. history were conducted by NAEP for the first time in1985-86.
Items were created from a set of objectives developed for each learningarea. For mathematics, science, and reading, some items used in previousassessments were used again in 1985-86 to permit analyses of trends overtime.
In each learning area, items were developed both to assess academicachievement (achievement items) and investigate student attitudes, experi-ences, and interests (attitude items). (NAEP booklets describing itemdevelopment objectives for each learning area are included in thepublic-use data tapes package.)
In addition, a common core of items was administered to each student tocollect data about the student's personal and family background.
The following sections summarize the content of assessment items foreach learning area and the core of common background items.
3.2.1 Mathematics
Earlier assessments in mathematics were conducted during the schoolterms ending in 1973, 1978, and 1982. The objectives for development ofmathematics items for 1985-86 were organized into seven content areas:
Mathematical methodsDiscrete mathematicsData organization and interpretationMeasurementGeometryRelations, functions, and algebraic expressionsNumbers and operations
Some mathematics items required the use of a calculator, which wasprovided.
Five categories of attitude items were also developed:
Mathematics in schoolMathematics and oneselfMathematics and societyMathematics as a disciplineAttitudes toward computers
3.2.2 Science
Earlier assessments in science were conducted during the school termsending in 1970, 1973, 1977, and 1982. The objectives for development ofscience items for 1985-86 were organized into six content areas:
16
23

Life sciencesPhysicsChemistry
Earth and space sciencesHistory of scienceNature of science
Seven categories of attitude items were also developed:
Attitudes toward science classesCareer and education intentionsSocioscientific responsibilityScience as a personal toolValue of scienceSocietal issuesExperiences in science
3.2.3 Reading
Earlier assessments in reading were conducted during the school termsending in 1971, 1975, 1980, and 1984. The objectives for development ofreading items for 1985-86 were:
Comprehends what is readExtends comprehensionManages the reading experienceValues reading
The reading attitude items investigated what students read, both in andout of school; how often they read different kinds of material; how oftenthey read for enjoyment; use of the library; understanding the value ofreading; and the reading behavior of people in the students' homes.
3.2.4 Computer Competence
Computer competence was assessed by NAEP for the first time in 1985-86.Students were assessed at the cognitive levels of knowledge, operation, andproblem solving/design in three content areas: knowledge and attitudes,programming, and computer applications. The eight applications areas are:
Word processingDatabase managementLab instrumentationTelecommunications
GraphicsMusic generationSpreadsheetsModels and simulations
Students' attitudes were assessed on subjects such as computers'importance in society and in the workplace; computing opportunities inschool; relevance of computer instruction to future success; and use ofcomputers outside the school curriculum.
3.2.5 Literature
Grade 11/age 17 students' knowledge of literature was assessed by NAEPin 1985-86 as part of the Foundations of Literacy Project, funded by the
17
24

National Endowment for the Humanities under a grant to the EducationalExcellence Network, Columbia University. Although NAEP conducted previousassessments of literature in 1970-71 and 1979-80, none of the items used inthose assessments are common to the items used in 1985-86.
Achievement items were developed to assess knowledge within fourliterary genres:
Novels, short stories, and playsMyths, epics, and biblical characters and storiesPoetryNonfiction
Students were also asked to respond to items about their experienceswith literature in school and outside of school.
3.2.6 U.S. Histcry
Grade 11/age 17 students' knowledge of U.S. history was assessed byNAEP for the first time in 1985-86, as part of the Foundations of LiteracyProject, funded by the National Endowment for the Humanities under a grantto the Educational Excellence Network, Columbia University. Achievementitems were developed to assess knowledge of six historical time periods:
Exploration and colonization to 1763The Revolutionary War and the New Republic, 1763-1815Nationhood, Sectionalism, and the Civil War, 1815-1877Territorial expansion, the rise of modern America, andWorld War I, 1877-1920The Great Depression, the New Deal, and World War II,1920-1945Post-World War II, 1945 to present
Students were also asked to respond to items about their school studiesand activities in various areas of U.S. history.
3.2.7 Common Background
In addition to learning area achievement and attitude items, eachstudent was asked to respond to general background items concerningsubjects such as materials in the home, languages spoken, levels ofparents' education, hours spent watching television, and after-schoolactivities.
At grade 3/age 9 the common background questions were read aloud tostudents by the exercise administrator; this took fifteen minutes ofLssessment time. At the other two grade/ages, students were given sixminutes to complete the common background questions. Only the firstquestion, regarding student ethnicity, was read aloud. Students read andcompleted the remaining questions themselves.
18

The set of common background items differed slightly for eachgrade/age, but ithin each grade/age the same set of background items wasused for every student.
3.3 ASSEMBLING ITEMS INTO ASSESSMENT INSTRUMENTS
In conducting its first NAEP assessment in 1983-84, Educational TestingService incorporated significant changes in the design of the assessmentinstruments (see A New Design for a New Era by Messick, Beaton, and Lord,1983). The new design, with some modifications, was used again in the1985-86 assessment and is described in the following paragraphs.
The approach used prior to 1983-84 divided the entire pool of itemsdesignated for a given age group into a number of distinct sets, each ofwhich would take a student about three-quarters rf an hour to com)lete.Since no student was administered more than one set of items, this simplematrix design allowed the calculation of measure of relation among itemswithin the same set but not among items in different sets.
To allow the study of the interrelationships among all items within alearning area, ETS assigned items to students by means of a BalancedIncomplete Block (BIB) design with spiralled administration. Items withina learning area were assembled into sixteen-minute blocks (thirteen minutesfor grade 3/age 9), each block comprising approximately two minutes ofattitude items and approximately fourteen minutes (eleven minutes for grade3/age 9) of achievement items. Each student was administered a bookletcontaining three learning area blocks and a block of common backgrounditems, for a total testing time of approximately 54 minutes.
The balanced part of this method assigns blocks to booklets in such away that each learning area block appears in the same number of bookletsand each pair of blocks within a learning area appears in at least onebooklet. Such a design generates a large number of different booklets.
The incomplete part of the method refers to the fact that no individualreceives all items, thus yielding incomplete data for the respondents.
The spiralling part of the method cycles the order of booklets foradministration so that typically no two students in any assessment sessionin a school, and at most only a few students in schools with multiplesessions, receive the same booklet. Spiralling thus reduces schoolclustering effects (see Chapter 4) and results in more efficient sampling.
To permit the calculation of correlations among items between learningareas, a design was formulated to provide for systematic pair ng of blocksbetween learning areas, allowing selected items in each area to be linkedto items in each of the other areas.
19 26

3.3.1 Assembling Items into Blocks
The first step in assembling assessment instruments was the grouping ofitems from each learning area into units called "blocks".
Blocks were created from the item pool f9r each learning area withineach grade/age. An item was selected to be placed in a block based on thetime required to complete the item. More blocks were assigned for math andscience at successive grade/age levels because of the increasing range ofcoursework in those areas as grades advance.
Each resulting learning area block contained approximately fourteenminutes of achievement items (eleven minutes for grade 3/age 9) and twominutes of attitude items. Each block was given a unique identificationnumber consisting of cohort age (9, 13, or 17), learning area initial (Mfor mathematics, R for reading, etc.), and sequence number (1 through 11).
Common background items were grouped into one block for each grade/age.
The resulting total of blocks and corresponding block identificationnumbe.s for each grade/age are presented in Tables 3-2, 3-3, and 3-4 at theend or the chapter. Six reading blocks, two mathematics blocks, and twoscience blocks were common to both grade 7/age 13 and grade 11/age 17.
3.3.2 Assembling Blocks into Booklets
The second step in assembling assessment instruments was the groupingof learning area blocks and common background blocks into booklets.
This assembly resulted in 51 different booklets for grade 3/age 9; 67different booklets for grade 7/age 13; and 92 different booklets for grade11/age 17. Each booklet for a given grade/age contained three learningarea blocks and the appropriate common background block.
The learning area blocks used in each booklet for the three grade/agesare shown in Tables 3-5, 3-6, and 3-7 at the end of the chapter.
Methods of booklet assembly for each learning area are described in thefollowing paragraphs.
Mathematics, Science, Reading, and Computer Competence
Blocks for these learning areas were assigned to booklets in such a waythat, for a given grade/age, each learning area block appeared in the samenumber of booklets and each pair of blocks within a learning area appearedin at least one booklet.
Systematic and judicious pairing of certain blocks of items betweenlearning areas was performed to permit selected items in each area to belinked to items in the other three areas. For example, at grade 3/age 9,where there were six reading blocks and seven mathematics blocks, the totalpossible block pairs between those learning areas was 42. Fifteen of those
20
2/

pairings were achieved through the booklet design. Table 3-1 presents theachieved pairings of blocks across all learning areas for each grade/age.
Table 3-1
Potential and Achieved Black Pairings Across Learning Areasby Grade/Age
GRADE 3/AGE 9 GRADE 7/AGE 13 GRADE 11/AGE 17PAIRINGS PAIRINGS PAIRINGS
LEARNING AREAS Potential Achieved Potential Achieved Potential Achieved
Reading-Mathematics 42 15 54 11 66 12
Reading-Science 42 15 54 11 66 14
Reading-Computer 18 12 36 20 35 28
Mathematics-Science 49 18 81 18 121 28
Mathematics-Computer 21 9 54 11 66 14
Science-Computer 21 9 54 11 66 12
Literature and U.S. History
Four special booklets were created for the administration of literatureand U.S. history items to grade 11/age 17 students. Each of these booklets(numbered 92 through 95) contained one of the four literature blocks; oneof the four U.S. history blocks; reading block 13R4; and the grade 11/age17 common background block. Reading block 13R4, which is also used inother booklets, was included to permit correlations between reading abilityand literature and history achievement.
3.3.3 Spiralling and Bundling Assessment Booklets
The order of the booklets for each grade/age was spiralled, or cycledfor administration in such a way that, typically, no two students in anyone assessment session received the same booklet. Booklets were packagedtogether in bundles of 29. (Note: Booklets 1 through 5 were not includedin the bvndling method; they were used only in "bridge" assessments,discussed in Section 3.4.) A bundle size of 29 accommodated the number ofstudents in a typical assessment session plus an allowance for additionalstudents. The bundle size also ensured that each booklet would appearequally often in each position of a bundle, which improved the chance thateach booklet would be used the same number of times throughout theassessment.
21
28

For grade 3/age 9, 46 booklets numbered 6 through 51 were bundled asfollows:
Bundle #1 contained booklets 6 through 34Bundle #2 contained booklets 35 through 51, then 6 through 17Bundle #3 contained booklets 18 through 46Bundle #4 contained booklets 47 through 51, then 6 through 29
This process continued through 46 bundles, at which point booklet 6 wasagain the first booklet in the bundle, and another 46-bundle cycle wasstarted. Within a cycle, every booklet appeared exactly once in each ofthe 29 bundle positions.
For grade 7/age 13, 62 booklets numbered 6 through 67 were bundled inthe same manner. The cycle contained 62 different bundles. Again, withina cycle, every booklet appeared exactly once in each of the 29 bundlepositions.
The bundling procedure differed slightly for grade 11/age 17 in orderto achieve a larger sample size for the assessment of literature and U. S.history. The four literature and U.S. history booklets, numbered 92through 95, were included seven times more often than the other booklets inthe bundling cycle. Booklets 92 through 95 were placed as evenly aspossible among the other 86 booklets, numbered 6 through 91. Note theappearance of booklets 92 through 95 at the beginning of the first bundle:
6 7 8 92 9 10 11 93 12 13 14 94 15 16 17 95 18 19 20 92 21 22 23 93...
The grade 11/age 17 cycle contained 114 different bundles. Within acycle, booklets 6 through 91 appeared exactly once in each of the 29 bundlepositions; booklets 92 through 95 appeared exactly seven times.
The bundling cycle was repeated until enough booklets had been bundledto satisfy the spiral sample sizes targeted for each grade/age, listed inTable 3-8 at the end of the chapter.
3.4 BRIDGE ASSESSMENT INSTRUMENTS (Booklets 1-5)
At each grade/age, booklets 1 to 5 are "bridge" instruments, used tomeasure the effects of changes in
Student age definition (from calendar year to school year)Time of testing (from a schedule that is staggered acrossfall, winter, and spring to a schedule that tests in springonly)
Mode of administration (from administrations In whichstudents have items read to them from a tape recorder toadministrations in which students read items on their own)
22
29

These bridge instruments are so called because they build a bridgebetween the old and new methods. Two separate bridge assessments, Bridge Aand Bridge B, were conducted to measure the effects of the three changes.These assessments were conducted at the age level (age 9, age 13, and age17) only; age 17 was not included in one of the bridge assessments.
3.4.1 Change in Age Definition and Time of Testing (Bridge A: Booklets 1-3)
In 1985-86, NAEP changed the age definition and the time of testing for9-year-olds and 13-year-olds. The effects of these changes were measured
by Bridge A.
In previous assessments, 9- and 13-year-olds were defined as those bornduring the appropriate calendar year preceding the assessment; 17-year-oldswere defined as those born between October 1 and September 30 of the
appropriate years preceding the assessment. In the 1985-86 assessment, allthree age levels were defined by the October 1 to September 30 interval,both to attain comparability and to link the birth cohorts more closely toschool entrance age requirements. With the revised age definitions, themodal grades (the grades into which most students of particular ages fall)are now 3, 7, and 11, which are uniformly four years apart.
Each age level had formerly been assessed at a different time duringthe school year: 13-year-olds in October and November, 9-year-olds inJanuary and February, and 17-year-olds in March and April. In 1985-86,NAEP began assessing all students in the spring, to eliminate variation inthe time of testing and to coordinate the assessment with near-completionof the curriculum year.
Booklets 1, 2, and 3 at ages 9 and 13 contain mathematics, science,reading, and common background blocks. The weighted samples of studentswho received each booklet, when combined with the weighted samples ofstudents excluded from participation, are each equivalent to the sample ofthe national student population (see Chapter 4 for more information).
Because computer competence was assessed for the first time in 1985-86,the requirement for bridging in this learning area did not apply. Since
neither age definition nor time of testing was changed for 17-year-olds,those students were not included in the Bridge A assessments.
Bridge A assessments were conducted for 9-year-olds from January 6 toJanuary 31, 1986 and for 13-year-olds from November 4 to December 13, 1985.
3.4.2 Change in Mode of Administration (Bridge B: Booklets 4-5)
Prior to the 1983-84 assessment, items were presented aurally and theirtiming was paced through the use of a tape recorder. The method ofspiralling booklets, introduced in 1983-84, requires administration ofitems by printed page alone.
To permit links between the data from both old and new administrationprocedures, the Bridge B assessment was conducted for ages 9, 13, and 17 in
23
30

the learning areas of mathematics and science. Reading was not included inthis study because a bridge assessment of reading was conducted in 1983-84;computer competence and U.S. history were not included because they werenot assessed under the old procedures; and literature was not includedbecause no links are possible to the data from previous literatureassessments.
Booklets 4 and 5 at each age were used for Bridge B. These bookletscontain mathematics, science and common background blocks. The weightedsamples of students who received each booklet, when combined with theweighted samples of students excluded from participation, are equivalent tothe sample of the national student population (see Chapter 4 for moreinformation).
Bridge B was conducted in separate sessions during the same time periodas the spiral sessions, which were administered from February 17 to May 2,1986.
3.5 QUESTIONNAIRES
In addition to the student assessment booklets, four other instrumentswere administered to collect data about school characteristics, teachers,excluded students and computer coordinators. The methods through whichthese populations were sampled are described in Chapter 4. These fourinstruments, which were designed in the form of questionnaires, aredescribed in the following paragraphs.
3.5.1 The Teacher Questionnaire*
NAEP gathered information on the curricula and teaching methods used byselected teachers in schools in which spiral assessments were administered.The data were provided by teachers who completed a questionnaire whichincluded questions about years of teaching experience, course curricula,use of classroom time, homework assignments, and teaching materials used.
Included in the sample for grade 3/age 9 were teachers of English orlanguage arts; for grade 7/age 13, teachers of English, mathematics, orscience; and for grade 11/age 17, teachers of English, mathematics,science, or U.S. history.
3.5.2 The School Characteristics and Policy Questionnaire
The School Characteristics and Policy Questionnaire was completed bythe school principal or his or her representative for each school includedin the spiral assessment and all bridge assessments. The questionnaire wasused to gather information about school administration, staffing patterns,
*Data not available until Version 2.0
24
31

special programs, subject requirements, and use and availability ofcomputers. Data collected from the School Characteristics and PolicyQuestionnaire can be found in the school files on each data tape.
3.5.3 The Excluded Student Questionnaire*
This questionnaire was completed by school personnel for every studentwho was selected for inclusion in the NAEP sample, but who was unable torespond to items because he or she had limited English languageproficiency, was educable mentally retarded, functionally disabled or hadother difficulties (for example, emotional distress because of a familysituation). The questionnaire was used to gather information about specialeducation, language, and other student programs.
3.5.4 The Computer Coordinator Questionnaire
This questionnaire was completed by the computer coordinator, if therewas one, for each school included in the spiral assessment and the Bridge Bassessments. The questionnaire was used to gather information aboutsubjects aided by computer instruction, computer topics and courses taught,and computer resources available. Data from the Computer CoordinatorQuestionnaire can be found on the school files of each data tape.
3.6 TABULAR SUMMARY OF ASSESSMENT INSTRUMENTS
The tables on the following pages summarize the major characteristicsof the 1985-86 student assessment instruments.
Tables 3-2, 3-3, and 3-4 provide information about item blocks.Included are the numbers of achievement and attitude items in each block,the booklets in which each block appears, and the number of times eachblock was used in booklets.
Tables 3-5, 3-6, and 3-7 show which blocks were contained in eachbooklet. Table 3-8 presents the target sample sizes used to determine therequired numbers of assessment blocks and booklets.
Tables 3-9, 3-10, and 3-11 are matrices showing the number of timeseach block is paired with every other block in the spiral sample.
Tables 3-12, 3-13, and 3-14 show the actual numbers of students whowere administered each spiral block and bridge booklet. These tables 21soinclude corresponding weighted numbers, standard errors, and coefficientsof variation.
*Data not available until Version 2.0
25
32

33
Table 3-2
Block Information, Grade 3/Age 9
BLOCK TYPEBLOCKID
NUMBER OFACHIEVEMENT
ITEMS
NUMBER OFATTITUDEITEMS APPEARS IN BOOKLETS
NUMBER OFOCCURRENCES
Common Background BA9 28 1 through 51 51
Reading 9111 10 11 1 7 12 17 26 37 48 79R2 11 9 2 10 35 38 43 45 48 79R3 10 7 3 10 21 23 26 39 51 79R4 12 4 13 24 25 48 49 51 69R5 13 11 7 32 35 44 47 51 69R6 13 4 14 15 16 26 35 49 6
Mathematics 9Mi 26 0 1 4 11 15 19 24 36 47 89M2 26 0 3 4 11 16 22 28 30 32 89M3 16 3 2 5 13 19 20 22 23 46 89M4 21 7 11 12 29 39 46 50 69M5 17 11 17 21 22 29 31 36 69M6 20 8 9 19 25 28 29 38 69Mi 18 10 14 28 34 36 45 46 6
Science 9S1 18 5 1 5 6 16 20 27 41 47 89S2 25 0 2 5 14 18 39 40 41 44 89S3 20 11 3 4 6 8 9 18 24 37 89S4 14 9 6 12 21 30 40 42 69S5 15 4 8 23 25 27 34 40 69S6 15 4 17 18 27 38 42 50 69S7 14 7 8 31 32 41 42 43 6
Computer 9C1 20 20 10 13 33 34 37 50 6Competence 9C2 19 15 7 9 15 20 33 43 6
9C3 20 13 30 31 33 44 45 49 6
26
34

Table 3-3Block Information, Grade 7/Age 13
BLOCK TYPEBLOCKID
NUMBER OFACHIEVEMENT
ITEMS
NUMBER OFATTITUDEITEMS APPEARS IN BOOKLETS
NUMBER OFOCCURRENCES
Common Background BA13 - 30 1 through 67 67Reading 13RI 12 19 1 6 8 24 26 32 67 7
13R2 10 9 2 18 32 34 36 42 51 7
13R3 13 15 3 6 16 17 20 36 39 7
13R4 14 7 12 19 20 24 34 35 6
13R5 12 6 6 14 30 34 47 60 6
13R6 13 5 14 20 32 46 6
Mathematics 13111 37 14 1 4 13 26 29 44 57 59 8
13M2 37 7 3 4 10 13 37 42 43 50 56 9
13M3 24 8 2 5 7 13 25 33 35 63 8
13M4 29 14 10 28 33 39 40 44 6
13M5 26 17 8 10 25 38 55 59 6
13M6 36 12 29 33 38 46 47 56 6
13M7 39 16 7 17 28 53 56 59 65 7
1314 43 15 22 25 28 29 30 43 6
1311e 41 16 7 38 43 44 48 51 65 7
Science 135I 25 11 1 5 40 49 57 61 62 66 8
13S2 31 9 2 5 11 30 52 54 62 63 8
13S3 27 9 S 4 15 21 37 52 53 61 67 9
13S4 18 9 11 21 31 42 55 66 6
13S5 18 1 15 31 39 46 58 62 6
13S6 18 10 16 31 41 48 49 52 6
1357 18 9 15 35 41 54 60 65 66 7
13Se 18 14 8 11 12 37 41 58 61 7
135e 18 13 21 22 47 49 54 58 6
Computer 13CI 21 21 9 24 45 51 60 64 6
Competence 13C2 20 15 12 16 23 27 45 53 6
13C3 24 4 18 22 26 27 63 64 6
13C4 30 7 9 19 27 46 48 50 6
13C5 20 10 9 14 17 18 23 40 6
13C6 21 12 19 23 36 55 64 67 6
27
35 36

Block InformMoine, "r4ade 11/Age 1,
BLOCK TYPEBLOCKID
NUMBER OFACHIEVEMENT
ITEMS
NUMBER OFATTITUDEITEMS APPEARS IN BOOKLETS
NUMBER OFOCCURRENCES
Common Background BA17 - 49 4 through 95 92
Reading 13111 12 19 34 38 47 50 54 61 89 7
13R2 10 9 14 21 26 28 36 81 89 7
13R3 13 15 13 42 50 81 85 86 90 7
13R4 14 7 7 9 33 61 79 81 88 92 93 94 95 7
13Rs 12 6 24 26 61 62 75 77 85 7
13R6 13 5 7 22 35 51 68 85 89 7
Mat hematics 17M1 35 14 4 10 31 32 36 40 44 57 64 9
17M2 35 14 4 12 14 15 20 30 31 59 76 9
17M3 24 11 5 31 41 43 60 67 68 73 83 9
13M4 29 14 14 15 25 37 53 64 73 87 8
13Ms 26 17 9 11 40 43 45 53 74 76 8
17M6 36 10 16 20 24 25 40 41 72 7
17M7 37 16 9 29 30 32 42 58 72 73 8
17Ma 37 15 6 10 11 34 59 60 72 87 8
17M9 41 20 25 29 36 37 43 46 59 65 8
17Mio 36 10 11 13 20 29 57 64 67 83 8
17Mil 37 11 6 13 32 41 46 76 78 87 8
Science 1751 27 11 5 19 47 71 78 79 82 84 91 9
17S2 32 9 5 8 18 49 57 62 80 91 8
17S3 23 9 4 8 44 45 48 63 68 70 82 9
17S4 20 11 6 16 28 55 56 62 63 71 8
13Ss 18 1 8 17 34 39 56 74 84 86 8
13S6 18 10 12 16 23 39 65 80 82 88 8
17S7 20 17 15 44 48 51 52 55 80 84 8
17Sa 20 13 17 23 51 58 63 67 69 91 8
17S9 20 17 12 18 23 52 58 70 71 86 8
17Sio 20 15 18 19 48 56 69 74 78 88 8
17S11 20 9 37 39 47 49 55 60 69 70 8
28
38

(cthitlaii)
BLOCK TYPEBLOCKID
NUMBER OFACHIEVEMENT
ITEMS
NUMBER OFATTITUDEITEMS APPEARS IN BOOKLETS
NUMBER OFOCCURRENCES
Computer 17C1 23 21 7 21 30 38 65 66 77 7Competence 17C2 21 15 19 27 33 35 42 53 77 717C3 24 4 22 24 27 38 49 52 90 717C4 17 23 10 26 35 45 54 66 90 717Cs 24 20 22 28 33 46 50 66 75 717C6 17 19 17 21 27 54 75 79 83 7U.S. History 17HI 36 25 92
117H2 36 25 93117H3 35 25 94117H4 34 25 951
Literature 171,1 30 42 92 117L2 31 42 93
117L3 30 42 94 117L4 30 42 95
1
3929
40

Table 3-5
Booklet Content, Grade 3/Age 9
BOOKLET BLOCKS BOOKLET BLOCKS
*1) 9R1 9143. 953. 27) 953. 9Ss 9S6*2) 9S2 9R2 9M3 28) 9M6 9M2 9M7*3) 9M2 9S3 9R3 29) 9M4 9M6 9Ms
**4) 9143. 9M2 9S3 30) 9S4 9C3 9M2**5) 953. 9S2 9M3 31) 9S7 9C3 9Ms
6) 9S3 9S4 953. 32) 910 9M2 9S77) 9Rs 9R1 9C2 33) 9C2 9C1 9C38) 9S3 9S7 9Ss 34) 9Ss 9M7 9C1
9) 9C2 9M6 9S3 35) 9R2 9Rs 9R6
10) 9R3 9R2 9C1 36) 9Ms 9M7 9M111) 9M4 9143. 9M2 37) 9C1 9R1 9S312) 9R1 9M4 9S4 38) 9M6 9S6 9R213) 9R4 9C1 9M3 39) 9S2 9R3 9M414) 9S2 9R6 9M7 40) 9Ss 9S2 9S415) 9143. 9C2 9R6 41) 9S7 9S1 9S216) 9M2 9R6 953. 42) 9S4 9S6 9S717) 9S6 9Ms 9R1 43) 9R2 9S7 9C218) 9S6 9S3 9S2 44) SC3 9S2 9Rs
19) 9143. 9M6 9M3 45) 9M7 9C3 9R220) 953. 9C2 9M3 46) 9M7 9M4 9M321) 9Ms 9S4 9R3 47) 9143. 953. 9Rs22) 9M2 9Ms 9M3 48) 9R1 9R2 9R423) 9R3 9Ss 9M3 49) 9R6 9R4 9C324) 9R4 9S3 9143. 50) 9C1 9M4 9S625) 9R4 9S.: 9M6 51) 910 9R4 9R326) 9R6 9R3 9R1
* Booklet used for Bridge A assessment only** Booklet used for Bridge B assessment only
30
41

Table 3-6
Booklet Content, Grade 7/Age 13
BOOKLET BLOCKS BOOKLET BLOCKS
*1) 13R1 13M1 13S1 35) 13R4 13S7 13M3*2) 13S2 13R2 13M3 36) 13C6 13R3 13R2*3) 13M2 13S3 13R3 37) 13S3 13M2 1358
**4) 13M1 13M2 13S3 38) 13Ms 13M6 13M9**5) 13S1 13S2 13M3 39) 13Ss 13M4 13R3
6) 13R3 13R1 13R5 40) 13Cs 13S1 13M47) 13M7 13M9 13M3 41) 13S7 13S6 13S88) 13S8 13Ms 13R1 42) 13R2 13M2 13S49) 13C1 Ms 13C4 43) 13M2 13M8 13M910) 13M4 13M2 13Ms 44) 13M4 13M1 13M911) 13S8 13S2 13S4 45) 13C2 13C1 13R612) 13S8 13C2 13R4 46) 13Ss 13M6 13C413) 13M2 13M1 13M3 47) 13R5 13S9 13M614) 13R6 13R5 13Cs 48) 13C4 13S6 13M915) 13S3 13Ss 13S7 49) 13S6 13S9 13S116) 13R3 13C2 13S6 50) 13C4 13R6 13M217) 13M7 13R3 13Cs 51) 13C1 13R2 13M918) 13Cs 13C3 13R2 52) 13S6 13S3 13S219) 13R4 13C4 13C6 53) 13C2 13S3 13M720) 13R6 13R4 13R3 54) 13S7 13S2 13S921) 13S9 13S4 13S3 55) 13S4 13C6 13Ms22) 13C3 13M8 13S9 56) 13M6 13M7 13M223) 13C6 13Cs 13C2 57) 13M1 13R6 13S124) 13R4 13C1 13R1 58) 13S9 13So 13Ss25) 13Ms 13M8 13M3 59) 13M1 13Ms 13M726) 13M1 13R1 13C3 60) 13R5 13S7 13C127) 13C3 13C4 13C2 61) 13S1 13So 13S328) 13M7 13M4 13M8 62) 13S2 13Si 13Ss29) 13M6 13M8 13M1 63) 13S2 13C3 13M330) 13Ms 13R5 13S2 64) 13C1 13C6 13C331) 13S4 13Ss 13S6 65) 13S7 13M7 13M932) 13R1 13R2 13R6 66) 13S1 13S4 13S733) 13M4 13M6 13M3 67) 13R1 13S3 13C634) 13R2 13R4 13R5
* Booklet used for Bridge A assessment only** Booklet used for Bridge B assessment only
31 42

Table 3-7Booklet Content, Grade 11/Age 17
BOOKLET BLOCKS BOOKLET BLOCKS
1) Not Used 49) 17C3 17S2 17511
2) Not Used 50) 13Ri 13R3 17C5
3) Not Used 51) 17S7 17S8 13R6
*4) 17M1 17M2 17S3 52) 17C3 17Ss 17S7
*5) 1751 17S2 17M3 53) 13M5 13M4 17C2
6) 17S4 171411 17Ma 54) 17C4 17C6 13R1
7) 13R6 13R4 17C1 55) 17S7 17511 17S4
8) 17S3 13S5 17S2 56) 13S5 17S10 17S4
9) 13R4 13M5 17M7 57) 17M1 17S2 17M10
10) 17Ma 17M1 17C4 58) 17M7 17Ss 17S9
11) 13M5 17Mio 17Ma 59) 17M2 17Ma 17M9
12) 17S9 17M2 13S6 60) 17M8 17511 17M3
13) 171411 13R3 17M10 61) 13R1 13Rs 13R4
14) 13R2 13M4 17M2 62) 17S2 17S4 13R5
15) 17M2 17S7 13M4 63) 17S4 1758 17S3
16) 13S6 17S4 17M6 64) 17M10 13M4 17M1
17) 1758 1355 17C6 65) 13S6 17C1 17M9
18) 17S10 1759 17S2 66) 17C4 17C1 17C5
19) 1751 17Sio 17C2 67) 1758 17Mio 17M3
20) 17M2 17M6 17M10 68) 17S3 13R6 17M3
21) 17C6 13R2 17C1 69) 17511 17S10 17S8
22) 17C5 17C3 13R6 70) 17S3 17511 17S9
23) 17S9 13S6 1758 71) 17S9 17S4 1751
24) 17M6 13R5 17C3 72) 17h8 17M7 17M6
25) 17M6 13M4 17M9 73) 13M4 17M7 17M3
26) 13115 13R2 17C4 74) 1355 13Ms 17S10
27) 17C2 17C6 17C3 75) 17C6 17Cs 138.5
28) 13R2 17C5 17S4 76) 171411 17M2 13M5
29) 17M7 17M10 17M9 77) 17C1 17C2 13R5
30) 17M7 17M2 17C1 78) 17M11 1751 17S10
31) 17M1 17M2 17M3 79) 13R4 17C6 1751
32) 17M1 17M7 17M11 80) 17S2 13S6 17S7
33) 17C5 17C2 13R4 81) 13R3 13R4 13R2
34) 17M8 13R1 135s 82) 13S6 17S3 1751
35) 17C2 17C4 13R6 83) 17M10 17C6 17M3
36) 17M1 13R2 17M9 84) 1751 17S7 1355
37) 17511 13M4 17M9 85) 13115 13R6 13R3
38) 17C1 17C3 13R1 86) 1355 17S9 13R3
39) 17511 1355 13S6 87) 13M4 17M8 17M11
40) 13M5 17M6 17M1 88) 17S10 13S6 13R4
41) 17M6 17M11 17M3 89) 13R6 13R1 13R2
42) 13R3 17C2 17M7 90) 17C4 17C3 13R3
43) 13M5 17M9 17M3 91) 17S2 1751 1758
44) 17M1 17S7 17S3 92) 13R4 17H1 17L1
45) 17S3 17C4 13M5 93) 17H2 13R4 .7L2
46) 17C5 171411 17M9 94) 17L3 13R4 17H3
47) 1751 17511 13R1 95) 17L4 17H4 13R4
48) 17S7 17S3 17Sio
*Booklet used for Bridge B assessment only
32
43

Table 3-8
Target Sample Sizes by Grade /Ages
Grade 3/Age 9 Grade 7/Age 13 Grade 11/Age 17 Total
Spiral 19,933 26,867 37,267 10,8002 94,867
Bridge 10,000 10,000 4,000 --2
24,000
Total 29,933 36,867 41,267 10,8002 118,867
1
Actual sample sizes are given in Table 4-2 in Chapter 42Literature and U.S. history sample
3344

Table 3-9
Block-to-Block Occurrence Matrix, Grade 3/Age 9Spiral Booklets
R1R2R3R4R5R6M1M2M3M4M5M6M7SIS2S3S4S5S6S7C1C2C3
R1 611111 1 1 1 1 1 1 1
R2 6 1 1 1 1 1 1 1 1 1 1 1R3 6 1 1 1 1 1 1 1 1 1 1R4 6 1 1 1 1 1 1 1 1 1R5 6 1 1 1 1 1 1 1 1R6 6 1 1 1 I 1 1 1Mi 6 1 1 1 1 1 1 1 1 1M2 6 1 1 1 1 1 1 1 1 1M3 6 1 1 1 1 1 1 1 1M9 6 1 1 1 1 1 1 1M5 6 1 1 1 1 1 1Ms 6 1 1 1 1 1M7 6 1 1 1 1
Si 6 1 1 1 1 1 1 1S2 6 1 1 1 1 1 1S3 6 1 1 1 1 1 1S4 6 1 1 1 1S5 6 1 1 1
S6 6 1 1
$7 6 1 1C7 6 1 1C2 6 1C3 6
34

Table 3-10
Block-to-Block Occurrence Matrix, Grade 7/Age 13Spiral Booklets
111112R3R4115116M1M2M3M4M5M6M7M8M9S1S2S3S4S5S6S7S8S9C1C2C3C4C5C6
Ri 6 1 1 1 1 1 1 1 1 1 1 1 1
R2 6 1 1 1 1 1 1 1 1 1 1 1
R3 6 1 1 1 1 1 1 1 1 1 1
R4 6 1 1 1 1 1 1 1 1 1
R5 6 1 1 1 1 1 1 1 1
Rs 6 1 1 1 11 11MI 6 1 1 1 1 1 1 1 1 1 1
M2 7 1 1 1 1 1 1 1 1 1 1 1
M3 6 1 1 1 1 1 1 1 1 1
M4 6 1 1 1 1 1 1 1 1
M5 6 1 1 1 1 1 1 1
M6 6 1 1 1 1 1 1
M7 7 1 2 1 1 1 1
M8 6 1 1 1 1
M9 7 1 1 1 1
Si 6 1 1 1 1 1 1 1 1 1
S2 6 1 1 1 1 1 1 1 1
S3 7 1 1 1 1 2 1 1 1
S4 6 1 1 1 1 1 1
S5 6 1 1 1 1 1
Ss 6 1 1 1 1 1
S7 7 1 1 1
S8 7 1 1
S9 6 1
Ci 6 1 1 1 1 1
C2 6 1 1 1 1
C3 6 1 1 1
C4 6 1 1
C5 6 1
C6 6
35
46

Table 3-11
Block-to-Block Occurrence Matrix, Grade 11/Age 17Spiral Booklets*
RiR2R3RaRsRsIiM2M3MaMsMsM7MaMsM;M:SiSzS3SaSsS6S7SeSsS;S:CiCzC3CaCsCs
Ri 7 1 1 1 1 1 1 1 1 1 1 1 1 1 1Rz 7 1 1 1 1 1 1 1 1 1 1 1 1 1R3 7 1 1 1 1 1 1 1 1 1 1 1 1R4 7 1 1 1 1 1 1 1 11 11R5 7 1 1 1 1 1 1 1 1 1 1R6 7 1 1 1 1 1 1 1 1 1MI 8 1 1 1 1 1 1 1 1 2 1 1 1 1 1M2 8 1 2 1 1 1 1 1 1 1 1 1 1 1M3 8 1 1 1 1 1 1 2 1 1 1 1 1M4 8 1 1 1 1 2 1 1 1 1 1M5 8 1 1 1 1 1 1 1 1 1 1 1M6 7 1 1 1 1 1 1 1 1M7 8 1 1 1 1 1 1 1 1M8 8 1 1 2 1 1 1 1M9 8 1 1 1 1 1 1M; 8 1 1 1 1M: 8 1 1 1 1Si 8 1 1 1 1 1 1 1 1 2 1 1 1Sz 7 1 1 1 1 1 1 1 1 1 1S3 8 1 1 1 2 1 1 1 1 1Sa 8 1 1 1 1 1 1 1 1S5 8 1 1 1 1 2 1 1S6 8 1 1 2 1 1 1S7 8 1 1 1 1 1S8 8 2 1 1 1Ss 8 1 1 1S; 8 1 1S: 8 1Ci 7 1 1 1 1 1C2
7 1 1 1 1C3
7 1 1 1C4
7 1 1C5 7 1C6
7
*Semicolon (;) represents 10; colon (:) represents 11.
36
en

Table 3-12
Number of Students Administered Each Spiral Block and Bridge BookletGrade 3/Age 9
Spiral Blocks (Grade 3/Age 9)(Booklets 6-51)
Block Total Weighted NStandard Error(of Weighted N)
Coefficientof Variation
9R1 2778 519199 5066 1.09R2 2778 514795 7812 1.59R3 2748 504935 5666 1.19R4 2771 513876 5933 1.29R5 2779 518050 6879 1.39R6 2788 520851 5532 1.19M1 2782 520673 6204 1.2'M2 27'6 1 6: :4
9M3 2754 513679 9010 1.89M4 2762 501816 6684 1.39M5 2742 505693 9042 1.89M6 2764 507773 6551 1.S9M7 2796 518787 6318 1.29S1 2800 519771 6540 1.39S2 2796 513036 7704 1.59S3 2774 517181 6453 .2
9S4 2774 512470 6152 1.29S5 2783 506764 7474 1.59S6 2789 510028 6170 1.29S7 2810 515453 7194 1.49C1 2770 502409 7700 1.59C2 2754 509985 6458 1.3
1.59C3 2773 513073 7548TotalSpiral 21287 3931992 18966 0.5
Briu e Booklets A e 9
Booklet Total Weighted NStancaFiarSrror(of Weighted N)
Coefficientof Variation
1
--7-2315 3098639 16593 0.52361 3104555 20282 0.7
3 2256 3112834 14390 0.54 1994 3151352 20051 0.65 2048 3121844 26874 0.9
37
48

Table 3-13
Number of Students Administered Each Spiral Block and Bridge BookletGrade 7/Age 13
Spiral Blocks (Grade 7/Age 13)(Booklets 6-67)
Block Total Weighted NStandard Error(of Weighted N)
Coefficientof Variation
13R1 2645 387896 5534 1.4
13R2 2688 395605 7477 1.9
13R3 2680 385111 6283 1.6
13R4 2695 395021 7079 1.8
13R5 2679 389566 5566 1.4
13R6 2692 394547 6344 1.6
13M1 2678 387547 4521 1.2
13M2 3130 452148 6003 1.3
13M3 2661 392482 5393 1.4
13M4 2723 393767 6091 1.5
13M; 2696 381586 5257 1.4
13M6 2695 386437 6302 1.6
13M7 3092 443077 5663 1.3
13M8 2697 390203 6705 1.7
13M9 3125 452549 7000 13-1351 2695 389658 6989 1.8
13S2 2660 387668 6189 1.6
13S3 3125 451104 4213 0.9
13S4 2682 389091 4545 1.2
13S5 2670 383151 3623 0.9
13S6 2670 392571 5429 1.4
13S7 3109 445846 6180 1.4
13S8 3115 447356 6336 1.4
13S9 2676 381161 6605 1.7
13C1 2665 389025 4492 1.2
13C2 2672 387848 5357 1.4
13C3 2667 390099 4732 1.2
13C4 2677 388399 5812 1.5
13C5 2688 392545 8021 2.0
13C6 2657 380658 4698 1.2
TotalSpiral 27668 4007907 16317 0.4
Bridge Booklets
Weighted N
(Age 13)Standard Error(of Weighted N)
Coefficientof Variation
0./----Booklet Total
1 2075- 2937402 21332
2 2054 2950983 24449 0.8
3 2071 2943837 211822 0.7--4 2032 3008026 22738 0.8
5 2146 3028806 15282 0.5
38
49

Table 3-14
Number of Students Administered Each Spiral Block and Bridge BookletGrade 11/Age 17
P iral Blocks (Grade 11/A e 17)(Booklets 6-95)
Block Total Weighted NStandard Error(of Weighted N)
Coefficientof Variation
13R1 2449 252747 4142 1.6
13R2 2428 253214 4501 1.8
-33TO 2395 250738 3766 1.5
13R4 12192 1264606 6608 0.513R5 2436 254622 3928 1.5
13R6 2417 247014 3840 1.617M1 2823 295171 4062 1.417M2 2795 289562 49E 1.7
-17M3 2782 290965 5121 1.813M4 2812 291714 2968 1.013M5 2788 290699 4275 ITS17M6 2443 252921 4624 1.817M7 2786 294005 3644 1.2
17M8 78. 29 41/ 1.4
1 M9 2798 29 414 ..)4 9
--17ff8
3872
1.9
,7M10 8 291233 Lf------1.317M11 2780 --191096
1751 2747 284402 5606 2,017S2 2421 250694 3077 1.2
17S3 2828 296071290-42-
53694467410 5
1.81.51 S4 2835
13S5 2771 286892 1.413S6 2771 288266 4483 1.6
-1757 2814 -390561 ZIT 1.41.21.7
1.3
1758 28182785
293055293243--286128
35664886373817S9
17S10 275117S11 2851 299574 6761 2.317C1 2433 253647 3409 1.3
17C2 2457 254457 3547 1.417C3 2444 252893 375/ 1.517C4 2438 254840 3514 1.417C5 2427 254089 3760 1.517C6 2424 252106 2431
3675--1.01.517H1 2441 252282
-17H2 2428 251539 2892 1.1
17H3 2459 254264254201
30372653
1.21.017H4 2446
39 50

Table 3-17(continued)
Spiral Blocks (Grade 11/A e 17) (Booklets 6-95)
Block Total Weighted NStandard Error(of Weighted N)
Coefficientof Variation
17L1
17t221T22441
8251539252282 3675 1.5
2892 1.
17L3 2459 254264 3037 1.2
17L4 2446 254201 2653 1.0
TotalSpiral 39753 4136965 13025 0.3
Bridge Booklets (Age 17)
Booklet Total Weighted NStandard Error(of Weighted N)
Coefficientof Variation
4
---3----1934 3240017 13772
101590.40.31934 3252949
40 51

Chapter 4
SAMPLE SELECTION
52

Chapter 4: SAMPLE SELECTION'
4.1 INTRODUCTION
This chapter describes the special features of the 1985-86 sampledesign and the methods used by Westat, Inc., the survey subcontractor, toselect the sample. Also discussed in this chapter are the sampling weightsprovided by Westat and how they were derived. A discussion of how to usethese sampling weights can be found in Chapter 7.
4.2 GRADE/ACE DEFINITION
As in the 1983-84 assessment, the 1985-86 assessment sampled studentsby grade as well as age. This sampling enhances the utility of NAEP data,since school districts traditionally delineate groups of students by graderather than age. However, the 1985-86 main sample uses a differentdefinition of the ages 9 and 13 than that of prior assessments and assessesthese students at a different time of year. In past assessments, 9-year-olds were defined on a calendar year basis and were assessed in thewintertime; 13-year-olds were also defined on a calendar year basis andwere assessed in the fall of the school year; 17-year-olds were defined onan October through September basis and were assessed in the spring of theschool year.
In 1985-86, uniform age definitions and uniform administration dateswere adopted for the main assessment. The students of a particular agewere defined as the students born between October 1 and September 30 of theappropriate years preceding the assessment. All ages were assessed in thespring. This modification of the previous age definitions (for ages 9 and13) had the effect of changing the modal grades to 3, 7, and 11 from 4, 8,and 11, the grades assessed in the past. This change resulted in the needfor bridge studies, as detailed below.
The 1985-86 main assessment includes three student cohorts: studentswho were either in the third grade or 9 years old; students who were eitherin the seTrjiTE-grade or 13 years olaT and students who were either in theeleventh grade or 17 years old. The main assessment represents twooverlapping samFles. The first sample represents students of specifiedgrades (who could be of any age). The second sample represents students ofspecified ages (who could be of any grade). For the age 17 students, this
'Data collected from the Teacher Questionnaire and the Excluded StudentQuestionnaire, and sampling weights for schools, excluded students, andteachers associated with students are not contained on the Version 1.0 datatapes, but will be included in Version 2.0.
43
53

sample is comparable to samples from previous NAEP assessments. Because of
the changes in age definitions for age 9 and age 13, the samples for those
ages are not direct' comparable to previous NAEP assessments.
4.3 BRIDGE SAMPLES
To determine the possible effects of changes in age definitions as well
as in mode of administration (elimination of the audiotape used for pacingthe exercises), two bridge studies were conducted. The term "bridge"describes the purpose of these studies, which is to provide the statisticallinkage between the 1985-86 data and data from previous assessments. The
two bridge studies, which were conducted at age levels only, are as
follows:
Bridge A: A bridge study to measure the effect of changingthe age de definitions and the time of year in which the assessment
data were collected. Since these changes affected only ap?s 9 and13, a bridge sample was not necessary for age 17. Since trenddata have been traditionally collected only by age, grade samplingwas unnecessary.
This bridge study addresses the learning areas of reading,mathematics, and science and consists of three booklets each forages 9 and 13. Within each booklet, mathematics and scienceblocks were administered using a tape recorder; reading blockswere administered by pencil and paper only. The respondents to
any one of the three booklets assigned to a given age comprise arepresentative sample of the population of all students of thatage. Since, for this bridge study, the traditional agedefinitions were used, each of these samples is comparable tosamples from previous NAEP assessments.
Bridge B: A bridge study to measure the effect of changingfrom tape-recorded to printed administration. The new definitions
of age and time of assessment were used. These bridge sampleswere collected at all three age levels for the learning areas of
science and mathematics. At all ages, two bridge book1ets were
administered. The respondents to any one of the two bridgebooklets assigned to a given age constitute a representativesample of the population of all students of that age, where thenew age definition is being used. Each of these samples iscomparable to the corresponding age sample from the main (spiral)
assessment.
The full 1985-86 sample is summarized in Section 4.6.
4.4 SAMPLE DESIGN
The sample of students for the 1985-86 NAEP assessment was selectedusing a complex multistage sample design involving the sampling of students
44
54
from selected schools within 94 selected geographic regions, called primarysampling units, from across the United States. The sample design will bedescribed in detail in a technical report ti.. '...;e issued in 1987 by Westat,Inc., the firm subcontracted by ETS to select the sample. This sectionwill provide as overview of the design.
4.4.1 Primary Sampling Units
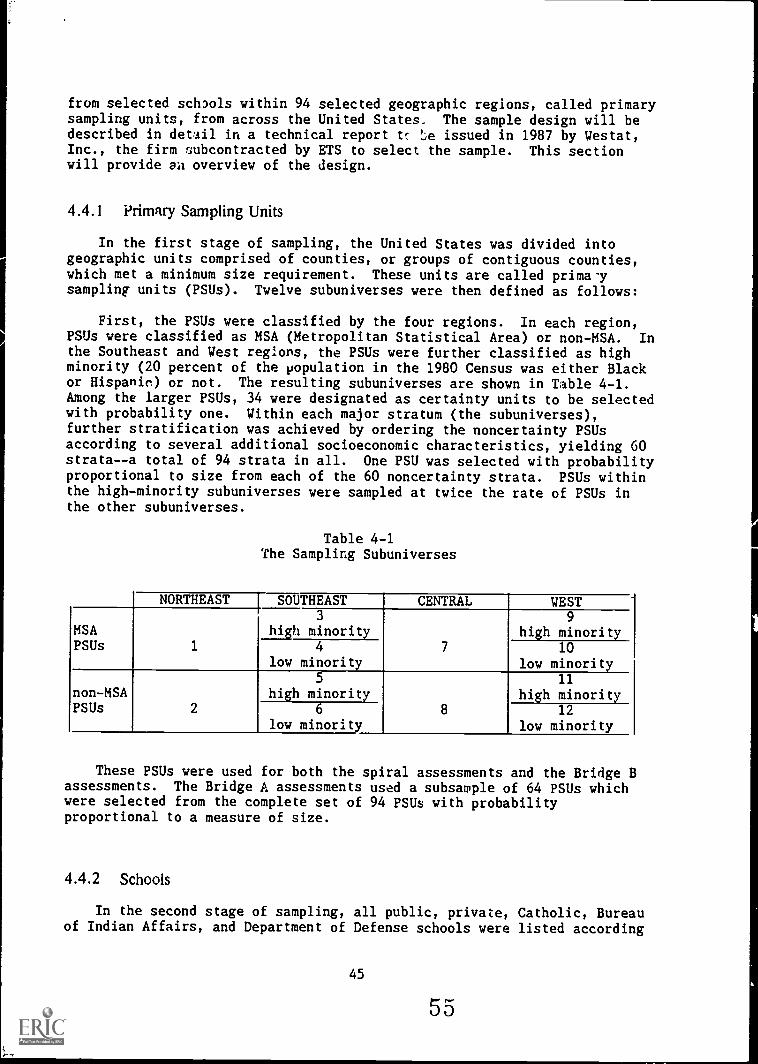
In the first stage of sampling, the United States was divided intogeographic units comprised of counties, or groups of contiguous counties,which met a minimum size requirement. These units are called primarysampling units (PSUs). Twelve subuniverses were then defined as follows:
First, the PSUs were classified by the four regions. In each region,PSUs were classified as MSA (Metropolitan Statistical Area) or non-MSA. Inthe Southeast and West regions, the PSUs were further classified as highminority (20 percent of the population in the 1980 Census was either Blackor Hispanic) or not. The resulting subuniverses are shown in Table 4-1.Among the larger PSUs, 34 were designated as certainty units to be selectedwith probability one. Within each major stratum (the subuniverses),further stratification was achieved by ordering the noncertainty PSUsaccording to several additional socioeconomic characteristics, yielding 60strata--a total of 94 strata in all. One PSU was selected with probabilityproportional to size from each of the 60 noncertainty strata. PSUs withinthe high-minority subuniverses were sampled at twice the rate of PSUs inthe other subuniverses.
Table 4-1The Sampling Subuniverses
NORTHEAST SOUTHEAST CENTRAL WEST
MSAPSUs 1
3
high minority7
9
high minority4
low minority10
low minority11
high minoritynon-MSAPSUs 2
5
high minority86
low minority12
low minority
These PSUs were used for both the spiral assessments and the Bridge Bassessments. The Bridge A assessments used a subsample of 64 PSUs whichwere selected from the complete set of 94 PSUs with probabilityproportional to a measure of size.
4.4.2 Schools
In the second stage of sampling, all public, private, Catholic, Bureauof Indian Affairs, and Department of Defense schools were listed according
45
55

to the three grade/age groups within each of the 94 PSUs. High-minorityschools were oversampled to ensure adequate sample sizes, thereby enhancingthe reliability of estimates.
Schools within each PSU were selected (without replacement) withprobabilities proportional to assigned measures of size. Roughly equalmeasures of size were assigned to schools containing estimates ofgrade /age- eligible students ranging from 20 to 150 (for grade 3/age 9), or20 to 200 (for grade 7/age 13 and grade 11/age 17). Schools above theindicated maximum size were selected with probabilities proportional to thenumber of grade/age-eligible students. Schools with less than 20 estimatedgrade/age eligibles were assigned considerably lower measures of size,since they had higher per-student administrative costs.
4.4.3 Assigning Sessions to Schools, by Type
The assignment of sessions to schools served as the third stage ofsampling. This assignment was done separately by the three types ofsessions, designated spiral, Bridge A, and Bridge B, which representseparate samples of the student population.
The Bridge A assessments involved three distinct booklets each for ages9 and 13 (using the old definitions). Schools to participate in thisassessment (conducted in the fall and winter) were selected from thesubsample of 64 PSUs which had been designated as the Bridge A PSUs. Eachof the three distinct booklets was to be administered once within each ofthe PSUs. To avoid the possibility that a particular bridge session mightbe assigned to a school with only one or very few eligibles, small schoolswere clustered with other schools in the same PSU to form clusters of aspecified minimum number of eligibles. Bridge sessions were then assignedwithin each PSU by selecting a systematic sample of three school clustersat each age with probability proportional to the estimated number of ageeligibles within the school (or school cluster).
Schools which were selected for the Bridge A assessment of a grade/ageclass were excluded from the spiral and Bridge B assessments of thegrade/age class.
All remaining selected schools were used for the spiral and Bridge Bassessments. For the Bridge B assessments, there were two distinctbooklets at each age class, each of which was administered once within eachof the 94 PSUs. A systematic sample of two schools within each PSU wasselected for the Bridge B assessment. After this selection, spiralsessions were assigned to schools at a rate approximately proportional tothe estimated number of eligible students who would be available afteraccounting for the initial assignment of the Bridge B sessions. With theexception of the smallest schools selected for the Bridge B assessment,each school selected for the combined spiral and Bridge B assessments wasallocated at least one spiral assessment.
46 SG

4.4.4 Sampling Students
In the fourth stage of sampling, a consolidated list of allgrade-eligible and age-eligible students was established for each selectedschool. A systematic selection of eligible students was made and, for thespring assessment, students were assigned by Westat district supervisors tospiral or Bridge B sessions, depending on whether the assessment was to beadministered by pencil and paper or tape recorder.
4.4.5 Sampling Excluded Students
Some students selected for the sample were deemed unassessable by theschool authorities because they had limited English language proficiency,were judged as being educable mentally retarded, were functionallydisabled, or had other difficulties (for example, emotional distressbecause of a family situation). In these cases, an Excluded StudentQuestionnaire was filled out by the school staff listing the reason forexcluding the student and providing some background information.
4.4.6 Sampling Teachers
The Teacher Questionnaire was administered to the teachers of asubgroup of students sampled for spiral sessions. The purpose of thissample was to estimate the number (proportion) of students whose teachershad various attributes, not to estimate the attributes of the teacherpopulation. Therefore, statements such as, "20 percent of students haveteachers who have..." are appropriate in discussing Teacher Questionnairedata, but statements such as, "20 percent of teachers have..." are not. Thenumber of teachers sampled was equal to the number of spiral sessionsconducted in the school. The teachers selected taught certain subjectareas. One subject was designated for each spiral assessment in theschool. Therefore, if a school had two spiral assessments, two subjectswere designated, perhaps the same or different subjects. For grade 3/age9, the subject was always English or language arts. For grade 7/age 13 thesubject(s) could have been either English/language arts, mathematics, orscience. For grade 11/age 17, the subject(s) could have been eitherEnglish/language arts, U.S. history, mathematics, or science.
For each spiral session, a subsample of students was selectedand the school coordinator was asked to identify, for each selectedstudent, the teacher in the designated subject area who was teaching thestudent. These instructors completed a Teacher Questionnaire. Please notethat since a number of students may have had the same teacher, and someteachers did not complete the questionnaire, the number of students in thesubsample for whom teacher information is available is greater than thenumber of teachers who completed questionnaires in a given school.
47
57

4.4.7 Sampling School Characteristics and Computer Coordinators
The School Characteristics and Policy Questionnaire was distributed inevery sampled school. It was mailed to the school by Westat prior to theassessment and picked up by the Westat supervisor, then returned to ETS.
In every school, for all three grade/age levels, a specialquestionnaire was also given to the school's computer coordinator, if theschool had one.
The School Characteristics and Policy and Computer Coordinatorquestionnaires are described in Chapter 3.
A Principal Questionnaire, distributed to each sampled school by Westatprior to the assessment, was used by Westat to determine an estimate ofgrade/age-eligible students. Some of the data from the PrincipalQuestionnaire has been retained on the data tapes. See Chapter 6 for anexplanation of the Principal Questionnaire data variables.
4.5 SAMPLE WEIGHTS
NAEP uses differential sampling rates. Some subpopulations aredeliberately oversampled to obtain larger samples of respondents in variousreporting groups. As a result of this oversampling, these subpopulations,which may have different characteristics from the rest of the population,are overrepresented in the sample. Analyses which ignore thisoverrepresentation may be misleading since these subpopulations haveunwarranted impact on the results. To account for these differentialprcbabilities of selection, as well as other aspects of the sample andpopulation being surveyed, sampling weights are supplied on the data filesso that each respondent will be appropriately represented in data analysis.These weights should be used for all analyses, whether exploratory orconfii3atory.
Information about what weights are provided on the public-use datatapes and how they should be used appears in Section 7.2 of Chapter 7. Theremainder of the current section will be devoted to a description of theprocedures used by NAEP to derive the sampling weights for the assessedstudents. Readers who do not need detailed technical information about thederivation of weights may disregard Sections 4.5.1 through 4.5.6.
The weight assigned to a particular student reflects two majorcomponents of the sample design and the population being surveyed. Thefirst component, the student's base weight, reflects the probability ofselection of the student for participation in a particular type ofassessment session (i.e., a particular bridge assessment session or aspiral session). The second component reflects adjustments to the baseweight to account for nonresponse and to ensure that estimates, based onthese sampling weights, of certain subpopulation totals correspond tovalues reliably known from external (e.g., Census) sources. This latterform of adjustment is known as post-stratification and can reduce the biasresulting from noncoverage as well as nonresponse and may, additionally,reduce sampling variability.
48
58

4.5.1 Base Weight
The base weight assigned to a student is the reciprocal of theprobability that the student was invited to a particular type of assessmentsession, that is, a spiral session or a particular bridge assessmentsession. That probability is the product of four factors:
1) The probability that. the PSU was selected;2) the conditional probability, given the PSU, that the school
was selected;3) the conditional probability, given the sample of schools in a
PSU, that the school wi.s Lliocated the specified type of
session; and4) the conditional probability, given the school, that the
student was invited to the specified type of session.
Thus, the base weight for a student may be expressed as the product
WB
= PSUWT SCHWT SESSWT STUDWT
where PSUWT, SCHWT, SESSWT, and STUDWT are, respectively, the reciprocalsof the preceding probabilities.
4.5.2 Adjustment of Base Weights for Nonresponse
The base weight for a student was adjusted by two nonresponse factors;one to adjust for non-cooperating schools and one to adjust for students
who were invited to the assessment but did not appear either in thescheduled session or in a makeup session. Thus, the student nonresponseadjusted weight is of the form
%1w
= V131
f f2
f3
where WB is the student base weight, fl is a school nonresponse factor, f2is a session nonresponse factor, and f3 is a student nonresponse factor,each computed as described blow.
School Nonresponse Adjustment (SCHNRF and SESNR)
School nonresponse factors were computed separately within each PSU forup to two or three classes of schools using as many nonresponse classes asthe number of sampled schools in the PSU and nonresponse pattern allowed.However, since it was required that each class contain at least four orfive schools, often only one class was identified in the PSU.
49
59
. 1

For any nonresponse class, c, the school nonresponse factor for spiralsessions is given by
E W.G.
f lc . icA1 1
E W.G.1 1
i cB
where
Wi = school weight (the reciprocal of the probability ofselection of the school conditional on the PSU);
Gi = estimated number of grade-eligible students in school i;
set A consists of the original sample of eligible schools (includingrefusing schools but not including substitutes); and
set B consists of all cooperating schools (including schools thatwere substituted for non-cooperating schools).
Note that, for a substitute school, W. was computed as if the schoolhad been originally selected by the sampling procedure.
The school nonresponse factor, fl, appears as SCHNRF on the data tapes.
The session nonresponse factor, f2, appears as SESNRF on the datatapes.
Student Nonresponse Adjustment (STUNRF)
Student nonresponse adjustment factors were computed separately forspiral sessions and for each of the bridge assessment sessions within eachPSU.
The student nonresponse factor, f3, appears as STUNRF on the datatapes.
50
6u

Nonresponse Adjustment for Students in Bridge Sessions
For each bridge session, t, in a PSU, the nonrespense factor f2t was
computed by
fnt
2tn'
t
where
nt = number of students invited to the particular Bridge sessionin the PSU; ani
n'= number of students who completed the session.
Nonresponse Adjustment for Students in Spiral Sessions
For spiral sessions, the student nonresponse adjustment was madeseparately for two classes of students: those in or above the modal gradefor their age and those below the modal age. This is in recognition of thelikely differences between students in the two classes both in theirassessed abilities and in their likelihood of nonresponse.
The factor for students in class c in a particular PSU was computed by
E Winicf2c
=
E W.n'.1 1c
where the summations extend over the schools in the PSU and
n. = number of spiral iL'ited students in school i and studentclass c;
n'.lc
number of spiral tested students in school i and studentclass c; and
the reciprocal of the probability of assignment of astudent in school i to a spiral session, conditional on thePSU, adjusted for school nonresponse.
4.5.3 Trimming of Weights (WTRIMF)
In a number of cases, students were assigned extremely large weights.One cause of large weights was underestimation of the number of eligiblestudents in some schools leading to inappropriately low probabilities ofselection for those schools. Other extremely large weights arose as the
51
6.1

result of high levels of noaresponse coupled with low to moderateprobabilities of selection.
Students with extremely large weights have an unusually large impact onestimates such as weighted means. Since the variability in weightscontributes to the variance of an overall estimate by an approximate factor1 + V2, where V is the relative variance of the weights, a few extremelylarge weights are likely to produce large sampling variances of thestatistics of interest, especially when the large weights are associatedwith students with atypical performance characteristics.
In such cases, a procedure of trimming the more extreme weights tovalues somewhat closer to the mean weight was applied. This trimming canincrease the accuracy of the resulting survey estimates, substantiallyreducing V and hence the sampling variance while possibly introducing asmall bias.
The weight trimming adjustment factor appears as WTRIMF on the datatapes.
4.5.4 Post-Stratification (PSTRATF)
As in most sample surveys, the respondent weights are random variableswhich are subject to sampling variability. Even if there were nononresponse, the respondent weights would at best provide unbiasedestimates of the various subgroup proportions. However, since unbiasednessrefers to average performance over a conceptually infinite number ofreplications of the sampling, it is unlikely that any given estimate, basedon the achieved sample, will exactly equal the population value.Furthermore, the respondent weights have been adjusted for nonresponse anda number of extreme weights have been reduced in size.
To reduce the mean squared error of estimates using the samplingweights, these weights were further adjusted so that estimated populationtotals for a number of specified subgroups of the population, based on thesum of weights of students of the specified type, were the same aspresumably better estimates derived from other sources. This adjustment,called post-stratification, reduces the mean squared error of estimatesrelating to student populations that span several subgroups of thepopulation. The post-stratification was done separately for the spiralsessions and each of the bridge sessions within each grade/age group,because each of these can be viewed as separate samples of the appropriatepopulation.
The post-stratification adjustment factor appears as PSTRATF on thedata tapes.
4.5.5 The Final Student-Weight: The Full-Sample Weight (WEIGHT)
The final weight assigned to a student is the student full-sampleweight. This weight is the student's base weight after the application ofthe various adjustments described above.
52
62

The student full-sample weight appears as WEIGHT on the data tapes andis the product of the variables PSUWT, SCHWT, SCHNRF, SESSWT, SESNR,STUDWT, STUNRF, WTR1MF and PSTRATF. The student full-sample weight shouldbe used to derive all estimates of population and subpopulationcharacteristics such as the proportion of students of a specified type whowould respond in a certain way to an exercise.
4.5.6 Weights Used for Variance Estimation (SRWTxx)
Variances for NAEP estimates are computed by a jackknife repeatedreplication method. This method involves the use of a series of weightsSRWTO1 through SRWT38 (for the spiral sample).
For information about the use of these weights and how they werecomputed, see Section 7.3 in Chapter 7.
4.6 TABULAR SUMMARY OF THE 1985-86 SAMPLES
The 1985-86 NAEP database includes a number of different samples fromeach grade/age population of students. These samples include:
The spiral sample of students who are in the grade/agecombination and whc ere in the school's judgment, assessable
The two Bridge B samples (bridge booklets 4 and 5) of studentswho are of the specified age and wno were assessable
The excluded students from the combined spiral assessment andthe Bridge B assessments who, in the school's judgment, werenot assessable
The three Bridge A samples (bridge booklets 1, 2 and 3) ofstudents who are of the specified age (using the old agedefinition) and who were assessable
The excluded students from the combined Bridge A assessments.
Westat has developed an appropriate set of sampling weights to use foreach of these samples. All estimates of population parameters use theseweights. Details of the construction of these weights appear in Section4.5 of this chapter. A discussion of which weights to use for whichanalyses appears in Chapter 7. This section provides summary statisticsfor each of the samples including the sample sizes and estimated populationtotals.
Table 4-2 shows the sizes of the various samples and their samplingweights by grade/age combination and by type of sample. The top positionof the table addresses the samples from the spiral and Bridge Bassessments.
53
63

The sums of the weights for the spiral sample estimate the numbers ofgrade/age-eligible students in the total population who would be deemedassessable by their schools. Note that this sample includes therespondents to any block used in the spiral assessment of the givengrade/age.
The two Bridge B samples, bridge booklet 4 and bridge booklet 5 aredefined by age only; each sum of weights estimates the numbers ofage-eligible students (using the new age definition) in the totalpopulation who would be deemed assessable by their schools. The
differences in the estimated total number of age-eligible students from thetwo Bridge B assessments are due to sampling variance.
Finally, the sums of weights of the excluded students from the combinedspiral and Bridge B assessments estimate the numbers of grade/age-eligiblestudents in the total population who, in their school's opinion, would not
be assessable.
To estimate the total number of in-school students in a grade/agecategory, add
to
the sum of the weights for the spiral sample
the sum of the weights for the excluded students fxomthe spiral and Bridge B samples
To estivate the total number of students (of any grade) in an agecategory, add
to
the sum of the weights from either of the two BridgeB assessments
the sum of the weights for the age-eligible excludedstudents from the spiral and Bridge B samples
The lower part of Table 4-2 shows the sample sizes and sum of weightsfor the three Bridge A samples. These assessments are of the populationsof students defined by the old age definitions. Since the age definitionfor the 17-year-olds was unchanged in the main assessment, no such bridge
was necessary. For ages 9 and 13, the sum of weights for each of theBridge A samples, bridge booklet 1, bridge booklet 2, and bridge booklet 3,provides an estimate of the number of assessable age-eligible students inthe total population.
The sum of the weights of the excluded students from the Bridge Aassessments estimates the number of age-eligible students in the totalpopulation who, in their school's opinion, would have been unassessable.
54
64

To estimate the total number of students (of any grade) in an agecategory using the old age definition, add
to
the sum of the weights from any of the three Bridge Aassessments
the sum of the weights for the excluded students fromthe Bridge A assessments
In most cases, the number of students in a grade/age combination is notof interest; a researcher will be interested in estimating the number ofstudents at either a grade or an age. An estimate of the number ofstudents at an age level can be made by summing the weights of only theage-eligible students, and an estimate of the number of students in a gradeby summing the weights of grade-eligible students.
Tables 4-3, 4-4, and 4-5 show how many students at each grade level areat, in, or above the modal age for that grade, and how many at each agelevel are at, in, or above the modal grade for that age. These figureswere computed from the spiral sample only. Along with the counts from thissample, the sum of the weights (Weighted N) for each category is presented,and these sums are estimates of the numbers of students in these categoriesin the population. The standard errors of these estimates and coefficientsof variation are also given. These standard errors are estimated by thejackknife technology given in Chapter 7. The coefficient of variation ofan estimate is the standard error of the estimate expressed az; a percent ofthe estimate.

Table 4-2
Number of Students by Grade/Ageand Type of Assessment
AssessmentType
Grade 3/Age 9 Grade 7/Age 13 Grade 11/Age 17
TotalSum of
Weights TotalSum of
Weights TotalSum of
Weights
Spiral' 21287 3931992 27668 4007907 39753 4136965
Bridge B--Booklet 42 1994 3151352 2032 3008026 1934 3240017
Brid e B--Booklet 52
2048 3121844 2146 3028806 1934 3252949
Exc uded Stu ents--Combined Spiral andBridge B Samples * * * * * *
Bridge A--Booklet 1 2315 3098639 2075 2937402 ** **
Bridge A--Booklet 23 2361 3104555 2054 2950983 ** **
Brid e A--Booklet 33 2256 3112834 2071 2.943837 ** **
Exc u e Stu ents--Bridge A Samples * * * * ** **
'Sample for both age and grade using new age definitions2Sample for age only using new age definitions
3 Sample for age only using old age aefinitions*Not available on Version 1.0 tapes**No assessment conducted for age 17
56 66
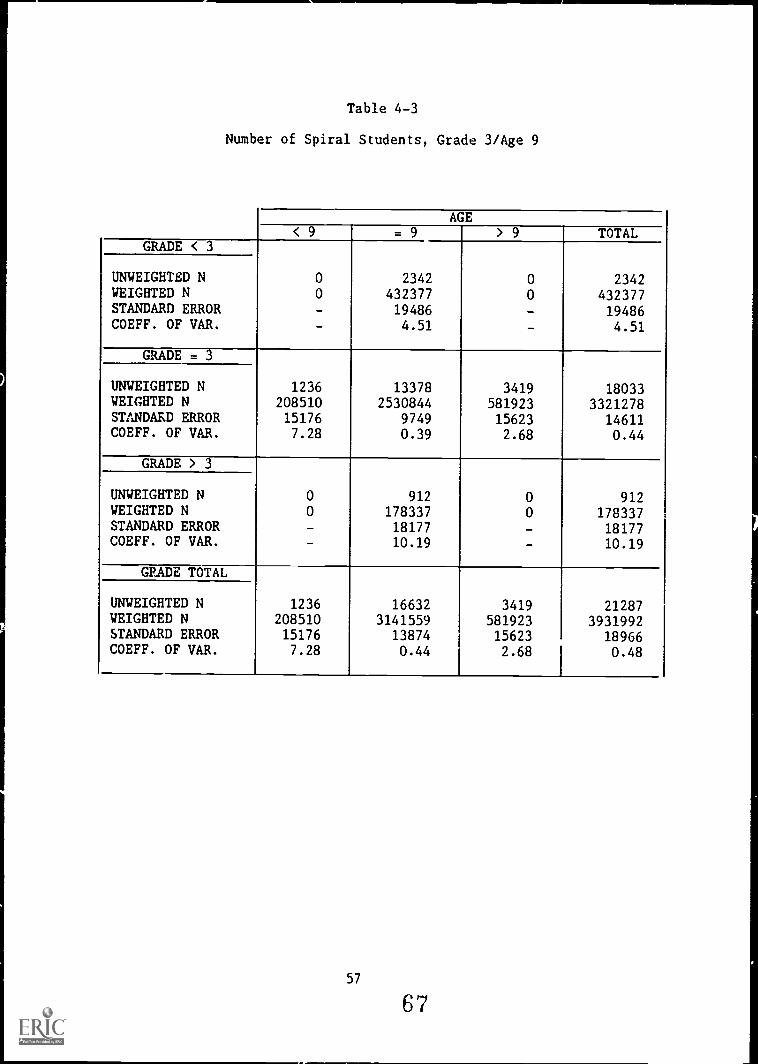
Number of Spiral Students, Grade 3/Age 9
< 9 . 9 > 9 TOTALGRADE < 3
UNWEIGHTE,DN 0 2342 0 2342WEIGHTED N 0 432377 0 432377STANDARD ERROR - 19486 - 19486COEFF. OF VAR. - 4.51 - 4.51
GRADE = 3
UNWEIGHTED N 1236 13378 3419 18033WEIGHTED N 208510 2530844 581923 3321278STANDARD ERROR 15176 9749 15623 14611COEFF. OF VAR. 7.28 0.39 2.68 0.44
GRADE > 3
UNWEIGHTED N 0 912 0 912WEIGHTED N 0 178337 0 178337STANDARD ERROR - 18177 - 18177COEFF. OF VAR. - 10.19 - 10.19
GRADE TOTAL
UNWEIGHTED N 1236 16632 3419 21287WEIGHTED N 208510 3141559 581923 3931992STANDARD ERROR 15176 13874 15623 18966COEFF. OF VAR. 7.28 0.44 2.68 0.48
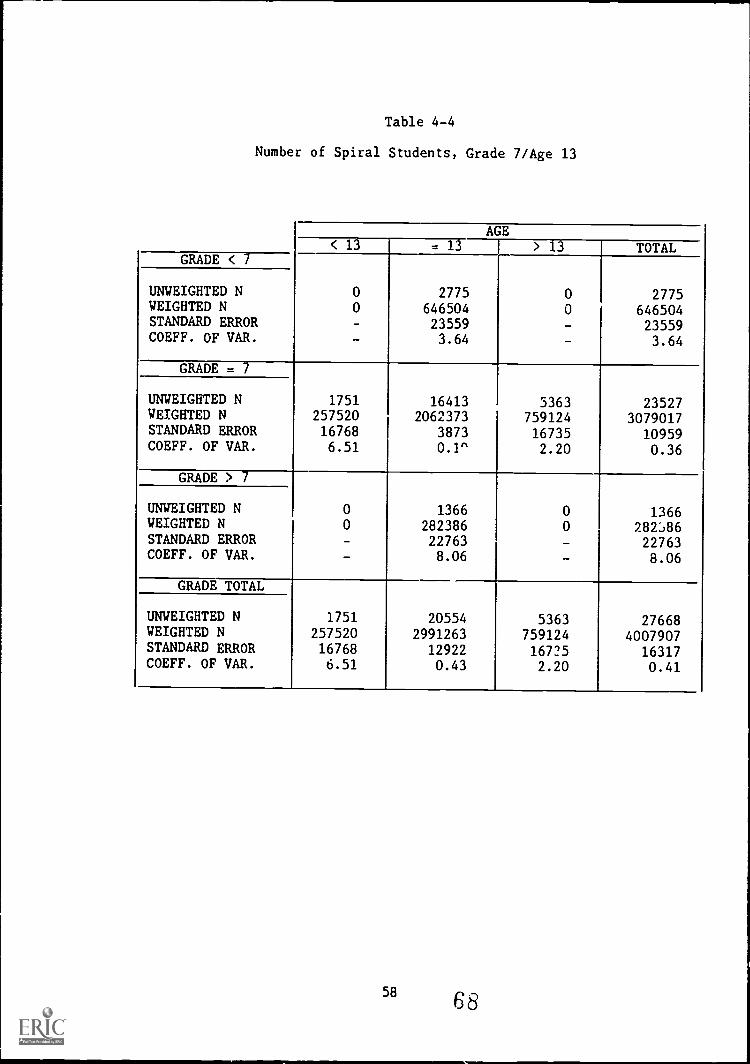
Table 4-4
Number of Spiral Students, Grade 7/Age 13
AGE< 13 . 13 > 13 TOTAL
GRADE < 7
UNWEIGHTED N 0 2775 0 2775WEIGHTED N 0 646504 0 646504STANDARD ERROR 23559 23559COEFF. OF VAR. 3.64 3.64
GRADE = 7
UNWEIGHTED N 1751 16413 5363 23527WEIGHTED N 257520 2062373 759124 3079017STANDARD ERROR 16768 3873 16735 10959COEFF. OF VAR. 6.51 0.1' 2.20 0.36
7--------GRADE >
UNWEIGHTED N 0 1366 0 1366WEIGHTED N 0 282386 0 28286STANDARD ERROR 22763 22763COEFF. OF VAR. 8.06 8.06
GRADE TOTAL
UNWEIGHTED N 1751 20554 5363 27668WEIGHTED N 257520 2991263 759124 4007907STANDARD ERROR 16768 12922 16725 16317COEFF. OF VAR. 6.51 0.43 2.20 0.41
58 68

Table 4-5
Number of Spiral Students, Grade 11/Age 17
AGE< 17 . 17 > 17 TOTAL
GRADE < 11
UNWEIGHTED N 0 5613 0 5613
WEIGHTED N 0 692940 0 692940
STANDARD ERROR - 16672 - 16672
COEFF. OF VAR. - 2.41 - 2.41
GRADE = 11
UNWEIGHTED N 3264 23967 4707 31938
WEIGHTED N 356364 2270022 561849 3188235
STANDAD ERROR 17845 3696 16124 8536
COEFF. OF VAR. 5.01 0.16 2.87 0.27
GRADE > ff---
UNWEIGHTED N 0 2202 0 2202
WEIGHTED N 0 255790 0 255790
STANDARD ERROR - 17040 - 17040
COEFF. OF VAR. - 6.66 - 6.66
GRADE TOTAL
UNWEIGHTED N 3264 31782 4707 39753
WEIGHTED N 356364 3218752 561849 4136965
STANDARD ERROR 17845 8501 16124 13025
COEFF. OF VAR. 5.01 0.26 2.87 0.31
59
69

Chapter 5
DATA COLLECTION AND SCORING
70
Chapter 5: DATA COLLECTION AND SCORING
5.1 INTRODUCTION
In addition to sample selection, Westat, Inc., was responsible forfield administration for the 1985-86 NAEP assessment. When data collectionwas completed, assessment instruments were sent to ETS for processing.This chapter outlines the processes of field administration, datacollection, entry and editing of data, and data entry quality control.
5.2 FIELD ADMINISTRATION AND DATA COLLECTION
Based on the 1985-86 sampling design, Westat invited more than 120,000primary, elementary and secondary school students from more than 1,600schools in 94 PSUs to participate in the 1985-86 assessment. Theassessments in each participating school were coordinated by districtsupervisors. These supervisors were responsible for conducting sessions intheir PSUs and maintaining the security of NAEP materials and theconfidentiality of assessment data.
District supervisors provided school pe-sonnel with general informationabout NAEP and worked with them to ensure student attendance at eachassessment session. Each supervisor was assisted by two exerciseadministrators. Supervisors and exercise administrators were responsiblefor establishing assessment schedules, ensuring that schools were properlyprepared for sessions, completing student sample selection in each school,collecting and checking all NAEP materials, and returning materials to ETS.
5.3 DATA ENTRY SYSTEM
The 1985-86 assessment booklets were designed to be read by acomputerized scanning device. Respondents filled in ovals next to theirresponse choice(s) for each item. When the instruments were received atETS, they were processed by the scanning department. The scanned data weretransmitted to magnetic tape, then to a computer database.
As the database was created, the data was edited; data in error wereindicated on an error listing. A data entry system was developed tocorrect data discrepancies and to enter data from booklets that were unableto be scanned. The intell'gent, direct data entry system allowed entry,verification, and resolution of the data. As each booklet was presented,the system automatically prepared for appropriate exercise sets by settingup corresponding formats or data descriptions. The system also permittedon-line editing of data as they were entered.
63
71

5.3.1 Editing
Editing included an assessment of the internal logic and consistency ofthe data received. For example, data were examined for non-existent schoolIDs, out-of-range values, and illogical or inconsistent responses. Wherepossible, conflicts in the data were resolved. If resolution was notpossible, the information was left in the form in which it was received.
5.3.2 Multiple Responses
In cases where students, teachers, or school personnel provided morethan one response to a single-response background or attitude item,specific guidelines were developed to incorporate these responsesconsistently and accurately. None of the guidelines applied to achievementitems; multiple responses on achievement items were coded as such. Thefirst item in block 9R1 is presented below as an example of how multipleresponses were resolved.
How often do you do each of the following things when you studyfor a test?
Read thematerial overa few times
Almost More than Almost Lt s than Never orevery half the half the half the hardly
time time time time ever
CD CD CD CD CD
The purpose of this item was to find out whether a student ever "readthe material over a few times." If the student were to fill in more thanone nval and the response data were coded merely "Multiple Response", noinformation about the student's habits would be recorded. To retainmultiple response data for this item, combinations of responses wereassigned values. First, a number was assigned to each of the possibleresponses:
1 = Almost every time2 = More than half the time3 = Almost half the time
4 = Less than half the time5 = Never or hardly ever
Next, these values were combined to form new values:
1 & 2, 1 & 3 = 21 & 4, 1 & 5, 2 & 3, 2 & 4 = 32 & 5, 3 & 4, 3 & 5 =44 & 5 =5All other combinations = 9
The appropriate new values were entered whenever multiple responseswere encountered for this item.
6472
5.4 PROFESSIONALLY SCORED ITEMS
As in earlier assessments, the 1985-86 session included items whichrequired open-ended responses. Open-ended response items were administeredfor reading, science, and mathematics. NAEP recruited and trained a teamof readers to score these items. The readers were trained using scoringguides that defined possible score points for each item. Reading responseswere scored on a 4-, 5-, or 8-point scale, depending upon the item.Science responses were scored on a 2-, 3-, or 4-point scale, depending uponthe item. Mathematics responses were scored as either correct, incorrector "no response." Reading and science responses were scored by the samereaders; a different group if readers scored the mathematics responses.
All readers used scoring guides specifically designed for each item.Some of the items had been used in previous assessments; others weredeveloped for the 1985-86 session. To ensure comparability of results,items from previous assessments were scored using scoring guides fromprevious assessments. The guides for new items were constructed using datafrom field testing.
Twenty percent of the reading and science scores were subjected toreliability checks in which the responses were read and scored by a secondreader who was not provided with the score assigned by the first. Bothscores are retained on the data tapes. Ten percent of the mathematicsscores were subjected to a "correctness" check by a second reader, whocorrected any mathematics scores found to be in error.
5.5 QUALITY CONTROL
NAEP measured the accuracy of its data entry operation to determine howprecisely the data moved from receipt of the instrument to the subsequentmachine-readable dataset. For this purpose, a number of student bookletsand questionnaires were selected at random and compared, character bycharacter, with their representation on a disk file. The number ofbooklets and questionnaires involved in quality control checks was basedupon the number needed to establish a statistically reassuring conclusionabout the accuracy of the entire data entry operation. Student bookletsand questionnaires for all three grade/ages were included in qualitycontrol checks.
65
73

Chapter 6
REPORTING SUBGROUPS AND OTHER VARIABLES
74I
I

Chapter 6: REPORTING SUBGROUPS AND OTHER VARIABLES'
6.1 INTRODUCTION
In addition to reporting national results, NAEP reports information byseveral student subgroups (results are not reported for individualstudents). Some subgroup data are takca directly from responses toassessment items; some are derived from responses to two or more differentitems. This chapter defines the reporting subgroups and explains how theirdata are derived.
This chapteL also explains the data variables on the tapes that havebeen taken from sources other than the assessment instruments.
6.2 REPORTING SUBGROUPS
NAEP reports information about student subgroups defined by sex,race/ethnicity (both observed and imputed), region of the country,grade, age, level of parent's education, and size and type of community.The derivation of each of these subgroups is explained in the followingsections.
6.2.1 Sex (DSEX)
The variable SEX on the student file is the sex of the student beingassessed, as taken from school records. For a few students, data for thisvariable was missing, and was imputed after the assessment by ETS. Theresulting variable DSEX on the student file contains a value for everystudent and should be used for sex subgroup comparisons.
6.2.2 Observed Race/Ethnicity (RACE)
The variable RACE on the student file is the race/ethnicity of thestudent being assessed, as observed and recorded by the exerciseadministrator. The observed definition of student race/ethnicity was theonly one used in NAEP assessments prior to 1983-86 This variably shouldbe used for race/ethnicity subgroup comparisons to assessments conductedbefore 1983-84.
J.
Data collected from the Teacher Questionnaire and the Excluded StudentQuestionnaire, and sampling weights for schools, excluded students, andteachers associated -ith students are not contained on the Version 1.0 datatapes, but will be included in Version 2.0.
69
75

6.2.3 Imputed Race/Ethnicity (DRACE)
The variable DRACE on the student file is an imputed definition of
race/ethnicity, derived from up to three sources of information. This
variable can be used for race/ethnicity subgroup comparisons within the
1985-86 assessment and between the 1985-86 and 1983-84 assessments.
Two common background items were used io the determination of
race/ethnicity. The items were included in every spiral and bridge
assessment booklet, as follows:
Common Background Item Number 2:
2. If you are Hispanic, what is your Hispanic background?
cD I am not HispanicCD Mexican, Mexican American, or ChicanoCD Puerto RicanCD CubanCD Other Spanish or Hispanic background
Students who responded to item number 2 by filling in one of the ovals(cD) two through five were considered Hispanic. For students who filled in
the first oval, or did not respond to the item, or provided informationwhich was illegible or which could not be classified, responses to item
number 1 were examined in an effort to determine race/ethnicity. Item
number 1 read as follows:
Common Background Item Number 1:
1. Which best describes you?
CD WhiteCD BlackCD Hispanic (Mexican, Mexican American, Chicano, Puerto
Rican, Cuban, or other Spanish or Hispanic background)CD Asian or Pacific IslanderCD American Indian or Alaskan NativeCD Other (What?)
Students who filled in the first oval were considered White; secondoval were considered Black; third oval were considered Hispanic; fourthoval were considered Asian or Pacific Islander; fifth oval were consideredAmerican Indian or Alaskan Native. If a student responded by filling inthe si:.th oval ("Other"), provided illegible information or informationwhich could not be classified, or did not respond at all, observedrace/ethnicity (RACE), if provided by the exercise administrator, was used.
70
7G

Imputed race/ethnicity could not be classified for a student who didnot respond to background items 1 or 2, and for whom an observedrace/ethnicity was not provided.
Table 6-1 summarizes the procedure used to determine race/ethnicity.
6.2.4 Size and Type of Community (STOC. SSTOC)
NAEP assigned each participating school to one of seven size and typeof community categories. These categories are included as the variableSTOC on the student file and SSTOC on the school file. The categories weredesigned to provide information about the communities in which the schoolswere located.
The STOC reporting categories consist of three "extreme" types ofcommunities and four "residual" community sizes. Schools were placed intoSTOC categories based upon information about the type of community, thesize of its population and upon an occupational drofile of residentsprovided prior to the assessment by school principals. The principalscompleted estimates of the percentage of students whose parents fit intoeach of six occupational categories.
Schools in extreme rural and low or high metropolitan areas were rankedin descending order according to the occupational profile, the type ofcommunity, and the size of its population. The top 10 percent of theseschools were assigned to the extreme STOC categories (1, 2 and 3) below.The remaining schools were classified according to one of the four residualSTOC categories. The three extreme STOC categorieS are as follows:
STOC 1 - Extreme Rural:
This category was used for schools in rural ..reas where ahigh proportion of adults was farmers or farm workers and a ?owproportion of professional, managerial, or factory workers. .4.,
least some of the students in these schools were from open countryor places with a population of less than 10,000.
STOC 2 - Low Metro:
The low metro STOC category was used for schools in areaswhere a high proportion of the adult population was either notregularly employed or on welfare and a low proportion was employedin professional or managerial positions. The schools in STOC 2were located in cities, or the urbanized area of cities, with apopulation greater than 200,000.
STOC 3 - High Metro:
High metro schools were located in city areas where a highproportion of adults was , .cloyed in professional or managerialpositions and a low proportion factory or farm workers, notregularly employed, or on welfare. STOC 3 schools were located in
71 77

Table 6-1
Determining Imputed Race/Ethnicity (DRACE)
Background Item Number 2
2. If you are Hispanic, what is yourHispanic background?CD I am not HispanicCD Mexican, Mexican American,
or ChicanoCD Puerto RicanCD CubanCD Other Spanish or Hispanic
background
Student filled in first oval,did not respond, provided anillegible response or provideda response which could not beclassified
Background Item Number 1
1. Which best describes you?cp WhiteCD BlackCD HispanicCD Asian or Pacific IslanderCD American Indian or Alaskan
NativeCD Other (What?)
student did not fill in anoval, provided an illegibleresponse or provided aresponse which could not beclassified
Observed Race/Ethnicity
Observed Race/Ethnicity was notprovided by ExerciseAdministrator
Unclassified Race/Ethnicity
72
Student filled inoval 2, 3, 4, or 5 0
Student filled inoval 1, 2, 3, 4,
or 5
Studentas
Hispanic
Student was:CD WhiteCD BlackCD HispanicCD AsianCD American
Indian
(Student was:White
Provided by BlackExercise HispanicAdministrator 4 Asian
AmericanIndian
711111

cities or the urbanized area of cities with populations greaterthan 200,000.
Schools which did not fall into STOC 1, 2 or 3 were classifiedaccording to four "residual" STOC categories depending upon the size of thecommunity in which they were located. The four residual STOC reportingcategories are as follows:
STOC 4 - Main Big City:
STOC 4 schools were located within the limits of cities withpopulations greater than 200,000 but not classified as High or LowMetro.
STOC 5 - Urban Fringe:
The schools assigned to STOC 5 were located in the urbanized,area, but outside the limits, of cities with populations over200,000, but not classified as Low or High Metro.
STOC 6 - Medium City:
STOC 6 schools were located in cities with populations ofbetween 25,000 and 200,000 which did not classify as fringe areasfor big cities.
STOC 7 - Small Place:
The schools assigned to STOC 7 were located in communitieswith populations of less than 25,000. These communities were notlocated in the urbanized areas of big cities and could not beclassified as Extreme Rural.
6.2.5 Parental Education (PARED)
The variable PARED on the student file is derived from responses to twocommon background items (B003501 and B003601). Students were asked toindicate the extent of their father's education (item B003601) by choosingone of the following:
CD He did not finish high school;He graduated from high school:
CD He had some education after highschool;
CD He graduated from college; orCD I Don't Know.
73 79

Students were asked to provide the same information about the extent oftheir mother's education (item B003501) by choosing one of the following:
CD She did not finish high school;cD She graduated from high school;CD She had some education after high
school;CD She graduated from college; orCD I Don't Know.
The information was combined into one parental education reportingcategory (PARED), as follows:
If a student indicated the extent of education for only one parent,level was included in the data. If a student indicated the extent of
eaucation for both parents, the higher of the two levels was included inthe data. If a student indicated that he or she did not know the level ofeducation for both parents or indicated that he or she did not know thelevel of education for one parent and did not respond for the other, theparental education level was classified as unknown. If the student did notrespond for both parents, the student was recorded as having provided noresponse.
6.2.6 Region (REGION, SREGION)
In addition to overall responses, NAEP computed data for fourgeographical regions in the United States. These data are retained on the,-*ata tapes as the variable REGION on the student file and SREGION on theschool file. Table 6-2 outlines the assignment of individual states to eachregion. (Note: Alaska and Hawaii were not included in the sample.)
Table 6-2Geographic Regions
NORTHEAST: SOUTHEAST:ConnecticutDelawareDistrictof Columbia
MaineMarylandMassachusetts
New HampshireNew JerseyNew YorkPennsylvaniaRhode IslandVermont
A a ama MississippiArkansas North CarolinaFlorida South CarolinaGeorgia TennesseeKentucky VirginiaLouisiana West Virginia
IllinoisIndianaIowaKansasMichiganMinnesota
CENTRAL:MissouriNebraskaNorth DakotaOhioSouth DakotaWisconsin
Alas aArizonaCaliforniaColoradoHawaiiIdahoMontanaNevada
WEST:
New MexiOklahomaOregonTexasUtahWashingtonWyoming
74

6.2.7 Grade (DGRADE. MODGRD)
To enhance the usefulness of 1985-86 assessment data, MAEP sampledstudents by grade as well as by age. Students were also sampled in 1983-84by both grade and age; the student cohorts in that assessment were grade4/age 9, grade 8/age 13, and grade 11/age 17. The ages sampled matchedthose sampled in earlier assessments; each grade sampled represented thecorresponding modal grade, or the grade attended by most students of theparticular age.
In 1985-86, with changes in age definition and time of testing for ages9 and 13, the corresponding modal grades also changed, from grades 4 and 8to grades 3 and 7. Age definition and time of testing did not change forthe older student cohort, which remained grade 11/age 17.
The main (spiral) sample includes many students in each cohort who wereboth age-eligible (age 9, 13, or 17) and grade-eligible (attendingrespectively grade 3, 7, or 11). However, because NAEP collected data bygrade or age, each cohort also includes students who were age-eligible butnot in the modal grade, and students who were grade-eligible but not of the
modal age (the age of most students attending the particular grade).
The bridge studies performed to assess the effects of the changes inage definition and time of testing (Bridge A) and mode of administration(Bridge B) sampled students by age only.
Results for students in a particular grade can be selected using thevariable DGRADE, the student's actual grade at time of testing, on thestudent file.
Results for students in three ranges of grades (i.e., students ingrades below the modal grade, at the modal grade, and above the modalgrade) can be selected using the variable MODGRD on the student file.
Table 6-3 compares MODGRD values with their corresponding DGRADE valuesfor the three grade/ages.
6.2.8 Age (DAGE, MODAGE)
For the 1985-86 main (spiral) sample, student age for all threegrade/age cohorts was calculated as of September 30, 1986. Because NAEPcollected data by grade or age, each spiral sample student cohort includesstudents who were both age-eligible and grade-eligible, students who wereage-eligible but not in the modal grade, and students who weregrade-eligible but not of the modal age. The modal ages for each grade/agecohort in the spiral sample were defined by the following birth'1ates, basedon the school year:
Age 9: born between October 1, 1976 and September 30, 1977
Age 13: born between October 1, 1972 and September 30, 1973
Age 17: born between October 1, 1968 and September 30, 1969
75
81

Table 6-3
Comparison of MODGRD and DGRADE Values
DGRADPGrade 3/Age
Spiral &Brid:e B
9DGRADE
Grade 7/Age 13DGRADE
Grade 11/AgeSpiral &Brid:e B
17
: IODGRD Brid:e ASpiral &Brid:e B Brid:e A Brid:e
1 (< modal 1 k 4 5 7 --grade) 2 2 5 6 8
3 6 7 9
10
2 (= modal 3 4 7 8 11 --grade)
3 (> modal 4 5 8 9 12 --grade)! 9
Table 6-4
Comparison of MODAGE and DAGE Values
MODAGE DAGE - Age 9 DAGE - Age 13 DAGE - Age 17
1 (< modal age) 7 9 148 10 15
11 1612
2 (= modal ate) 9 13 17
3 (> modal age) 10 14 1811 15 1912 16 2013 I.7 2114 18 22
23
76 82

Because the definitions of ages 9 and 13 were changed in the 1985-86assessment, a bridge study (Bridge A) was conducted to determine theeffects of the change. At eligibility for the Bridge A samples was basedon the previous definition of age (by calendar year) and uas calculated asof December 31, 1986.
The Bridge A age 9 samples include only students born between January 1and December 31, 1976. Students with those birthdates who were in a gradelower than second grade or higher than fifth grade were not included in theBridge A samples.
The Bridge A age 13 samples include only students born between January1 and December 31, 1972. Students with those birthdates who were in agrade lower than sixth grade or higher than ninth grade were not includedin the Bridge A samples.
A second bridge study, Bridge B, was conducted to determine the effectsof a change in mode of administration. Age eligibility f the Bridge Bsamples wa3 based on the new definition of age (by schoo, year) and wascalculated as of September 30, 1986.
The Bridge B samples include only students born oetween October 1, 1976and September 30, 1977 (age 9); students born between October 1, 1972 andSeptember 30, 1973 (age 13); and students born between October 1, 1968 andSeptember 30, 1969 (age 17).
Results for students in a particular age can be selected using thevariable DACE, the student's actual age at time of testing, on the studentfile.
Results for students in three ranges of ages (i.e., students in agesbelow the modal age, at the modal age, or above Lie modal age) can beselected using the variable MODAGE on the student file.
Table 6-4 compares MODAGE values with their corresponding DAGE valuesfor the three student age cohorts.
6.3 OTHER VARIABLES
Several variables on the data tapes have been taken from sources otherthan the student assessment instruments or a-sessment surveyquestionnaires. These are described in the following sections.
6.3.1 Principal Questionnaire Variables
Prior to the assessment, Westat, Inc., distributed a questionnaire toeach school principal to gather data about school characteristics,including school enrollment and attendance, parents' occupations, and,tudent ethnicity. These data variables are retained on the school file,and are identified in the data layouts by "(PQ)" in the SHOT: LABEL field.
77
83

The NAEP variables
SPCTAMI (percent American Indian)SPCTASI (percent Asian/Pacific Islander)SPCTHSP (percent Hispanic)SPCTBLK (percent Black)SPCTWHT (percent White)
represent percents of student ethnicity in each school. The data from thesevariables were derived from the percent-ethnicity variables from thePrincipal Questionnaire: PPCTAMI, PPCTASI, PPCTHSP, PPCTBLK, and PPCTWHT.Missing data for these variables were supplemented with corresponding datafrom another source, Quality Education Data, Inc. (see below). Ifpercent-ethnicity data was not available from either source, the derivedvariables indicate "Missing" for those schools.
6.3.2 Quality Education Data (QED) Variables
The data tapes contain several variables obtained from informationsupplied by Quality Education Data, Inc. (QED). QED maintains and updatesannually lists of schools showing grade span, total enrollment, schooldistrict, principal's name and other information for each school. Some ofthis information has been used for the following variables:
Student Files Sizhool Files
ORSHPT IDP SPECED SORSHPT SIDP SSPECEDNTEACHC CAI LIB/MED SNTCHC SCAI SLIBMEDSCHTYPE URBAN INDARTS SSCHTYP SURBAN SINDARTGRSPAN RSTUDA ADULTED SGRSPAN SNSTUD SADLTEDENROLL NTEACHA PCENROL SENROLL SNTEACH SPCENROL
Most of the QED variables are sufficiently defined in the datacodebooks. Explanations of others are provided below.
ORSHPT and SORSHPT are the Orshansky Percentile, an indicator ofrelative wealth which specifies the percentage of district school-agechildren who fall below the poverty lino.
IDP and SIDP represent, at the school district level, dollars perstudent spent for textbooks and supplemental materials.
ADULTED and SADLTED indicate whether or not adult education courses areoffered at the school site.
URBAN and SURBAN define the scnool's urbanicity: Urban (central city),Surburban (arca surrounding central city, but still located within thecounties constituting the Standard Metropolitan Statistical Area; or Rural(area outside any Standard Metropolitan Statistical Area).
PCENROL and SPCENROL indicate the percent increase or decrease inschool enrollment from 1980.
788 4

Chapter 7
CONDUCTING STATISTICAL ANALYSES OF 1985-86 NAEP DATA
85

Chapter 7: CONDUCTING STATISTICAL ANALYSES
OF 1985-86 NAEP DATA'
7.1 INTRODUCTION
Users of NAEP data should be aware of the special properties of theNAEP database that affect the validity of conventional techniques ofstatistical inference. Because a complex sampling scheme, rather thansimple random sampling, was used to collect NAEP data, stariard proceduresfor statistical inference should not be applied to the NAEP data withoutmodification.
In the NAEP sampling scheme, students do not have an equal probabilityof being selected. There'nre, as in all complex surveys, each student hasbeen assigned a sampling weight. The larger the probability of selectionfor students within a particular demographic group, the smaller the weightsfor those students will be. When computing descriptive statistics orconducting inferential procedures, one should weight the data for eachstudent. Performance of statistical analyses without weights can lead tomisleading results.
Another way in which the complex sample design used by NAEP differsfrom simple random sampling is that the NAEP sampling scheme involves theselection of clusters of students who come from the same school, as well asclusters of schools that come from the same geographical region. As aresult, observations are not independent of one another as they are in asimple random sample. Therefore, use of ordinary formulas for estimati-gthe standard error of sample statistics, such as means, proportions orregression coefficients, will result in values that are too small. Thestandard error, which is a measure of the variability of a samplestatistic, gives an indication of ho.' well that statistic estimates thecorresponding population value. It is used in conducting tests ofstatistical significance. If conventional simple random sampling (SRS)formulas are used to compute standard errors, "too many" statisticallysignificant results will occur.
Yet another effect of the NAEP sampling scheme is a reduction of theeffective degrees of freedom. In a simple random sample, the degrees offreedom of a variance estimate are based on the number of subjects. In theNAEP design, the degrees of freedom are a function of the number ofclusters of primary sampling units (PSUs) and the number of strata in the
'Data collected from the Teacher Ouestionnaire and the Excluded StudentQuestionnaire, and sampling weights for schools, excluded students, andteachers associated with students are not contained on the Version 1.0 datatapes, but will be included in Version 2.0.
81
86

design, rather than the number of subjects (see Chapter 4 for a discussionof the sample design). Therefore, the ordinary formulas for obtainingdegrees of freedom are not valid with the NAEP data.
The following sections will outline the procedures used in NAEP toaccount for these special properties of the NAEP data. Section 7.2discusses the use of weights to account for the differential samplingrates. Section 7.3 discusses jackknife procedures that can be used toestimate sampling variability. Section 7.4 provides an approximateprocedure, using design effects, for estimating sampling variability.Although this technique is less precise than the jackknife, it involvesconsiderably less computation. It is expected thzt the resultant degree ofaccuracy will be acceptable to most users of the NAEP data.
7.2 '..JSING WEIGHTS TO ACCOUNT FOR DIFFERENTIALREPRESENTATION
The 1985-86 NAEP used a complex sample design to obtain the studentswho were assessed. The goal of this design was to obtain a series ofsamples (for the various ages and grades) from which estimates ofpopulation and subpopulation characteristics could be obtained withreasonably high precision (as measured by low sampling variability). Toaccomplish this goal, NAEP used a multistage cluster sample design(described in Chapter 4) in which the probabilities of selection of theclusters was proportional to measures of their size To ensure adequateprecision in the estimation of the characteristics of varioussubpopulations of interest, some subpopulations (corresponding to studentsfrom areas with high concentrations of Black, Hispanic and/or Asianstudents) were deliberately sampled at approximately twice the normal rateto obtain larger samples of respondents from thossz! subpopulations. Theresult of these differential probabilities of selection is a series ofachieved samples, each containing proportionately more members of certainsubgroups than there are in the population.
Appropriate estimation of population characteristics must take thisdisproportional representation into account. This is accomplished byassigning a weight to each respondent, where the weights properly accountfor the sample design and 'eflect the appropriate proportionalrepresentation of the various types of individuals in the population.These weights also include adjustments for nonresponse and adjustments(known as post-stratification adjustments) designed to make sampleestimates of certain subpopulation totals conform to external, morea',...qrate, estimates. Details about the computation of these weights appearin Chapter 4. For the present purpose, it is sufficient to note that theseweights should be used for all analyses, whether exploratory orconfirmat,,ry.
The 1985-86 database includes a number of different samples fromseveral populations. Each of these samples has its own set of weightswhich are to be used to produce estimates about the characteristics of thepopulation addressed by the sample (the target population). The various
82
8'7

samples, their target populations, and their weights are discussed in thefollowing sections.
7.2.1 The Spiral Samples of Students
These samples, one for each of the three grade/age combinations,consist of all students assessed in the main (spiral) assessment. Thetarget population for each of these samples consists of all students whoare in the specified grade/age combination who were deemed assessable bytheir school. The weight to be used for all analyses at the student level,based on these samples, is the student full-sample weight (WEIGHT).
The sum of weights for all students in a particular grade/age spiralsample estimates the total number of assessable students in the populationwho are of that grade/age combination. In most cases such an estimate isof minor interest; a researcher is more likely interested in the number ofstudents at either a grade or an age. An estimate cf the number ofassessable students at ar age level can be obtained by summing the weightsof only the age-eligible students; and an estimate of the number ofassessable students in a given grade comes by summing the weights of onlythe grade-eligible students. In general, an estimate of the number ofassessable students in the population who possess some characteristic, suchas third grade students in the Northeast, comes by summing the weights ofall respondents to the spiral assessment who have that characteristic.
An estimate of the proportiosi of students in the population who possesssome characteristic is obtained as the ratio of :he estimated total numberof students with that characteristic to the estimated population total.This estimate can be restricted to subpopulations. For example, theestimated proportion of all assessable third grade students who are also inthe northeast is
WTOT (3rd grade and NE)WTOT (3rd grade)
where WTOT (3rd grade and NE) is the sum of the weights of all students inthe spiral sample who are both in the third grade and the Northeast andwhere WTOT (3rd grade) is the sum of the weights of all students in thespiral sample who are in the third grade and from any region.
It is also clearly of interest to estimate .:1,1 relative proportion of a
population (say 3rd grade students) who could correctly respond to anassessment exercise. This proportion is estimated by the ratio
P = WTOT (3rd grade, answered item correctly)WTOT (3rd grade, presented the item)
where the numerator is the sum of weights of all assessed students who arein the third grade and who correctly responder' to the item. Please note
83
88

that the denominator is the sum of weights of all students who
1) are in the third grade and2) were presented the item.
This total is less than WTOT (3rd grade) because not all students arepresented every item (due to 'le spiral design). However, the sample ofassessed students who were presented the item is itself a representativesample of the entire population of assessable students.
7/.2 The Bridge B Samples of Students
For each of the three ages (9, 13 and 17--using the new agedefinitio.is) \here are two bridge samples (from booklets 4 and 5) designedto allow the measurement of the effect of changing from tape-recorded toprinted mode of administration. The target population for each of thesesamples consists of all students who are of the specified age and who wouldbe assessable. The weight to be used for all analyses at the studentlevel, based on any one of these samples, is the student full-sample weight(WEIGHT).
The sum of weights of all respondents to a particular bridge sampleestimates the total number of age-eligible students in the country whowould be assessable. Since there are two such samples, there are twoestimated totals which differ only because of sampling variability.Another estimate can be obtained as the average of these two estimates.
Estimates of totals for subpopulatiom as well as estimates ofproportions can be obtained in the same manner as in the above discussionfor the spiral sample.
7.2.3 The Excluded Students from the Spiraland Bridge B Assessments
The excluded students from the combined spiral and Bridge B assessmentsare a sample from the population of all grade /age eligible students who, inthe opinion of their school, would not be assessable. The weight to beused for all analyses of these data, such as for analysis of the responsesto the Excluded Student Questionnaire, is the excluded student final weight(XWEIGHT).
insides conducting weighted analyses on these data to estimatecharacteristics of the population of excluded students, analogous to theanalyses for the assessed students, it is possible to combine the varioussamples together.
For example, the sum of the weights of all spiral assessed students ofa given grade/age combination plus the equivalent sum of weights for theexcluded students estimates the total number of in-school students(assessable or not) in the grade/age combination.
84
83

7.2.4 The Bridge A Samples of Students
For each of the ages 9 and 13, there are three bridge samples (frombooklets 1, 2 and 3) designed to allow the measurement of the effect ofchanging the age definitions and the time of year the assessment data werecollected. Consequently, the target population for each of these samples,while being the assessable age eligibles, is different from the targetpopulation of age eligibles in the spiral and Bridge B assessments, thedifference being the change in definition of age between the two types ofsamples.
The weight to be used for all analyses of these data is thestudent-full sample weight (WEIGHT).
7.2.5 The Excluded Students from the Bridge A Assessments
These are a sample from the population of all age eligible students,using the °A age definitions, who would be unassessable. T! weight touse for all analyses of these data is the excluded student final weight(XWEIGHT). These data can be combined with the data from any one of thefall/winter bridge samples to estimate characteristics of the totalpopulation of in-school students (assessable or not) of the specified ageclass.
7.2.6 Other Weights
The final teacher-student weights (TSTUVTF) are appropriate foranalyses of the Teacher Questionnaire data, where the teacher'scharacteristics are linked to the students. These will to available forthe spiral assessment only.
The teacher-student weights are appropriate for use in estimating thenumber or percent of students in the total population who have variouscharacteristics; they are not appropriate for use in estimating the numberof teachers, or the r"-Iber of teachers with various characteristics. Theyare supplied only for a subsample of students who were selected from thefull NAEP sample and are app:,?riate for use in analyses involving thetticher-characteristics of students. For example, these weights would beused to estimate the proportion of students who have Hispanic language artsteachers.
The school weights will be used to analyze, at the school level, theSchool Questionnaire data.
7.3 PROCEDURES USED BY NAEP TO ESTIMATE VARIABILITY (Jackknifing)
This section describes how the saapling variability of statistics basedon the NAEP data can be estimated. This estimate represents the mostprecise estimate obtainable, given the resources available to NAEP. Betterestimators of uncertainty could be obtained with more resources. Because
85
90

most secondary users will have fewer resources than those available for theNAEP reports, Section 7.4 provides less expensive approximations to thevariance estimator described below.
A major source of uncertainty in the estimation of the value in thepopulation of a variable of interest exists because information about thevariable is obtained only on a sample from the population. To reflect thisfact, it is important to attach to any statistic (e.g., a mean) an estimateof the sampling variability to be expected for that statistic.
Estimates of sampling variability are designed to provide informationabout boy much the value of a given statistic would be likely to change ifthe statistic had been based on another, equivalent, sample of individualsdrawn in exactly the same manner as the achieved sample. Consequently, theestimation of the sampling variability of any statistic m,:.st take intoaccount the design of the sample.
The NAEP sample is obtained via a stratified multistage probabilitysampling design which includes provisions for sampling certainsubpopulations at higher rates. Additional characteristics of the sampleinclude adjustments for both nonresponse and post-stratification. Theresulting sample has different statistical characteristics from those of asimple random sample. In particular, because of the effects of clusterselection (students within schools, schools within PSUs) and because ofeffects of nonresnonse and post-stratification adjustments, observationswade on different students cannot be assumed to be independent of eachother (and are, in fact, generally positively correlated). Furthermore, toaccount for the differential probabilities of selection (and the variousadjustments), -ach student has an associated sampling weight, which must beused in the computation of any statistic and which it itself subject tosampling variability.
Treatment of the data as a simple random sample, with disregard for thespecial characteristics of the NAEP sample design, will produce underesti-mates of the true sampling variability.
A procedure known as jackknifing is suitable for estimating samplingerrors from such a complex design. This procedure has a number ofproperties which make it particularly suited for the analysis of NAEP data:
1) The jackknife procedure properly estimates the sampling errorarising from the complex sample selection procedure for linearestimates such as simple totals and means, and does soapproximately for more complex estimates.
2) It reflects the component of sampling error introduced by theuse of weighting factors which are dependent upon the sampledata actually obtained.
3) Jackknifing can be adapted readily to the estimation ofsampling errors for parameters estimated using statisticalmodeling procedures, as well as for tabulation estimates.
86
9i

4) Once appropriate weights are derived and attached tc eachrecord, the procedure is straightforward to use for estimatingsampling errors. A single set of replicate weights isrequired for all tabulations and model parameter estimateswhich may be needed.
The method of applying the jackknife procedure involves first definingpairs of groups of first-stage sampling units. For the 1985-86 NAEP spiralassessment. Westat has defined 76 groups of such first-stage units, pairedso that the populations represented by each member of the pair are similar.In many cases, a group consists of a single PSU. This results in 38 pairsof first-stage units. Similar pairings have been defined for the bridgeassessments. For the Bridge A assessment there are 33 pairs; there arealso 33 pairs for the Bridge B assessment (but these correspond to somewhatdifferent clusters of PSUs). These pairings are identified by the variableJKPAIR on the data tapes; membership within the pair is identified by thevariable JKREPL.
The component of the sampling variability attributable to a pair offirst-stage units is estimated as the squared difference between the valueof the statistic for the complete sample and a pseudoreplicate formed byrecomputing the statistic on a specially constructed pseudodataset. Thispseudodataset is created from the original dataset by eliminating onemember of the pair and replacing it with a copy of the second set offirst-stage units in the pair. For computational purposes, the pseudo-dataset associated with a given pair is the original dataset with adifferent set of weights, referred to as the student replicate weightsSRWTO1 through SRWT38 on the data tapes, where SRWTi is for the i pair.This set of weights allows measurement of the total effect of replacing onemember of the pair with a copy of the other, including adjustments fornonresonse and post-stratification. The pseudoreplicate associated withthe it pair for a given statistic is obtained by recalculating thestatistic using the weights SRWTi instead of the sampling weights.
The 4.tudent replicate weight, SRWTi, for the ith pair of first-stageuni ?s was computed as follows:
Let W be the base weight of a student, where the base weight accountsfor the probabilities of selection but does not include nonresponse orpost-stratification adjustments.
Then SRWTi = fNR fPS W .
i i
where
0 JKPAIR = i, JKREPL = 2
Wai = JKFAC W13 JKPAIR = i, JKREPL = 1
V3
JKPAIR 4 i
87
92

is the replicate base weight formed by replacing the second member of thepair by the first, JKFAC is a constant multiplier (usually Huai. to 2)designed to maintain certain population totals, and where f and fi' are,respectively, nonresponse and post-stratification adjustment factors basedon these replicated base weights.
As a specific example of the use of the student replicate weights, lett(x,w) be any statistic which is a function of the sample responses x andthe weights w and which estimates population value T. For example, t couldbe a weighted mean, a weighted percent-correct point or a weightedregression coefficient. The t( ,w), computed with the sampling weights(WEIGHT on the data tapes) is the appropriate sample estimate of T. Tocompute Var(t), the sampling variance for this statistic, proceed in thefollowing manner:
1) For each of the 38 pa;rs of first-stage units, compute the),associated pseudo-repiicae for the statistic. For the ipair, this is
ti . t(x,SRWTi)
which is the statistic t reca'culated by using SRWTi insteadof the sampling weights.
2) The sample variance of t is
- 38Var(t) = E (t1 - t)2 .
This estimation technique is called the multi-weight jackknifeapproach. Tables 9-7 and 9-8 in Chapter 9 provide SPSS-X and SAS code forcarrying out the above in the special case of a weighted mean.
A similar procedure is followed to estimate the sampling variabilityfor statistics based on any of the bridge samples. The only difference isin the number of pairs (and hence replicate weights) used.
Replicate weights have been provided for the following samples:
1) Spiral students2) Bridge B students3) Bridge B excluded students4) Bridge A students5) Bridge A excluded students6) Teacher-student sample
SRWTO1 to SRWT38SRWTO1 to SRWT33EXVT01 to EXWT38SRWTO1 to SRWT33EXVT01 to EXVT33TSWTO1 to TSWT38
7.3.1 Degrees of Freedom bf the Jackknifed Variance Estimate
Note that the jackknife procedure estimate the sampling variability ofthe statistic by assessing the effect of change in the sample at the level
88

of clusters of first-stage units. For this reason, the number of degreesof freedom of the variance estimate Var(t) will be at most equal to thenumber of pairs. The nunber of degrees of freedom, which indicates thevariability of the variance estimate, equals the number of independentpieces of information used to generate the variance. In the current case,for the spiral sample, the pieces of information are the 38 squareddifferences (t. - t)2, each supplying at most one degree of freedom,regardless of how many individuals were sampled within any PSU. (There arefewer pairs with the bridge samples.)
Increasing the number of individuals sampled within any PSU results ina lower estimate of sampling variability because the within-PSU componentis reduced. This, however, does not improve the estimation of thebetween-PSU component of variability, which depends on the number of PSUsselected.
The number of degrees of freedom of the sample variance estimator canbe less than the number of pairs (38) when a few of the squared differences(ti - t)
2are markedly different in magnitude than the remainder. An
extreme case thisthis is when one or more of the ti are identical to t, sothat (t, - t) = 0. This may happen, for example, when the statistic t isa mean for a subgroup and no members of that subgroup come from the pair i.Sucli a pair contributes zero degrees of freedom to the variance.
An estimate of the effective number of degrees of freedom for liar(t)comes from an approximation due to Satterthwaite (1946). (See Cochran,1977, p. 96, for a discussion.)
The effective number of degrees of freedom using this approximation is
38t)2)2
i=1dfff =
38
Z (ti t)s
i=1
which i.:. never larger than 38.
7.4 APPROXIMATIONS
The major computational load in computing uncertainty measures for anystatistic exists in the computation of the uncertainty due to samplingvariability. As mentioned earlier, f.he procedure detailed n Section 7.3.1requires that the statistic be recomputed 39 times to obtain an estimate ofthe sampling variance of the statistic. This section describes how toapproximate the sampling variability for any statistic.
As indicated in Section 7.3.1, it is inappropriate to estimate thesampling variability of any statistic based on the NAEP database by using
89
94

simple random sampling (SRS) formulas. These formulas, which are the onesused by most standard statistical software such as SPSS and SAS, willproduce variance estimates which are generally much smaller than iswarranted by the sample design.
It may be possible to account approximately for the effects of thesample design by using an inflation factor, the design effect, developed byKish (1967) and e;:cended by Kish and Frankel (1974). The design effect fora statistic is the ratio of the actual variance of the statistic (takingthe sample design into account) over the conventional variance estimatebased on the same number of elements. To avoid sources of bias due toimproper representation, this conventional estimate must use the samplingweights. The design effect may be used to adjust error estimates based onsimple random sampling assumptions to account approximately for the effectof the design. In practice, this is often accomplished by dividing thetotal sample size by the design effect and using this effective sample sizein the computation of errors. Note that the value of the design effectdepends on the type of statistic computed and the variables considered in aparticular analysis as well as the clustering effects occurring amongsampled elements.
Based on empirical results and theoretic considerations, Kish andFrankel (1974) have developed several col.jectures about design effects:
1) Generally, the design effects for complex statistics fromcomplex samples are greater than 1, causing variances based onsimple random sampling assumptions to tend to be underesti-mates.
2) The design effects for complex statistics (such as regressioncoefficients) tend to be smaller than the corresponding designeffects for means of the same variables. Hence, these latterestimates, which are more easily computed, tend to giveoverestimates of the design effects of complex statistics.
3) The design effects of complex statistics tend to resemblethose of means; variables with a high design effect of themean also tend to have high design effects for enmplexstatistics involving those variables.
To incorporate the design effect idea in a statistical analysis,proceed in the following manner:
1) For a given class of statistics (e.g., means, percentilepoints, regression coefficients), compute the jackknifevariance as in Sectior 7.3.1 for a number of cases. The casesshould cover the range of situations for which the approxima-tion is to br used. If various subpopulati3ns are to be con-sidered, it is important to have information on the relativevariability within ear.: subgroup. This is especially i':por-tant if certain subgroups are more highly clustered in .hesample.
90

2) For the identical cases, compute the conventional estimate ofthe variance. This estimate must take the sample weights intoaccount to avoid problems of bias due to improper representa-tion. To account properly for the difference between thenumber of individuals being sampled end the total of thesampling weights, the weights should be scaled so that theirsum equals the sample size.
3) For each case, compute the design effect where the designeffect for case j is
deffj = VarjK(td/VarcoN(tj)
the ratio of the jackknife variance estimate of the statisticto its conventional variance estimate.
4) If the design effects for the various cases are tolerablysimilar, choose an overall composite design effect. If thedesign effects for certain subgroups appear to cluster arounda markedly different value from the remaining cases, treatthose subgroups separately.
5) In the case that a consistent overall design effect has beenfound:
a) rescale the weight of each individual so that thesum of the scaled weights is equal to the effectivesample size
sample sizeNsff design effect
b) conduct a -raditional weighted analysis using thesescaled weights
6) The degrees of freedom for any variance estimates obtained byusing this approach is still at best 38, the number of pairs,as it was for the jackknife. Accordingly, tests of signifi-cance produced by standard programs (which will use the effec-tive sample size minus the number of parameters for errordegrees of freedom) should be interpreted with extreme cautionbecause they are likely to be too liberal. Significance andinferential procedures are properly based o- the smaller errordegrees of freedom.
7.5 A NOTE CONCERNING MULTIPLE COMPARISONS
In performing multiple hypothesis tests it is important to consider thefact that if J tests are performed, each with a Type I error rate (theprobability of rejecting the null hypothesis when the null hypothesis is
91
96

true) of a, the Type I error rate for the entire set of contrasts could beas high as Ja. Therefore, it is desirable to use a multiple comparisonprocedure to control the overall error rate for the entire set ofhypothesis tests. In the present case, it is advantageous to use aprocedure that allows control of the error rate for sets of varying sizethat may include both pairwise and complex comparisons. (An exahiple of acomplex contrast is a comparison of one group to the average of two othergroups.) The Dunn-Bonferroni approach is, therefore, a good choice. Toapply this method in its simplest form, we need only decide at what levelwe wish to control the setwise error rate (as) and then set the Type Ierror rate for each comparison equal to ac = as/J, where J is the number ofcomparisons.
For example, suppose we wanted to perform three pairwise comparisonsbetween regional groups, as well as one complex comparison, controlling asat .05. The Type I error rate for each comparison should be set atac a
s
.05/4 .0125. The required critical value can be obtainedfrom a table of the Bonferroni t-statistic (Miller, 1981, p. 238) with theappropriate degrees of freedom.
References
Cochran, W. G. (1977). Sampling techniques (3rd ed.). New York: JohnWiley & Sons.
Kish, L. (1967). Survey sampling. New York: John Wiley & Sons.
Kish, L., & Frankel, M. R. (1974). Inference from complex samples.Journal of the Royal Statistical Society, Series B, 36, 1-22.
Miller, R. G. (1981). Simultaneous statistical inference (2nd ed.). NewYork: Springer.
Satterthwaite, F. E. (1946). An approximate distribution for estimates ofvariance components. Biometrics, 2, 110-114.
92
9 '"?

Chapter 8
CONTENT AND FORMAT OF THE DATA TAPES
98

Chapter 8: CONTENT AND FORMAT OF THE DATA TAPES'
8.1 INTRODUCTION
This chapter provides detailed information concerning the contents andformat of each data fill on the 7ublic-use data tapes and of the printedlayouts and codebooks produced for the 1985-86 assessment.
8.2 RAW DA1A FILES
The raw data files contain one record per student, excluded student,teacher, and school. All raw data files are rectangular, so that recordlengths are f!xed and a given variable always occurs in the same positionon every record within a file. The data files for each grade/age aredescribed in Tables 8-4, 8-5, and 8-6.
Due to the spiral design (see Chapter 3), students were administereddifferent blocks of items during the 1985-86 assessment. As a result, eachstudent record contains blank spaces for the exercise blocks that were notincluded in his or her assessment booklet (missing by design). Fields arealso blank for items which did not appear in booklets due to a pLintingerror (e.g., incorrect block in book, missing pages) and for theprofessionally scored items that were not included in reliability checks(see Section 5.4 in Chapter 5).
Responses classified as off-task, illegible, omitted or not reached, IDon't Know, or out-of-range have been included in the raw data files,codebooks, and machine-readable catalogs and are coded as indicated inTable 8-1.
8.3 LAYOUTS
With the exception ol. '4 types, all information in the layouts hasbeen numerically coded. The la, ts include the following information foreach data field:
SEQ. NO. Sequence number. Fields are numbered sequentially torepresent the order in which they appear on the datarecord.
'Data collected from the Teacher Questionnaire and the Excluded StudentQuestionnaire, sampling weights for schools, excluded students, andteachers, and IRT parameters for student responses are not contained on theVersion 1.0 data tapes. They will be included in Version 2.0.
95

Table 8-1
Code Definitions
CODE FORFIELD
WIDTH = 1
CODE FORFIELD
WIDTH = 2 CODE DEFINITION
5 55 ILLEGIBLE (items N003104 and N003105 only)
6 66 OFF TASK (items N003104 and N003105 only)
7 77
I DON'T KNOW (items N003104, N003105 and allmultiple-choice items)
NON-RATEABLE (professionally scored items)
8 88 OMITTED or NOT REACHED (all items)
9 99 OUT-OF-RANGE RESPONSE (all items)
96 -100

FIELD NAME A short name (of up to eight characters) whichidentifies the field. The format of the field namesass,-ciated with response data follows:
Position 1 identifier nature/source of the response data:
Positions 2through 5
Positions 6and 7
Position 8
B = Common background item within common backgroundblock
S = Background and attitude item within cognitive block(with two exceptions: item S002701 appears in thecommon background block for all grade/ages; itemS004001 appears in the common background block forgrade 7/age 13 and grade 11/age 17)
N = Cognitive item within cognitive blockC = School questionnaire itemT = Teacher questionnaire itemX = Excluded student questionnaire itemH = U. S. history itemL = Literature item
identify an exercise (Student files) or question(School, Teacher, Excluded Student files). If position1 is S or N, a zero in position 2 signifies a readingitem; a 2 signifies a mathematics item; 4 signifies ascience item; and 6 signifies a computer item.
identify a part within an exercise (Student files) ora part within a question (School, Teacher, ExcludedStudent files)
identifies the block containing an item (Student filesonly). To save file space, the numeric designation (1through 11) has been replaced-by an alphabetic one (hthrough K). This position is left blank forquestionnaire variables.
COL. POS. Column position. The start location of the field on thedata record.
FIELD WIDTH The number of characters in the field.
DECIMAL PLACES The number of digits to the right of the decimal pointin the field. The raw data contain implicit decimalpoints.
TYPE The files include three field types, as follows:
Type C (Continuous) fields designate continuous numerical datawithout fixed ranges.
Type D (Discrete) fields designate discrete data with a fixednumber of responses. Type D fields may include raw itemresponses or imputed (derived) categorical variables.
97
101

Type DI (Discrete with "I Dor't Know") fields designate discretedata with a special code for an "I Don't Know" response.Depending on the field width, the "I Don't Know" valueis either 7 or 77.
RANGE The range of values or of valid responses for a field.
KEY VALUE The correct response for a multiple-choice item. Forsome professionally scored items, the key is expressedas a range of values, denoting cut-point scoring foritem analysis. (See CORRECT RESPONSE in Section 8.5.)
SHORT LABEL A brief description of the information in the field.
3.4 CODEBOOKS
Each entry in the codebooks represents a distinct assessment item oritem information. The first line of each codebook entry contains thefollowing information:
SEQ. NO. Sequence number. In conjunction with the numbersassigned ia the layouts, the fields in the codebooks arenumbered sequentially.
FIELD NAME A brief description of the information in the field.The field names in the codebooks correspond to those inthe layouts.
REL. IND. Released indicator. Indicates that an item has beenreleased to the public (R) or that an item has been heldsecure (U).
TYPE
BLOCK
ITEM NO.
In conjunction with the three field types defined forthe layouts above, the field type is designated asContinuous (C), Discrete (D), or Discrete with "I Don'tKnow" (DI).
For assessment items, indicates the block in which anitem appeared for the grade/age group of students forwhich the codebook was prepared. (See Table 8-2 forblock designations.)
Indicates the number of an item within a block for thegrade/age group of students for which the codebook iTprepared.
98
102

Table 8-2
Block Designations and File Locations
BLOCK LOCATION DESCRIPTION
ID Student FilesAssessment identification andinformation from booklet cover
WT Student Files Weights and derived variables
BA Student Files Common background items
CA-CF* student Files Computer competence items
HA-HD* Student Files U.S. history items
LA-LD* Student Files Literature items
MA-MK* Student Files Mathematics items
RA-RF* Student Files Reading items
SA-SK* Student Files Science items
XI
ExcludedStudentFiles
Assessment identification andinformation from questionnairecover
XWExcludedStudent Files
Weights and derivedvariables
XQExcludedStudent Files
Excluded student questionnaireitems
TITeacherFiles
Assessment identification andinformation from questionnairecover
TW Teacher Files Weights and derived variables
TQ Teacher Files Teacher questionnaire items
SS School Files Assessment identification
SW School Files Weights and derived variables
SQ School Files School questionnaire items
TC School FilesComputer coordinatorquestionnaire items
*To save file space, the numeric block designation (1 through 11)has been replaced by an alphabetic designation (A through K).
99
103

AGES Indicates the student grade/age or age groups to whom anitem was administered, as follows:
NAME/DESCRIPTION
OLD ID (NAEP ID)
Spiral Samples Bridge Samples
1 = Grade 3/Age 92 = Grade 7/Age 133 = Grade 11/Age 17
1 = Age 92 = Age 133 = Age 17
Provides a brief description of the item or informationin the field.
If an item has been used in the past, the ID numberassigned to it during previous assessments is includedas the last number on the first line of the codebookentry.
Please note that, for items administered to more than one grade/agegroup, the information under BLOCK and ITEM NO. refers only to thegrade/age group for which a codebook was prepared. For example, the blocklocation and item number for an item in the grade 3/age 9 (grade/age 1)codebook apply to grade/age 1 only. The block location and item number maybe different for grade/age groups 2 and 3. The block and item wambers foreach grade/age group are indicated in the appropriate codebooks.
For all discrete variables and items, the third and subsequent linescontain each valid data value, its associated label, and the unweightedfrequency of that value in the data file associated with the codebook.(For achievement items, the key data value is indicated by an asterisk.)The last line under each discrete variable entry contains the "TOTAL" orsum of the frequency counts as an extra check for analyses.
8.5 MACHINE-READABLE CATALOGS
Each raw data file has a corresponding machinereadable file; thesefiles all have the suffix CAT. The files, designed to help users extractdata of interest from the raw data, contain a record for each variable oritem on the raw data files. Table 8-3 contains the machine-readablecatalog data layout. Specific information concerning the contents of thecatalogs is provided below.
FIELD SEQUENCE Fields are numbered sequentially to represent theNUMBER order in which they appear on the raw data record.
FIELD NAME A short name of up to eight characters that identifiesthe field.
START COLUMN The start location of the field on the raw data record.
END COLUMN The end location of the field on the raw data record.
FIELD WIDTH The number of characters in the field.
100
104

Table 8-3Machine-Readable Catalog Data Layout
START ENDCOLUMNS
FIELDWIDTH FIELD DESCRIPTION COMMENTS
1 - 4 4 Field Sequence Number
5 - 12 8 Field Name New NAEP Identification
13 - 16 4 Start Column
17 - 20 4 End Column
21 - 22 2 Field Width
23 - 23 1 Decimal Places
24 - 24 1 Field Type 1=Discrete 2=Continuous
25 - 27 3 Minimum Valid Response
ExcludingI Don't Know responses28 - 30 3 Maximum Valid Response
31 - 32 2 Correct Response
33 - 34 2 I Don't Know (IDK) Code
35 - 36 2 No Response Code
37 - 38 2
Multiple and Out-Of-RangeCode
39 - 88 50 Field Label
89 - 104 16 Old NAEP Identification
105 - 128 24 IRT ParametersThree fields,eight positions each
129 - 130 2
Number of ResponseValues and Labels
This number determines thenumber of response valuesand labels that follow
131 - 132 2 Response Value
1st Value133 - 152 20 Response Label
153 - 154 2 Response Value
2nd Value155 - 174 20 Response Label
.
.
549 - 550 2 Response Value
20th Value551 - 570 20 Response Label
101
105

DECIMAL PLACES
FIELD TYPE
Type I
Type 2
MINIMUM VALIDRESPONSE
MAXIMUM VALIDRESPONSE
The number of digits to the right of the decimal pointin the field. The raw data contain implicit decimalpoints.
The files include two field types:
(Discrete) fields designate discrete data with a fixednumber of responses. Type 1 fields may include raw itemresponses or imputed categorical variables.
(Continuous) fields designate continuous numerical datawithout fixed ranges.
The minimum value of valid responses for an item,excluding "I Don't Know" response.
The maximum value of valid responses for an item,excluding "I Don't Know" response.
CORRECT RESPONSE This is a two-position field. If the second position isblank, the item has a unique correct response in thefirst position. If the second position is not blank,the item has more than one correct response and thefield indicates the correct response range. The firstposition is the lowest correct response value; thesecond is the highest correct response value. Forexample, if possible responses for a professionallyscored reading item ranged from 0 to 5, and 3 to 5 wasconsidered an acceptable response, the first position ofthe field would contain a 3 and the second positionwould contain a 5.
I DON'T KNOW For appropriate multiple-choice items, the numbers inthe "IDK Value" column reflect the option to respond byindicating "I Don't Know." "I Don't Know" values havebeen recoded to 7 or 77. Otherwise, this field isblank.
NO RESPONSE CODE Where applicable, omitted or not reached values havebeen recoded to 8 or 88. Otherwise, this field isblank.
MULTIPLE ANDOUT-OF-RANGECODE
Where applicable, multiple or out-of-range responseshave been recoded to 9 or 99. Otherwise, this field isblank.
OLD NAEP ID If an item has been use.. in the past, this is the numberassigned to it during previous assessments.
102
106

IRT PARAMETERS
NO. OF RESPONSEVALUES & LABELS
RESPONSE VALUESAND LABELS
Three eight-character fields containing IRT itemparameters: "a" (discrimination); "b" (difficulty); and"c" (lower asymptote). Each parameter is represented toa precision of five decimal places with an explicitdecimal point. (Not included on Version 1 tapes.)
The number of possible valid responses plus "I Don'tKnow," no response, multiple and out-of-range.
For each possible item response, a two-position fieldwhich indicates the response value and a 20-positiontext field which provides a brief description of theresponse.
8.6 SPSS-X AND SAS CONTROL STATEMENT FILES
All data files on the public-use data tapes are accompanied by separatecontrol files to facilitate the creation of SPSS-X and SAS system files.These control files include statements for variable definitions, variablelabels, missing value codes, value lab21.1., and an optional section forcreating and storing scored variables. Each set of control statements alsogenerates unweighted descriptive statistics of the reporting variables forthe related data file and a listing of the contents of the saved systemfile.
Specific details on the structure and use of these control files areprovided in Chapter 9.
103
107

Table 8-41985-86 Public-Use Data Tape Description
Grade 3/Age 9
DATA FILESRECORDLENGTH
BLOCKSIZE
# OFRECORDS FILE NAME
Data Files
1. Student Spiral Data 1098 18666 21287 Y17RMSC1.BIB.DAT2. Bridge Booklet 1 544 19040 2315 Y17RMSC1.BR1.DAT3. Bridle Booklet 2 537 18795 2361 Y17RMSC1.BR2.DAT4. Bridge Booklet 3 550 18700 2256 Y17RMSC1.BR3.DAT5. Bridge Booklet 4 557 18938 1994 Y17RMSC1.BR4.DAT
6.BTidge Booklet 5 540 18900 2048 Yl7RMSCLBR5.DAT7. School Questionnaire 549 18616 632 Y17RMSCLSCO.DAT
SPSS-X Control Statem:nt Files
8. Student Spiral Data 80 19040 3890 Y17RMSC1.BIB.SPX9. Bridge Booklet 1 80
8:7-171442Y17RMSC1.BR2.SPX19040 865 Y17RMSC1.BR1.SPX
10. Bridge Booklet 211. Bridge Booklet 3 80 19040 902 Y17RMSC1.BR3.SPX12. Bridge Booklet 4 80 19040 991 Y17RMSC1.BR4.SPX13. Bridge Booklet 5 80 19040 866 Y17RMSC1.BR5.SPX14. School Questionnaire 80 19040 723 Y17RMSC1.SCQ.SPX
SAS Control Statement Files
15ejtt1480 19040 4021 Y17RMSC1.BIB.SAS
1 . Bridge Boo et 80 19040 946 Y17RMSC1.BR1.SAS17. Bridge Booklet 2 80 19040 897 Y17RMSC1.BR2.SAS18. Bridge Booklet i 80 19040 966 Y17RMSC1.BR3.SAS19. Bride Booklet 4 80 19040 1027 Y17RMSC1.BR4.SAS2$. Bridge Boo et 1 Y RMSC .BR .SAS21. School Questionnaire 80 1904 1260 Y17RMSCLSCO.SAS
Machine-Readable Catalog Files
22. Student Spiral Data 570 18810 765 Y17RMSC1.BIB.CAT23. Brid:e Booklet 1 570 18810 213 Y17RMSCLBR1.CAT
. Br .a.. Boo et 0 1 2 7 Y 7RMSC .B.1...CAT25. Bridge Booklet 3 570 18810 218 Y17RMSC1.BR3.CAT26. Brid:e Booklet 4 570 18810 226 Y17RMSC1.BR4.CAT
. Br :e Boo et 570 :: I 211 Y RMSC .BRJ.CATY17RMSC1.SCQ.CAT:. Sc oo Quest onnaire 0 1880 82
104
108

Table 8-51985-86 Public-Use Data Tape Description
Grade 7/Age 13
DATA FILESRECORDLENGTH
BLOCKSIZE
# OFRECORDS FILE NAME
Data Files
1. Student Spiral Data 1606 17666 27668 Y17RMSC2.BIB.DAT
2. Bridge Booklet 1 597 18507 2075 Y17RMSC2.BR1.DAT
3. Bridge Booklet 2 567 18711 2054 Y17RMSC2.BR2.DAT
4. Bridge Booklet 3 585 18720 2071 Y17RMSC2.BR3.DAT
5. Bridge Booklet 4 608 18848 2032 Y17RMSC2.BR4.DAT
6. Bridge Booklet 5 584 18688 2146 Y17RMSC2.BR5.DAT
7. School Questionnaire 553 18802 567 Y17RMSC2.SCQ.DAT
SPSS-X Control Statement Files
8. Student Spiral Data 80 19040 6804 Y17RMSC2.BIB.SPX
441411:411ett 280 19040 1131 Yl7RMSC2.BR1.SPX
Y17RMSC2.BR2.SPX80 i9040 1005
11. Bride Booklet 3 80 19040 1115 Y17RMSC2.BR3.SPX
12. Bri ge Booklet 4 80 19040 1299 Y17RMSC2.BR4.SPX
13. Bridge Booklet 5 80 19040 1120 Y17RMSC2.BR5.SPX
14. School Questionnaire 80 19040 731 Y17RMSC2.SCQ.SPX
SAS Control Statement Files
15. Student Spiral Data 80 19040 7041 Y17RMSC2.BIB.SAS
16. Bridge Booklet 1 80 19040 1247 Y17RMSC2.BR1.SAS
17. Bridge Booklet 2 80 19040 1093 Y17RMSC2.BR2.SAS
18. Bridge Booklet 3 80 19040 1222 Y17RMSC2.BR3.SAS
19. Bridge Booklet 4 80 19040 1359 Y17RMSC2.BR4.SAS
20. Bridge Booklet 5 80 19040 1194 Y17RMFC2.BR5.SAS
21. School Questionnaire 80 19040 1273 Y17RMSC2.SCQ.SAS
Machine-Readable Catalog Files
22. Student Spiral Data 570 18810 1270 Y17RMSC2.BIB.CAT
23. Bridge Booklet 1 570 18810 264 YI7RMSC2.BR1.CAT
24. Bridge Booklet 2 570 18810 236 Y17RMSC2.BR2.CAT
25. Bridge Booklet 3 570 18810 253 Y17RMSC2.BR3.CAT
26. Bridge Booklet 4 570 18810 276 Y17RMSC2.BR4.CAT. Br .ge Booklet 0 188 0 53 Y17RMSC2.BR .CAT
28. School Questionnaire 570 18810 386 Y17RMSC2.SCQ.CAT
105
109

Table 8-61985-86 Public-Use Data Tape Description
Grade 11/Age 17
DATA FILESRECORDLENGTH
BLOCKSIZE
# OFRECORDS I FILE NAME
Data Files
1. Student Spiral Data 2407 16849 39753 Y17RMSC3.BIB.DAT2. Bridge Booklet 4 631 18930 1934 Y17RMSC3.BR4.DAT3. Bridge Booklet 5 615 19065 1934 Y17RMSC3.BR5.DAT4. School Questionnaire 598 I 18538 433 Y17RMSC3.SCQ.DAT
SPSS-X Control Statement Files
5. Student Spiral Data 80 19040 10489 Y17RMSC3.BIB.SPX6. Bridge Booklet 4 80 19040 1320 Y17RMSC3.BR4.SPX
Y17RMSC3.BR5.SPX7. Bridge Booklet 5 80 19040 12098. School Questionnaire 80 19040 767 Y17RMSC3.SCQ.SPX
SAS Control Statement Files
9. Student Spiral Data 80 19040 11196 Y17RMSC3.BIB.SAS10. Brid:e Booklet 4 80 19040 1421 Y17RMSC3.BR4.SAS
. Brisge Boo et 80 19040 1 1 Y1 RMSC .BR .SAS12. School Questionnaire 80 19040 1329 Y17RMSC3.SCQ.SAS
Machine-Readable Catalog Files
13. Student Spiral Data 570 18810 2069 Y17RMSC3.BIB.CAT14. Bridge Booklet 4 570 18810 297 Y17RMSC3.BR4.CAT15. Bridge Booklet 5 570 18810 281 Y17RMSC3.BR5.CAT16. School Questionnaire 570 18810 410 Y17RMSC3.SCQ.CAT
106 to

Chapter 9
WORKING WITH SPSS-X AND SAS
111

Chapter 9: WORKING WITH SPSS-X AND SAS'
9.1 INTRODUCTION
This chapter discusses the use of the statistical software SPSS-X andSAS in analyzing 1985-86 NAEP data. Included are procedures for creatingSPSS-X and SAS system files, merging files using SPSS-X and SAS, and usingthe jackknife procedure with SPSS-X and SAS to estimate standard errors.
9.2 SPSS-X AND SAS CONTROL STATEMENT FILES
All data files on the public-use data tapes are accompanied by separatecontrol files to facilitate the creation of SPSS-X and SAS system files.These control files include statements for variable definitions, variablelabels, missing value codes, value labels, and an optional section forcreating and storing scored variables. Each set of control statements alsogenerates unweighted descriptive statistics of the reporting variables forthe related data file and a listing of the contents of the saved systemfile.
The common features of both types of control files, as well as generalguidelines, are provided below.
VARIABLE The field names are listed in the order in which theyDEFINITION appear on the file, along with their column position and
input formats. If the field is numeric with no decimalplaces, no format is provided. Otherwise the format isindicated by a number for the number of decimal places,or a '$' or '(A)' for a non-numeric field.
VARIABLE LABELS A 40-character text description for each field.
MISSING VALUES All blank fields in the data are automatically set tothe system missing value by each package. However, allmultiple-choice and some open-ended items were prone toeither multiple or out-of-range responses. These itemswere coded as fields of 9s in the data files. Thecontrol statement files instruct each system to treatthese values as missing.
'Data collected from the Teacher Questionnaire and the Excluded StudentQuestionnaire, sampling weights for schools, excluded students, andteachers, and IRT parameters for student responses are not contained on theVersion 1.0 data tapes. They will be included in Version 2.0.
109
112

VALUE LABELS
SCORING
All numeric fields with discrete (orare provided with 20-character text dvalue within the variable's range.
categorical) valuesscriptors for each
For each 4tem with one or more correctcontrol statements are provided for crevariable, its label, and its value labeof each item is performed according to tscheme: missing values are copied as is,response values are recoded to 1, all othincluding No Response and "I Don't Know,"O. The scoring of the No Response and "Ivalues are coded separately from other incresponses to allow the user to edit these cstatements and substitute alternate values.
responses,ating a scoreds. The scoringhe following
correcter values,are recoded asDon't Know"rrectontrol
The scored variable names are derived by repvalue in the sixth and seventh digits of thename with that value plus 50. For example, t
version of item number N001503A is N001553A.block of scoring control statements is performconditionally and, by default, will not be savsystem file. The user must edit only one stateeither type of file to invoke the scoring and tthe new variables.
lacing theoriginalhe scoredThe entireed
d on thement in
save
IMPORTANT NOTE: The system file generation programs cannot runthe control statement file and its corresponding data file reside onsame tape. Both SPSS-X and SAS will try to read a data file beforehave completed processing the control statement file, which is physicimpossible if both files are on the same tape. The user is advised tthe control files to disk, as they require less storage space and allouser to edit the control statements before generating the system files
if boththeheyally
copyw the
9.3 CREATING SPSS-X SYSTEM FILES
Each SPSS-X control statement file is linked to its corresponding datfile through the file name: the suffix DAT in the data file name isreplaced by SPX to obtain the control statement file name. For example,
file "Y17RDVR1.BIB.SPX" is the control statement file for data file"Y17RDVR1.BIB.DAT."
a
All SPSS-X control statement files have been generated according to thestructure in Table 9-1.
The TEMPORARY command instructs SPSS-X to perform the subsequentscoring statements on a temporary basis and delete the new variables afterthe next procedure encountered (FREQUENCIES). Thus, the scored variableswill NOT be saved on the system file unless the TEMPORARY command iscommented or edited out.
110
113

Table 9-1SPSS-X Control Statement Synopsis
TITLElabel for sysout of file generation run
FILE LABELlabel to be stored with file
DOCUMENTtext description of data to be saved in file
DATA LIST FILE=RAWDATA/variable names, locations, & formats
VARIABLE LABELS40-character label for each variable
MISSING VALUESlist of variables to have user-missing values assigned
VALUE LABELSvariable names, values, & value labels
TEMPORARY [delete this statement tosave scored variables]
RECODEoldvar (SYSMIS =SYSMIS) (9 =9) (keyval =1)(nrval=0) (idlwal.0) (ELSE=0) INTO newer
VARIABLE LABELSlabels for new variables
MISSING VALUESfor multiple & out-of-range recodes
VALUE LABELS1=Correct O= Incorrect
FREQUENCIESreporting variables
SAVE OUTFILE.SYSrILE/COMPRESSEDDISPLAY LABELS
111
114

All control statement files assume that the file handle (or DDNAME) forthe, input data file is RAWDATA, and the file handle for the output systemfile is SYSFILE.
Ine control statements were coded according to the command andprocedure descriptions in the SPSS-X User's Guide (SPSS Inc., McGraw-HillBook Company, 1983). They were tested under SPSS-X Version 2.1(IBM-OS/MVS).
9.4 CREATING SAS SYSTEM FILES
Each SAS control statement file is linked to its corresponding datafile through the file name: the suffix DAT in the data file name isreplaced by SAS to obtain the control statement file name. For example,file "Y17RDVR1.BIB.SAS" is the control statement file for data file"Y17RDWR1.BIB.DAT."
All SAS control statement files have been generated according to thestructure in Table 9-2.
All SAS control files use the SAS Macro Language facility to reduce thenumber of source statements generated and to provide consistent performanceof repetitive functions. Therefore, the user must ensure that the MACROoption is invoked whenever processing any of the control statement files.
The DO OVER through END statements following each ARRAY statement setup the conversion of the "I Don't Know," No Response, and Multiple Responsecodes to the system missing value. However, once this conversion isexecuted and saved on the system file, these recoded values will beindistinguishable from actual missing values on the original data file.For this reason, these statements have been commented out to allow the userto decide which, if any, of the values are to be recoded. To activate thereceding, delete the asterisks preceding the DO OVER and END statements,and from the appropriate IF THEN statement(s).
The SCORE MACRO sequence sets up the creation of scored variables andtheir labels. To save these variables on the system file, edit thestatement immediately following the MACRO and delete the asterisk in thefirst column.
The control statements were coded according to the command andprocedure descriptions in the SAS User's Guide: Basics 1982 Edition (SASInstitute Inc., 1982). They were tested under SAS Version 82.4(IBM-OS/MVS).
112

Table 9-2
SAS Control Statement Synopsis
TITLEDATA SYSFILE.xxx;INFILE RAWDATA;INPUT
Variable names, column positions, & formatsLABEL40-character variable labels
ARRAY MVn (I)
list of variables to be recoded for missing*DO OVER MVn;
* IF MVn=7 THEN MVn=.;* IF MVn=8 THEN MVn=.;* IF MVn=9 THEN MVn=.;* END;
%MACRO FMTVAR;PROC FORMAT;VALUEvariable name value=value label
%MEND FMTVAR;LENGTH DEFAULT=2other variables with appropriate lengths;
%MACRO SCORE;%MACRO RECODE;
SAS macro to perform scoring for each variable%MEND RECOJE;%RECODE
(oldvar,newvar,idkval,nrval,keyval)
LABELlabels for new variables
PROC FORMAT;
value labels for new variables%MEND SCORE;*%SCORE;
%FMTVAR;PROC FREQ;TABLES
reporting variablesPROC CONTENTS NOSOURCE POSITION;
[delete asterisk tosave scored variables]
113
116

9.5 MERGING FILES UNDER SPSS-X OR SAS
The NAEP data files are structured to facilitate matching among thefour instruments (Student, Teacher, School, and Excluded Student). However,for the purposes of analysis and reporting, only four types of linkages arevalid:
1) School with Student (spiral or bridge)2) Teacher with Student (spiral only)3) School with Excluded Student (spiral or bridge)4) School with Teacher with Student (spiral only)
The primary linkage on all files is through the scrambled PSU andschool code fields: SCRPSU, SSCRPSU, TSCRPSU and XSCRPSU. The secondarylinkage for the BIB Spiral and Teacher files is through the scrambledteacher code fields: SCRTC and TSCRTC. All files are sorted by these fieldsto permit direct match-merging without the need to re-sort.
When a hierarchical file match is performed, both SPSS-X and SAS builda rectangular file at the level of the lowest file in the match. Eachrecord from the higher order file is repeated across the correspondingrecords of the lower order file. For example, in matching School withStudent data, the information from one school record is repeated across allstudent records belonging to that school. Clearly, the number of variablesfrom the higher order file will have a greater impact on the size of theresulting merged file.
The examples contained in Tables 9-3 through 9-6 will perform directmatches according to the four linkages listed above. The KEEP statementsare not necessary to the performance of the merge, but when applied to onlythose variables required for analysis will make more efficient use ofcomputer resources. These examples also assume that no transformations areto be performed on the input files. If transformations are desired foranalysis, the most efficient course to follow would be to transform thevariables from the higher order file first, perform the match procedure,then transform the variables from the lower order file.
9.6 COMPUTING THE ESTIMATED VARIANCE OF A MEAN (JACKKNIFING)USING SPSS-X OR SAS
A method for computing the estimated variance of a mean is presented inthis section in SPSS-X and SAS program code form (see Section 7.3.1 inChapter 7 for a discussion of the jackknife procedure). This method, themulti-weight method, may be used for any variable.
For each vaeoble to be jackknifed, generate two vectors of weigl!edsums and products. Sum these vectors across the entire file using theAGGREGATE (SPSS-X) or SUMMARY (SAS) procedures. From the weighted sumscompute the weighted means and thence compute the estimated variance andstandard error.
114
117

One advantage to this approach is chat it will accomplish the computa-tion in one pass of the data. Another advantage, afforded by the AGGREGATE(SPSS-X) and SUMMARY (SAS) procedures, is the facility to compute subgroupstatistics by using the BREAK keyword (SPSS-X) or CLASS option (SAS) withthe variable(s) defining the subgroups. Al? computations performedsubsequent to the aggregation procedure are performed on each record of thecollapsed file, corresponding to one of the subgroups. In the examples inTables 9-7 and 9-8, the variable SEX is used as a break control variable,and the derived statistics are printed for each sex code.

Table 9-3
Matching School and Student Files
SPSS -X
MATCH FILESTABLE = SCHOOL/
RENAME=(SSCRPSU.SCRPSU)/FILE=STUDENT/KEEP.SCRPSU,other school & student variables/BY=SCRPSU
SAS
DATA MATCH1;MERGE SCHOOL (RENAME= (SSCRPSU =SCRPSU)
KEEP=SSCRPSU other school variables)STUDENT(KEEP= SCRPSU other student variables);
BY SCRPSU;
Table 9-4
Matching Teacher and Student Files
SPSS-X
MATCH FILESTABLE.TEACHER/IN=INTEACH/
RENAME=(TSCRPSU=SCRPSU)(TSCRTC=SCRTC)/FILE=STUDENT/KEEP=SCRPSU,SCRTC,other teacher & student variables/BY.SCRPSU,SCRTC
SELECT IF (INTEACH)
SAS
DATA MATCH2;MERGE TEACHER(RENAME =( TSCRPSU = SCRPSU TSCRTC=SCRTC) IN =T
KEEP.TSCRPSU TSCRTC other teacher variables)STUDENT(KEEP-.SCRPSU SCRTC other student variables);
BY SCRPSU SCRTC;IF T;
116
119

Table 9-5
Matching School and Excluded Student Files
SPSS-X
MATCH FILESTABLE.SCHOOL/
RENAME.(SSCRPSU.SCRPSU)/FILE.EXCLUDE/
RENAME.(XSCRPSU.SCRPSU)/KEEP.SCRPSU,other school & excluded student variables/BY= SCRPSU
SAS
DATA MATCH3;MERGE SCHOOL (RENAME =(SSCRPSU =SCRPSU)
KEEP.SSCRPSU other school variables)EXCLUDE(RENAME =(XSCRPSU =SCRPSU)
KEEP =SCRPSU other excluded student variables);BY SCRPSU;
117
120

Table 9-6
Matching School, Teacher and Student Files
SPSS-X
MATCH FILESTABLE.SCHOOL/IN.INSCHOOL/
RENAME=(SSCRPSU.SCRPSU)/FILE=TEACHER/
RENAME=(TSCRPSU.SCRPSU)(TSCRTC.SCRTC)/KEEP.SCRPSU,SCRTC,other school & teacher variables/BY.SCRPSU
SELECT IF (INSCHOOL)HATCH ?ILESTABLE4c/IN.INTEACH/FILE.STUDENT/
KEEP.SCRPSU,SCRTC,other school,teacher & student variables/BYSCRPSU,SCRTC
SELECT IF (INTEACH)
SAS
DATA MATCH4A;MERGE SCHOOL (RENAME-(SSCRPSU-SCRPSU)
KEEP =SSCRPSU other school variables)TEACHER(RENAME =(TSCRPSU =SCRPSU TSCRTC =SCRTC)
KEEP=TSCRPSU TSCRTC other teacher variables);BY SCRPSU;IF S;
DATA MATCH4B;MERGE MATCH4A (IN=T
KEEP = SCRPSU SCRTC other school
& teacher variables)STUDENT(KEEP=SCRPSU SCRTC other student variables);
BY SCRPSU SCRTC;IF T;

Table 9-7
Standard Error Computation: Multi-Weight MethodUsing SPSS-X
SPSS-XGET FILE = STUDENT/
KEEP.SEX,WEIGHT,JKWTO1 TO JKWT38,XVECTOR WT =JKWTO1 TO JKWT38VECTOR WX(38)SELECT IF (NOT SYSMIS(X))COMPUTE WTX.VE1GHT*XLOOP #I.1 TO 38
COMPUTE WX(#I) = VT(#I)*XEND LOOPAGGREGATE OUTFILE*/BREAKSEX/UWN.N(WEIGHT)/
SWT,SW1 TO SW38 . SUM(WEIGHT,JKWTO1 TO JKWT38)/SWX,SX1 TO SX38 . SUM(VTX,WX1 TO VX38)/
VECTOR SW SW1 TO SW38VECTOR SX . SX1 TO SX38COMPUTE XBAR . SWX/SWTCOMPUTE XVAR . 0LOOP #I.1 TO 38
COMPUTE #DIFF = SX(#I)/SW(#I) - XBAR. COMPUTE XVAR . XVAR + #DIFF * #DIFFEND LOOPCOMPUTE XSE = SORT(XVAR)PRINT FORMATS XVAR,XSE (F8.4)LIST VAR1ABLES.SEX,UWN,SWT,XBAR,XVAR,XSEFINISH
119
122

Table 9-8
Standard Error Computation: Multi-Weight MethodUsing SAS
SAS
DATA A;SET STUDENT;ARRAY WT JKWT01-JKWT38;ARRAY WX VX1-WX38;IF (X NE .);WTX = WEIGHT*X;DO OVER WT;
WX = WT*X;END;
PROC SUMMARY;CLASS SEX;VAR WEIGHT JKWT01-JKWT38 WTX WX1-VX38;OUTPUT OUT =B N(WEIGHT)=UWN
SUM(WEIGHT VTY. JKWT01-JKWT38 WX1-WX38)=SWT SVX SW1-SW38 SX1-SX38;
DATA C;SET B;ARRAY SW SW1 -SW38;ARRAY SX SX1-SX38;XBAR = SVX/SWT;XVAR = 0;DO OVER SW;
DIFF . (SX/SW)-XBAR;XVAR = XVAR+DIFF*DIFF;
END;
XSE . SQRT(XVAR);PROC PRINT;
VAR SEX UWN SWT XPAR XVAR XSE;
120
123
Appendix A
NAEP HISTORY
124

Appendix A: NAEP HISTORY
The National Assessment of Educational Progress (NAEP) is acontinuing, congressionally mandated national survey of the knowledge,skills, understandings, and attitudes of young Americans in major learningareas usually taught in school. Its primary goals are to detect andreport the current status of, as well as changes in, the educationalattainments of young Americans, and to report long-term trends in thoseattainments. The purpose of NAEP is to gather information which will aideducators, legislators and others in improving the educational experienceof youth in the United States. It is the first ongoing effort to obtaincomprehensive and dependable achievement data on a national basis in auniform, scientific manner.
Between 1964 and 1969, initial assessment planning and developmentactivities were conducted for NAEP with support from both the CarnegieCorporation and the Ford Foundation. During this time, objectives andexercises were developed for many of the learning areas, sampling and datacollection strategies were planned, and data analysis plans wereformulated and outlined.
From its inception, NAEP has developed assessments through a consensusprocess. In the process, educators, scholars, and lay persons designobjectives for each learhing area, proposing general goals they thinkAmericans should achieve in the course of their education. After carefulreviews, the objectives are given to item writers, who develop measurementinstruments appropriate to the objectives.
After the items pass extensive reviews by subject-matter specialists,measurement experts, and lay persons, and are tested in schools throughoutthe country, they are administered to a stratified multistage nationalprobability sample. The young people sampled are selected so thatassessment results may be generalized to the entire national population.
NAEP collected data for the first time in 1969. Since that time,
samples have included over one million 9-, 13- and 17-year-old studentsand, as funding would allow, 17-year-olds who had left school and adults26 to 35 years of age. In 1983-84, grade samples of students were added
to the assessment. As Table A-1 illustrates, assessment- have focused ontraditional learning areas such as reading, writing, mathematics, andscience, and on less traditional areas such as citizenship, art,literature, music, and career and occupational development.
Since 1971, NAEP has been solely supported by federal funds. Funding
agencies have included the Office of Education, the National Center forEducation, and the National Institute of Education. NAEP is currentlysupported by the Office for Educational Research and Improvement, Centerfor Statistics.
123
125

NAEP was administered by the Education Commission of the States (ECS)through 1982. In 1983, Educational Testing Service (ETS) assumedresponsibility for administration of the project. In assumingresponsibility for NAEP, ETS has incorporated an updated sampling designand, at the same time, has made a concerted effort to ensure continuitywith previous assessments.
Public-use data tapes were first produced in 1975, allowing outsideresearchers access to the NAEP database. In June 1985 ETS produced itsfirst public-use data tapes, in a new format, for the 1983-84 assessment.Although it will not be possible to change the format of the tapes issuedfor assessments prior to 1983-84, the new format produced by ETS makes thetapes easier to use (e.g., files have been more simply organized,documentation has been improved and made more accessible).
124
126

Table A-1National Assessment of Educational ProgressLearning Areas, Grades, and Ages Assessed
1969-1986
ASSESSMENT YEAR LEARNING AREAS
GRADES/AGES ASSESSED*Grade
3
Grade4
Age9
Grade7
Grade8
Age13
Grade11
Age17IS
Age170S
AgeADULT
Year 1/1969-70
Science X X X X X
Writing X X X X X
Citizenship X X X X X
Year 2/1970-71Reading X X X X X
Literature X X X X X
Year 3/1971-72Music X X X X X
Social Studies X X X X X
Year 4/1972-73Science (2) X X X X X
Mathematics X X X X X
Year 5/1973-74
Career and OccupationalDevelopment X X X X X
Writing (2) X X X X
Year 6/1974-75Reading (2) X X X X
Art X X X X
Year 7/1975-76
Citizenship/Social Studies (2) X X X X
Mathematics** X X
Year 8/1976-77
Science (3) X X X
Basic Life Skills** X
Health** X
Energy** X
Reading** (3) X
Science** (3) X
Year 9/1977-78Mathematics (2) X X X
Consumer Skills** X
Year 10/1978-79
Art (2) X X X
Music (2) X X X
Writing (3) X X X
Year 11/1979-80Reading (4) X X X X
Literature (2) X X X X
125
127128

Table A-1(continued)
ASSESSMENT YEAR LEARNING AREAS
GRADES/AGES ASSESSED*Grade
3
Grade4
Age9
Grade7
Grade8
Age13
Grade11
Age17IS
Age170S
AgeADULT
Year 12/1980-81 No Data Collection
Year 13/1981-82
Mathematics (3) XCitizenship/Social Studies (3) X X X
Science** (4) X X XYear 14/1982-83 No Data Collection
Year 15/1983-84Readin (5) X X X X X XVrarin 4) X X X X X X
Year 16/1984-85 Literacy**
Year 17/1985-86
Mathematics (4)Reading (6) X X X X XScience (5) X X X X X XComputer Competence X X X X X XLiterature** X XU. S. History ** X X
17IS denotes 17-year-olds enrolled in public or private schools; 170S denotes 17-year-olds who droppedout of school or graduated prior to the assessment
** Small, special-interest assessment conducted on limited samples at specific ages( ) Indicates second and subsequent assessments of a learning area
..0
129

Appendix B
RELATED MACHINE-READABLE DATA FILES
AND PRINTED REPORTS
131

APPENDIX B
Related Machine-Readable Data Files
Data files are also available for t!-a following NAEP assessments:
YEAR GRADE/AGE LEARNING AREA(S)
_1985 Adult Literacy1983-84
-9-8--3784----rad-e8/AgeGrade 4/Age 9 Readingand Writing
13 Reading and Writing1983-84 Grade 11/Age 17 Reading and Writing1981-82 Age 9 Math and Citizenship/Social Studies1981-82 A e 13 Math and Citizenshi /Social Studies1981-82 Age Mat an' C t zens ip/Soc a Studies1981-82 Age 9, 13, 17 Science Probe1979-80 Age 9 Reading/Literature1979-80 Age 13 Reading/Literature1979-80 Age 17 Reading/Literature1978-n Age 9 Art, Music, and Writing1978-79 Age 13 Art, Music, and Writing1978-79 Age 17 Art, Music, and Writing1978-79 Age 9, 13, 17 Vriting Essay Responses1978 Age 17 Consumer Skills1977-78 Age 9 Mathematics1977-78 A:e 13 Mathematics7 - Age Mat emat cs
1977 Age 17 Basic Life Skills1-077 Adults Science, Energy, Reading, and Health
1976-77 Age 9 Science1976-77 Age 13 Science1976-77 Age 17 Science1975-76 Age 9 Citizenship/Social Studies1975-76-B75-76
Age 13 Citizenship/Social StudiesAge 17 Citizenship /Social Studies
1975-7Z Age 13, 17 Supplemental Mathematics1974-75 Age 9 Reading1974-75 A:e 13 Rea in1' --1974-75
Age 17 RearingAge 9 Art
1974-75 Age 13 Art1974-75 Age 17 Art
(continued)
129
132

YEAR GRADE/AGE LEARNING AREA(S)
1973-74 Age 9 Career & Occupational Development and Writing1973-74 Age 13 Career & Occupational Development and Writing
1973-I4 Age 17 Career & Occupational Development and Writing1973-74 Adults Career & Occupational Development and Writing1973-74 Age 9, 13, 17 Writing Essay Responses1972-73 Age 9 Science and Mathematics1972-73 Age 13 Science and Mathematics1972-73 Age 17 Science and Mathematics1972-73 Adult Science and Mathematics
' A:e ' Rea. nl/L terature1'70-71 Age Rea.ing/L terature1970-71 Age 17 Reading/Literature1970-71 Adults Reading/Literature1969-70 Age 9, 13, 17 Writing Essay Responses
For more information about NAEP public-use data tapes, contact:
Norma NorrisSenior Research Data AnalystNational Assessment of Educational ProgressEducational Testing Service, 22-TPrinceton, NJ 08541(609) 734-5898
Related Printed Reports
The following reports provide additional information about the National Assessment ofEducational Progress. Please note that direct sources are included for each publication. butthat most may be obtained through the Educational Resources Information Center (ERIC) database.
MATHEMATICS
Education Commission of the States. (1981). Mathematics objectives, 1981-82 assessment. (ED211 3!,2) (NAEP-13-MA-10) (ISBN-0-89398-147-8) Denver, CO: National Assessment ofEducrl:mal Progress, 41p. Available from NAEP, CN6710, Princeton, NJ, 08541-6710.
Education Commission of the States. (1979). The second assessment of mathematics. 1977-78.released exercise set. (ED 187 543) Denver. CO: National Assessment of EducationalProgress, 366p.
Education Commission of the States. (1978). Mathematics objectives: Second assessment. (ED156 439) Denver, CO: National Assessment of Educational Progress, 52p. Available fromSuperintendent of Documents, U. S. Government Printing Office. Washington, DC, 20402.
Education Commission of the States. (1977). Mathematics lechical report: Exercise volume.(ED 138 468) (NAEP-04-MA-20) Denver. CO: National Assessment of Educational Progress.I ,412p. Available from Superintendent of Documents, U. S. Government Printing Office,Washington. DC, 20402.
Education Commission of the States. (1976). Mathematics technical report: Summary volume.(ED 129 636) (NAEP-04-MA-21) Denver. CO: National Assessment of Educational Progress.18ip. Available from Superintendent of Documents. U. S. Government Printing Office.Washington, DC, 20402.
Education Commission of the States. (1975). Math fundamentals: Selected results from thefirst National Assessment of mathematics. (ED 102 029) (NAEP-R-04-MA-01) Denver. CO:National Assessment of Educational Progress, 56p. Available from Superintendent ofDocuments, U. S. Government Printing Office, Washington, DC, 20402.
Education Commission of the States. (1975). Consumer math: Selected results from the firstNational Assessment o f mathematics. (ED 1 1 1 696) (NAEP-04-MA-02) Denver. CO: NationalAssessment of Education! Progress. 49p. Available from Superintendent of Documents.U. S. Governmernt Printing Office, Washington, DC. 20402.
Education Commission of the States. (1975). National Assessment of Educational Progress. Thefirst National Assessment of mathematics: An overview. (ED 127 198) (NAEP-04-MA-00)Denver, CO. National Assessment of Educational Progress. 64p. Available fromSuperintendent of Documents. U. S. Government Printing Office. Washington. DC. 20402.
131
134

Educational Testing Service. (1986). Math objectives. /985 -86 assessment. (17-M- I 0)Princeton. NJ: National Assessment of Educational Progress. 26p. Available from NAflP.CN6710, Princeton, NJ, 08541-6710.
Kahl. S. (1979). Mathematical knowledge and skills: Selected results from the secondassessment of mathematics. (ED 176 964) (NAEP-09-MA-02) Denver. CO: National Assessmentof Educational Progress. 83p. Available from Superintendent of Documents, U. S.Government Printing Office, Washington, DC, 20402 and from NAEP, CN6710, Princeton, NI.08541-6710.
Kahl. S. (1979). Mathematical understanding: Selected results from the second assessment ofmathematics. (ED 182 174) (NAEP-09-MA-04) Denver, CO: National Assessment ofEducational Progress. 53p. Available from Superintendent cf Documents, U. S. GovernmentPrinting Office, Washington, DC, 20402 and from NAEP, CN6710, Princeton. NJ, 08541-6710.
Phillips. D. (1980). Mathematics technical report: Summary volume. (ED 186 279)(NAEP-09-MA-21) Denver. CO: National Assessment of Educational Progress, 158p.Available from Superintendent of Documents, U. S. Government Printing Office, Washington,DC, 20402 and from NAEP. CN6710, Princeton, NJ. 08541-6710.
Norris. E. L., & Bowes. J. E. (1970). National Assessment of Educational Progress.mathematics objectives. (ED 063 140) Ann Arbor. MI: National Assessment of EducationalProgress, 41p. Available from NAEP. CN6710, Princeton: NJ. 08541-6710.
Ward, B. (1980). Procedural handbook: /977 -78 mathematics assessment. (ED 186 280)(NAEP-09-MA-40) Denver, CO: National Assessment of Educational Progress. 74p. Availablefrom NAEP, CN6710. Princeton. NJ. 08541-6710 and Superintendent of Documents. U. S.Government Printing Office, Washington. DC. 20402.
Ward, B. (1979). Changes in mathematical achievement. /973 -78: Results from the secondassessment of mathematics. (ED 177 011) (NAEP-09-MA-01) Denver. CO: National Assessmentof Educational Progress. 43p. Available from NAEP. CN6710, Princeton. NJ, 08541-6710.
Ward. B. (1979). Mathematical applications: Selected results from the second assessment ofmathematics. (ED 176 965) (NAEP-09-MA-03) Denver, CO: National Assessment ofEducational Progress. 66p. Available from Superintendent of Documents. TT. S. GovernmentPrinting Office, Washington. DC. 20402 and from NAEP. CN6710, Princeton. NJ, 08541-6710.
READING
DeCrow. R. (1972). Adult reading abilities: Definitions and measurements. (ED 068 810)Washington. DC: National Reading Center Foundation. 6p.
Gadway, C. J. (1973). Critical reading: Theme 8. reading. (ED 078 387) (NAEP-02-R-08)Denver. Co: National Assessment of Educational Progress. 182i Available fromSuperintendent of Documents. U. S. Government Printing Office. Washington. DC, 20402.
Gadway. C. J. (1973). Drawing inferences: Theme 7. reading. (ED 083 533) (NAEP-02-R-07)Denver. CO: National Assessment of Educational Progress. 275p. Available fromSuperintendent of Documents. U.S. Government Printing Office. Washington. DC. 20402.
132
135

Gadway. C. J. (1973). Gleaning significant facts from passages: Theme 5. reading. (ED 078360) (NAEP-02-R-05) Denver. CO: National Assessment of Educational Progress. 225p.Available from Superintendent of Documents. U. S. Government Printing Office. Washington.DC, 20402.
Gadway. C. J. (1973). Main ideas and organization: Theme 6. reading. (ED 079 688)(NAEP-02-R-06) Denver. CO: National Assessment of Educational Progress. 152p. Availablefrom Superintendent of Documents. U. S. Government Printing Office. Washington. DC. 20402.
Gadway, C. J. (1973). Reading: Released exercises. (ED 079 684) (NAEP-02-R-20) Denver. CO:National Assessment of Educational Progress. 424p. Available from Superintendent ofDocuments. U. S. Government Printing Office. Washington. DC. 20402.
Gadway. C. J. (1973). Reference materials: Theme 4. reading. (ED 079 687) (NAEP-02-R-04)Denver. CO: National Assessment of Educational Progress. 164p. Available fromSuperintendent of Documents. U. S. Government Printing Office. Washington, DC. 20402.
Gadway. C. J. (1973). Understanding words and word relationships: Theme 1 the NationalAssessment of reading. (ED 077 021) (NAEP-02-R01) Denver. CO: National Assessment ofEducational Progress. 106p. Available from Superintendent of Documents. U. S. GovernmentPrinting Office, Washirgton. DC. 20402.
Gadway, C. J. (1973). Written directions.. Theme 3. reading. (ED 083 572) (NAEP-02-R-03)Denver. CO: National Assessment of Educational Progress. 155p. Available fromSuperintendent of Documents. U. S. Government Printing Office. Washington, DC. 20402.
Gallo. D. R. (1972). Reading rate and comprehension: 1970-71 assessment. (ED 076 934)(NAEP-02-R-09) Denver. CO: National Assessment of Educational Progress. 24p. Availablefrom Superintendent of Documents. U. S. Government Printing Office, Washington. DC. 20402.
Education Commission of the Sit s. (1984). Reading objectives. 1983-84 Assessment. (NAEP15-RL-10) (ISBN-0-88685-022-3) Denver. CO: National Assessment of Educational Progress.Ilp. Available from NAEP. CN6710. Princeton. NJ. 08541-6710.
Education Commission of the States. (1982). Reading comprehension of American youth: Do theyunderstand what they read? Results from the 1979-80 National Assessment of reading andliterature. (ED 217 396) (NAEP-11-R-02) (ISBN-0-89398-223-7) Denver. CO: NationalAssessment of Educational Progress. 89p. Available from NAEP. CN6710. Princeton. NJ.08541-6710.
Education Commission of the States. (1981). Has Title I improved education for disadvantagedstudents? Evidence from three national assessments of reading. (ED 201 995)(NAEP-SY-DS-50) Denver. CO: National Assessment of Educational Progress. 9p. Availablefrom NAEP. CN6710, Princeton. NJ, 08541-6710.
Education Commission of Opt States. (1981). Procedural handbook: 1979-80 reading andliterature assessment. (ED 210 300) (NAEP-11-RL-40) (ISBN-0-89398-221 3) Denver. CO:National Assessment of Educational Progress. 103p. Available from NAEP. CN6710,Princeton. NJ, 08541-6710.
Education Commission of the States. (1981). Reading/literature released exercise set. 1979-80Assessment. (ED 205 588) (N kEP-11-RL-25) (ISBN-0-89.)98-222-9) Denver. CO: NationalAssessment of Educational Progress. 355p. Available from NAEP. CN6710. Princeton. NJ.08541-6710.
133
136

Education Commission of the States. (1981). Reading/literature tvleased exercise wt. 1979-80Assessment. Supplement. (ED 205 589) (NAEP-I 1-R1.-26) (ISBN-0-89398-222-9) Denver, CO:National Assessment of Educational Progress, 471 p. Available from NAEP, CN6710,Princeton, NJ, 08541-6710.
Education Commission of the States. (1931). Reading, thinking and writing: Results from the1979-80 National Assessment of reading and literature. (ED 209 641) (NAEP-11-L-01)(ISBN-0-89398-110-9) Denvet., CO: National Assessment of Educational Prop ess, 82p.Available from NAFP, CN6710, Princeton, NJ, 08541-6710.
Education Commission of the States. (1981). Three National Assessments of reading changes inperformance, 1970-80. (ED 200 898) (NAEP-11-R-01) (ISBN-0-89398-220-2) Denver, CO:National Assessment of Educational Progress, 9I p. Available from Superintendent ofDocuments, U. S. Go' minent Printing Office, Washington, DC, 20402.
Education Commission of the States. (1980). Reading and literature objectives, 1979-80Assessment. No.1 1 -RL-1 0. (ED 185 503) (NAEP-11-RL-10) Denver, CO: National Assessmentof Educational Progress, 25p. Available from NAEP, CN6710, Princeton, NJ, 00541-6710.
Education Commission of the States. (1979). The first assessment of reading, 1970-71assessment. Released exercise set No. 02-R-25. (ED 191 017) Denver, CO: NationalAssessment of Educational Progress, 341 p. Available from NAEP, CN6710, Princeton, NJ,08541-6710.
Education Commission of the States. (1978). Reading change, 1970-75: Summary volume.reading report No.06-R-21. (ED 153 196) Denver, CO: National Assessment of EducationalProjess, 95p. Available from NAEP, CN6710, Princeton, NJ, 08541-6710.
Education Commission of the States. (1976). Reading in America: A perspective on twoassessments. (ED 128 785) (NAEP-06-R-01) Denver, CO: National Assessment of EducationalProgress. 35p. Available from Superintendent of Documents, U. S. Government PrintingOffice, Washington, DC, 20402.
Education Commission of the States. (1574). Reading objectives; Second Assessment. (ED 089238) Denver, CO: National Amessinent of Educational Progress, 21p. Available from NAEP.CN6710, Princeton, NJ, 08541-6710.
Education Commission of the States. (1974). Reading: Summary data. (ED 094 359)(NAEP-02-R-00) Denver, CO: National Assessment of Educational Progress, 62p. Availablefrom Superintendent of Documents, U. S. Government Printing Office, Washington, DC, 20402.
Education Commission of the States. (1973). Graphic materials: Theme 2, reading. (ED 078384) (NAEP-02-R-02) Denver, CO: National Assessment of Educational Progress, 213p.Available from Superintendent of Documents. U. S. Government Printing Office. Washington.DC, 20402.
Educational Testing Service. (1987). Reading objectives, 1986 and 1988 assessments. (NAEP17/19-R-I0) (ISBN-0-88685-')63-0) Princeton. NJ: National Assessment of EducationalProgress, 31p. Available from NAEP, CN6710, Princeton, NJ, 08541-6710.
134
137

Educational Testing Service. (1985). The reading report ca-d: Progress toward excellence inour schools. Trends in reading over four National Assessments. 1971-1984. (NAEP-15-R-0 I )(ISBN-0-88685-034-7) Princeton, NJ: National Assessment of Educational Progress. 72p.Available from NAEP, CN6710, Princeton, NJ, 08541-6710.
Johnson. S. S. (1973). A survey of reading habits: Theme 4,literature. (ED 078 366)(NAEP-02-L-04) Denver, CO: National Assessment of Educational Progress, I57p. Availablefrom Superintendent of Documents, U. S. Government Printing Office, Washington, DC, 20402.
Kalk, J. M. (1981). The relationship between reading related background variables andcomprehension achievement: A secondary analysis of the /979 -80 reading/literatureassessment data. (ED 214 132) Denver, CO: National Assessment of Educational Progress.159p. Available from NAEP, CN6710, Princeton, NJ, 08541-6710.
Norris. E. L. & Bowes, J. E. (1970). Reading objectives. (ED 041 010) Ann Arbor, MI:National Assessment of Educational Progress, 40p. Available from NAEP, CN6710. Princeton.NJ, 08541-6710.
SCIENc.:E
Committee on Assessing the Progress of Education. (1969). Science objectives. (ED 033 872)Ann Arbor, MI: National Assessment of Educational Progress, 33p. Available from NAEP,CN6710, Princeton, NJ, 08541-6710.
Dochterman. C. L. (1970). National Assessment of Educational Progress. Summary of report I.Science: National results. (ED 043 099) Denver, CO: Education Commission of the States.24p.
Education Commission of the States. (1979). Science objectives for the third assessment. (ED179 402) Denver, CO: National Assessment of Educational Progress, 68p.
Education Comission of the States. (1978). Science achievement in the schools: A summary ofresults from the 1975-77 National Assessment of scienre. (ED 164 337) (NAEP-SR-08-S-01)Denver, CO: National Assessment of Educational Progress, 64p.
Education Commission of the States. (1978). Three National Assessments of science: Changesin achievement, 1969-77. Selected results from the third National Assessment of science.(ED 159 026) (NAEP-08-S-00) Denver. CO: National Asse'sment of Educational Progress,44p.
Education Commission of the States. (1978). The third assessment of science, 1976-77.Release exercise set. (ED 161 686) Denver. CO: National \ssessment of EducationalProgress, 350p.
Education Commission of the States. (1977). National Assessment of Educational Progress.Science technical report: Sununary volume. (ED 141 135) (NAEP- 04 -S -21) Denver, CO:National Assessment of Educational Progi,:ss. 20Ip. Available from Superintendent ofDocuments, U.S. Government Printing Office. Washington, DC, 20402.
135
138

Education CommisChanges inNationalDocumen
sion of the States. (1975). National Assessment of Educational Progress.science performance. 1969-1973: Exercise volume. (ED 127 199) Denver. CO:
Assessment of Educational Progress. 332p. Available from Superintendent ofts, U.S. Government Printing Office. Washington, DC, 20402.
Education Commission of the States. (1975). National Assessment of Educational Progress.released science exercises. 1972-73. (ED 193 040) Denver. CO: National Assessment ofEducational Progress, 482p.
Education Commission of the States. (1975). National Assessments of science. 1969 and 1973:A capsule description of changes in science achievement. (ED 104 723) (NAEP-04-S-00)Denver, CO: National Assessment of Educational Progress, 26p. Available fromSuperintendent of Documents, U.S Government Printing Office, Washington, DC, 20402.
Educational Testing Service. (1986). Science objectives, 1985-86 assessment. (17-S-10)(ISBN-0-88685-040-1) Princeton, NJ: National Assessment of Educational Progress, 40p.Available from NAEP, CN6710. Princeton, NJ, 08541-6710.
Mastie
Nati
, M. M., & Johnson. G. H. (1972). National Assessment of Educational Progress. sciehceobjectives for 1972-73 assessment. (ED 072 976) Denver, CO: National Assessment ofEducational Progress, 53p. Available from NAEP, CN6710, Princeton, NJ, 08541-6710.
onal Assessment of Educational Progress. (1970). National Assessment of EducationalProgress, report 1-Science: National results. Observations and commentary of a panel of
reviewers. (ED 055 785) Ann Arbor. MI: National Assessment of Educational Progress.42p. Available from Superintendent of Documents, U. S. Government Printing Office,Washington, DC, 20402.
Norris, E. (1970). National Assessment of Educational Progress, report 1--Science: Nationalresults and illustrations of group comparisons. (ED 055 786) Ann Arbor. MI: NationalAssessment of Educational Progress, 226p. Available from Superintendent of Documents.U.S. Government Printing Office, Washington. DC. 20402.
Searls, D. T., & Others. (1975). Change in national science achievement: Some analysisproblems. (ED 157 709) Denver, CO: National Assessment of Educational Progress, 19p.
OTHER REPORTS
Applebee, A. N., Langer J. A., & Mullis. I. V. S. (1987). Learning to be literate in America:Reading, writing, and reasoning. (No. 15-RW-01) Princeton, NJ: National Assessment ofEducational Progress, 47p. Available from NAF.P, CN6710, Princeton, NJ, 08541-6710.
Beaton, A. E. (1987). Implementing the new design: The 1983-84 NAEP technical report. (ISBN0-88685-062-2) (NAEP 15-TR-20) Princeton, NJ: National Assessment of EducationalProgress, 768p. Available from NAEP. CN6710. Princeton. NJ. 08541-6710.
Education Commission of the States. (1982). introduction to the National Assessment ofEducational Progress public use data tapes. National Assessment of Educational Progress62p. Available from NAEP, CN6710, Princeton, NJ, 08541-6710.
136
139

Educational Testing Service. (1987). Profiling American education. (No. 18-GIY) Princeton.NJ: National Assessment of Educational Progress. 20p. Available from NAEP. EducationalTesting Service, Rosedale Road. Princeton, N.1, 08541-0001.
Educational Testing Service. (1987). Learning by doing: A manual for teaching and assessinghigher-order thinking in science and mathematics. (No. 17-HOS-80) (ISBN 0-99685-059-2)Princeton, NJ: National Assessment of Educational Progress, 32p. Available from NAEP.CN6720, Princeton, NJ 08541-6710.
Educational Testing Service. (1986). Foundations of literacy: A description of theassessment of a basic knowledge of U. S. history and literature. (17 -HL -1 I)(ISBN-0-88685-041-X) Princeton. NJ: National Assessment of Educational Progress, 22p.Available from NAEP, CN6710, Princeton, NJ, 08541 -6710.
Educational Testing Service. (1986). A framework for assessing computer competence: Definingobjectives. (17-CC-10) (ISBN-0-88685-043-6) Princeton, NJ: National Assessment ofEducational Progress, 38p. Available from NAEP, CN6710, Princeton, NJ 08541-6710.
Kirsch, I. S., & Jungeblut, A. (1986). Literacy: Profiles of America's young adults. (No.16-PL-02) (ISBN 0- 88685 - 054 -I) Princeton, NJ: National Assessment of EducationalProgress, 68p. Available from NAEP, Educational Testing Service, Rosedale Road.Princeton, NJ, 08541,
Kirsch, I. S., & Jungeblut, A. (1986). Literacy: Profiles of America's young adults- -Finalreport. (No. 16-PL-01) (ISBN 0-88685-056-8) Princeton, NJ: National Assessment ofEducational Progress. Available from NAEP, Educational Testing Service, Rosedale Road,Princeton, NJ, 08541.
Messick, S., Beaton, A., & Lord, F. (1983). NAEP reconsidered: A new design for a new era.(NAEP-83-1) Princeton, NJ: Educational Testing Service, 93p. Available from NAEP,CN6710, Princeton, NJ, 08541-6710.
Ward, B. (1980). The National Assessment approach to objectives and exercise development.(ED 194 577) (NAEP-12-IP-55) Denver. CO: National Assessment of Educational Progress,50p. Available from NAEP, CN6710, Princeton, NJ, 08541-6710.
137
140