files.transtutors.com...det norske veritas report for adnatco-ngsco fleet energy efficiency study...
TRANSCRIPT

DET NORSKE VERITAS
Draft Report
Fleet Energy Efficiency Study
ADNATCO-NGSCO
Report No.: 146SO6J-4
Rev 00, 2012-05-02

DET NORSKE VERITAS
Report for ADNATCO-NGSCO
MANAGING RISK Fleet Energy Efficiency Study
DNV Reg. No.:PP036368 Revision No.: 00
Date : 2012-05-02 Page i of viii
ADNATCO-NGSCO Fleet Energy Efficiency Study DET NORSKE VERITAS, DUBAI BRANCH
P.O. Box 11539 Dubai,
United Arab Emirates
Tel: +971 4 3526626
Fax: +971 4 3523717
http://www.dnv.com
For:
Polarcus DMCC
Khalifa Complex, Takreer Tower 9th Floor
P. O. Box 2977
Abu Dhabi, UAE
Account Ref.:
PO No: 130741
Date of First Issue: 2012-05-02 Project No.: PP036368
Report No.: 146SO6J-4 Organisation
Unit:
Management
Revision No.: 0 Subject Group: Operation Excellence
Summary:
Based on DNV‟s 6 areas of focus during the course of this project, the potential saving opportunities
identified amount to 21% (US$ 93 Million) across the ADNTACO-NGSCO fleet. These are through
Voyage performance, Ship Performance, Primary and Secondary Energy Consumers, Fuel Management
and Organisational and Strategy initiatives. Theoretical EEDI values were calculated for the appropriate
vessel in line with IMO as well as vessel EEOI baselines for data available. A high level way forward plan
is proposed.
Prepared by: Name
Cairns, Cameron; Johansson, Mikael; Kjeldsen, Gunnar; Tampi, Thomas; Ådnegard,
Vidar; Surya Prakasa Raju, Mudunuri; Navaneethan, Venkateswaran;
Approved by: Name and Position
Mohd Shahrin Bin Osman
Head of Management Advisory, Middle East
No distribution without permission from the client
or responsible organisational unit (however, free
distribution for internal use within DNV after 3
years)
Indexing Terms
No distribution without permission from the client
or responsible organisational unit Key Words
Energy Efficiency; Seismic operations: Environmental performance
Strictly confidential Service Area Operational Excellence
Unrestricted distribution Market Segment
Maritime seismic operation
Rev. No. / Date: Reason for Issue: Prepared by: Verified by: Accepted by:
00/20120502 Draft Final Report Cameron Cairns Mikael Johansson Shahrin Osman
© 2010 Det Norske Veritas, Dubai Branch Reference to part of this report which may lead to misinterpretation is not permissible.

DET NORSKE VERITAS
Report for ADNATCO-NGSCO
MANAGING RISK Fleet Energy Efficiency Study
DNV Reg. No.:PP036368 Revision No.: 00
Date : 2012-05-02 Page ii of viii
TABLE OF CONTENTS
1 EXECUTIVE SUMMARY ................................................................................................................. 1 1.1 Current Practise ................................................................................................................ 1 1.2 ADNATCO-NGSCO energy efficiency benchmarking ................................................... 1 1.3 Opportunities .................................................................................................................... 3
1.4 Suggested way forward .................................................................................................... 4 1.5 Concluding remarks ......................................................................................................... 5
2 NOMENCLATURE ............................................................................................................................ 6
3 INTRODUCTION ............................................................................................................................... 9
3.1 ADNATCO-NGSCO ....................................................................................................... 9 3.2 Background .................................................................................................................... 10 3.3 Objectives ....................................................................................................................... 10
3.4 Scope of work ................................................................................................................. 11
3.4.1 Energy Efficiency .................................................................................................... 11 3.4.2 Monitoring of effects ............................................................................................... 12 3.4.3 Ship Energy Efficiency Management Plan (SEEMP) ............................................. 12
3.4.4 Calculation of EEDI ................................................................................................ 12
4 METHODOLGY ............................................................................................................................... 13
4.1 DNV energy efficiency process description ................................................................... 13 4.2 Activities for Energy Efficiency opportunity assessment .............................................. 14 4.3 Data gathering and interviews ........................................................................................ 14
4.3.1 Interview list ............................................................................................................ 14
4.4 Workshops ...................................................................................................................... 15 4.5 Analysis .......................................................................................................................... 15 4.6 Capability Benchmarking ............................................................................................... 15
4.7 Opportunity assessment .................................................................................................. 15 4.8 Recommendations .......................................................................................................... 16 4.9 Way Forward development ............................................................................................ 16
4.10 Assumptions and limitations .......................................................................................... 16
5 THE ADNATCO-NSGCO FLEET ................................................................................................... 17 ADNATCO-NGSCO Case Vessels.................................................................................... 18 5.1.1 ........................................................................................................................................ 18
5.1.1.1 Tanker Fleet .................................................................................................... 18
5.1.1.2 LNG Carriers ................................................................................................... 19
6 ADNATCO-NGSCO‟S CURRENT ENERGY EFFICIENCY PRACTICE .................................... 20
ADNATCO-NGSCO.............................................................................................................. 21 6.1 Guiding Documentation ................................................................................................. 21
6.2 What the people on board say ........................................................................................ 22 6.2.1 Basis Ship ................................................................................................................ 22 6.2.2 Main results from any free text - Tanker ................................................................. 22 6.2.3 Main results from any free text - LNG .................................................................... 22

DET NORSKE VERITAS
Report for ADNATCO-NGSCO
MANAGING RISK Fleet Energy Efficiency Study
DNV Reg. No.:PP036368 Revision No.: 00
Date : 2012-05-02 Page iii of viii
6.2.4 Results from questions ............................................................................................. 22 6.3 Performance management .............................................................................................. 24 6.4 Operational profiles and fuel consumption for ADNATCO-NGSCO fleet ................... 26
6.4.1 Tanker Fleet ............................................................................................................. 26 6.4.2 Dry Fleet .................................................................................................................. 28
6.4.3 LNG Fleet ................................................................................................................ 29 6.4.4 Savings Calculation methodology ........................................................................... 30
7 BENCHMARKING OF ADNATCO-NGSCO ENERGY MANAGEMENT
CAPABILITIES ........................................................................................................................................ 31 7.1.1 Benchmarking approach .......................................................................................... 31
7.1.2 ADNATCO-NGSCO energy efficiency benchmarking .......................................... 33
8 ENERGY EFFICIENCY OPPORTUNITY ASSESSMENT ........................................................... 37
Voyage Performance .............................................................................................................. 40 8.1 ............................................................................................................................................... 40
8.1.1 Voyage planning and speed management................................................................ 41 8.1.1.1 Observations .................................................................................................... 41
8.1.1.2 Potential solutions ........................................................................................... 42 8.1.1.3 Expected benefits ............................................................................................ 43
8.1.2 Chartering and contracts .......................................................................................... 44 8.1.2.1 Observations .................................................................................................... 44 8.1.2.2 Potential solutions ........................................................................................... 44
8.1.2.3 Expected benefits ............................................................................................ 44 8.1.3 Weather Routing ...................................................................................................... 45
8.1.3.1 Observations .................................................................................................... 45 8.1.3.2 Potential Solutions .......................................................................................... 45
8.1.3.3 Expected Benefits ............................................................................................ 45 8.1.4 Autopilot .................................................................................................................. 46
8.1.4.1 Observations .................................................................................................... 46
8.1.4.2 Potential Solutions .......................................................................................... 46 8.1.4.3 Expected Benefits ............................................................................................ 46
8.1.5 Port operations ......................................................................................................... 47 8.1.5.1 Observations .................................................................................................... 47 8.1.5.2 Potential solutions ........................................................................................... 47
8.1.5.3 Expected benefits ............................................................................................ 47 8.2 Ship performance ........................................................................................................... 48
8.2.1 Sea trials................................................................................................................... 49 8.2.1.1 Observations .................................................................................................... 49
8.2.1.2 Possible solutions ............................................................................................ 49 8.2.1.3 Expected benefit .............................................................................................. 49
8.2.2 Propeller Polishing/Cleaning ................................................................................... 49
8.2.2.1 Observations .................................................................................................... 50 8.2.2.2 Possible solutions ............................................................................................ 52 8.2.2.3 Expected benefit .............................................................................................. 52
8.2.3 Hull condition .......................................................................................................... 53 8.2.3.1 Observations .................................................................................................... 54

DET NORSKE VERITAS
Report for ADNATCO-NGSCO
MANAGING RISK Fleet Energy Efficiency Study
DNV Reg. No.:PP036368 Revision No.: 00
Date : 2012-05-02 Page iv of viii
8.2.3.2 Possible solutions ............................................................................................ 57 8.2.3.3 Hull Coating: ................................................................................................... 57 8.2.3.4 Expected benefit .............................................................................................. 58
8.2.4 Draft Optimization ................................................................................................... 59 8.2.4.1 Observations .................................................................................................... 59
8.2.4.2 Possible solutions ............................................................................................ 60 8.2.4.3 Expected benefit .............................................................................................. 60
8.2.5 Trim optimisation .................................................................................................... 60 8.2.5.1 Observations .................................................................................................... 61 8.2.5.2 Possible solutions ............................................................................................ 61
8.2.5.3 Expected benefit .............................................................................................. 61
8.2.6 Energy efficiency devices ........................................................................................ 62
8.2.6.1 Observation ..................................................................................................... 62 8.2.6.2 Possible solutions ............................................................................................ 62 8.2.6.3 Expected benefits ............................................................................................ 63
8.3 Primary energy consumers ............................................................................................. 64
8.3.1 LNG Steam Plant Main Boiler ................................................................................ 65 8.3.1.1 Observations .................................................................................................... 65
8.3.1.2 Possible solution.............................................................................................. 65 8.3.1.3 Expected benefits ............................................................................................ 65
8.3.2 LNG Main Boiler Combustion Air System Air Heaters ......................................... 66
8.3.2.1 Observations .................................................................................................... 66 8.3.2.2 Possible solutions ............................................................................................ 66
8.3.2.3 Expected benefits ............................................................................................ 66 8.3.3 LNG Combustion Air System Forced Draught Fans and furnace ........................... 66
8.3.3.1 Observations .................................................................................................... 67 8.3.3.2 Possible solutions ............................................................................................ 67
8.3.3.3 Expected Benefits ............................................................................................ 68
8.3.4 LNG Flue Gas Oxygen Content /Smoke Indicators ................................................ 68 8.3.4.1 Observations .................................................................................................... 68
8.3.4.2 Possible solutions ............................................................................................ 68 8.3.4.3 Expected benefits ............................................................................................ 69
8.3.5 LNG Main Turbine-Performance ............................................................................ 69
8.3.5.1 Observations:................................................................................................... 69 8.3.5.2 Possible solution.............................................................................................. 70 8.3.5.3 Potential benefits ............................................................................................. 70
8.3.6 LNG Main Condenser-Performance ........................................................................ 71 8.3.6.1 Observations .................................................................................................... 71
8.3.6.2 Potential solutions ........................................................................................... 71
8.3.6.3 Expected Benefits ............................................................................................ 71
8.3.7 LNG Condensate Feed System ................................................................................ 72 8.3.7.1 Observations .................................................................................................... 72
8.3.7.2 Possible solutions ............................................................................................ 72 8.3.7.3 Expected Benefits ............................................................................................ 72
8.3.8 LNG auxiliary engine utilisation ............................................................................. 73 8.3.8.1 Observations .................................................................................................... 73

DET NORSKE VERITAS
Report for ADNATCO-NGSCO
MANAGING RISK Fleet Energy Efficiency Study
DNV Reg. No.:PP036368 Revision No.: 00
Date : 2012-05-02 Page v of viii
8.3.8.2 Possible solutions ............................................................................................ 73 8.3.8.3 Expected benefits ............................................................................................ 73
8.3.9 Main and Auxiliary Engine Performance Management .......................................... 74 8.3.9.1 Observations .................................................................................................... 74 8.3.9.2 Potential Solutions .......................................................................................... 83
8.3.9.3 Expected benefits ............................................................................................ 84 8.3.10 Auxiliary Engine Utilisation .................................................................................... 84
8.3.10.1 Observations .................................................................................................... 84 8.3.10.2 Potential Solutions .......................................................................................... 86 8.3.10.3 Expected Benefits ............................................................................................ 86
8.3.11 Auxiliary Boiler utilisation and Performance .......................................................... 87
8.3.11.1 Observation: .................................................................................................... 87
8.3.11.2 Possible Solutions ........................................................................................... 87 8.3.11.3 Expected Benefits ............................................................................................ 88
8.3.12 Economiser Performance ......................................................................................... 88 8.3.12.1 Observation ..................................................................................................... 88
8.3.12.2 Potential Solutions .......................................................................................... 89 8.3.12.3 Benefits ........................................................................................................... 89
8.4 Secondary energy consumers ......................................................................................... 90 8.4.1 Secondary consumers utilisation and good practices .............................................. 91
8.4.1.1 Observations .................................................................................................... 91
8.4.1.2 Possible solutions ............................................................................................ 91 8.4.1.3 Expected Benefits ............................................................................................ 92
8.4.2 Variable speed drives ............................................................................................... 92 8.4.2.1 Observations .................................................................................................... 92
8.4.2.2 Potential solutions ........................................................................................... 93 8.4.2.3 Expected benefits ............................................................................................ 93
8.4.3 Low energy appliances ............................................................................................ 94
8.4.3.1 Observation: .................................................................................................... 94 8.4.3.2 Potential Solutions: ......................................................................................... 94
8.4.3.3 Expected Benefits ............................................................................................ 94 8.5 Fuel Management ........................................................................................................... 95
8.5.1 Understanding fuel specifications............................................................................ 96
8.5.1.1 Observations .................................................................................................... 96 8.5.1.2 Potential solutions ........................................................................................... 97 8.5.1.3 Expected benefit .............................................................................................. 97
8.5.2 Fuel Ordering, purchasing, documentation and responsibilities ............................. 98 8.5.2.1 Observations .................................................................................................... 98
8.5.2.2 Potential solutions ........................................................................................... 99
8.5.2.3 Expected benefit .............................................................................................. 99
8.5.3 Systematic Benchmarking of Fuel Quantity .......................................................... 100 8.5.3.1 Observations .................................................................................................. 100
8.5.3.2 Potential solutions ......................................................................................... 101 8.5.3.3 Expected Benefits .......................................................................................... 102
8.5.4 Reduce Statutory and Environmental risks............................................................ 102 8.5.4.1 Observations .................................................................................................. 102

DET NORSKE VERITAS
Report for ADNATCO-NGSCO
MANAGING RISK Fleet Energy Efficiency Study
DNV Reg. No.:PP036368 Revision No.: 00
Date : 2012-05-02 Page vi of viii
8.5.4.2 Potential Solutions ........................................................................................ 103 8.5.4.3 Expected Benefits .......................................................................................... 103
8.5.5 Systematic Fuel Quality Testing and understanding Fuel Parameters .................. 104 8.5.5.1 Observations- ................................................................................................ 104 8.5.5.2 Possible solutions .......................................................................................... 105
8.5.5.3 Benefits ......................................................................................................... 105 8.5.6 Fuel Training ......................................................................................................... 105
8.5.6.1 Observations .................................................................................................. 106 8.5.6.2 Potential solutions ......................................................................................... 106 8.5.6.3 Expected Benefits .......................................................................................... 106
8.6 Organisation and strategy ............................................................................................. 107
8.6.1 Goals, processes and procedures ........................................................................... 108
8.6.1.1 Observations .................................................................................................. 108 8.6.1.2 Potential solutions ......................................................................................... 109
8.6.2 Roles and responsibilities ...................................................................................... 110 8.6.2.1 Observations .................................................................................................. 110
8.6.2.2 Potential solutions ......................................................................................... 110 8.6.3 Training, evaluation and follow up ........................................................................ 110
8.6.3.1 Observations .................................................................................................. 111 8.6.3.2 Potential solutions ......................................................................................... 111
8.6.4 Culture and awareness building ............................................................................. 112
8.6.4.1 Observations .................................................................................................. 112 8.6.4.2 Potential solutions ......................................................................................... 112
8.7 Performance management ............................................................................................ 114 8.7.1 Reporting and follow up practices ......................................................................... 114
8.7.1.1 Voyage performance management ................................................................ 114 8.7.1.2 NGSCO primary consumer reporting (monthly) .......................................... 115
8.7.1.3 ADNATCO fuel measuring equipment ........................................................ 116
8.7.1.4 ADNATCO engine analysis tools ................................................................. 117 8.7.2 Performance follow up .......................................................................................... 118
8.7.2.1 Observations .................................................................................................. 118 8.7.2.2 Potential solutions ......................................................................................... 118 8.7.2.3 Expected benefits .......................................................................................... 120
9 THEORETICAL CALCULATION OF EEDI ................................................................................ 121 9.1 Tankers ......................................................................................................................... 122 9.2 Bulk carriers ................................................................................................................. 122 9.3 Container ...................................................................................................................... 123
10 CALCULATION OF THE EEOI.................................................................................................... 124 10.1 Utilising the EEOI value for Energy Efficiency analysis ............................................ 124
10.1.1 Establishing an EEOI reference ............................................................................. 124
10.1.2 CO2 emission based on Clean Cargo Working Group methodology .................... 125 10.1.3 ADNATCO-NGSCO Baseline .............................................................................. 127
10.2 Sample calculations ...................................................................................................... 127
11 PRIORITISATION OF OPPORTUNITIES ................................................................................... 129

DET NORSKE VERITAS
Report for ADNATCO-NGSCO
MANAGING RISK Fleet Energy Efficiency Study
DNV Reg. No.:PP036368 Revision No.: 00
Date : 2012-05-02 Page vii of viii
11.1 Assessment of initiative complexity ............................................................................ 129 11.2 Prioritisation of initiatives ............................................................................................ 131
12 WAY FORWARD .......................................................................................................................... 132 12.1 Quick Win Phase - Low implementation complexity initiatives rapid implementation
133
12.2 Phase 2 Energy efficiency enabler implementation ..................................................... 133 12.3 Phase 3 Energy efficiency project definition ............................................................... 134
13 CONCLUSION ............................................................................................................................... 136
14 REFERENCES ................................................................................................................................ 137
15 APPENDIX ..................................................................................................................................... 138 15.1 ADNATCO-NGSCO Fleet List ................................................................................... 138
15.2 Ship Questionnaire sample ........................................................................................... 140 15.3 Calculated EEOI – ADNATCO-NGSCO Fleet ........................................................... 141
Table of Figures:
Figure 1-1 : Industry Energy Management Capability Rules ................................................................................... 2 Figure 1-2 : Waterfall Diagram illustrating saving opportunities for ADNATCO-NGSCO ................................... 3 Figure 1-3 : Proposed way forward to initiate and implement the saving initiatives and enablers .......................... 5 Figure 3-1 : Scope across ADNATCO-NGSCO fleet ............................................................................................ 11 Figure 4-2 : Energy Efficiency opportunity assessment workflow ........................................................................ 14 Figure 4-3 : Interview list of key members of management team .......................................................................... 14 Figure 5-1 ADNATCO- NGSCO Fleet Overview ................................................................................................. 17 Figure 6-1 : Questionnaire Results – LNG Fleet & Dry and Tanker Fleet ............................................................ 23 Figure 6-2 : Illustration of high-level dataflow for an ideal reporting tool for ADNATCO-NGSCO ................... 25 Figure 6-4 : Total estimated annual fuel cost for the whole ADNATCO-NGSCO fleet based on 365 days
in a year ................................................................................................................................................................. 30 Figure 7-1: ADNATCO-NGSCO energy management benchmarking Industry Benchmarking ........................... 33 Figure 8-1 : Fuel savings by Vessel Type and Initiative ........................................................................................ 38 Figure 8-5 Resistance components for a displacement vessel................................................................................ 54 Figure 8-6 Estimated increase in fuel consumption from increasing hull roughness for the Al Hamra ................. 55 Figure 8-7 Estimated increase in fuel consumption from increasing hull roughness for the Abu Dhabi III .......... 56 Figure 8-9 Clean ADNATCO hull in dry dock after washing ............................................................................... 57 Figure 8-10 Reduction in fuel consumption from variations in draft for selected vessels ..................................... 59 Figure 8-13 : Boiler Fuel oil viscosity reading (Jan-2011 to Mar 2012) for vessel Al Hamra ............................... 65 Figure 8-14 : Boiler air heater trend (Jan-2011 to Mar-2012)................................................................................ 66 Figure 8-15: Furnace and Windbox pressure – Al Hamra ..................................................................................... 67 Figure 8-16 : Furnace and Windbox pressure - Shahama ...................................................................................... 67 Figure 8-17 : O2 content readings of flue gas - Shahama ...................................................................................... 68 Figure 8-19 : Main turbine parameter trending (Jan-2011 to Mar-2012) – Al Hamra ........................................... 69 Figure 8-20 : Exhaust Steam pressure Trend ......................................................................................................... 70 Figure 8-21 : Condenser vacuum readings – Al Hamra ......................................................................................... 71 Figure 8-22 : Make-up water consumption to boilers – Al Hamra ........................................................................ 72 Figure 8-23Analysis of engine performance for Abu Dhabi III – Tanker .............................................................. 74 Figure 8-24 : Main Engine SFOC comparing with ship trials................................................................................ 75 Figure 8-25 : Main Engine SFOC at sea (Aug 2011 – Mar 2012) ......................................................................... 75 Figure 8-27 : Main engine performance ................................................................................................................. 76 Figure 8-28 : Auxillary engine balance (Pmax, FPI and Texh) ............................................................................. 77

DET NORSKE VERITAS
Report for ADNATCO-NGSCO
MANAGING RISK Fleet Energy Efficiency Study
DNV Reg. No.:PP036368 Revision No.: 00
Date : 2012-05-02 Page viii of viii
Figure 8-29 : Auxillary engine #1 Performance ..................................................................................................... 78 Figure 8-30 : Auxillary engine #2 Performance ..................................................................................................... 78 Figure 8-31 : Auxillary engine #3 Performance ..................................................................................................... 79 Figure 8-32 : Analysis of engine performance – Shah ........................................................................................... 79 Figure 8-33 : Ro-Ro engine performance test ........................................................................................................ 80 Figure 8-34 : Engine performance result – Al Bazm II .......................................................................................... 81 Figure 8-35 Main Engine SFOC with shop trial .................................................................................................... 81 Figure 8-36 : Auxillary engine #1 balance Overview ............................................................................................ 82 Figure 8-37 : Auxillary engine #1 performance ..................................................................................................... 83 Figure 8-38 : Auxillary engine utilization –Al Dhafrah, Al Samha, Al Bazm, Abu Dhabi – III, Umm Al
Lulu, Bani Yas ....................................................................................................................................................... 85 Figure 8-39 : Auxillary Engine Load ..................................................................................................................... 86 Figure 8-40 : Auxillary Boiler AV Cons/day - Discharge ..................................................................................... 87 Figure 8-41 : Auxillary Boiler AV cons/day - Ballast ........................................................................................... 87 Figure 8-42 : Economizer Performance ................................................................................................................. 88 Figure 8-43 : Cost Benefit Analysis for VFDs ....................................................................................................... 93 Figure 8-44 : Best Practice Benchmark – Fuel Management ................................................................................. 96 Figure 8-45 : Fuel specification standard ISO 8217............................................................................................... 96 Figure 8-46 : Fuel – Evaluate Specifications ......................................................................................................... 97 Figure 8-47 : Fuel quantity received – adjusting figures...................................................................................... 100 Figure 8-48 : Bunker Delivery Note – MARPOL Annex VI ............................................................................... 103 Figure 8-51 Matrix (Sample) – Source: DNV ...................................................................................................... 110 Figure 8-52 ADNATCO-NGSCOImprovement Opportunities ........................................................................... 114 Figure 8-53: Possible Future Performance Management Concept ....................................................................... 119 Figure 8-54: Detailed KPI analysis ...................................................................................................................... 120 Figure 10-1 : Global CO2 Emissions - 2006 ........................................................................................................ 124 Figure 10-3 : EEOI Umm Al Lulu 2011 .............................................................................................................. 128 Figure 10-4 : EEOI LNG Shahamah 2011 ........................................................................................................... 128 Figure 11-1 : Implementation Complexity of initiatives for ADNATCO-NGSCO– Source: DNV .................... 130 Figure 11-2 : Fuel efficiency prioritisation matrix ............................................................................................... 131 Figure 12-1 : Way forward plan ........................................................................................................................... 135

DET NORSKE VERITAS
Report for ADNATCO-NGSCO
MANAGING RISK Fleet Energy Efficiency Study
Page 1 of 151
1 EXECUTIVE SUMMARY
For most ship owners/operators, energy is one of the largest cost aspects. The fuel price has
increased to historically high levels, environmental pressures from regulators are intensifying
leading to an increased focus on energy consumption and how it can be reduced to have
positive effect on emissions.
To date it is fair to say that the focus of ADNATCO-NGSCO over the past few years has been
firmly on integrating the two companies, and expanding operations. Through the process of
this project, it was apparent that due to these intense last few years there has been limited
focus and priority given to energy efficiency but a clear willingness to do so going forward,
where the outcome of this project is intended to be the firm starting point and a contributor to
its activities as part of the ADNOC sustainability program, to improve fuel efficiency and
ultimately reduce harmful emissions to air and enhance its environmental profile in the
industry.
1.1 Current Practise
During the course of the project, it was evident that whilst a lot of effort is being made to
account for and improve the company‟s environmental footprint, there did not appear to be a
companywide policy, strategic plan or strategic focus on energy efficiency, where in DNV‟s
experience the organisational enablers and strategic direction must be in place for a company
to be successful with energy management. Single energy efficiency initiatives (e.g. propeller
polishing, trim optimisation, etc) can be successfully implemented and reduce energy
consumptions on ships, but a company will not be able to take out its full potential without
addressing the organisation as a whole.
1.2 ADNATCO-NGSCO energy efficiency benchmarking
As illustrated in the overview in ADNATCO-NGSCO scores below average in most areas of
the analysis. It shall be stated that ADNATCO-NGSCO have gone through a rapid growth in
terms of fleet expansion over the last couple of years and the organisation is currently settling
for more stable conditions. Regardless a number of aspects are needed to be addressed in
order to meet and potentially beta the industry average in this respect. Detailed explanation to
scoring is provided in Chapter 7 of this report.

DET NORSKE VERITAS
Report for ADNATCO-NGSCO
MANAGING RISK Fleet Energy Efficiency Study
Page 2 of 151
Figure 1-1 : Industry Energy Management Capability Rules

DET NORSKE VERITAS
Report for ADNATCO-NGSCO
MANAGING RISK Fleet Energy Efficiency Study
Page 3 of 151
1.3 Opportunities
Based on DNV‟s 6 areas of focus during the course of this project, the potential saving
opportunities identified amount to 21% (US$ 93 Million) across the ADNTACO-NGSCO
fleet as represented in a waterfall diagram below:
Figure 1-2 : Waterfall Diagram illustrating saving opportunities for ADNATCO-NGSCO

DET NORSKE VERITAS
Report for ADNATCO-NGSCO
MANAGING RISK Fleet Energy Efficiency Study
Page 4 of 151
1.4 Suggested way forward
To define the way forward for ADNATCO-NGSCO energy efficiency opportunity DNV
suggest creating a 5 year Energy Efficiency Strategy with defined KPI‟s at various levels of
the organisation and accompanied by an implementation plan in 3 phases. The ambition with
this set up is to limit organisational stress and ensure the correct results.
Quick Win Phase - Low implementation complexity initiatives rapid
implementation
- Direct implementation of low complexity initiatives that will immediately
strengthen ADNATCO-NGSCO energy operations.
- Does not have to be driven as projects but rather definition of action and way
of working combined with targeted implantation
- Implementation of the SEEMP‟s and communication and awareness thereof
Phase 2 - Energy efficiency enabler implementation
- Definition and establishment of enablers for energy efficiency initiatives
- This task is more comprehensive and DNV suggest to set this up as dedicated
project(s)
Phase 3 - Energy efficiency project definition
- Dedicated project implementation of higher complexity initiatives based on
prioritisation matrix
- This task is more comprehensive and DNV suggest to set this up as dedicated
project(s)
This is not a complete project plan but an overall layout of how ADNATCO-NGSCO can
address this aspect in further work. A detailed project plan needs to be established describing
exhaustively how the work will be managed, expected result, budget, timeline etc.
An information and communication plan connected to performance management need to
shadow the project plan.

DET NORSKE VERITAS
Report for ADNATCO-NGSCO
MANAGING RISK Fleet Energy Efficiency Study
Page 5 of 151
The illustration below represents the way forward for ADNATCO-NGSCO based on time and
potential fuel savings that can be realised by initiating and implement the prioritised
initiatives and enablers.
1.5 Concluding remarks
ADNATCO-NGSCO has gone through a rapid growth in terms of fleet expansion over the
last couple of years and the organisation is currently settling for more stable conditions.
However when benchmarked on Energy Efficiency against the industry there are a number of
aspects needing to addressed in order to meet and potentially beta the industry average in this
respect. Given that no solid framework was identified to be in place with regard to energy
efficiency, numerous saving potentials were identified for ADNATCO-NGSCO to optimise
the energy consumption which is detailed in the report.
It is recommended, that in order to have a focus and control over energy efficiency, a
dedicated project manager should be assigned to initiate these initiatives and gain some
momentum within ADNATCO-NGSCO. Ideally this role should be outside of the daily
operations such that a focus can be maintained without distractions of daily operational
concerns. This role should be instrumental in institutionalizing energy efficiency within
ADNATCO-NGSCO to become a leading and sustainable performer.
Figure 1-3 : Proposed way forward to initiate and implement the saving initiatives and enablers

DET NORSKE VERITAS
Report for ADNATCO-NGSCO
MANAGING RISK Fleet Energy Efficiency Study
Page 6 of 151
2 NOMENCLATURE
AC Air - conditioning
ACC Automatic Combustion control
ADGAS Abu Dhabi Gas Liquefaction Company
ADNATCO Abu Dhabi National Tanker Company
ADNOC Abu Dhabi National Oil Company
AMOS Analysis of Moment Structures
Avg. Average
BHP Brake Horse Power
BOG Boil-Off Gas
CBM Condition Based Maintenance
CE Chief Engineer
CEO Chief Executive Officer
Cd Drag co-efficient
CFD Computational Fluid dynamics
CH4 Methane
CO2 Carbon dioxide
Deg C Degree Celcius
DNV Det Norske Veritas
DNVPS Det Norske Veritas Petroleum Services
ECA Emission Control Area(s)
EE Energy Efficiency
EEDI Energy Efficiency Design Index
EEOI Energy Efficiency Operational Indicator
ERP Enterprise Resource Planning
ETA Estimated Time of Arrival
EU European Union
FD Forced draft
FO Fuel Oil

DET NORSKE VERITAS
Report for ADNATCO-NGSCO
MANAGING RISK Fleet Energy Efficiency Study
Page 7 of 151
GHG Green house Gas
HCFC Hydrochloroflurocarbon
HFO Heavy Fuel Oil
HR Human Resource
Hrs Hours
HSE Health, Safety and Environment
HVAC Heating, Ventilation and Air Conditioning
IAS Integrated Automated system
IMO International Maritime Organisation
ISM International Safety Management
ISPS International Ship and Port Facility Security
Code
IT Information Technology
ISO International Organisation for Standardisation
Kg Kilogram
Km Kilometre
kN Kilo Newton
KPI Key Process Indicator
kW Kilowatt
kWh Kilowatt-hour
LNG Liquid Natural Gas
MCR Maximum continuous revolution
MDO Marine Diesel Oil
MGO Marine Gas Oil
MT Metric Tonne(s)
NGSCO National Gas Shipping Company
Nm Nautical Mile(s)
NOx Nitrogen Oxide
OPEX Operating Expense
P&I Protection & Indemnity

DET NORSKE VERITAS
Report for ADNATCO-NGSCO
MANAGING RISK Fleet Energy Efficiency Study
Page 8 of 151
Pmax (from graph) Max Pressure
PMS Planned Maintenance system
RACI Responsible, Accountable, Consulted and
Informed
RPM Rotations per Minute
Ro-Ro Roll-in/Roll Of
ROV Remotely Operated Vehicles
SAP Systems, Application and Products in data
processing
SAH Steam Air Heater
SEEMP Ship Energy Efficiency Management Plan
SFOC Specific fuel Oil Consumption
SMART Specific, Measurable, Attainable, Realistic
and Timely
SMS Safety Management System
SOx Sulphur Oxide
SVP Senior Vice President
T Tonne
Texh (from graph) Exhaust temperature
TEPCO Tokyo Electric Power Company
US Unites States
USD United States Dollars
VSD Variable Speed Drives
VFD Variable Frequency Drives
VP Vice President

DET NORSKE VERITAS
Report for ADNATCO-NGSCO
MANAGING RISK Fleet Energy Efficiency Study
Page 9 of 151
3 INTRODUCTION
For most ship owners/operators, energy is one of
the largest cost aspects, and the general projections
is that the relative cost of the traditional energy
base for the maritime industry will increase. In
recent times, the cost of fuel has increased to
historically high levels manifesting this
development.
In addition, there is an increasing focus in the
market on the environmental footprint of shipping
and regulators are introducing instruments for
measuring the environmental performance. New
regulations on fuel such as ECA development put
increased pressure on the operators. As a result of
such pressures, DNV has worked with ship owners
and operators to identify opportunities to reduce
fuel consumption and thereby emissions through
technical, operation and organizational
improvements.
3.1 ADNATCO-NGSCO
Prior to 2009, ADNATCO and NGSCO were separate operating companies where NGSCO
was established in 1993 with the purpose of transporting LNG on behalf of its sister-company
Abu Dhabi Gas Liquefaction Company Limited (ADGAS) from its terminals to Tokyo Electric
Power Co. (TEPCO) in Tokyo Bay with 8 LNG vessels. ADNATCO was established in 1975
with the purpose of transporting crude oil, petroleum products and general cargo to the rest of
the world.
In 2009 the two companies were merged to form ADNATCO-NGSCO and at the same time
ADNATCO underwent major fleet expansion and acquired 15 new ships over 2 years. Today
ADNATCO-NGSCO operates a combined fleet of 30 vessels, one of the largest fleet in the
Arabian Gulf.
The rapid expansion has meant the combination of different vessel types and the way of
operating them as well as substantial increases in the resources required from personnel to IT
infrastructure in a short space of time. On top of this expansion, ADNATCO-NGSCO has
undertaken the implementation of an SAP ERP business solution to address the needs of its
expanded fleet and operational requirements with the aim of benefiting from real time
management and ultimately improve its overall efficiency in line with industry best practice.
ADNATCO-NGSCO is an ISM, ISO 9001 & 14001 certified company, ensuring a certain
level of safety, quality and environmental management within the company. This within the
shipping industry is considered as good practice and means the there is a focus and willingness
on the operations and its effects on the environment, where continuous improvement and
sustainability is targeted. The company, being part of the ADNOC group of companies is also
required to report it activities as part of a Sustainable Development program.
Source: Bunkerworld May 9th 2011
Soaring Bunker Prices Stakeholder Scrutiny
Regulatory Landscape becoming increasingly more complex
Source: Bunkerworld

DET NORSKE VERITAS
Report for ADNATCO-NGSCO
MANAGING RISK Fleet Energy Efficiency Study
Page 10 of 151
To date it is fair to say that the focus of ADNATCO-NGSCO over the past few years has been
firmly on integrating the two companies, and expanding operations. Through the process of
this project, it was apparent that due to these intense last few years there has been limited focus
and priority given to energy efficiency but a clear willingness to do so going forward, where
the outcome of this project is intended to be the firm starting point and a contributor to its
activities as part of the ADNOC sustainability program, to improve fuel efficiency and
ultimately reduce harmful emissions to air and enhance its environmental profile in the
industry.
Source: ADNATCO-NGSCO
3.2 Background
DNV visited ADNATCO-NGSCO during the month of May 2011 to give a presentation on
the regulatory agenda relating to shipping emissions from DNV‟s point of view to its senior
managers. Particular emphasis was put on the emissions to air and increasing regulations
being imposed on ship owners and operations. The focus of this presentation was to tackle
these regulations in a positive way to benefit shipping organisations.
One of the particular solutions offered by DNV that was presented was Energy Efficiency
(EE) and Ship Energy Efficiency Management Plan (SEEMP) and the positive impact on fuel
savings and thus emissions to air that solution that can generate for ship owners.
ADNATCO-NGSCO sent out a tender enquiry No. E11181, requesting a bid to carry out a
Fleet Energy Efficiency Study which DNV subsequently won.
3.3 Objectives
The objectives of this part of the work with ADNATCO-NGSCOcan be described as the
following:
Evaluate ADNATCO-NSGCO‟s energy efficiency performance
Benchmark ADNATCO-NSGCO‟s with industry best practice and their fellow peers
Present business case for fuel cost savings initiatives
Prioritise improvement opportunities
Propose high level way forward plan to realise identified savings

DET NORSKE VERITAS
Report for ADNATCO-NGSCO
MANAGING RISK Fleet Energy Efficiency Study
Page 11 of 151
3.4 Scope of work
3.4.1 Energy Efficiency
DNV have conducted an Energy Efficiency Phase 1 - Opportunity Assessment project with a
focus on 6 key areas as illustrated in the figure below based on the following approach:
High level verification and quantification of improvement opportunities
Quantitative and/or qualitative benchmark of performance vs. leading practises
Establish a foundation for an improvement programme
Assist ADNATCO-NGSCO to develop specific solutions to improvement
opportunities
Provide assistance over an extended period of time in Piloting the top 3 “Quick Wins”
identified during the project
o 6 months extended assistance (schedule to be agreed)
o Based on an estimate of 12 days over 6 months – (e.g. 2 days/moth)
The scope covers ADNATCO-NSGCO Fleet of 30 vessels.
Figure 3-1 : Scope across ADNATCO-NGSCO fleet

DET NORSKE VERITAS
Report for ADNATCO-NGSCO
MANAGING RISK Fleet Energy Efficiency Study
Page 12 of 151
3.4.2 Monitoring of effects
During the piloting stage of the 3 identified quick wins, DNV shall include the installation
and configuration of Nauticus Air, DNV‟s Environmental Performance System to be used by
ADNATCO-NGSCO as a tool to monitor the effects of Piloted Quick Wins.
3.4.3 Ship Energy Efficiency Management Plan (SEEMP)
Based on the outcome of this Energy Efficiency phase 1 project, where specific
recommendations have been made in a prioritized format, the SEEMP‟s have been developed
in line with the IMO guideline for each vessel to be implemented onboard in the near future
in line with a planned roll out to be defined by ADNATCO-NGSCO.
3.4.4 Calculation of EEDI
Currently the calculation of EEDI is only intended for new buildings and will become
mandatory for all new builds started after January 2013.
However, a voluntary estimated theoretical calculation was requested by ADNATCO-
NGSCO for it vessels in operation, based on the formula without sea trials and verification in
order to provide an estimated EEDI value for internal reference. This has been calculated for
each vessel type applicable and based on IMO Guidelines and plotted in relation to the IMO
reference line.

DET NORSKE VERITAS
Report for ADNATCO-NGSCO
MANAGING RISK Fleet Energy Efficiency Study
Page 13 of 151
4 METHODOLGY
This section aims to describe how the project was executed.
4.1 DNV energy efficiency process description
Below is an illustration of the typical process of an Energy Efficiency project DNV conducts.
A phase 1 was carried out with ADNATCO-NSGCO, where the process establishes the “as
is” situation working closely together to review data, conduct interviews and workshops,
analyse data and produce key recommendation as to where the ADNATCO-NGSCO realise
energy savings organisational improvements. The identified opportunities will further be
developed in Phase 2 to properly tailor them to ADNATCO-NSGCO‟s organisation. Full
implementation will be conducted in Phase 2.
Phase 1
Opportunity assessment
Phase 2
Solution development
Phase 3
Implementation
3 – 6 months
Objective:
• To prepare tailor made solutions
moved forward from phase 1 for
piloting or fleet implementation
• Swift implementation and
realisation of benefits for
identified “quick wins”
> 6 months
Objective:
• Realise the identified
opportunities by efficient
implementation of solution
elements & training programs
6 weeks
Objective:
• High level verification and
quantification of improvement
opportunities
• Quantitative and/or qualitative
benchmark of performance vs.
leading practises
• Establish a foundation for an
improvement programme.
• Identify quick wins for possible
piloting
DNV Polarcus
Figure 4-1 : DNV Three-phase Energy Efficiency Process

DET NORSKE VERITAS
Report for ADNATCO-NGSCO
MANAGING RISK Fleet Energy Efficiency Study
Page 14 of 151
4.2 Activities for Energy Efficiency opportunity assessment
The work was executed through the use of various techniques, methods and tools as
demonstrated in the illustration below:
Data gathering and interviews
Workshops Recommendations Analysis
Main Engine assessment Test Date 31.12.2007 Result
Engine balance (compared to avereage) Yellow Red Value
Pmax Maximum combustion pressure 5 7 % 3,4 %
Pcomp Compression pressure 4 5 % 5,1 %
FPI Fuel Pump Indicator 5 10 % 3,2 %
Texh Exhaus gas temperature 7 9 % 5,6 %
Engine efficiency (compared to new building sea trial)
Pmax Corrected comb. press. drop compared to engine ref. 5 10 % 20,4 %
Pcomp Corrected compression pressure drop compred to engine ref. 5 15 % 13,8 %
Texh Corrected exhaust gas temp. increase compared to engine ref. 10 15 % 13,8 %
ΔTTC Turbo charger differential temp decrease compared to ref. 15 20 % 26,7 %
Engine thermal load - MCR achivable 100 % 100 %
ΔPscav 280 mm 120
Engine overloada_Pmax Angle of maximum pressure less than 11,5 or greater than 16° 11,5 16 deg 0,0
Pignition Max pressure rise more than manufacturer's recommendation 30 bar 21
Fuel oil consumption (compared to NB sea trial)
t/d FO consumption increase to refence per day @ NCR [+4,31 (t/d)] 0 0 % 3,8 %
Warning levels
Scavenging air cooler air side fouling (mm H2O)
Benchmarking and Way forward development
Capability benchmarking
244
Client DNV
Analysis
US$
Way forward plan
Phase 1
Opportunity identification
Phase 2
Solution development
Phase 3
Implementation
Aux Eng
Bunker mgt
Autopilot
SUSTAINABLE
OPERATIONS (way of life)
* KPI’s
* Measurement
* Reporting
* Job descriptions
* Procedures
Saving
realisations
MUSD
NEW AREAS
* Maintenance
* Training
Trim/ballast
Hull/propell
Main engine(s)
Voyage mgt
1st round
2nd round
3rd round
8 12 16 20 weeks
The Way Forward for SCI
Organisation & Strategy
Voyage Performance
Ship Performance
Main & Aux Engines
Energy Consumers
Fuel Management
Par Best industry performance Company X
Figure 4-2 : Energy Efficiency opportunity assessment workflow
4.3 Data gathering and interviews
DNV requested and analysed data from ADNATCO-NGSCO with regard to their
organisational structure, fleet information, vessel performance data, noon reports etc., and
made observations serving as input to the interviews.
Interviews were conducted on-site of ADNATCO-NGSCO from 18th
– 29th
March, 2012 with
selected key members of the management relative to their functions including but not limited
to Executive Management Team, Vessel Managers, Department Managers, Superintendent,
On-board personnel etc. Interviews were done face to face or via telephone with Masters and
Chiefs that were available at the time for discussion.
In Addition one ship visit was made in Fujairah on LNG Al Khaznah vessel on 22nd
March
2012 to witness bunkering operations and interview the Master and Chiefs. Below is the list
of people interviewed, where some were absent at the time a stand in was interviewed:
4.3.1 Interview list Figure 4-3 : Interview list of key members of management team
Sn Position
1 CEO
2 SVP Operations
3 Tanker, Dry, LNG Fleet Managers
4 Tanker, Dry, LNG Fleet Senior Technical Superintendents
5 Tanker, Dry, LNG Fleet Senior Operations Superintendents
6 Tanker Technical Superintendent
7 Dry Operations Superintendent
8 LNG Technical Superintendent group
9 Marine Personnel Officer
10 Tanker Charter Manager

DET NORSKE VERITAS
Report for ADNATCO-NGSCO
MANAGING RISK Fleet Energy Efficiency Study
Page 15 of 151
Sn Position
11 VP Corporate Strategy
12 SVP Procurement
13 VP Finance
14 VP HR and Administration
15 VP HSE Division
16 Bunkering and Agency Officer
17 Procurement Officer
18 Captain and Chief engineer of DIYYINAH-I ( Tanker)
19 Captain and Chief engineer of ABU DHABHI-III ( Tanker)
20 Captain and Chief Engineer of SHAH ( Bulk Carrier)
21 Captain and Chief Engineer of RASGHUMAYAS ( Bulk Carrier)
22 Captain and Chief engineer of ARRILAH-I ( Bulk Carrier)
23 Captain and Chief engineer of AL KHAZNAH (LNG)
24 Captain And Chief Engineer of MRAWEH ( LNG)
4.4 Workshops
The results from the focused interviews were collated and some key observations and
hypothesis were determined. These were used as the basis for discussion during workshops
with ADNATCO-NSGCO‟s key resources where initiatives and hypothesises were presented
and discussed. The workshop ambition is to ensure that observations were validated and
identify any need for further analysis.
4.5 Analysis
All information gathered from interviews, workshops and systems were analysed using
various methods and tools to assess ADNATCO-NSGCO‟s performance and to benchmark
against industry best practice and industry peers.
4.6 Capability Benchmarking
Based on all the information reviewed, interviews and workshop conclusions and data
analysed, DNV assessed the organisation based on the 6 key focus areas mentioned in section
2.4 above and rated the organisation accordingly using a scoring system.
4.7 Opportunity assessment
As a result of the qualitative and quantitative analysis of information and data covered during
the course of the project, key improvement opportunities relating to energy efficiency were
identified and related to potential fuel savings where appropriate.

DET NORSKE VERITAS
Report for ADNATCO-NGSCO
MANAGING RISK Fleet Energy Efficiency Study
Page 16 of 151
4.8 Recommendations
As a result of the qualitative and quantitative analysis of information and data covered during
the course of the project, the workshops and the benchmarking process, DNV has made
improvement opportunity recommendations under the 6 areas of focus mentioned in section
2.4 above which include statements of saving potentials as appropriate, prioritisation of those
recommendations and the identification of quick win opportunities.
4.9 Way Forward development
As part of the final report delivery, DNV has developed a high level way forward plan
illustrating how best ADNATCO-NGSCO should proceed with development of solutions and
the process of implementing those solutions on a prioritisation and time basis so as to realise
the benefits and opportunities .
4.10 Assumptions and limitations
In the work carried out the following assumptions has been employed. Other assumptions
taken into account are explained.
The information and data provided is correct and accurate
Fuel Price of HFO of US$ 720/MT
Fuel Price of MGO of US$ 1040/MT
Where no consumption information was available for Auxiliary engines a SFOC of
220g/kwh was assumed.
CO2 conversion factor for MGO of 3.206
CO2 conversion factor for HFO of 3.1144

DET NORSKE VERITAS
Report for ADNATCO-NGSCO
MANAGING RISK Fleet Energy Efficiency Study
Page 17 of 151
5 THE ADNATCO-NSGCO FLEET
ADNATCO-NGSCOfleet comprises of 2 oil tankers, 9 bulk cargo vessels, 3 chemical tankers,
2 container vessels, 4 product carriers, 2 Ro-Ro vessels and 8 LNG carriers.
Figure 5-1 ADNATCO- NGSCO Fleet Overview
The 8 LNG vessels sit under NGSCO and
the reaming 22 vessels are under
ADNATCO.
The trade pattern of the LNG vessels are
fixed on a steady long term contract
between ADGAS and Tokyo Electric Power
Co. (TEPCO) and operate on a very regular
schedule between the Das Island
liquefaction plant and Tokyo Bay.
The container and RoRo vessels operate in
the Middle East coastal areas whilst the
small vessels operate between Ruwais and
Abu Dhabi.
The bulk vessels are operated on the spot market trading generally places such as the Middle
East, North Africa, India and South America, essentially around the equator. The oil tankers
are operated on the spot market trading in the Far East in places such as India, Malaysia and
Korea.
For the purposes of this project, 7 case vessels were selected as a representation of the
ADNACTCO-NGSCO fleet and were considered as average performing vessels based on
input from ADNATCO-NGSCO. These case vessels have been used as the case upon which
the savings potentials are calculated and aggregated to form an overall saving for the whole
fleet. The vessels are as follows:

DET NORSKE VERITAS
Report for ADNATCO-NGSCO
MANAGING RISK Fleet Energy Efficiency Study
Page 18 of 151
5.1.1 ADNATCO-NGSCO Case Vessels
5.1.1.1 Tanker Fleet
Oil Tanker:
Abu Dhabi - III
Ship particulars
Length Overall 243.98m
Beam 42.0m
Max Draft 15.33m
Deadweight: 105,200 MT
Main Engines: Hyundai B&W 6S60MC-C8
MCR rating: 14,280 kw x 105 RPM
Product Tanker
Bani Yas
Ship particulars
Length Overall 288m
Beam 32.24m
Max Draft 14.598m
Deadweight: 73,700 MT
Main Engines: STX MAN B&W7S50MC-C(MK VII)
MCR rating: 15,050 BHP
Chemical Tanker:
Umm All Lulu-I
Ship particulars
Length Overall 139.95m
Beam 21m
Max Draft 8.269m
Deadweight: 15,485 MT
Main Engines: Caterpillar MAK 6M 43 C
MCR rating: 5400 KW
Bulk Carrier:
Shah
Ship particulars
Length Overall 186.40m
Beam 27.84m
Max Draft 11.145m
Deadweight: 37,000 MT
Main Engines: Hyundai MAN B&W 6S50MC-C7
MCR rating: 7860 KW

DET NORSKE VERITAS
Report for ADNATCO-NGSCO
MANAGING RISK Fleet Energy Efficiency Study
Page 19 of 151
Container Vessels
Al Bazm-II
Ship particulars
Length Overall 149.46m
Beam 22.7m
Max Draft 11.2m
Deadweight: 1100 TEU
Main Engines: MAN B&W 8S35MC7
MCR rating: 5920 KW x 173 RPM
Ro-Ro Vessel
Al Dhafrah
Ship particulars
Length Overall 121.48m
Beam 21
Max Draft 5.3m
Deadweight: 4,405 MT
Main Engines: 2xMAK 9M453 AK 2x3600 Bhp 600 Rpm
MCR rating: 3600 BHP
5.1.1.2 LNG Carriers
Al Hamra
Ship particulars
Length Overall 290.10m
Beam 48.10m
Max Draft 11.767m
Deadweight: 73,000 MT
Main Engine: Steam Turbine Mitsubishi ( MS 40-2)
MCR rating: 29,600 kw @ 85 rpm

DET NORSKE VERITAS
Report for ADNATCO-NGSCO
MANAGING RISK Fleet Energy Efficiency Study
Page 20 of 151
6 ADNATCO-NGSCO’S CURRENT ENERGY EFFICIENCY PRACTICE
During the process of interviews and workshops, it was
clear that the environment is a strong focus within
ADNATCO-NGSCO and there exists an embedded
awareness within all employees and since becoming
ISO14001, further emphasis was placed on this. The
company has identified environmental aspects of both
its shore and ship based activities such that those that
are deemed to have significant impact to the
environment are monitored and evaluated in monthly
HSE meetings. Some of the aspects include:
CO2, SOx, NOx, Methane CH4, GHG emission, HCFC‟s used and Energy Consumption
Furthermore, the company is part of the ADNOC Sustainability Performance Initiative which
requires annual reporting of numerous metrics relating to the environment which include but
not limited to the above mentioned aspects.
In addition, 3 notable energy efficiency initiatives in LNG operations were observed as
mentioned below:
In 2010 the LNG fleet increased the number of voyages in that
year by 5 more than the previous and consuming 100 tons less
bunker fuel.
Negotiating with ADGAS on increasing the use of LNG for
propulsion and thereby reducing heavy fuel oil consumption
and CO2 emissions.
Reduction of hull resistance with the application of Intersleek a
self-cleaning hull paint above 10 knots to all LNG vessels with
mix feelings of success.
These single initiatives were made through a concentrated focus on
reducing the energy consumption and CO2 emitted on the LNG fleet on more of a one off
push rather than part of a wider programme to reduce consumption.
During the course of the project, it was evident that whilst a lot of effort is being made to
account for and improve the company‟s environmental footprint, there did not appear to be a
companywide policy, strategic plan or focus on energy efficiency, where in DNV‟s
experience the organisational enablers and strategic direction must be in place for a company
to be successful with energy management. Single energy efficiency initiatives (e.g. propeller
polishing, trim optimisation, etc) can be successfully implemented and reduce energy
consumptions on ships, but a company will not be able to take out its full potential without
addressing the organisation as a whole.
It was clear from interviews, discussions and workshops that ADNATCO-NGSCO‟s
employees from the CEO to the crew believe there are opportunities for improvement and
showed great willingness and engagement to be part of creating those opportunities.

DET NORSKE VERITAS
Report for ADNATCO-NGSCO
MANAGING RISK Fleet Energy Efficiency Study
Page 21 of 151
6.1 ADNATCO-NGSCO Guiding Documentation
During DNV‟s time with ADNATCO-NGSCO the following documents were referred to in
interviews, discussions and workshops as providing guidance or focus to the organisation and
crew on energy management:
ADNATCO-NGSCO Dry Cargo Operations Manual
ADNATCO-NGSCO Tanker Operations Manual
ADNATCO-NGSCO LNG Operations Manual
QHSSE Policy
ADNATCO & NGSCO Fleet KPIs
The above operations procedures make some references to energy efficiency related aspects
such as fuel economy, reduction of speed and optimal engine loading but the responsibility is
left up to the individual masters and chief engineers to decide and does not appear to be
driven from top management or through a structured framework of appraisal.
The company QHSSE policy focuses on numerous aspects including the environment,
however there is limited reference to improving performance and striving for energy
efficiency in operations.
KPIs exist for both the ADNATCO and NGSCO fleet where only the NGSCO fleet have
some mention of energy efficiency and emissions related, however the KPI on bunker
consumption and how it is formulated is not understood and hence is not measured. The KPI
on CO2 emissions is monitored and calculated based on fuel consumption however it is
unclear how this is achievable by the crew.
No energy efficiency related KPIs exist at present
for the ADNATCO fleet.
Overall, the manuals focus on technical integrity
of the vessels and the KPIs on the safety and
quality of operations but in the context of energy
efficiency there is little in the way of concrete
policies and guidelines in place to ensure the
specific aspects from the highest levels in the
organisation at a Policy level get translated to the
on board operational tasks.

DET NORSKE VERITAS
Report for ADNATCO-NGSCO
MANAGING RISK Fleet Energy Efficiency Study
Page 22 of 151
6.2 What the people on board say
6.2.1 Basis Ship
Ship email questionnaire sent out to all ADNATCO-
NGSCO vessels at the beginning of the project. Masters
and Chief Engineers were also invited to provide free text
inputs on potential improvements
Objective of questionnaire was to map the Energy
Management culture within the company, ensure
involvement of sea staff and investigate current practices
on how some elements of vessel-operations are conducted
throughout the fleet.
All 30 ships questionnaires, 8 LNG and 22 Tanker were
retuned.
6.2.2 Main results from any free text - Tanker
Masters and Chief Engineers are generally very committed to fuel saving in their day
to day business however some are unaware of what they can do to help
Ship performance is perceived differently from various crews and limited sharing of
best practice within fleet (trim, auto pilot etc)
Weather routing used if charter requires only otherwise down to Master‟s judgment
Crew receives feedback on reports from the office when there is problem only
Suggestions from crew are always welcomed by the office
A ship specific Trim and Draft program would be beneficial in optimizing fuel burnt
Propeller cleaning only done in dry dock
Checks on hull conditions only when opportunity arises, not regular procedure
Bunker samples always sent for testing
Bunker quantity surveyors highly recommended
6.2.3 Main results from any free text - LNG
Masters and Chief Engineers are generally very committed to fuel saving in their day
to day business however some are unaware of what they can do to help
There is a general resistance to change
Passage planning relates to arrive time only and not fuel consumption
Measures and targets are self-defined
Time in hand on ETA is sometimes excessive
Checks on hull conditions only when opportunity arises, not regular procedure
Propeller cleaning only in dry dock
6.2.4 Results from questions
The scoring is based on a total positive answer basis in relation to each question asked in 8
sections in the questionnaire. Please refer to the appendix for a sample of the question set.

DET NORSKE VERITAS
Report for ADNATCO-NGSCO
MANAGING RISK Fleet Energy Efficiency Study
Page 23 of 151
Generally the crew on board are committed to energy saving.
There are minor differences that can be seen between the LNG and Tanker fleet where
it would appear that less focus is put on items 1- 4 however this is due to the nature of
the fixed route and coating of the propellers.
Masters and CE seem to have a strong belief in the company ability to save fuel, but
there is still some work to do on informing and making the ship crew aware of the
company focus on fuel management.
Specific targets and guidance is required from the office to facilitate the crew.
Regular feedback on performance and encouraging of information sharing and
benchmarking is needed.
Figure 6-1 : Questionnaire Results – LNG Fleet & Dry and Tanker Fleet

DET NORSKE VERITAS
Report for ADNATCO-NGSCO
MANAGING RISK Fleet Energy Efficiency Study
Page 24 of 151
6.3 Performance management
Currently in ADNATCO-NGSCO there are 2 data and information
systems running in the company where the LNG fleet are using
AMOS and Tanker fleet are using excel and paper based reporting.
There are various reports sent in to the office which are evaluated
and compared to the previous results and if anything unusual is
spotted it is then flagged and reported back to the ship for
clarification. Such reports include:
Chief Engineers reports
NOON reports
Monthly technical performance reports
Voyage reports
Main and Auxiliary Engine load tests
Each report serves a different requirement for technical, operations and commercial with
varying styles and formats between fleet types where the crew are required to generate these
numerous reports. Many of them contain the same information with additional parameters
depending on the office based requirement and hence numerous duplication of information
and reporting being done.
With the present information and reporting system, it is very difficult to establish an accurate
picture and detailed breakdown of each vessel into the numerous operations modes they
perform such as:
Loading Port
Laden pilot to pilot
Laden manoeuvre
Discharging Port
Ballast pilot to pilot
Ballast manoeuvre
Waiting

DET NORSKE VERITAS
Report for ADNATCO-NGSCO
MANAGING RISK Fleet Energy Efficiency Study
Page 25 of 151
Monthly and yearly summaries of energy, lube oil and
chemicals is done however no trending of the information
is carried out and hence there is a limited ability to monitor
and benchmark performance and consumption on a real
time basis.
Within the tanker fleet, there are no set targets or KPI‟s in
place nor communicated across the company that focus on
energy efficiency or management of performance and
improvement thereof.
The LNG fleet have 2 KPIs relating to annual CO2 emissions and bunker consumption
efficiency, however the origins of the latter and how it is calculated or measured is unclear
and thus not focused on. Hence no benchmarking of performance is done between vessels.
Co-ordination between the commercial, operations and technical departments is good
however there is no structured approach with regard to energy efficiency or common data and
information reporting format or tool that can be used to make key decisions upon.
Today the data collected from the vessel is substantial but it is not transformed to information
and decision support. A performance management system should:
Be a central tool for understanding and improving company performance.
Ensure ability to measure actual performance
Enable evaluation of performance towards historic trend and/or a defined set of targets
Support corrective actions which lead to further improvements
Currently ADNATCO-NGSCO is undergoing implementation of SAP ERP business solution
to address the needs of its expanded fleet and operational requirements. It is anticipated that
this system will be used as performance management tool retrieving data, transforming into
information and KPIs that can be used for evaluation and action taking.
Figure 6-2 : Illustration of high-level dataflow for an ideal reporting tool for ADNATCO-NGSCO

DET NORSKE VERITAS
Report for ADNATCO-NGSCO
MANAGING RISK Fleet Energy Efficiency Study
Page 26 of 151
6.4 Operational profiles and fuel consumption for ADNATCO-NGSCO fleet
Based on the information extracted from ADNATCO-NGSCO Technical Performance
Reports, it was possible to establish operational profiles for 7 representative vessels in
operation. The purpose of doing so was to establish a pattern as to how the vessels spend their
time during the course of their operations and how energy consumed is apportioned to the
various profiles. It is important to note that these are used as the base cases for the savings
calculations for the whole ADNATCO-NGSCO fleet, where the savings calculation basis is
further described in the next section below.
6.4.1 Tanker Fleet
Abu Dhabi III
Operations Mode MT/day Fuel MT/day Fuel MT/day Fuel
Sea Passage Ballast (hrs) 37.96 HFO 3.01 HFO 0.3 HFO
Sea Passage Laden (hrs) 39.13 HFO 3.20 HFO 0.3 HFO
Port/Waiting Time (hrs) 2.0 HFO 2.90 HFO 3.5 HFO
Main Engine (avg.) Aux Engine (avg.) Boiler (avg.)
CRUDE OIL

DET NORSKE VERITAS
Report for ADNATCO-NGSCO
MANAGING RISK Fleet Energy Efficiency Study
Page 27 of 151
Bani Yas
Operations Mode MT/day Fuel MT/day Fuel MT/day Fuel
Sea Passage Ballast (hrs) 30.65 HFO 2.35 HFO 2.35 HFO
Sea Passage Laden (hrs) 34.64 HFO 2.64 HFO 1.52 HFO
Port/Waiting Time (hrs) 1.4 HFO 2.42 HFO 9.87 HFO
Main Engine (avg.) Aux Engine (avg.) Boiler (avg.)
Umm Al Lulu
Operations Mode MT/day Fuel MT/day Fuel MT/day Fuel MT/day Fuel
Sea Passage Ballast (hrs) 17.28 HFO 1.32 HFO 0.15 MGO 0.21 HFO
Sea Passage Laden (hrs) 16.99 HFO 1.20 HFO 0.11 MGO 0.23 HFO
Port/Waiting Time (hrs) 0.74 HFO 1.64 HFO 0.12 MGO 0.39 HFO
Boiler (avg.)Main Engine (avg.) Aux Engine (avg.)
CHEMICAL
PRODUCT

DET NORSKE VERITAS
Report for ADNATCO-NGSCO
MANAGING RISK Fleet Energy Efficiency Study
Page 28 of 151
6.4.2 Dry Fleet
Shah
Operations Mode MT/day Fuel MT/day Fuel MT/day Fuel MT/day Fuel
Sea Passage Ballast (hrs) 21.24 HFO 1.96 HFO 0.23 MGO 0.84 HFO
Sea Passage Laden (hrs) 22.87 HFO 2.21 HFO 0.27 MGO 0.70 HFO
Port/Waiting Time (hrs) 1.0 HFO 1.88 HFO 0.19 MGO 1.09 HFO
Boiler (avg.)Main Engine (avg.) Aux Engine (avg.)
Al Bazm II
Operations Mode MT/day Fuel MT/day Fuel MT/day Fuel MT/day Fuel
Sea Passage Ballast (hrs) 16.6 HFO 1.90 HFO 0.36 MGO 0.74 HFO
Sea Passage Laden (hrs) 16.6 HFO 1.97 HFO 0.32 MGO 0.79 HFO
Port/Waiting Time (hrs) 0.86 HFO 2.18 HFO 0.23 MGO 1.05 HFO
Main Engine (avg.) Boiler (avg.)Aux Engine (avg.)
CONTAINER
BULK

DET NORSKE VERITAS
Report for ADNATCO-NGSCO
MANAGING RISK Fleet Energy Efficiency Study
Page 29 of 151
Al Dhafra
Operations Mode MT/day Fuel MT/day Fuel MT/day Fuel MT/day Fuel
Sea Passage Ballast (hrs) 12.5 HFO n/a HFO 1.80 MGO 0.10 MGO
Sea Passage Laden (hrs) 12.74 HFO n/a HFO 1.80 MGO 0.10 MGO
Port/Waiting Time (hrs) 1.6 HFO n/a HFO 1.80 MGO 0.10 MGO
Aux Engine (avg.)Main Engine (avg.) Boiler (avg.)
6.4.3 LNG Fleet
Al Hamra Aux Engine (avg.)
Operations Mode MT/day Fuel BOG Equiv.
MT/DayFuel MT/day Fuel
Sea Passage Ballast (hrs) 118.0 HFO 45.6 LNG 0.3 MGO
Sea Passage Laden (hrs) 128.2 HFO 63.4 LNG 0.1 MGO
Port/Waiting Time (hrs) 45.1 HFO 16.0 LNG 0.1 MGO
Main Engine (avg.)
RORO
LNG

DET NORSKE VERITAS
Report for ADNATCO-NGSCO
MANAGING RISK Fleet Energy Efficiency Study
Page 30 of 151
6.4.4 Savings Calculation methodology
The basis for the calculation of the savings potential in this report is set on the following:
Compilation of Monthly Technical Performance Reports for each case vessel
Sorting into operational time profiles: Ballast, Laden and Port Waiting time
Averaging of fuel consumed for ME, AE and Boiler in MT per day (HFO and MGO)
Multiplying : consumption per day x 365 days x Operational Time x No of Vessels
Applying the appropriate fuel cost assumptions to HFO or MGO
Applying the saving % per initiative as applicable to the fleet and operational profile
Below is an illustrative example for Oil Tanker - Main Engine HFO, considering the effect of
improved voyage planning and speed management:
HFO Fuel Price 720 USD/MT
MGO Fuel Price 1040 USD/MT 1
Case Vessel:
Abu Dhabi III Cons/day Days/yr Ops Mode Subtotal/yr Vessels Total HFO/yr Total MGO/yr $ /year - HFO $ /year - MGO
1. Voyage
Planning and
Speed
Management
Fuel
Saving/yr
Operation Mode MT Days % MT No. MT MT USD USD % MT
Sea Passage Ballast 37.96 365 23% 3187 2 6373 n/a $4,588,908 n/a 10.0% 637.35
Sea Passage Laden 39.13 365 34% 4856 2 9712 n/a $6,992,688 n/a 10.0% 971.21
Port/Waiting Time 2 365 43% 314 2 628 n/a $452,016 n/a n/a
16713 $12,033,612 1608.56
Main Engine - HFO
Oil Tankers
Figure 6-3 : Illustrative example for Oil Tanker – Main engine HFO, considering the effect of improved voyage planning & speed
management
Below is the total estimated annual fuel cost for the whole ADNATO-NGSCO fleet based on
365 days in a year and is the denominator for the overall savings calculations:
HFO Fuel Price 720 USD/MT
MGO Fuel Price 1040 USD/MT
Total HFO/yr Total MGO/yr $ cost/year - HFO $ cost/year - MGO
MT MT USD USD
Oil x 2 20,145 0 $14,504,458 $0
Product x 4 44,886 0 $32,317,883 $0
Chemical x 3 6,670 133 $4,802,617 $138,364
Bulk x 9 48350 743.724 $34,811,960 $773,473
Container x 2 4318 177.536 $3,109,029 $184,637
RoRo x 2 3502 1387 $2,521,303 $1,442,480
LNG x 8 488385 554.8 $351,636,912 $576,992
616256 2996 $443,704,162 $3,115,947
Total Fuel (MT)
Tanker
Dry Fleet
LNG Fleet
Vessel type
$446,820,108
ESTIMATED ANNUAL AVG. FUEL COST
619,252 Figure 6-4 : Total estimated annual fuel cost for the whole ADNATCO-NGSCO fleet based on 365 days in a year

DET NORSKE VERITAS
Report for ADNATCO-NGSCO
MANAGING RISK Fleet Energy Efficiency Study
Page 31 of 151
7 BENCHMARKING OF ADNATCO-NGSCO ENERGY
MANAGEMENT CAPABILITIES
7.1.1 Benchmarking approach
DNV energy management benchmarking model focuses on the company‟s inherent
capabilities related to energy efficiency and seeks to provide a qualitative assessment of
performance based on interviews and information assembled. The benchmarking does not say
anything about the actual technical condition from an energy management perspective, this is
outlined in the qualitative assessment of savings potential where all potential energy losses are
analysed and savings potential (i.e. technical condition) is established.
The benchmarking addresses how the company works with the main dimensions of energy
management as outlined in section 1 and further elaborated in the bullet list below. Each main
dimension is divided into a number of sub-categories and analysed as follows:
1. Assessment of handling of each subcategory related to
a. Process – How are processes governing energy efficiency defined and
embedded in the day to day operation
b. Tools & Technology applied – What tools for measuring performance is
employed and how are ADNATCO-NGSCO actively seeking technology
solutions to further improve efficiency.
c. People & Organisation – What capabilities does the organisation and
individual persons possess related to the topic.
2. The assessment is based on a defined scale from “1” – “5” where 1 denotes significant
room for improvement and 5 indicates mature operation related to energy efficiency.
In the benchmarking procedure scoring “1”, “3” and “5” are described to guide the
assessment and ensure similar assessment.
A description of the main dimensions of the benchmarking is outlined below.
Capability dimension Description
Management &
Organisation
Assessment of how ADNATCO-NGSCO is handling the energy
efficiency dimension related to:
Energy management strategy & Tactical plans
Performance management
Roles & responsibilities
Competence, training & awareness
Environment & corporate responsibility
Experience transfer & Life cycle perspective

DET NORSKE VERITAS
Report for ADNATCO-NGSCO
MANAGING RISK Fleet Energy Efficiency Study
Page 32 of 151
Capability dimension Description
Voyage Performance
Assessment of how ADNATCO-NGSCO is handling the energy
efficiency dimension related to:
Fleet planning, route and ship allocation.
Chartering/Contracts
Voyage planning
Voyage execution and speed management
Weather routing and sea currents
Port and harbour operations
Ship Performance
Assessment of how ADNATCO-NGSCO is handling the energy
efficiency dimension related to:
General capability description for ship performance
Hull Condition
Propeller condition
Autopilot & rudder
Trim & draft
Hull appendages
Fuel Management
Assessment of how ADNATCO-NGSCO is handling the energy
efficiency dimension related to:
Pre bunkering
Bunkering
Post bunkering
Primary consumer
Assessment of how ADNATCO-NGSCO is handling the energy
efficiency dimension related to:
Engine performance
Engine utilisation
Secondary consumers
Assessment of how ADNATCO-NGSCO is handling the energy
efficiency dimension related to:
General energy consumers
Water production
AC plants
Hydraulic systems
Electric lighting
Compressor handling

DET NORSKE VERITAS
Report for ADNATCO-NGSCO
MANAGING RISK Fleet Energy Efficiency Study
Page 33 of 151
7.1.2 ADNATCO-NGSCO energy efficiency benchmarking
As illustrated in the overview in ADNATCO-NGSCO scores below average in most areas of
the analysis. It shall be stated that ADNATCO-NGSCO have gone through a rapid growth in
terms of fleet expansion over the last couple of years and the organisation is currently settling
for more stable conditions. Regardless a number of aspects are needed to address in order to
meet and potentially beta the industry average in this respect. Detailed explanation to scoring
is provided in the below table.
Figure 7-1: ADNATCO-NGSCO energy management benchmarking Industry Benchmarking

DET NORSKE VERITAS
Report for ADNATCO-NGSCO
MANAGING RISK Fleet Energy Efficiency Study
Page 34 of 151
Capability
dimension ADNATCO-NGSCO performance assessment
Management &
Organisation
Process
ADNATCO-NGSCO have some guiding documentation on optimal
performance of equipment and also reports on fuel consumption.
However, he room for improvement related to embedded and
institutionalised energy efficiency operation is significant. This is true for
most analysed areas (Energy management strategy & Tactical plans;
Performance management; Experience transfer & Life cycle perspective)
Tools & Technology The tools and procedures for institutionalising energy efficiency in in the
organisation is not in place and the SMS does not target energy
efficiency.
Performance follow up is a major development area within ADNATCO-
NGSCO where much reporting is based on manual and sometimes
handwritten reports with limited automated analysis and follow up.
People & Organisation
Roles and responsibilities related to energy management are not defined
and no structured training and awareness campaigns on this subject.
Voyage
Performance
Process
Voyage performance in general and the aspect of fuel efficiency in
voyage planning is not institutionalised in ADNATCO-NGSCO. Full
speed ahead is the general paradigm.
Tools & Technology Tools and support in the voyage planning phase to incorporate energy
efficiency can be improved in both chartering and operations.
People & Organisation
The cooperation between technical and chartering/operations related to
energy consumption and implication on fuel efficiency correlation to
speed for example.

DET NORSKE VERITAS
Report for ADNATCO-NGSCO
MANAGING RISK Fleet Energy Efficiency Study
Page 35 of 151
Capability
dimension ADNATCO-NGSCO performance assessment
Ship Performance
Process
Limited process support on-board or onshore to manage ship
performance in SMS manuals or maintenance management system.
Tools & Technology No tools for follow up on hull performance, propeller performance or
trim and drag institutionalised.
People & Organisation
Clear roles and responsibilities not assigned.
Fuel Management
Process
There are significant improvement potential related to process aspects, it
is observed misalignment regarding terminology, process related to
benchmarking of received quality and quantity and in addition some
vessels carry carrying non-compliant statutory documents related to
MARPOL annex VI.
Tools & Technology No tools in place for supplier benchmarking and structured analysis of
bunker operations.
People & Organisation
Limited training of onshore and on-board personnel handling bunker
purchase currently. Improved and structured knowledge management
will increase awareness and performance.
Primary consumer
Process
ADNATCO-NGSCO carry out structured reporting on consumer
performance however little structured and trended analysis of data
received. Related to utilisation of auxiliary engines limited follow up but
however guidelines on how to utilise engines form a technical integrity
point of view is in place.
Tools & Technology The reporting templates are fit for purpose but a one off exercise. Limited
institutionalised follow up with embedded trending and support for
handling deficiencies.
People & Organisation
Clear roles and responsibilities not assigned.

DET NORSKE VERITAS
Report for ADNATCO-NGSCO
MANAGING RISK Fleet Energy Efficiency Study
Page 36 of 151
Capability
dimension ADNATCO-NGSCO performance assessment
Secondary
consumers
Process
Limited process support related to energy efficiency, however guidelines
to ensure technical integrity.
Tools & Technology No application of frequency drives or low energy appliances to reduce
consumption on-board. Limited structured follow up.
People & Organisation
Awareness on-board related to impact on fuel consumption and handling
of secondary consumers

DET NORSKE VERITAS
Report for ADNATCO-NGSCO
MANAGING RISK Fleet Energy Efficiency Study
Page 37 of 151
8 ENERGY EFFICIENCY OPPORTUNITY ASSESSMENT
Based on DNV‟s work in collaboration with ADNATCO-NGSCO and the information made
available at the time of the project, below is a summary of savings in % in cost estimated for
the entire ADNATCO-NGSCO fleet.
Focus area Savings [%]
Voyage performance
Voyage Planning and Speed Management 1.2%
Chartering and Contracts 0.0%
Weather Routing 0.9%
Autopilot Settings 0.9%
Port Operations 0.0%
Subtotal Voyage performance 3.1%
Ship performance
Sea trials 0.0%
Propeller polishing/cleaning 0.4%
Hull condition 0.7%
Draft optimization 0.3%
Trim optimization 3.5%
Energy efficiency devices 0.0
Subtotal Ship performance 4.9%
Primary Energy Consumers
LNG Steam Plant Main Boiler - Viscosity Control 0.5%
LNG Main Boiler Combustion Air System Air Heaters 0.4%
LNG Combustion Air System Forced Draught Fans and Furnace 0.8%
LNG Flue Gas Oxygen Content/Smoke Indicators - Exhaust System 0.8%
LNG Main Turbine Performance 0.0%
LNG Main Condenser-Performance 1.6%
LNG Condensate Feed System 0.8%
LNG Auxiliary Engine Utilization 0.5%
Main Engine Performance 0.5%
Auxiliary Engine Performance 0.2%
Auxiliary Engine Utilization 0.3%
Auxiliary Boiler Utilization and Performance 0.0%
Economiser Performance 0.0%
Subtotal Primary Energy consumers 6.3%
Secondary Energy Consumers
Secondary Consumer Performance 0.1%
Variable Speed Drives 0.1%
Low Energy Appliances 0.0%
Subtotal Secondary Energy consumers 0.1%
Fuel Management
Understanding Fuel Specifications 1.5%
Systematic Benchmarking of Fuel Quantity 1.0%
Fuel Ordering 1.5%
Statutory and Environmental Risk 0.0%
Fuel Quality Testing 2.0%
Fuel Training 0.5%
Subtotal Fuel Management 6.5%
Total 21%

DET NORSKE VERITAS
Report for ADNATCO-NGSCO
MANAGING RISK Fleet Energy Efficiency Study
Page 38 of 151
The above diagram shows a breakdown in Fuel Savings per vessel type in ADNATCO-
NGSCO based on a 365 day fuel cost for all vessels in each type category.
In all vessels fuel management shows some opportunities since this is a central
function
In LNG the largest savings are found in optimizing the main plant performance
In all remaining vessel types savings can be found in all areas where the bigger gains
are found in Ship performance through propeller polishing, optimizing of trim and
draft and in Primary Consumers through better utilization of Auxiliary Engines
through maintaining higher load factors.
Illustrating the potential in a waterfall diagram as
per below it is easy to see that the potential for
ADNATCO-NGSCO to optimise the energy
consumption is significant. The primary energy
consumer, ship performance and voyage
performance aspects represent the majority of this
saving. The activities, investments and time
required to achieve these vary and hence the
initiatives need to be prioritized which will be
outlined in the subsequent sections.
The below savings are based on the operations
data provided by ADNATCO-NGSCO for the case
vessels mentioned in Chapter 5, assuming these
vessels are representative of the ADNATCO-
NGSCO fleet.
Summary of savings potential/yr:
Oil Tankers: 21%
Product Tankers: 22%
Chemical Tankers: 23%
Bulk Carriers: 23%
Containers: 21%
RoRo’s: 21%
LNG’s: 21%
Total: circ. 130k (MT)
US$ circ. 93 million
400 k MT of CO2 (HFO&MGO)
Figure 8-1 : Fuel savings by Vessel Type and Initiative

DET NORSKE VERITAS
Report for ADNATCO-NGSCO
MANAGING RISK Fleet Energy Efficiency Study
Page 39 of 151
Figure 8-2: Energy Efficiency Opportunity Assessment

DET NORSKE VERITAS
Report for ADNATCO-NGSCO
MANAGING RISK Fleet Energy Efficiency Study
Page 40 of 151
8.1 Voyage Performance
Currently within ADNATCO-NGSCO a lot of data is either reported or logged on the vessel
in various systems such as, Daily noon reports, Voyage reports, Engine performance reports
and Cargo and statements of facts.
However, many of the reports currently in separate formats, contain differing information and
are also sometimes in paper format.
Voyage Performance
Fleet planning, route and ship
allocation
Chartering/contracts
Voyage planning
Speed Management
Weather routing & sea current
Port/harbour operations
In general speed relates to the cube of the fuel consumption and thus a small reduction in
speed conveys substantial reduction in fuel and limited schedule impact. The ambition is to
utilise slack in the logistic system to the operator advantage and not necessarily to go with the
lowest speed but to go with optimal speed.
Voyage Performance - A measure of the ability to execute a given vessel operation in an as
profitable and energy efficient way as possible.

DET NORSKE VERITAS
Report for ADNATCO-NGSCO
MANAGING RISK Fleet Energy Efficiency Study
Page 41 of 151
8.1.1 Voyage planning and speed management
8.1.1.1 Observations
There is a standing instruction to keep on most
economical speed as much as possible unless otherwise
requested specifically from client and they are willing to
pay the difference. However, currently there is no
definition or policy for optimized speed (“eco speed”) for any of the vessels in
ADNATCO-NGSCO
On the LNG‟s typical voyage times are a 14-15 day window where the vessel must
make it in this time and adjust speed accordingly hence the voyage plan is worked out
based on the ETA taking into consideration weather, stoppages and crew changes and
is left up to the master to work out a detailed passage plan.
Anecdotal evidence suggest some Masters on the LNGs speed up really fast for 13
days and then slow right down in last 2 days to make the unloading time or stop over
in Singapore.
Masters are only required to report a delay on the ETA otherwise generally they speed
up to have some time in the pocket and then slows down a bit before the destination to
make sure they make the ETA.
Contract speed is specified as per sea trial
data and thus not considering the reduced
speed from fouling.
On the ADNATCO fleet, Commercial fix
the vessels with a projected fuel
consumption and then hand over to
operations to plan the voyage accordingly
without any follow up – it is then left up to
the Master to plan accordingly.
Operations only provide guidance to the
ship during a voyage with regard to course
and speed if there is a risk apparent such as Piracy.
Commercial have speed consumption curves available for some vessels but there
exists variations and it is unclear on whether parameters used are consistent and
correct.
Currently there is no tool to assess the relationship between speed and cost (OPEX,
commercial) implication.

DET NORSKE VERITAS
Report for ADNATCO-NGSCO
MANAGING RISK Fleet Energy Efficiency Study
Page 42 of 151
8.1.1.2 Potential solutions
ADNATCO-NGSCO should develop a decision support tool for establishing optimal speed
with respect to known and anticipated schedule that can be used for planning and continuous
optimization as the schedule changes. The tool can be used to provide a harmonized
understanding of speed‟s effect on cost profile and emissions within ADNATCO-NGSCOas
well as basis for communication with clients regarding effect of various speeds related to cost
and environmental footprint of the transportation purchased. Base data for that kind of tool
can come from systems already employed within ADNATCO-NSGCO. These include
weather routing and route planning tools, speed consumption curves and market indexes.
In the below illustration conceptual decision support tool is outlined (the below sample is
based on a tool developed by DNV for a multi segment ship owner). A similar tool can be
developed for ADNATCO-NGSCOby using presently known data such as:
Consumption figures per engine
Engine utilisation
Speed consumption curves
Fuel price
Index benchmark figures (eg. Baltic Index)
Contractual figures (day rate etc.)
Figure 8-3 Speed vs. Fuel Decision Support Tool - Source: Det Norske Veritas (DNV)

DET NORSKE VERITAS
Report for ADNATCO-NGSCO
MANAGING RISK Fleet Energy Efficiency Study
Page 43 of 151
Voyage planning and speed
management
By effectively utilizing a live
decision support tool for speed
management ADNATCO fleet
could realize 3% savings and
NGSCO LNG fleet 1%
8.1.1.3 Expected benefits
More accurately adapted speed will possibility have
significant impact on fuel consumption for all fleet
segments.
On voyages in laden below charter speed, other
operators have reduced speed to 14 knots and
potentially saved 8 % of fuel consumption with
negligible impact on schedule
Estimated that it is possible to optimize speed on
30% of voyages and impact up to 10% of fuel
consumption for all segments in the ADNATCO fleet, hence a saving of 3% in ballast
and laden legs.
Although the LNG fleet are on regular schedules and specific ETA‟s, there is still
significant room for improving structured and consistent speed planning and follow up
across the fleet where up to 1% saving can be realised.

DET NORSKE VERITAS
Report for ADNATCO-NGSCO
MANAGING RISK Fleet Energy Efficiency Study
Page 44 of 151
Chartering and contracts
Quantifying saving benefits
for this initiative is not
feasible for this study.
This is however an initiative
which can be a differentiator
for ADNATCO-NGSCO in
dialogue with its clients
8.1.2 Chartering and contracts
Based on DNV‟s experience, companies who have a firm
control over their vessel performance, use that to their
advantage in contracts.
8.1.2.1 Observations
The LNG‟s are on a long term contract and bound by an
Annual delivery program stipulating the amount of cargo to be transported
ADGAS is the LNG client and controls the amount of supply to their customer in
terms of quantity and frequency in a year
The tankers and dry fleet are on the spot market with a
mixture of Voyage and Time charter contracts.
Contracts are fixed based on seat trial speeds rather
than actual
The relationship between operations and commercial
is good however there is a perception that they are
working in silos
Commercial reply on the technical department to provide information on consumption
for each vessel to factor into the chartering and contracts
Little post contract analysis is carried out to ensure the assumptions made were correct
Commercial fix the vessel based on certain assumptions and information but then
actually execution and performance of the vessel is up to the master.
There is no follow up from chartering on post voyages
8.1.2.2 Potential solutions
Develop a common guideline between chartering, operations and technical
departments on the effects of speed management in terms of consumption and fuel
cost for the vessels to be used in charter contracts and operational considerations.
Focus on the speed in contracting with ambition to lower speed and consumption
figures if this is assessed to be a potential order winner.
Distribute critical speeds for each vessel and updated calculation tool to Operation
department and crew on board so all are on the same page
8.1.2.3 Expected benefits
Putting a positive spin on energy efficiency in contracting
stage to profile ADNATCO-NGSCO.
ADNATCO-NGSCObrand initiative on fuel
optimisation towards charters
Price Energy Efficiency into charter contracts to
benefit ADNATCO-NSGCO
Provide clients with alternate choices linked to
environmental footprint per voyage .

DET NORSKE VERITAS
Report for ADNATCO-NGSCO
MANAGING RISK Fleet Energy Efficiency Study
Page 45 of 151
Routing from NAPA PowerRouting from NAPA Power
Weather Routing
1% improved fuel
performance in the
ADNATCO-NGSCO
fleet
8.1.3 Weather Routing
Companies DNV have previously worked with have seen
positive effect of weather routing implementation in the area of
3-5% on sea passages.
Weather Routing is the practice of utilising weather forecasts to
determine optimal routes along sea passages. In general
shipping, a rule of thumb is that 20% of voyages are through adverse weather based on
analysis of weather data carried out by DNV, which requires more propulsion power than in
benign weather conditions. Avoiding these areas can lead to fuel savings on the voyage. A
caveat is however that the route allows for flexibility of choosing different courses.
Potential fuel savings by applying weather routing is achieved by:
Optimised utilisation of current and tide
Minimise sailing in unfavourable weather (wind and waves)
Speed management taking oceanographic data into account
Many suppliers offer solutions to optimise the route based on weather info. These vary from
complex on board systems all the way to simple subscription “on-demand” services.
8.1.3.1 Observations
Currently Weather Routing is not utilised in the ADNATCO-
NGSCOFleet in a systematic way.
8.1.3.2 Potential Solutions
Subscribe to “on-demand” weather routing service.
In order to fully benefit from weather routing ADNATCO-
NGSCO needs to further train the masters in using the system
for fuel saving purposes and create a greater awareness
Choice of route must be followed up by shore together with speed profiles
Cost of this service is estimated to be between 1000-3000 USD per voyage based on
discussions with potential vendors.
8.1.3.3 Expected Benefits
Companies DNV have previously worked with have seen positive
effect of weather routing in the area of 3-5% depending on trading
pattern but savings in the area of 1-2% seem realistic target based
on ADNATCO-NGSCO trading patterns. This is not applicable for
the short sea segments where the impact is deemed negligible.
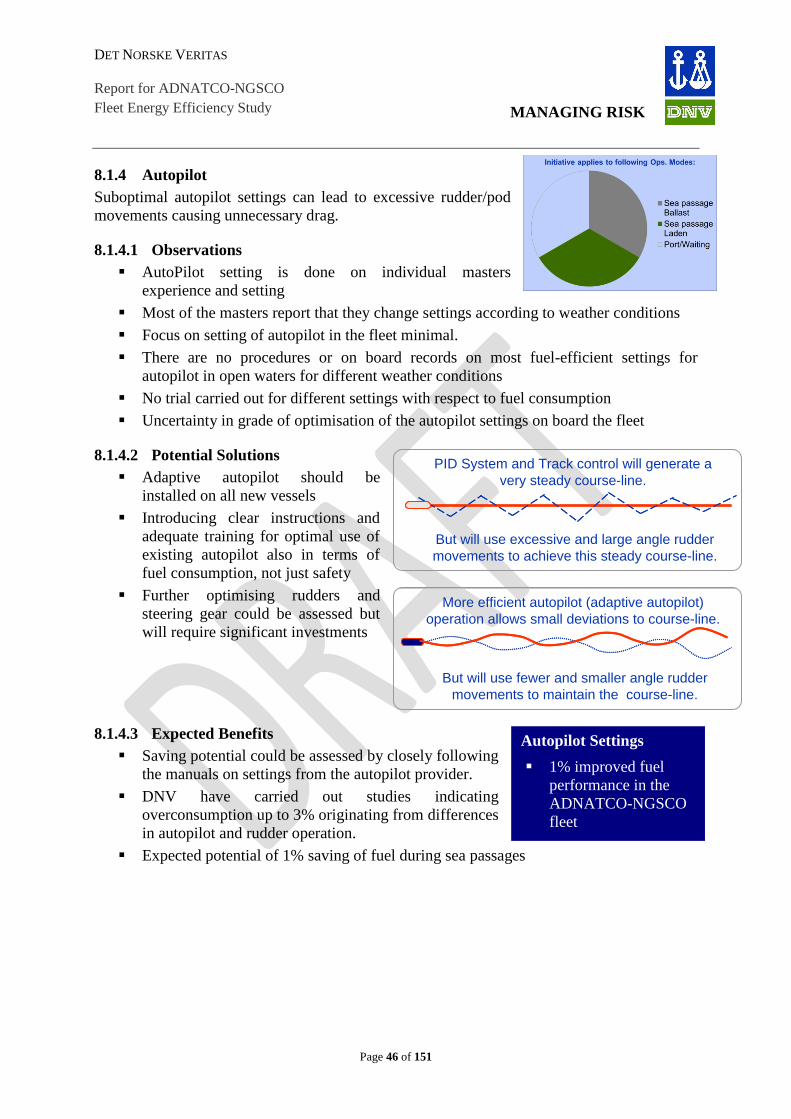
DET NORSKE VERITAS
Report for ADNATCO-NGSCO
MANAGING RISK Fleet Energy Efficiency Study
Page 46 of 151
But will use excessive and large angle rudder
movements to achieve this steady course-line.
PID System and Track control will generate a
very steady course-line.
But will use fewer and smaller angle rudder
movements to maintain the course-line.
More efficient autopilot (adaptive autopilot)
operation allows small deviations to course-line.
Autopilot Settings
1% improved fuel
performance in the
ADNATCO-NGSCO
fleet
8.1.4 Autopilot
Suboptimal autopilot settings can lead to excessive rudder/pod
movements causing unnecessary drag.
8.1.4.1 Observations
AutoPilot setting is done on individual masters
experience and setting
Most of the masters report that they change settings according to weather conditions
Focus on setting of autopilot in the fleet minimal.
There are no procedures or on board records on most fuel-efficient settings for
autopilot in open waters for different weather conditions
No trial carried out for different settings with respect to fuel consumption
Uncertainty in grade of optimisation of the autopilot settings on board the fleet
8.1.4.2 Potential Solutions
Adaptive autopilot should be
installed on all new vessels
Introducing clear instructions and
adequate training for optimal use of
existing autopilot also in terms of
fuel consumption, not just safety
Further optimising rudders and
steering gear could be assessed but
will require significant investments
8.1.4.3 Expected Benefits
Saving potential could be assessed by closely following
the manuals on settings from the autopilot provider.
DNV have carried out studies indicating
overconsumption up to 3% originating from differences
in autopilot and rudder operation.
Expected potential of 1% saving of fuel during sea passages

DET NORSKE VERITAS
Report for ADNATCO-NGSCO
MANAGING RISK Fleet Energy Efficiency Study
Page 47 of 151
8.1.5 Port operations
DNV‟s experience from past projects has shown that proper
preparation and organisation of port calls can reduce fuel
consumption and save valuable time.
For organisations where their vessels call to port on a regular
basis, adjusting their voyage speed to arrive at the right time
slot, streamlining their time in port by ensuring the right paper
work is in place and avoiding unnecessary use of equipment can enable them reduce fuel
consumption and time in port.
8.1.5.1 Observations
LNG terminals are always the same and have been
running the route for many years
In the ADNATCO fleet port cards are in use regularly
No KPI‟s on port time being used
8.1.5.2 Potential solutions
Investigate the use of commercial systems available in the market that provide real time
information and updates to further optimize arrival times and facilitate continuous
improvement
Investigate the use of a KPI on reducing time on port
8.1.5.3 Expected benefits
Due to the system in place already, it is not believed that many
benefits can be realised at this stage, however continuous
monitoring of port performance with the use of extensive data
available to ADNATCO-NGSCO will enable regular
benchmarking and thereby identification of any potential
improvements.
Port operations
It is not assessed that any
quantifiable savings can be
estimated related to
improved port operations.

DET NORSKE VERITAS
Report for ADNATCO-NGSCO
MANAGING RISK Fleet Energy Efficiency Study
Page 48 of 151
8.2 Ship performance
Ship performance relates to the activities where ADNATCO-NGSCO can optimise the vessel
efficiency by reducing a ship‟s drag in transit. Ship performance in the energy management
context deals with the energy that is consumed for creation of thrust from the propulsors and
the propulsion of hull through water. The aim of evaluating the ship performance is to
minimise the energy needed to make the ship move forward and to maximise the thrust
produced by the propulsors.
Ship Performance
Hull Condition
Propeller Condition
Trim and Draft Optimisation
Use of Autopilot
Sea Trials
Ship Performance - A measure of the ability to monitor and limit ship and equipment drag in
the water enabling energy efficient operations.

DET NORSKE VERITAS
Report for ADNATCO-NGSCO
MANAGING RISK Fleet Energy Efficiency Study
Page 49 of 151
8.2.1 Sea trials
Sea trials are conducted to ascertain the performance of the
vessel. Speed power trials are carried out to know the required
power for a given displacement and speed, and is a proposed
way to measure the propeller and hull condition on a regular
basis and measure the effects from a maintenance job.
8.2.1.1 Observations
ADNATCO-NGSCO does not employ any structured sea trials to assess the ship performance
as of today.
8.2.1.2 Possible solutions
A structured procedure on when to carry out speed trials and a standard template for speed
power trials will provide basis for decision support regarding the following:
Hull performance and maintenance will be done with the ambition of prolonging the
interval of first hull cleaning from dry-dock as far as possible within reasonable
performance limits not affecting energy consumption.
Planning and decision support regarding hull cleaning and propeller polishing
An established scheme for sea trials should give information on all key figures for speed
trials: speed, power input, weather, RPM, torque (if possible), and the report should include
guidance on how to conduct the test in order to calculate performance parameters in a
consistent manner.
Possible actions:
Speed trials once a year for LNG in ballast and laden for the same conditions ( time of
the year).
Measured mile tests for dry cargo and tanker fleet every six months once in laden and
ballast for the same conditions
8.2.1.3 Expected benefit
Enable to track, quantify and monitor energy saving
measures related to hull and propeller
Ensures focus of hull and propeller as large contributors to
resistance and fuel consumption
8.2.2 Propeller Polishing/Cleaning
Propeller roughness affects the total amount of energy consumed for propulsion of the vessel.
It is therefore an effective energy efficiency measure even for small relative improvements.
Propeller roughness affects the drag that each propeller blade experiences. A higher roughness
will increase the required energy to maintain the same rate of revolutions and thrust.
Propellers become rough during the operation and the roughness and possible marine fouling
of propellers has a large impact on energy consumption. Propeller polishing is generally
Sea Trials
It is not assessed that any
direct quantifiable savings
can be estimated related sea
trials

DET NORSKE VERITAS
Report for ADNATCO-NGSCO
MANAGING RISK Fleet Energy Efficiency Study
Page 50 of 151
executed by divers in the ports. For comparison of propeller roughness a standard Rubert
scale is used.
8.2.2.1 Observations
Propeller polishing is in general not done in service
Propeller polishing is generally done at every dry-dock for tankers and dry fleet
The LNG fleet is dry-docked once in 3 years and it is observed that the propellers are
coated
Propeller polishing is not done to a certain grade.
Effect of propeller polishing is not documented
Cannot measure any effects on hull fouling or propeller performance etc. (LNG Sr. Ops
Supt) i.e. no system in place to monitor effects
Based on available propeller data and empirical models, calculations have been carried out for
the Abu Dhabi III, Shah, Al Bazm, Al Samha and Al Dafrah showing the effect of increased
propeller roughness. Graphs showing the effect on daily fuel consumption for increased
roughness are given in
Figure 8-4.

DET NORSKE VERITAS
Report for ADNATCO-NGSCO
MANAGING RISK Fleet Energy Efficiency Study
Page 51 of 151
Figure 8-4 Effect of propeller blade roughness on daily fuel consumption for selected vessels
Based on previous studies and information gathered during interviews an average propeller
condition of D may be assumed for the dry cargo and tanker fleets. Many of the dry cargo and
tanker vessels are relatively new and the propellers are probably still in relatively good
condition. However, over time this will degrade if no action is taken.

DET NORSKE VERITAS
Report for ADNATCO-NGSCO
MANAGING RISK Fleet Energy Efficiency Study
Page 52 of 151
All vessels in the LNG fleet are reported to have coated propellers.
8.2.2.2 Possible solutions
In-water propeller polishing is a well-known measure to reduce fuel consumption, however
not utilized in ADNATCO-NGSCO.
Propeller polishing should ideally be done when propeller roughness is above a set criterion,
however this may prove to be difficult to monitor. Installation of torque-meter is a way of
measuring the propeller, and the propeller roughness KPI = Torque / RPM may then be
continuously monitored.
The following actions are suggested for optimizing the propeller performance for the
ADNATCO dry cargo and tanker fleets:
In-water propeller polishing at fixed intervals of 6 months is recommended practice
Polish to grade A or B on Rubert scale to put pressure on service provider and to be sure
of effect
The effect of propeller polishing may be validated by sea trials.
8.2.2.3 Expected benefit
The relative savings due to propeller roughness may be
applied to all sailing conditions for the dry cargo and tanker
vessels. Continuous follow up of propeller condition is
expected to enable ADNATCO to reduce the average
roughness with 2-3 steps on the Rupert scale for the two fleets.
The LNG vessels have coated propellers and the effect of
regular propeller polishing instead of coating the propellers
has not been assessed.
Propeller Polishing
It is anticipated that
regular polishing of
the propellers on
ADNATCO fleet will
save 2.5%

DET NORSKE VERITAS
Report for ADNATCO-NGSCO
MANAGING RISK Fleet Energy Efficiency Study
Page 53 of 151
8.2.3 Hull condition
A new ship will have smooth hull surface and lesser drag. As the
years of operation increases, the hull becomes rough and due to
marine fouling the drag through water will increase. Hull
cleaning is generally done during dry-docking, but hulls may
also be cleaned by e.g. ROVs or divers in between dry-docks.
Hull cleaning with brushes should be avoided as this is may
damage the coating. Use of antifouling paint may also improve the hull performance.
The ship resistance is dependent on the Froude number which is a non-dimensional ratio of
the vessel speed and length. Figure 8-5 presents the typical resistance components for a
displacement vessel, and the portion of contribution to the total resistance for a low speed and
high speed vessel
As seen, for slow-going vessels the frictional resistance is by far the largest contributor to the
total resistance, while for faster-going vessels the wave making resistance will increase and
hence represent a larger portion of the total resistance.
In order to minimize the viscous resistance and optimize the performance, it is important the
keep the hull as smooth as possible. If heavy fouling is observed, cleaning the hull will be an
important element in reducing the resistance and saving fuel.
Froude numbers of the case study ships for the ADNATCO fleet are given below.
Abu Dhabi III - Tanker @ 13,5 kn Froude value 0,14
Shah – Bulk @ 13,5 kn Froude value 0,17
Al Samha – Chemical @ 12,5 kn Froude value 0,18
Al Bazm II – Container @ 16 kn Froude value 0,22
Al Dhfrah - Ro/Ro @ 12 kn Froude value 0,19
Al Hamra - LNG Carrier @ 19,5kn Froude value 0,19
Reference values:
Low speed - VLCC @ 14,5 kn Froude value 0,13
High speed - Container (7100 TEU) @ 22,5 kn Froude value 0,21
The ADNATCO-NGSCO vessels hence range from slow to high speed.
High Speed : Wave Making Resistance accounts for ~30% of the total resistance
Slow speed : Frictional (viscous) resistance accounts for ~80% of the total resistance

DET NORSKE VERITAS
Report for ADNATCO-NGSCO
MANAGING RISK Fleet Energy Efficiency Study
Page 54 of 151
Figure 8-5 Resistance components for a displacement vessel
8.2.3.1 Observations
8.2.3.1.1 Hull Coating:
Intersleek 700 antifouling paint is used for the LNG vessels.
The new Intersleek 900, which is claimed by the manufacturer to be self cleaning at 1-2
knots, is supposed to be applied on one vessel and benchmarked towards the other
vessels with Intersleek 700, in order to monitor the performance
In general, for the tanker and dry cargo fleets there is currently now direct strategy on
the choice of coating. Many of the vessels are rather new, with coating as applied from
the yard
LNG Vessels - Look at coating on ships but can not monitor effects of paints (Sr Ops
Supt)

DET NORSKE VERITAS
Report for ADNATCO-NGSCO
MANAGING RISK Fleet Energy Efficiency Study
Page 55 of 151
8.2.3.1.2 Hull Cleaning:
Hull cleaning is in general carried out in dry-dock. There is no common practice within
ADNATCO to carry out hull cleaning between dry-docks. The LNG vessels are in
general dry-docked every 3rd year while the dry cargo and tank vessels are dry-docked
every 5th year except the coastal vessels doing intermediate dry-docking.
Masters will observe fouling, but have no clear instructions on acceptance criteria or
actions to be taken.
Increased fouling shall be detected by operations after observations of reduced speed,
this triggering visual inspections. No clear instructions or acceptance criteria exists.
Marine growth in water belt is also observed for the Intersleek coated LNG vessels, but
the frequent dry-docking, short time in port and the expensive foul release coating
makes hull cleaning a refusing option for the superintendents. This coating is also
known to take easier damage from cleaning than other coatings.
The effect of hull roughness for selected vessels is shown in Figure 8-6 to Figure 8-8 below.
The graphs will give an indication of increase in power in case the vessel‟s hull roughness is
increased.
Figure 8-6 Estimated increase in fuel consumption from increasing hull roughness for the Al Hamra
Highly Fouled
Lightly Fouled
New Hull

DET NORSKE VERITAS
Report for ADNATCO-NGSCO
MANAGING RISK Fleet Energy Efficiency Study
Page 56 of 151
Figure 8-7 Estimated increase in fuel consumption from increasing hull roughness for the Abu Dhabi III
Figure 8-8 Estimated increase in fuel consumption from increasing hull roughness for the Shah
Highly Fouled
Lightly Fouled
New Hull
Highly Fouled
Lightly Fouled
New Hull

DET NORSKE VERITAS
Report for ADNATCO-NGSCO
MANAGING RISK Fleet Energy Efficiency Study
Page 57 of 151
8.2.3.2 Possible solutions
8.2.3.3 Hull Coating:
Clear communication of products to be used and responsibility for selection of
antifouling, also between the fleets. Intersleek paints are applied to the LNG fleet only
and it is recommended to assess whether to apply this to the other fleets as well.
Testing process for evaluation of new products to give quantifiable answers of the
performance of antifouling products
Implement policy on dry-dock hull pre-treatment depending on ship age; e.g. complete
side shell grit blasting at 15 year docking
8.2.3.3.1 Hull Cleaning:
Establish procedures and criteria for when hull cleaning should be implemented.
Develop a matrix of cost including where and when hull cleaning is possible and what
systems are available
Hull cleaning should be conducted before longer transits and after longer periods at
anchorage / idling
Determine effect of hull cleaning by speed trials
Strive to use brushless systems (e.g. ROVs) in order to minimize damage on coating.
Figure 8-9 Clean ADNATCO hull in dry dock after washing

DET NORSKE VERITAS
Report for ADNATCO-NGSCO
MANAGING RISK Fleet Energy Efficiency Study
Page 58 of 151
8.2.3.4 Expected benefit
Better control of the hull roughness and earlier detection of
increased fouling, along with established procedures and
criteria on coating selection will improve the hull condition
performance for the ANDATCO fleet
For the LNG fleet a certain regime is already established, and
combined with the frequent interval between dry-docking and
the applied foul release coating, direct measures such as
regular hull cleaning has not been proposed. However it is
important to keep the focus on hull condition, and
establishing clear procedures and decision criteria also for
this fleet. Hence a small fuel saving fraction has been proposed, based on future
development of improved coatings, and established coating selection criteria and testing
routines within ADNATCO.
Hull condition
It is anticipated that
Hull roughness
control on the
ADNATCO fleet will
save 2%
LNG coating
improvements can
save 0.5%

DET NORSKE VERITAS
Report for ADNATCO-NGSCO
MANAGING RISK Fleet Energy Efficiency Study
Page 59 of 151
8.2.4 Draft Optimization
Viscous resistance accounts for the largest portion of the total
resistance for a typical merchant vessel. In ballast condition the
deadweight is ballast water and consumables such as fuel oil
and fresh water. By minimizing the deadweight on ballast legs
while still keeping the vessel within safety and operational
limits will lead to a possible reduction of the viscous resistance
and fuel consumption.
8.2.4.1 Observations
Approximately 50% of the sailing time for the LNG fleet, 40% for the tanker fleet and
30% for the dry cargo fleet is executed in ballast condition
Limited attention is being paid to the amount of ballast water / draft being carried on the
ballast legs
Viscous resistance accounts for ~80% of the total resistance for the low speed (Froude
number) vessels and ~65% for the higher speed vessels, and is proportional to the
wetted area.
Figure 8-10 below presents the estimated reduction in fuel consumption when comparing the
completed ballast leg with the highest draft to the one with the lowest draft for four selected
vessels, based on the received voyage reports. This comparison is not directly applicable to
fuel saving, as the ballast leg with highest draft here possibly is in harsh weather where a
large draft is imperative. However it gives an indication on the fuel saving possibilities based
on a reduction in draft.
Note that, as the Abu Dhabi III and Shah are rather new vessels with less than a year sailing
time, a larger difference in completed ballast leg drafts, hence larger estimated difference in
fuel consumption may be found for older vessels across the tanker and dry cargo fleet.
Figure 8-10 Reduction in fuel consumption from variations in draft for selected vessels

DET NORSKE VERITAS
Report for ADNATCO-NGSCO
MANAGING RISK Fleet Energy Efficiency Study
Page 60 of 151
8.2.4.2 Possible solutions
Identification of minimum possible draft for all vessel classes by use of loading
manuals / loading computers and hull models, considering propeller immersion and safe
operations.
Development of vessel specific guideline for minimization of draft
Effects may be estimated as proportional to the change in wetted area and therefore
calculated by using known empirical methods for viscous resistance
8.2.4.3 Expected benefit
The indicated saving potential for the three fleets in ballast are
provided for the combined effect of draft and trim optimization.
8.2.5 Trim optimisation
The water flow around a ship affects the pressure field along the hull and thereby the ship‟s
resistance. The wetted surface area, wave excitation and vortex
shedding can be minimized by trimming the vessel correctly.
The potential for reducing the fuel consumption by optimizing
the trim will be largest in off design sailing conditions as
ballast and partly loaded. A CFD study can be done covering
all relevant draft and speed conditions to get an optimum trim. A generic trim optimization
table from a CFD study of a vessel is shown in Figure 8-11 below.
Speed
Trim 1,0 0,5 0,0 -0,5 -1,0 1,0 0,5 0,0 -0,5 -1,0 1,0 0,5 0,0 -0,5 -1,0
9.0
0 -
9.7
0m
Avoid Avoid Fair Good Optimal Good Good Good Good Optimal Good Optimal Good Good Fair
8.3
5 -
9.0
0m
Avoid Avoid Avoid Good Optimal Avoid Avoid Avoid Fair Optimal Good Good Optimal Good Good
7.7
5 -
8.3
5m
Avoid Avoid Avoid Fair Optimal Avoid Fair Avoid Good Optimal Avoid Fair Good Optimal Good
13,0-15,5 knots 15,5-18,5 knots 18,5-21 knots
Dra
ft
Figure 8-11 : Generic results from a CFD trim optimization study
Example Example
Draft optimization
It is anticipated that
draft optimization can
achieve 2% on
ADNATCO fleet and
0.5% on NGSCO

DET NORSKE VERITAS
Report for ADNATCO-NGSCO
MANAGING RISK Fleet Energy Efficiency Study
Page 61 of 151
8.2.5.1 Observations
There are no ship specific guidelines on what trim one should try to obtain during
ballast and part load conditions in order to reduce fuel consumption across the
ADNATCO fleets
LNG vessels are sailing on even keel in laden and ballast when entering and leaving
ports, but no specific guidelines exist for the voyage.
Trims are dictated by Master‟s experience
8.2.5.2 Possible solutions
The optimal trim of a vessel depends on the hull lines, draft and speed. Studies of the ship
ballast tank configuration and means of varying the trim will identify the possible trim range.
Vessels with a larger portion of wave making resistance, such as the LNG fleet, will have a
larger fuel saving potential within trim optimization.
The optimal trim settings may be found for each hull by model tests or CFD calculations and
determined for a range of speeds and drafts. The trim will be set for standstill draft settings,
but calculations will account for squat effects.
Closer follow-up of the vessels and choice of trim will be important for implementation of the
measure. Defined KPI‟s for the number of voyages/days with optimum trim is a proposed
measure.
Based on a trim optimization study, trim tables and guidelines for the ADNATCO-NGSCO
fleet may be established
8.2.5.3 Expected benefit
The indicated saving potential for the three fleets in ballast are provided
for the combined effect of draft and trim optimization.
Trim optimisation
It is anticipated that
optimizing trim on
the ADNATCO fleet
will save 3%
Optimising on LNG
will save 4%

DET NORSKE VERITAS
Report for ADNATCO-NGSCO
MANAGING RISK Fleet Energy Efficiency Study
Page 62 of 151
8.2.6 Energy efficiency devices
Energy efficiency devices are used on existing ships to
improve the overall efficiency of a vessel by improving the
propulsion efficiency. The propulsion is a result of the
interaction between the hull, the propeller and the rudder.
The measures are in general divided into three groups:
Pre propeller measures: Improving the inflow to the propeller.
Propeller measures: Improving the efficiency of the propeller itself.
Post propeller measure: Improving the flow behind the propeller, in connection with the
rudder.
Some of these fuel saving measures are originally designed to minimize the danger of
propeller induced vibrations (pressure pulses), but do also have a favourable effect on the
propulsion efficiency.
8.2.6.1 Observation
No efficiency improvement devices are fitted to any of the ADNATCO-NGSCO vessels
8.2.6.2 Possible solutions
Installing energy efficiency devices on vessels have been reported to give satisfying fuel
savings. If planning to install such devices on vessels, it is important to keep the following in
mind:
All proposed modifications need detailed analysis of effects on ship design and require
in many cases CFD analysis or similar.
It needs to be assessed vessel design by vessel design on what solutions are fit for
purpose and will provide the desired savings.
It is suggested to establish an overview of possible solutions and pros and cons for each
solution. An overall example of effect of different devices on different efficiency
factors are outlined in the illustration.

DET NORSKE VERITAS
Report for ADNATCO-NGSCO
MANAGING RISK Fleet Energy Efficiency Study
Page 63 of 151
Figure 8-12 Effect on efficiency factors from different energy efficiency devices
8.2.6.3 Expected benefits
Generic savings for installation are not possible to establish, as
there are so many different factors that needs to be taken into
account. DNV has worked with companies that have been able to
prove savings up to 5% and companies where no savings are
possible to demonstrate.
Energy Efficient
Devices
It is assessed that no
quantifiable savings
can be estimated
without further study.

DET NORSKE VERITAS
Report for ADNATCO-NGSCO
MANAGING RISK Fleet Energy Efficiency Study
Page 64 of 151
8.3 Primary energy consumers
Energy Consumer performance relates to the activities where ADNATCO-NGSCO can
optimise the utilisation of Primary and Secondary consumers such as the engines and
electrical consumers on board the vessels.
Primary Energy Consumers
Main engine performance
Auxiliary engine performance
Main engine performance
Boiler performance
LNG propulsion system performance
ADNATCO-NGSCO is operating a fleet of LNG (steam propulsion),RORO, Container ,Oil
tanker ,Chemical Tanker and bulk vessels that are all equipped with diesel propulsion varying
from 2550 kw to 14280 kw. The auxiliary engines in the fleet are all four stroke engines
varying from 480kw to 850 kw.
In order to provide a qualified opinion of potential improvement opportunities related to
energy efficiency for the ADNATCO-NGSCO vessels, DNV has made performance analysis
of engines and boilers and their utilization of the following sample vessels:
LNG- Al Hamra & Shahamah ( Steam Plant Study)
Chemical tanker- Al Samha
Bulker- Shah
Oil tanker- Abu Dhabi III
Container- Al Bazm
RO-RO- Al Dhafrah
DNV had an in-depth look at the operation of the diesel engines with regards to diesel engine
efficiency and utilization for conventional vessels, boiler and turbine plant efficiency for
steam propulsion vessels, auxiliary boilers and economizers performance and power
management optimization.
Primary energy consumer performance - A measure of the ability to monitor and ensure
optimal performance from an energy efficiency perspective of primary consumers (i.e. main
engine, axillary engine and boilers) on the vessel

DET NORSKE VERITAS
Report for ADNATCO-NGSCO
MANAGING RISK Fleet Energy Efficiency Study
Page 65 of 151
Viscosity control
Improved fuel oil
performance by up to
1% for the NGSCO
fleet.
8.3.1 LNG Steam Plant Main Boiler
Viscosity and fuel pressure is instrumental in order to achieve
efficient combustion.
8.3.1.1 Observations
Fuel pressures in operation found within norms.
Viscosity readings in some reports higher than design norms (18 cSt at burner inlet).
The graph illustrates boiler fuel oil viscosity readings (Jan-2011 to March 2012 for
vessel Al Hamra. The reason for deviations could be that the viscosity meter is not
working accordingly. However it must
be assumed that the readings are correct.
In addition are viscosity readings
missing in the latest performance
reports.
The same analysis carried out for vessel
Shahama shows viscosity within the
desired interval showing good
performance for this vessel.
8.3.1.2 Possible solution
Ensure optimum combustion and reduced fouling by continuous viscosity control
Regular maintenance of viscometer and heater controls as per Maker‟s norms to
ensure that the monitoring equipment is providing accurate readings.
In case of inoperative viscometer, maintaining correct FO temperature at burner inlet
depending on density of fuel being used.
8.3.1.3 Expected benefits
Correct viscosity control ensures optimum combustion,
reduced fouling in exhaust passages, improved fuel
consumption values.
Good viscosity control ensures optimum combustion and
based on reported values an added consumption of 1% can
be estimated.
Figure 8-13 : Boiler Fuel oil viscosity reading (Jan-2011 to Mar
2012) for vessel Al Hamra

DET NORSKE VERITAS
Report for ADNATCO-NGSCO
MANAGING RISK Fleet Energy Efficiency Study
Page 66 of 151
Air heater performance
Improved boiler
performance by up to 0,5%
for the NGSCO fleet.
8.3.2 LNG Main Boiler Combustion Air System Air Heaters
Air heater functionality is instrumental for efficient combustion.
8.3.2.1 Observations
Parameters of Air Heaters within design norms. The graph illustrates boiler air heater
trend (Jan-2011 to March 2012).
8.3.2.2 Possible solutions
Routine check of steam traps at Steam Air
Heater (SAH) drains to ensure optimum
operation. Use of Thermography
recommended.
8.3.2.3 Expected benefits
Good heat transfer and reduction in energy loss.
Approximate fuel savings of 0.5 %.
8.3.3 LNG Combustion Air System Forced Draught Fans and
furnace
Furnace and windbox pressure within norms ensures correct
air/fuel ration and hence efficient combustion capabilities.
Figure 8-14 : Boiler air heater trend (Jan-2011 to Mar-2012)

DET NORSKE VERITAS
Report for ADNATCO-NGSCO
MANAGING RISK Fleet Energy Efficiency Study
Page 67 of 151
8.3.3.1 Observations
Furnace and Windbox pressures
higher in earlier reports, more in
conformance with design values in
later reports for Al Hamra, most
probably explained with system
cleaning during dry docking.
For Shahama furnace and Windbox
pressures show a rising trend in
performance reports as shown in
Figure 8-16. Consequently, the
Forced Draught fan outlet pressures
are also higher than design values.
The recorded differential pressures at economizers are lower than can be expected.(
operational values 60-90 mm WG)
Voyage summaries show less frequency of soot blowing than should be evidenced with the
operational situation.
Causes for deviation might relate to:
Choked sensing lines of furnace and windbox transmitters.
Fouling in exhaust passages.
Defective controls in Automatic Combustion Control (ACC) of boilers.
Air loss between FD Fan discharge and windbox.
Economiser differential pr. Manometers malfunction.
8.3.3.2 Possible solutions
Routine blowing through of transmitter sensing lines to prevent fouling.
Soot blowing operations should be carried out at least every alternate day at sea when
operating in FO and Dual modes.
Proper operation of soot blowers should be checked as per routine given by Makers.
Figure 8-15: Furnace and Windbox pressure – Al Hamra
Figure 8-16 : Furnace and Windbox pressure - Shahama

DET NORSKE VERITAS
Report for ADNATCO-NGSCO
MANAGING RISK Fleet Energy Efficiency Study
Page 68 of 151
Combustion air
system
Improved boiler
performance by up
to 1% for the
NGSCO fleet.
8.3.3.3 Expected Benefits
Improved windbox and furnace operation will convey improved heat
transfer and reduction in energy losses. Improvement in the efficiency
of combustion by maintaining correct air-fuel ratio will result in
significant reduction of fuel consumption from existing values.
Reduced fouling will contribute to better heat transfer improving
boiler efficiency to near design values. This will convey approximate
fuel savings of up to 1%.
8.3.4 LNG Flue Gas Oxygen Content /Smoke Indicators
Proper trending and overview of O2 content and smoke in
exhaust gases are good indicators of boiler performance and
air/fuel mix.
8.3.4.1 Observations
O2 content readings of flue gas missing in 8
out of 11 reports trended for Al Hamra
indicating non-operational O2 Analyzers. For
Shahama O2 content readings of flue gas
within expected design norms.
Smoke indicator readings in all reports show readings, indicative of improper combustion and
presence of visible smoke at exhaust. Smoke indicator readings point to combustion condition
of Boiler 2 being worse than Boiler 1. (Expected readings of Smoke indicators at steady loads
is 0). Boiler smoke indicator trend for Al Hamra is presented in the graph (Jan-2011 to March
2012)
8.3.4.2 Possible solutions
Smoke in boiler exhaust should be momentary, only during transient load changes.
O2 Analyzers to be maintained in good working condition and calibration checks
carried out as per Makers norms.
O2 content in flue gas to be monitored at all times and kept within design values of
excess air ( 7% at lower loads and 5% at higher loads)
O2 Trim control to be carried out in laden passages to eliminate excess air supplied by
ACC due to presence of N2 present in Boil-Off Gas (BOG) (start of laden voyage).
Figure 8-17 : O2 content readings of flue gas - Shahama

DET NORSKE VERITAS
Report for ADNATCO-NGSCO
MANAGING RISK Fleet Energy Efficiency Study
Page 69 of 151
Exhaust system
Improved boiler
performance by up to 1%
for the NGSCO fleet.
Use of excess O2 curves provided by Boiler Makers to be utilized for O2 trimming. ( a
sample curve provided).Correct operation of Gas Chromatograph to be ensured,
calibrations to be done regularly.
Figure 8-18 : Sample curve of Boiler Load vs O2 content in Flue Gas
8.3.4.3 Expected benefits
Optimum air-fuel ratio ensures the best combustion
resulting in fuel savings from present consumption
levels. Approximate fuel savings of 1%.
8.3.5 LNG Main Turbine-Performance
Efficient turbine performance is naturally instrumental for a
fuel efficient propulsion system for the LNG fleet.
8.3.5.1 Observations:
Turbine performance parameters
found within design norms and
recorded pressures indicate good
turbine condition for analyzed
vessels. Main turbine parameter
trending (Jan-2011 to March 2012)
for Al Hamra is presented in the
graphs.
Figure 8-19 : Main turbine parameter trending (Jan-2011 to Mar-
2012) – Al Hamra

DET NORSKE VERITAS
Report for ADNATCO-NGSCO
MANAGING RISK Fleet Energy Efficiency Study
Page 70 of 151
Turbine performance
No anticipated savings
All performance parameters recorded
in reports. For Shahama HP 1st stage
temperatures are erroneously recorded
in last two analyzed reports.
8.3.5.2 Possible solution
Operation of turbine in extraction mode as much as operational circumstances permits
to obtain optimal efficiency.
8.3.5.3 Potential benefits
No expected benefits identified
Figure 8-20 : Exhaust Steam pressure Trend

DET NORSKE VERITAS
Report for ADNATCO-NGSCO
MANAGING RISK Fleet Energy Efficiency Study
Page 71 of 151
Condenser performance
Improved performance by
up to 2% for the NGSCO
fleet.
8.3.6 LNG Main Condenser-Performance
The main condenser is the largest heat sink in the system and
performance has significant impact on energy performance.
8.3.6.1 Observations
For Al Hamra:
Condenser vacuum in latest performance
report of 19/03/2012 is -0.921 bar at SW
temp. 30 deg C. Design value is -0.9492
bar at 27 deg C. The readings are
illustrated in the graph, this indicates
potential leaks and air ingress in system.
Main condenser SW Diff. pressure is
recorded only in one performance report
of 19/03/2012 at 0.921 bar. Design value
is 0.2 bar.
Trend shows deterioration in main condenser vacuum.
The vacuum values do not conform with design values in latest reports.
Difference in SW temp between inlet and outlet is higher than the design value of 4 deg C.
Fouling of tubes, SW passages as evidenced by very high differential pressure.
For Shahama the parameters are within design norms.
8.3.6.2 Potential solutions
Mercury Manometer, if fitted, to be maintained in good working order.
Backwash/cleaning of main condenser at regular intervals. Main condenser to be
cleaned at first available opportunity in view of excessive differential pressure.
Check for leaks causing air ingress to main condenser.
Maintain undercooling between steam and condensate in main condenser to within
3 deg C.
Maintain at least 710-720 mm Hg vacuum at main condenser.
8.3.6.3 Expected Benefits
Improvement in vacuum will result in substantial fuel
savings, since a higher vacuum results in incomplete
extraction of work and is an energy loss. Approximate
Figure 8-21 : Condenser vacuum readings – Al Hamra

DET NORSKE VERITAS
Report for ADNATCO-NGSCO
MANAGING RISK Fleet Energy Efficiency Study
Page 72 of 151
Condenser feed system
performance
Improved performance by
up to 1% for the NGSCO
fleet.
fuel savings of 2.0%.
8.3.7 LNG Condensate Feed System
Correct operation of the condensate feed system ensures efficient
combustion performance.
8.3.7.1 Observations
Feed heater and deaerator feed outlet
temp and pressures are within norms
indicating good condition for analyzed
vessels.
Make-up water consumption to boilers
high for Al Hamra related to potentially
known problem as indicated in the graph
(green line indicate optimal
performance, yellow line tolerance level based on vessel age).
8.3.7.2 Possible solutions
Maintain closed feed conditions.
Check and rectify leakages.
Steam trap condition to be checked by measurement of temp downstream with optical
pyrometer/thermography and overhauled as required. Work to be implemented in PMS
system as preventive maintenance routine.
Routine check of control valves to ascertain leaks past closed valves. Eg: Dump
Control valve.
8.3.7.3 Expected Benefits
Reduction in fuel consumption estimated to 1% as a
minimum
Figure 8-22 : Make-up water consumption to boilers – Al Hamra

DET NORSKE VERITAS
Report for ADNATCO-NGSCO
MANAGING RISK Fleet Energy Efficiency Study
Page 73 of 151
LNG Auxiliary engine
utilisation
Improved performance by
up to 20% for the NGSCO
fleet in port operation.
8.3.8 LNG auxiliary engine utilisation
Electrical power in LNG vessels can be produced from either
Turbo Alternators or diesel auxiliary engines. In order to
optimise energy efficiency it is recommend to use turbo
alternators to largest possible extent.
8.3.8.1 Observations
The chief engineer can take his own initiatives on running turbo-alternators and diesel
generators.
Seemingly often two turbo alternators are run in parallel even when load is low. In
some cases the axillary diesel engines are being run in parallel with turbo alternators
running at very low loads.
This regime conveys overconsumption of energy.
8.3.8.2 Possible solutions
Provide guidelines and follow up on turbo alternator and diesel auxiliary engine utilisation to
ensure single use of one turbo alternator and limit diesel auxiliary engine utilisation as much
as operational circumstances permit.
8.3.8.3 Expected benefits
Based on anecdotal evidence their regime conveys an over
consumption of 12 tonnes per day. This could yield a saving of
up to 20% whilst in port manoeuvring.

DET NORSKE VERITAS
Report for ADNATCO-NGSCO
MANAGING RISK Fleet Energy Efficiency Study
Page 74 of 151
8.3.9 Main and Auxiliary Engine Performance Management
A selection of 5 vessels were taken from the ADNATCO fleet to
provide an overview of the general performance of differing age
and type of vessels and the approach to capturing, monitoring and
following up of performance and the benefits thereto.
8.3.9.1 Observations
8.3.9.1.1 Tanker fleet
The below illustrates analysis of engine performance for Abu Dhabi III – Tanker.
Abudabhi-III
Yellow Red ME AE 1 AE 2 AE 3
Pmax 5 15 0,7 % 0,6 % 0,6 % 0,7 %
FPI 5 15 1,6 % 2,7 % 2,6 % 2,7 %
Texh 7 15 4,0 % 3,1 % 3,6 % 3,7 %
Yellow Red
Pmax 5 15 4,2 % -19,6 % -21,5 % -15,0 %
Pmax 5 15 4,8 % -19,1 % -20,7 % -14,3 %
Texh 10 20 -0,2 % 6,5 % 10,7 % 6,9 %
Yellow Red
SFOC 182,0
SFOC 3 10 1,6 % Condition acceptable
Keep attention
Investigate
Maximum combustion pressure
Exhaust gas temperature
Fuel Pump Indicator
Engine balance (compared to mean)
Specif ic fuel oil consumption - value [g/kWh]
Engine efficiency (compared to sea trial/shop test)
Fuel oil consumption
Performance results
Warning levels
29/1/2012
FO consumption increase compared to reference [g/kWh]
Results
Max corrected press. drop referred to engine reference
Corrected exhaust gas temp. increase compared to engine ref.
Average corrected press. drop referred to engine reference
Diesel Engine assessmentEngines input
Figure 8-23Analysis of engine performance for Abu Dhabi III – Tanker
It was expected that a new vessel would demonstrate good overall performance and this
serves to illustrate that the current situation is good but will not continue and hence, even with
new vessels it is important to continuously monitor performance to ensure optimal
performance is maintained and any reduction can be spotted and dealt with as early as
possible.
The diesel engines of the ship are in general performing well. One should however keep an
eye on the exhaust gas temperatures of AE 2 as these are above what is considered acceptable.
The condition is not critical, but should be adjusted and/ or kept under surveillance.
8.3.9.1.1.1 Main engine specific fuel oil consumption SFOC
The specific SFOC shows an increase of 2.2% from shop trial data. This is as expected for a
“new” ship as shop trials are performed under optimal conditions. However as the ship ages
there will be a tendency for degradation of SFOC and if not monitored and followed up
regularly, this development will not be kept under control and lead to reduced fuel efficiency.

DET NORSKE VERITAS
Report for ADNATCO-NGSCO
MANAGING RISK Fleet Energy Efficiency Study
Page 75 of 151
8.3.9.1.1.2 Main Engine Balance
The cylinder balance is good and well within limits of a good performing engine.
Main engine cylinder balance overview
(% difference from test average values)
-20,00 %
-15,00 %
-10,00 %
-5,00 %
0,00 %
5,00 %
10,00 %
15,00 %
20,00 %
1 2 3 4 5 6
% d
iffe
ren
ce
fro
m m
ea
n
Cylinder #
Balance Pmax
-20,00 %
-15,00 %
-10,00 %
-5,00 %
0,00 %
5,00 %
10,00 %
15,00 %
20,00 %
1 2 3 4 5 6
% d
iffe
ren
ce
fro
m m
ea
n
Cylinder #
Balance FPI
-15,00 %
-10,00 %
-5,00 %
0,00 %
5,00 %
10,00 %
15,00 %
1 2 3 4 5 6
% d
iffe
ren
ce
fro
m m
ea
n
Cylinder #
Balance Texh
Close
Figure 8-26 : Main engine cylinder balance overview (Pmax, FPI and Texh)
Figure 8-24 : Main Engine SFOC comparing with ship trials Figure 8-25 : Main Engine SFOC at sea (Aug 2011 – Mar 2012)

DET NORSKE VERITAS
Report for ADNATCO-NGSCO
MANAGING RISK Fleet Energy Efficiency Study
Page 76 of 151
8.3.9.1.1.3 Main Engine Performance
The overall engine performance is good. There is a slight drop noted on the scavenge air
pressure which can be monitored in order to prevent further decrease in the pressure. Pmax is
slightly lower than for shop trials, but presently insignificant.
Figure 8-27 : Main engine performance
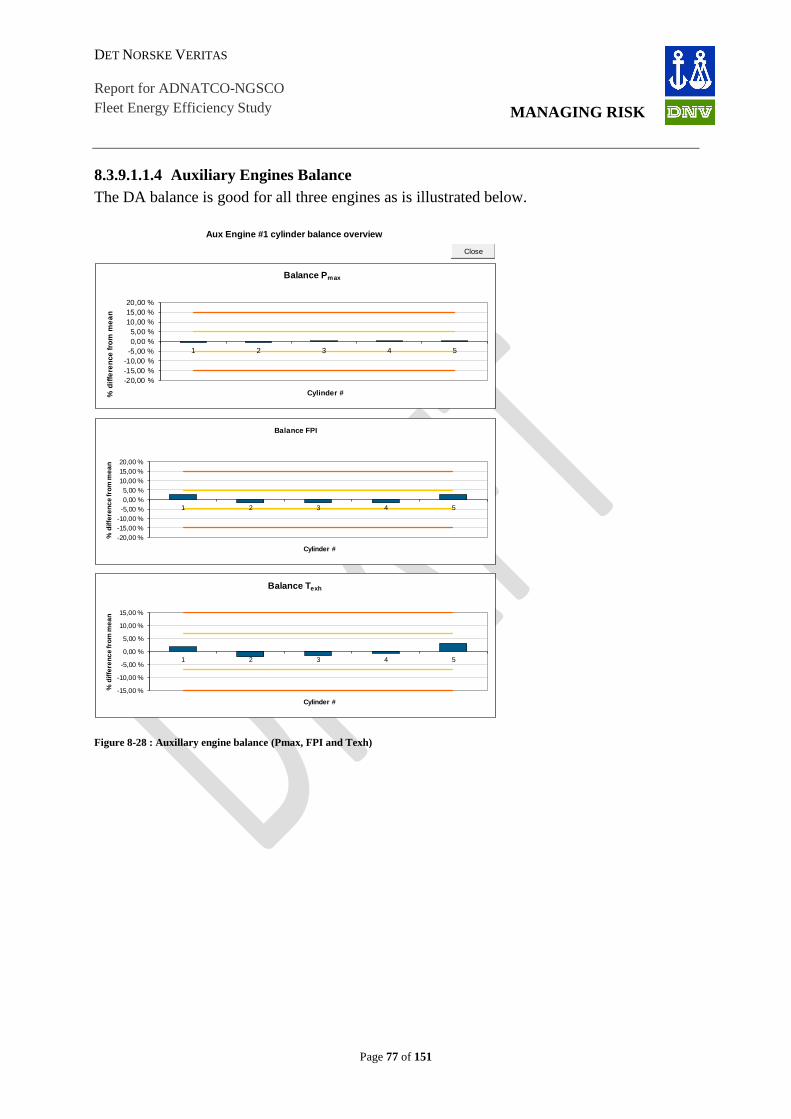
DET NORSKE VERITAS
Report for ADNATCO-NGSCO
MANAGING RISK Fleet Energy Efficiency Study
Page 77 of 151
8.3.9.1.1.4 Auxiliary Engines Balance
The DA balance is good for all three engines as is illustrated below.
Aux Engine #1 cylinder balance overview
-20,00 %
-15,00 %
-10,00 %
-5,00 %
0,00 %
5,00 %
10,00 %
15,00 %
20,00 %
1 2 3 4 5
% d
iffe
ren
ce
fro
m m
ea
n
Cylinder #
Balance Pmax
-20,00 %
-15,00 %
-10,00 %
-5,00 %
0,00 %
5,00 %
10,00 %
15,00 %
20,00 %
1 2 3 4 5
% d
iffe
ren
ce
fro
m m
ea
n
Cylinder #
Balance FPI
-15,00 %
-10,00 %
-5,00 %
0,00 %
5,00 %
10,00 %
15,00 %
1 2 3 4 5
% d
iffe
ren
ce
fro
m m
ea
n
Cylinder #
Balance Texh
Close
Figure 8-28 : Auxillary engine balance (Pmax, FPI and Texh)

DET NORSKE VERITAS
Report for ADNATCO-NGSCO
MANAGING RISK Fleet Energy Efficiency Study
Page 78 of 151
8.3.9.1.1.5 Auxiliary Engine Performance
AE1 is performing well. A slight increase in exhaust gas temperatures noted which should be
monitored and kept under control.
Figure 8-29 : Auxillary engine #1 Performance
AE2 in general is performing well. The exhaust gas temperatures of AE 2 are slightly high,
approximately 11% above shop trials. Read in conjunction with other parameters, there are
indications that both the scavenge air pressure and the Pmax have slightly increased. It is
recommended to establish reasons for the increased scavenge air and Pmax pressures.
Figure 8-30 : Auxillary engine #2 Performance

DET NORSKE VERITAS
Report for ADNATCO-NGSCO
MANAGING RISK Fleet Energy Efficiency Study
Page 79 of 151
AE3 is performing well. A slight increase in exhaust gas temperatures noted which should be
monitored and kept under control.
Figure 8-31 : Auxillary engine #3 Performance
8.3.9.1.2 Bulk
The Shah could not be fully analysed as there was only access to the sea trial data. This data is
insufficient in terms for a thorough analysis, however it can be used to give an indication of
the engine performance.
Shah
Yellow Red ME AE 1 AE 2 AE 3
Pmax 5 15 1.1 % 2.0 % 1.1 % 1.8 %
FPI 5 15 0.0 % 0.0 % 0.0 % 7.2 %
Texh 7 15 2.6 % 4.1 % 4.0 % 5.3 %
Yellow Red
Pmax 5 15 13.0 % -33.2 % -26.3 % -27.4 %
Pmax 5 15 14.0 % -30.6 % -25.1 % -25.2 %
Texh 10 20 -0.1 % -16.7 % -9.5 % -4.7 %
Yellow Red
SFOC 160.5
SFOC 3 10 #DIV/0! Condition acceptable
Keep attention
Investigate
Performance results
Warning levels
12/30/2011
FO consumption increase compared to reference [g/kWh]
Results
Max corrected press. drop referred to engine reference
Corrected exhaust gas temp. increase compared to engine ref.
Average corrected press. drop referred to engine reference
Diesel Engine assessment
Maximum combustion pressure
Exhaust gas temperature
Fuel Pump Indicator
Engine balance (compared to mean)
Specif ic fuel oil consumption - value [g/kWh]
Engine efficiency (compared to sea trial/shop test)
Fuel oil consumption
Engines input
Figure 8-32 : Analysis of engine performance – Shah
The main engine has been analysed to the extent possible, although only two reference loads
were tested on sea trial. Only AE 3 was tested on the sea trials, although no analysis was
possible except from the exhaust gas temperatures. The main engine is low on Pmax. This
should be investigated and corrected.
Typically, a pressure drop of 10 bars equals 2% overconsumption of fuel. The SFOC from the
ship indicates a lower SFOC than calculated for the sea trial by 8.2%. This is not expected.
The on board SFOC calculations/ measurements should be investigated for errors. The AE 3

DET NORSKE VERITAS
Report for ADNATCO-NGSCO
MANAGING RISK Fleet Energy Efficiency Study
Page 80 of 151
does show slight imbalance with the FPI. This could be an erroneous reading, but should be
investigated and mitigated if required.
8.3.9.1.3 RORO
It is registered that the performance test has been carried out at 50% load.
Figure 8-33 : Ro-Ro engine performance test
Best practise for engine performance testing, especially for 4-stroke engines, is between 80-
95% of MCR.
The deviations are generally too large, but this can typically be related to the low load on the
engine. To achieve a useful and comparable test result, the engines should be tested at a
higher load. Engines running on low load can often be “all over the place”, but will settle
down once properly loaded up.

DET NORSKE VERITAS
Report for ADNATCO-NGSCO
MANAGING RISK Fleet Energy Efficiency Study
Page 81 of 151
8.3.9.1.4 Container
The below is an analysis for Al Bazm II
Al Bazm II
Yellow Red ME AE 1 AE 2 AE 3
Pmax 5 15 3.1 % 6.1 % 2.3 % 3.7 %
FPI 5 15 1.8 % 0.0 % 2.0 % 0.0 %
Texh 7 15 3.2 % 9.5 % 3.2 % 2.9 %
Yellow Red
Pmax 5 15 -5.4 % -8.3 % -16.3 % #DIV/0!
Pmax 5 15 -2.2 % -2.1 % -13.6 % #DIV/0!
Texh 10 20 -0.1 % 10.7 % 9.6 % 12.0 %
Yellow Red
SFOC 184.6
SFOC 3 10 5.6 % Condition acceptable
Keep attention
Investigate
Performance results
Warning levels
1/23/2012
FO consumption increase compared to reference [g/kWh]
Results
Max corrected press. drop referred to engine reference
Corrected exhaust gas temp. increase compared to engine ref.
Average corrected press. drop referred to engine reference
Diesel Engine assessment
Maximum combustion pressure
Exhaust gas temperature
Fuel Pump Indicator
Engine balance (compared to mean)
Specif ic fuel oil consumption - value [g/kWh]
Engine efficiency (compared to sea trial/shop test)
Fuel oil consumption
Engines input
Figure 8-34 : Engine performance result – Al Bazm II
The main engine results indicate there is an overconsumption of 5-6% compared to shop
trials. This should be investigated and mitigated. It is as a minimum, recommended, to keep
an eye on the consumption.
AE 1 is showing signs of cylinder imbalance and high exhaust gas temperatures. There is also
a slight decrease in combustion pressure compared to the test bed results. This is
recommended to be kept closely monitored and to take corrective action.
8.3.9.1.4.1 Main engine specific fuel oil consumption SFOC
A increase in the fuel consumption compared to the shop trials. Same can be assigned to the
conditions, but this should be kept closely monitored and trended to avoid further increase in
the fuel overconsumption.
Figure 8-35 Main Engine SFOC with shop trial

DET NORSKE VERITAS
Report for ADNATCO-NGSCO
MANAGING RISK Fleet Energy Efficiency Study
Page 82 of 151
8.3.9.1.4.2 Auxiliary Engine Balance
The cylinder balance is above recommended limits, and should be investigated and corrective
actions initiated.
Aux Engine #1 cylinder balance overview
-20,00%
-15,00%
-10,00%
-5,00%
0,00%
5,00%
10,00%
15,00%
20,00%
1 2 3 4 5 6
% d
iffe
ren
ce
fro
m m
ea
n
Cylinder #
Balance Pmax
-20,00%
-15,00%
-10,00%
-5,00%
0,00%
5,00%
10,00%
15,00%
20,00%
1 2 3 4 5 6
% d
iffe
ren
ce
fro
m m
ea
n
Cylinder #
Balance FPI
-15,00%
-10,00%
-5,00%
0,00%
5,00%
10,00%
15,00%
1 2 3 4 5 6
% d
iffe
ren
ce
fro
m m
ea
n
Cylinder #
Balance Texh
Close
Figure 8-36 : Auxillary engine #1 balance Overview
8.3.9.1.4.3 Auxiliary Engine Performance
AE 1 is showing increased exhaust gas temperatures. Although not critical, especially
cylinder one should be kept under surveillance.
The scavenge air pressure is somewhat high, which could be an inaccuracy in the pressure
gauge. Pmax is good, and indicates a sound engine overall.

DET NORSKE VERITAS
Report for ADNATCO-NGSCO
MANAGING RISK Fleet Energy Efficiency Study
Page 83 of 151
Figure 8-37 : Auxillary engine #1 performance
8.3.9.2 Potential Solutions
It is recommended that the SFOC is trended to keep the development under control.
Changes towards a further increase should be mitigated.
The SFOC is a good overall parameter for the engine performance but does not give
any details on the reason for any changes in the engine. The tracking of diesel engine
performance and the collecting and trending of results s recommended for defined
engine parameters.
The benchmarking between vessels on SFOC and % deviation from baseline of the
engine parameters should be established. The following checks are recommended to
be carried to correct the anomalies noted in the above vessels.
There needs to be a harmonised process related to engine analysis regarding loads,
weather and other prerequisites.
There should be institutionalised and ideally automated trending and analysis of
performance test.

DET NORSKE VERITAS
Report for ADNATCO-NGSCO
MANAGING RISK Fleet Energy Efficiency Study
Page 84 of 151
Main and auxiliary
engine performance
For majority of the
ADNATCO fleet currently
limited savings potential.
Long term effect:
3% savings on
main engine
performance
5% savings on
auxiliary engine
performance
8.3.9.3 Expected benefits
Based on development of the new vessels and status of the older
vessels in the fleet it can be stated that currently the savings
potential related to better follow up of engine performance is
limited. However, as has been illustrated, efficient trending
altering the organisation of substandard performance in the fleet
is not evident. This will over time convey degraded performance
and decreased fuel efficiency. Based on the analysis a long term
effect of neglecting these aspects will constitute
overconsumption of fuel as indicated below.
Effective control on the main engine performance and
timely corrective measures on deviation to ensure the
optimum performance can give an estimated
improvement potential of 3% in fuel savings across all
the ADNATCO fleet.
Effective control on the auxiliary engine performance and timely corrective measures
on deviation to ensure the optimum performance can give an estimated improvement
potential of 5% in fuel savings across all the ADNATCO fleet.
By ensuring optimal performance of the main and auxiliary engines, breakdowns and
excessive wear will be avoided impacting in a positive way on maintenance costs.
8.3.10 Auxiliary Engine Utilisation
Optimised auxiliary engine utilisation influences hugely the
fuel consumption as well as maintenance aspects related to the
engines. Analysis have been carried out based on reported data.
8.3.10.1 Observations
Auxiliary engine utilisation is difficult to follow up but based on the data provided an
analysis of running hours can indicate many generators online simultaneously.

DET NORSKE VERITAS
Report for ADNATCO-NGSCO
MANAGING RISK Fleet Energy Efficiency Study
Page 85 of 151
Figure 8-38 : Auxillary engine utilization –Al Dhafrah, Al Samha, Al Bazm, Abu Dhabi – III, Umm Al Lulu, Bani Yas
It can be seen that the average engine load over a period of 1 year is varying 40% to 65%
overall in the fleet. There could be multiple reasons for this however the most plausible would
be that the settings in the power management system are not optimised. Seemingly limited
follow up from an efficiency point of view on running hours of auxiliary engines or total
produced kWh. kWh meters are not installed on auxiliary engines and thus makes it
impossible to follow up actual utilisation.

DET NORSKE VERITAS
Report for ADNATCO-NGSCO
MANAGING RISK Fleet Energy Efficiency Study
Page 86 of 151
Auxiliary engine
utilisation
10% improved fuel
performance for
auxiliary engines in
ADNATCO fleet
Analysing the total power production per engine, it can be seen that engines have been
operating at loads below optimum level (around 80% in general) despite guidance on how to
utilise auxiliary engines in SMS documentation.
8.3.10.2 Potential Solutions
Phase 1 – No kWh meters installed
Institutionalise reporting of auxiliary engine running hours related to mode of
operation.
As for as operational circumstances permits the auxiliary engines should be operated
at loads higher than 75%.
Utilise the reporting tool to benchmark results where results are communicated back to
the vessel
Update SMS information to ensure consistency.
Phase 2 – upgraded PMS system and/or kWh meters installed
Improved management of auxiliary engines
Possible to monitor actual utilisation and benchmark results
The power management system utilization shall be at the optimum level.
8.3.10.3 Expected Benefits
For every 1% increase in load factor of the engines from 50%,
there is a realised benefit of a better SFOC - Thus maintaining
the average engine utilisation at 80% compared to current
50% whenever possible correlates to an 18% fuel saving per
hour from the 50% FO cons figure. This is however data
Figure 8-39 : Auxillary Engine Load

DET NORSKE VERITAS
Report for ADNATCO-NGSCO
MANAGING RISK Fleet Energy Efficiency Study
Page 87 of 151
based on the reported monthly reports system and it is strongly dependent on the
accuracy of the tank sounding systems for the day tanks to determine the specific fuel
oil consumption.
In addition realising the full effect is not realistic, however an improvement in the area
of 5% to 10% should be achievable.
8.3.11 Auxiliary Boiler utilisation and Performance
The auxiliary boiler provides heat to the ship system as
required. Heat is provided by the auxiliary boiler system and
the economiser utilising exhaust gas heat. It should be the
ambition to maintain the consumption of the auxiliary boiler at
a minimum level and utilise the economiser “free” energy to
the largest possible extent.
8.3.11.1 Observation:
There are no performance analysis for
auxiliary boilers that can be used for
analysis of efficiency of boilers in the
fleet.
Boiler consumption for tanker vessel
Abu Dhabi III is illustrated in the
graphs.
8.3.11.2 Possible Solutions
In order to ensure optimal boiler performance it is suggested to institutionalise the following
To maintain as high a vacuum as possible in the COPT condensers to minimize the
fuel consumption
To ensure the boilers operate at loads higher than 60% during the discharge operations
for tanker fleet.
Boiler combustion and feed water treatment shall be maintained as per maker‟s norms
Maintaining the boiler feed water temperature at the recommended level
Effective utilization of the boilers by means of training
Figure 8-40 : Auxillary Boiler AV Cons/day - Discharge
Figure 8-41 : Auxillary Boiler AV cons/day - Ballast

DET NORSKE VERITAS
Report for ADNATCO-NGSCO
MANAGING RISK Fleet Energy Efficiency Study
Page 88 of 151
Auxiliary boiler
utilisation and
performance
1.5% improved fuel
performance in the
ADNATCO fleet
Ensure that only economizer is used during sea passage as primary source for heating
unless additional cargo heating is required.
The vessel shall aim at minimise utilisation of boiler in port and idling.
For cargo require heating the vessels shall to closely monitor cargo temp / air temp / sea water
temp and expected sea water temp / air temp en route for better planning of cargo heating.
The ambition shall be to use only one boiler (at full capacity) for cargo heating rather than
running two boilers at a reduced capacity. Close liaison on board the vessel between
engine/deck when heating coils are being shut/throttled in order to avoid “steam dumping” in
the condenser.
If there is no instruction to maintain cargo at the loaded temperature and to only meet
discharge temperature requirements, then temperature can fall to about 5-10 deg C above
melting/pour point and then cargo to be gradually raised to discharge temperature prior
vessel's arrival (always to be decided together with operator).
Above to be evaluated in connection with cargo characteristics (viscosity, pour point, melting
point cloud point, etc) and any other heating instruction given.
8.3.11.3 Expected Benefits
Reduction in fuel consumption approx. 1 to 1.5% for all
the above solutions combined.
8.3.12 Economiser Performance
As described above the economiser utilises “free” heat available
to optimise energy performance by minimising need for auxiliary
boiler utilisation.
8.3.12.1 Observation
The monitoring parameters are pressure drop and
temperature difference between the inlet and
outlet of the economiser. Present status indicate
good performance and no deviations noted
except for vessel Al Bazm, where the pressure
drop across economizer is beyond limits
indicative of faulty manometer as indicated in Figure 8-42 : Economizer Performance

DET NORSKE VERITAS
Report for ADNATCO-NGSCO
MANAGING RISK Fleet Energy Efficiency Study
Page 89 of 151
Economiser performance
No benefits expected
the graph.
8.3.12.2 Potential Solutions
Regular cleaning of the economisers when pressure drop increases to 80 to 90 mm
water gauge.
8.3.12.3 Benefits
As indicated the economiser in general seem to be in
good working condition.
Ensuring clean economiser will convey overall
improvement in plant efficiency and main engine fuel
consumption decrease due to clear exhaust passages

DET NORSKE VERITAS
Report for ADNATCO-NGSCO
MANAGING RISK Fleet Energy Efficiency Study
Page 90 of 151
8.4 Secondary energy consumers
DNV defines secondary consumers as all electrical equipment supplied from the main
electrical switchboard.
Secondary Energy Consumer
Thruster operations
Cargo operations
Ventilation, HVAC, lights
Insulation & energy losses
Water productions
Incinerator
Etc.
The major electrical consumers on board a typical vessel in the ADNATCO fleet for which
the motor power is more than 30 kw are as follows:
Ballast Pumps
Main sea water pumps
Low temperature cooling water pumps
Fire & GS pumps
Tank cleaning pump ( Chemical tanker)
Fixed gas free fan ( chemical tankers)
Ventilation fans
Steering gear pumps
Hydraulic power packs
Air compressors
However, it was chosen to focus on two major subjects in this chapter based on observations
and input from ADNATCO-NGSCO personnel through interviews and workshops;
Secondary consumers optimum utilization and best practices
Variable Frequency Drives for consumers greater than 30 kw.
In addition are implementation of low energy appliances addressed in this chapter.
Secondary consumer performance - A measure of the ability to monitor and ensure optimal
performance from an energy efficiency perspective of secondary consumers (e.i electrical
consumers) on the vessel

DET NORSKE VERITAS
Report for ADNATCO-NGSCO
MANAGING RISK Fleet Energy Efficiency Study
Page 91 of 151
8.4.1 Secondary consumers utilisation and good practices
Ensuring that all secondary consumers are operated at the most
energy efficient is instrumental and achieved by guiding manuals
combined with repeated awareness campaigns and focus on
superintendent and management vessel visits.
8.4.1.1 Observations
There is currently limited guidance on handling of secondary energy consumers from
an energy efficiency point of view in ADNATCO-NGSCO manuals.
8.4.1.2 Possible solutions
Initiate awareness campaign and establish guiding material to ensure optimal energy
performance of secondary consumers.
Regime can address for example:
Demand controller for the air compressors to be checked for optimum start and stop
pressures
Regular cleaning of condensate traps of air compressors
Isolation of redundant lines to prevent leakages.
Volumetric efficiency of the compressors to be monitored and maintained
Air intake filter for compressors to be regularly cleaned
HVAC system cold air return filters from accommodation and cabin spaces to be
regularly cleaned.
Insulation damage for hot and cold lines to be monitored and rectified to prevent heat
loss and heat ingress.
Regular cleaning of steam traps.
Regular monitoring of air, water, fuel and steam leakages and rectification of same
KWH meters can be fitted on the
consumers for close monitoring of
energy production versus
consumptions and deviations from
the load balance prescribed by the
builders.
Regular cleaning of atmospheric
condenser
Energy baseline for the various consumers to be established for various modes of
vessel operation and same to be monitored.

DET NORSKE VERITAS
Report for ADNATCO-NGSCO
MANAGING RISK Fleet Energy Efficiency Study
Page 92 of 151
Secondary consumer
performance
2% improved fuel
performance for
secondary consumers
(auxiliary engine fuel
consumption) for the
ADNATCO-NGSCO
fleet.
8.4.1.3 Expected Benefits
Institutionalised improved practices conveys optimum
utilisation of equipment and reduced maintenance
costs
Exact benefit figures are hard to predict, but is
expected to be up to 2% based on DNV experience.
8.4.2 Variable speed drives
Energy can be saved by using frequency converters or variable
speed drives:
Variable frequency drives (VFDs, variable speed drives,
VSDs) allow a motor‟s speed to be varied electrically instead
of by mechanical means. A variable speed drive often uses
less energy than an alternative fixed speed mode of operation.
Fans and pumps for example, provided that the consumer
output requirements vary in various modes of operation or depending on ambient conditions.
e.g. SW and FW pumps and engine room fans.
Another feature with VSD is the soft start option which leads to lower maintenance cost and
longer motor life. The variable speed is not only beneficial related to lower energy
consumption, but can be an effective way of protecting equipment in stand-by mode i.e.
steering gear and hydraulic power packs .
The price for VFD has reduced dramatically the last few years and are now becoming a
realistic option also for retrofit solutions.
8.4.2.1 Observations
It has been observed that ADNATCO-NGSCO has not used
VSD or frequency drive solutions in the fleet. The below
listed equipment are potential ones where the variable speed
drives can be installed.
Ballast Pumps
Main sea water pumps
Low temperature cooling water pumps
Fire & GS pumps
Tank cleaning pump ( Chemical tanker)
Fixed gas free fan ( chemical tankers)

DET NORSKE VERITAS
Report for ADNATCO-NGSCO
MANAGING RISK Fleet Energy Efficiency Study
Page 93 of 151
VSD/frequency converter
2% improved fuel
performance for
secondary consumer
(auxiliary engine fuel
consumption) for the
ADNATCO-NGSCO
fleet.
Ventilation fans
Steering gear pumps
Hydraulic power packs
Air compressors
8.4.2.2 Potential solutions
Investigate applicability of retrofit of frequency/VFD solution on larger consumers.
DNV experience shows that it is difficult to provide a sound return on investment on
smaller consumers and hence does not at this stage advocate a solution or a saving
related to this area. However DNV are in discussion with a vendor claiming to have
significant progress in this aspect and claim sound return on investment estimations on
smaller consumers proven in the Cruise industry where smaller consumers are
abundant. DNV will monitor this development and share experiences with
ADNATCO-NGSCO enabling further development within this area.
8.4.2.3 Expected benefits
The graph shows the pay-back time for the investment on VSDs for specific applications. It
follows from the affinity laws that reducing motor speed to 50% results in a power
consumption drop up to 15%. For certain modes of operation, the saving can be as much as
50% according to
manufacturers.
It is much more economical to
put VSDs on high power
motors as illustrated. The graph
shows clearly that pay-back
time for motor of 90 kW is less
than 1.5 year as compared to
about 5.5 years for motor of 45
kW.
It is assumed that VSD will
decrease the power
consumption of the motor by 10-30% considering the operational
profile conveying reduced fuel consumption on auxiliary engines
of about 2%.
In addition motor maintenance cost is expected to be reduced and
motor life is expected to increased.
Figure 8-43 : Cost Benefit Analysis for VFDs

DET NORSKE VERITAS
Report for ADNATCO-NGSCO
MANAGING RISK Fleet Energy Efficiency Study
Page 94 of 151
Low energy appliances
0.5% improved
auxiliary engine fuel
consumption for the
ADNATCO-NGSCO
fleet.
8.4.3 Low energy appliances
To reduce energy consumption on smaller systems, hotel
equipment and lightning an option is to shift to low energy
appliances. This has been done with success by other operators.
It needs to be assessed how the life expectancy of the
equipment will effect total life cycle cost, but in this assessment
include energy and potential water consumption as well as
technical quality.
8.4.3.1 Observation:
No indication of energy efficient lighting and practice of controls used for various
lighting systems.
8.4.3.2 Potential Solutions:
Energy efficient lighting can be explored.
Potential for intelligent lighting in the public spaces and cabins.
Best practices to be established for the switching on/off the lights for the various
spaces.
Low energy appliances in hotel.
8.4.3.3 Expected Benefits
The fuel saving for all the above solutions put together
should be around 0.5%.

DET NORSKE VERITAS
Report for ADNATCO-NGSCO
MANAGING RISK Fleet Energy Efficiency Study
Page 95 of 151
8.5 Fuel Management
Fuel Management is fuel related activities which ADNATCO-NGSCO undertakes prior to,
during and post bunkering operations. Risk management, cost, operational efficiency, and
compliance with regulatory requirements are all important aspects of Fuel Management.
Six improvement areas have been identified based on reviewed documents and procedures
pertaining to ADNATCO-NGSCO fuel management and bunkering operations as well as
interview sessions and an on board visit.
Fuel Management
Understanding fuel specifications
Fuel ordering, purchasing,
documentation and responsibilities
Systematic benchmarking of fuel
quantity
Reduce Statutory/Environmental Risk
Systematic Fuel Quality Testing and
Understanding of Fuel Parameters
Fuel Training
These six improvement areas are not covering all the aspects of ADNATCO-NGSCO‟s fuel
management, but it has been identified as the most critical areas to explore in order to mitigate
risk and be more fuel efficient.
All the initiatives detailed below are considered to apply in all operational modes.
Bunker operations from purchasing to consumption

DET NORSKE VERITAS
Report for ADNATCO-NGSCO
MANAGING RISK Fleet Energy Efficiency Study
Page 96 of 151
Figure 1 illustrates where ADNATCO-NGSCO stands in comparison to industry average in
the six identified improvement areas.
8.5.1 Understanding fuel specifications
The third edition of the ISO 8217 Standard was completed and published in November 2005
while the fourth edition was released in June 2010.
The revised standard contains amendments to the ISO RM (Residual Fuel) and DM (Distillate
Fuel) grades. In addition, 12 informative Annexes have been added to the revised standard,
including amongst others information about the newly introduced parameters, ignition/
combustion properties and interpretation of
test results.
Selection of the correct fuel grades for
each vessel is an important part of fuel
management.
8.5.1.1 Observations
There appears to be an inconsistent
understanding of the ISO 8217 Standard in
ADNATCO-NSGCO. Different
terminologies are being used for fuel
grades within the organization.
ADNATCO-NGSCOhas done a study and
RMA RMB RMD RME
10 30 80 180 180 380 500 700 380 500 700
Kinematic viscosity at 50 °C (b) mm²/s max. 10.00 30.00 80.00 180.0 180.0 380.0 500.0 700.0 380.0 500.0 700.0 ISO 3104
Density at 15 °C kg/m³ max. 920.0 960.0 975.0 991.0 991.0 991.0 991.0 991.0 1010.0 1010.0 1010.0 ISO 3675 or ISO 12185 (see also 7.1)
CCAI max. 850 860 860 860 See Annex B
Sulfur (c) mass % max. ISO 8754 (see also 7.2)
Flash point °C min. 60.0 60.0 60.0 60.0 60.0 60.0 60.0 60.0 60.0 60.0 60.0 ISO 2719 (see also 7.3)
Hydrogen sulfide (d) mg/kg max. 2.00 2.00 2.00 2.00 IP 570
Acid Number (e) mg KOH/g max. 2.5 2.5 2.5 2.5 ASTM D664
Total Sediment Potential mass % max. 0.10 0.10 0.10 0.10 ISO 10307-2 Procedure A
Carbonresidue–micromethod mass % max. 2.50 10.00 14.00 15.00 18.00 18.00 18.00 18.00 ISO10370
Pour point (upper) - winter quality (f) max. 0 0 30 30 30 30 30 30 30 30 30 ISO 3016
Pour point (upper) - summer quality max. 6 6 30 30 30 30 30 30 30 30 30 ISO 3016
Water Volume% max. 0.30 0.50 0.50 0.50 0.50 0.50 0.50 0.50 ISO3733
Ash mass % max. 0.040 0.070 0.070 0.070 ISO6245
Vanadium mg/kg max. 50 150 150 150 IP 501, IP 470 or ISO 14597 (see also 7.8)
Sodium mg/kg max. 50 100 100 50 IP 501, IP470
Aluminium plus silicon mg/kg max. 25 40 40 50 IP 501, IP 470 or ISO 10478 (See also 7.8)
a This category is based on previous distillate DMC category specified in ISO8217:2005, Table 1
b 1 mm2/s = 1 cSt
c The purchaser shall define the maximum sufur content in accordance with relevant statutory limitations. See Clause 0.3 and Annex C
d Due to reasons stated in Annex D the implementation date for compliance with the limit shall be 1 July 2012. Until such time, the specified value is given for guidance
e See Annex H
f Purchasers shall ensure that this pour point is suitable for the equipment on board, especially if the ship may operate in cold climates
mg/kg Used lubricating oil (ULO): Zinc
Phosphorus
Calcium
60
100
60
IP 501 or IP 470Ca > 30 and Zn > 15
or
Ca > 30 and P > 15
0.50
0.150
450
100
°C
2.5
0.100
350
20.00
870 870
Statutory requirements
2.00 2.00
2.5
0.10
RMK
Catagory ISO-F-
RMG Test method reference Unit LimitCharacteristics
0.10
Figure 8-44 : Best Practice Benchmark – Fuel Management
Figure 8-45 : Fuel specification standard ISO 8217

DET NORSKE VERITAS
Report for ADNATCO-NGSCO
MANAGING RISK Fleet Energy Efficiency Study
Page 97 of 151
Fuel Specification
It is not practical to
estimate a benefit for
this activity but the
impact of enhanced
awareness is significant.
is now using 180 grade fuels instead of the 80 grade fuel which were previously being used by
the RoRo vessels. Evaluation of specifications for other vessels has not been done.
There is uncertainty on how to differentiate between commercial and statutory requirements
within the different departments.
8.5.1.2 Potential solutions
Introduce standard terminology and references to ISO 8217:2010 standard throughout the
organization and incorporate knowledge as an integral part of the entire bunker chain.
Have a holistic approach to evaluating specifications for each vessel. Most often, 380 grade
fuels are „no better' than 500 grade fuels, with the latter being cheaper. A general policy
should be to use the highest viscosity possible with respect to the heating capability and
centrifuge capacity of the total fuel system. In fact, marine engines are designed to operate on
high viscosity fuel oils which (provided they are not contaminated) will often need less
consideration than operation on distillate fuels.
The fuel quality requirements of each engine and the storage and fuel treatment plant
requirements for each vessel should all be reviewed, and a suitable grade should be selected
from the ISO 8217 Standard which gives parameters nearest to these requirements.
The fuel purchasing department must use the fuel specifications for each vessel when seeking
quotations. If suppliers are not able to provide the quality required, it may be necessary to
accept an alternative grade. The purchase and technical department should discuss these
points and agree on a line of communication if the buyer is in any doubt regarding fuel
quality. However the technical department will also need to acknowledge that at certain times,
the buyer will need to negotiate on price and quality depending on availability.
8.5.1.3 Expected benefit
Introducing standard terminology and references to the
specification would lead to a better understanding of the
quality requirement and quality ordered for each vessel
throughout the organisation.
Figure 8-46 : Fuel – Evaluate Specifications

DET NORSKE VERITAS
Report for ADNATCO-NGSCO
MANAGING RISK Fleet Energy Efficiency Study
Page 98 of 151
This allows ADNATCO-NGSCO to set clear responsibilities within the organization
as well as with external parties like charterers and suppliers.
Reviewing the specifications for each vessel would result in greater flexibility while
ordering fuels and the use of cheaper fuels. There would also be flexibility to bunker
at different ports and avoid delays in case of non- availability of a specific grade in
certain ports.
8.5.2 Fuel Ordering, purchasing, documentation and responsibilities
Over the years, the problems encountered by ship owners and operators in the procurement
and use of marine fuels have not diminished. To mitigate the risks of getting poor quality fuel
or quantity discrepancies, as well as overpaying for the fuel, a good bunker purchasing routine
is vital. In addition, the follow up of each delivery is important as well, in order to monitor
the quality and compliance of each fuel that will eventually be consumed on board.
8.5.2.1 Observations
ADNATCO-NGSCO lifts most of their fuel off the port of Fujairah. This was not the case a
few years ago when ADNOC supplied marine fuels in Abu Dhabi and Fujairah, with superior
fuel quality and no quantity discrepancies.
The suppliers that are now used by ADNATCO-NGSCO worldwide come from an approved
list of suppliers and brokers provided by ADNOC. The list consists mostly of brokers, and
there are only a few physical suppliers from the port of Fujairah. It is not certain how often
the approved list of suppliers is updated and by what means.
There is no other benchmarking mechanism in place to rate the suppliers. Suppliers that have
delivered off spec fuel will be
tagged in the purchasing system,
but the internal results or data
analytics from current fuel
management partner is not utilized
to continuously assess the fuel
quality of these suppliers.
There is a tender system in place
for each fuel purchase. This tender
system is not catering to the
volatile and competitive market,
and it jeopardizes the possibility to
arbitrate the best suppliers at the
lowest cost. Suppliers or brokers receiving the tender will only have a few hours to reply, and
the deadline was observed to be during lunchtime, local time. If more than one broker is used
in this tender system, the physical supplier may hold the advantage and raise the fuel price
since there are several brokers asking the same supplier for the same nomination.
The supplier‟s terms and conditions are not clear to all departments. Ships staffs are not
aware of the binding commercial sample location and sample bottles, and some departments
are not aware of the timeline for issuing claims.

DET NORSKE VERITAS
Report for ADNATCO-NGSCO
MANAGING RISK Fleet Energy Efficiency Study
Page 99 of 151
Fuel Ordering
It is estimated that
2% can be saved
across ADNACTO-
NGSCO fleet
Follow up actions are primarily in the hands of the superintendents, even with density
shortliftings. There are, however, many overlapping responsibilities in the entire bunker
operations with no clear guidelines.
8.5.2.2 Potential solutions
Go through a RACI (Responsible,
Accountable, Consulted and Informed)
process to map up responsibilities from
pre-bunkering to post bunkering routines.
Use data analytic tools from fuel testing
companies to map up the reputable
suppliers instead of only relying on a list
of approved brokers and suppliers from
ADNOC
Have all the affected departments and
ship staffs understand the supplier‟s terms and conditions in order to be prepared for issues
relating to ADNATCO-NGSCO fuel deliveries.
Provide more time and flexibility when purchasing fuel oil from
brokers/suppliers, and avoid deadlines. Choose only one broker for
each nomination and possibly a few physical suppliers as well, but
avoid using many brokers for the same nomination as this may cause
supplier to hike their prices.
8.5.2.3 Expected benefit
There will be clear mandates and responsibilities throughout
the organization with a RACI in place as well as clear bunker
purchasing guidelines. The workload in each department will
also be reduced when only the necessary claims are pushed by
the responsible department.
Best practice purchasing routines will result in savings and better service in a volatile
and competitive market. With the annual fuel quantity that is purchased by
ADNATCO-NGSCO, savings can reach an estimated USD 10-
20 million a year. (equals 2 – 4% of total fuel bill)
A better understanding of the supplier‟s terms and condition, as
well as using data analytics will send signals to the suppliers and
market that ADNATCO-NGSCO are quality focused.

DET NORSKE VERITAS
Report for ADNATCO-NGSCO
MANAGING RISK Fleet Energy Efficiency Study
Page 100 of 151
8.5.3 Systematic Benchmarking of Fuel Quantity
Bunkers are typically the largest contributor to the operational costs of a ship, with the
physical transfer of fuel often taking place thousands of miles away from the contracting
offices. As neither the buyer nor the seller is present to witness the bunker quantity transfer
and sampling procedures on board, any post-
delivery investigation on quantity shortages is
usually futile and inconclusive. Protests,
demurrages, physical shortages, legal fees,
management time, inconvenience and stress add
to overall costs.
Fuel disputes which are more likely to come to
the attention of solicitors, P&I Clubs and
underwriters are usually centred on quality
parameters rather than quantity as the associated costs are likely to be higher. Following
proper sampling procedures and documentation is of utmost importance during any
bunkering.
8.5.3.1 Observations
Inadequate benchmarking of actual quantity received. Large differences (up to 100MT)
between vessel received quantities and bunker tanker supplied quantities have been reported
on ADNATCO-NGSCO vessels.
In many cases, differences are not
brought to the attention of the
office as both the ship and barge
crews attempt to settle bunker
quantity disputes between
themselves by adjusting the bunker
figures
Taking and sealing of commercial
samples taken by the supplier are
usually not witnessed by the ship
staff. Supply vessel measurements
and sampling are sometimes not
witnessed due to unavailability of
safe access. Very often ship staff do
not have the time to witness the activities on the barge as they are involved with various other
activities on board like receiving stores/lubes, repairs, workshop personnel etc during the
short stay.
Surveyors “accepted by all parties” (which is usually the supplier‟s “preferred” surveyor) are
appointed for bunker quantity surveys.
It is not possible to follow-up on claims without adequate documentation
There is no benchmarking of the actual quantities on board the vessels.
Figure 8-47 : Fuel quantity received – adjusting figures

DET NORSKE VERITAS
Report for ADNATCO-NGSCO
MANAGING RISK Fleet Energy Efficiency Study
Page 101 of 151
8.5.3.2 Potential solutions
Educate ship staff on the importance of witnessing bunker tanker measurements and sampling
procedures and reporting the actual quantities received.
Ship staff will not be familiar with the “Tricks of the Trade”. It is important to assist ship staff
by appointing truly independent surveyors that have the training, experience and integrity to
address a number of interrelated issues. Surveyors should follow proper surveying procedures
and ensure that correct petroleum measurement and sampling criteria are followed. Surveyors
appointed should report the actual figures and not adjust figures on site and be able to
objectively identify problems and concerns and provide all relevant details to the client.
Safe access for boarding the supply vessel should be provided for enabling ship staff/surveyor
to witness the Supply vessel measurements and sampling.
Quantification is also about uncovering discrepancies in density and water content. Roles in
the organization should be defined to follow up on claims including density shortliftings.
In the future, it may be required to investigate potential of flow meters in delivery routines.

DET NORSKE VERITAS
Report for ADNATCO-NGSCO
MANAGING RISK Fleet Energy Efficiency Study
Page 102 of 151
Benchmarking Fuel
Quality
It is estimated that 1%
can be saved across
ADNACTO-NGSCO
fleet
8.5.3.3 Expected Benefits
Avoiding settling of quantity disputes on board by adjusting
figures and reporting actual figures to the office is essential for
benchmarking quantity and consumption more accurately.
Use of independent surveyors following proper surveying
procedures, who are familiar with the “Tricks of the Trade”
will reduce the quantity discrepancies.
Proper documentation will also help with follow-up on
quantity and quality claims.
Considering 30 vessels in the fleet, each bunkering 6 times a year and losing 20 MT
per bunkering, estimated savings would be 30x6x20x700=2,520,000 USD/year.
More importantly, this will send signal to suppliers and the market that
ADNATCO/NGSCO are quality and quantity focused and eventually lead to a
reduction in disputes.
8.5.4 Reduce Statutory and Environmental risks
It is becoming more difficult to keep up with new and upcoming fuel regulations. Even with
MARPOL Annex VI fuel
requirements that have been
in place since 2005, many
vessels are still sailing with
non-compliant documents
and procedures on board.
Enforcement and controls
with regards to MARPOL
Annex VI requirements will
step up, especially in
Europe and in the US, so it
is important to understand
and to be compliant with
current and upcoming fuel regulations in order to avoid costly detentions in the future.
8.5.4.1 Observations
No ADNATCO-NGSCO vessels have been detained due to MARPOL Annex VI or European
Commission Directives 1999/32/EC and 2005/33/EC to date. There are, however, vessels
carrying non-compliant statutory documents.
Change-over procedures have not been re-evaluated since the new ECA sulphur limit was
reduced to 1.00%, and there are no test results available to verify correct change over
procedures.
Notification to the flag state and port state are not prepared when sample location or sample
equipment is different from the requirements under MARPOL Annex VI. In addition, no
notifications are prepared when the commercial test results indicated non-compliance.

DET NORSKE VERITAS
Report for ADNATCO-NGSCO
MANAGING RISK Fleet Energy Efficiency Study
Page 103 of 151
Statutory and
Environmental Risk
It is not practical to
estimate a benefit for
this activity but the
impact of enhanced
awareness is significant.
There are no agreement in place between ADNATCO-NGSCO and the suppliers/brokers
when it comes to the supplier‟s responsibilities if the official MARPOL Annex VI sample is
verified by the authorities.
Statutory and regulatory updates are mainly provided by the agents. No one is responsible for
collecting all the updates and information and distributing it internally in a clear and
understandable way.
8.5.4.2 Potential Solutions
Implement routines for collection,
registration and documentation of
Notifications catering to statutory needs.
Verify on a few vessels that compliant low
sulphur fuel oil is being consumed after
completion of change-over, and to make
sure the change-over procedures are
updated to cater to the lower sulphur
limits.
Have a standard clause to all
suppliers/brokers that if the official
MARPOL sample is tested and deemed to
be non-compliant, the sole responsibility
and costs will be on them (suppliers).
There should be one person and one back-up person responsible for collecting all fuel
regulatory updates.
8.5.4.3 Expected Benefits
There will be a reduced risk of vessel detentions if the
MARPOL Annex VI guidelines are followed, and there will a
reduced risk of any negative profiling.
ADNATCO-NGSCO will be updated and prepared for all
regulatory updates which may also have cost implications
It will send signals to suppliers and market that ADNATCO-
NGSCO is quality focused.
Figure 8-48 : Bunker Delivery Note – MARPOL Annex VI

DET NORSKE VERITAS
Report for ADNATCO-NGSCO
MANAGING RISK Fleet Energy Efficiency Study
Page 104 of 151
8.5.5 Systematic Fuel Quality Testing and understanding Fuel Parameters
Unpredictable fuel quality is a regular cause for concern among ship operators. Testing of
marine fuels can:
1. Prevent operational problems for vessels
2. Prevent commercial losses as a result of using „off specification‟ bunkers
3. Provide indication of compliance with MARPOL Annex VI regulations
4. Assist in the filing of claims against suppliers for off-specification fuel
5. Helps avoid unnecessary delays and other inconveniences resulting from bunkering off-
specification fuel
8.5.5.1 Observations-
Diffused understanding of what is a “good” fuel. A good fuel is not just a fuel meeting the
specifications or a “green” fuel report. In fact a fuel just meeting the specification may be
more dangerous than a fuel not meeting the specification as enough attention may not be paid
to the fuel treatment on board due to a false sense of security that the fuel is meeting the
specifications.
There is inadequate benchmarking of actual quality received and no bench marking of quality
based on important fuel parameters.
Poor utilization of
information derived from
Fuel Quality Testing (FQT)
throughout the organization.
Tabulated fuel quality test
results are not available and
bench marking of fuels by
vessel/fleet/ port has not
been carried out.
Unclear responsibilities with
regards to continued follow
up of test results
Receiving the requisite fuel
quality according to ISO
8217 is but one side of the
coin. Residual fuels should
always be treated as „contaminated‟ products, requiring on board fuel oil treatment to
minimise the level of contaminants present and to ensure that the quality of fuel is good
enough before it enters the engine. Monitoring and benchmarking of the fuel treatment system
is not in place.
The heat liberated by combustion of a fuel may be termed the specific energy. Marine fuel is
usually quoted in USD/ton with different prices for distillates (gas oils and marine diesel oils)
and residual fuel grades. The specific energy of fuels is not being taken into consideration
while ordering fuels.

DET NORSKE VERITAS
Report for ADNATCO-NGSCO
MANAGING RISK Fleet Energy Efficiency Study
Page 105 of 151
Fuel Quality Testing
It is estimated that 2%
can be saved across
ADNACTO-NGSCO
fleet
8.5.5.2 Possible solutions
Educate across the organization about each fuel parameter and the impact it has on engine
operations.
Utilize the testing data which
provides detailed info based on
which decisions are made concerning
acceptance of the fuel, storage,
handling/treatment, engine
operational adjustments on board,
etc.
Tabulate results to monitor,
benchmark and evaluate fuel quality.
Define roles in the organization to
utilize the data derived from the quality testing
Implement verification of samples across the fuel system to monitor and assess the quality of
the fuel reaching engine.
The specific energy of fuels from different suppliers/ports should be benchmarked and taken
into consideration while ordering fuels.
8.5.5.3 Benefits
Familiarity with fuel
parameters and their impact on
operations will help in using
the test reports for more
efficient operation of the plant.
It will also help with following
up on the delivered quantity
and quality.
The analysis reports should also
be used to measure and
compare emissions accurately.
It will also help relate fuel quality to maintenance which will lead to possible
reduction in maintenance cost and avoid breakdowns
Benchmarking of specific energy of fuels by different
suppliers will help in evaluating the cost per unit of energy
and can lead to savings of up to 2% of fuel costs.
This will also help with accurate calculation of specific fuel
consumption.
8.5.6 Fuel Training
Ship owners and ship management companies often do not focus on fuel training, even though
fuel may account for up to 70% of the vessels operational costs. In addition, the fuel quality

DET NORSKE VERITAS
Report for ADNATCO-NGSCO
MANAGING RISK Fleet Energy Efficiency Study
Page 106 of 151
Fuel Training
It is not practical to
estimate a benefit for
this activity but the
impact of enhanced
awareness is
significant.
has deteriorated dramatically over the last 10 years, and there are now more statutory fuel
mandates to follow as well.
8.5.6.1 Observations
There is no formalized or required fuel training within the organization. Internal training and
officer conferences do not focus on fuel quality or fuel regulations.
There is a gross variation of relevant fuel related knowledge and competence in ADNATCO-
NGSCO. Some have attended external fuel related courses in the past few years, but others
only have the internal knowledge from when fuel quality and quantity was not an issue (ie
bunkered from ADNOC).
There is little to no attendance in fuel conferences from the commercial department. They
lack the insight, developments and connections which their counterparts from other shipping
companies receive from attending these conferences.
8.5.6.2 Potential solutions
Introduce and systemize defined bunker related training for relevant staff so that they are
updated and knowledgeable about critical fuel
related issues.
Conduct officers conferences that cover topics
such as sampling, fuel treatment, significance
of test parameters and statutory requirements.
Participate in selected bunker conferences
such as Fujcon, International Bunker
Conference and Sibcon to gain industry
knowledge, updates and future developments
as well as connecting with peers and
suppliers/brokers.
8.5.6.3 Expected Benefits
Better understanding of what is important in fuel management
across all departments.
It will increase the network and information exchange from an
internal approach to a best practice industry approach.
It will allow ADNATCO-NGSCO to stay ahead of events affecting
operations and cost.
With fuel training in place, both onshore and on board, it will
provide the foundations to achieve the identified benefits relating to fuel management.

DET NORSKE VERITAS
Report for ADNATCO-NGSCO
MANAGING RISK Fleet Energy Efficiency Study
Page 107 of 151
8.6 Organisation and strategy
Organisation and strategy aspect relates to how ADNATCO-NGSCOcan build and benefit
from the organisational capabilities to fully institutionalise energy efficiency in the company.
Organisation and Strategy
Strategy & tactical plans
Roles & responsibilities
Culture & awareness
Competence & training
Cooperation & communication
Integrate with environmental profile
Performance management
During the course of the project, the topic of energy efficiency was discussed with several
employees, including Procurement, HR, Training, Finance, HSEQ, Chartering, Operations,
Technical and shipboard crew and was believed to provide a good representation of how
ADNATCO-NGSCOoperates.
It is clear that ADNATCO-NGSCOhas a strong commitment towards energy efficiency in
management levels. However there appears to be less of a systematic and institutionalised
focus on energy efficiency where the company‟s strategic ambitions and goals should reflect
the desire to continuously improve its use of energy and how that desire is achieved
operationally through measurable goals and thus operational procedures.
Organisation and strategy - In DNV experience, single energy efficiency initiatives such as
propeller polishing or draft optimisation, can be successful in reducing energy consumption
but a company will not be able to realise the full potential of its efforts without addressing the
fundamentals of the organisation.

DET NORSKE VERITAS
Report for ADNATCO-NGSCO
MANAGING RISK Fleet Energy Efficiency Study
Page 108 of 151
Figure 8-49 Overall energy efficiency strategic ambitions
8.6.1 Goals, processes and procedures
8.6.1.1 Observations
ADNATCO-NGSCOhas some
strategic ambitions in place
relating to environmental and
acquisition performance;
however in the context of energy
efficiency, these goals are not
very well defined and therefore
difficult to measure and follow
up.
There is a limited focus on energy efficiency/consumption in operation.
Some KPIs are In place relating to energy efficiency but very ambiguous and not used
in reality.
Lack of formal processes and procedures guiding the organisation in the area of
energy efficiency
Shore organisation shows limited energy efficiency focus
ADNATCO-NGSCOhas opportunities for improvement within all organisational and
strategic aspects regarding energy efficiency

DET NORSKE VERITAS
Report for ADNATCO-NGSCO
MANAGING RISK Fleet Energy Efficiency Study
Page 109 of 151
8.6.1.2 Potential solutions
Define clear top level targets for energy efficiency such as 5% reduction in CO2
emissions per tonNm YoY.
Targets on all levels shall in the best case follow the SMART principle (Specific,
Measurable, Attainable, Realistic and Timely).
Establish and document an overall clear process and procedure relating to energy
efficiency
Review
performance
Initiate
improvement
actions
Set energy
efficiency targets
Bunker
performance
Ship Performance
Voyage
performance
Energy
consumers
Secondary
consumers
Results
achieved
•Cost
•RiskResources•Organisation
•Material
•Documentation
•IT Management
Figure 8-50 : Overall energy efficiency process
Establish guidelines and procedures supporting the
ADNATCO-NGSCOpersonnel in energy efficiency
efforts. This should encompass all aspects of energy
efficiency and could be structured in a energy
management manual and cheat sheets for various
roles on the organisation.
Ensure energy efficiency is present across all
departments on a management and organizational
perspective to ensure accountability and
responsibility is divided appropriately across team
to ensure a unified approach and common
understanding towards goals and strategy.

DET NORSKE VERITAS
Report for ADNATCO-NGSCO
MANAGING RISK Fleet Energy Efficiency Study
Page 110 of 151
8.6.2 Roles and responsibilities
Clearly defined roles and responsibilities with regard energy efficiency performance are
essential in order to have a sustainable and constant focus on energy efficiency over time.
It is vital to understand that energy efficiency is not a one off project but a continuous process
and the roles and responsibility within the ADNATCO-NGSCOneeds to reflect a long term
commitment to energy efficiency.
8.6.2.1 Observations
Currently roles and responsibilities regarding aspects vital for
structured energy efficiency are missing. For example:
Responsibility for energy efficiency is not defined or
delegated
Structured information management is very limited
Definition of reporting, monitoring and improvement
management limited and different between
departments
Responsibility for structural analysis and follow up of consumption is not defined
On an overall level there are allocated responsibilities for operational efficiency aspects
related to the operation of the vessel, however these are not relating directly to fuel efficiency
and are not institutionalised.
8.6.2.2 Potential solutions
Define clear roles and responsibilities addressing energy efficiency for further improvement
by using a RACI matrix. An example is illustrated below: RACI - Chart for a Department
Responsible. Individual(s) who perform an activity - responsible for action. The degree of responsibility is defined by the accountable person
Accountable. The individual who is ultimately accountable. Includes yes/no and power of veto
Consulted. The individual to be consulted prior to final decision or action is taken. Two-way communication
Informed. The individuals who needs to be informed after a decision or action is taken. One-way communication
Man
ag
er
Pla
nn
ing
Off
icer
Te
am
Le
ad
er
As
sis
tan
t
Pa
yro
ll T
ea
m L
ea
de
r
Pa
yro
ll A
ssis
tan
t
We
lfa
re O
ffic
er
Te
am
Le
ad
er
As
sis
tan
t
Te
am
Lead
er
As
sis
tan
t
Te
am
Le
ad
er
As
sis
tan
t
Te
am
Le
ad
er
As
sis
tan
t
Develop annual budget c a r c c c i
Budget approval a c r i
Review SLA a a r c i i
Recalculate Manning Ratios Manning Ratio Tool i a r c c
Define cadet recruitment intake a i i i i
Review T+C for sea staff and adapt as required a c r c c i i
Develop HR policies-as required a c i r i c
Produce annual training and development plan a c r c c i
Overview long term plan of forthcoming crew changes i a r c i
Review dry dock plan against crew change plan c c a r i i
Forecast manning demand and identify recruitment needs a r c i i c
Plan recruitment process a r i c i
Plan IT systems training a c i i i c i i i i i c i i i i r i
Arrange medical appointments for signing on sea staff i a r
Review of certificate expiry dates a i r c i
HR Services
Tools &
TemplatesActivityNote
HR
VP
FM
S
Marine Manning
Operations
Training
BSU
GM
FO
GM
FP
SM
FP
Developmen
tCadet
Man
ag
er
Man
ag
er
Pay/Fin
An
nu
al
Pla
nn
ing
Mo
nth
ly P
lan
nin
g
A
R
I
C
A
C A R C C C I
A C R I
A A R C I I
I A R C C
A I I I I
A C R C C I I
A C I R I C
A C R C C I
I A R C I
C C A R I I
A R C I I C
A R I C I
A C I I I C I I I I I C I I I I R I
I A R
I R C IA Figure 8-51 Matrix (Sample) – Source: DNV
8.6.3 Training, evaluation and follow up
SAMPLE
WHO?
HOW?
WHEN?

DET NORSKE VERITAS
Report for ADNATCO-NGSCO
MANAGING RISK Fleet Energy Efficiency Study
Page 111 of 151
Plan
Closing of
gaps
Define
competence
needs
Business
Goals
and KPIs
Assess
current
competences
Implement
effective
training
Review
results
Map
competence
gaps
People are an organisation‟s most critical asset and
ADNATCO-NGSCOhas a highly committed and focused set of
employees.
Trained, motivated and empowered sea and shore personnel is
the key for continuous energy efficiency. Competence training
and awareness are central to the success of institutionalising
energy efficiency within ADNATCO-NSGCO.
8.6.3.1 Observations
Currently training is focused on personal safety and the environment and has little scope on
the subject of energy efficiency
There is little focus is on energy efficiency in evaluation and feedback procedures to onshore
and onboard crew.
8.6.3.2 Potential solutions
Develop and introduce specific EE training packages:
Targeting all aspects of energy efficiency relative
to ADNATCO-NGSCO
Utilisation of vendor training sessions and
overhaul to leverage energy efficiency
competence
Use competence mapping within EE
Utilise training modules in energy efficiency to
institutionalise an energy efficiency culture. Training in energy related matters are
provided from many vendors. Below an indicative training plan is elaborated:
Training course Potential vendor Target group
Bunker training course DNVPS Bunker purchasers
Superintendents
Chief engineers
On-board bunker and
purification course
Engine manufacturers
Superintendents
Chief engineers
Energy management general
training
DNV advisory
Online solutions like Seagull
All
Engine monitoring and
tuning
Engine manufacturers Superintendents
Chief engineers
Include energy efficiency aspects as one topic in the evaluation scheme for all
personnel.
PEOPLE
PEOPLE
SU
CC
ES
S

DET NORSKE VERITAS
Report for ADNATCO-NGSCO
MANAGING RISK Fleet Energy Efficiency Study
Page 112 of 151
Define SMART KPIs that can be used for evaluation.
8.6.4 Culture and awareness building
Communication is one of the biggest concerns for employees both internally and
externally. Culture and communication need to be addressed to succeed with
energy efficiency and companies need demonstrate they can walk the talk as well
as talk the talk in order to create a sound culture and get buy in from employees.
8.6.4.1 Observations
The culture of focusing on environmental and energy
management aspects is not very present in
ADNATCO-NSGCO.
Data and information relating to vessel operation and
performance is recorded but not utilized to
demonstrate performance nor is there a common and
regular platform for feedback to senders (not full
circle)
8.6.4.2 Potential solutions
A well managed and targeted communication strategy needs to be outlined in connection to
future fuel saving initiatives.
The communication plan should build on the standard and normal ways of communication
within the company. Vehicles for communication can be internet, mails, T-shirts, mugs,
posters etc.
Visualising and communication fuel consumption by billboards in office, posters on vessel
and on line data on bridge is one type of powerful tool in the communication work and
engaging employees in friendly and safe competition can prove to be very effective
Communicated information should be specific and relevant to the person it is being
communicated to.
Walk the talk – ensure that office initiatives and
efforts with respect to energy efficiency is
implemented and visualised in order to demonstrate
commitment and attitude. This can be done by using
awareness campaigns.
Don‟t only focus on the fleet but include offices and
travel as well – leading by example builds a sound
culture. It is suggested that a limited project is
established to address these aspects. It shall be noted
that the main driver for this is not economical return
but rather building an energy conscious image and
culture as part of a generic CSR framework.
Examples of office related activities to lower energy consumption can be:
Source: DNV

DET NORSKE VERITAS
Report for ADNATCO-NGSCO
MANAGING RISK Fleet Energy Efficiency Study
Page 113 of 151
- Travel
Incentive schemes for public
communication/reduce use of cars/car
pools
Increased use of virtual meetings
- IT equipment and server parks
- Ventilation, heating and cooling
optimisation
- Shut down computers and other equipment
- Movement controlled lightning
Fleet Offices and travel
Energy consumed in Polarcus offices and
for travel is a fraction of the total, but the
message is important
Source: DNV
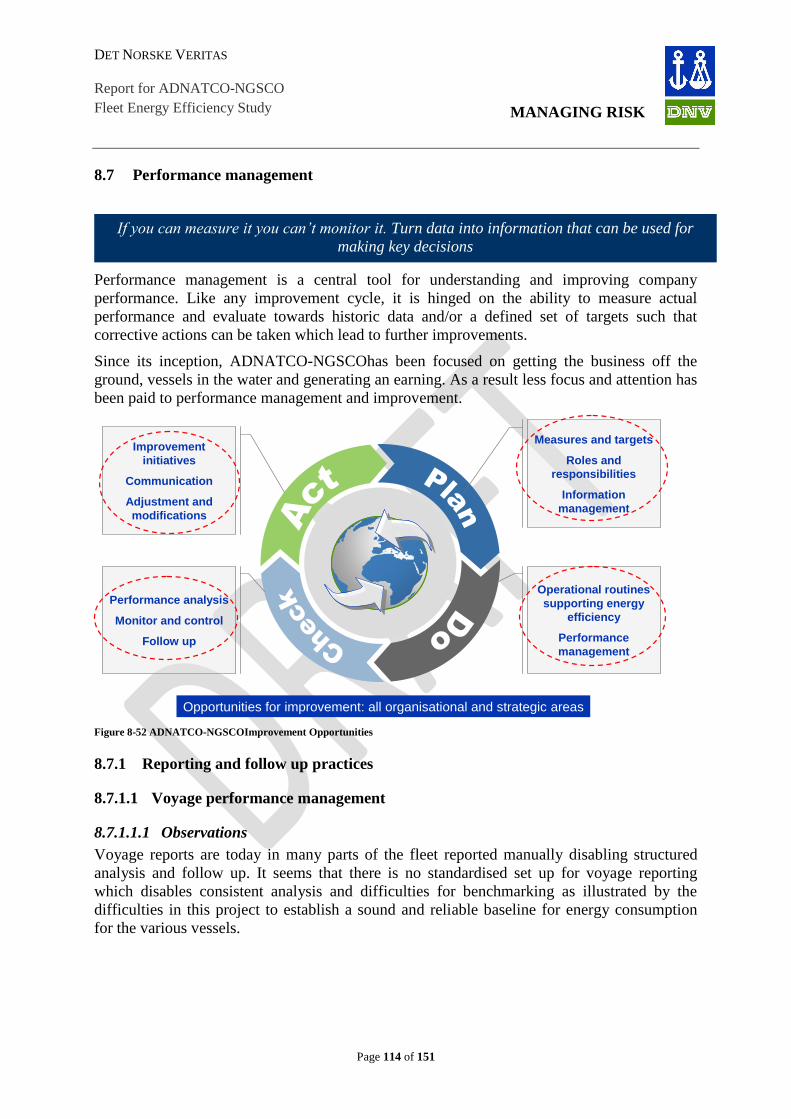
DET NORSKE VERITAS
Report for ADNATCO-NGSCO
MANAGING RISK Fleet Energy Efficiency Study
Page 114 of 151
8.7 Performance management
Performance management is a central tool for understanding and improving company
performance. Like any improvement cycle, it is hinged on the ability to measure actual
performance and evaluate towards historic data and/or a defined set of targets such that
corrective actions can be taken which lead to further improvements.
Since its inception, ADNATCO-NGSCOhas been focused on getting the business off the
ground, vessels in the water and generating an earning. As a result less focus and attention has
been paid to performance management and improvement.
Improvement
initiatives
Communication
Adjustment and
modifications
Performance analysis
Monitor and control
Follow up
Measures and targets
Roles and
responsibilities
Information
management
Operational routines
supporting energy
efficiency
Performance
management
Opportunities for improvement: all organisational and strategic areas Figure 8-52 ADNATCO-NGSCOImprovement Opportunities
8.7.1 Reporting and follow up practices
8.7.1.1 Voyage performance management
8.7.1.1.1 Observations
Voyage reports are today in many parts of the fleet reported manually disabling structured
analysis and follow up. It seems that there is no standardised set up for voyage reporting
which disables consistent analysis and difficulties for benchmarking as illustrated by the
difficulties in this project to establish a sound and reliable baseline for energy consumption
for the various vessels.
If you can measure it you can’t monitor it. Turn data into information that can be used for
making key decisions

DET NORSKE VERITAS
Report for ADNATCO-NGSCO
MANAGING RISK Fleet Energy Efficiency Study
Page 115 of 151
8.7.1.1.2 Possible solution
Establishment of generic template for voyage reporting that is reported ion electronic format.
In the first stage this could be an excel solution as illustrated below.
In later stages it is recommended that a form solution connected to a database input is
established and the finals solution is a system like the Marorka system where values are
automatically transferred to a database form online monitoring equipment on-board.
8.7.1.2 NGSCO primary consumer reporting (monthly)
8.7.1.2.1 Observations
From AL Hamra performance reports of 02/10/2011 and 02/11/2011 are exactly
identical in all readings except the date. When compared with the data in voyage
summary reports, it is evident that one of these two reports is erroneous.
Seemingly no conformance standard related to performance test process:
o Performance report of 20/01/2011 was taken with sea and wind conditions of 4
and 5 respectively , report of 28/03/2011 with sea and wind force of
rough/force 7, report of 24/06/2011 at sea/wind of 6/7.
o Of 11 performance reports analyzed, 8 were taken in ballast passage and 3 in
laden passage.
Missing parameters
o Oxygen content of flue gas is mentioned only in 3 of the 11 performance
reports

DET NORSKE VERITAS
Report for ADNATCO-NGSCO
MANAGING RISK Fleet Energy Efficiency Study
Page 116 of 151
o FO viscosity reading is missing
o Main condenser SW diff pressure reading is recorded only in one performance
report of 19/03/2012.
o Exhaust gas temp readings at Economiser outlet not recorded in performance
reports.
Fuel consumption readings (combined) in most reports are not in conformance with
expected readings, some readings are far too low to be true.
Voyage summary reports studied indicated that soot blowing operation of boilers is
conducted at a far lower frequency than should be expected with the fuel used and
industry best practices.
8.7.1.2.2 Possible solution
Performance reports to be taken in fair weather conditions as much as possible,
unless specific objectives need to be met.
When FO burning is being carried out, even in Dual Mode, it is best practice to
soot blow boilers every alternate day to prevent build-up of soot upstream in
exhaust path.
Performance report data is to be recorded diligently. Ship staff to appreciate
importance of the same.
Fuel consumption to be recorded both for Gas and FO and then the combined
consumption is to be recorded on the reports.
It is recommended that the performance trial is conducted for a period of 1 hour
and flowmeter readings and counters noted and recorded.
Modification to Automatic Combustion Controls (ACC) to be able to operate
Boilers in Gas Mode in Port and low loads.( in line with EU requirements for use
of low sulphur fuels in ports)
8.7.1.3 ADNATCO fuel measuring equipment
8.7.1.3.1 Observations
The ADNATCO fleet have geared positive displacement fuel meters installed but not certain
on equipment readings. No vessel sin the fleet have coriolis meters installed or Torque meters
installed.
In addition not possible to follow up kWh production on the generators.
8.7.1.3.2 Possible solution
o achieve overview over the engine performance basically two
parameters that is required:
How much fuel is consumed by the engines
o Coriolis meter installed

DET NORSKE VERITAS
Report for ADNATCO-NGSCO
MANAGING RISK Fleet Energy Efficiency Study
Page 117 of 151
o Phased upgrade when applicable
How much energy do the engines produce.
o Torque meter on the propeller shaft
o kWh meters on the generators
Institutionalising this set of equipment in the fleet will convey correct and accurate fuel
measurement that can be trusted for analysis and optimisation.
It will also be possible to install slave monitor on bridge for momentary illustration of fuel
consumption (DNV currently working with operator where bunker cost will be integrated so
that live costs will show on bridge).
8.7.1.4 ADNATCO engine analysis tools
8.7.1.4.1 Observations
The established format is
good and consistent
(except for fuel
consumption for
auxiliary engines).
However, utilising the
reported data for
systematic follow up can
be improved. It shall be
mentioned that
ADNATCO utilises
same sheet used in entire
fleet which is very
positive.
There is limited guidance
related how to do the
performance testis,
ambient conditions
etcetera, much up to the
vessel crew to ensure
that data is recorded in a
structured manner.
Vessel Name: M/T "UmmAl Lulu1"
(5400 KW at 100% MCR) Condition: Loaded
Vessel Name: M/T "Umm Al Lulu 1 Date:
Trial Duration hrs 1,0 Compression pressure 1 bar 143 Peak pressure 1 bar 155
RPM (lever pos 10 = 90% load) rpm 498 Compression pressure 2 bar 144 Peak pressure 2 bar 158 Date of Trial 13-nov-11 ME DA IN DA OUT
Indicated power kW 5 006 Compression pressure 3 bar 144 Peak pressure 3 bar 155 RPM during trial 498,0 6328964 #REF! #REF! start
Shaft generator power (Loaded) kW 250 Compression pressure 4 bar 141 Peak pressure 4 bar 154 Spring size Dr.Diesel 6329913 #REF! #REF! finish
Actual % MCR % 93 Compression pressure 5 bar 142 Peak pressure 5 bar 156
165,0 Compression pressure 6 bar 143 Peak pressure 6 bar 158
Cylinder oil consumption per day L/d N/A Mean compression pressure bar 142,8 Mean peak pressure bar 156,0 Cylinder Pmax Pcomp Area Length MIP ikW kW
Governor arm on engine 3 0,0 0,0 0
Draught, Fwd m 7,3 M.I.P.1 bar 22,63 Fuel Rack 1 mm 52 4 0,0 0,0 0
Draught, Aft m 7,3 M.I.P.2 bar 22,50 Fuel Rack 2 mm 53 5 0,0 0,0 0
Displacement mt 18131,0 M.I.P.3 bar 23,17 Fuel Rack 3 mm 51 6 0,0 0,0 0
Vessel condition Loaded / Ballast Loaded M.I.P.4 bar 22,42 Fuel Rack 4 mm 52 7 0,0 0,0 0
Ship's speed kts 11,8 M.I.P.5 bar 22,52 Fuel Rack 5 mm 51 8 0,0 0,0 0
Sea Temperature °C 33,0 M.I.P.6 bar 22,57 Fuel Rack 6 mm 52 Average 0,0 0,0 0 Total 0 0
ER Air Temperature °C 34,0 Mean M.I.P. 22,64 Mean Fuel Rack mm 51,8
Outside air temperature °C 25,0 Total kW 5 006
Barometric Pressure mb 1032,0 Total HP 6 808
Wind force / direction 5/S
Turbo-charger rpm 19500,0 kW as a percentage of MCR 92,7 % MCR
Lub Oil Pump Disch/Suct Press bar 5,2 Exhaust Temperature 1 °C 386 Exhaust Temperature 1 °C
LO Pressure at engine bar 4,8 Exhaust Temperature 2 °C 418 Exhaust Temperature 2 °C Quantity of Fuel Used 0,949 Cubic Meters
LO Pressure at T/C bar 4,9 Exhaust Temperature 3 °C 405 Exhaust Temperature 3 °C Duration of Trial 1,0 Hours
Fuel Oil Pressure bar 6,1 Exhaust Temperature 4 °C 411 Exhaust Temperature 4 °C Density of fuel 0,9489 (380sCt )
JW Pressure bar 2,9 Exhaust Temperature 5 °C 395 Exhaust Temperature 5 °C SG at 140 °C 0,8702
LT Pressure bar 4,2 Exhaust Temperature 6 °C 386 Exhaust Temperature 6 °C Fuel Consumption per Day 19,8 Metric Tonnes
SW Pressure bar 3,5 Mean Temperature °C 400,2 Mean Temperature °C Specific Fuel Consumption 165,0 g/kW.Hr 121,3 g/BHP.Hr
Scavenge Pressure bar 3,5 Exhaust Temp Inlet T/C °C Exh temp before EGB °C 325
Scavenge Manifold Temp °C 46,0 Exhaust Temp Outlet T/C °C 338 Exh temp after EGB °C 275 Cylinder Oil Consumed #REF! Litres
LO Temp Before Engine °C 56,0 Cyl Oil Consumption per Day #REF! Litres
Specific Cyl Oil Consumption #REF! g/kW.Hr #REF! g/BHP.Hr
Fwd/Aft NOTES:
Jacket FW Temp Inlet °C 61,0 HT Cooler LT In °C 43 LT Cooler LT In °C 36 MIP =
Jacket FW Temp Outlet Max °C 78,0 HT Cooler LT Out °C 39 LT Cooler LT Out °C 35 length of card x spring constant 0,949 = Total cons
Jacket FW Temp Outlet, Min °C 78,0 HT Cooler FW In °C 74 LT Cooler SW In °C 32 #REF! = Minus DA cons
Thrust °C 42,0 HT Cooler FW Out °C 61 LT Cooler SW Out °C 39 MIP = 370 mm² #REF! = ME cons
Stern Tube °C 44/47 Controller set point / actual °C Controller set point / actual °C 76mm x 0.3
Fuel Oil Temp °C 140,0
Fuel Oil Viscosity at engine cSt 15,0 ER temperature (T/C AIR IN) °C 34 LO Cooler LT In °C 49 cylinder constant = 0.2245 (Engine manual Volume 1 Operation 706-05 page 3)
Fuel Oil SG @ 15°C 0,9489 Air cooler air In °C 178 LO Cooler LT Out °C 62 Indicated Power = MIP x cylinder constant x RPM
Air cooler pressure drop mm Air cooler air Out °C 46 LO Cooler LO In °C 74 Effective Power = (MIP - 1 bar) x cylinder constant x RPM
T/C intake pressure drop mm Air cooler LT In °C 39 LO Cooler LO Out °C 60 100% Effective Power = 5920kW
EGB gas pressure drop mm Air cooler LT Out °C 42 Controller set point / actual °C
Comments:
FWG running: Yes Engine Speed @ 95% load = 500 RPM
Any Other Comments: Shaft Speed @ 95% load = 160 RPM
Trial start time: 11:00 Trial Finish Time: 12:00 Total Trial Time: 1 Hr
F.O. Start (Reading From Flowmeter): Ltrs
F.O. Finish (Reading From Flowmeter): Ltrs
(This consumption is only for ME )
FUEL COUNTERS
Area of card Fuel Meter Calculations
REC 16: M.E. 85% Power Trial
LO COOLER x 1ME AIR COOLER x 1
Daniel Worytkiewicz
13-nov-11
6328964
6329913
Chief Engineer:
in cubic meters
(shaded cells are filled in automatically)
HT COOLER x 1 LT COOLER x 2
Chief Engineer:
Specific fuel consumption g/kW Hr

DET NORSKE VERITAS
Report for ADNATCO-NGSCO
MANAGING RISK Fleet Energy Efficiency Study
Page 118 of 151
“What’s measured gets done”
Thomas Peters
“If you can’t measure it, you can’t manage it”
Peter Drücker
8.7.1.4.2 Possible solution
Use the performance tests for systematic trending of performance and follow up of fuel
economy and establish guidelines of how to take performance test to ensure consistent follow
up.
8.7.2 Performance follow up
8.7.2.1 Observations
ADNATCO-NGSCOhas one [sic!] KPI on energy
efficiency established on overall reporting, and few know
how to interpret this measure. And no one is using it for
follow up on fuel consumption.
A lot of good data is either reported or logged manually or
on predefined formats, but this data is not interpreted into
information that can be used for taking decisions and
actions.
8.7.2.2 Potential solutions
In order to do improve ADNATCO-NGSCOshould employ a development program in 2
steps:
Step1 – define the KPIs
Define a set of energy efficiency key performance indicators in a hierarchical format
where the top level is linked to the company‟s vision and value drivers.
The KPIs need to be SMART (Specific, Measurable, Achievable, Relevant and Time
bound) and designed to achieve the following:
- Encourage desired behaviour
- Fully integrated and aligned with all other operating measures
- Quantifiable and balanced
- Set at the level where decisions that affect the measurement are made
The KPIs shall be possible to extract on:
- company level,
- fleet level and,
- vessel level
DNV have worked with a number of operators developing KPI system for energy
performance follow up. ADNATCO-NGSCOrequires a common performance management
system where data is retrieved from numerous relevant sources and is transformed into

DET NORSKE VERITAS
Report for ADNATCO-NGSCO
MANAGING RISK Fleet Energy Efficiency Study
Page 119 of 151
information and KPIs that can be used in evaluation and action taking. The system should be
set up to be able to provide access to relevant and accurate information set at the appropriate
level for the persons accessing it. DNV suggest ADNATCO-NGSCOto use the above KPIs in
a hierarchical matter whereby the KPIs are propagated downwards to the relevant functions
in the organisation. I.e. temperature balance on the Engines is not something the CEO should
need to monitor, and maybe not even the Maritime Manager. This could however be a KPI
attributed for the Chief Engineer only, or maybe even the Superintendent. Further
development and implementation of this framework should get high priority in Phase 2 and 3
of ADNATCO-NSGCO‟ Energy Efficiency Project. It is instrumental to be able to set a
baseline and measure change in any improvement initiative.
Further refining and implementing the performance management framework should be
ADNATCO-NSGCO‟ main priority in going into a Phase 2 Energy Efficiency Project.
Figure 8-53: Possible Future Performance Management Concept

DET NORSKE VERITAS
Report for ADNATCO-NGSCO
MANAGING RISK Fleet Energy Efficiency Study
Page 120 of 151
Figure 8-54: Detailed KPI analysis
The figure above shows potential future scenario for ADNATCO-NSGCO‟s future
performance management system. The general idea is that all the data is disseminated in a
single “Data Mining Engine”. Whether this is placed onboard the vessels or if it is all
collected on shore, depends on the preferred IT infrastructure ADNATCO-NGSCOchoose.
Another benefit of collecting all the data to a single database is that it allows for potentially
reducing one or more data entry points. I.e. the current hand written voyage reports being
generated daily by the crew, can be integrated into overall reporting, and therefore one whole
reporting stream can be reduced. This must be further reviewed in Phase 2 of the Energy
Efficiency Project.
The IT logistical solution needs to be tailored based on the KPIs that ADNATCO-
NGSCOwishes to monitor and disseminate rather than vice versa.
8.7.2.3 Expected benefits
Enable better oversight of how energy is being consumed during each operational
mode and what effect situations such as weather and current has on performance.
Enables benchmarking of performance and thereby continuous improvement in terms
optimizing energy consumption, reduction of emissions and improved budgeting for
future contracts
Communicating improvements and demonstrating how ADNATCO-NGSCOis
“walking the walk” regarding environmental performance.
Providing visualisation and up to date reference points in relation to specific KPIs
relating to energy efficiency

DET NORSKE VERITAS
Report for ADNATCO-NGSCO
MANAGING RISK Fleet Energy Efficiency Study
Page 121 of 151
9 THEORETICAL CALCULATION OF EEDI
The EEDI has been introduced by the IMO to promote environmental friendly ship design.
The IMO EEDI is a benchmarking scheme and an indication of a merchant ship‟s CO2 output
in relation to its value for the society and is expressed as follows:
Currently the calculation of EEDI is only intended for new buildings and will become
mandatory for all newbuilds started after January 2013. The requirements and process for the
calculation of the EEDI is relatively complex, involved and costly. However a voluntary
estimated theoretical calculation can be done on ship types already in operation based on the
formula without sea trials and verification in order to provide an estimated EEDI value for
internal reference.
DNV has calculated the estimated theoretical Energy Efficiency Design Index (EEDI) value
for each vessel type applicable as per the IMO Guidelines and plotted its position in relation
to the IMO reference line for the respective fleet types.
Based on the guideline certain vessel types and means of propulsion are currently not to be
considered and for ADNATCO-NGSCO these are as follows:
Gas carriers having Turbine based propulsion, hence all the LNG vessel
RoRo vessels
Chemical tankers having less than 20000DWT
Thus the following vessel type calculations were carried out as a representation of the
ADNATCO-NGSCO fleet that can be considered for EEDI.
As can be seen from the calculations for those applicable vessels, most are competitive in the
market at least after implementation of the EEDI first phase.

DET NORSKE VERITAS
Report for ADNATCO-NGSCO
MANAGING RISK Fleet Energy Efficiency Study
Page 122 of 151
9.1 Tankers
The required EEDI‟s are follows: 4.3 for DWT 105200 and 5.1 for DWT 73700
The above show the tanker fleet is also competitive in the market after EEDI
implementation of January 2013.
9.2 Bulk carriers
The required EEDI are as follows: 5.2 for DWT 577000 and 6.4 for DWT 37000
The above show these bulk vessels are also competitive in the market after EEDI
implementation of January 2013.
The required EEDI are as follows: 6.8 for DWT 32027 and 7.5 for DWT 26387

DET NORSKE VERITAS
Report for ADNATCO-NGSCO
MANAGING RISK Fleet Energy Efficiency Study
Page 123 of 151
The above show these bulk vessels will not be competitive in the market after EEDI
implementation of January 2013 if the clients are comparing EEDI values.
Certain measures are available to improve this position such as installation of energy
saving devices however this should be considered carefully based on a cost benefit
analysis.
9.3 Container
The required EEDI is as follows: 25.7 for DWT 13600
The container of DWT 13600 is below the required by approximately 20% which
shows that this vessel is competitive with new build vessels following implementation
of EEDI Phase 2 in January 2020 up to 2025.
Below are the assumption made during the process of calculating the theoretical EEDI values:
Assumptions :
1. No mechanical and electrical efficiency improvement methods /devices
2. No PTI/PTO
3. Gas carriers which are having Turbine based propulsion are not Considered for EEDI calculation
4. RO-RO vessels are not considered for EEDI calculations
5. Chemical Tankers which are having less than 20000DWT are not considered for EEDI Calculation
6. Auxilary engine power is taken as 2.5% of Main Engine MCR+250 for engines more than 10000kW
7. Auxilary engine power is taken as 5% of Main engine MCR for engines less than 10000kW
8. SFC for Main engine is considered as 183g/kWh
9. SFC for Main engine is considered as 210g/kWh
10. HFO is considered as Fuel for all vessels
11. Carbon factor CF is taken 3.114
12.P_ME is taken as 75%of MCR
13. For Conatiner ship the capacity is taken as 70%of the DWT
14. It is assumed that SFC for Main engine and auxilary engine is same.

DET NORSKE VERITAS
Report for ADNATCO-NGSCO
MANAGING RISK Fleet Energy Efficiency Study
Page 124 of 151
10 CALCULATION OF THE EEOI
The shipping industry burns approximately 335 million tonnes fuel per
year whilst transporting 85% of the world‟s goods. This can be
associated with the emissions of around 1 billion tonnes of CO2 per
year. If the shipping industry was a country then based on the below
graph, it would emit more than Germany per year.
International politics and stakeholder pressure has force the IMO to put measures in place to
curb the emissions from the shipping industry and as a result numerous requirements have
been and are going to be brought into force. One of these is the Energy
Efficiency Operational Inicator (EEOI). The formula is as follows:
The EEOI value provides more of a helicopter perspective rather then looking at an individual
ship and should be used as an efficiency parameter on a fleet level rathre than to assess an
individual ship performance. However, in DNV‟s experience, it is seen that this measure is
increasingly being asked for in a commercial setting and hence it will be important for
ADNATCO-NGSCO to understand, calculate and monitor this for all ships going forward.
As part of the scope of this project, DNV has clacluated each vessel EEOI from data provided
for the year 2011 in order for ADNATCO-NGSCO to establish a baseline for each vessel.
10.1 Utilising the EEOI value for Energy Efficiency analysis
10.1.1 Establishing an EEOI reference
Based on the methodology developed by the Clean shipping project
(http://www.cleanshippingproject.se/) it is possible to establish a reference/target value for
EEOI. The methodology is based on establishing the EEDI based on the reference
Figure 10-1 : Global CO2 Emissions - 2006

DET NORSKE VERITAS
Report for ADNATCO-NGSCO
MANAGING RISK Fleet Energy Efficiency Study
Page 125 of 151
curve(function between vessel deadweight and emitted grams CO2 per tonneNm) and the
account for operational factors (average load and payload ratio for the segment).
EEDI reference values:
General cargo EEDI = 290.28dwt – 0.33
Reefer (gen. cargo) EEDI = 290.28dwt – 0.33
Bulk EEDI= 1354dwt – 0.5117
Tanker EEDI = 1950.7dwt – 0.5337
Container EEDI = 139.38dwt – 0.2166
RoRo EEDI = 20528dwt – 0.7165
Car carrier (RoRo) EEDI= 20528dwt – 0.7165
Load factor:
General cargo 0.6
Reefer 0.6
Bulk 0.6
Tanker 0.55
Container 0.8
RoRo 0.88
Car carrier 0.9
Payload ratio:
General cargo 0.9
Reefer 0.9
Bulk 0.9
Tanker 0.95
Container 0.8
RoRo 0.5
Car carrier 0.25
Based on the above a EEOI reference value based on EDI and operational factors can be
established:
EEOIref = EEDI / (load factor * payload ratio).
The vessel specific EEOI obtained can then be compared with the reference value and
performance assessed.
10.1.2 CO2 emission based on Clean Cargo Working Group methodology
Another method for calculating CO2 performance is using the Clean Cargo Working Group
(CCWG) methodology. The methodology is only applicable for container vessels and using
the process outlined by the CCWG. In this case the reference values are defined by CCWG as
outlined below. DNV is carrying out verification of utilisation of CCWG methodology for
many big container operators.

DET NORSKE VERITAS
Report for ADNATCO-NGSCO
MANAGING RISK Fleet Energy Efficiency Study
Page 126 of 151
Standardized trade laneCCWG Average
(g CO2/ TEUkm)
Asia – Africa 81.7
Asia – Mediterranean 83.1
Asia – Middle East/India 92.8
Asia – North America EC* 89
Asia – North America WC** 82.8
Asia – North Europe 74.4
Asia – Oceania 91.8
Asia – South America (EC/WC) 90.4
Europe (North& Med) – Africa 108.5
Europe (North& Med) – Middle East/ India 92
Europe (North& Med) – Oceania (via Suez/via Panama) 98.7
Europe (North& Med) – Latin America/ South America 86.4
Intra –Americas (Caribbean) 109.1
Intra – Asia 104.1
Intra – Europe 117.7
Mediterranean – North America EC (incl. Gulf) 86.9
Mediterranean – North America WC 69.5
North America EC – Middle East/ India 88.2
North America – Africa 119.6
North America – Oceania 103.1
North America –South America (EC/WC) 92.1
North Europe – North America EC (incl. Gulf) 97.2
North Europe – North America WC 89.5
South America (EC/WC) – Africa 80.5

DET NORSKE VERITAS
Report for ADNATCO-NGSCO
MANAGING RISK Fleet Energy Efficiency Study
Page 127 of 151
10.1.3 ADNATCO-NGSCO Baseline
The objective going forward is to continue to calculate and monitor this metric and through
technical and operational measures and opportunities covered in this report, continue to
improve upon the baseline and hence reduce the CO2 emitted for the work done.
It is recommende that ADNATCO-NGSCO establish EEOI statistics and acceptance
criteria for each vessel EEOI, as outlined in the 8.7.2, so as to continuosly monitor
performance including the IMO reference value for the vessel in question, as
illustrated below:
10.2 Sample calculations
Below are a selection of 3 vessels in the ADNATCO-NGSCO fleet for quick reference. For
all vessels please refer to the appendix.
Figure 10-2 : EEOI Al Samha for 2011
As can be seen from Al Samha, currently operating in general above the IMO EEOI reference
value for the vessel.

DET NORSKE VERITAS
Report for ADNATCO-NGSCO
MANAGING RISK Fleet Energy Efficiency Study
Page 128 of 151
As can be seen for Umm Al LuLu, operationg at almost double the IMO EEOI reference
value for the vessel and hence there is much room for improvement.
Currently there does not exist an IMO EEDI reference value for vessels powered by steam
turbines and hence no established IMO EEOI reference value can be created for the LNG
vessels however this will come in time as the IMO develops. It may be worthwhile discussing
with industry peers with similar vessels to establish a common average reference value to
benchmark against.
Figure 10-3 : EEOI Umm Al Lulu 2011
Figure 10-4 : EEOI LNG Shahamah 2011

DET NORSKE VERITAS
Report for ADNATCO-NGSCO
MANAGING RISK Fleet Energy Efficiency Study
Page 129 of 151
11 PRIORITISATION OF OPPORTUNITIES
11.1 Assessment of initiative complexity
In order to provide a prioritisation of the initiatives DNV employ a rating of implementation
complexity of each initiative in 4 dimensions where have a relative weight:
Investment in 3 categories (Weight 50%)
- High, >10,000 USD/vessel Rated as 1
- Medium, 2,000<x<10,000 USD vessel Rated as 5.5
- Low <2,000 USD /vessel Rated as 10
Procedure Changes Needed in 2 categories (Weight 10%)
- Competence Change Rated as 1
- Procedure Change Rated as 10
Direct Measurability in 2 categories (Weight 30%)
- No Rated as 1
- Yes Rated as 10
Department Involvement in 3 categories (Weight 10%)
- Corporate Rated as 1
- Cross departmental Rated as 5.5
- N/A Rated as 10
As can be seen from the table on the following page, each initiative has been rated in the 4
dimensions highlighted above, combining the rating with the weight, provides a measure of
ease of implementation, where maximum score is 10 representing the least difficult to
initiate. Where as 1 indicates significant implementation complexity.
Combining the implementation complexity with the savings potential as outlined in
subsequent chapter provide a prioritisation matrix for ADNATCO-NGSCOthat can underlie
the planning of way forward activities. The implementation complexity rating is outlined in
subsequent table.

DET NORSKE VERITAS
Report for ADNATCO-NGSCO
MANAGING RISK Fleet Energy Efficiency Study
Page 130 of 151
Area Area Weighting Area Weighting Area
50%
Procedure
Changes
Needed
10%
Direct
Measurabilit
y
30% 10%
1.
H igh
>10,000
USD / vessel
5
M edium
2,000<x<
10,000
USD
vessel
10.
Lo w
<2,000 USD
/ vessel
1.
C o mpetence
C hange
10.
P ro cedure
C hange
1.
N o
10.
Yes
1.
C o rpo rate
5
C ro ss
department
al
10.
N / A
Score Weighted
ScoreScore
Weighted
ScoreScore
Weighted
ScoreScore
Weighted
Score
Voyage Performance
Voyage Planning and Speed Management 10 5 1 0.1 10 3 5 0.5 8.6 1.2%
Chartering and Contracts 10 5 10 1 10 3 5 0.5 9.5 0.0%
Weather Routing 1 0.5 10 1 10 3 10 1 5.5 0.9%
Autopilot Settings 10 5 10 1 1 0.3 10 1 7.3 0.9%
Port Operations 1 0.5 1 0.1 1 0.3 1 0.1 1 0.0%
Ship PerformanceSea Trials 5 2.5 1 0.1 1 0.3 10 1 3.9 0.0%
Propeller Polishing 5 2.5 10 1 1 0.3 10 1 4.8 0.4%
Hull Condition 1 0.5 1 0.1 1 0.3 10 1 1.9 0.7%
Draft Optimization 10 5 10 1 10 3 10 1 10 0.3%
Trim Optimization 5 2.5 10 1 10 3 10 1 7.5 3.5%
Energy Efficiency Devices 1 0.5 1 0.1 1 0.3 10 1 1.9 0.0%
Primary Energy Consumers
LNG Plant Performance 5 2.5 10 1 10 3 10 1 7.5 5.4%
LNG Plant Performance 10 5 10 1 10 3 10 1 7.5 0.5%
LNG Main Boiler Combustion Air System Air Heaters 10 5 10 1 10 3 10 1 10 0.4%
LNG Combustion Air System Forced Draught Fans and Furnace 10 5 10 1 10 3 10 1 10 0.8%
LNG Flue Gas Oxygen Content/Smoke Indicators - Exhaust System 10 5 10 1 10 3 10 1 10 0.8%
LNG Main Turbine Performance 10 5 10 1 10 3 10 1 10 0.0%
LNG Main Condenser-Performance 10 5 10 1 10 3 10 1 10 1.6%
LNG Condensate Feed System 10 5 10 1 10 3 10 1 10 0.8%
LNG Auxiliary Engine Utilization 10 5 10 1 10 3 10 1 10 0.5%
Main Engine Performance 10 5 10 1 10 3 10 1 10 0.5%
Auxiliary Engine Performance 10 5 10 1 10 3 10 1 10 0.2%
Auxiliary Engine Utilization 10 5 10 1 10 3 10 1 10 0.3%
Auxiliary Boiler Utilization and Performance 10 5 10 1 10 3 10 1 10 0.0%
Economiser Performance 10 5 10 1 10 3 10 1 10 0.0%
Secondary Energy Consumers
Secondary Consumer Performance 10 5 10 1 1 0.3 10 1 7.3 0.1%
Variable Speed Drives 5 2.5 1 0.1 10 3 10 1 6.6 0.1%
Low Energy Appliances 5 2.5 1 0.1 10 3 10 1 6.6 0.02%
Fuel Management
Understanding Fuel Specifications 5 2.5 1 0.1 1 0.3 5 0.5 3.4 1.5%
Fuel Ordering 5 2.5 1 0.1 10 3 5 0.5 6.1 1.5%
Systematic Benchmarking of Fuel Quantity 5 2.5 1 0.1 10 3 5 0.5 6.1 1.5%
Statutory and Environmental Risk 10 5 1 0.1 1 0.3 5 0.5 5.9 0.0%
Fuel Quality Testing 1 0.5 1 0.1 10 3 5 0.5 4.1 2.0%
Fuel Training 5 2.5 1 0.1 1 0.3 5 0.5 3.4 0.5%
Saving
%
Investment costDepartment
Involvement
Initiative
Weighting Weighting
Ease of
Implementa
tion
Figure 11-1 : Implementation Complexity of initiatives for ADNATCO-NGSCO– Source: DNV

DET NORSKE VERITAS
Report for ADNATCO-NGSCO
MANAGING RISK Fleet Energy Efficiency Study
Page 131 of 151
11.2 Prioritisation of initiatives
By combining information of the savings table and the assessment of implementation
complexity for each initiative, a prioritisation matrix has been established as shown below.
The ambition of the prioritisation matrix is to assist ADNATCO-NSGCO‟ decision making
process:
The prioritisation matrix is divided in 4 quadrants to facilitate the prioritisation of activities
for next phase. The quick win activities are identified in the prioritisation matrix.
Quick Wins to
Focus on 1st
Figure 11-2 : Fuel efficiency prioritisation matrix

DET NORSKE VERITAS
Report for ADNATCO-NGSCO
MANAGING RISK Fleet Energy Efficiency Study
Page 132 of 151
12 WAY FORWARD
To define the way forward for ADNATCO-NGSCO energy efficiency opportunity DNV
suggest creating a 5 year Energy Efficiency Strategy with defined KPI‟s at various levels of
the organisation:
This strategy must be accompanied with an implementation plan in 3 phases. The ambition
with this set up is to limit organisational stress and ensure the correct results.
Quick Win Phase - Low implementation complexity initiatives rapid
implementation
- Direct implementation of low complexity initiatives that will immediately
strengthen ADNATCO-NGSCO energy operations.
- Does not have to be driven as projects but rather definition of action and way
of working combined with targeted implantation
- Implementation of the SEEMP‟s and communication and awareness thereof
Phase 2 - Energy efficiency enabler implementation
- Definition and establishment of enablers for energy efficiency initiatives
- This task is more comprehensive and DNV suggest to set this up as dedicated
project(s)
Phase 3 - Energy efficiency project definition
- Dedicated project implementation of higher complexity initiatives based on
prioritisation matrix
- This task is more comprehensive and DNV suggest to set this up as dedicated
project(s)
In the subsequent section a suggested way forward is outlined for ADNATCO-NSGCO. This
is not a complete project plan but an overall layout of how ADNATCO-NGSCO can address
this aspect in further work. A detailed project plan needs to be established describing
exhaustively how the work will be managed, expected result, budget, timeline etc.
An information and communication plan connected to performance management need to
shadow the project plan.

DET NORSKE VERITAS
Report for ADNATCO-NGSCO
MANAGING RISK Fleet Energy Efficiency Study
Page 133 of 151
12.1 Quick Win Phase - Low implementation complexity initiatives rapid
implementation
DNV suggest the following initiatives for Rapid implementation based on low
implementation complexity:
1. Voyage planning and speed management
Establish a framework and market based tool to determine optimal voyage speeds
and plan and adjust voyages accordingly with a continuous monitoring and
follow up regime set in place
2. Autopilot settings and weather routing systems
Optimize adaptive settings to allow for minimal rudder adjustments and
institutionalize a common practice across entire fleet and investigate the market
for weather routing systems from vendors
3. Propeller polishing
Institutionalize across ADNATCO fleet every 6 months
4. Trim & Draft optimization
Trial and error and team experience to find optimal trim and draft settings for
ADNATCO fleet and set guidelines and easy to use reference tables and
guidelines across all vessels. Similarly for Draft on LNG‟s
5. LNG Plant performance monitoring framework
With defined “good” performance parameters set and monitor and follow up
6. Fuel Ordering and Systematic Benchmarking of quality
Carry out a RACI process to map responsibilities for the whole fuel ordering
process and create a list of reputable suppliers instead of only approve brokers
7. Implementation of the SEEMP‟s and communication and awareness thereof
As part of this project delivery the SEEMP‟s are produced for each vessel
containing the quick wins and targets set.
DNV recommends that the requirements of a dedicated project manager role and candidate
should be considered at this stage with possible implementation by Phase 2 so as to facilitate
and have a focus on implementation of the initiatives outlined in the report.
12.2 Phase 2 Energy efficiency enabler implementation
Enablers for energy efficiency need to be institutionalised before implementation of more
complex initiatives. DNV suggest dividing this work in 3 streams:
1. Establishing of Processes, roles and responsibilities
2. Training and awareness
3. Implementation of performance management system (content as well as IT
systems)
4. Establishment and implementation of guiding documentation and training

DET NORSKE VERITAS
Report for ADNATCO-NGSCO
MANAGING RISK Fleet Energy Efficiency Study
Page 134 of 151
12.3 Phase 3 Energy efficiency project definition
On a general note DNV‟s experience shows that limiting focus on defined activities is more
fruitful then trying to address all aspects at once. Based on the prioritisation of initiatives
DNV suggest addressing the following aspects in a first phase of ADNATCO-NGSCO energy
efficiency program (no intermutual order):
1. Chartering and Contracts
2. Port Operations
3. Sea Trials
4. Hull Condition
5. Energy Efficiency Devices
6. Main Engine Performance
7. Auxiliary Engine Performance
8. Auxiliary Engine Utilization
9. Auxiliary Boiler Utilization and Performance
10. Economiser Performance
11. Secondary Consumer Performance
12. Variable Speed Drives
13. Low Energy Appliances
14. Understanding Fuel Specifications
15. Statutory and Environmental Risk
16. Fuel Quality Testing
17. Fuel Training
The illustration below represents the way forward for ADNATCO-NGSCO based on time and
potential fuel savings that can be realised by initiating and implement the prioritised
initiatives and enablers.

DET NORSKE VERITAS
Report for ADNATCO-NGSCO
MANAGING RISK Fleet Energy Efficiency Study
Page 135 of 151
Figure 12-1 : Way forward plan

DET NORSKE VERITAS
Report for ADNATCO-NGSCO
MANAGING RISK Fleet Energy Efficiency Study
Page 136 of 151
13 CONCLUSION
ADNATCO-NGSCO has gone through a rapid growth in terms of fleet expansion over the
last couple of years and the organisation is currently settling for more stable conditions.
However when benchmarked on Energy Efficiency against the industry there are a number of
aspects needing to addressed in order to meet and potentially beta the industry average in this
respect. Given that no solid framework was identified to be in place with regard to energy
efficiency, numerous saving potentials were identified for ADNATCO-NGSCO to optimise
the energy consumption. A total of 21% savings for entire fleet was identified which
translates into the following:
129,333 tonnes of fuel per year for entire fleet
US$ 93.3 million per year based on current estimated fuel price of US$720/MT
(HFO) and US$1040/MT (MGO)
402,857 tonnes of CO2
The opportunities identified during the process of this project were found to be a mixture of
management and organisational related initiatives as well as technology and hardware and in
order for ADNATCO-NGSCO to realise the benefits of these, certain enablers will need to be
put into place whilst others can be easily carried out with quick returns (quick wins). A way
forward plan must be established in order to clearly identify how these initiatives can become
effective and the benefits realised, for which DNV has produced a high level approach as seen
in Chapter 12, where this will serve as a good starting point. However, ADNATCO-NGSCO
must take this further to more clearly define a plan that takes into account time constraints,
budgetary concerns, roles and responsibilities, training needs, effective communication at the
right level and that clearly sets the target and limits for all concerned employees.
It is recommended, that in order to have a focus and control over energy efficiency, a
dedicated project manager should be assigned to initiate these initiatives and gain some
momentum within ADNATCO-NGSCO. Ideally this role should be outside of the daily
operations such that a focus can be maintained without distractions of daily operational
concerns. This role should be instrumental in institutionalizing energy efficiency within
ADNATCO-NGSCO to become a leading and sustainable performer.

DET NORSKE VERITAS
Report for ADNATCO-NGSCO
MANAGING RISK Fleet Energy Efficiency Study
Page 137 of 151
14 REFERENCES
“List to be completed on issue of final report”
1. Case vessel Technical Performance Reports
2. Case Vessel technical information
3. Chief Engineers reports
4. ME and DA monthly load test reports
5.
6.
7.
8.
9.
10.
11.
12.
13.
14.
15.

DET NORSKE VERITAS
Report for ADNATCO-NGSCO
MANAGING RISK Fleet Energy Efficiency Study
Page 138 of 151
15 APPENDIX
15.1 ADNATCO-NGSCO Fleet List
SHIP PARTICULARS
Length
Overall
Beam Max
Draft
Main Engines MCR
rating
Oil Tankers
Abu Dhabi - III
243.98m 42.0m 15.33m Hyundai B&W 6S60MC-C8 14,280 kw x
105 RPM
Liwa-V
243.99m 42.036m 15.33m Hyundai B&W 6S60MC-C8 14,280 kw x
105 RPM
Bulk Carriers
Al habiyyah
178.16m 27.5m 11.399m MAN B&W 6L67GFCA
9600BHp@123 RPM 13100 BHp
Abu Al Abyad
190.00m 32.26m 13.271m STX MAN B&W 6S50MC-C
9480 Kw in 127 RPM 12700 BHp x
127 RPM
Al Yasat-II
190.00m 32.26m 13.271m STX-MAN B&W 6S50MC-C
(MK VII) 12700 BHP
x 127 RPM
Arrilah-I
186.40m 27.8m 11.145m Hyundai MAN B&W 6S50MC-
C7, 7860 KW in 129 RPM 7860 KW
Arzanah
166.64m 27.50m 11.399m MAN B&W 6L67GFCA
9600Bhp@123Rpm 13100 BHP
Butinah
190.00m 32.26m 13.271m STX-MAN B&W 6S60MC-C
(MK VII) 12900 BHP
x 127 RPM
Ras Ghumays-I
190.00m 32.26m 13.271m STX-MAN 6S50MC-C (MK
VII) 12700 BHP
x 127 RPM
Shah
186.40m 27.84m 11.145m Hyundai MAN B&W 6S50MC-
C7 7860 KW
Umm Ad Dalkh
186.40m 27.8m 11.145m Hyundai MAN B&W 6S50MC-
C7, 7860 KW in 129 RPM 7860 KW
Chemical Tankers
Al Samha
144.06m 22.60m 9.406m STX MAN B&W 8S35MC-
MK7 5920 Kw
Janana
127m 19m 8.029m MAN B&W 6L40/54 - 4 Stroke
Diesel 3900 KW @
500 RPM
Umm All Lulu-I
139.95m 21m 8.269m Caterpillar MAK 6M 43 C 5400 KW
Container Vessels

DET NORSKE VERITAS
Report for ADNATCO-NGSCO
MANAGING RISK Fleet Energy Efficiency Study
Page 139 of 151
Al Bazm-II
149.46m 22.7m 11.2m MAN B&W 8S35MC7 5920 KW x
173 RPM
Al Sadr-I
149.46m 22.7m 11.2m Hyundai MAN B&W
8S35MC7, 5920 KW x 173
RPM
5920 KW x
173 RPM
Crude/Production Tankers
Bani Yas
288m 32.24m 14.59m STX MAN B&W7S50MC-
C(MK VII) 15,050 BHP
Diyyinah-I
288m 32.24m 14.59m STX MAN B&W7S50MC-
C(MK VII) 15,050 bhp
X 127 RPM
Mezaira‟s
288m 32.24m 14.59m STX MAN B&W7S50MC-
C(MK VII) 15,050 bhp
X 127 RPM
Yamilah-III
288m 32.24m 14.59m STX MAN B&W7S50MC-
C(MK VII) 15,050 bhp
X 127 RPM
Ro-Ro Vessels
Al Dhafrah
121.48m 21m 5.3m 2xMAK 9M453 AK 2x3600
Bhp 600 Rpm 3600 BHP
Al Ruwais
121.48m 21m 5.3m 2xMAK 9M453 AK 2x3600
Bhp 600 Rpm 3600 BHP
LNG Carriers
Al Khaznah
293m 45.75m 11.27m Steam Turbine Kawasaki AU
400 28,700 kw @
93.0 rpm
Shahama
293m 45.75m 11.27m Steam Turbine Kawasaki AU
400 28,700 kw @
93.0 rpm
Ghasha
293m 45.75m 11.27m Steam Turbine Kawasaki AU
400 28,700 kw @
93.0 rpm
Mubaraz
290.10m 48.10m 11.76m Steam Turbine Mitsubishi ( MS
40-2) 29,600 kw @
85 rpm
Ish
293m 45.75m 11.27m Steam Turbine Kawasaki AU
400 28,700 kw @
93.0 rpm
Mraweh
290.10m 48.10m 11.76m Steam Turbine Mitsubishi ( MS
40-2) 29,600 kw @
85 rpm
Al Hamra
290.10m 48.10m 11.76m Steam Turbine Mitsubishi ( MS
40-2) 29,600 kw @
85 rpm
Umm Al Ashtan
290.10m 48.10m 11.76m Steam Turbine Mitsubishi ( MS
40-2) 29,600 kw @
85 rpm

DET NORSKE VERITAS
Report for ADNATCO-NGSCO
MANAGING RISK Fleet Energy Efficiency Study
Page 140 of 151
15.2 Ship Questionnaire sample
Questions
Name of ship
LOCKED SHEET - ONLY EDIT IN WHITE CELLS
0. General YES NO NA Notes Capt Cheng
I am heavily committed to energy saving x x x
I am satisfied with the energy saving policy of this company x x x
My colleagues do not care about energy saving x x x
I have clear measures and targets related to my role x x x
I have no idea if the reports sent to shore are analysed by anyone x x x
I always have the necessary budget to cover all planned or routine maintenance tasks x x x
There are always positive reactions to proposed improvement projects within my company x x x
I find that I have far too much unnecessary e-mails that are not relevant to my work x x x
Reporting formats are standardised onboard all vessels x x x
1. Planning and execution of voyages
My company has clear and standard procedures for voyage or passage planning x x
We always plan passages to make sure the ETA is calculated from optimal speed x x
I sometimes receive ETA instructions from shore that are unrealistic x x
We receive information from shore of tide restrictions, pilot requirements and other issues that might affect the voyage x x
The company has procedures for evaluation of the passage after completion and feedback is sent to shore x x
The vessel is often struggling to keep to the scheduled speed requirements x x
2. Weather routing
Weather routing systems and services are in operation for all ocean passages or passages of more than 24 hours x x
Weather conditions are always evaluated as part of the passage planning x x
I trust the information and suggestions from the weather routing system/company x x
3. Trim
Trim is adjusted for different load conditions in order to reduce resistance x x
Company procedures for optimal trim and draft are available onboard all vessels x x
I know how trim and draft affect fuel consumption x x
4. Hull and propeller condition
My company has procedures to check the hull roughness between dry dock intervals x x
We carry out periodic checks of hull condition x x
The effect on vessel performance is noticeable after dry dock or propeller polishing x x
The propeller is cleaned regularly x x x
5. Engine condition
Engine performance measurements are taken every month x x
Engine performance measurements are taken at approx same engine load each time x x
The results from the engine performance measurements are evaluated before they are reported to shore x x
When engine performance is evaluated, the sea trial data is used for comparison x x
Acceptance criteria for the performance measurements are clearly defined x x
The Specific Fuel Oil Consumption (SFOC) for the diesel engines are calculated and monitored onboard x x
The SFOC is ISO corrected for engine room temperature and sea water temperature x x
6. Energy consumers
Total electrical energy used onboard (kWh) is measured and reported x x
The power management system is working properly x x
The crew is striving to minimise the energy consumption x x
7. Fuel and bunkering procedures
There is a need for Bunker Quantity Surveyors to ensure that correct quantity is received x x
We are short lifted from time to time x x
Bunker ROB (Remaining On Board) volume is recorded on the vessel every day x x
We are confident that the delivered fuel quality is acceptable x x
We use fuel oil sampling equipment onboard x x
Please cross off in the white boxes next to each question.
LIWA-V
Answers

DET NORSKE VERITAS
Report for ADNATCO-NGSCO
MANAGING RISK Fleet Energy Efficiency Study
Page 141 of 151
15.3 Calculated EEOI – ADNATCO-NGSCO Fleet
Full fleet EEOI calculations to be added once all data has come from the ships. Some is still
outstanding but will be added here shortly.

DET NORSKE VERITAS
Report for ADNATCO-NGSCO
MANAGING RISK Fleet Energy Efficiency Study
DNV Reg. No.: PP036368 Revision No.: 00
Date : 2012-05-02 Page 0-1
Det Norske Veritas:
Det Norske Veritas (DNV) is a leading, independent provider of services for managing risk
with a global presence and a network of 300 offices in 100 different countries. DNV‟s
objective is to safeguard life, property and the environment.
DNV assists its customers in managing risk by providing three categories of service:
classification, certification and consultancy. Since establishment as an independent foundation
in 1864, DNV has become an internationally recognised provider of technical and managerial
consultancy services and one of the world‟s leading classification societies. This means
continuously developing new approaches to health, safety, quality and environmental
management, so businesses can run smoothly in a world full of surprises.
Global impact for a safe and sustainable future:
Learn more on www.dnv.com
- o0o -