file format v1.2 software v1.7 - complete genomics - about · pdf filecomplete genomics, inc....
TRANSCRIPT

Complete Genomics, Inc.
2071 Stierlin Court Mountain View, CA 94043 www.completegenomics.com
Data File Formats
File format v1.2
Software v1.7.3

This page intentionally left blank

3 | P a g e Data File Formats v1.2 Apr-2010
© 2010 Complete Genomics, Inc. All rights reserved.
Table of Contents
TABLE OF CONTENTS .............................................................................................................................. 3
1 INTRODUCTION ................................................................................................................................. 4
2 SEQUENCING APPROACH ................................................................................................................ 5
3 GENOME DATA FILE CONTENT AND ORGANIZATION .............................................................. 6
3.1 MANIFEST.ALL .................................................................................................................................................................................. 6 3.2 READS, MAPPING, AND ASSEMBLY DATA ..................................................................................................................................... 7
3.2.1 Header format ....................................................................................................................................................................... 7 3.2.2 MAP Directory – Reads and Mapping Data ...................................................................................................................... 9 3.2.3 LIB Directory – Library information ................................................................................................................................... 13 3.2.4 ASM directory - Assembly and variations identified ......................................................................................................... 17 3.2.5 Sequence Coordinate System ............................................................................................................................................. 33 3.2.6 Alignment Cigar Format ...................................................................................................................................................... 34
INDEX ........................................................................................................................................................ 35

4 | P a g e Data File Formats v1.2 Apr-2010
© 2010 Complete Genomics, Inc. All rights reserved.
1 Introduction
This document describes the directory structure and file formats for complete genome sequencing data delivered by Complete Genomics, Inc. (CGI) to customers and collaborators. The data include sequence reads, their mappings to a reference human genome, and variations detected against the reference human
genome.
Disclaimer of Warranties. COMPLETE GENOMICS, INC. PROVIDES THESE DATA IN GOOD FAITH TO
THE RECIPIENT “AS IS.” COMPLETE GENOMICS, INC. MAKES NO REPRESENTATION OR WARRANTY, EXPRESS OR IMPLIED, INCLUDING WITHOUT LIMITATION ANY IMPLIED WARRANTY OF MERCHANTABILITY OR FITNESS FOR A PARTICULAR PURPOSE OR USE, OR ANY OTHER STATUTORY WARRANTY. COMPLETE GENOMICS, INC. ASSUMES NO LEGAL LIABILITY OR
RESPONSIBILITY FOR ANY PURPOSE FOR WHICH THE DATA ARE USED.
Any permitted redistribution of the data should carry the Disclaimer of Warranties provided above.
Data file formats are expected to evolve over time. Backward compatibility of any new file format is not
guaranteed.

5 | P a g e Data File Formats v1.2 Apr-2010
© 2010 Complete Genomics, Inc. All rights reserved.
2 Sequencing Approach
Complete Genomics‟ sequencing platform employs high-density DNA nanoarrays that are populated with DNA nanoballs (DNBs™) and base identification is performed using a non-sequential, unchained read
technology, known as combinatorial probe-anchor ligation (cPAL™).
Complete Genomics‟ sequencing technology, including the library construction process and the ligation-based assay approach, is described in the Complete Genomics Technology Whitepaper, available in the “Resources” section of the Complete Genomics website (www.completegenomics.com). This section also
describes the data structure, the nomenclature used, and the contents and organization of the data files.
Read Data Format
Each slide, containing an ultra-high density DNA nanoarray, is partitioned into several lanes. A field is a region within a lane that is imaged at one time; each field covers a two-dimensional array of spots on the slide, the vast majority of which are occupied by a single DNB. The DNB is a head-to-tail concatamer consisting of more than 200 copies of a circular DNA template comprised of genomic DNA and several synthetic adaptors. A library is a collection of these paired-end constructs processed together from genomic DNA and the known adaptors. Figure 1 depicts the architecture of the circular template and of the reads
generated from a single four-adaptor DNB.
Figure 1: Gapped read structure
Each DNB consists of two paired reads, called half-DNBs, separated by a physical distance referred to as the mate gap. Within each half of the DNB, reads of genomic DNA are obtained from the ends of each adaptor (reads r1 – r4 correspond to one half-DNB and r5 – r8 to the other half-DNB in Figure 1). These reads do not include adaptor sequence. Neighboring reads within each half-DNB are proximal in genomic coordinates but may be separated from each other by small gaps (positive values, in bases), or may overlap one another (represented by negative values, in bases). The plot in the bottom-half of Figure 1 displays typical distributions for the gaps and overlaps associated with reads from a single, four-adaptor DNB. Actual gap distributions are empirically estimated from sampled data. DNB positions in output files refer to positions within an aggregation of the reads obtained from each DNB. In Figure 1, these are positions within the seventy bases (5 + 10 + 10 + 10 + 10 + 10 + 10 + 5) constructed by aggregating reads r1 – r8 in order of genomic position. Note that because proximal reads (such as r1 and r2 above) can overlap, two read
positions may correspond to a single genomic location.

6 | P a g e Data File Formats v1.2 Apr-2010
© 2010 Complete Genomics, Inc. All rights reserved.
3 Genome data file content and organization
Data for sequenced human genomes will be provided on one or more hard drives. The hard drives are formatted with the NTFS file system that can be read by a variety of operating systems. To install the hard
drives, please refer to the documentation provided with them.
The data is stored in the directory structure that is shown in Table 1. Some of the files are signed using S/MIME technology to ensure data integrity, using the PKCS #7 secure message format specification (Public
Key Cryptography Standards #7, published by RSA Security).
`-- Package [Single data delivery] |-- GS000000123-DNA-C01 [single individual genome]
| |-- ASM [data on assembled genome: variations, annotations] | | |-- REF [base-level coverage and reference scores, organized by chromosome]
| | | |-- coverageRefScore-chr1-GS000000123-ASM.tsv.bz2
| | | |-- coverageRefScore-chr2-GS000000123-ASM.tsv.bz2 | | | |-- coverageRefScore-chr3-GS000000123-ASM.tsv.bz2
| | | `-- coverageRefScore-chr4-GS000000123-ASM.tsv.bz2 | | |-- EVIDENCE [reads and alignments supporting called alleles in intervals containing variations ]
| | | |-- evidenceIntervals-chr1-GS000000123-ASM.tsv.bz2 [intervals for which evidence is provided on chromosome 1] | | | |-- evidenceDnbs-chr1-GS000000123-ASM.tsv.bz2 [DNB alignments supporting the called alleles in intervals specified
| | | | in evidenceIntervals-chr1-GS000000123-ASM.tsv.bz2] | | | |-- evidenceIntervals-chr2-GS000000123-ASM.tsv.bz2 [intervals for which evidence is provided on chromosome 2]
| | | |-- evidenceDnbs-chr2-GS000000123-ASM.tsv.bz2 [DNB alignments supporting the called alleles in intervals specified
| | | | in evidenceIntervals-chr2-GS000000123-ASM.tsv.bz2] | | | `-- correlation-GS000000123-ASM.tsv.bz2 [Correlations between intervals that share supporting DNBs]
| | |-- gene-GS000000123-ASM.tsv.bz2 [gene annotation of variations] | | |-- gene-var-summary-GS000000123-ASM.tsv [summary of variations that occur in genes]
| | |-- dbSNPAnnotated-GS000000123-ASM.tsv.bz2 [calls on dbSNP variations] | | |-- var-GS000000123-ASM.tsv.bz2 [called sequence with respect to the reference genome]
| | `-- summary-GS000000123-ASM.tsv [summary of assembly statistics] | `-- LIB [DNB architecture for library used in the assay]
| | |-- GS000000123-CLS [library name]
| | | |-- lib_DNB_GS000000123-CLS.tsv [library file] | `-- MAP [reads, scores, mappings, and associated data]
| |-- GS000000123-FS3-L04 [section of data, currently one slide lane] | | |-- reads_GS000000123-FS3-L04_00X.tsv.bz2 [reads and scores for 1-30,000,000 DNBs]
| | `-- mapping_GS000000123-FS3-L04_00X.tsv.bz2 [mappings for reads of same lane] | `-- GS00009-FS3-L05
| |-- reads_GS000000123-FS3-L05_00X.tsv.bz2 | `-- mapping_GS000000123-FS3-L05_00X.tsv.bz2
|-- README.txt [README accompanying data set]
|-- manifest.all [manifest of files] `-- version [version of export format]
Table 1: Genome data file structure
3.1 Manifest.all
manifest.all is a MD5-compatible file into which all of the checksums for all files written to disk are recorded.

7 | P a g e Data File Formats v1.2 Apr-2010
© 2010 Complete Genomics, Inc. All rights reserved.
3.2 Reads, Mapping, and Assembly data
The data corresponding to a single genome is organized into three main directories:
1) MAP – Reads, quality scores, and alignments to the reference genome. 2) LIB – DNB structure for the library used in the sequencing assay. 3) ASM – Assembly of the complete genome: variations called, coverage, and annotations
The representation of reads, quality scores, and alignments has been designed as a transfer format, dominated by considerations of simplicity and compactness. For some applications, this could result in increased cost in accessing particular subsets of interest within the data (see section “Association between
mapping_ slide-lane_00X.tsv and reads_slide-lane_X.tsv”).
3.2.1 Header format
Each data file in the directory structure contains a header section that describes the contents of the file and provides associated metadata. Each header row begins with the hash character (#) followed by a tab-separated, key-value pair. All header items are not present in all files. The keys and their possible values are
described below in Table 2.
Key Description Allowed values
#TYPE Indicates the type of data contained in the file.
READS: reads file
MAPPINGS:
alignments of reads to the reference genome. LIB-DNB:
description of the architecture of reads within DNBs in a library. REFMETRICS:
reference scores (scores indicating the likelihood of the assembled genome being identical to the reference at each genomic position)
and coverage information DBSNP-TO-CGI:
information on loci annotated in dbSNP
GENE-ANNOTATION: variations annotated with impact on RefSeq genes
SUMMARY-REPORT: summary information on the assembled genome
VAR-ANNOTATION: information on the assembled genome, expressed relative to the
reference genome. GENE-VAR-SUMMARY-REPORT:
summary of genetic variations in coding regions of genes.
EVIDENCE-CORRELATION: information on correlations in supporting data between pairs of
genomic intervals EVIDENCE-DNBS:
DNB alignments supporting the called alleles in a genomic interval. EVIDENCE-INTERVALS:
genomic intervals over which supporting evidence is provided for the called sequence.
#FORMAT_VERSION Version number of the file
format, e.g. 0.6
Two or more digits separated by periods.
#LIBRARY Identifier of the library that the
DNBs were generated from
#SAMPLE Identifier of the sample that the
library was created from
#SLIDE Flow slide identification code
#LANE Identifier of the slide lane that the reads were extracted from

8 | P a g e Data File Formats v1.2 Apr-2010
© 2010 Complete Genomics, Inc. All rights reserved.
#CHROMOSOME Identifier of the chromosome
that the reference score and coverage data apply to. Data for
the pseudoautosomal regions
on chromosome Y are reported at their coordinates on
chromosome X.
chr1-chr22, chrM, chrX, chrY
#ASSEMBLY_ID Name of the assembly. assembly-name-ASM
#SOFTWARE_VERSION CGI pipeline build number. Two or more digits separated by periods.
#DBSNP_BUILD dbSNP version used for annotation.
dbSNP build XXX where X are digits.
#GENERATED_AT Date and time of the assembly. Year-Month-Day Time
#GENERATED_BY Assembly pipeline component
that generated the output.
Alpha-numeric string.
#GENE_ANNOTATIONS Entrez Gene version used for annotation.
NCBI build XX.X where X are digits.
#GENOME_REFERENC
E
Human genome build used for
assembly.
NCBI build XX where X are digits.
#MAX_PLOIDY Maximum allowed copy number estimate.
Positive integer
#WINDOW_SHIFT
Shift, in bases, between consecutive windows in which
smoothed coverage is
calculated for copy number estimation.
Positive integer
#WINDOW_WIDTH
Width, in bases, of windows in
which smoothed coverage is
calculated for copy number estimation.
Positive integer
#BATCH_FILE_NUMBER Number of the batch of a split
data file
Positive 1-based integer
#BATCH_OFFSET Offset of the first record in a batch to the position of the
record in a non-split file
Positive 0-based integer
#FIELD_SIZE Size of the lane fields Positive integer
Table 2: Header Metadata
The header section is followed by a single row of tab-separated column headers that begins with the “greater than” character „>‟; followed by the data, also in a tab-separated format. An example from the gene-var-
summary-library_name-ASM.tsv file is shown below:
#ASSEMBLY_ID GS19240-ASM #BUILD 1.7 #DBSNP_BUILD dbSNP build 129 #GENERATED_AT 2010-Jan-21 13:42:57.076648 #GENERATED_BY callannotate #GENE_ANNOTATIONS NCBI build 36.3 #GENOME_REFERENCE NCBI build 36 #TYPE GENE-VAR-SUMMARY-REPORT #VERSION 0.6 >column-headers
If a data file becomes too large, it will be split during export. The resulting collection of files is known as a batch. Each batch that is a result of the split has a copy of the original header and additional header fields that

9 | P a g e Data File Formats v1.2 Apr-2010
© 2010 Complete Genomics, Inc. All rights reserved.
are specific to a batch, for instance: BATCH_FILE_NUMBER. A batch file repeats the structure of the original file but contains a contiguous subset of the original file data. The original file can be restored by concatenating the batch files, excluding their headers, in their BATCH_FILE_NUMBER order. Some data files from the export package expect the other files in the split format and use the keys like FILE_ID, BATCH_FILE_NUMBER, RECORD_NUMBER to refer the data. Files typically split include Reads and
Mappings.
3.2.2 MAP Directory – Reads and Mapping Data
The MAP Directory contains reads, scores, and alignments to the reference genome for each DNB, organized by slide and lane. Each subdirectory name is the identifier for the lane, for example “GS08089-FS3-L01”
would represent data for the first lane (L01) of the slide “GS08089-FS3”.
Reads and mappings are split within each lane to keep the data below a 5GB file size threshold. A lane directory containing: reads_slide-lane_001.tsv.bz2, reads_slide-lane_002.tsv.bz2, and reads_slide-lane_003.tsv.bz2 will have corresponding mappings files: mapping_slide-lane_001.tsv.bz2, mapping_ slide-lane _002.tsv.bz2, and mapping_slide-lane_003.tsv.bz2. Previously reads and mappings were contained in
single files.
The following sections describe the files in each lane subdirectory within the MAP Directory.
reads_slide-lane_00X.tsv.bz2:
A tab-delimited text file (compressed with bzip2) containing the reads and associated quality scores, as
described in Table 3.
Name Description Text Format
flags Column Mapping characteristics of the DNBs, represented in bits within an integer. Individual flags described below.
Integer (base 10), e.g. 8.
flag: LeftHalfDnbNoMatches
The left half of this DNB yielded no mappings to the reference genome.
0x01
flag: LeftHalfDnbMapOverflow
The left half of this DNB yielded a large number of mappings to the reference genome [indicative of highly repetitive sequence; mappings not tracked for this half-DNB].
0x02
flag: RightHalfDnbNoMatches
The right half of this DNB yielded no mappings to the reference genome.
0x04
flag: RightHalfDnbMapOverflow
The right half of this DNB yielded a large number of mappings to the reference genome [indicative of highly repetitive sequence; mappings not tracked for this half-DNB].
0x08
reads
The base calls read from a single DNB, in an order specified in lib_DNB_<library_id>.tsv.
Base positions for which no information is available are denoted by „N‟ in the “reads” field.
one character per base, not separated
scores
Quality scores for reads. Each score is a Phred-like transformation of the error probability associated with a single base read. Base positions for which no information is available are assigned a score of 0
one Ascii-33i-encoded character per
base, not separated. The Phred quality score can be inferred from the Ascii code of the displayed character. For example, a score of “A” has the Ascii code 65, and a Phred quality score of 65 – 33 = 32. This corresponds to a discordance probability of 10
-(32/10) = 0.00063.
Table 3: Reads file format description
A sample set of rows from a reads_slide-lane_00X.tsv file is presented below for hypothetical DNBs of

10 | P a g e Data File Formats v1.2 Apr-2010
© 2010 Complete Genomics, Inc. All rights reserved.
length 20, showing the Ascii-33-encoded, single-character quality scores. DNBs with the structure illustrated in Figure 1 would have 70 bases and corresponding scores, with the first 35 bases corresponding to the left half-DNB and the last 35 bases to the right half-DNB.
>flags reads scores
1 AGTGAGACACCTGAGGGNGA SXXX<NDUETSUBTMW]#\Z
4 AAATATATTTTGTAGTCNAG PKMZH@+E6CN)KJ)[)#Z5
0 CTTCTCTGGTTTATTGTNTG UXW6XTTP/R(0MST3[#],
The interpretations of all allowed values for the flags field are described below:
flags 0 1 2 4 5 6 8 9 10
LeftHalfDnbNoMatches x x x
LeftHalfDnbMapOverflow x x x
RightHalfDnbNoMatches x x x
RightHalfDnbMapOverflow x x x
A value of flags = 0 indicates that both arms of the DNB mapped to the reference genome. If a flag other than 0 is set the corresponding arm has no mappings in the mapping file. For example, a flag of 4 (no matches) or 8 (overflow) indicates mappings are only available for the left arm and not the right.
11 | P a g e Data File Formats v1.2 Apr-2010
© 2010 Complete Genomics, Inc. All rights reserved.
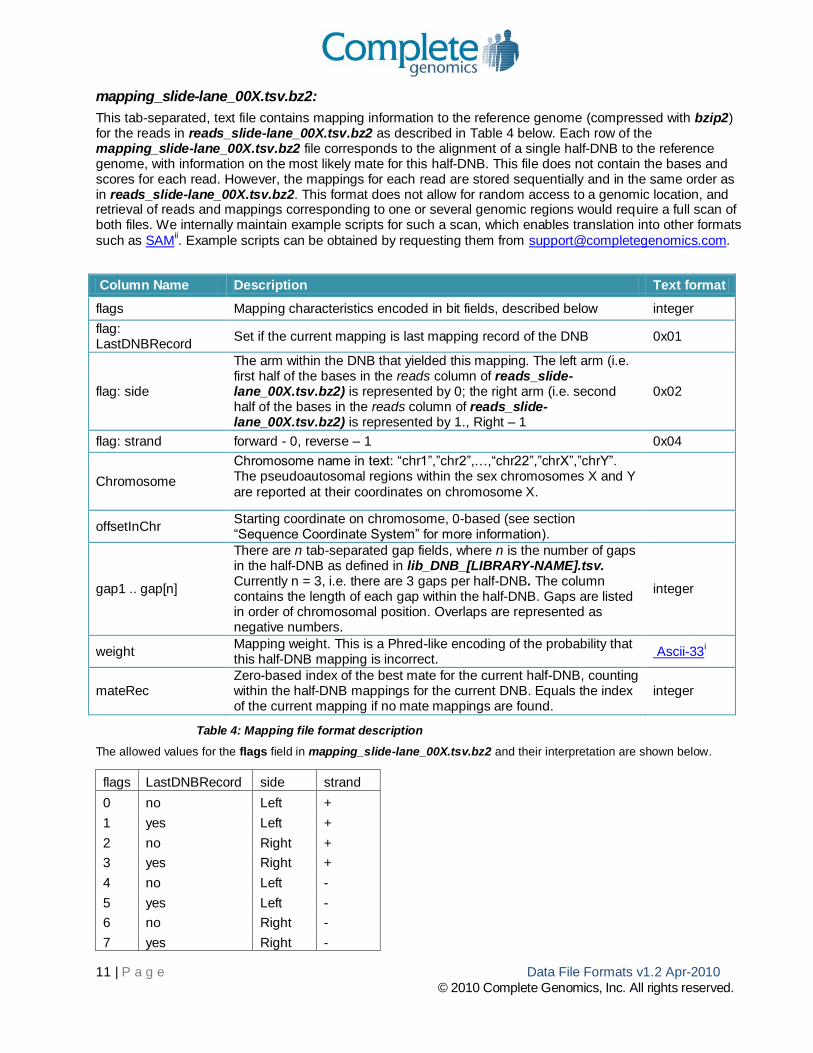
mapping_slide-lane_00X.tsv.bz2:
This tab-separated, text file contains mapping information to the reference genome (compressed with bzip2) for the reads in reads_slide-lane_00X.tsv.bz2 as described in Table 4 below. Each row of the mapping_slide-lane_00X.tsv.bz2 file corresponds to the alignment of a single half-DNB to the reference genome, with information on the most likely mate for this half-DNB. This file does not contain the bases and scores for each read. However, the mappings for each read are stored sequentially and in the same order as in reads_slide-lane_00X.tsv.bz2. This format does not allow for random access to a genomic location, and retrieval of reads and mappings corresponding to one or several genomic regions would require a full scan of both files. We internally maintain example scripts for such a scan, which enables translation into other formats
such as SAMii. Example scripts can be obtained by requesting them from [email protected].
Column Name Description Text format
flags Mapping characteristics encoded in bit fields, described below integer
flag: LastDNBRecord
Set if the current mapping is last mapping record of the DNB 0x01
flag: side
The arm within the DNB that yielded this mapping. The left arm (i.e. first half of the bases in the reads column of reads_slide-lane_00X.tsv.bz2) is represented by 0; the right arm (i.e. second half of the bases in the reads column of reads_slide-lane_00X.tsv.bz2) is represented by 1., Right – 1
0x02
flag: strand forward - 0, reverse – 1 0x04
Chromosome
Chromosome name in text: “chr1”,”chr2”,…,“chr22”,”chrX”,”chrY”. The pseudoautosomal regions within the sex chromosomes X and Y
are reported at their coordinates on chromosome X.
offsetInChr Starting coordinate on chromosome, 0-based (see section “Sequence Coordinate System” for more information).
gap1 .. gap[n]
There are n tab-separated gap fields, where n is the number of gaps in the half-DNB as defined in lib_DNB_[LIBRARY-NAME].tsv. Currently n = 3, i.e. there are 3 gaps per half-DNB. The column contains the length of each gap within the half-DNB. Gaps are listed in order of chromosomal position. Overlaps are represented as negative numbers.
integer
weight Mapping weight. This is a Phred-like encoding of the probability that this half-DNB mapping is incorrect.
Ascii-33i
mateRec Zero-based index of the best mate for the current half-DNB, counting within the half-DNB mappings for the current DNB. Equals the index of the current mapping if no mate mappings are found.
integer
Table 4: Mapping file format description
The allowed values for the flags field in mapping_slide-lane_00X.tsv.bz2 and their interpretation are shown below.
flags LastDNBRecord side strand
0 no Left +
1 yes Left +
2 no Right +
3 yes Right +
4 no Left -
5 yes Left -
6 no Right -
7 yes Right -

12 | P a g e Data File Formats v1.2 Apr-2010
© 2010 Complete Genomics, Inc. All rights reserved.
A sample set of rows from a mapping_slide-lane_00X.tsv.bz2 file is shown below:
>flags chromosome offsetInChr gap1 gap2 gap3 weight mateRec
0 chr18 54911965 -2 0 5 ( 1
3 chr18 54912325 5 0 -3 ( 0
0 chr7 92578954 -2 0 6 ! 3
0 chr8 59803146 -2 0 6 ! 4
4 chr19 19695620 4 0 -2 ! 5
2 chr7 92579332 6 0 -3 ! 0
2 chr8 59803538 6 0 -3 ! 1
7 chr19 19695239 -3 0 6 ! 2
4 chr7 101416273 6 1 -2 L 1
7 chr7 101415891 -2 0 5 L 0
5 chr8 85763053 5 0 -2 j 0
Note that in accordance with the column definitions, flags that are odd numbers signify the last mapping record for a DNB. Thus, in the above example, mappings for four DNBs are shown: 1. For the first DNB, there is one mapping available for each half-DNB, with both close to one another on
chromosome 18. The mateRec field for the two half-DNB mappings is populated with 1 and 0 respectively, indicating that these two are best mates for one another. Based on the flags values of 0 and
3, it is shown that both half-DNBs map to the forward strand. 2. For the fourth and last DNB, there is only one mapping available. Based on flags = 5, it can be inferred
that it is a mapping of the left half-DNB to the reverse strand of the reference genome. The offsetInChr field (representing the starting coordinate of the mapping, in zero-based half-open coordinates described in the section “Sequence coordinate system”) and gap fields are described with respect to the forward strand, however, and not in the order of the bases in reads_slide-lane_00X.tsv.bz2. That is, for the DNB architecture represented in Figure 1, the 35 bases in this reverse-strand-mapped, left half-DNB map to the right of offsetInChr, with contiguous reads of 10, 10, 10 and 5 bases separated by gaps of 5, 0 and -2 bases respectively (the last being an overlap of two bases). Because no mate mapping was found for this half-DNB, mateRec is populated with its own record position within the mappings for the DNB, which is 0.
3. The third DNB has one mapping available for each half-DNB on chromosome 7, both on the reverse strand based on the values of flags. Again, mateRec indicates that the two mappings are mated with one another.
4. The second DNB, represented in rows 3 – 8 of the example, has six, half-DNB mappings. The mateRec field values for these rows indicate that this DNB has three pairs of mated mappings on the genome: one each on chromosomes 7, 8 and 19. For example, the record numbers of the two chromosome 7 mappings within the set for this DNB are 0 and 3; the mateRec fields in these records are 3 and 0 respectively. The values of flags indicate that the first three rows (rows 3 – 5 in the example) correspond to the left half-DNB and the next three rows (rows 6 – 8 in the example) correspond to the right half-DNB; they also indicate that the chromosome 19 mappings are to the reverse strand.
We internally maintain a script that processes the mapping files and extracts these pieces of information. The script may be requested from [email protected].
13 | P a g e Data File Formats v1.2 Apr-2010
© 2010 Complete Genomics, Inc. All rights reserved.
Association between mapping_slide-lane_00X.tsv and reads_slide-lane_00X.tsv:
DNB mappings in mapping_slide-lane_00X.tsv are stored in the same order as records for DNBs in the reads_slide-lane_00X.tsv file, allowing for an association between them. Within a DNB, all left-arm mappings precede right-arm mappings. The number of mapping records corresponding to each DNB is variable, and flags within the two files help to associate records within the two with each other. The reads_slide-lane_00X.tsv file includes read and score data for each DNB that passes basic quality filters. The flags corresponding to each DNB contain information on whether each of its constituent half-DNBs yielded mappings to the reference genome. There are three possibilities for each DNB: 1. If either LeftHalfDnbNoMatch or LeftHalfDnbMapOverflow is set to 1, no mapping records are expected
for the left half-DNB in mapping_slide-lane_00X.tsv. 2. If either RightHalfDnbNoMatch or RightHalfDnbMapOverflow is set to 1, no mapping records are
expected for the right half-DNB in mapping_slide-lane_00X.tsv. 3. The last half-DNB mapping record in mapping_slide-lane_00X.tsv corresponding to this read will have the
LastDNBRecord flag set to 1, indicating that the next mapping record corresponds to a new DNB. Using the above rules, it is possible to scan the mapping_slide-lane_00X.tsv and reads_slide-lane_00X.tsv files together, associating the mappings in mapping_slide-lane_00X.tsv with reads and scores in reads_slide-lane_00X.tsv. Mappings are associated with the next record in reads_slide-lane_00X.tsv following a record with the LastDNBRecord flag set to 1; however, records in reads_slide-lane_00X.tsv for which no mappings are expected, due to rules (1) and (2) above, are skipped. We internally maintain an example script which implements such a scan of the mapping_slide-lane_00X.tsv and reads_slide-lane_00X.tsv files. The script may be requested from [email protected].
3.2.3 LIB Directory – Library information
The library directory contains a subdirectory which houses a file that provides the library information used
during assembly. The library information is stored in a tab-delimited text file.

14 | P a g e Data File Formats v1.2 Apr-2010
© 2010 Complete Genomics, Inc. All rights reserved.
lib_DNB_[LIBRARY-NAME].tsv:
This file describes the architecture of reads and gaps within all DNBs in the library (Table 5). The information is useful in the interpretation of reads in reads_slide-lane_00X.tsv. The DNB is described as a series of
objects of different types (reads, gaps, mate gap) sequentially following one another.
Column
Name Description Text format
id Position of the object within each DNB, numbered from 0 to n-1, where n is the number of objects (reads and gaps) within each DNB
int
type Object type: currently one of "read","gap","mategap" string
armID Number of the half-DNB: 0-left, 1-right int
indArm 0-based position of the object within an arm int
objArm 0-based position of this object type within an arm, e.g. the second gap
within the second arm has “1” for this field. int
min
Minimum length in bases for the object.
N.B. The minimum and maximum values for mate gaps given in this table exclude the most extreme 0.05% of values on either end of the observed distribution. The values for small gaps in this table describe the minimum and maximum values observed in the most frequent small gap tuples for
the given arm, accounting for 99.9% of observations.
int
max
Maximum length in bases for the object. Blank when maximum is not
specified.
N.B. The minimum and maximum values for mate gaps given in this table exclude the most extreme 0.05% of values on either end of the observed distribution. The values for small gaps in this table describe the minimum and maximum values observed in the most frequent small gap tuples for
the given arm, accounting for 99.9% of observations.
int
Table 5: Read structure file format description
An example of the lib_DNB_[LIBRARY-NAME].tsv file is shown below for the DNB architecture depicted in
Figure 1:
>id type armID indArm objArm min max
0 read 0 0 0 5 5
1 gap 0 1 0 -3 -1
2 read 0 2 1 10 10
3 gap 0 3 1 0 0
4 read 0 4 2 10 10
5 gap 0 5 2 5 7
6 read 0 6 3 10 10
7 mategap 0 7 3 250 600
8 read 1 0 0 10 10
9 gap 1 1 0 5 7
10 read 1 2 1 10 10
11 gap 1 3 1 0 0
12 read 1 4 2 10 10
13 gap 1 5 2 -3 -1
14 read 1 6 3 5 5

15 | P a g e Data File Formats v1.2 Apr-2010
© 2010 Complete Genomics, Inc. All rights reserved.
lib_gaps_M_[LIBRARY-NAME].tsv:
This file describes the empirically observed mate gap distribution for the library, as described in Table 6below.
Column
Name Description
mateGap The number of genomic bases between the two arms of the DNB.
frequency The fraction of DNBs observed to have the given mate gap.
Table 6: Mate gap frequency file format description
An example of a portion of the lib_gaps_M_[LIBRARY-NAME].tsv file is shown below:
>mateGap frequency
196 1.72227e-06
197 1.72227e-06
198 1.20081e-05
199 2.2844e-05
200 3.368e-05
201 4.62665e-05
202 5.78527e-05
lib_gaps_rollup_[ARM]_[LIBRARY-NAME].tsv:
This file describes the frequency of observation of gap tuples for the given arm for the library (Table 7). A gap
tuple is a set of gap values for all the small gaps in the arm.
Column
Name Description
gaps Semi-colon separated list of the small gaps in the arm, in DNB order.
frequency The fraction of DNBs observed to have the given gaps.
Table 7: Small gaps rollup file format description
An example of a portion of the lib_gaps_rollup_L_[LIBRARY-NAME].tsv file is shown below:
>gaps frequency
-2;0;6 0.509517
-2;0;5 0.239315
-2;0;7 0.084158
-1;0;6 0.0352779
-2;0;4 0.0178566
-3;0;6 0.0174722

16 | P a g e Data File Formats v1.2 Apr-2010
© 2010 Complete Genomics, Inc. All rights reserved.
lib_gaps_[ARM][ID]_[LIBRARY-NAME].tsv:
This file describes the frequency of observation of small gap values depending on nearby genomic sequence for the given arm for the library (Table 8). The gaps Complete Genomics models as dependent on the same sequence are described in one file, and the gaps Complete Genomics models as independent are in separate files. For example, for the left arm, there may be two files lib_gaps_L0_[LIBRARY-NAME].tsv and lib_gaps_L1_[LIBRARY-NAME].tsv. Furthermore, the “L0” file may describe two of the three gaps in the arm, while the “L1” file describes the remaining gap because the third gap is modeled as independent of the first two.
Column Name Description
sequence:[sequenceStart]-
[sequenceEnd];firstGap:[N];gapCount:[M]
Here “sequenceStart” is the 0-based number of bases from the clone end (toward the mate gap) of the sequence start, or for [ID] > 0, the number of bases from the end of the last gap described in the previous gaps file. The “sequenceEnd” is one past the end of the sequence, using the same coordinate system as sequenceStart. [N] and [M] determine which gaps are described by the file. They are gap offsets in order from the end of the clone. The data rows for this column contain base sequence. The sequence data is the genomic sequence in order from the clone end, on the same strand as the clone strand for the left arm, and on the opposite strand for the right arm. This facilitates analysis of gap frequency asymmetries in otherwise symmetric DNB architectures. The sequence may have N‟s in
which case the gap frequencies are rollups.
gaps:[Gap N];…;[Gap N+M-1] This header describes a gap tuple, and the data values describe the frequency of occurrence for that gap tuple, given the
sequence. Here, “Gap N” is the gap value for gap N.
Table 8: Sequence-dependent gaps file format description
For example, for the DNB architecture depicted in Figure 1, we may model the two gaps nearest the clone end as dependent on one sequence, and the small gap nearest the mate gap as dependent on another
sequence as shown in Figure 2:
CATGACCCGCAAATCTGAAACTATCTGGCCCTTGGCAGGGGAAGTT.......TGAGCGACGTTAGATCTCTGTCCAAATTTGCCTCAAACTGCAGCCAG
CATGA GACCCGCAAA TCTGAAACTA CCTTGGCAGG
GCCAG AACTGCAGCC AAATTTGCCT ACGTTAGATC
Gap=-2
Gap=0
Gap=6 Gap=-3
Gap=2
Gap=7
Genome
GG DNB
GG
Figure 2. In this example, the likelihood of occurrence of the red gaps depends on the red sequence (11-16 bases from the clone end). The likelihood of occurrence of the blue gaps depends on the blue sequence (23-28 bases from the end of the nearest red gap).
Left Arm
Mate Gap
Right Arm

17 | P a g e Data File Formats v1.2 Apr-2010
© 2010 Complete Genomics, Inc. All rights reserved.
In this example, there will be two sequence dependent gaps files for each arm. The lib_gaps_L0_[LIBRARY_NAME].tsv and lib_gaps_R0_[LIBRARY_NAME].tsv files will describe the sequence dependent frequency of the two gaps nearest the clone end (red in the diagram) for their respective arms, and they may have the same column header (because gap offsets are described as offsets from the end of the
clone in these files). For example, a portion of these files might look like this:
>sequence:11-16;firstGap:0;gapCount:2 gaps:-3;0 gaps:-2;0 gaps:-2;1
AAAAA 2.96E-02 8.50E-01 2.24E-02
AAAAC 2.91E-02 8.63E-01 1.45E-02
AAAAG 3.39E-02 8.58E-01 2.15E-02
AAAAT 3.15E-02 8.56E-01 2.26E-02
AAAAN 3.09E-02 8.60E-01 2.09E-02
AAACA 2.56E-02 8.62E-01 1.72E-02
The remaining gaps file for each arm lib_gaps_L1_[LIBRARY_NAME].tsv and lib_gaps_R1_[LIBRARY_NAME].tsv will describe the sequence dependent frequency of the gap nearest the mate gap (blue in the diagram) for each arm, and they may have the same column header. For example, a
portion of these files might look like this:
>sequence:23-28;firstGap:2;gapCount:1 gaps:5 gaps:6 gaps:7
AAAAA 2.86E-01 5.93E-01 9.21E-02
AAAAC 3.01E-01 5.73E-01 9.88E-02
AAAAG 2.92E-01 5.86E-01 9.10E-02
AAAAT 2.81E-01 5.96E-01 9.21E-02
AAAAN 2.88E-01 5.90E-01 9.29E-02
AAACA 2.86E-01 5.87E-01 1.02E-01
3.2.4 ASM directory - Assembly and variations identified
The files in this directory describe and annotate the genome assembly with respect to the reference genome. The ASM directory contains the primary results of the assembly within one file: var-[ASM-ID].tsv.bz2 the
variations file. The file var-[ASM-ID].tsv.bz2 includes a description of all loci where the assembled genome
differs from the reference genome.
[ASM-ID] in the file name is the assembly ID for this genome assembly.
In addition to these files, annotations of the assembled sequence with respect to the dbSNP database, RefSeq transcripts, and protein sequences are included. Also included in the REF subdirectory are files containing supplementary information: the sequence coverage at each reference genomic position and a score indicating the likelihood of the genome being homozygous and identical to the reference at each
position.

18 | P a g e Data File Formats v1.2 Apr-2010
© 2010 Complete Genomics, Inc. All rights reserved.
var-[ASM-ID].tsv.bz2
Variation records described in Table 9 have the following fields:
Column # Column Name Description
1 locus Identifier of a particular genomic locus
2 ploidy
The ploidy of the reference genome at the locus (= 2 for autosomes, 2 for pseudoautosomal regions on the sex chromosomes, 1 for males on the non-pseudoautosomal parts of the sex chromosomes, 1 for mitochondrion, “?” if varType is “no-ref” or “PAR-called-in-X”). The reported ploidy is fully determined by gender, chromosome and location, and is not inferred from the sequence data.
3 haplotype
Identifier for each haplotype at the variation locus. For diploid genomes, 1 or 2. Shorthand of “all” is allowed where the varType field is one of “ref”, “no-call”, “no-ref”, or “PAR-called-in-X”. Haplotype numbering does not imply phasing; haplotype 1 in locus 1 is not necessarily in phase with haplotype 1 in locus 2. See hapLink, below, for phasing information.
4 chromosome Chromosome name in text: “chr1”,”chr2”,…,“chr22”,”chrX”,”chrY”. The mitochondrion is represented as “chrM”. The pseudoautosomal regions within the sex chromosomes X and Y are reported at their coordinates on chromosome X.
5 begin Reference coordinate specifying the start of the variation (not the locus) using the half-open zero-based coordinate system. See section “Sequence Coordinate System” for more information.
6 end
Reference coordinate specifying the end of the variation (not the locus) using the
half-open zero-based coordinate system. See section “Sequence Coordinate System” for more information.
7 varType
Type of variation, currently one of:
snp: single-nucleotide polymorphism
ins: insertion
del: deletion
sub: Substitution of one or more reference bases with the bases in the allele column
„ref‟ : no variation; the sequence is identical to the reference sequence on the indicated haplotype
no-call-rc: “no-call reference consistent “one or more bases are ambiguous, but the allele is potentially consistent with the reference
no-call-ri: “no-call reference inconsistent” one or more bases are ambiguous, but the allele is definitely inconsistent with the reference
no-call: an allele is completely indeterminate in length and composition, i.e. alleleSeq = „?‟
no-ref: the reference sequence is unspecified at this locus.
PAR-called-in-X: this locus overlaps one of the pseudoautosomal regions on the sex chromosomes. The called sequence is reported as diploid sequence on Chromosome X; on chromosome Y the sequence is reported as varType = “PAR-called-in-X”.
8 reference
The reference sequence for the locus of variation. Empty when varType is ins. A value of „=‟ indicates that the user must consult the reference for the sequence; this shorthand is only used in regions where no haplotype deviates from the reference sequence.
9 alleleSeq The observed sequence at the locus of variation. Empty when varType is del. “?” is

19 | P a g e Data File Formats v1.2 Apr-2010
© 2010 Complete Genomics, Inc. All rights reserved.
used to indicate 0 or more unknown bases within the sequence; “N” is used to indicate exactly one unknown base within the sequence.”=” is used as shorthand to indicate identity to the reference sequence for non-variant sequence, i.e. when varType is „ref‟.
10 totalScore A score corresponding to a single variation and haplotype, representing the confidence in the call.
11 hapLink Identifier that links a haplotype at one locus to haplotypes at other loci. Currently only populated for very proximate variations that were assembled together. Two calls that share a hapLink identifier are expected to be on the same haplotype,
12 xRef Field containing external variation identifiers, currently only populated for variations corroborated directly by dbSNP. Format: dbsnp:[rsID], with multiple entries separated by the semicolon (;).
Table 9: Variations block description
An example of a portion of the “var-[ASM-ID].tsv.bz2” file is shown below:
>locus
ploidy
haplotype
chromosome
begin
end
varType
reference
alleleSeq
totalScore
hapLink
xRef
974 2 all chr1 5099 5126 no-call = ?
975 2 all chr1 5126 5145 ref = =
976 2 1 chr1 5145 5146 snp G T 87
dbsnp:806
976 2 2 chr1 5145 5146 snp G T 58
dbsnp:806
977 2 all chr1 5146 5212 ref = =
978 2 1 chr1 5212 5215 ref GTC GTC 36
978 2 2 chr1 5212 5215 no-call-rc GTC ?T? 36
979 2 all chr1 5215 5363 ref = =
980 2 1 chr1 5363 5363 ins G
47
980 2 2 chr1 5363 5363 ref
55
981 2 all chr1 5363 6464 ref = =
982 2 1 chr1 6464 6465 del T
57
982 2 2 chr1 6464 6465 del T
65
983 2 all chr1 6465 8600 ref = =
984 2 1 chr1 8600 8601 ref C C 120
984 2 2 chr1 8600 8601 snp C T 479
985 2 all chr1 8601 9559 ref = =
986 2 1 chr1 9559 9563 ref ACGG ACGG 65 779
986 2 1 chr1 9563 9564 snp C G 47 779
986 2 1 chr1 9564 9566 ref GT GT 69 779
986 2 2 chr1 9559 9566 no-call ACGGCGT ?
780
987 2 all chr1 9566 9569 ref = =
988 2 1 chr1 9569 9570 ref C C 47 779
988 2 2 chr1 9569 9570 no-call-ri C G? 45 780

20 | P a g e Data File Formats v1.2 Apr-2010
© 2010 Complete Genomics, Inc. All rights reserved.
Notes: 1) Locus 974 is a „no-call‟ extending from position 5099 to 5126. The haplotype value of „all‟ is shorthand to
indicate that both haplotypes are unresolved over this sequence range. 2) Loci 975, 977 and 979 identify regions that are confirmed to be homozygous and identical to the
reference sequence. In these cases, varType is „ref‟ and both the reference and alleleSeq fields are reported as „=‟, which is shorthand for the reference sequence over the specified sequence range.
3) The first set of variations (locus ID=976) is an example of a homozygous SNP call, where the reference sequence is a „G‟ and the assembled genome has two copies of the „T‟ allele. The confidence score for the existence of at least one „T‟ allele is 87 and the confidence score for the existence of two „T‟ alleles is 58. This variation has the dbSNP identifier “rs806”.
4) Variation ID 980 is an example of an insertion event in one of the haplotypes. An insertion of a „G‟ is seen at position 5363 in haplotype 1, while haplotype 2 has the reference sequence, with a vartype of „ref‟.
5) A homozygous deletion of a „T‟ is found in variation ID 982 at position 6464, indicated by the calling of a „del‟ variation in both haplotypes.
6) A heterozygous SNP „C/T‟ call is found in variation ID 984, where reference shows a „C” and the assembled genome has a „C‟ allele in one haplotype and a „T‟ in the other.
7) Variation ID 978 shows an example where only one of the two haplotypes is called. The assembled genome is identical to the reference (in this case, the bases „GTC‟) on one haplotype, while the other allele could not be fully called due to competing alternate hypotheses that could not be adequately discriminated. The alleleSeq column shows „?T?‟ in this case. The type of allele is „no-call-rc’, which indicates that although the assembly software did not fully resolve the sequence for this region, the call made is consistent with the reference sequence.
8) An example of a „no-call-ri‟ call is shown for locus 988. One haplotype of the assembled genome is identical to the reference (a „C‟ at position 9569), but on the other haplotype the „C‟ has been replaced by a „G‟, and there is uncertainty about the insertion of more bases to the right of this one (indicated by „?‟).
9) The locus with ID = 986 depicts a more complex situation, where there are three calls for one haplotype (1) and a „no-call‟ unresolved call for the other haplotype. There is only one variation call on haplotype 1 (a SNP at position 9564) but neither the length nor the composition of the sequence on the other haplotype could be reliably determined over this locus. This variation also has a value in the haplink column (780) which links this variation to variation with ID 988 on haplotype 2. This indicates that these
variations are in phase with one another.
21 | P a g e Data File Formats v1.2 Apr-2010
© 2010 Complete Genomics, Inc. All rights reserved.
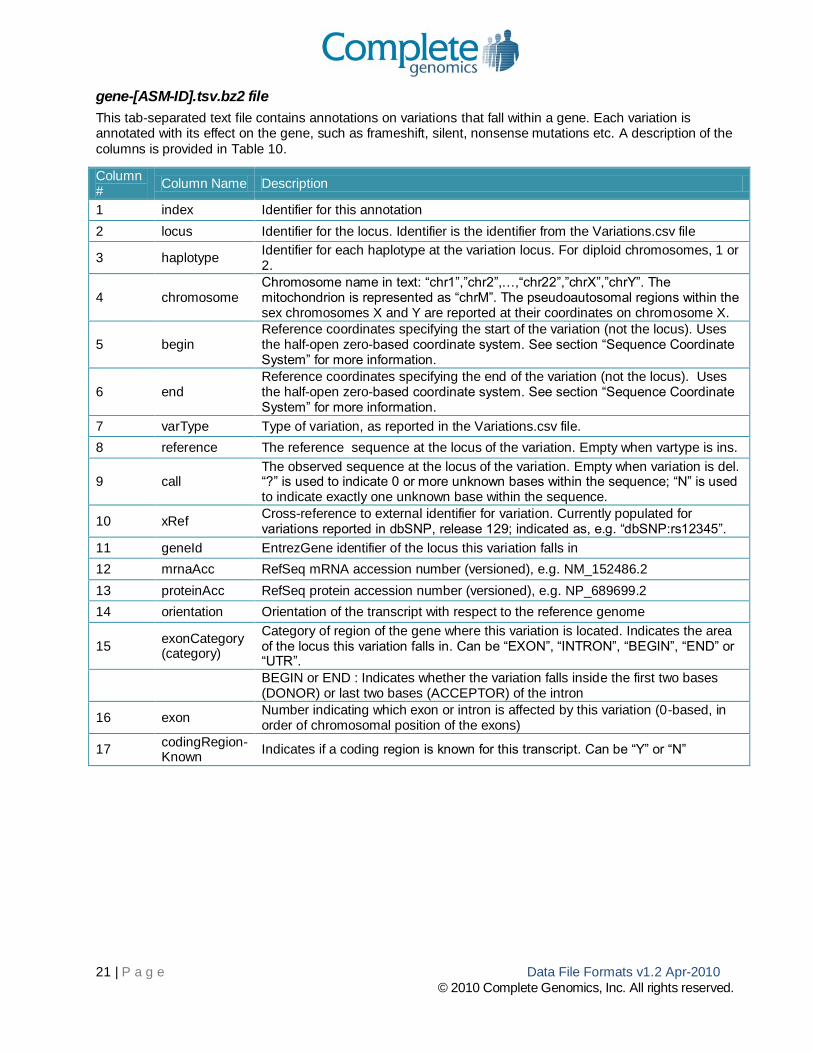
gene-[ASM-ID].tsv.bz2 file
This tab-separated text file contains annotations on variations that fall within a gene. Each variation is annotated with its effect on the gene, such as frameshift, silent, nonsense mutations etc. A description of the
columns is provided in Table 10.
Column #
Column Name Description
1 index Identifier for this annotation
2 locus Identifier for the locus. Identifier is the identifier from the Variations.csv file
3 haplotype Identifier for each haplotype at the variation locus. For diploid chromosomes, 1 or 2.
4 chromosome Chromosome name in text: “chr1”,”chr2”,…,“chr22”,”chrX”,”chrY”. The mitochondrion is represented as “chrM”. The pseudoautosomal regions within the sex chromosomes X and Y are reported at their coordinates on chromosome X.
5 begin Reference coordinates specifying the start of the variation (not the locus). Uses the half-open zero-based coordinate system. See section “Sequence Coordinate System” for more information.
6 end Reference coordinates specifying the end of the variation (not the locus). Uses the half-open zero-based coordinate system. See section “Sequence Coordinate System” for more information.
7 varType Type of variation, as reported in the Variations.csv file.
8 reference The reference sequence at the locus of the variation. Empty when vartype is ins.
9 call The observed sequence at the locus of the variation. Empty when variation is del. “?” is used to indicate 0 or more unknown bases within the sequence; “N” is used to indicate exactly one unknown base within the sequence.
10 xRef Cross-reference to external identifier for variation. Currently populated for variations reported in dbSNP, release 129; indicated as, e.g. “dbSNP:rs12345”.
11 geneId EntrezGene identifier of the locus this variation falls in
12 mrnaAcc RefSeq mRNA accession number (versioned), e.g. NM_152486.2
13 proteinAcc RefSeq protein accession number (versioned), e.g. NP_689699.2
14 orientation Orientation of the transcript with respect to the reference genome
15 exonCategory (category)
Category of region of the gene where this variation is located. Indicates the area of the locus this variation falls in. Can be “EXON”, “INTRON”, “BEGIN”, “END” or “UTR”.
BEGIN or END : Indicates whether the variation falls inside the first two bases (DONOR) or last two bases (ACCEPTOR) of the intron
16 exon Number indicating which exon or intron is affected by this variation (0-based, in order of chromosomal position of the exons)
17 codingRegion-Known
Indicates if a coding region is known for this transcript. Can be “Y” or “N”
22 | P a g e Data File Formats v1.2 Apr-2010
© 2010 Complete Genomics, Inc. All rights reserved.
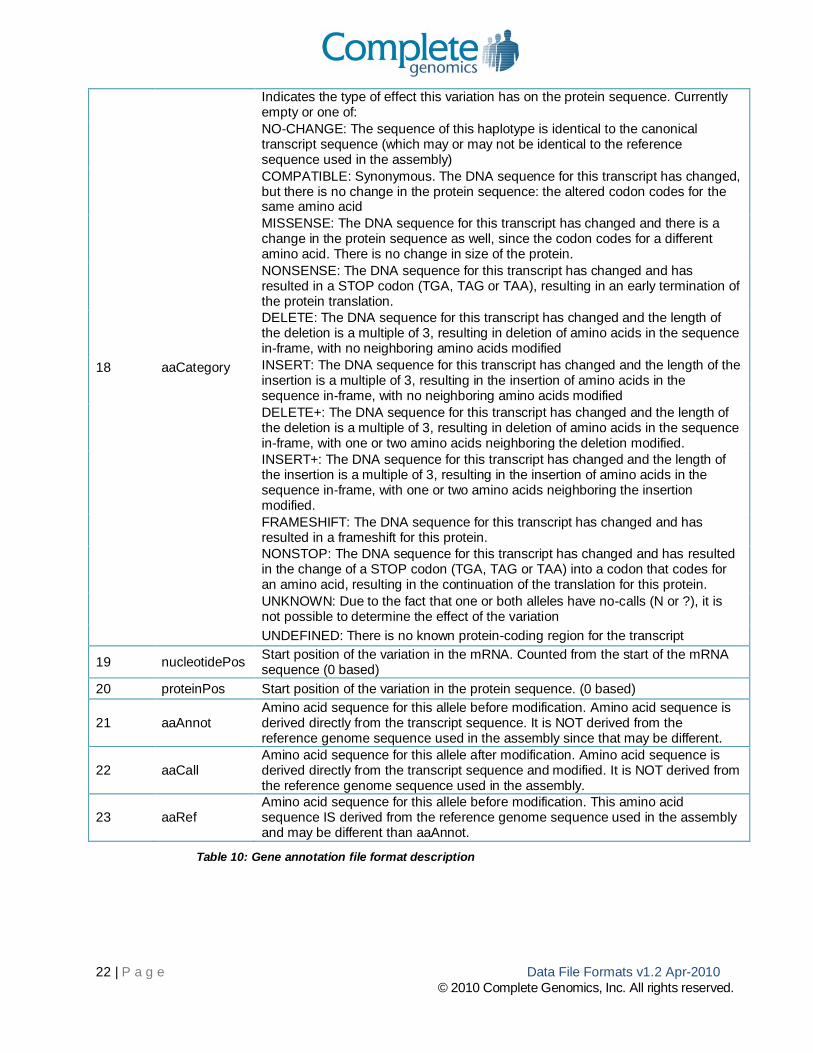
18 aaCategory
Indicates the type of effect this variation has on the protein sequence. Currently empty or one of:
NO-CHANGE: The sequence of this haplotype is identical to the canonical transcript sequence (which may or may not be identical to the reference sequence used in the assembly)
COMPATIBLE: Synonymous. The DNA sequence for this transcript has changed, but there is no change in the protein sequence: the altered codon codes for the same amino acid
MISSENSE: The DNA sequence for this transcript has changed and there is a change in the protein sequence as well, since the codon codes for a different amino acid. There is no change in size of the protein.
NONSENSE: The DNA sequence for this transcript has changed and has resulted in a STOP codon (TGA, TAG or TAA), resulting in an early termination of the protein translation.
DELETE: The DNA sequence for this transcript has changed and the length of the deletion is a multiple of 3, resulting in deletion of amino acids in the sequence in-frame, with no neighboring amino acids modified
INSERT: The DNA sequence for this transcript has changed and the length of the insertion is a multiple of 3, resulting in the insertion of amino acids in the sequence in-frame, with no neighboring amino acids modified
DELETE+: The DNA sequence for this transcript has changed and the length of the deletion is a multiple of 3, resulting in deletion of amino acids in the sequence in-frame, with one or two amino acids neighboring the deletion modified.
INSERT+: The DNA sequence for this transcript has changed and the length of the insertion is a multiple of 3, resulting in the insertion of amino acids in the sequence in-frame, with one or two amino acids neighboring the insertion modified.
FRAMESHIFT: The DNA sequence for this transcript has changed and has resulted in a frameshift for this protein.
NONSTOP: The DNA sequence for this transcript has changed and has resulted in the change of a STOP codon (TGA, TAG or TAA) into a codon that codes for an amino acid, resulting in the continuation of the translation for this protein.
UNKNOWN: Due to the fact that one or both alleles have no-calls (N or ?), it is not possible to determine the effect of the variation
UNDEFINED: There is no known protein-coding region for the transcript
19 nucleotidePos Start position of the variation in the mRNA. Counted from the start of the mRNA sequence (0 based)
20 proteinPos Start position of the variation in the protein sequence. (0 based)
21 aaAnnot Amino acid sequence for this allele before modification. Amino acid sequence is derived directly from the transcript sequence. It is NOT derived from the reference genome sequence used in the assembly since that may be different.
22 aaCall Amino acid sequence for this allele after modification. Amino acid sequence is derived directly from the transcript sequence and modified. It is NOT derived from the reference genome sequence used in the assembly.
23 aaRef Amino acid sequence for this allele before modification. This amino acid sequence IS derived from the reference genome sequence used in the assembly and may be different than aaAnnot.
Table 10: Gene annotation file format description

23 | P a g e Data File Formats v1.2 Apr-2010
© 2010 Complete Genomics, Inc. All rights reserved.
An example of a portion of the gene-[ASM-ID].tsv.bz2 file is shown below (long text in columns is wrapped
for clarity – this will not occur in an actual TSV file): >index
locus
haplotype
chromosome
begin
end
varType
reference
call
xRef
geneId
mrnaAcc
proteinAcc
orientatoin
exonCategory
exon
codingRegionKnown
aaCategory
nucleotidePos
proteinPos
aaAnnot
aaCall
aaRef
68 1269 1 chr1 59315 59316 snp G A dbsnp:rs2854
682
79501 NM_00100
5484.1
NP_00100
5484.1
+ EXON 0 Y COMPATIBLE 362 120 K K K
68 1269 2 chr1 59315 59316 ref G G 79501 NM_00100
5484.1
NP_00100
5484.1
+ EXON 0 Y NO-CHANGE 362 120 K K K
69 1271 1 chr1 59373 59374 snp A G dbsnp:rs2691
305
79501 NM_00100
5484.1
NP_00100
5484.1
+ EXON 0 Y MISSENSE 420 140 T A T
69 1271 2 chr1 59373 59374 snp A G dbsnp:rs2691
305
79501 NM_00100
5484.1
NP_00100
5484.1
+ EXON 0 Y MISSENSE 420 140 T A T
70 1273 1 chr1 59414 59415 snp G C dbsnp:rs5587
4132
79501 NM_00100
5484.1
NP_00100
5484.1
+ EXON 0 Y COMPATIBLE 461 153 A A A
70 1273 2 chr1 59414 59415 ref G G 79501 NM_00100
5484.1
NP_00100
5484.1
+ EXON 0 Y NO-CHANGE 461 153 A A A
24 | P a g e Data File Formats v1.2 Apr-2010
© 2010 Complete Genomics, Inc. All rights reserved.
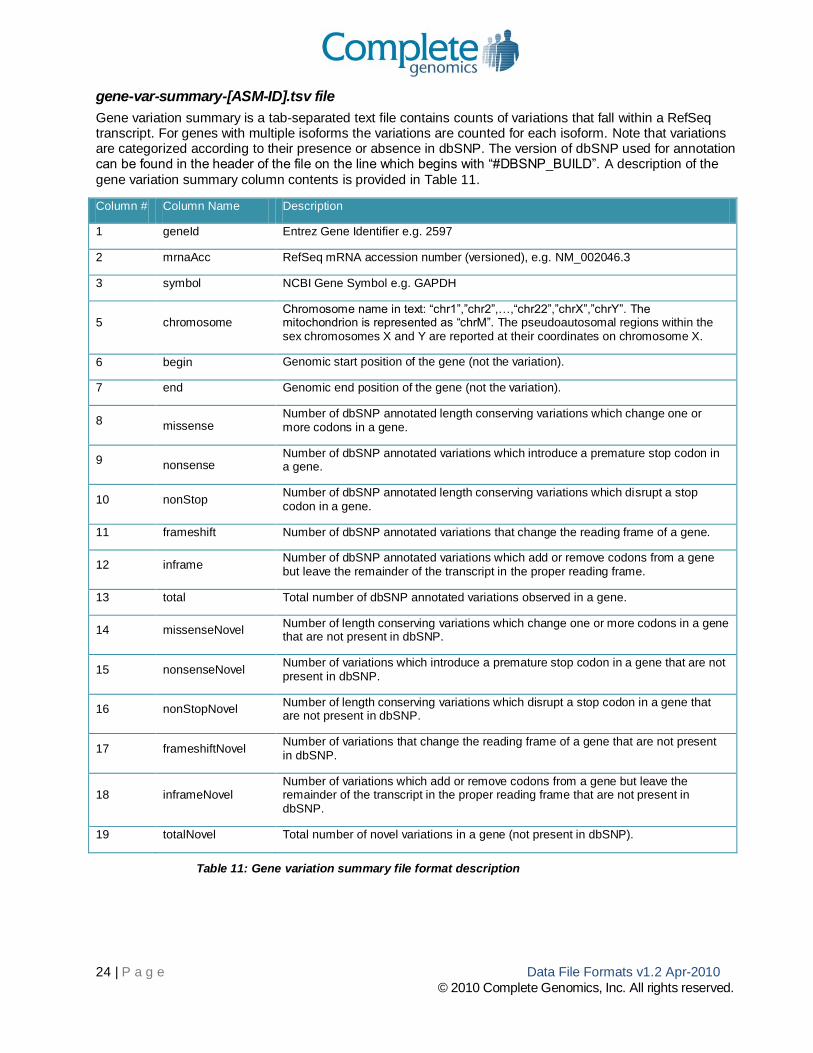
gene-var-summary-[ASM-ID].tsv file
Gene variation summary is a tab-separated text file contains counts of variations that fall within a RefSeq transcript. For genes with multiple isoforms the variations are counted for each isoform. Note that variations are categorized according to their presence or absence in dbSNP. The version of dbSNP used for annotation can be found in the header of the file on the line which begins with “#DBSNP_BUILD”. A description of the
gene variation summary column contents is provided in Table 11.
Column # Column Name Description
1 geneId Entrez Gene Identifier e.g. 2597
2 mrnaAcc RefSeq mRNA accession number (versioned), e.g. NM_002046.3
3 symbol NCBI Gene Symbol e.g. GAPDH
5 chromosome Chromosome name in text: “chr1”,”chr2”,…,“chr22”,”chrX”,”chrY”. The mitochondrion is represented as “chrM”. The pseudoautosomal regions within the sex chromosomes X and Y are reported at their coordinates on chromosome X.
6 begin Genomic start position of the gene (not the variation).
7 end Genomic end position of the gene (not the variation).
8 missense Number of dbSNP annotated length conserving variations which change one or more codons in a gene.
9 nonsense Number of dbSNP annotated variations which introduce a premature stop codon in a gene.
10 nonStop Number of dbSNP annotated length conserving variations which disrupt a stop codon in a gene.
11 frameshift Number of dbSNP annotated variations that change the reading frame of a gene.
12 inframe Number of dbSNP annotated variations which add or remove codons from a gene but leave the remainder of the transcript in the proper reading frame.
13 total Total number of dbSNP annotated variations observed in a gene.
14 missenseNovel Number of length conserving variations which change one or more codons in a gene that are not present in dbSNP.
15 nonsenseNovel Number of variations which introduce a premature stop codon in a gene that are not present in dbSNP.
16 nonStopNovel Number of length conserving variations which disrupt a stop codon in a gene that are not present in dbSNP.
17 frameshiftNovel Number of variations that change the reading frame of a gene that are not present in dbSNP.
18 inframeNovel Number of variations which add or remove codons from a gene but leave the remainder of the transcript in the proper reading frame that are not present in dbSNP.
19 totalNovel Total number of novel variations in a gene (not present in dbSNP).
Table 11: Gene variation summary file format description

25 | P a g e Data File Formats v1.2 Apr-2010
© 2010 Complete Genomics, Inc. All rights reserved.
An example of a portion of the gene-var-summary-[ASM-ID].tsv file is shown below: >geneId
mrnaAcc
chromosome
begin
end
missense
nonsense
nonStop
frameshift
inframe
total
missenseNovel
nonsenseNovel
nonStopNovel
frameshiftNovel
inframeNovel
totalNovel
9696 NM_014675.3 chr1 17121031 17172061 5 0 0 0 0 5 0 0 0 0 0 0
4237 NM_002403.2 chr1 17173583 17179726 0 0 0 0 0 0 0 0 0 0 0 0
4237 NM_017459.1 chr1 17173583 17180668 0 0 0 0 0 0 0 0 0 0 0 0
23400 NM_022089.1 chr1 17185039 17210854 1 0 0 0 0 1 0 0 0 0 0 0
6390 NM_003000.2 chr1 17217803 17253252 0 0 0 0 0 0 0 0 0 0 0 0
11240 NM_007365.2 chr1 17265842 17318535 0 0 0 0 0 0 0 0 0 0 0 0
400743 XM_001721788.1 chr1 17393407 17393980 3 0 0 0 0 3 0 0 0 0 0 0
29943 NM_013358.2 chr1 17404207 17445088 0 0 0 0 0 0 0 0 0 0 0 0

26 | P a g e Data File Formats v1.2 Apr-2010
© 2010 Complete Genomics, Inc. All rights reserved.
dbSNPAnnotated-[ASM-ID].tsv.bz2
This file contains all dbSNP entries with fully-defined alleles (not unspecified large insertions and deletions) and the calls that were made for each of the locations in the genome being sequenced (Table 12). Note “A” and “B” are used to indicate that allele information is present for both chromosomes but does not indicate the
origin of the chromosome.
Column # Column Name Description
1 dbSnpId Identifier for this dbSNP entry. Format is [DBNAME]:[ACC#]. DBNAME currently is “dbsnp” only and ACC# is the dbSNP identifier. (example: dbsnp:rs1167318)
2 alleles Alleles for the dbSNP entry. (e.g. “C/T”, “C/-“, etc.)
3 chromosome
Chromosome name in text: “chr1”,”chr2”,…,“chr22”,”chrX”,”chrY”. The mitochondrion is represented as “chrM”. The pseudoautosomal regions within the sex chromosomes X and Y are reported at their coordinates on chromosome X.
4 begin Reference coordinate specifying the start of the dbSNP entry. Uses the half-open zero-based coordinate system. See section “Sequence Coordinate System” for more information.
5 end Reference coordinate specifying the end of the dbSNP entry. Uses the half-open zero-based coordinate system. See section “Sequence Coordinate System” for more information.
6 reference The reference sequence at the locus of the variation.
7 found Indicates whether the variation was located on the assembled genome.
8 exactMatch
Indicates whether an exact match to the variation in dbSNP was detected. Partial matches are possible in the case of repeats, for instance, where the exact number of repeated copies in the database entry is not identical to the variation found. Value can be “Y” or “N”
9 loci When the genome assembly resulted in a call different from the reference, then the locus ID(s) from the variation file is given here, else blank. This field corresponds to column #1 of the variation file “var-[ASM-ID].tsv.bz2”
10 zygosity Indicates the zygosity of the call at this position. Can be “hom”, “het” or empty, for homozygous, heterozygous and unknown respectively.
11 varTypeA Indicates the type of variation at this location for the assembled genome for the “A” haplotype. Can be “ref”, “snp”, “sub”, “ins”, “del”, “no-call-rc”, and no-call-ri”.
12 hapA Sequence of the “A” haplotype.
13 scoreA Score of the “A” haplotype. (Empty in the case of a homozygous reference call).
14 chromosomeA Chromosome number where the “A” haplotype is found.
15 beginA
Reference coordinate specifying the start of the variation. Uses the half-open zero-based coordinate system. See section “Sequence Coordinate System” for more information. The pseudoautosomal Regions for the sex chromosomes X and Y are represented by their coordinates on chromosome X
16 endA
Reference coordinate specifying the end of the variation. Uses the half-open zero-based coordinate system. See section “Sequence Coordinate System” for more information. The pseudoautosomal Regions for the sex chromosomes X and Y are represented by their coordinates on chromosome X.
17 varTypeB Indicates the type of variation at this location for the assembled genome for the “B” haplotype. Can be “ref”, “snp”, “sub”, “ins”, “del”, “no-call-rc”, and no-call-ri”.
18 hapB Sequence of the “B” haplotype.

27 | P a g e Data File Formats v1.2 Apr-2010
© 2010 Complete Genomics, Inc. All rights reserved.
19 scoreB Score of the “B” haplotype. (Empty in the case of a homozygous reference call).
20 chromosomeB Chromosome number where the “B” haplotype is found.
21 beginB
Reference coordinate specifying the start of the variation. Uses the half-open zero-based coordinate system. See section “Sequence Coordinate System” for more information. The pseudoautosomal Regions for the sex chromosomes X and Y are represented by their coordinates on chromosome X.
22 endB
Reference coordinate specifying the end of the variation. Uses the half-open zero-based coordinate system. See section “Sequence Coordinate System” for more information. The pseudoautosomal Regions for the sex chromosomes X and Y are represented by their coordinates on chromosome X.
Table 12: Annotated dbSNP file format description
An example of a portion of the dbSNPAnnotated-[ASM-ID].tsv.bz2 file is shown below (long text in columns
is wrapped for clarity – this will not occur in an actual TSV file):
>dbSnpId
alleles
chromosome
begin
end
reference
found
exactMatch
loci
zygosity
varTypeA
hapA
scoreA
contigA
beginA
endA
varTypeB
hapB
scoreB
contigB
beginB
endB
dbsnp:rs11510383 T/C chr1 1730 1731 C Y Y hom ref C chr1 1730 1731 ref C chr1 1730 1731
dbsnp:rs4030194 G/A chr1 1757 1758 G Y Y hom ref G chr1 1757 1758 ref G chr1 1757 1758
dbsnp:rs57442816 T/C chr1 1783 1784 T ? N no-call-
rc
? chr1 1783 1784 no-
call-
rc
? chr1 1783 1784
dbsnp:rs4849250 T/C chr1 1808 1809 C Y Y hom ref C chr1 1808 1809 ref C chr1 1808 1809
dbsnp:rs7564627 G/A chr1 1809 1810 G Y Y hom ref G chr1 1809 1810 ref G chr1 1809 1810
dbsnp:rs2981848 G/A chr1 1823 1824 G ? N no-call-
rc
G? chr1 1823 1824 no-
call-
rc
G? chr1 1823 1824
REF Directory
The REF Directory contains the coverage and reference score data for each base position of the reference genome. The data are split into several files, one corresponding to each chromosome. The coverage data represents the number of uniquely and fully mapped DNBs that overlap each base position – more precisely, it counts all full-DNB mappings that have a mapping weight ratio > 0.99 overlapping each position. The reference score is a measure of confidence that the base at that position is the same as the reference genome (homozygous reference). The reference score is computed based on an examination of several
alternate hypotheses, including all heterozygous SNPs and some single-base insertions and deletions.
coverageRefScore-[chromosome-ID]-[ASM-ID].tsv.bz2
The reference score and coverage files are organized by chromosome. The chromosome number is also represented in the header key “#CHROMOSOME”. The file consists of three columns as described in Table
13:
Column Name Description
offset 0-based position within chromosome for the base
refScore
Reference score for the position. Positive values indicate greater confidence that the position is homozygous and identical to the reference
genome.

28 | P a g e Data File Formats v1.2 Apr-2010
© 2010 Complete Genomics, Inc. All rights reserved.
uniqueSequenceCoverage
Coverage of this position by unique, fully mapping reads (both arms map with expected order, orientation and separation, and the weight of this
mapping indicates only one high-probability mapping)
weightSumSequenceCoverage
Coverage of this position as determined by adding the weight ratio for each full DNB mapping covering this position. The weight ratio is a
measure of the probability that the mapping is correct for this DNB.
Table 13: Coverage and reference score file format description
An example of a coverage/refScore file is provided below:
>offset refScore uniqueSequenceCoverage weightSumSequenceCoverage
0 45 30 30
1 48 32 33
2 49 32 32
3 95 42 50
4 92 43 47
5 90 43 44
EVIDENCE Directory
The EVIDENCE Directory contains supporting information for intervals in the reference sequence where there is substantial evidence for variations from the reference sequence. The assembly software ordinarily proceeds by first identifying locations on the genome where variations from the homozygous reference are suggested, and then attempts to resolve the sequence at these locations by synthesizing the available evidence. This directory contains files that enumerate these locations on the genome, list the alleles within the most likely hypothesis at each location and describe the DNB alignments supporting each allele and the reference sequence. Finally, when pairs of genomic intervals share contributions from a subset of DNBs,
information is provided on pairwise correlations between those intervals.
For normal genomes, the information in this directory allows for a detailed investigation of the supporting evidence for each allele. For abnormal genomes such as tumors, in which both the ploidy and purity might
vary, this information might help assess the strength of evidence for putative novel alleles observed.
Data is reported for genomic intervals when (i) the most likely hypothesis explaining the observed data differs from the homozygous reference hypothesis, and (ii) the most likely hypothesis is more likely than the homozygous reference hypothesis by a threshold (currently a score difference of 20). For each allele, alignments are shown for all DNBs that support one of the alleles reported over another by a score difference of 3. Only the best alignment is shown for each DNB-allele pair. The data of each type (evidence intervals, evidence DNBs) are split into several files, one for each chromosome. This information may be converted to other formats such as SAM
ii. We internally maintain an example script that performs such a conversion.
Example scripts may be obtained by requesting them from [email protected].

29 | P a g e Data File Formats v1.2 Apr-2010
© 2010 Complete Genomics, Inc. All rights reserved.
evidenceIntervals-[chromosome-ID]-[ASM-ID].tsv.bz2 (Table 14)
Column Name Description
IntervalId Identifier for this evidence interval. Cross-referenced with evidenceDnbs file.
Chromosome
Chromosome name in text: “chr1”,”chr2”,…,“chr22”,”chrX”,”chrY”. The mitochondrion is represented as “chrM”. The pseudoautosomal regions within the sex chromosomes X and Y are reported at their coordinates on chromosome X.
OffsetInChromosome
Reference coordinate specifying the start of the genomic interval. Uses the half-open zero-based coordinate system. See section “Sequence Coordinate System”
for more information.
Length Length in bases of the evidence interval.
Ploidy
Ploidy of the sequence over the interval = 1 for the non-pseudoautosomal fractions of the sex chromosomes in a male genome and for the mitochondrion;
= 2 otherwise).
AlleleIndexes
Semicolon-separated indices of the alleles in the called sequence. Allele0 is always the reference allele. The number of alleles equals the ploidy specified for the interval. For example, for a diploid interval in which the Assembly software predicts heterozygosity with one copy each of allele 0 and allele 1, AlleleIndexes would be “0;1”. A diploid interval with a single homozygous SNP predicted within
it would have AlleleIndexes = “1;1”.
Score
Score representing the strength of evidence for the called sequence over the interval, i.e. for the combination of alleles specified in AlleleIndexes, not factoring
in correlations with other genomic intervals.
Allele0 The sequence of Allele0, which by construction is identical to the reference
genome over the evidence interval.
Allele1 The sequence of Allele1, which must differ from the reference sequence.
Allele2 The sequence of Allele2, which must differ from the reference sequence. Blank
unless the most likely sequence hypothesis has two non-reference alleles.
Allele1Alignment
The alignment of Allele1 to the reference genome, specified in a Cigar format (see section 3.2.6 “Alignment Cigar Format” for details). Blank when Allele1 is
absent.
Allele2Alignment
The alignment of Allele2 to the reference genome, specified in a Cigar format (see section 3.2.6 “Alignment Cigar Format” for details). Blank when Allele2 is
absent.
Table 14: Evidence interval file format description

30 | P a g e Data File Formats v1.2 Apr-2010
© 2010 Complete Genomics, Inc. All rights reserved.
An example of an evidence interval file is provided below: >IntervalId
Chromosome
OffsetInChromosome
Length
Ploidy
AlleleIndexes
Score
Allele0
Allele1
Allele2
Allele1Alignment
Allele2Alignment
0 chr1 968 14 2 1;2 38 GTCACGGTGGCGCG GTCACGGCGGCGCG GTCACGGTACCCCG 14M 14M
1 chr1 1267 8 2 1;1 895 GCCCACCT GCCCGCCT 8M
2 chr1 1367 7 2 0;1 1178 TAGACTC TAGGCTC 7M
evidenceDnbs-[chromosome-ID]-[ASM-ID].tsv.bz2 (Table 15)
Column Name Description
IntervalId Identifier for this evidence interval. Cross-referenced with evidenceIntervals file.
Chromosome Chromosome name in text: “chr1”,”chr2”,…,“chr22”,”chrX”,”chrY”. The mitochondrion is represented as “chrM”. The pseudoautosomal regions within the sex chromosomes X and Y are reported at their
coordinates on chromosome X.
Slide Identifier for the Slide from which data for this half-DNB was obtained.
Lane Identifier for the lane within the slide from which data for this half-DNB was obtained.
FileNumInLane The file number of the reads file describing this DNB. (e.g. X in reads_slide-lane_00X.tsv.bz2)
DnbOffsetInLaneFile Record within data for the slide lane in reads_slide-lane_00X.tsv.bz2 that corresponds to this DNB.
AlleleIndex An index specifying which allele this half-DNB mapping supports the most. The sequence of the allele and its alignment to the reference are specified in evidenceIntervals-[chromosome-ID]-[ASM-ID].tsv.bz2.
Side
A single character, “L” or “R”, specifying the location of this half-DNB within the DNB, For DNBs with the
architecture specified in Figure 1, “L” refers to bases 1 – 35 of the 70-base DNB read set, and “R” refers to bases 36 – 70.
Strand The strand of the half-DNB, “+” or “-“, expressed relative to the reference genome
OffsetInAllele The position at which the half-DNB starts (as seen on the “+” strand) relative to the start of the allele
sequence in the evidence interval. The offset may be positive or negative.
AlleleAlignment The alignment of the half-DNB to the allele sequence, provided in an extended cigar format (see section
3.2.6 “Alignment Cigar Format” for details).
OffsetInReference The chromosomal position on the reference genome at which the half-DNB starts (as seen on the “+”
strand).
ReferenceAlignment The alignment of the half-DNB to the reference genome, specified in a Cigar format (see section 3.2.6 “Alignment Cigar Format” for details).
MateOffsetInReference The chromosomal position at which the mate of this half-DNB starts on the reference genome.
MateReferenceAlignment Alignment of the mate of this half-DNB to the reference genome, specified in a cigar format (see section
3.2.6 “Alignment Cigar Format” for details).
MappingQuality
A Phred-like encoding of the probability that this half-DNB mapping is incorrect, encoded as a single
character with Ascii-33i. The mapping quality is related to the existence of alternate mappings; the Phred
score is obtained by subtracting 33 from the Ascii code of the character.
ScoreAllele0 A score representing the likelihood that this DNB arose from Allele0, the reference allele. A higher score
than that for other alleles indicates that this DNB most likely arose from sequence identical to the reference.

31 | P a g e Data File Formats v1.2 Apr-2010
© 2010 Complete Genomics, Inc. All rights reserved.
ScoreAllele1 A score representing the likelihood that this DNB arose from Allele1. A higher score than that for other alleles indicates that this DNB most likely arose from Allele 1.
ScoreAllele2
A score representing the likelihood that this DNB arose from Allele2. Computed as {10 log10 [P(DNB|Allele2) / PDNBSBase]}, where P(DNB|Allele1) is the likelihood that this DNB arose from Allele2
and PDNBSBase is the likelihood that this DNB arose from elsewhere on the reference genome. This field is blank when the most likely hypothesis does not include AlleleIndex 2.
Sequence Sequence of the DNB arm bases in the DNB order (same as in the reads_slide-lane_00X.tsv.bz2 file).
Scores Phred-like error scores for DNB bases in the DNB order, not separated (same as in the reads_slide-
lane_00X.tsv.bz2 file).
Table 15: Evidence mapping file format description
An example of an evidence mapping file is provided below (long text in columns is wrapped for clarity – this will not occur in an actual TSV file):
>IntervalId
Chromosome
Slide
Lane
OffsetInLane
AlleleIndex
Side
Strand
OffsetInAllele
AlleleAlignment
OffsetInReference
ReferenceAlignment
MateOffsetInReference
MateReferenceAlignment
MappingQuality
ScoreAllele0
ScoreAllele1
ScoreAllele2
Sequence
Scores
0 chr1 GS08082-
FS3
L02 26934240 0 R - -8 5M2B10
M0N10M
6N10M
960 5M2B10
M0N10M
6N10M
1442 10M6N1
0M0N10
M2B5M
$ 3 0 0 CCTAGAGACATTGCT
GGTGGGATACGTACA
ATTCTTCTACCCGTC
CCGCGCCACCGTGAC
GTGAGAGTTT
899::7617738887
9;<<<;;:;;969::
2%6278999799942
818:5<<=<<:;:;:
79868*7988
0 chr1 GS08084-
FS3
L05 19495053 0 L + 11 5M2B10
M0N10M
5N10M
979 5M2B10
M0N10M
5N10M
1461 10M6N1
0M0N10
M2B5M
$ 3 3 0 GCGGCGCGCAGAGAC
GGGTAGAACCAATCC
GAAAATCCCACCAGC
TAGGAATGCCTGTTT
CTCCACTCAA
888928646566666
9<<:<;;;9:;:9;;
<9:988899:99888
;;<<<<<=<:;;;;:
8;6:42#)49
0 chr1 GS08086-
FS3
L05 72690110 0 R - 6 5M2B10
M0N10M
6N10M
974 5M2B10
M0N10M
6N10M
1487 10M6N1
0M0N10
M2B5M
$ 3 0 0 CTGGCGCAAAAATCC
AAAAGTAAATTGGAG
AAACACGGATTACTG
TACCCGTCTCTGCGC
CGCGCGCCAC
88889)786766766
:;<<;1-
7908;9::899:888
88999960:9<<<::
<;:78678604456:
:99
0 chr1 GS08087-
FS3
L02 19601948 0 R - -13 5M2B10
M0N10M
5N10M
955 5M2B10
M0N10M
5N10M
1426 10M6N1
0M0N10
M2B5M
$ 3 0 0 GGGATATACAGAACA
GTACAATTCTAATCA
GTTCACGTCTCTGCC
CCACCGTGACGTGAG
TTTCTCTGCG
898986668667666
:;;<<:9:;8:99:;
:9::889999+/%.$
;;:;;<;<;:::;:;
55474;:::9
0 chr1 GS08087-
FS3
L02 47476549 0 L + 11 5M2B10
M0N10M
6N10M
979 5M2B10
M0N10M
6N10M
1475 10M6N1
0M0N10
M2B5M
$ 3 3 0 GCGGCGCGCAGAGAC
GGGTAGAACCATCCG
AAAAGTCTAGGAATG
TCTCCACAAAGTGTT
TACTTTTTTG
88890.7,66/3226
:;<;<89;69:99::
::9:88999978998
;<;<<;=<;::<:;:
88847;::9:
correlation.tsv.bz2
The correlation file (Table 16) describes the results of a pairwise correlation analysis of all pairs of genomic intervals that share evidence from some of the same DNBs – this can happen when DNBs map well to more than one location on the genome (e.g. segmental duplications or regions with tandem repeats). The analysis
evaluates the likelihood of three two-region hypotheses with respect to the reference hypothesis:
i. that a non-reference allele occurs only in the first region,

32 | P a g e Data File Formats v1.2 Apr-2010
© 2010 Complete Genomics, Inc. All rights reserved.
ii. that a non-reference allele occurs only in the second region, and
iii. that a non-reference allele occurs in both regions.
The relative likelihood for each hypothesis to the null (reference) hypothesis is reported in decibels, i.e. as a Phred-like score. The Assembly software uses evidence of correlations among called loci to no-call one or
both instances of putative variations.
Column Name Description
Chromosome1
Chromosome name for the first interval in text: “chr1”,”chr2”,…,“chr22”,”chrX”,”chrY”. The mitochondrion is represented as “chrM”. The pseudoautosomal regions within the sex chromosomes X and Y are
reported at their coordinates on chromosome X.
OffsetInChromosome1
Reference coordinate specifying the start of the first genomic interval. Uses the half-open zero-based coordinate system. See section “Sequence Coordinate
System” for more information.
Length1 Length in bases of the first evidence interval.
Chromosome2
Chromosome name for the second interval in text: “chr1”,”chr2”,…,“chr22”,”chrX”,”chrY”. The mitochondrion is represented as “chrM”. The pseudoautosomal regions within the sex chromosomes X and Y are
reported at their coordinates on chromosome X.
OffsetInChromosome2
Reference coordinate specifying the start of the second genomic interval. Uses the half-open zero-based coordinate system. See section “Sequence Coordinate
System” for more information.
Length2 Length in bases of the second evidence interval.
P1 Score representing the likelihood of the hypothesis that a non-reference allele
exists in the first interval and the second interval is homozygous reference.
P2 Score representing the likelihood of the hypothesis that a non-reference exists in
the second interval and the first interval is homozygous reference.
P12 Score representing the likelihood of the hypothesis that a non-reference allele
exists in both intervals.
Table 16: Correlation file format description

33 | P a g e Data File Formats v1.2 Apr-2010
© 2010 Complete Genomics, Inc. All rights reserved.
3.2.5 Sequence Coordinate System
Sequence positions in the mapping and variations files are represented in half-open, zero-based coordinates, which denote locations between successive reference base positions. A substitution or deletion of the second base (T) in the sequence of length 8 below would have a start position of 1 and an end position of 2. An
insertion following the same second base would have both a start and end position of 2.
0 1 2 3 4 5 6 7 8 A T A G G C T A
All genomic coordinates are reported with respect to the NCBI Build 36 reference human genome assembly
iii.
All data for the pseudoautosomal regions on the Y chromosome in males are reported at their coordinates on the X chromosome. The ranges of the two pseudoautosomal regions on the sex chromosomes are:
Pseudoautosomal
Region Coordinates on Chromosome X Coordinates on Chromosome Y
1 0 – 2,709,519 0 – 2,709,519
2 154,584,237 - 154,913,753 57,443,437 - 57,772,953
Table 17: Sequence Coordinate System

34 | P a g e Data File Formats v1.2 Apr-2010
© 2010 Complete Genomics, Inc. All rights reserved.
3.2.6 Alignment Cigar Format
Alignments of DNBs and alleles to the reference sequence are represented in the evidence files in a “cigar-like” format, which resembles the cigar representation used by SAM
ii. It has additional features to support
overlaps in the DNB structure, as can occur between reads r1 and r2 or between r7 and r8 in the DNB architecture depicted in Figure 1.
The cigar representation is a concatenation of a sequence of integers and modifiers, e.g. "10M3N10M", which denotes an alignment with 10 matching or mismatching bases, followed by a 3-base gap, followed by 10 matching or mismatching bases. For DNB alignments to an allele or reference sequence reported in the file evidenceDnbs-[chromosome-ID]-[ASM-ID].tsv.bz2, the modifiers may be interpreted as follows in Table
18:
Cigar
Modifier Description
M Position within a DNB read that aligns to a base of sequence (may be a match, a mismatch, or a no-call)
N Bases in the sequence corresponding to a gap in the DNB (i.e. unsequenced bases between reads).
B Bases in the sequence corresponding to an overlap between consecutive reads within a DNB.
I Bases in the DNB that correspond to an insertion within the sequence to which it is aligned.
P Gap bases in the DNB (i.e. unsequenced bases between reads) that correspond to an insertion of bases within the sequence to which it is aligned.
D Bases in the sequence that are deleted within the DNB.
Table 18: Alignment Cigar Format Modifiers in evidenceDnbs-[chromosome-ID]-[ASM-ID].tsv.bz2
The cigar format is also used to represent the alignments of alleles to the reference sequence in evidenceIntervals-[chromosome-ID]-[ASM-ID].tsv.bz2. For these alignments, the modifiers are as follows in Table 19:
Cigar Modifier Description
M Position where the allele and reference sequence are aligned (may be a match, a
mismatch, or a no-call)
I Bases in the allele that are an insertion with respect to the reference sequence.
D Bases in the reference sequence that are deleted within the allele.
Table 19: Alignment Cigar Format Modifiers in evidenceIntervals-[chromosome-ID]-[ASM-ID].tsv.bz2
35 | P a g e Data File Formats v1.2 Apr-2010
© 2010 Complete Genomics, Inc. All rights reserved.
Index
A
adaptors · 5
allele · 18
alleleSeq · 18, 20
API · 1
architecture · 5
array · 5
ASM · 7, 17, 18, 19, 21, 24, 26
assembly · 17
B
bases · 5, 18, 20
begin · 18
C
calls · 20
checksums · 6
collection · 5
complete genome · 4
Complete Genomics · 4, 5
concatamer · 5
constructs · 5
contig · 18, 26
coordinate · 5, 18, 26, 27, 29, 32
csv · 19, 26
D
data integrity · 6
deletion · 18, 20, 33
delins · 18
directory · 4
DNB · 5, 9
E
empirically · 5
end · 18, 24, 33
example · 19, 20
F
FDF · 9
field · 5
Field · 19
four-adaptor · 5
G
gap · 5
gap distribution · 15
gap distributions · 5
gaps · 5
genome · 4, 17, 20
genomic DNA · 5
genomic location · 5
genomic position. · 5
H
half-DNB · 5
hapLink · 19
haplotype · 18, 19, 20
header · 27
human genome · 4
human genomes · 6
I
identifier · 19, 20
ins · 18
insertion · 18, 20, 33
L
lane · 5
library · 5
locus · 18, 19, 26, 27
M
manifest · 6
Manifest.[n].all · 6
mapping · 33
N
negative · 5
no-call · 18
O
operating systems · 6

36 | P a g e Data File Formats v1.2 Apr-2010
© 2010 Complete Genomics, Inc. All rights reserved.
P
paired-end · 5
phase · 20
PKCS #7 · 6
polymorphism · 18
position · 5, 20, 33
Pretty Good Privacy · 6
Pseudo Autosomal Regions · 11, 18, 24, 26, 27, 29, 30, 32
Public Key Cryptography Standards · 6
R
reads · 4, 5, 9
ref-consistent · 18, 20
reference · 4, 7, 17, 18, 20, 26, 33
reference genome · 7
ref-inconsistent · 18, 20
region · 5, 20
RSA Security · 6
S
score · 19, 20
scores · 9
sequence · 4, 5, 18, 20, 26, 33
signed · 6
snp · 18
structure · 4, 6
T
totalScore · 19
V
variation · 18, 19, 20, 26, 27, 29, 32
variations · 4, 17, 20, 21, 24, 33
Variations · 17, 18, 19, 21, 22, 24
vartype · 18, 20
© Copyright 2010. Complete Genomics, Inc. All rights reserved. cPAL and DNB are trademarks of Complete Genomics, Inc. in the US and certain other countries. All other trademarks are the property of their respective
owners.

37 | P a g e Data File Formats v1.2 Apr-2010
© 2010 Complete Genomics, Inc. All rights reserved.
i http://en.wikipedia.org/wiki/FASTQ_format
ii http://samtools.sourceforge.net/
iii http://www.ncbi.nlm.nih.gov/projects/mapview/map_search.cgi?taxid=9606&build=previous