figure 3.1 stages in electrical signal measuring system
DESCRIPTION
Figure 3.1 Stages in electrical signal measuring system. Figure 3.2 Generic voltage amplifier. Figure 3.3 Amplifier frequency response. Figure 3.4 Frequency distortion of a square wave due to high-frequency attenuation. Figure 3.5 Effect of phase angle on signal. - PowerPoint PPT PresentationTRANSCRIPT

Copyright ©2011 by Pearson Education, Inc.Upper Saddle River, New Jersey 07458
All rights reserved.
Introduction to Engineering Experimentation, Third EditionAnthony J. Wheeler • Ahmad R. Ganji
Figure 3.1 Stages in electrical signal measuring system.
Copyright ©2011 by Pearson Education, Inc.Upper Saddle River, New Jersey 07458
All rights reserved.
Introduction to Engineering Experimentation, Third EditionAnthony J. Wheeler • Ahmad R. Ganji
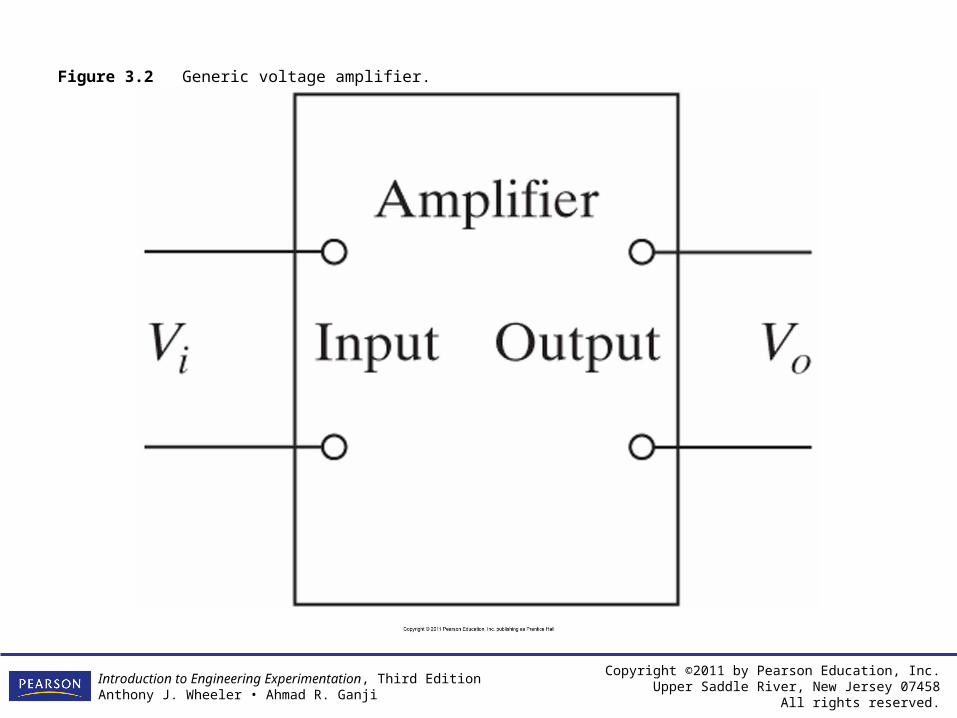
Figure 3.2 Generic voltage amplifier.

Copyright ©2011 by Pearson Education, Inc.Upper Saddle River, New Jersey 07458
All rights reserved.
Introduction to Engineering Experimentation, Third EditionAnthony J. Wheeler • Ahmad R. Ganji
Figure 3.3 Amplifier frequency response.

Copyright ©2011 by Pearson Education, Inc.Upper Saddle River, New Jersey 07458
All rights reserved.
Introduction to Engineering Experimentation, Third EditionAnthony J. Wheeler • Ahmad R. Ganji
Figure 3.4 Frequency distortion of a square wave due to high-frequency attenuation.

Copyright ©2011 by Pearson Education, Inc.Upper Saddle River, New Jersey 07458
All rights reserved.
Introduction to Engineering Experimentation, Third EditionAnthony J. Wheeler • Ahmad R. Ganji
Figure 3.5 Effect of phase angle on signal.

Copyright ©2011 by Pearson Education, Inc.Upper Saddle River, New Jersey 07458
All rights reserved.
Introduction to Engineering Experimentation, Third EditionAnthony J. Wheeler • Ahmad R. Ganji
Figure 3.6 Typical phase-angle response of amplifier.

Copyright ©2011 by Pearson Education, Inc.Upper Saddle River, New Jersey 07458
All rights reserved.
Introduction to Engineering Experimentation, Third EditionAnthony J. Wheeler • Ahmad R. Ganji
Figure 3.7 Effect on signal of linear and nonlinear phase-angle variation with frequency: (a) original signal; (b) phase angle varies linearly with frequency; (c) phase angle varies nonlinearly with frequency.
Copyright ©2011 by Pearson Education, Inc.Upper Saddle River, New Jersey 07458
All rights reserved.
Introduction to Engineering Experimentation, Third EditionAnthony J. Wheeler • Ahmad R. Ganji
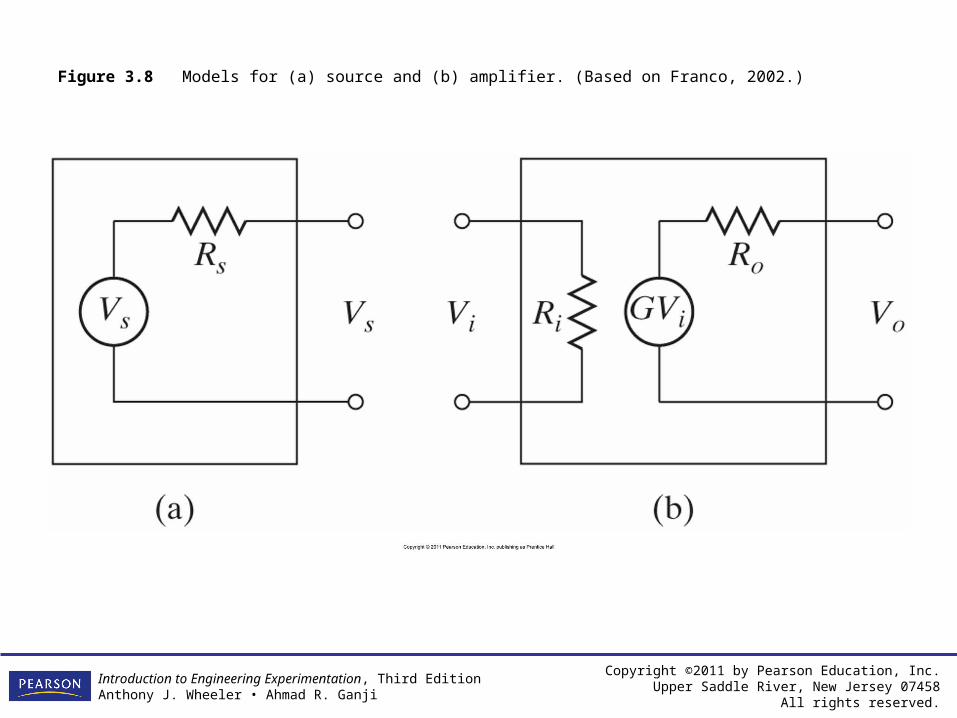
Figure 3.8 Models for (a) source and (b) amplifier. (Based on Franco, 2002.)

Copyright ©2011 by Pearson Education, Inc.Upper Saddle River, New Jersey 07458
All rights reserved.
Introduction to Engineering Experimentation, Third EditionAnthony J. Wheeler • Ahmad R. Ganji
Figure 3.9 Combined model of (a) input source, (b) amplifier, and (c) output load. (Based on Franco, 2002.)
Copyright ©2011 by Pearson Education, Inc.Upper Saddle River, New Jersey 07458
All rights reserved.
Introduction to Engineering Experimentation, Third EditionAnthony J. Wheeler • Ahmad R. Ganji
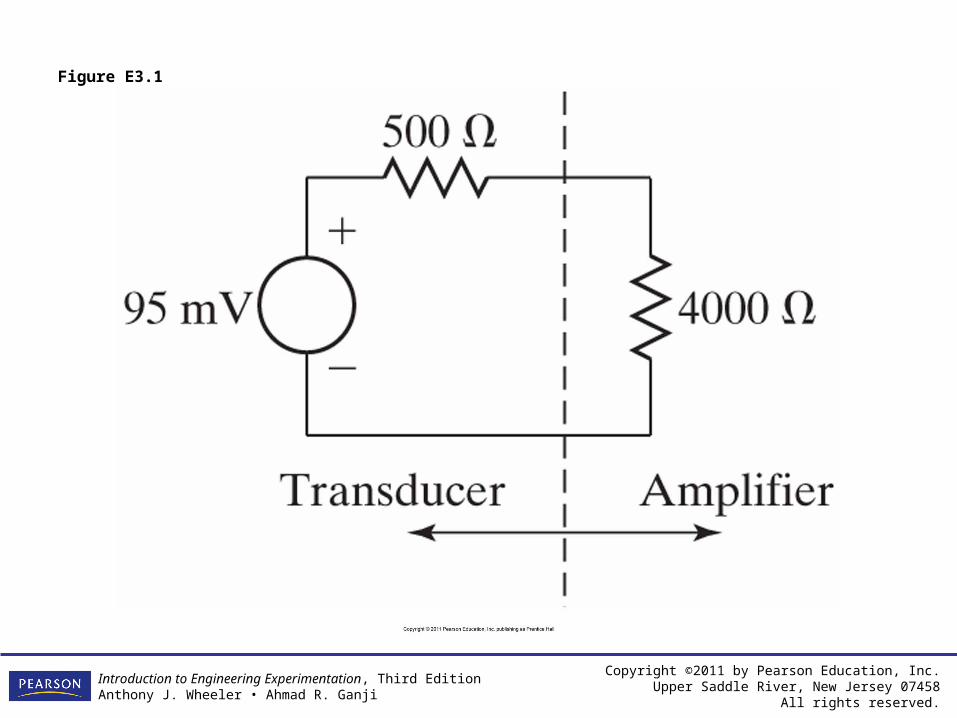
Figure E3.1
Copyright ©2011 by Pearson Education, Inc.Upper Saddle River, New Jersey 07458
All rights reserved.
Introduction to Engineering Experimentation, Third EditionAnthony J. Wheeler • Ahmad R. Ganji
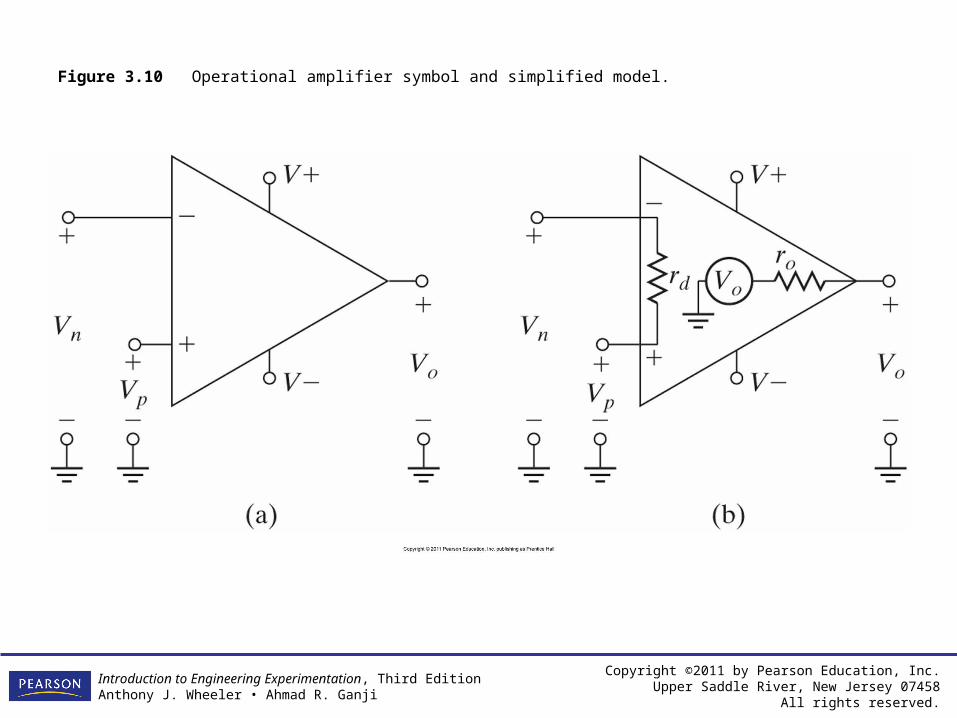
Figure 3.10 Operational amplifier symbol and simplified model.

Copyright ©2011 by Pearson Education, Inc.Upper Saddle River, New Jersey 07458
All rights reserved.
Introduction to Engineering Experimentation, Third EditionAnthony J. Wheeler • Ahmad R. Ganji
Figure 3.11 Simple noninverting amplifier using an op-amp.

Copyright ©2011 by Pearson Education, Inc.Upper Saddle River, New Jersey 07458
All rights reserved.
Introduction to Engineering Experimentation, Third EditionAnthony J. Wheeler • Ahmad R. Ganji
Figure 3.12 Frequency response of op-amp amplifier.
Copyright ©2011 by Pearson Education, Inc.Upper Saddle River, New Jersey 07458
All rights reserved.
Introduction to Engineering Experimentation, Third EditionAnthony J. Wheeler • Ahmad R. Ganji
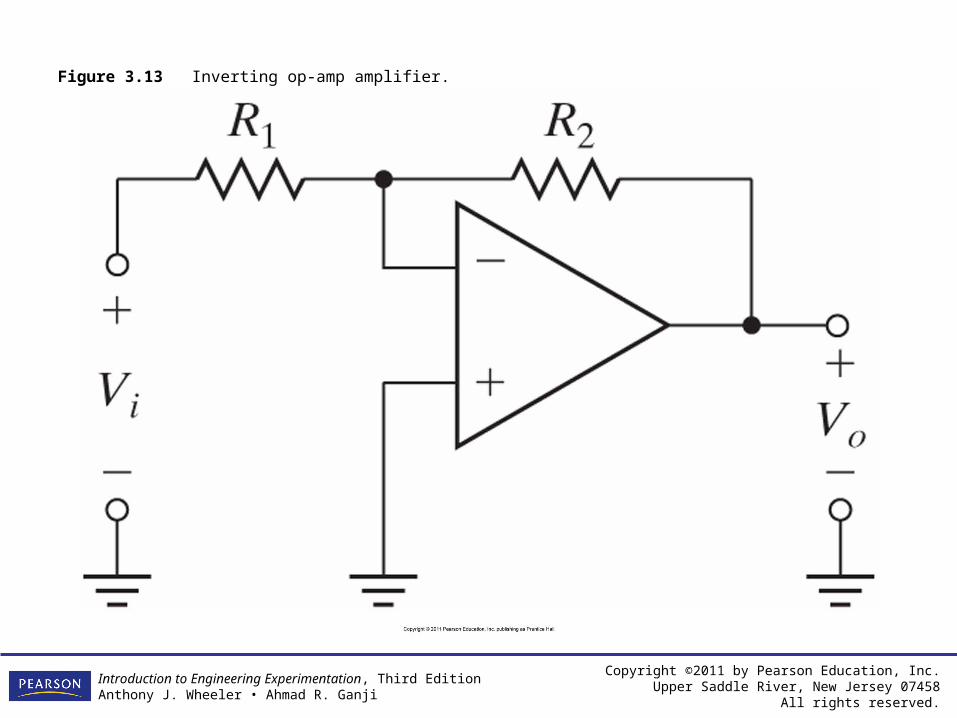
Figure 3.13 Inverting op-amp amplifier.

Copyright ©2011 by Pearson Education, Inc.Upper Saddle River, New Jersey 07458
All rights reserved.
Introduction to Engineering Experimentation, Third EditionAnthony J. Wheeler • Ahmad R. Ganji
Figure 3.14 True differential input instrument amplifier. (From Franco, 2002.)

Copyright ©2011 by Pearson Education, Inc.Upper Saddle River, New Jersey 07458
All rights reserved.
Introduction to Engineering Experimentation, Third EditionAnthony J. Wheeler • Ahmad R. Ganji
Figure 3.15 Attenuation using dividing network.

Copyright ©2011 by Pearson Education, Inc.Upper Saddle River, New Jersey 07458
All rights reserved.
Introduction to Engineering Experimentation, Third EditionAnthony J. Wheeler • Ahmad R. Ganji
Figure E3.3a

Copyright ©2011 by Pearson Education, Inc.Upper Saddle River, New Jersey 07458
All rights reserved.
Introduction to Engineering Experimentation, Third EditionAnthony J. Wheeler • Ahmad R. Ganji
Figure E3.3b
Copyright ©2011 by Pearson Education, Inc.Upper Saddle River, New Jersey 07458
All rights reserved.
Introduction to Engineering Experimentation, Third EditionAnthony J. Wheeler • Ahmad R. Ganji
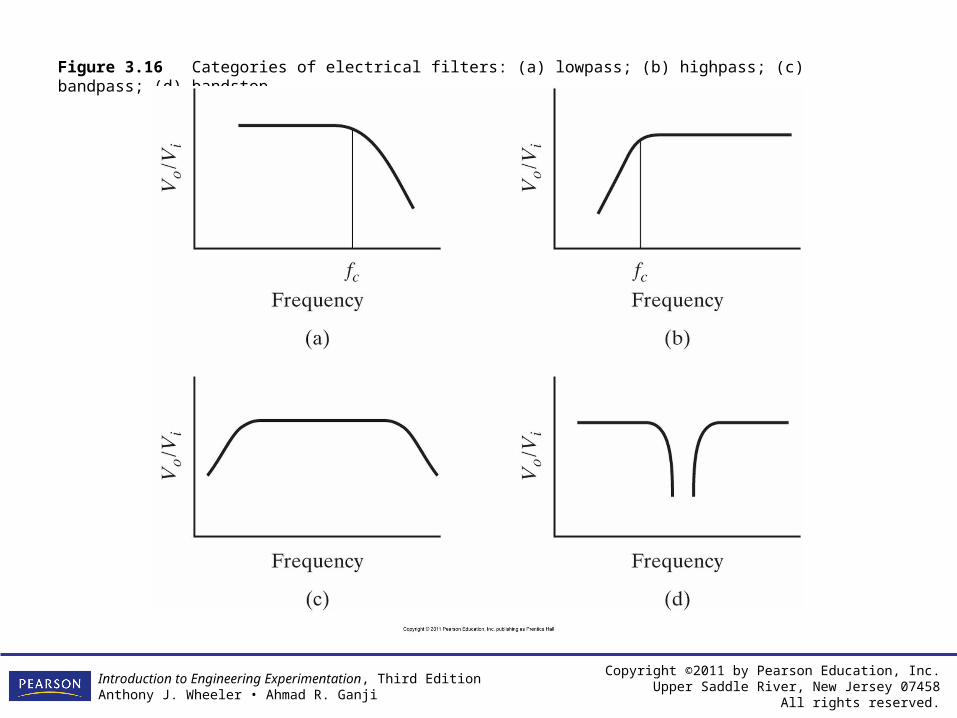
Figure 3.16 Categories of electrical filters: (a) lowpass; (b) highpass; (c) bandpass; (d) bandstop.
Copyright ©2011 by Pearson Education, Inc.Upper Saddle River, New Jersey 07458
All rights reserved.
Introduction to Engineering Experimentation, Third EditionAnthony J. Wheeler • Ahmad R. Ganji
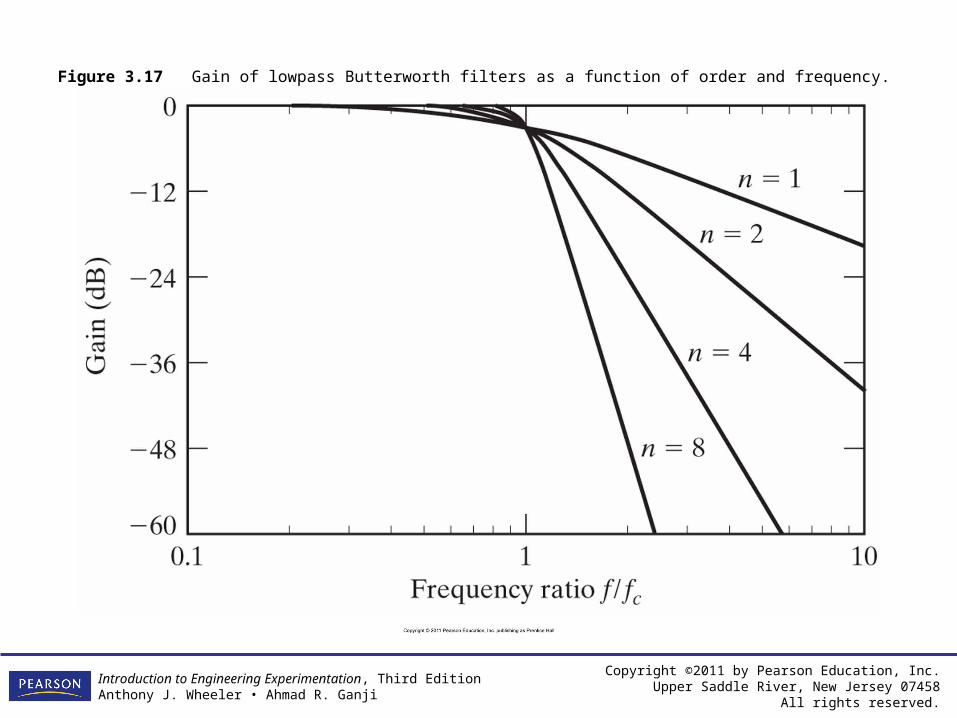
Figure 3.17 Gain of lowpass Butterworth filters as a function of order and frequency.

Copyright ©2011 by Pearson Education, Inc.Upper Saddle River, New Jersey 07458
All rights reserved.
Introduction to Engineering Experimentation, Third EditionAnthony J. Wheeler • Ahmad R. Ganji
Figure 3.18 Gain of lowpass Chebyshev filters as a function of order and frequency.

Copyright ©2011 by Pearson Education, Inc.Upper Saddle River, New Jersey 07458
All rights reserved.
Introduction to Engineering Experimentation, Third EditionAnthony J. Wheeler • Ahmad R. Ganji
Figure 3.19 Comparison of Butterworth and Bessel phase-angle variation with frequency.

Copyright ©2011 by Pearson Education, Inc.Upper Saddle River, New Jersey 07458
All rights reserved.
Introduction to Engineering Experimentation, Third EditionAnthony J. Wheeler • Ahmad R. Ganji
Figure 3.20 Gain of lowpass Bessel filters as a function of order and frequency.
Copyright ©2011 by Pearson Education, Inc.Upper Saddle River, New Jersey 07458
All rights reserved.
Introduction to Engineering Experimentation, Third EditionAnthony J. Wheeler • Ahmad R. Ganji
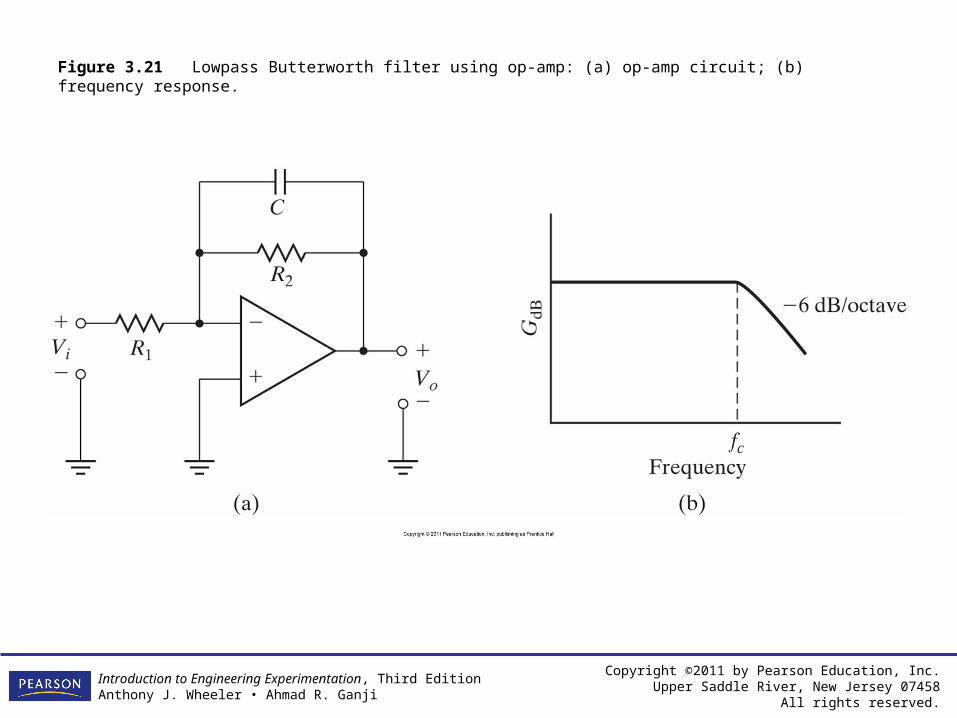
Figure 3.21 Lowpass Butterworth filter using op-amp: (a) op-amp circuit; (b) frequency response.
Copyright ©2011 by Pearson Education, Inc.Upper Saddle River, New Jersey 07458
All rights reserved.
Introduction to Engineering Experimentation, Third EditionAnthony J. Wheeler • Ahmad R. Ganji
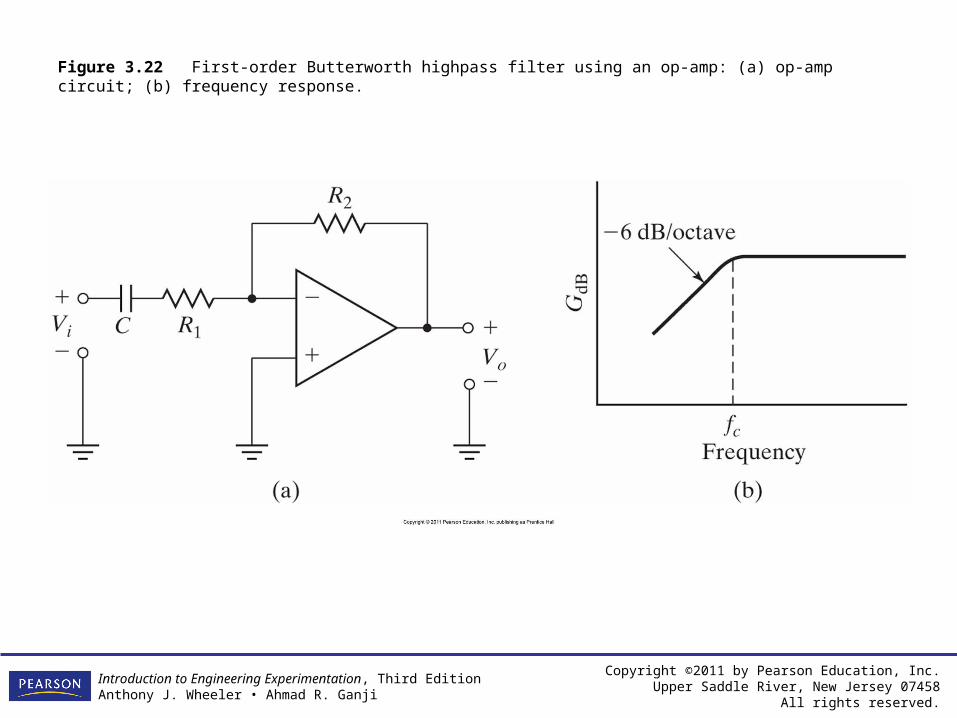
Figure 3.22 First-order Butterworth highpass filter using an op-amp: (a) op-amp circuit; (b) frequency response.

Copyright ©2011 by Pearson Education, Inc.Upper Saddle River, New Jersey 07458
All rights reserved.
Introduction to Engineering Experimentation, Third EditionAnthony J. Wheeler • Ahmad R. Ganji
Figure 3.23 Bandpass filter using op-amp: (a) op-amp circuit; (b) frequency response.
Copyright ©2011 by Pearson Education, Inc.Upper Saddle River, New Jersey 07458
All rights reserved.
Introduction to Engineering Experimentation, Third EditionAnthony J. Wheeler • Ahmad R. Ganji
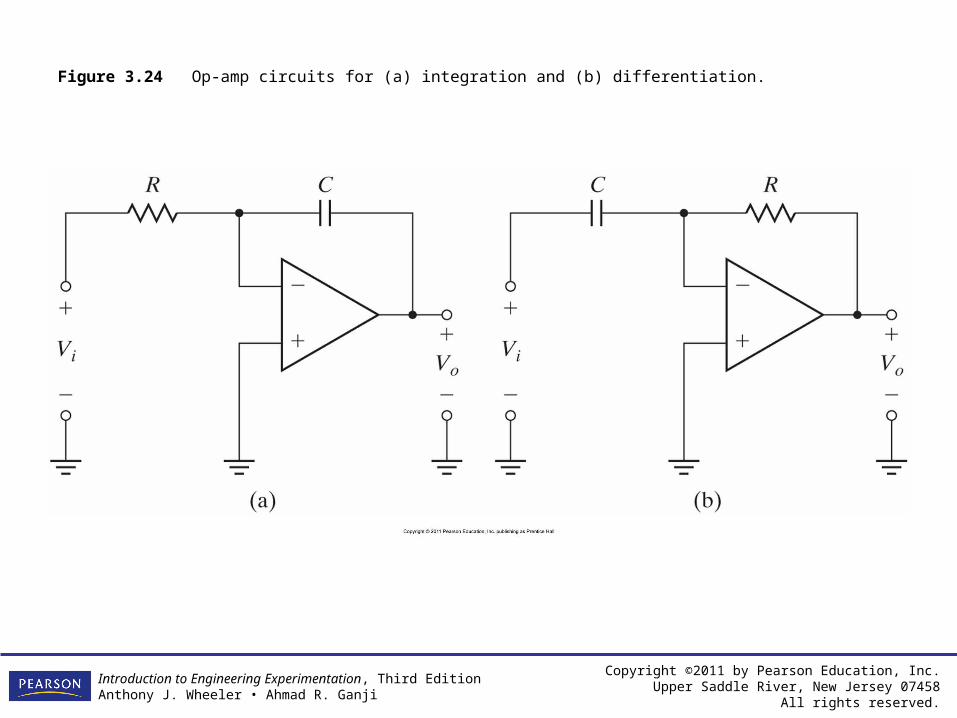
Figure 3.24 Op-amp circuits for (a) integration and (b) differentiation.

Copyright ©2011 by Pearson Education, Inc.Upper Saddle River, New Jersey 07458
All rights reserved.
Introduction to Engineering Experimentation, Third EditionAnthony J. Wheeler • Ahmad R. Ganji
Figure 3.25 Op-amp comparator: (a) circuit; (b) output voltage.

Copyright ©2011 by Pearson Education, Inc.Upper Saddle River, New Jersey 07458
All rights reserved.
Introduction to Engineering Experimentation, Third EditionAnthony J. Wheeler • Ahmad R. Ganji
Figure 3.26 Digital multimeter with a digital voltmeter as a mode of operation. (Courtesy of Triplett Corp.)

Copyright ©2011 by Pearson Education, Inc.Upper Saddle River, New Jersey 07458
All rights reserved.
Introduction to Engineering Experimentation, Third EditionAnthony J. Wheeler • Ahmad R. Ganji
Figure 3.27 Cathode ray oscilloscope. (Courtesy of Tektronix, Inc.)

Copyright ©2011 by Pearson Education, Inc.Upper Saddle River, New Jersey 07458
All rights reserved.
Introduction to Engineering Experimentation, Third EditionAnthony J. Wheeler • Ahmad R. Ganji
Figure 3.28 Schematic view of cathode ray tube.

Copyright ©2011 by Pearson Education, Inc.Upper Saddle River, New Jersey 07458
All rights reserved.
Introduction to Engineering Experimentation, Third EditionAnthony J. Wheeler • Ahmad R. Ganji
Figure 3.29 Block diagram of analog oscilloscope.

Copyright ©2011 by Pearson Education, Inc.Upper Saddle River, New Jersey 07458
All rights reserved.
Introduction to Engineering Experimentation, Third EditionAnthony J. Wheeler • Ahmad R. Ganji
Figure 3.30 Strip-chart recorder.

Copyright ©2011 by Pearson Education, Inc.Upper Saddle River, New Jersey 07458
All rights reserved.
Introduction to Engineering Experimentation, Third EditionAnthony J. Wheeler • Ahmad R. Ganji
Figure 3.31 Interference sources for signal wiring.

Copyright ©2011 by Pearson Education, Inc.Upper Saddle River, New Jersey 07458
All rights reserved.
Introduction to Engineering Experimentation, Third EditionAnthony J. Wheeler • Ahmad R. Ganji
Figure 3.32 Source of ground loop.

Copyright ©2011 by Pearson Education, Inc.Upper Saddle River, New Jersey 07458
All rights reserved.
Introduction to Engineering Experimentation, Third EditionAnthony J. Wheeler • Ahmad R. Ganji
Figure 3.33 Grounding and shielding of system components.

Copyright ©2011 by Pearson Education, Inc.Upper Saddle River, New Jersey 07458
All rights reserved.
Introduction to Engineering Experimentation, Third EditionAnthony J. Wheeler • Ahmad R. Ganji
Figure 3.34 Current-loop signal transmission.