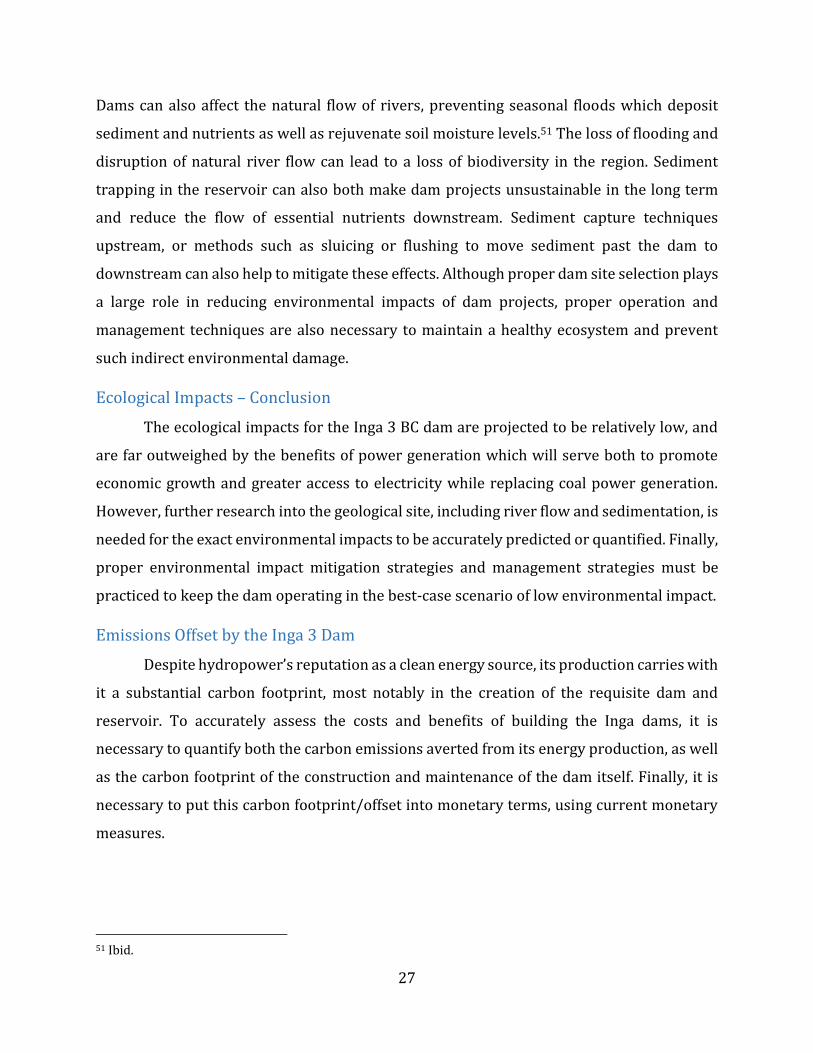
figure 1, inga 1 dam, congo river. source: jullien, 2013. damming the...
TRANSCRIPT

1
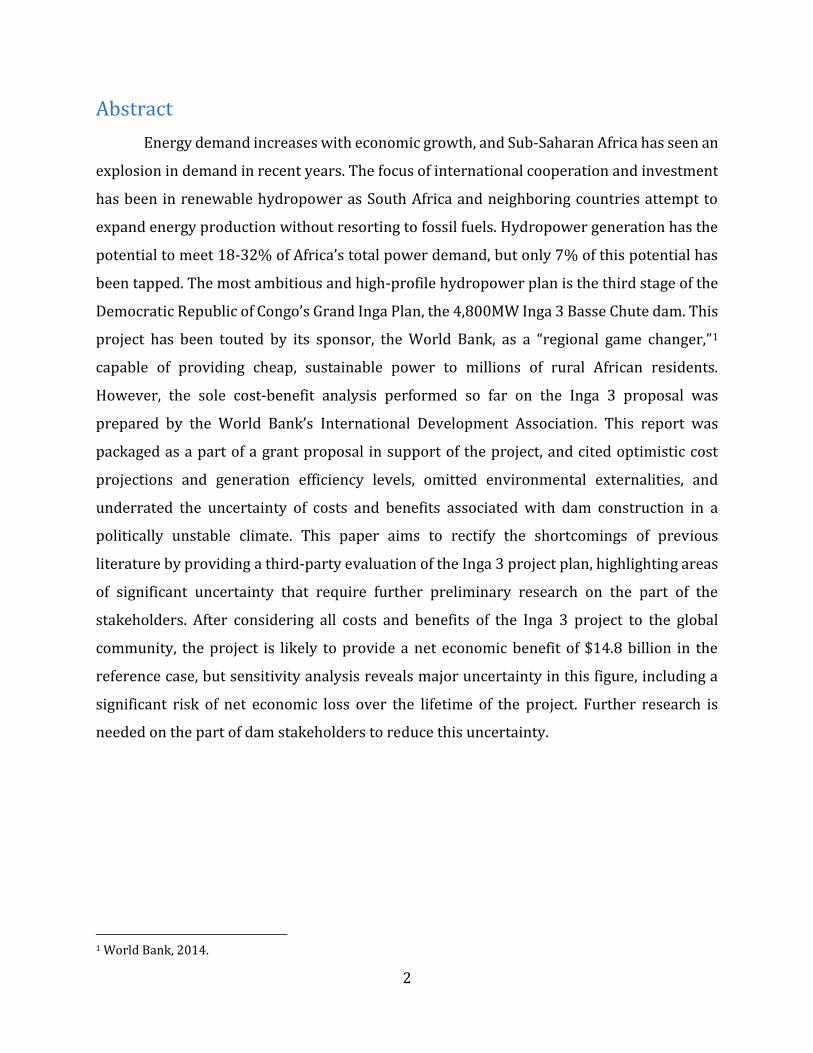
Figure 1, Inga 1 Dam, Congo River. Source: Jullien, 2013.
Damming the Congo
A Cost-Benefit Analysis of the Inga 3 Hydropower Project
Authors:
Ryan Gruver
Edward Lieb
Michael Shen
Leandra Trudeau
Wendy Wei
Dylan West
Majors:
Economics
Physics
Economics & Biology
ENST & Public Policy
Political Science & Visual Arts
Economics & ENST
Energy & Energy Policy
Professors Stephen Berry & George Tolley
The University of Chicago
December 8, 2014
2
Abstract
Energy demand increases with economic growth, and Sub-Saharan Africa has seen an
explosion in demand in recent years. The focus of international cooperation and investment
has been in renewable hydropower as South Africa and neighboring countries attempt to
expand energy production without resorting to fossil fuels. Hydropower generation has the
potential to meet 18-32% of Africa’s total power demand, but only 7% of this potential has
been tapped. The most ambitious and high-profile hydropower plan is the third stage of the
Democratic Republic of Congo’s Grand Inga Plan, the 4,800MW Inga 3 Basse Chute dam. This
project has been touted by its sponsor, the World Bank, as a “regional game changer,”1
capable of providing cheap, sustainable power to millions of rural African residents.
However, the sole cost-benefit analysis performed so far on the Inga 3 proposal was
prepared by the World Bank’s International Development Association. This report was
packaged as a part of a grant proposal in support of the project, and cited optimistic cost
projections and generation efficiency levels, omitted environmental externalities, and
underrated the uncertainty of costs and benefits associated with dam construction in a
politically unstable climate. This paper aims to rectify the shortcomings of previous
literature by providing a third-party evaluation of the Inga 3 project plan, highlighting areas
of significant uncertainty that require further preliminary research on the part of the
stakeholders. After considering all costs and benefits of the Inga 3 project to the global
community, the project is likely to provide a net economic benefit of $14.8 billion in the
reference case, but sensitivity analysis reveals major uncertainty in this figure, including a
significant risk of net economic loss over the lifetime of the project. Further research is
needed on the part of dam stakeholders to reduce this uncertainty.
1 World Bank, 2014.

3
Contents Abstract ..................................................................................................................................................................... 2
Background ............................................................................................................................................................. 5
Hydropower in Sub-Saharan Africa .......................................................................................................... 5
The Grand Inga Project: Inga 1 and 2 ....................................................................................................... 6
The Grand Inga Project: Inga 3 Proposal ................................................................................................ 7
Political and Financial Climate ......................................................................................................................... 9
Institutional Climate for Foreign Investment in the DRC ................................................................. 9
Feasibility of Financing ............................................................................................................................... 10
Energy Generation ............................................................................................................................................. 12
Projected Electricity Output ...................................................................................................................... 12
Energy Generation and Economic Growth .......................................................................................... 13
Energy Distribution ........................................................................................................................................... 13
Providing Energy to Local Consumers .................................................................................................. 13
Overview of High-Voltage Transmission over Long Distances ................................................... 15
The South African Power Pool: Existing Infrastructure and Inga’s Transmission Needs . 18
Environmental and Social Impacts .............................................................................................................. 19
Ecological Impacts – Project Overview ................................................................................................. 20
Environmental and Social Risks .............................................................................................................. 23
Benefits of the Current Site Plan and Design ...................................................................................... 24
Direct Ecological Impacts ........................................................................................................................... 25
Potential Negative Impacts and Mitigation Strategies .................................................................... 26
Ecological Impacts – Conclusion ............................................................................................................. 27
Emissions Offset by the Inga 3 Dam ....................................................................................................... 27
Carbon Offset by Inga 3 Energy Production ................................................................................... 28
4
Carbon Emissions from Dam Construction .................................................................................... 29
Carbon Emissions from the Bundi Reservoir ................................................................................ 30
Social Impacts of Hydropower and Inga 3 ...................................................................................... 33
Cost-Benefit Analysis ........................................................................................................................................ 34
The “Without” Case ....................................................................................................................................... 35
Summary of Costs .......................................................................................................................................... 35
Summary of Benefits .................................................................................................................................... 37
Summary of Cost-Benefit Model Parameters and Sensitivity Analysis .................................... 39
Net Present Value Model ............................................................................................................................ 42
Conclusion............................................................................................................................................................. 44
Reducing Uncertainty: Questions for Future Research .................................................................. 44
Sources Cited ....................................................................................................................................................... 46
5
Background
Hydropower in Sub-Saharan Africa
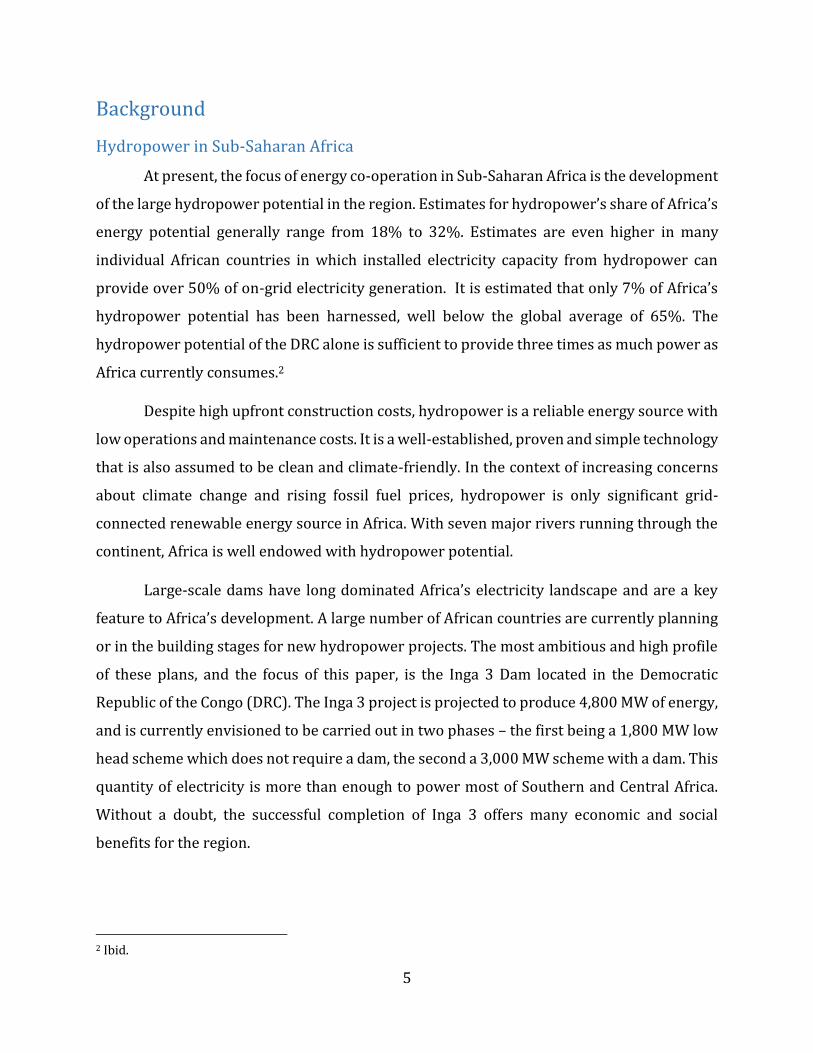
At present, the focus of energy co-operation in Sub-Saharan Africa is the development
of the large hydropower potential in the region. Estimates for hydropower’s share of Africa’s
energy potential generally range from 18% to 32%. Estimates are even higher in many
individual African countries in which installed electricity capacity from hydropower can
provide over 50% of on-grid electricity generation. It is estimated that only 7% of Africa’s
hydropower potential has been harnessed, well below the global average of 65%. The
hydropower potential of the DRC alone is sufficient to provide three times as much power as
Africa currently consumes.2
Despite high upfront construction costs, hydropower is a reliable energy source with
low operations and maintenance costs. It is a well-established, proven and simple technology
that is also assumed to be clean and climate-friendly. In the context of increasing concerns
about climate change and rising fossil fuel prices, hydropower is only significant grid-
connected renewable energy source in Africa. With seven major rivers running through the
continent, Africa is well endowed with hydropower potential.
Large-scale dams have long dominated Africa’s electricity landscape and are a key
feature to Africa’s development. A large number of African countries are currently planning
or in the building stages for new hydropower projects. The most ambitious and high profile
of these plans, and the focus of this paper, is the Inga 3 Dam located in the Democratic
Republic of the Congo (DRC). The Inga 3 project is projected to produce 4,800 MW of energy,
and is currently envisioned to be carried out in two phases – the first being a 1,800 MW low
head scheme which does not require a dam, the second a 3,000 MW scheme with a dam. This
quantity of electricity is more than enough to power most of Southern and Central Africa.
Without a doubt, the successful completion of Inga 3 offers many economic and social
benefits for the region.
2 Ibid.

6
However, the Grand Inga Project has a myriad of political, technical, financial
challenges. Despite the potential benefits, policymakers and activists are divided over Inga
3’s feasibility and environmental consequences. Some stakeholders question if the Grand
Inga will begin construction in the next decade, if at all. In light of the recent increased
interest in African energy projects, this paper aims to contribute to this ongoing debate over
the feasibility and consequences of the Grand Inga Dam.
The Grand Inga Project: Inga 1 and 2
The Congo River is the second largest river in the world and has an estimated
hydroelectric capacity of 100,000 MW. Approximately 140 miles to the southwest of
Kinshasa lies the Bundi Valley of the Congo River and the Inga Falls. Kinshasa is the capital
of the Democratic Republic of the Congo and has a population of over 9 million people.3 At a
median discharge of 42,476 m³/s (1,500,000 ft³/s) and a drop of 96 meters, Inga Falls is one
of the world’s largest waterfalls, and one of the most promising hydroelectric locations in
the world.
There are two existing dams on the Inga Falls. Both Inga I and Inga II were primarily
funded by the government of the Congo. Construction of Inga 1 began in 1968 and was finally
commissioned in 1972 as a six-turbine plant generating 351 MW of power for the populated
areas surrounding and downstream of the dam. A full decade later, the construction of Inga
2 was completed. The eight turbines of Inga 2 were built to produce 1,424MW of power,
reserved for mining activity in the south.4
The construction of Inga 2 relied on the ability of electricity transfer to the copper
and cobalt mines located near the Zambian border in Shaba Province (now Katanga). At the
time it was built, Inga-Kolwezi was the longest high-voltage direct current power line in the
world.5 Investors hoped to capitalize on a period of elevated copper prices, and the
Congolese government was looking to exert pressure over the secessionist province in the
south. The cost of the project exceeded projections and was adjusted multiple times,
eventually reaching a $500 million budget overrun. A mix of private and public groups
3 Demographia, 2014. 4 World Bank, 2014. 5 ABB Group, 2014.

7
provided the financing, notably Citibank, Manufacturers Hanover Trust, and the U.S. Export-
Import Bank. The cost of this project contributed greatly to the Congolese National debt, and
failed to alter the local mining companies’ reliance on locally sourced hydroelectricity. The
Inga-Kolwezi line is now only functioning at a third of its nameplate capacity, as much of its
infrastructure has been scavenged by local communities.6
The DRC also faces the problem of rehabilitating the two existing dams, which have
fallen into disrepair. Inga I and II currently operate far below their installed capacity of
1,775MW, generating less than 900MW.7 Rehabilitation of these two dams has been tied to
the restoration and modernization of the DRC’s electrical grid. In May 2005 the Canadian
company MagEnergy signed an agreement with the state-owned electric utility Société
nationale d'électricité (SNEL) to rehabilitate some of Inga 2’s turbines, with a completion
goal of 2009.8 Work to rehabilitate Inga 2 finally began April 27, 2006, just under a year after
the initial agreement with MagEnergy was signed. This first phase, which involved fixing a
single 168 MW turbine and other emergency repair work, was reported 90% complete in
April 2009, and the second phase (four other turbines) was estimated to take five additional
years. It remains in doubt whether the government will honor its agreement and fund the
second phase. SNEL has received funding from the Regional and Domestic Power Markets
Development Project, which is itself supported by the World Bank, African Development
Bank, and European Investment Bank.9
The Grand Inga Project: Inga 3 Proposal
Feasibility studies for the Inga site were first conducted in the 1950’s when the Congo
was still under the colonial rule of Belgium. Interest in development remained strong after
the Congo gained independence, and in 1963 a feasibility study was conducted by the Italian
firm SICAI which recommended that the Inga 1 support domestic industrialization rather
than export-focused industry.10 Proposals for development dictated that two smaller dams
(Inga 1 and Inga 2) would be constructed first followed by the Inga 3 Basse Chute, and then
6 Ibid. 7 World Bank, 2014. 8 MagIndustries Corp., 2005. 9 Ibid. 10 Young & Turner, 1985.

8
the Grand Inga Dam. The Grand Inga Dam would be larger than the present day Three Gorges
Dam in China and have an estimated output of 39,000MW.
A new approach of a series of smaller hydropower developments was adopted in
2011. The staged development of the Inga site is more in step with local and regional energy
demand growth, limits the needed upfront investment, and significantly reduces risks.11 The
next phase of the Grand Inga project is the building of the Inga 3 Basse Chute (BC) which will
have an installed generation capacity of 4,800W. This project will divert a portion of the
Congo River into the Bundi tributary with a dam being built across the Bundi valley.
Continued development in stages allows for flexibility in construction and the ability to
adjust development to suit economic conditions over time.
Proponents of the Inga Dam hope that its development will improve regional
infrastructure integration, making possible the formation of large, competitive markets in
the DRC. The project’s successful completion means establishing regional connectivity in the
Sub-Saharan region, hopefully providing reliable lower-cost energy for agriculture, industry,
mining, and communications. Hydropower is a vast resource at low economic cost,
generating energy at the rate of US$ 0.03-0.10/kWh, substantially below current African
fossil fuel rates of US$ 0.15-0.30/kWh. These features have led experts to believe that
hydropower is the energy resource that could reduce Africa’s dependence on imported oil,
lower the overall cost of energy, curtail GHG emissions as the region develops, and provide
the needed push for expanded access to electricity, which remains a pressing socio-economic
goal of all sub-Saharan African nations.
Despite the myriad of potential benefits stemming from the completion of the Inga 3
BC project, according to the World Bank the technical assistance project’s overall risk is rated
as high.12 Risks associated with its development fall into two categories: First, the project
faces the technical, financial, political, environmental and social risks usually associated with
large hydropower development in developing countries. Second the project’s risk is
11 World Bank, 2014. 12 Ibid.

9
increased by the political fragility and comparatively weak governance structures in the
Democratic Republic of Congo.
Political and Financial Climate
The World Bank and several other financial institutions like the African Development
Bank are funding the project to completion through grants and loans. South Africa will also
finance part of the project. Though several large development banks have also pledged to
contribute funds to the Inga Dam, private sector funds are still crucial for the feasibility of
the project. The private sector’s support depends on the outcome of various assessments
which energy companies are currently undertaking to evaluate the viability of the site’s
development, most notably those by the World Bank and IFC.
Institutional Climate for Foreign Investment in the DRC
The DRC is rich in natural resources, has a large population size, and boasts a
generally open trading system, but the DRC remains a highly challenging business
environment. Many barriers deter private investors from funding the Inga Dam. The DRC has
a lack of creditworthy electricity buyers which means no guarantee of payback. All investors
in the DRC, foreign and domestic, suffer from multiple audits by various government
enforcement agencies for violations of tax laws. As a result of years of civil war and decades
of mismanagement, the DRC has inadequate physical infrastructure that will hinder business
operations. High levels of corrupt bureaucracy continue to constrain the private sector.
Furthermore, the seizing of natural resources by oppositional groups to gain leverage and
autonomy against the government has been a common theme in the Congo. Rebels have
captured dams before – in 1998, rebels seized part of Inga 2 and proceeded to cut off the
power supply in Kinshasa during fighting against Mobutu. There is no guarantee that
political turmoil in Congo would not lead to similar situations occurring with the Grand Inga
Dam Project.13
After the democratic elections of 2006, the DRC has made progress in addressing the
country’s significant political, economic, and social challenges. The DRC seeks to attract
13 African Business Magazine, 2012.

10
foreign investors and Congolese investment regulations do not discriminate against foreign
investors. However, in practice, foreign investors are subject to harassment and shifting
rules on taxation. There have been many positive steps taken but concerns over
transparency of contracts still remain.
Feasibility of Financing
As the Inga 3 is a hydropower project with a regional reach, Africa’s regional bodies
and institutional framework have an important role to play in facilitating integration in
operational terms. So far, institutional progress has not translated into driving the
development of regional infrastructure. Electricity trade remains less than 5% of power
generation in all regions and has not grown measurably in a decade. Staffing problems
continue to be serious constraints.
According to the World Bank report on the Inga 3, the Government of the DRC is
developing the hydropower potential using a Public Private Partnership (PPP) approach. A
PPP is a government service or private business venture which is funded and operated by a
partnership of government and one or more private sector companies. For the Inga Dam, the
rationale behind this decision is that mobilizing private participation and investment in
hydropower development will reduce the need for public investment, which in insufficient.
In general, public investment faces debt capacity constraints while private sector
participation can enhance project cost-effectiveness through efficiency, and contribute
innovation from the private partner.
Unfortunately, experience with PPP financing shows that high cost projects located in
countries with a low GDP, such as the DRC, are difficult to finance, and take longer to develop.
For public sector projects, this is due to limits on country and sector exposure imposed by
bilateral and multi-lateral donors. The practice of allocating country financing “envelopes”
to each country based on several criteria including country size of population, progress with
reforms, and governance also slows the process down considerably. For private sector
projects financed under PPP, lenders carefully monitor the political risk as it is an indicator
of a government’s capacity to buy the project if needed. Investors are concerned with
financing a large project in a country where the government is unlikely to bear the cost of

11
possible penalties or cancellation of the project under extreme uninsured circumstances.
Thus, another formidable challenge to the Inga project is the pervasive political instability of
the Congo, which continues to grip the country.
The lengthy social policies of the World Bank are yet another hindrance towards the
speedy financing of the Inga 3 project. All projects financed by the World Bank are subject to
organizational social policies. The Inga Dam triggers the OP/BP 4.12 policy for Involuntary
Resettlement and land acquisition.14 Currently, no resettlement is needed in the immediate
vicinity of the Inga 3 hydropower complex, though 84 households need to be resettled along
the transmission lines. The Inga 3 also triggers OP/BP 4.10 pertaining to potential impacts
to be induced by the construction of the transmission line that impedes on areas inhabited
by Indigenous People. Under OP/BP 4.10, there are no indigenous people settlements at the
Inga 3 development area or its immediate area of influence. However, the proposed
transmission lines may cross areas inhabited by indigenous people. In both cases, several
social impact assessments and resettlement plans still have to be confirmed before the
money from the World Bank can flow into the project. At this stage, the details concerning
the parties who will implement these plans are still unknown.
The poor conditions and trajectories of the first two Inga Dams are also poor omens
for the success of the third. The Inga 1 and Inga 2 dams were responsible for a huge part of
the country's debt burden.15 The financing of the rehabilitation of Inga 1 and 2 was US$ 600
million, and despite the economic attractiveness of the project, it proved to be a challenge
that is still not fully funded. The Inga 3 project is very likely to face the same fate. The Inga 3
has estimated costs equivalent to 13% of the GDP of DRC. It is generally accepted that a limit
of 3% of a country’s GDP for any single project may be realistic. Large projects that exceed
3% of the GDP may need to be deferred until the country’s GDP growth allows the economy
to bear the burden. Economically, the Grand Inga price tag of $80 billion is too heavy for a
poor, corrupt and volatile country as the DRC in its current state.
14 International Bank for Reconstruction and Development, 2004. 15 BankTrack, 2014.
12
Energy Generation
Projected Electricity Output
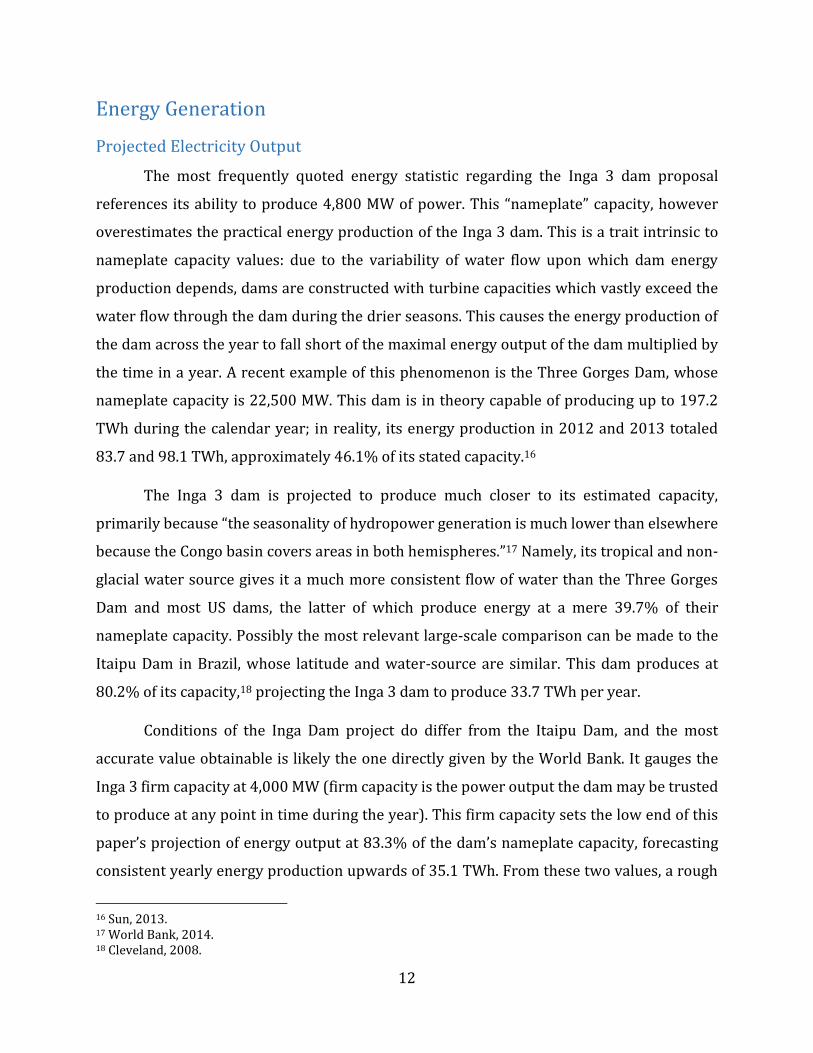
The most frequently quoted energy statistic regarding the Inga 3 dam proposal
references its ability to produce 4,800 MW of power. This “nameplate” capacity, however
overestimates the practical energy production of the Inga 3 dam. This is a trait intrinsic to
nameplate capacity values: due to the variability of water flow upon which dam energy
production depends, dams are constructed with turbine capacities which vastly exceed the
water flow through the dam during the drier seasons. This causes the energy production of
the dam across the year to fall short of the maximal energy output of the dam multiplied by
the time in a year. A recent example of this phenomenon is the Three Gorges Dam, whose
nameplate capacity is 22,500 MW. This dam is in theory capable of producing up to 197.2
TWh during the calendar year; in reality, its energy production in 2012 and 2013 totaled
83.7 and 98.1 TWh, approximately 46.1% of its stated capacity.16
The Inga 3 dam is projected to produce much closer to its estimated capacity,
primarily because “the seasonality of hydropower generation is much lower than elsewhere
because the Congo basin covers areas in both hemispheres.”17 Namely, its tropical and non-
glacial water source gives it a much more consistent flow of water than the Three Gorges
Dam and most US dams, the latter of which produce energy at a mere 39.7% of their
nameplate capacity. Possibly the most relevant large-scale comparison can be made to the
Itaipu Dam in Brazil, whose latitude and water-source are similar. This dam produces at
80.2% of its capacity,18 projecting the Inga 3 dam to produce 33.7 TWh per year.
Conditions of the Inga Dam project do differ from the Itaipu Dam, and the most
accurate value obtainable is likely the one directly given by the World Bank. It gauges the
Inga 3 firm capacity at 4,000 MW (firm capacity is the power output the dam may be trusted
to produce at any point in time during the year). This firm capacity sets the low end of this
paper’s projection of energy output at 83.3% of the dam’s nameplate capacity, forecasting
consistent yearly energy production upwards of 35.1 TWh. From these two values, a rough
16 Sun, 2013. 17 World Bank, 2014. 18 Cleveland, 2008.

13
estimate of energy production can be obtained: 33.7 TWh – 36.5 TWh per year (3,850MW-
4,160MW) will reasonably account for energy production and assumed optimism on the part
of a dam sponsor.
Energy Generation and Economic Growth
Consumers of Inga 3 electricity in South Africa are located in urban centers and
currently consume electricity primarily from coal generation. Thus, rather than expanding
access to electricity within South Africa, Inga power will displace fossil fuel sources.
Consumers of Inga 3 electricity in DRC are both industrial mining companies and residential
consumers. The former currently consume electricity primarily from coal generation as well.
On the other hand, expanding electricity access to impoverished residential consumers in
DRC who currently have no electricity access has been touted as a tool to enable rapid
economic development among this population.19 Interestingly, empirical research indicates
that this causality runs the opposite way in DRC, particularly in the long run. Economic
growth unidirectionally causes an increase in electricity consumption.20 For this reason, this
analysis assumes the project will not stimulate increased economic output by way of
expanded electricity generation, but rather will in the long run simply displace electricity
generation by coal. Therefore, the cost-benefit analysis includes a parameter for displaced
carbon and sulfur dioxide emissions, but not for economic growth.
Energy Distribution
Providing Energy to Local Consumers
Only 25 – 30% of the populations in Africa have access to electricity. This figure is just
9% in the DRC.21,22 In support of their investment in Inga 3, the World Bank has forwarded
the notion that local energy development—in the DRC and Sub-Saharan Africa as a whole—
will drastically increase upon the construction of the Inga dams. They support this notion
primarily by citing the increase in energy stability and the reduction in energy costs that
come from energy production via hydropower as opposed to current thermal sources.
19 World Bank, 2014. 20 Odhiambo, 2014. 21 Kadiayi, 2013. 22 World Bank, 2014.

14
Specifically, the Inga Dams are projected to generate energy at US$.06/kWh, and projected
to decrease energy prices in the DRC by 5%.23 Energy development is cited as a vital part of
economic stability, an important element in the achievement of social, sustainable
development, and a basic requirement towards the eradication of poverty.24
However, the claim that the Inga 3 dam will aid in the electrification of the African
poor, specifically the DRC’s rural communities, remains unsubstantiated. First and foremost,
the DRC has already agreed to export over half of the energy (2500 of 4800 MW) produced
by the Inga 3 project to urban centers in South Africa, even before the project has begun
construction.25 Plans are also in place to export Inga 3 energy to southern Nigeria.26 1000
MW of electricity will be sold to the national utility, which will sell it to households and small
businesses in greater Kinshasa, though this is by far the most urbanized area of the DRC.27
Only 2% of rural citizens in the DRC have access to electric power. Currently, no formal
proposals for creating a grid to power rural local populations are tied to the construction of
either the Inga 3 project.
In an IEA-published report detailing investment strategies for providing energy
access to the poor, skepticism is expressed on the potential for electrifying the poor via on-
grid sources: specifically, though investment for the actual energy production (the dam) is
shown to be easily found, as the profit margin is implicit, investment – particularly foreign
private investment – in the distribution and transmission of said energy is more difficult to
secure, given the lack of a definitive profit incentive for private enterprises.28 This logic is
well supported by current dealings in the Grand Inga Dam project. Given the current
difficulties in securing private funding for the dam itself, grid investment may be near
impossible to obtain.
The most widely proposed alternative to the Grand Inga project in electrifying the
Congo is a series of mini-grid dams across the DRC. Such projects have shown modest success
23 Ibid. 24 Kadiayi, 2013. 25 World Bank, 2014. 26 Jullien, 2013. 27 World Bank, 2014. 28 IEA, 2011.

15
in both the DRC and neighboring Republic of Congo. Though less cost-effective per
investment than on-grid solutions,29 these dams have the benefit of quicker, nominal
electrifications of rural communities, as well as independent energy production and
maintenance.30,31
Clearly, the potential for lifestyle improvements for DRC and SSA citizens are
enormous. Current power generation in SSA, excluding South Africa, is 28 GW, which will be
more than doubled if the Grand Inga Dam project is completed. The World Bank
optimistically forecasts the Inga 3 project will allow energy access to 7 million citizens of
Grand Kinshasa. However, the enormity of this jump itself is cause for concern: current grid
infrastructure and investment in it are hard to come by, maintenance concerns abound, and
political instability makes the resolution of either of those concerns more difficult.
Overview of High-Voltage Transmission over Long Distances
At their most basic, electric power transmission topologies can be divided into two
types: direct current (DC) and alternating current (AC). Current and voltage remain
relatively constant for DC transmission; for AC, they vary sinusoidally with time. Power
transmitted is the product of the current passing through a wire and the voltage across it.
Increasing either the voltage or the current allows for greater transmission of power, but
because the ability of current to pass through a wire decreases as the cross-sectional area of
that wire decreases, it is more economical to transmit power at high-voltage, low current.
AC can easily be “stepped up” to a higher voltage for transmission or “stepped down”
to a lower voltage for distribution using a simple set of magnetically coupled inductors (a
“transformer”). Stepping a direct current up or down is much more complicated and thus
comparatively more expensive. In the original DC electric distribution networks developed
by Edison in the US, load could never be far from source: the requirement that generating
stations be built close to end-users necessitated their construction in the densest areas on
the most expensive real estate in urban areas and rendered completely uneconomical rural
distribution. In 2004, the US DOE quoted a price of $50 million for a ±500kV, 6MW HVDC
29 Ibid. 30 Ibid. 31 Bakiman, 2011.
16
converter system. By 2009 this had gone up to $100 million. AC has thus long been the
dominant form of power transmission at most distances for reasons of simplicity and
economy.
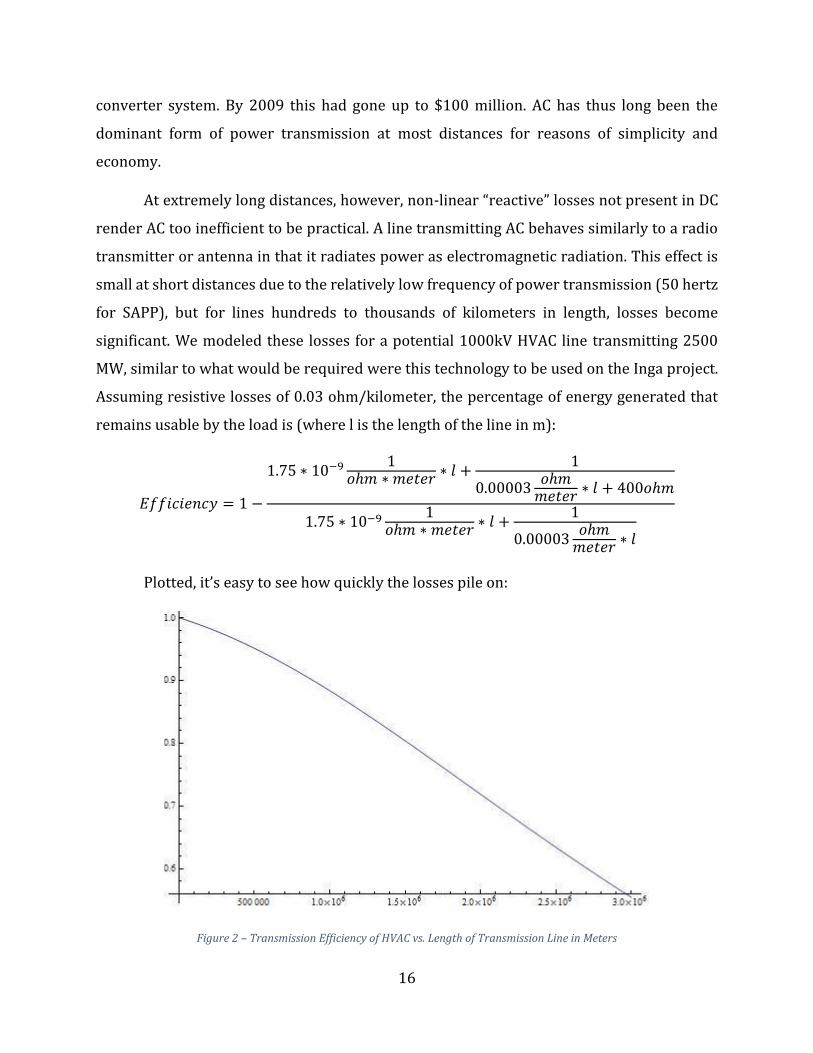
At extremely long distances, however, non-linear “reactive” losses not present in DC
render AC too inefficient to be practical. A line transmitting AC behaves similarly to a radio
transmitter or antenna in that it radiates power as electromagnetic radiation. This effect is
small at short distances due to the relatively low frequency of power transmission (50 hertz
for SAPP), but for lines hundreds to thousands of kilometers in length, losses become
significant. We modeled these losses for a potential 1000kV HVAC line transmitting 2500
MW, similar to what would be required were this technology to be used on the Inga project.
Assuming resistive losses of 0.03 ohm/kilometer, the percentage of energy generated that
remains usable by the load is (where l is the length of the line in m):
𝐸𝑓𝑓𝑖𝑐𝑖𝑒𝑛𝑐𝑦 = 1 −
1.75 ∗ 10−9 1𝑜ℎ𝑚 ∗ 𝑚𝑒𝑡𝑒𝑟
∗ 𝑙 +1
0.00003𝑜ℎ𝑚
𝑚𝑒𝑡𝑒𝑟∗ 𝑙 + 400𝑜ℎ𝑚
1.75 ∗ 10−9 1𝑜ℎ𝑚 ∗ 𝑚𝑒𝑡𝑒𝑟
∗ 𝑙 +1
0.00003𝑜ℎ𝑚
𝑚𝑒𝑡𝑒𝑟 ∗ 𝑙
Plotted, it’s easy to see how quickly the losses pile on:
Figure 2 – Transmission Efficiency of HVAC vs. Length of Transmission Line in Meters

17
Luckily for bulk power transmission schemes such as the one under consideration,
the technology behind DC voltage conversion has improved vastly since the beginning of the
20th century. Modern HVDC converter stations use gate-commutated silicon controlled
rectifiers (thyristors) and, more recently, high-power insulated-gate bipolar transistors:
these are entirely solid-state and thus are cheaper and more reliable than the older mercury
arc valves. In general, according to Swiss electric infrastructure manufacturer ASEA Brown
Boveri (ABB), even taking into account the higher costs of voltage conversion, with modern
technology above line lengths of 500 km and at high loads it becomes more cost effective to
transmit electricity by high-voltage using direct rather than alternating current.
We modeled loss in a ±800kV line using a similar model as that used above for the AC
line:
𝐸𝑓𝑓𝑖𝑐𝑖𝑒𝑛𝑐𝑦 = 1 −0.00003
𝑜ℎ𝑚𝑚𝑒𝑡𝑒𝑟 ∗ 𝑙
0.00003𝑜ℎ𝑚
𝑚𝑒𝑡𝑒𝑟 ∗ 𝑙 + 1,024𝑜ℎ𝑚
This yields the following plot:
Figure 3 – Transmission Efficiency of HVDC vs. Length of Transmission Lines in Meters

18
The South African Power Pool: Existing Infrastructure and Inga’s Transmission Needs
In 1976, a study commissioned by the US Senate defined a wide area power grid, or
interconnect, as a “discrete network of high-capacity transmission lines overlaying…existing
transmission systems…strongly tying together virtually all of the generating capacity and
distribution utilities…into a single, huge power supply system.”32
Interconnects are economically viable when there is time-dependent geographical
diversity in loading.33 The Southern African Power Pool (SAPP) is the interconnection
serving most of southern Africa – South Africa, Lesotho, Swaziland, Namibia, Zimbabwe,
Mozambique, Zambia, and the DRC are all serviced. While Angola, Malawi, and Tanzania all
have connections to the SAPP system, those connections are not currently operating. In total,
this represents 54 GW of generating capacity, or 473 TWh per year. Of these 473 TWh,
however, only 22 GWh were traded in 2013: the SAPP, like most interconnects, was not
designed for bulk power transmission per se, but rather for easing of temporary spikes in
load.
The World Bank proposal favors “extension/reinforcement of the SAPP system”34 for
transmission of the 2500 MW to South Africa, but it presents no specifics as to how the SAPP
interconnect would be extended/reinforced: the extent/utility of the improvements “still
needs to be studied.”35 Given the absence of plans for upgrades to existing SAPP transmission
or even of current infrastructure, efficiency for the scenario in which power is transmitted
to ESKOM primarily through the SAPP interconnection was largely extrapolated.
For simplicity, we used the same model as used for losses from dedicated EHV AC
transmission lines, replacing the fixed load impedance with a variable grid input impedance
and assuming that upgrades made to the interconnection would keep that input impedance
above a minimum level at load. The power-voltage characteristic of a transmission network
is described by its input, or load, impedance – the derivative of the voltage across the
transmission network with respect to the current flowing into the network. A contour plot
32 Congressional Research Service, 1976, 1-1. 33 Congressional Research Service, 1976, 3-1. 34 World Bank, 2014. 35 Ibid.

19
was generated with an artificial “distance” parameter in meters on the x-axis and grid input
impedance on the y axis (see below).
Figure 4 – SAPP Grid Impedance vs. Distance Transmitted
It is easy to see from these plots that impedances above around 500 ohms have a
diminishing impact on transmission efficiency. Below 500 ohms, efficiency drops off sharply.
According to SAPP literature, in 2002, the high water mark for SAPP transmission, 738.58
GWh was traded. Spread out evenly over the course of that year and distributed by the grid’s
220kV AC transmission lines, this corresponds to a minimum input impedance of 575 ohm,
thus the above model is applicable.
Environmental and Social Impacts
In general, hydropower is seen as environmentally advantageous because it is a cost
effective and renewable energy source. However, large scale hydro projects have the
capacity to cause far-reaching geophysical impacts, and therefore run the risk of negative
environmental and social externalities. According to the current design plan, the Inga 3 BC
project will have relatively small environmental and social impacts which are outweighed by
the large generation capacity of the project. Although large hydro projects may often create
large negative social and environmental externalities, the Inga 3 BC project’s ecological
impact is reduced for four main reasons: it is a run-of-river dam, it does not dam the Congo
River itself, it involves a fairly small reservoir, and will cause little population displacement.

20
Correct mitigation strategies, if practiced, can further reduce the ecological impacts of the
dam. However, there is still some uncertainty with any estimates involving environmental
impact because this particular site requires further study, and every dam’s unique
geophysical site can cause widely varying results in practice.
Ecological Impacts – Project Overview
An analysis of the project’s ecological impact requires knowledge of both the Inga 3
BC plans and of run-of-river dams in general. The Inga 3 BC development consists of a
diversion of part of the waters of the Congo River into the Bundi tributary and a run-of-river
dam across the Bundi valley (see figure below).

21
Figure 5 – Map of the Inga 3 BC Site (World Bank, 2014)
The project will not require the construction of a dam on the Congo River itself.
Rather, it will include an intake on the Congo river, a 12 km transfer canal to bring the waters
to the Bundi valley, a 100 m high concrete dam, and a hydropower station equipped with 11
units for a total installed capacity of 4,755 MW, as well as 1,850 km of intra-DRC transmission
lines and associated switchyards and converting stations connecting the power station to
22
Kinshasa and to the Democratic Republic of Congo’s border,36 and a further 1,800 km of
transmission lines from the border to the South African grid.
Run-of-river dams are generally less ecologically harmful than their traditional
inundation dam counterparts due to the fact that they are less disruptive to the river
environment. The term “river diversion” more accurately describes larger projects such as
Inga 3 BC, in which electricity is generated by diverting a portion of a river’s flow into a
tunnel or pipeline to power turbines before returning the water to the river further
downstream. Turbines are not installed in the river itself. For large-scale run of river dam
projects such as Inga 3, the impacts on terrestrial and aquatic habitats can be significant, but
when done properly with care given to footprint size and location these projects can
generate electricity that minimizes impacts to the surrounding environment and nearby
communities.37
The International Development Association plans to devote $20 million to conducting
studies on the dam project.38 These studies will include technical studies such as geological
investigations on the site to confirm foundation conditions, a study of sedimentation in the
river, a study of the Congo River water intake to confirm the maximum capacities of the Inga
3 BC canal and water intake, and a study on how climate change may affect Inga 3 BC site
development feasibility. Environmental assessments (ESIAs) are planned for the Inga 3 BC
development and for the transmission lines in the DRC. Although preliminary feasibility
studies have been conducted on the project, further research into the site is needed. The
exact ecological impacts cannot be accurately predicted or quantified without extensive
geophysical and geotechnical site research, which can only be done with state-of-the-art
mathematical models (1D and 2D) to simulate longterm fluvial processes, with local expert
knowledge.39 Therefore, this section of the paper will outline a discussion of potential
environmental impacts of the dam, rather than certain numerical values.
36 World Bank, 2014. 37 Watershed Watch Salmon Society. 38 World Bank, 2014. 39 Basson, 2004.
23
Environmental and Social Risks
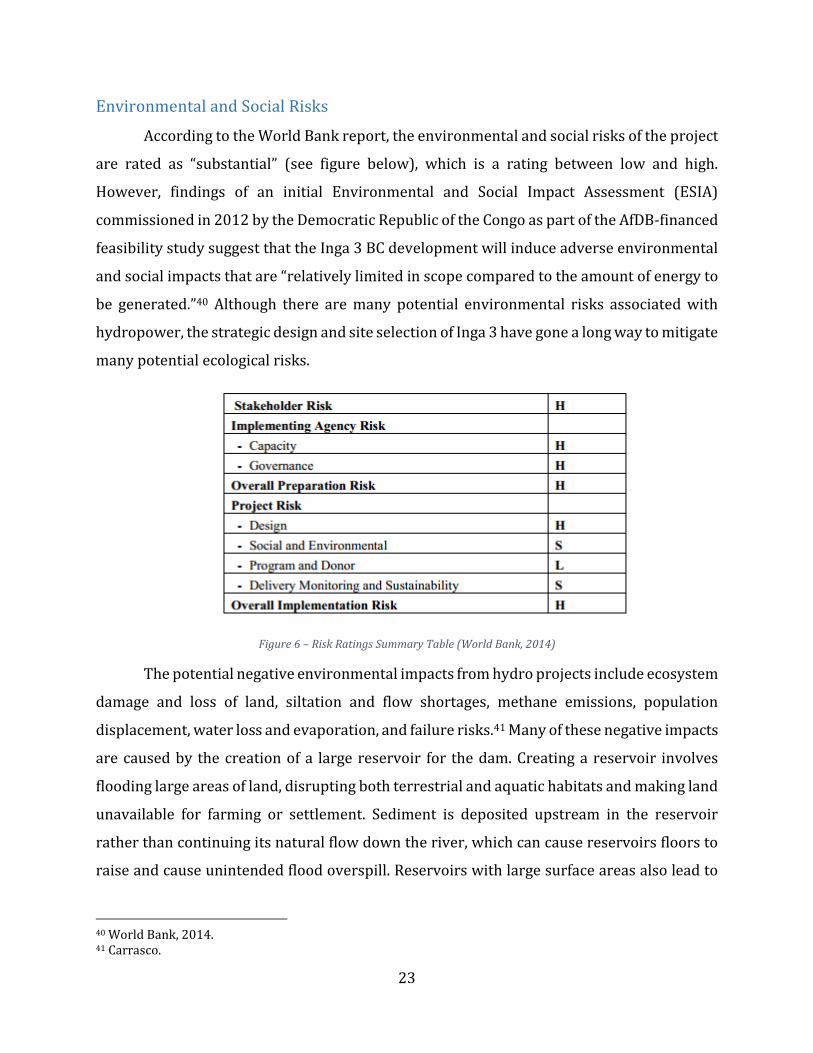
According to the World Bank report, the environmental and social risks of the project
are rated as “substantial” (see figure below), which is a rating between low and high.
However, findings of an initial Environmental and Social Impact Assessment (ESIA)
commissioned in 2012 by the Democratic Republic of the Congo as part of the AfDB-financed
feasibility study suggest that the Inga 3 BC development will induce adverse environmental
and social impacts that are “relatively limited in scope compared to the amount of energy to
be generated.”40 Although there are many potential environmental risks associated with
hydropower, the strategic design and site selection of Inga 3 have gone a long way to mitigate
many potential ecological risks.
Figure 6 – Risk Ratings Summary Table (World Bank, 2014)
The potential negative environmental impacts from hydro projects include ecosystem
damage and loss of land, siltation and flow shortages, methane emissions, population
displacement, water loss and evaporation, and failure risks.41 Many of these negative impacts
are caused by the creation of a large reservoir for the dam. Creating a reservoir involves
flooding large areas of land, disrupting both terrestrial and aquatic habitats and making land
unavailable for farming or settlement. Sediment is deposited upstream in the reservoir
rather than continuing its natural flow down the river, which can cause reservoirs floors to
raise and cause unintended flood overspill. Reservoirs with large surface areas also lead to
40 World Bank, 2014. 41 Carrasco.

24
huge amounts of water loss due to high amounts of evaporation before the water has even
gone through turbines to generate energy. This means that, in areas where water is scarce,
large-scale hydropower may be a very inefficient use of water resources. The flooding of
reservoirs also causes organic material in the soil or plants to degrade and produce methane,
a powerful greenhouse gas. The large amount of flooding in creating a reservoir also
necessitates the displacement of people who live near the site. In addition to its social
impacts, displacement necessitates resettlement in new areas, which may cause loss of
wilderness. Finally, if dams are poorly constructed or are built near the site of natural
disasters, dam failure can occur, releasing an enormous quantity of water and causing
catastrophic damage to downstream habitats, settlements, and infrastructure, as well as loss
of life. The above concerns should be taken into consideration when designing and
implementing new hydropower projects. Dams built with mitigation measures and adequate
site selection techniques can benefit local populations, whereas those built without proper
mitigation techniques, compensation measures and site selection evaluations criteria will
have considerable adverse environmental effects.
Benefits of the Current Site Plan and Design
The Inga 3 BC site was well-chosen to mitigate many of the negative environmental
externalities mentioned above. The site is well chosen because it allows for large generation
capacity from a run-of-river dam. Run-of-river dams do not require large reservoirs, thus
greatly reducing many reservoir-related environmental impacts such as methane release,
evaporation, habitat loss, and population displacement. The proposed reservoir in the Bundi
valley will be 15.5 sq. km,42 which is quite small considering the site’s generation capacity.
Run-of-river dams are also less disruptive to river flow than inundation dams, causing less
disruption to the river ecosystem. Another benefit to the Inga 3 BC design is that it does not
dam the Congo River itself, instead diverting water through a channel to the Bundi tributary.
Currently, the Congo River flows for many kilometers into the ocean, and fresh water is
displaced gradually with salt water. Halting or reducing freshwater flow would cause salt
water to intrude into the gap left by the reduced freshwater flow, and the salt water would
destroy all life dependent on freshwater in the affected area. The intrusion of the salt water
42 World Bank, 2014.
25
would be some 50 km inland, causing irreversible environmental harm to all living matter
and organisms at the river mouth.43 In addition, damming the Congo would cause much of
the surrounding area through which the river passes to be inundated by rising water levels,
as preliminary analysis of the land contours shows a flat profile in the immediate vicinity of
the river,44 which would create a massive lake. The current design, involving water diversion
and a run-of-river dam, is much preferred in that much of the river will continue to flow as
naturally as possible, keeping the impact on the environment to an absolute minimum. An
additional benefit of this project is that the interconnection of Inga with South Africa and
other Southern African countries has a considerable carbon emission reduction potential,
through avoidance of thermal-based power generation--in particular, coal-based electricity
generation in South Africa (further discussion below). Therefore this project can be
considered a climate change mitigation project, offsetting other negative climate impacts
which the project may necessitate.
Direct Ecological Impacts
The Inga 3 Dam Project has both direct and indirect ecological impacts. The direct
impacts have been roughly accounted for in the World Bank report, although there may be
many additional indirect impacts which the report does not consider. The implementation
of the civil works of Inga 3 BC development will require the acquisition of 77 ha of land for
the canal, and 15.5 sq. km for the creation of the Bundi reservoir, including 2.6 sq. km of
forest and agricultural land.45 The reservoir itself will not have significant negative impacts
on people or the ecosystem, although subsequent phases of the series of Inga hydropower
developments, which are outside of the scope of the Inga 3 BC project, are expected to have
a larger ecological footprint.
The construction of the water intake, the canal, the power house, and the
transmission lines within the Democratic Republic of Congo and in other SAPP countries will
induce some adverse environmental impacts. The AfDB-financed feasibility study found that
no endangered mammals and fishes will be affected by the construction of the Inga 3 BC
43 Csiki & Rhoads, 2010. 44 Ibid. 45 World Bank, 2014.

26
development.46 However, the 2.6 sq. km region in the Bundi Valley where the dam and canal
will be constructed is covered by forest, and the 100 m wide, 1,850 km long area to be cleared
across the country for the intra-DRC transmission line will also go through forested areas.47
The initial ESIA carried out as part of the Inga feasibility study also mentions that four
International Union for the Conservation of Nature (IUCN) Red List mammal species have
been identified as being in the Inga area: Chimpanzee (endangered), Hippopotamus
(vulnerable), Bay Duiker (least concern), and Sitatunga (least concern). However,
considering the small reservoir and overall ecological footprint of the Inga 3 BC project, it is
not expected that there will be an impact on these species. The Inga zone of the Congo is also
rich in diversity of fish species, identifying 146 species, none of which are of major concern.
However, it is possible that some species adapted to the deepest parts of the river, which
reaches depths of 100m, have yet to be discovered.48 There is also a dearth of information of
the presence of migratory fish species in the report, which would be particularly impacted.
Potential Negative Impacts and Mitigation Strategies
There are also many potential indirect negative ecological impacts which could occur
as a result of the Inga 3 BC project, which are not accounted for in the World Bank Report.
Due to reservoir sedimentation, many dam projects are not sustainable in the long term, and
and according to Basson’s report on hydropower fluvial morphologial impacts, “Often the
environmental costs incurred in the river downstream of the dam are not quantified
adequately.”49 The damming of rivers can cause water quality deterioration, due to the
reduced oxygenation in relatively stagnant reservoirs. Water pollution control measures
may be needed to improve reservoir water quality. Some infectious diseases can spread
around hydroelectric reservoirs, particularly in warm climates and densely populated
areas.50 The effects of contaminated water frequently become worse in stagnant reservoirs
than in fast flowing rivers. Because Inga 3 is a run-of-river dam, water flow should be less
impeded than in traditional inundation dams and reservoir impacts should be mitigated.
46 Ibid. 47 Ibid. 48 Ibid. 49 Basson, 2004. 50 Ibid.
27
Dams can also affect the natural flow of rivers, preventing seasonal floods which deposit
sediment and nutrients as well as rejuvenate soil moisture levels.51 The loss of flooding and
disruption of natural river flow can lead to a loss of biodiversity in the region. Sediment
trapping in the reservoir can also both make dam projects unsustainable in the long term
and reduce the flow of essential nutrients downstream. Sediment capture techniques
upstream, or methods such as sluicing or flushing to move sediment past the dam to
downstream can also help to mitigate these effects. Although proper dam site selection plays
a large role in reducing environmental impacts of dam projects, proper operation and
management techniques are also necessary to maintain a healthy ecosystem and prevent
such indirect environmental damage.
Ecological Impacts – Conclusion
The ecological impacts for the Inga 3 BC dam are projected to be relatively low, and
are far outweighed by the benefits of power generation which will serve both to promote
economic growth and greater access to electricity while replacing coal power generation.
However, further research into the geological site, including river flow and sedimentation, is
needed for the exact environmental impacts to be accurately predicted or quantified. Finally,
proper environmental impact mitigation strategies and management strategies must be
practiced to keep the dam operating in the best-case scenario of low environmental impact.
Emissions Offset by the Inga 3 Dam
Despite hydropower’s reputation as a clean energy source, its production carries with
it a substantial carbon footprint, most notably in the creation of the requisite dam and
reservoir. To accurately assess the costs and benefits of building the Inga dams, it is
necessary to quantify both the carbon emissions averted from its energy production, as well
as the carbon footprint of the construction and maintenance of the dam itself. Finally, it is
necessary to put this carbon footprint/offset into monetary terms, using current monetary
measures.
51 Ibid.

28
There is relatively no CO2 released over the life cycle of a hydroelectric dam.52
Therefore, its carbon emissions will primarily originate in the construction of the dam itself,
and from the methane and CO2 release associated with the dam’s reservoir.53 Worryingly,
there has been substantial data which suggests that warm, tropical dams are more likely to
be substantial greenhouse gas emitters than cold, boreal dams, and that these emissions may
exceed the emissions of thermal energy-producing equivalents.54 The World Energy Council
in 2004 estimated that the upper bound of the carbon cost of hydroelectric power is 40,000
tons CO2-eq per TWh, though this figure is approximate, dated, and does not deduct the
carbon sequestration potential of a reservoir.55 Given the inaccuracies of these
measurements, as well as their datedness, this analysis attempts to more accurately estimate
the net carbon footprint of the Grand Inga Dam project.
This footprint will be compared to the estimated carbon emissions averted if the
energy would have been produced by coal, the dominant electricity source in Sub-Saharan
Africa’s energy portfolio. An examination of the sulfur oxide emissions mitigated relative to
coal generation will be another component of the analysis. Notably, the carbon amount will
scale proportionally with the operation period of the dam, increasing with time, as will the
greenhouse gas emissions of the reservoir. As such, the final product of this assay will be a
carbon emission differential over time, with a corresponding graph of the dollar values of
this carbon emission difference over time. This monetary conversion will be determined
based on the price of carbon set by the European Union Emissions Trading System and the
social cost of carbon estimated by the US Environmental Protection Agency.
Carbon Offset by Inga 3 Energy Production
We begin by investigating the carbon aversion from Inga 3 energy production. Earlier,
we determined that the Inga 3 project would produce 33.7 – 36.5 TWh per year. As South
Africa has emerged as the most significant buyer of Inga 3 energy, we will use the South
African energy portfolio to determine Inga 3’s carbon aversion. An assay of three major South
African coal plants determined that for each kWh they produced via coal sources, they
52 World Energy Council, 2013. 53 Parliamentary Office of Science and Technology, 2006. 54 World Commission on Dams, 2000. 55 World Energy Council, 2004.
29
produced 0.993 kg CO2-eq. This value includes the greenhouse gas effects of CO2 and N2O.
(Carbon Accounting for South Africa) As 93% of South African grid energy is produced by
coal, we will assume that the entirety of the energy produced by the Inga 3 project will
produce carbon equivalents at the above rate. Therefore, we estimate that the Inga 3 dam
will avert 33.46 - 36.25 Mt CO2-eq per year, averaging 34.85 Mt CO2-eq per year.
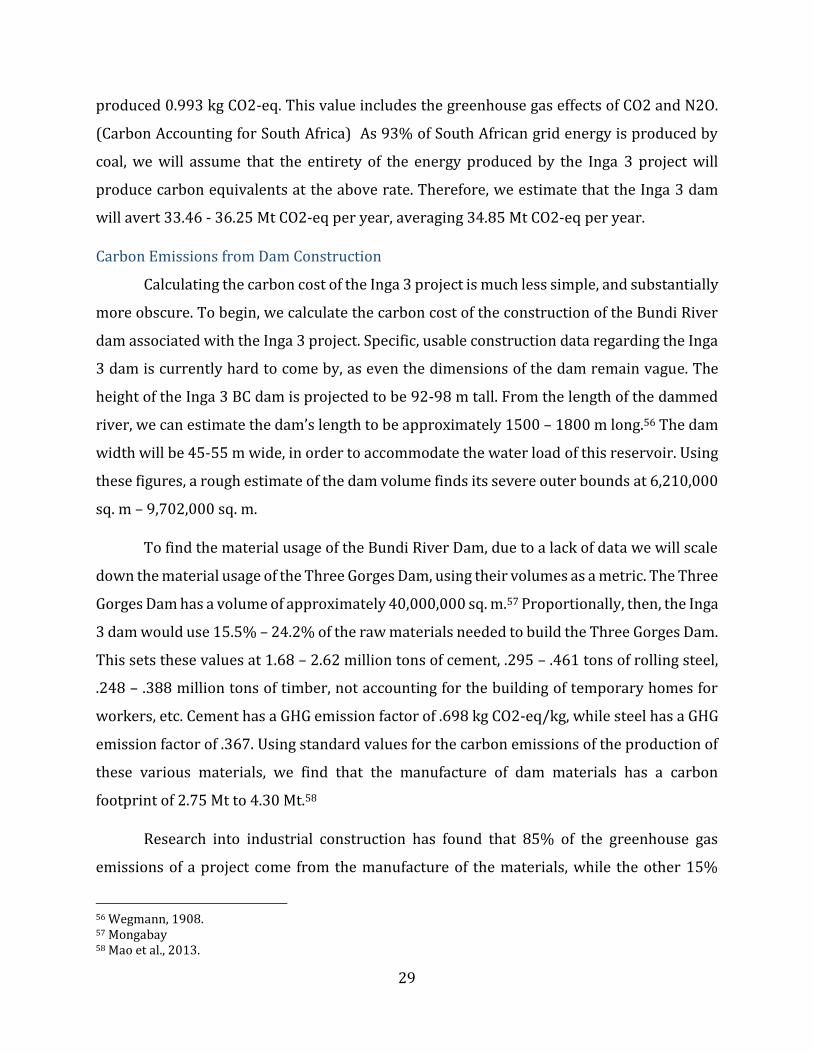
Carbon Emissions from Dam Construction
Calculating the carbon cost of the Inga 3 project is much less simple, and substantially
more obscure. To begin, we calculate the carbon cost of the construction of the Bundi River
dam associated with the Inga 3 project. Specific, usable construction data regarding the Inga
3 dam is currently hard to come by, as even the dimensions of the dam remain vague. The
height of the Inga 3 BC dam is projected to be 92-98 m tall. From the length of the dammed
river, we can estimate the dam’s length to be approximately 1500 – 1800 m long.56 The dam
width will be 45-55 m wide, in order to accommodate the water load of this reservoir. Using
these figures, a rough estimate of the dam volume finds its severe outer bounds at 6,210,000
sq. m – 9,702,000 sq. m.
To find the material usage of the Bundi River Dam, due to a lack of data we will scale
down the material usage of the Three Gorges Dam, using their volumes as a metric. The Three
Gorges Dam has a volume of approximately 40,000,000 sq. m.57 Proportionally, then, the Inga
3 dam would use 15.5% – 24.2% of the raw materials needed to build the Three Gorges Dam.
This sets these values at 1.68 – 2.62 million tons of cement, .295 – .461 tons of rolling steel,
.248 – .388 million tons of timber, not accounting for the building of temporary homes for
workers, etc. Cement has a GHG emission factor of .698 kg CO2-eq/kg, while steel has a GHG
emission factor of .367. Using standard values for the carbon emissions of the production of
these various materials, we find that the manufacture of dam materials has a carbon
footprint of 2.75 Mt to 4.30 Mt.58
Research into industrial construction has found that 85% of the greenhouse gas
emissions of a project come from the manufacture of the materials, while the other 15%
56 Wegmann, 1908. 57 Mongabay 58 Mao et al., 2013.
30
come from transportation of the materials, energy use, and industrial waste.59 The carbon
cost of the construction project is thus projected to be 3.25 Mt to 5.12 Mt CO2-eq, averaging
4.185 Mt.
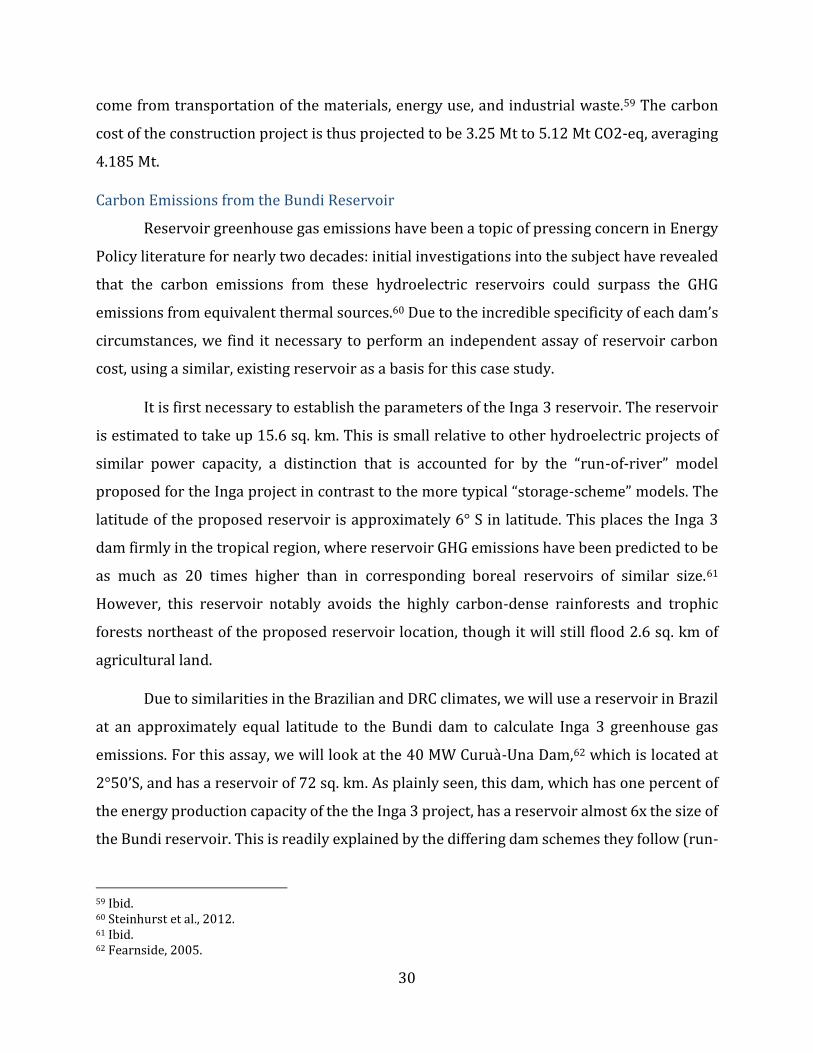
Carbon Emissions from the Bundi Reservoir
Reservoir greenhouse gas emissions have been a topic of pressing concern in Energy
Policy literature for nearly two decades: initial investigations into the subject have revealed
that the carbon emissions from these hydroelectric reservoirs could surpass the GHG
emissions from equivalent thermal sources.60 Due to the incredible specificity of each dam’s
circumstances, we find it necessary to perform an independent assay of reservoir carbon
cost, using a similar, existing reservoir as a basis for this case study.
It is first necessary to establish the parameters of the Inga 3 reservoir. The reservoir
is estimated to take up 15.6 sq. km. This is small relative to other hydroelectric projects of
similar power capacity, a distinction that is accounted for by the “run-of-river” model
proposed for the Inga project in contrast to the more typical “storage-scheme” models. The
latitude of the proposed reservoir is approximately 6° S in latitude. This places the Inga 3
dam firmly in the tropical region, where reservoir GHG emissions have been predicted to be
as much as 20 times higher than in corresponding boreal reservoirs of similar size.61
However, this reservoir notably avoids the highly carbon-dense rainforests and trophic
forests northeast of the proposed reservoir location, though it will still flood 2.6 sq. km of
agricultural land.
Due to similarities in the Brazilian and DRC climates, we will use a reservoir in Brazil
at an approximately equal latitude to the Bundi dam to calculate Inga 3 greenhouse gas
emissions. For this assay, we will look at the 40 MW Curuà-Una Dam,62 which is located at
2°50’S, and has a reservoir of 72 sq. km. As plainly seen, this dam, which has one percent of
the energy production capacity of the the Inga 3 project, has a reservoir almost 6x the size of
the Bundi reservoir. This is readily explained by the differing dam schemes they follow (run-
59 Ibid. 60 Steinhurst et al., 2012. 61 Ibid. 62 Fearnside, 2005.

31
of-river vs. storage scheme): future additions to the Inga project are expected to expand the
reservoir to a size of 40 sq. km, though the efficiency of energy production to reservoir size
is maintained. This dam was chosen for its closeness in latitude to the Inga reservoir, its
similar size (within an order of magnitude), and also for the recency of the relevant study
(2005). Following the lead of Fearnside, reservoir carbon emissions are calculated in two
parts: CO2 emissions and the CH4 emissions.
CO2 emissions are released when life forms decay aerobically: in the presence of
atmospheric O2, decaying life forms have their carbon bound to free oxides, releasing CO2 as
a chemical product. As such, the primary source of CO2 emissions from a reservoir are the
tallest portions of flooded trees, whose carbon becomes oxidized either as they stand, or as
driftwood floating in the reservoir. The Inga 3 project requires the flooding of 16.27 sq. km,
2.6 sq. km of which is forest or agricultural land. WISDOM mapping indicates that the woody
biomass in the flooded area lies between 51 – 100 tonnes/hectare.63 We approximate that
the non-forest or agricultural land has their entire carbon density below sea level, with said
region’s carbon density being between 51-75 t/ha. We furthermore approximate that the
fertile forest or agricultural land has a carbon density between 76-100 t/ha, with 40% of that
mass lying above the water, as is consistent with the Fearnside model, and with Salter et al.
characterizations of the respective areas as grasslands and evergreen forests.64,65 The
portion lying above water is characterized as decaying fully aerobically, with emissions
quickly exhausted within the first years during and after construction. As such, we will map
a quickly decaying exponential model of CO2 emissions, where total emissions are found
using the equation E = B * P * TA * PA, where E is emissions in metric tons of CO2, B is
biodensity of flooded land, P is proportion of biomass above water, TA is total area of flooded
land, and PA is the biomass to CO2 conversion ratio of 44 to 12 mass units. Final calculations
are made in the Summary of Costs section.
Methane (CH4) will be produced when carbon decomposition occurs under anaerobic
conditions. Macrophyte activity in such conditions will decompose life forms, primarily dead
63 FAO Forestry Dept., 2005. 64 Salter et al., 2011. 65 Fearnside, 2005.

32
or flooded vegetation, and emit methane gas. Methane production is extremely
environmentally costly: per ton of gas, CH4 has 21 times more impact on global warming than
CO2.66 The first step is to address surface emissions of CH4 from diffusion of methane or gas
bubbling release of methane from the reservoir into the atmosphere.
Fearnside estimates the surface methane emissions of the 72 sq. km Curuà-Una
reservoir at 1290.1 t CH4/year. Adjusting for volume, we can predict surface emissions of the
Inga 3 reservoir to be 279.5 t CH4/year. This model must be adjusted for the fact that the
Bundi reservoir for the Inga 3 project is not shallow, and thus emitted CH4 must travel a
longer water column to be emitted than in the Curuà-Una dam, and as such will have more
time to be oxidized into carbon dioxide. Thus, surface emissions are estimated to be 250 t
CH4/year, or 5250 t CO2-eq/year.
Turbine emissions are a larger source of methane emissions. These rise as a function
of water flow through the turbines, as well as methane density of the river or reservoir. The
equation P = G * Q * H is used to calculate water flow through turbines.67 P is hydraulic power
in Watts (4800 MW), G is acceleration due to gravity (9.81 m/s/s), Q is flow rate in m3/s, and
H is potential head of dam (95m).68 Thus, flow rate through the Inga 3 turbines is
approximately 5150 m3/s. An assay of a Congo River basin showed an average CH4 molarity
of 164 nmol/l,69 which, when multiplied by 16 g/mol for methane, corresponds to 2.62 mg
of methane/l. Following Fearnside in assuming at 60% of methane is released on passing
through the turbine, annual turbine methane emissions are calculated using the equation
𝐸 = 0.6 ∗ 𝑆 ∗ 𝐷 ∗ 𝑡 where S is flow rate in l/s, D is kg CH4/l water, and t is the conversion
factor of seconds to years. Therefore, 0.255 Mt of CH4, or 5.355 Mt CO2-eq, are released
through turbine emissions annually. Methane emissions from the reservoir are significantly
higher than carbon dioxide emissions from the reservoir.
66 Ibid. 67 Hammons et al., 2011. 68 World Bank, 2014. 69 Ibid.

33
Social Impacts of Hydropower and Inga 3
Past experiences with resettlement due to dams in Sub-Saharan Africa reveal
tremendous inefficiencies, with resettled people waiting years or even decades for cash or
land compensation, and relocated peasant farmers sinking into poverty following relocation
and never reintegrating into the agriculture economy in their new location.70 In fact, 7,000-
10,000 resettled people from Inga 1 and 2 have yet to receive compensation and still live in
a temporary situation in Camp Kinshasa.71 Due to underfinancing and underestimation of
risk, dam-building projects, particularly in developing regions, routinely “underestimate the
losses caused by displacement, compensate them in utterly insignificant proportion, and
externalize the difference as an unbearable burden on the displaced population.”72
The people living in the area surrounding the dams have been subjected to forced
relocation with limited, delayed, and often nonexistent compensation, and have been
rewarded with limited access to power at best. According to Simon Malanda, a
representative of the communities displaced during the construction of the Inga dams, the
Inga site was home to families from six clans who were forced to leave the site in 1920 under
Belgian colonial orders. It would be 30 years before any construction began at the site, and
in 1954-55, the Belgian authorities had to undertake a population survey of the area in order
to determine if people had returned to or remained in the area. After this survey, community
members sought compensation from the government. In 1958, an agreement with the
Belgian colonial authorities was reached for a lump sum of 781,000 Belgian francs to be paid
to the displaced communities.73 Unfortunately, the Belgian government never paid the
community members, and soon after Congo gained its independence. Neither the Congo nor
SNEL honored this agreement.
In 1970, SNEL wrote to Mr. Malanda that the claim would be included in the 1971
budget. However, SNEL did not fulfill its agreement. In 1975, a lawyer for the communities
submitted their claim to the high court in Kinshasa, but SNEL persuaded the lawyer to
70 De Wet, 1999. 71 World Bank, 2014. 72 Cernea, 2004. 73 International Rivers, 2014b.

34
withdraw the claim and settle out of court.74 The people of the six clans now live in 12 pre-
existing villages and one new village (called Lubwaku, meaning “thrown away”) around the
area. Also, Camp Kinshasa, the former workers’ camp, is now inhabited by displaced families
and former project workers or children of former workers. This camp is located on land
taken by SNEL for the projects, and a 2006 estimate established the population at 9000.
Camp Kinshasa has grown over the years despite a lack of sanitation facilities and the fact
that residents are not allowed to build on the site. Access to water is limited by water
pressure during the day and there is only one water pump connected to the camp. Camp
Kinshasa is the only area where displaced communities have access to electricity. The
affected communities would still like to be compensated for being displaced from the original
Inga site and also are seeking access to job opportunities, electricity, and what they call a
“modern city” with schools, health care, roads, internet and other infrastructure.
In response to the World Bank 2014 proposal, local communities prepared a petition
expressing concerns over the resettlement plan for the Inga 3 project, stating, “the flooding
of the Bundi Valley which is the agricultural hub for a large number of people in the region
will cause colossal impacts and collateral effects on the environment in general with
immediate consequence of the inevitable destruction of the livelihoods of the local
communities affected.”75 As such, it is critical to evaluate not only the price tag of the land
seized for the construction of the dam, the Bundi reservoir, and the transmission lines, but
to consider the productivity of the land lost.
Cost-Benefit Analysis
The renewable nature of hydropower has been a major selling point for investors
throughout the evolution of the Inga project proposal. With that in mind, this cost-benefit
analysis concerns itself with global costs and benefits, including greenhouse gas externalities
that impact all of humanity.
74 International Rivers, 2014b. 75 Local communities et al., 2014.

35
The “Without” Case
The “without” case assumes the same rising electricity demand as the “with” case –
Sub-Saharan Africa’s demand for electricity during this pivotal stage of development is the
very driving force behind the Inga 3 project, and if the dam is not completed the energy must
be made up by other means. The energy portfolio of the region is dominated by coal,76 so the
assumption of this paper is that the power output of the Inga 3 dam will displace coal
generation. The cost of the project will be invested elsewhere, and the primary discount rate
used to calculate present values in the analysis is 7%, with 5% and 10% used as low and high
bounds during the sensitivity analysis.
Summary of Costs
The numerical values of each cost and notes on their source and calculation are
included in Table 1, below. The costs are frontloaded due to the high fixed construction cost
which dominates the total cost model. Construction cost (DCC) of the dam and power plant,
including labor, capital, and legal and bureaucratic expenses is estimated in the World Bank
grant proposal,77 and is discounted over the estimated construction period (T). This cost is
funded by the World Bank and similar institutions (e.g. the African Development Bank),
national governments and utilities in Sub-Saharan Africa, and foreign investors. Present
value of DCC is represented by
𝑃𝑉𝐶𝐶 = ∑𝐷𝐶𝐶
𝑇(1 + 𝑟)𝑡
𝑇−1
𝑡=0
Loss of agricultural productivity (LAP) of land inundated by the reservoir and cleared
for transmission line installation is another up-front cost, estimated based on regional land
price (LP) multiplied by area (AD) and paid in the first year of the project. This cost is paid
both by the entities funding construction, and by the peoples of the region to whom the
agricultural loss represents an economic loss that may never be recuperated.
𝑃𝑉𝐿𝐴𝑃 = 𝐴𝐷 ∗ 𝐿𝑃
76 US EIA, 2014. 77 World Bank, 2014.
36
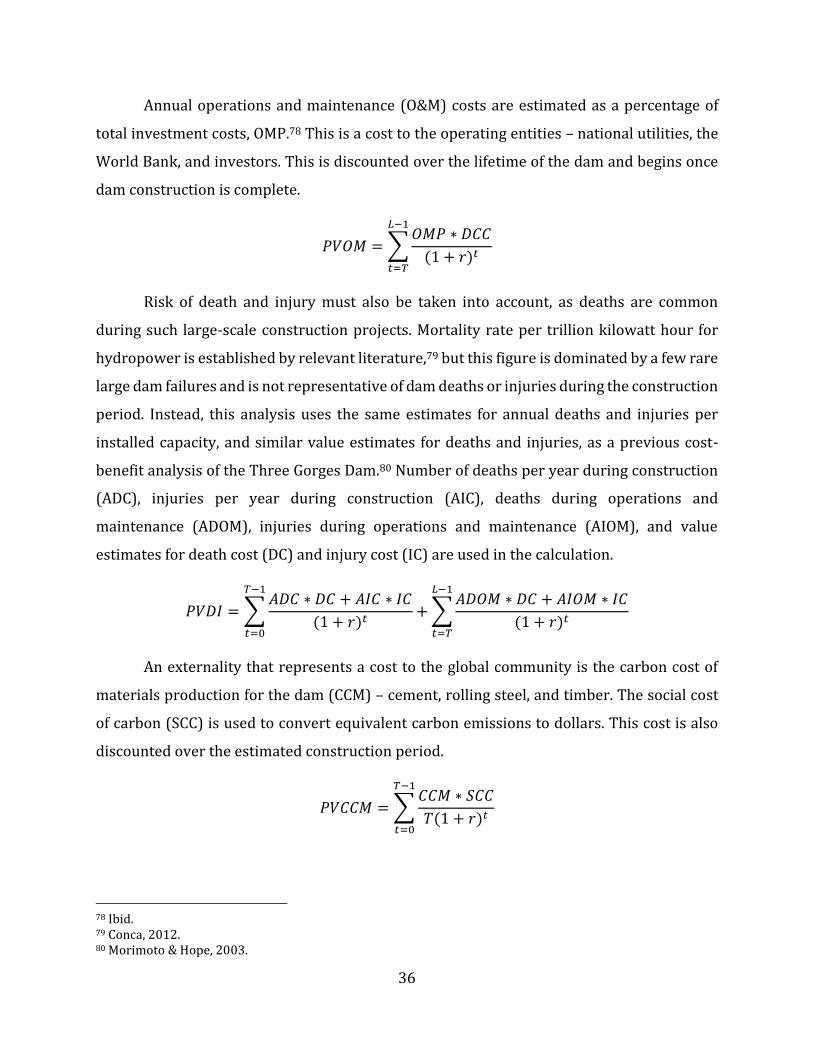
Annual operations and maintenance (O&M) costs are estimated as a percentage of
total investment costs, OMP.78 This is a cost to the operating entities – national utilities, the
World Bank, and investors. This is discounted over the lifetime of the dam and begins once
dam construction is complete.
𝑃𝑉𝑂𝑀 = ∑𝑂𝑀𝑃 ∗ 𝐷𝐶𝐶
(1 + 𝑟)𝑡
𝐿−1
𝑡=𝑇
Risk of death and injury must also be taken into account, as deaths are common
during such large-scale construction projects. Mortality rate per trillion kilowatt hour for
hydropower is established by relevant literature,79 but this figure is dominated by a few rare
large dam failures and is not representative of dam deaths or injuries during the construction
period. Instead, this analysis uses the same estimates for annual deaths and injuries per
installed capacity, and similar value estimates for deaths and injuries, as a previous cost-
benefit analysis of the Three Gorges Dam.80 Number of deaths per year during construction
(ADC), injuries per year during construction (AIC), deaths during operations and
maintenance (ADOM), injuries during operations and maintenance (AIOM), and value
estimates for death cost (DC) and injury cost (IC) are used in the calculation.
𝑃𝑉𝐷𝐼 = ∑𝐴𝐷𝐶 ∗ 𝐷𝐶 + 𝐴𝐼𝐶 ∗ 𝐼𝐶
(1 + 𝑟)𝑡
𝑇−1
𝑡=0
+ ∑𝐴𝐷𝑂𝑀 ∗ 𝐷𝐶 + 𝐴𝐼𝑂𝑀 ∗ 𝐼𝐶
(1 + 𝑟)𝑡
𝐿−1
𝑡=𝑇
An externality that represents a cost to the global community is the carbon cost of
materials production for the dam (CCM) – cement, rolling steel, and timber. The social cost
of carbon (SCC) is used to convert equivalent carbon emissions to dollars. This cost is also
discounted over the estimated construction period.
𝑃𝑉𝐶𝐶𝑀 = ∑𝐶𝐶𝑀 ∗ 𝑆𝐶𝐶
𝑇(1 + 𝑟)𝑡
𝑇−1
𝑡=0
78 Ibid. 79 Conca, 2012. 80 Morimoto & Hope, 2003.

37
Reservoir carbon emissions (RCE) in the form of CO2 and CH4 are discussed in-depth
in the Environmental and Social Impacts section. Annual reservoir CO2 emissions are
determined by solving for the constant k using the exponential form of total emissions, 𝐸 =
lim𝑡→∞
∑ 𝑘𝑒−0.9𝑡𝑡0 , or 𝐸 =
10
9𝑘. Calculations of k are shown in Table 2, below. Annual emissions
equal 𝑘𝑒−0.9𝑡, and are priced using SCC. Annual reservoir CH4 emissions in CO2-eq terms
(RME) are calculated in the Environmental and Social Impacts section.
𝑃𝑉𝑅𝐶𝐸 = ∑ (𝑘𝑒−0.9𝑡 + 𝑅
𝑇+𝐿−1
𝑡=0
𝑀𝐸) ∗𝑆𝐶𝐶
(1 + 𝑟)𝑡
A similar suite of costs is estimated for the construction of transmission lines,
including intra-DRC lines and the high-voltage line from DRC to South Africa. The factors
used are transmission line construction cost (TLC), loss of land productivity (ATL*LP),
carbon cost of materials production for the transmission line (TLCCM), and operations and
maintenance (TLOM). Construction time is assumed to be the same as the dam. Further, loss
of productivity of 84 households in the area of the planned transmission line within DRC
must be considered as part of this calculation. This is estimated by GDP per capita within
DRC and a multiplier to estimate percent of productivity lost (PLM), and is discounted over
the construction time of the project plus the lifetime of the dam (L). These numbers and notes
on their source and calculation are included in Table 3, below.
𝑃𝑉𝑇𝐿 = ∑𝑇𝐿𝐶
𝑇(1 + 𝑟)𝑡
𝑇−1
𝑡=0
+ 𝐴𝑇𝐿 ∗ 𝐿𝑃 + ∑𝑇𝐿𝑂𝑀 ∗ 𝐷𝐶𝐶
(1 + 𝑟)𝑡
𝐿−1
𝑡=𝑇
+ ∑𝑇𝐿𝐶𝐶𝑀 ∗ 𝑆𝐶𝐶
𝑇(1 + 𝑟)𝑡
𝑇−1
𝑡=0
+ ∑𝐺𝐷𝑃 ∗ 𝑃𝐿𝑀
(1 + 𝑟)𝑡
𝑇+𝐿−1
𝑡=0
Summary of Benefits
Benefits are dominated by the value of electricity produced. Total power generation
(P) is predicted to vary around the firm capacity of 4000MW. The contract signed with
Eskom, the South African electricity utility, dictates that 2500MW be transferred from Inga
3 to the South African border via the to-be-constructed high-voltage transmission line. A
contract with mining companies in the Katanga region accounts for a further 1300MW. The

38
remainder of the electricity generated will be transferred to Kinshasa, DRC’s capital,
primarily for residential and commercial use.81 The World Bank has completed a survey of
willingness-to-pay (WTP) for each of these consumer groups (detailed in Table 4). The final
factor in calculating annual value of electricity generated (AVEG) is the grid transmission
efficiency to each consumer region, also detailed in Table 3; numbers in the table are
determined using the models found in this report’s Energy Distribution section. The benefits
of this electricity accumulate in part to the consumers in the form of consumer surplus and
to the dam stakeholders as producer surplus. WTP is used as it accounts for the sum of the
two, giving the total economic benefit of electricity produced.
𝑃𝑉𝐸𝐺 = ∑𝐴𝑉𝐸𝐺
(1 + 𝑟)𝑡
𝐿−1
𝑡=𝑇
The other benefits are carbon dioxide and nitrous oxide greenhouse gas (GHG) and
sulfur oxide (SOX) emissions averted (ED) by replacing coal as a source of electricity. The
former is a benefit to the entire global community in the form of mitigated climate change.
The latter is a benefit to residents of the specific regions that consume the power, as SOX
emissions lead to smog, acid rain, harm to crops and livestock, and human health risks near
coal power plant locations.82 By multiplying the carbon dioxide-equivalent GHG output of
burning the amount of coal required to produce the same power output as Inga 3, annual
GHG averted by hydropower generation (GHGA) is calculated. Price or social cost of carbon
(SCC) is discussed in the Costs section. By multiplying the SOX emissions of the same quantity
of coal, SOX emissions averted by hydropower generation (SOA) is determined. Like GHG
emissions, a price or social cost of SOX emissions (PSO) is established in economic literature.
𝑃𝑉𝐸𝐷 = ∑𝐺𝐻𝐺𝐴 ∗ 𝑆𝐶𝐶 + 𝑆𝑂𝐴 ∗ 𝑃𝑆𝑂
(1 + 𝑟)𝑡
𝐿−1
𝑡=𝑇
81 World Bank, 2014. 82 Eds. of the Encyclopædia Britannica, 2014.

39
Summary of Cost-Benefit Model Parameters and Sensitivity Analysis
The following tables represent the values used in the net present value calculation for
the cost-benefit analysis. In order to allow for uncertainty through sensitivity analysis, three
scenarios are examined: a low net present value scenario, a reference case, and a high net
present value scenario. All dollar numbers have been converted to 2014 dollars.
Table 1 – Summary of Dam Construction and Operation Cost Factors Cost Factor Low NPV, Reference, High NPV Notes r 0.1, 0.07, 0.05 Discount rate represents economy-wide return on
investment minus inflation. T (years) 9, 8, 6 Best case is proposed 6-year construction time.83
Large-scale dams are uniquely prone to schedule overruns, averaging a 44% overrun with a median of 27%. Inga 3 is subject to notable factors: low per-capita income, associated with higher overruns, but also a low dam wall and high MW capacity, which correlate with lower overruns. World Bank projects a 2-year overrun as the worst case, which this paper uses as the reference case of 27% overrun. The worst case is a 44% overrun.
L (years) 35, 40, 50 The World Bank’s conservative estimate for lifespan is the lower bound.84 Dams routinely continue running longer than projected lifespans, and often exceed 50 years.
DCC ($billion) 8.6, 6.3, 6.2 The World Bank’s conservative estimate for the dam of the Bundi River and its corresponding intake is $2.6b, with an adjacent power plant costing $3.6b for a sum of $6.2b.85 The World Commission on Dams’ global review of large dams reveals that the 10 large dams funded by the African Development Bank had an average of 2% in cost overruns, while large-scale hydropower projects funded by the World Bank worldwide had an average cost overrun of 39%.86 These are used in the reference and high-cost scenarios.
AD (thousand ha) 1.63 This figure includes proposed footprint of dam, reservoir, and power plant.87
LP ($/ha) 590, 472, 354 A 2006 valuation of arable land in DRC, based on World Bank and United Nations data, estimated land values at $300-$500/ha.88
OMP (%) 2.5, 2.0, 1.5 2.0-2.5% of installation costs are typically needed for annual O&M of large hydroelectric projects.89
83 World Bank, 2014. 84 Ibid. 85 Ibid. 86 World Commission on Dams, 2000. 87 World Bank, 2014. 88 Biopact, 2006. 89 IRENA, 2012.

40
The World Bank report projects 1.5%,90 used here for the most optimistic case.
ADC (deaths/year) 9.1, 3.8, 1.4 Values are calculated from estimated deaths/GW/year for hydropower construction projects presented in Morimoto & Hope91 and multiplied by Inga 3 GW output in each scenario.
ADOM (deaths/year)
3.0, 2.7, 1.5 Same as above.
AIC (injuries/year) 1,632, 1,488, 816 Same as above. AIOM (injuries/year)
62, 58, 34 Same as above.
DC ($million/death)
6.62, 2.65, 0.53 These calculations are based on a central US value of statistical life (VSL) of $6.3 million (2004 dollars)92 and a VSL income elasticity of 0.40, with extremes of 0.08 and 1.00. These values are supported by the EPA’s Guidelines for Preparing Economic Analysis.93 This method of evaluating VSL across countries is described in Hammitt & Robinson.94 Incomes are per capita GDP for the US and DRC.
IC ($thousand/injury)
550, 5, 1.5 Cost per injury during dam construction and O&M in developing countries is described in Morimoto & Hope.
CCM (million metric tons CO2-eq)
5.12, 4.19, 3.25 Amount of each material was obtained by scaling the amount of materials from the 40 million sq. m volume of the Three Gorges Dam95 to the volume of Inga 3, estimated at 6.2 – 9.7 sq. m based on dam width and cross-sectional area required to hold the width of the river and depth of reservoir.96,97 Standard values for carbon emissions of production of each material are established by Mao, et al.98
SCC ($/metric ton CO2-eq)
6.90, 9.45, 12.00 Reference case is the 2014 price of carbon in the EU
Emissions Trading Scheme. 99 The reference case is the EPA’s official social cost of carbon at a 5%
discount rate,100 chosen because the high NPV scenario in this analysis also uses a 5% discount rate. Because the reference case is 27% below than the high price, the low price is projected at 27% below the reference case.
90 World Bank, 2014. 91 Morimoto & Hope, 2003. 92 Robinson et al., 2008. 93 OA EPA, 2000. 94 Hammitt & Robinson, 2011. 95 Gleick, 2009. 96 Wegmann, pp. 42, 1908. 97 World Bank, 2014. 98 Mao et al., 2013. 99 CITEPA, 2014. 100 Interagency Working Group on Social Cost of Carbon, 2013.
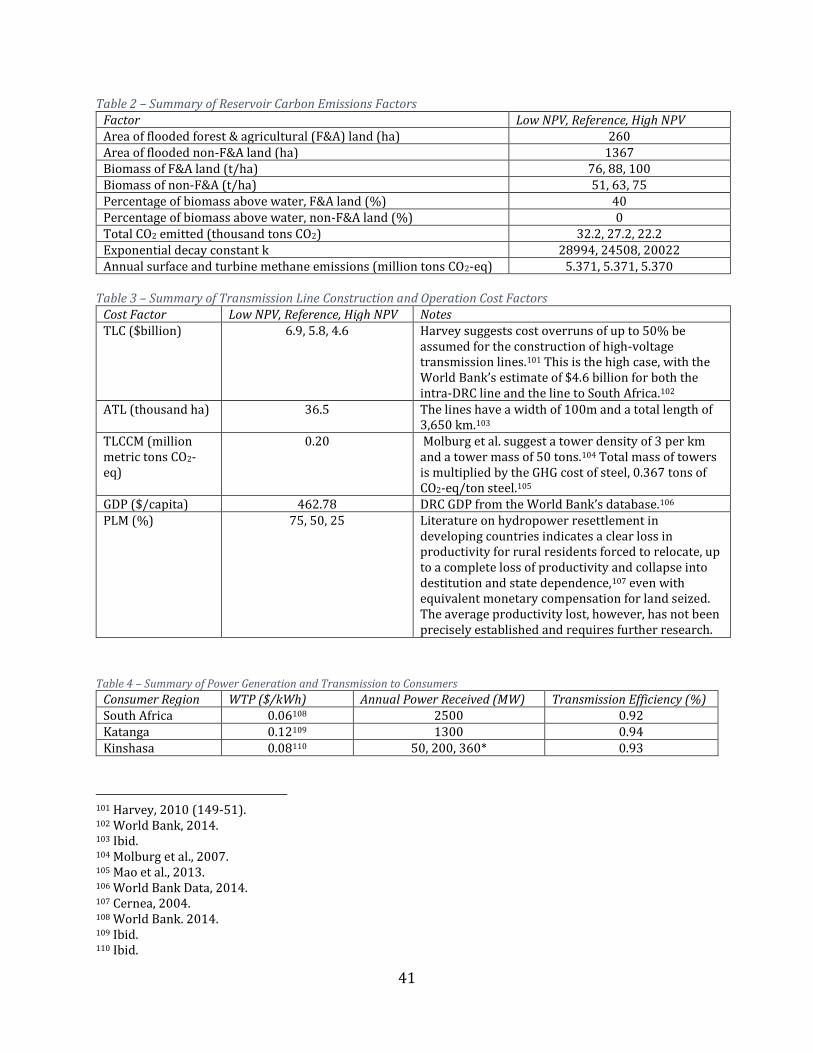
41
Table 2 – Summary of Reservoir Carbon Emissions Factors Factor Low NPV, Reference, High NPV Area of flooded forest & agricultural (F&A) land (ha) 260 Area of flooded non-F&A land (ha) 1367 Biomass of F&A land (t/ha) 76, 88, 100 Biomass of non-F&A (t/ha) 51, 63, 75 Percentage of biomass above water, F&A land (%) 40 Percentage of biomass above water, non-F&A land (%) 0 Total CO2 emitted (thousand tons CO2) 32.2, 27.2, 22.2 Exponential decay constant k 28994, 24508, 20022 Annual surface and turbine methane emissions (million tons CO2-eq) 5.371, 5.371, 5.370
Table 3 – Summary of Transmission Line Construction and Operation Cost Factors
Cost Factor Low NPV, Reference, High NPV Notes TLC ($billion) 6.9, 5.8, 4.6 Harvey suggests cost overruns of up to 50% be
assumed for the construction of high-voltage transmission lines.101 This is the high case, with the World Bank’s estimate of $4.6 billion for both the intra-DRC line and the line to South Africa.102
ATL (thousand ha) 36.5 The lines have a width of 100m and a total length of 3,650 km.103
TLCCM (million metric tons CO2-eq)
0.20 Molburg et al. suggest a tower density of 3 per km and a tower mass of 50 tons.104 Total mass of towers is multiplied by the GHG cost of steel, 0.367 tons of CO2-eq/ton steel.105
GDP ($/capita) 462.78 DRC GDP from the World Bank’s database.106 PLM (%) 75, 50, 25 Literature on hydropower resettlement in
developing countries indicates a clear loss in productivity for rural residents forced to relocate, up to a complete loss of productivity and collapse into destitution and state dependence,107 even with equivalent monetary compensation for land seized. The average productivity lost, however, has not been precisely established and requires further research.
Table 4 – Summary of Power Generation and Transmission to Consumers
Consumer Region WTP ($/kWh) Annual Power Received (MW) Transmission Efficiency (%) South Africa 0.06108 2500 0.92 Katanga 0.12109 1300 0.94 Kinshasa 0.08110 50, 200, 360* 0.93
101 Harvey, 2010 (149-51). 102 World Bank, 2014. 103 Ibid. 104 Molburg et al., 2007. 105 Mao et al., 2013. 106 World Bank Data, 2014. 107 Cernea, 2004. 108 World Bank. 2014. 109 Ibid. 110 Ibid.

42
*Because Kinshasa receives the leftover power output after South Africa and Katanga mining companies take a contractually set cut, power supplied to Kinshasa is the only figure that varies with changing power output in the sensitivity analysis scenarios.
Table 5 – Summary of Economic Benefit Factors
Benefit Factor Low NPV, Reference, High NPV Notes AVEG ($billion/year)
2.528, 2.626, 2.730 Total power output is described in the Energy Generation section of the report (3850-4160MW). Value of power delivered is summed across the three consumer regions, adjusted for transmission losses as described in Table 4.
GHGA (million metric tons CO2-
eq/year)
33.51, 34.82, 36.21 An assessment of three major South African coal plants determined that for each kWh of electricity from coal, 0.993 kg of CO2-equivalent GHG emissions were released.111 This was multiplied by total power output of Inga 3 in each scenario.
SOA (million metric tons SOX/year)
0.303, 0.315, 0.327 South African coal generation produces 8.97g SOX per kWh.112
PSO ($/kg SOX) 1.07 Muller et al. estimate the median social cost of SOX emission in the US at $970/short ton, or $1.07/kg.113
Net Present Value Model
The net present value of the Inga 3 dam project is determined by the present value of
costs subtracted from the present value of benefits. The equations in previous sections
represent the present value equations for costs and benefits. Table 6 (below) shows a
summary of the net present value calculation over the construction cycle and subsequent
lifespan of the dam, including sensitivity analysis.
Table 6 – Net Present Value of Inga 3 Dam Project to the Global Community and Sensitivity Analysis
Low NPV Reference High NPV Present Value of Costs ($19,196,385,283) ($12,498,947,858) ($13,389,140,864)* Present Value of Benefits $13,869,994,051 $27,323,743,846 $50,270,041,792 Net Present Value ($5,326,391,233) $14,824,795,988 $36,880,900,929
*Carbon price is constant within each scenario. A high carbon price is associated with a higher NPV because of the increased value of carbon emissions averted, so the High NPV scenario uses a higher carbon price than other scenarios. This results in a larger economic cost of reservoir and construction GHG emissions, though, and because of this, present value of costs in the High NPV scenario is larger than in the Reference case.
111 Letete et al., 2009. 112 Von Blottnitz, 2006. 113 Muller et al., 2011.

43
Figure 7 – Cumulative Net Present Value of Inga 3 Dam Project
In the Reference and High NPV scenarios, the Inga 3 dam project is economically
profitable. The breakeven point for the Reference case is reached in year 14 of the project,
seven years after the dam’s completion. In the High NPV scenario, the breakeven point is
reached in year 9, only four years following the dam’s completion. These rapid payback
periods clearly indicate that the hydropower potential of the region is extremely high. In the
Low NPV scenario, however, the project is economically unprofitable, never recuperating the
initial capital expenditures. The $42 billion disparity between the low estimate and the high
estimate reveals a high degree of uncertainty, particularly in evaluation of the project’s
benefits, and therefore a significant knowledge gap that must be addressed before
construction can begin. While the project is likely to produce a net economic profit, this is
not without risk.
The claim that the Inga 3 dam project represents a net external benefit to the global
community in terms of carbon emissions averted holds up to this report’s analysis. The
external net present value of greenhouse gas emissions ranges from $601 million in the Low
NPV case to $4.902 billion in the High NPV case, with a most likely value of $1.929 billion in
the Reference case. Because of the high carbon cost of coal electricity generation, a
renewable energy project of this scale in the developing world is extremely likely to mitigate
-$20
-$10
$0
$10
$20
$30
$40
0 10 20 30 40 50 60
Net
Pre
sen
t V
alu
e, $
bil
lio
n
Year
Cumulative Net Present Value of Inga 3 Dam Project
High NPV
Reference
Low NPV

44
climate change by reducing greenhouse gas emissions, even in the least optimistic scenario
used in this analysis.
Conclusion
This report has applied an economic cost-benefit analysis model to the Inga 3 dam
project in the Democratic Republic of Congo. Results suggest that the World Bank’s initial
economic analysis of the project, which calculated a range of net present values from $4.92
billion to $7.38 billion with a discount rate of 10%,114 are reasonable in magnitude but vastly
underestimate uncertainty associated with the project. This report includes a wide variety
of factors ignored by previous economic analyses of the Inga 3 dam project, including
externalities that significantly impact the global community. Factors previously untreated by
economic analysis include greenhouse gas and nitrous oxide emissions mitigated by
electricity generation, greenhouse gas emissions from materials manufacture, greenhouse
gas emissions from the dam reservoir, deaths and injuries during the construction and
maintenance of the dam, and productivity lost to forced resettlement. The report concludes
that the project has great potential for economic benefit to the stakeholders, regional
electricity consumers, and the global community, but due to the magnitude of uncertainty
and unknowns surrounding the analysis, this benefit comes at a high risk.
Reducing Uncertainty: Questions for Future Research
Much of the uncertainty lies in the calculation of benefits in the dam. Regional poverty
and instability casts significant doubt on the ability of the dam to consistently generate its
optimistic nameplate power output, especially in light of the poor performance of the first
two Inga dams. The difference in power output between the High and Low NPV scenarios
accounts for an annual discrepancy of $202 million in electricity value alone. Combined with
construction delays and capital deterioration over the course of the dam’s generating
lifespan, the shortfall of lifetime electricity generated between the Low NPV scenario and the
High NPV scenario results in a net present value shortfall of $27.7 billion from the most
optimistic projections. This leads to increased demand for coal electricity to offset the Inga
shortage, compounding the project’s underperformance with carbon and sulfur oxide
114 World Bank, 2014.
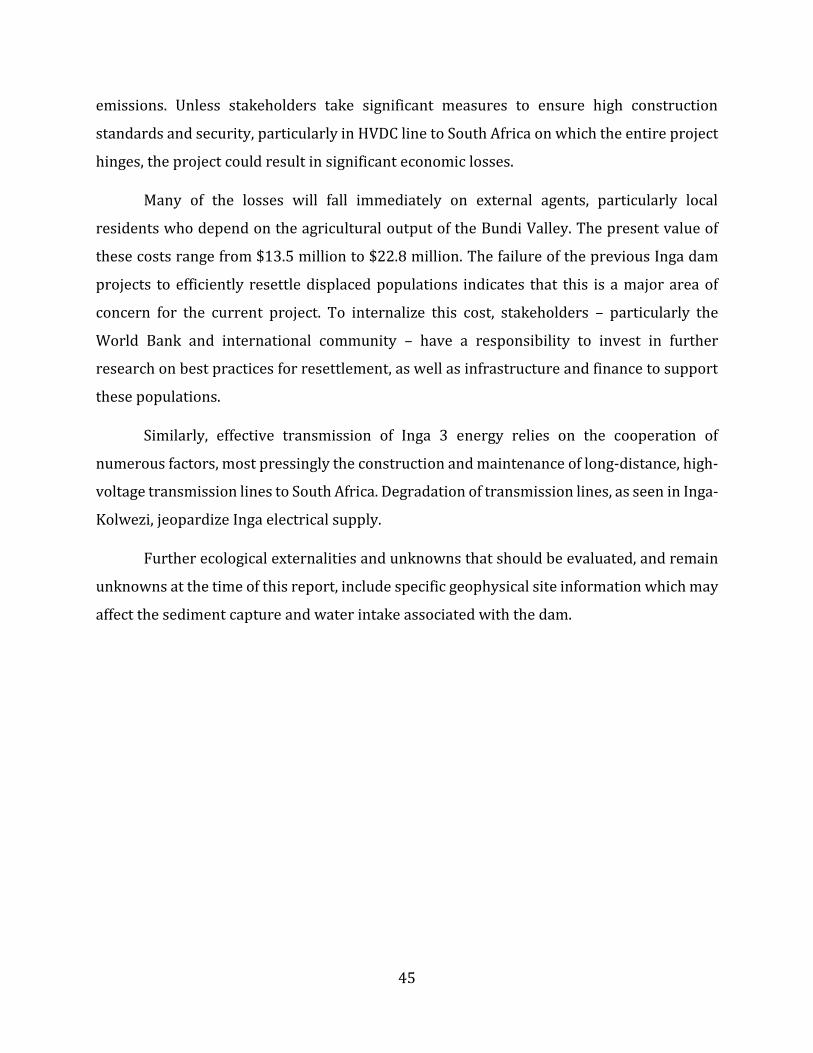
45
emissions. Unless stakeholders take significant measures to ensure high construction
standards and security, particularly in HVDC line to South Africa on which the entire project
hinges, the project could result in significant economic losses.
Many of the losses will fall immediately on external agents, particularly local
residents who depend on the agricultural output of the Bundi Valley. The present value of
these costs range from $13.5 million to $22.8 million. The failure of the previous Inga dam
projects to efficiently resettle displaced populations indicates that this is a major area of
concern for the current project. To internalize this cost, stakeholders – particularly the
World Bank and international community – have a responsibility to invest in further
research on best practices for resettlement, as well as infrastructure and finance to support
these populations.
Similarly, effective transmission of Inga 3 energy relies on the cooperation of
numerous factors, most pressingly the construction and maintenance of long-distance, high-
voltage transmission lines to South Africa. Degradation of transmission lines, as seen in Inga-
Kolwezi, jeopardize Inga electrical supply.
Further ecological externalities and unknowns that should be evaluated, and remain
unknowns at the time of this report, include specific geophysical site information which may
affect the sediment capture and water intake associated with the dam.
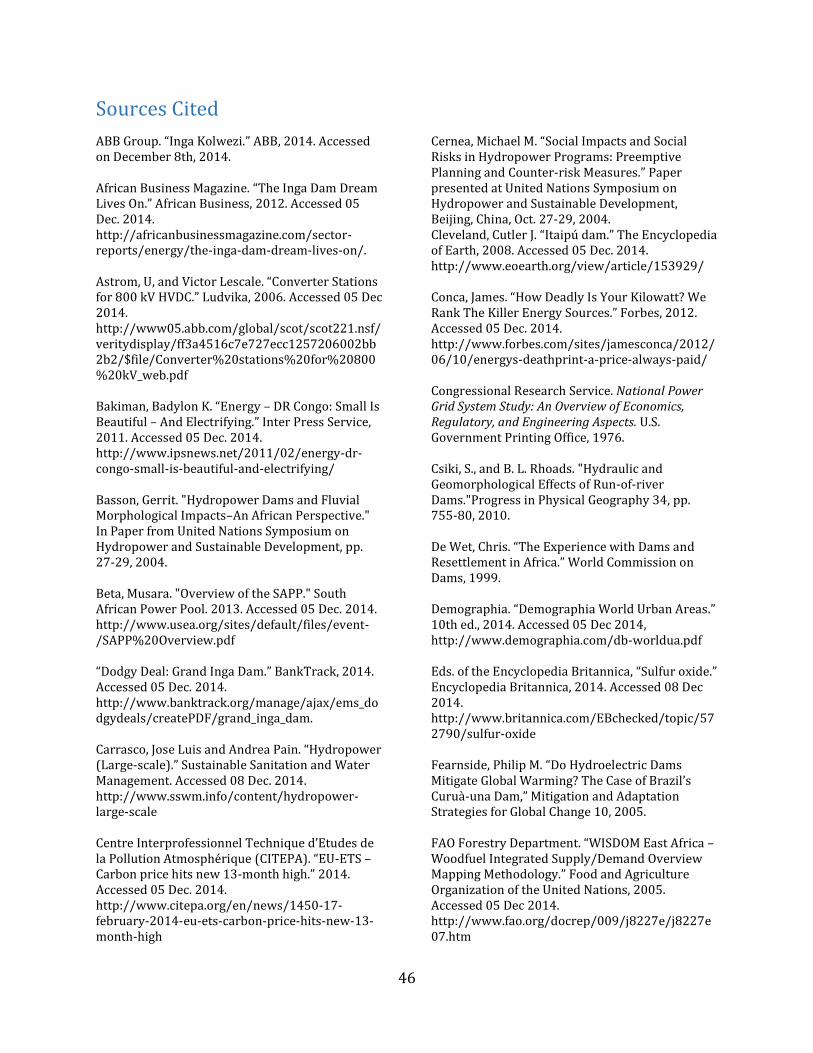
46
Sources Cited
ABB Group. “Inga Kolwezi.” ABB, 2014. Accessed on December 8th, 2014. African Business Magazine. “The Inga Dam Dream Lives On.” African Business, 2012. Accessed 05 Dec. 2014. http://africanbusinessmagazine.com/sector-reports/energy/the-inga-dam-dream-lives-on/. Astrom, U, and Victor Lescale. “Converter Stations for 800 kV HVDC.” Ludvika, 2006. Accessed 05 Dec 2014. http://www05.abb.com/global/scot/scot221.nsf/veritydisplay/ff3a4516c7e727ecc1257206002bb2b2/$file/Converter%20stations%20for%20800%20kV_web.pdf Bakiman, Badylon K. “Energy – DR Congo: Small Is Beautiful – And Electrifying.” Inter Press Service, 2011. Accessed 05 Dec. 2014. http://www.ipsnews.net/2011/02/energy-dr-congo-small-is-beautiful-and-electrifying/ Basson, Gerrit. "Hydropower Dams and Fluvial Morphological Impacts–An African Perspective." In Paper from United Nations Symposium on Hydropower and Sustainable Development, pp. 27-29, 2004. Beta, Musara. "Overview of the SAPP." South African Power Pool. 2013. Accessed 05 Dec. 2014. http://www.usea.org/sites/default/files/event-/SAPP%20Overview.pdf “Dodgy Deal: Grand Inga Dam.” BankTrack, 2014. Accessed 05 Dec. 2014. http://www.banktrack.org/manage/ajax/ems_dodgydeals/createPDF/grand_inga_dam. Carrasco, Jose Luis and Andrea Pain. “Hydropower (Large-scale).” Sustainable Sanitation and Water Management. Accessed 08 Dec. 2014. http://www.sswm.info/content/hydropower-large-scale Centre Interprofessionnel Technique d’Etudes de la Pollution Atmosphérique (CITEPA). “EU-ETS – Carbon price hits new 13-month high.” 2014. Accessed 05 Dec. 2014. http://www.citepa.org/en/news/1450-17-february-2014-eu-ets-carbon-price-hits-new-13-month-high
Cernea, Michael M. “Social Impacts and Social Risks in Hydropower Programs: Preemptive Planning and Counter-risk Measures.” Paper presented at United Nations Symposium on Hydropower and Sustainable Development, Beijing, China, Oct. 27-29, 2004. Cleveland, Cutler J. “Itaipú dam.” The Encyclopedia of Earth, 2008. Accessed 05 Dec. 2014. http://www.eoearth.org/view/article/153929/ Conca, James. “How Deadly Is Your Kilowatt? We Rank The Killer Energy Sources.” Forbes, 2012. Accessed 05 Dec. 2014. http://www.forbes.com/sites/jamesconca/2012/06/10/energys-deathprint-a-price-always-paid/ Congressional Research Service. National Power Grid System Study: An Overview of Economics, Regulatory, and Engineering Aspects. U.S. Government Printing Office, 1976. Csiki, S., and B. L. Rhoads. "Hydraulic and Geomorphological Effects of Run-of-river Dams."Progress in Physical Geography 34, pp. 755-80, 2010. De Wet, Chris. “The Experience with Dams and Resettlement in Africa.” World Commission on Dams, 1999. Demographia. “Demographia World Urban Areas.” 10th ed., 2014. Accessed 05 Dec 2014, http://www.demographia.com/db-worldua.pdf Eds. of the Encyclopedia Britannica, “Sulfur oxide.” Encyclopedia Britannica, 2014. Accessed 08 Dec 2014. http://www.britannica.com/EBchecked/topic/572790/sulfur-oxide Fearnside, Philip M. “Do Hydroelectric Dams Mitigate Global Warming? The Case of Brazil’s Curuà-una Dam,” Mitigation and Adaptation Strategies for Global Change 10, 2005. FAO Forestry Department. “WISDOM East Africa – Woodfuel Integrated Supply/Demand Overview Mapping Methodology.” Food and Agriculture Organization of the United Nations, 2005. Accessed 05 Dec 2014. http://www.fao.org/docrep/009/j8227e/j8227e07.htm
47
Gleick, Peter H. “Three Gorges Dam Project, Yangtze River, China.” The World’s Water 2008-2009: The Biennial Report on Freshwater Resources.” Island Press, 2009. http://islandpress.org/worlds-water-2008-2009 Hammitt, James K. & Lisa A. Robinson, “The Income Elasticity of the Value per Statistical Life: Transferring Estimates between High and Low Income Populations,” Journal of Benefit-Cost Analysis 2, 2011. Hammons, Thomas J. “Run of River Bulk Hydroelectric Generation from the Congo River without a Conventional Dam,” Natural Resources 2, 2011. Harvey, Leslie Daryl Danny. Energy and the New Reality 2 - Carbon-free Energy Supply. New York: Routledge, 2010. Inglesi, Roula. "Aggregate Electricity Demand in South Africa: Conditional Forcasts to 2030." Applied Energy, pp. 197-204, 2010. Interagency Working Group on Social Cost of Carbon. “The Social Cost of Carbon.” Environmental Protection Agency, 2013. Accessed 05 Dec. 2014. http://www.whitehouse.gov/sites/default/files/omb/assets/inforeg/technical-update-social-cost-of-carbon-for-regulator-impact-analysis.pdf International Bank for Reconstruction and Development. “Involuntary Resettlement Sourcebook: Planning and Implementation in Development Projects.” World Bank, 2004. http://indr.org/wp-content/uploads/2013/02/World-Bank-Involuntary-Resettlement-Sourcebook.pdf International Energy Agency. “Energy for All: Financing access for the poor (Special early excerpt of the World Energy Outlook 2011)” Presented at the Energy for All Conference in Oslo, Norway, Oct. 2011. International Energy Agency Hydropower Implementing Agreement. “Hydropower and the Environment: Managing the Carbon Balance in Freshwater Reservoirs.” IEA Hydro, 2012. Accessed 05 Dec. 2014. http://www.ieahydro.org/uploads/files/annexxii_ghgguidelinesoct2012.pdf
International Renewable Energy Agency (IRENA). “Renewable Energy Technologies: Cost Analysis Series, Hydropower.” Volume 1, Power Section. 2012. International Rivers, “Community History of Inga 1 and Inga 2.” 2014a. Accessed 05 Dec 2014. http://www.internationalrivers.org/resources/community-history-of-inga-1-and-inga-2-3622 International Rivers. “Inga 1 and Inga 2 Dams.” 2014b. Accessed 05 Dec 2014. http://www.internationalrivers.org/resources/inga-1-and-inga-2-dams-3616 Jullien, Maud. “Can DR Congo’s Inga dam project power Africa?” BBC Africa, 2013. Accessed 05 Dec. 2014. http://www.bbc.com/news/world-africa-24856000 Kadiayi, Alex. “Overview of the Electricity Sector in the Democratic Republic of Congo.” Democratic Republic of Congo Transmission Dept., 2013. Accessed 05 Dec. 2014. http://www.usea.org/sites/default/files/event-/Democratic%20Republic%20of%20Congo%20Power%20Sector.pdf Letete, Thapelo and Mondli Guma, “Information on climate change in South Africa: greenhouse gas emissions and mitigation options.” Energy Research Centre, 2009. Accessed 05 Dec. 2014. http://www.erc.uct.ac.za/Information/Climate%20change/Climate_change_info-complete.pdf Local communities and customary landowners of Inga, Inhabitants of Camp Kinshasa and villages Mvuzi 3, Lubuaku, Lundu, Kilengo, Kulu 1, Kulu 2, Kulu 3, Kimufu, Manzi, Yalala, Lufundi 1, Lufundi 2. “Petition of Inga local communities likely to be affected by the construction of the Inga 3 dam.” International Rivers, 2014. Accessed 05 Dec. 2014. http://www.internationalrivers.org/files/attached-files/codiclis_petition_english.pdf “MagEnergy Concludes Inga II Rehabilitation Agreement,” Marketwired, 2005. Accessed 05 Dec. 2014. http://www.marketwired.com/press-release/MagEnergy-Concludes-INGA-II-Rehabilitation-Agreement-543620.htm

48
Mao, Chao, Qiping Shen, Liyin Shen, Liyaning Tang. “Comparative study of greenhouse gas emissions between off-site prefabrication and conventional construction methods: Two case studies of residential projects,” Energy and Buildings 66, pp. 165-176, 2013. Molburg, J.C., J.A. Kavicky, and K.C. Picel. “The Design, Construction, and Operation of Long-Distance High-Voltage Electricity Transmission Technologies.” Argonne National Laboratories Environmental Science Division, 2007. MongaBay. “Land prices in Africa,” Biopact, 2006. Accessed 05 Dec 2014. http://news.mongabay.com/bioenergy/2006/09/land-prices-in-africa.html Morimoto, R. and C. Hope. “Applying a CBA Model to the Three Gorges Project in China.” University of Cambridge Judge Institute of Management, 2003. Muller, Nicholas Z., Robert Mendelsohn, and William Nordhaus. “Environmental Accounting for Pollution in the United States Economy.” American Economic Review, 101(5), pp. 1649-75, 2011. Odhiambo, Nicholas M. “Electricity Consumption, Exports, and Economic Growth in the Democratic Republic of Congo: An ARDL-Bounds Testing Approach.” The Journal of Developing Areas 48, 2014. Office of the Administrator of the US Environmental Protection Agency (OA EPA). “Guidelines for Preparing Economic Analysis.” EPA, 2000. Accessed 05 Dec. 2014. http://yosemite.epa.gov/ee/epa/eerm.nsf/vwAN/EE-0228C-07.pdf/$file/EE-0228C-07.pdf Parliamentary Office of Science and Technology. “Carbon Footprint of Electricity Generation.” Postnote, 2006. Accessed 05 Dec. 2014. http://www.parliament.uk/documents/post/postpn268.pdf Project Finance Newswire. “New Hydroelectric Projects in Africa a Reminder of the Enormous Unrealized Potential for This Source of Electricity.” Chadbourne, 2008. Accessed 05 Dec. 2014. http://www.chadbourne.com/HydropowerinAfrica_Nov08_projectfnance/
Robinson, Lisa A. “Valuing Mortality Risk Reductions in Homeland Security Regulatory Analyses,” U.S. Customs and Border Protection, 2008. Salter, Matt E., Paul J. Mann, Bienvenu Dinga, John Poulsen, Jonathan Barnes, Greg Fiske, Robert C. Upstill-Goddard, and Robert M. Holmes. “Outgassing from the Congo River Basin: a Major Source of Atmospheric CH4.” Presented at the AGU Fall Meeting, San Francisco, USA December 5-9 2011. Steinhurst, William, Patrick Knight, and Melissa Schultz. “Hydropower Greenhouse Gas Emissions: State of the Research.” Conservation Law Foundation and Pew Research Center, 2012. Sun, Qian. “Partial Social Cost Benefit Analysis of Three Gorges Dam: Impact Assessment Update and Greenhouse Gas Externality Component Study.” Masters diss., Dalhousie University, 2013. US Energy Information Administration (EIA). “South Africa.” Independent Statistics & Analysis, Feb. 2014. Accessed 05 Dec. 2014. http://www.eia.gov/countries/cab.cfm?fips=SF Von Blottnitz, H. “A comparison of air emissions of thermal power plants in South Africa and 15 European countries.” Journal of Energy in Southern Africa 17, 2006. Watershed Watch Salmon Society. “River Diversion / Run-of-River: What Is "Run of River" Hydropower?” Watershed Watch. Accessed December 8, 2014. http://www.watershed-watch.org/issues/hydropower/river-diversion/. Wegmann, Edward. The Design and Construction of Dams. Fifth Ed., John Wiley & Sons, 1908. World Bank. “International Development Association Project Appraisal on a Proposed Grant in the Amount of SDR 47.7 Million (US$ 73.1 Million Equivalent) to the Democratic Republic of Congo for an Inga 3 Basse Chute and Mid-Size Hydropower Development Technical Assistance Project.” Sustainable Development Department, Africa Region, 2014. http://www.wds.worldbank.org/external/default/WDSContentServer/WDSP/IB/2014/03/05/000456286_20140305164405/Rendered/PDF/774200REPLACEM0140Box382121B00OUO90.pdf

49
World Bank Data. “Congo, Dem. Rep.” 2014. Accessed 05 Dec. 2014. http://data.worldbank.org/country/congo-dem-rep World Commission on Dams, “Dams and Development: A New Framework for Decision-Making.” Sterling: Earthscan Publications, 2000. World Energy Council. “2004 Survey of Energy Resources.” 2004. Accessed 05 Dec. 2014. http://www.worldenergy.org/wp-content/uploads/2012/10/PUB_Survey-of-Energy-Resources_2004_WEC.pdf World Energy Council. “World Energy Resources: 2013 Survey.” 2013. Accessed 05 Dec. 2014. http://www.worldenergy.org/publications/2013/world-energy-resources-2013-survey/ Young, Crawford and Thomas Turner. The Rise and Decline of the Zairian State. Madison: The University of Wisconsin Press, 1985: 298–301.