figure 1: breakdown of cases by country disbursements check tampering payroll cash larceny cash on...
TRANSCRIPT

Country Number of Cases
Albania 1
Armenia 3
Bulgaria 5
Czech Republic 8
Hungary 2
Kazakhstan 5
Kosovo 1
Montenegro 2
Poland 8
Romania 11
Russia 21
Serbia 4
Slovakia 8
Slovenia 2
Turkey 15
Ukraine 2
Figure 1: Breakdown of Cases by Country
© 2017 Association of Certified Fraud Examiners, Inc. All rights reserved.

Figure 2: Occupational Frauds by Category—Frequency
© 2017 Association of Certified Fraud Examiners, Inc. All rights reserved.
0% 10% 20% 30% 40% 50% 60% 70% 80% 90% 100%
Financial Statement Fraud
Corruption
Asset Misappropriation
TY
PE
OF
FR
AU
D
P E R C E N T O F C A S E S
74.5%
55.1%
17.3%

Figure 3: Occupational Frauds by Category—Median Loss
© 2017 Association of Certified Fraud Examiners, Inc. All rights reserved.
$0 $200,000 $400,000 $600,000
Financial Statement Fraud
Corruption
Asset Misappropriation
TY
PE
OF
FR
AU
D
M E D I A N L O S S
$131,000
$200,000
$530,000

0% 10% 20% 30% 40% 50% 60%
Skimming
Register Disbursements
Check Tampering
Payroll
Cash Larceny
Cash on Hand
Expense Reimbursements
Financial Statement Fraud
Non-Cash
Billing
Corruption
SC
HE
ME
TY
PE
P E R C E N T O F C A S E S
55.1%
18.4%
18.4%
17.3%
10.2%
10.2%
7.1%
6.1%
4.1%
3.1%
2.0%
Figure 4: Frequency of Fraud Schemes
© 2017 Association of Certified Fraud Examiners, Inc. All rights reserved.
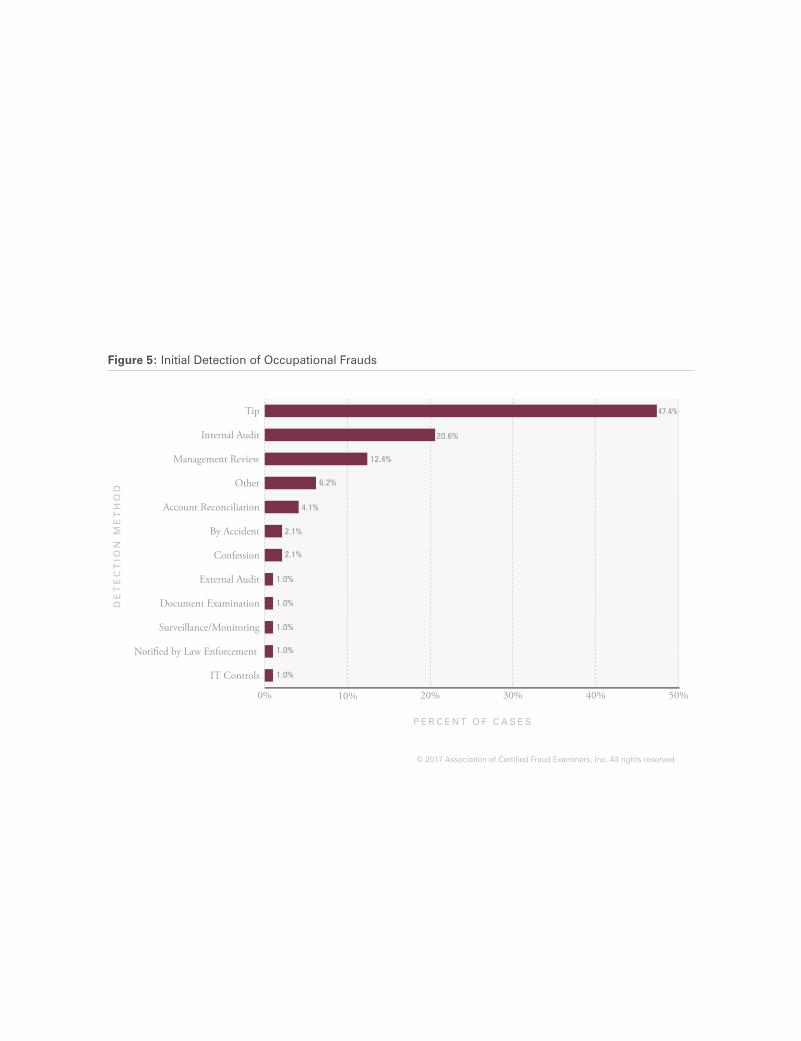
0% 10% 20% 30% 40% 50%
IT Controls
Notified by Law Enforcement
Surveillance/Monitoring
Document Examination
External Audit
Confession
By Accident
Account Reconciliation
Other
Management Review
Internal Audit
Tip
DE
TE
CT
ION
ME
TH
OD
P E R C E N T O F C A S E S
47.4%
20.6%
6.2%
12.4%
1.0%
4.1%
2.1%
2.1%
1.0%
1.0%
1.0%
1.0%
Figure 5: Initial Detection of Occupational Frauds
© 2017 Association of Certified Fraud Examiners, Inc. All rights reserved.

0% 10% 20% 30% 40% 50% 60%
Shareholder/Owner
Other
Competitor
Vendor
Anonymous
Customer
Employee
SO
UR
CE
OF
TIP
S
P E R C E N T O F C A S E S
2.2%
4.3%
19.6%
6.5%
6.5%
50.0%
23.9%
© 2017 Association of Certified Fraud Examiners, Inc. All rights reserved.
Figure 6: Source of Tips

0% 10% 20% 30% 40% 50% 60%
By Accident
Account Reconciliation
Management Review
Internal Audit
Tip
DE
TE
CT
ION
ME
TH
OD
P E R C E N T O F C A S E S
53.3%
37.5%
21.7%
6.7%
5.0%
3.3%
0.0%
3.1%Organizations With Hotlines
Organizations Without Hotlines
21.9%
18.8%
Figure 7: Impact of Hotlines on the Top Five Detection Methods
© 2017 Association of Certified Fraud Examiners, Inc. All rights reserved.

© 2017 Association of Certified Fraud Examiners, Inc. All rights reserved.
Figure 8: Type of Victim Organization—Frequency and Median Loss
$0
$50000
$100000
$150000
$200000
$250000
$300000
$350000
Other*Not-for-Profit*Government*Public CompanyPrivate Company
0%
10%
20%
30%
40%
50%
60%
T Y P E O F V I C T I M O R G A N I Z AT I O N
ME
DIA
N L
OS
SP
ER
CE
NT
OF
CA
SE
S
Percent of CasesMedian Loss
$131,000
49.0%
37.8%
5.1% 3.1%
$300,000
5.1%
*Government, Other, and Not-for-Profit categories had insufficient responses for median loss calculation.

$0
$50,000
$100,000
$150,000
$200,000
$250,000
$300,000
$350,000
$400,000
10,000+1,000–9,999100–999<100
N U M B E R O F E M P L O Y E E S
ME
DIA
N L
OS
SP
ER
CE
NT
OF
CA
SE
S
Percent of CasesMedian Loss
$220,000
$250,000
42.1%
23.2%
20.0%
14.7%
0%
5%
10%
15%
20%
25%
30%
35%
40%
45%$377,000
$50,000
Figure 9: Size of Victim Organization—Frequency and Median Loss
© 2017 Association of Certified Fraud Examiners, Inc. All rights reserved.
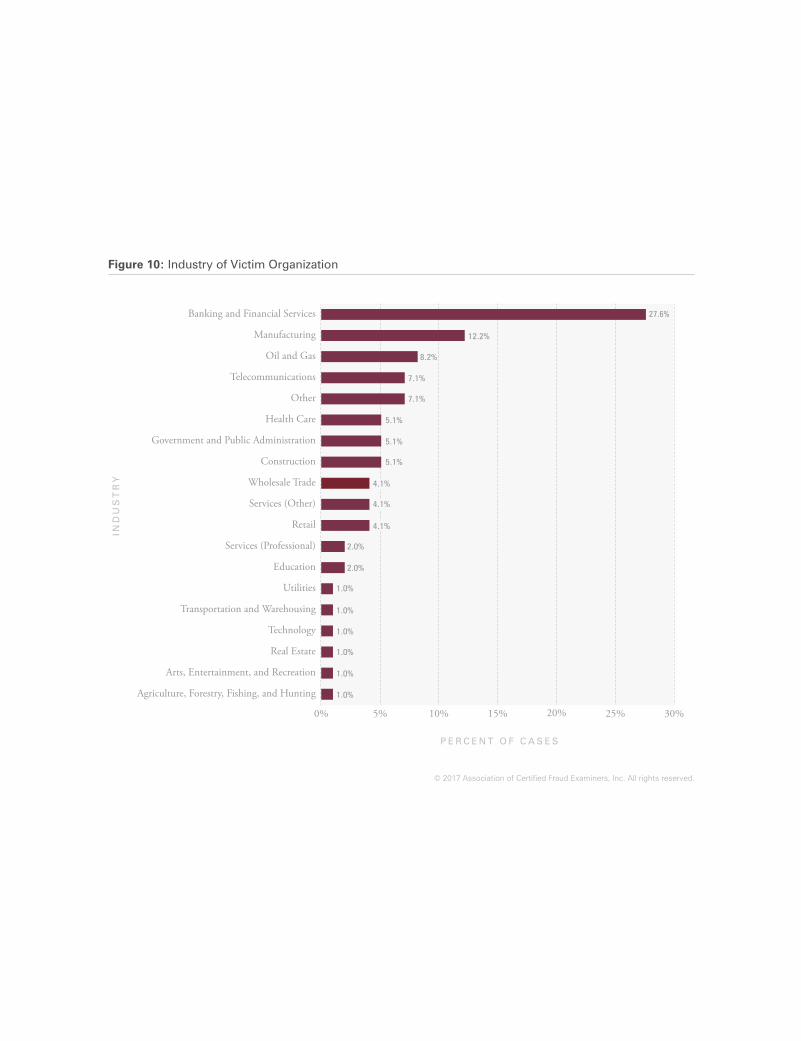
0% 5% 10% 15% 20% 25% 30%
Agriculture, Forestry, Fishing, and Hunting
Arts, Entertainment, and Recreation
Real Estate
Technology
Transportation and Warehousing
Utilities
Education
Services (Professional)
Retail
Services (Other)
Wholesale Trade
Construction
Government and Public Administration
Health Care
Other
Telecommunications
Oil and Gas
Manufacturing
Banking and Financial Services
IND
US
TR
Y
P E R C E N T O F C A S E S
27.6%
12.2%
8.2%
7.1%
5.1%
4.1%
4.1%
1.0%
2.0%
1.0%
1.0%
1.0%
1.0%
1.0%
2.0%
7.1%
5.1%
5.1%
4.1%
Figure 10: Industry of Victim Organization
© 2017 Association of Certified Fraud Examiners, Inc. All rights reserved.

0% 10% 20% 30% 40% 50% 60% 70% 80% 90% 100%
Rewards for Whistleblowers
Job Rotation/Mandatory Vacation
Employee Support Programs
Surprise Audits
Proactive Data Monitoring/Analysis
Formal Fraud Risk Assessments
Dedicated Fraud Department, Function, or Team
Fraud Training for Managers/Executives
Fraud Training for Employees
Anti-Fraud Policy
Hotline
External Audit of Internal Controls overFinancial Reporting
Management Review
Independent Audit Committee
Management Certification of Financial Statements
Internal Audit Department
External Audit of Financial Statements
Code of Conduct
AN
TI-
FR
AU
D C
ON
TR
OL
P E R C E N T O F C A S E S
90.9%
88.2%
82.8%
75.0%
70.3%
70.1%
69.4%
65.6%
61.4%
60.5%
56.8%
50.0%
45.3%
39.0%
35.3%
28.6%
17.6%
1.1%
Figure 11: Frequency of Anti-Fraud Controls
© 2017 Association of Certified Fraud Examiners, Inc. All rights reserved.

Control Percent of Cases Control in Place Control Not in Place Percent Reduction
Independent Audit Committee 70.3% $100,000 $1,100,000 90.9%
Management Certification of Financial Statements 75.0% $100,000 $925,000 89.2%
Hotline 65.6% $112,000 $850,000 86.8%
Dedicated Fraud Department, Function, or Team 50.0% $79,000 $500,000 84.2%
Management Review 70.1% $107,000 $675,000 84.1%
Fraud Training for Managers/Executives 56.8% $113,000 $700,000 83.9%
Fraud Training for Employees 60.5% $106,000 $550,000 80.7%
Surprise Audits 35.3% $60,000 $240,000 75.0%
Anti-Fraud Policy 61.4% $100,000 $375,000 73.3%
Job Rotation/Mandatory Vacation 17.6% $74,000 $275,000 73.1%
Employee Support Programs 28.6% $67,000 $215,000 68.8%
Proactive Data Monitoring/Analysis 39.0% $100,000 $270,000 63.0%
Formal Fraud Risk Assessments 45.3% $114,000 $300,000 62.0%
External Audit of Internal Controls over Financial Reporting 69.4% $132,000 $270,000 51.1%
Internal Audit Department 82.8% $141,000 $265,000 46.8%
External Audit of Financial Statements 88.2% $150,000 $150,000 0.0%
Code of Conduct 90.9% $150,000 *
Rewards for Whistleblowers 1.1% * $200,000
Figure 12: Median Loss Based on Presence of Anti-Fraud Controls
© 2017 Association of Certified Fraud Examiners, Inc. All rights reserved.
*Category had insufficient responses for median loss calculation.

Control Percent of Cases Control in Place Control Not in Place Percent Reduction
Surprise Audits 35.3% 13 months 20 months 35.0%
Employee Support Programs 28.6% 13 months 20 months 35.0%
Hotline 65.6% 17 months 26 months 34.6%
Internal Audit Department 82.8% 18 months 26 months 30.8%
Independent Audit Committee 70.3% 18 months 25 months 28.0%
External Audit of Internal Controls over Financial Reporting 69.4% 18 months 25 months 28.0%
Job Rotation/Mandatory Vacation 17.6% 17 months 23 months 26.1%
Management Certification of Financial Statements 75.0% 18 months 24 months 25.0%
Management Review 70.1% 18 months 24 months 25.0%
Dedicated Fraud Department, Function, or Team 50.0% 18 months 24 months 25.0%
Formal Fraud Risk Assessments 45.3% 18 months 24 months 25.0%
Proactive Data Monitoring/Analysis 39.0% 18 months 24 months 25.0%
Anti-Fraud Policy 61.4% 18 months 22 months 18.2%
Fraud Training for Employees 60.5% 20 months 24 months 16.7%
Fraud Training for Managers/Executives 56.8% 20 months 24 months 16.7%
External Audit of Financial Statements 88.2% 20 months 16 months -25.0%
Code of Conduct 90.9% 20 months *
Rewards for Whistleblowers 1.1% * 20 months
© 2017 Association of Certified Fraud Examiners, Inc. All rights reserved.
Figure 13: Median Duration of Fraud Based on Presence of Anti-Fraud Controls
*Category had insufficient responses for median duration calculation.

6.6% 2.9%
Lack of Internal Controls16.7%
Poor Tone at the Top16.7%
Other7.3%
Override of Existing Internal Controls33.3%
Lack of Competent Personnel in Oversight Roles2.1% Lack of Clear Lines of Authority
1.0%
Lack of Management Review15.6%
Lack of Independent Checks/Audits5.2%
Lack of Employee Fraud Education2.1%
© 2017 Association of Certified Fraud Examiners, Inc. All rights reserved.
Figure 14: Primary Internal Control Weakness Observed by CFE

Figure 15: Position of Perpetrator—Frequency and Median Loss
© 2017 Association of Certified Fraud Examiners, Inc. All rights reserved.
$0
$200,000
$400,000
$600,000
$800,000
$1,000,000
$1,200,000
Other*Owner/ExecutiveManagerEmployee0%
5%
10%
15%
20%
25%
30%
35%
40%
ME
DIA
N L
OS
SP
ER
CE
NT
OF
CA
SE
S
Percent of CasesMedian Loss
$50,000
$116,000
$1,000,00034.4%
37.8%
24.4%
3.3%
P O S I T I O N O F P E R P E T R AT O R
*Other category had insufficient responses for median loss calculation.

0% 5% 10% 15% 20% 25% 30%
Legal
Finance
Information Technology
Marketing/Public Relations
Manufacturing and Production
Board of Directors
Warehousing/Inventory
Accounting
Operations
Customer Service
Purchasing
Other
Executive/Upper Management
Sales
DE
PA
RT
ME
NT
OF
PE
RP
ET
RA
TO
R
P E R C E N T O F C A S E S
25.3%
18.7%
9.9%
8.8%
8.8%
6.6%
5.5%
5.5%
3.3%
2.2%
2.2%
1.1%
1.1%
1.1%
Figure 16: Department of Perpetrator—Frequency
© 2017 Association of Certified Fraud Examiners, Inc. All rights reserved.

Male 79.1%
Female20.9%
© 2017 Association of Certified Fraud Examiners, Inc. All rights reserved.
Figure 17: Gender of Perpetrator—Frequency

$0 $50,000 $100,000 $150,000 $200,000 $250,000 $300,000
Female
Male
GE
ND
ER
OF
PE
RP
ET
RA
TO
R
M E D I A N L O S S
$99,000
$245,000
© 2017 Association of Certified Fraud Examiners, Inc. All rights reserved.
Figure 18: Gender of Perpetrator—Median Loss
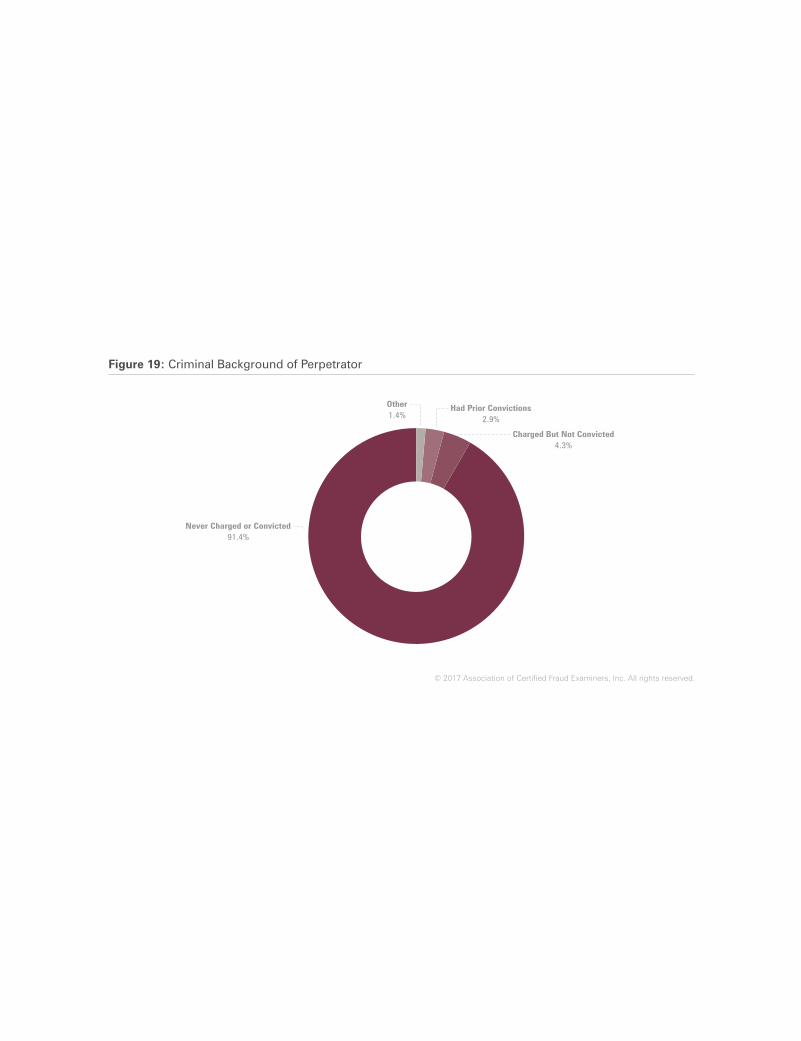
Never Charged or Convicted91.4%
Had Prior Convictions2.9%
Charged But Not Convicted4.3%
Other1.4%
Figure 19: Criminal Background of Perpetrator
© 2017 Association of Certified Fraud Examiners, Inc. All rights reserved.

6.6% 2.9%
Never Punished or Terminated89.1%
Previously Punished7.3%
Other3.6%
Previously Terminated1.8%
Figure 20: Employment Background of Perpetrator
© 2017 Association of Certified Fraud Examiners, Inc. All rights reserved.

0% 10% 20% 30% 40% 50% 60% 70% 80% 90% 100%
Civil Suit
Referral toLaw Enforcement
LE
GA
L A
CT
ION
TA
KE
N
P E R C E N T O F C A S E S
79.3%
No
Yes
48.8% 51.2%
20.7%
Figure 21: Cases Resulting in Referral to Law Enforcement or Civil Suit
© 2017 Association of Certified Fraud Examiners, Inc. All rights reserved.

0% 10% 20% 30% 40% 50% 60% 70%
100%
76–99%
51–75%
26–50%
1–25%
No Recovery
PE
RC
EN
T O
F L
OS
S R
EC
OV
ER
ED
P E R C E N T O F C A S E S
58.2%
11.9%
10.4%
1.5%
6.0%
11.9%
Figure 22: Recovery of Victim Organization’s Losses
© 2017 Association of Certified Fraud Examiners, Inc. All rights reserved.

0% 10% 20% 30% 40% 50% 60% 70%
No Punishment
Perpetrator Was No LongerWith Organization
Other
Probation or Suspension
Settlement Agreement
Permitted or Required Resignation
Termination
AC
TIO
N T
AK
EN
AG
AIN
ST
PE
RP
ET
RA
TO
R
P E R C E N T O F C A S E S
5.7%
6.8%
13.6%
12.5%
9.1%
60.2%
14.8%
Figure 23: Action Taken Against Perpetrator
© 2017 Association of Certified Fraud Examiners, Inc. All rights reserved.