figaro flexible and precise irrigation platform to … · • automatización general de una red de...
TRANSCRIPT

1
Saving water and energy in pressurized irrigation networks under FIGARO platform. The Picassent pilot site for citrus
International FIGARO Conference, 19 September 2016, Brussels, Belgium
Fernando MartinezTechnical University of Valencia
FIGARO FLEXIBLE AND PRECISE IRRIGATION PLATFORM TO IMPROVE FARM-SCALE WATER PRODUCTIVITY
III Jornada sobre Gestión Eficiente del Agua de Riego 2
Outline
• The Technical Irrigation Management
• Use and Optimization of Water, Energy and Fertilizers
• The Picassent case study
• Integrating the optimiser in FIGARO platform

III Jornada sobre Gestión Eficiente del Agua de Riego 3
THE TECHNICAL IRRIGATION MANAGEMENT

• Hydraulic management (network level)How to provide precisely the water needs for each plot by considering :
• Agronomic management (plot level)
Technical Irrigation Management
• Soil texture• Type of crop• Phenological status• Weather forecasting• Soil moisture• Plant stress …
• Water needs per day• Irrigation strategy• Fertilizer dosing
Available water at sources in quantity, quality and production costs
Network constraints: Pumping stations, reservoirs and network capacity
The irrigation management: on demand, by shifts, by request, automation level,..
Minimizing energy, costs and fertilizers, while keeping quality standards

5
Crop WaterRequirements
General optimization scheme
Irrigation scheduling
Fertigationturns
ENERGY
SAVINGS
WATER
SAVINGS
FERTILISER
SAVINGS
Adjust waterneeds
Improve EnergEfficiency
Adjuste Irriga-tion times
Reducing
GHG emission
Reserve waterfor other uses
Lessenvironmentaldegradation
Energydemansmoothing
ChooseElectricitytariffs
Adjustefertiliserneeds
COST
SAVINGS
COST SAVINGS

USE AND OPTIMIZATION OF WATER, ENERGY AND FERTILIZERS
III Jornada sobre Gestión Eficiente del Agua de Riego 6
General issues
III Jornada sobre Gestión Eficiente del Agua de Riego 7
• The irrigation technology• The irrigation management• The conception of the irrigation network• The scheme and operation of the Pumping Station• The electrical tariffs• The fertigation system• The hydraulic simulation• The optimisation procedures
Any algorithm intended to optimise the use of water, energy and fertilisers must take into account for:

The irrigation technology and management
III Jornada sobre Gestión Eficiente del Agua de Riego 8

The irrigation technologies
III Jornada sobre Gestión Eficiente del Agua de Riego 9
– Sprinkler irrigation Irrigation shfits are spaced 1 or 2
weeks The Irrigation efficiency is lower due
irregular distribution, evaporation, wind dispersion...
The pressure at hydrant raise to 40 m
Drip irrigation Highly frequency (daily or less) Greater efficiency because water is
applied directly to the root zone Pressures required at dripper are
lower (10 – 15 m)
III Jornada sobre Gestión Eficiente del Agua de Riego 10
– On demand irrigation
• Free demand
• Restricted on demand
– Irrigation by shifts
• Programmed shifts
• Flexible shifts
• Optmised shifts
– Operated by valves
• According the user requests
• According water needs estimation
The irrigation management

The conception of the irrigation network
III Jornada sobre Gestión Eficiente del Agua de Riego 16

17
Sistemas de suministro del agua de riego
Existen diversas tipologías de redes de riego a fin de proporcionar la presión requerida en los hidrantes
• Suministro por gravedad desde un embalse situado a cota suficiente y alimentado por una canal de transporte
• Red de captación y elevación a embalses de regulación, independiente de la red de riego.
• Red de captación y elevación a embalses de regulación, formando parte de la red de distribución de riego.
• Inyección directa mediante grupos de elevación desde depósito a red de distribución.
• Red de riego con múltiples puntos de captación y varias obras de regulación interconectadas en la red de riego.

18
Different water supply schemes
Captación y embalse en cabecera
Captación y embalse formando parte de la red
Bombeo con inyección directa
Sistema mixto con varios bombeos y depósitos

19
Automation levels
• Automatización individual del riego en parcela, normalmente con un programador y un conjunto de válvulas hidráulicas o electroválvulas.
• Automatización general de una red de riego y su gestión, habitualmente realizado con un ordenador central y una red en anillo de unidades de campo que controlan cada uno de los hidrantes, tomas o unidades de control remoto.
• Regulación y control de la estación de bombeo para adaptar la demanda de caudal y presión a las necesidades de la red con el fin de reducir el coste energético.
• Automatización integral del sistema para programar los riegos, la fertirrigación, la limpieza de cabezales, etc.

The scheme and operation of the Pumping Station
III Jornada sobre Gestión Eficiente del Agua de Riego 20
Variables de operación en una E. Bombeo
III Jornada sobre Gestión Eficiente del Agua de Riego 21
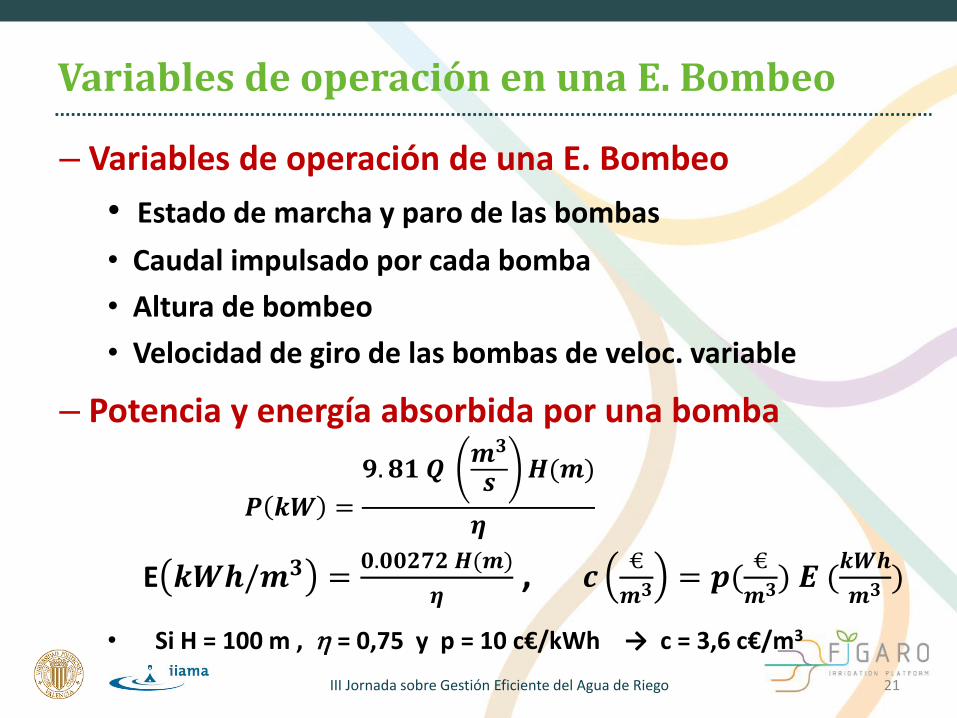
– Variables de operación de una E. Bombeo
• Estado de marcha y paro de las bombas
• Caudal impulsado por cada bomba
• Altura de bombeo
• Velocidad de giro de las bombas de veloc. variable
– Potencia y energía absorbida por una bomba
𝑷 𝒌𝑾 =
𝟗. 𝟖𝟏 𝑸𝒎𝟑
𝒔𝑯(𝒎)
𝜼
E 𝒌𝑾𝒉/𝒎𝟑 =𝟎.𝟎𝟎𝟐𝟕𝟐 𝑯(𝒎)
𝜼, 𝒄
€
𝒎𝟑= 𝒑(
€
𝒎𝟑) 𝑬 (𝒌𝑾𝒉
𝒎𝟑)
• Si H = 100 m , h = 0,75 y p = 10 c€/kWh → c = 3,6 c€/m3

Variables de operación en una E. Bombeo
III Jornada sobre Gestión Eficiente del Agua de Riego 22
– Variables consignables con BVF
• Número de bombas en operación
– Variables consignables con BVV
• Número y tipo bombas en operación
• Velocidad de giro de las BVV
• Altura de impulsión

Variables consignables en una E. Bombeo
III Jornada sobre Gestión Eficiente del Agua de Riego 23
– Modo de operación real de las E.B.
• En la práctica las E.B. van provistas de un sistema de control propio que arranca o para las bombas por consignas
• Usualmente trabajan con consignas de presión y de velocidad mínima para las BVV
– Variables consignables en la práctica
• El caudal horario demandado
o Depende de la organización de los turnos o de las horas de apertura y cierre de las válvulas
• La altura de bombeo (no siempre)

The electrical tariffs
III Jornada sobre Gestión Eficiente del Agua de Riego 24

25
Determinación de la secuencia de riego de los distintos sectores
– Estructura tarifaria para potencias medias medias y bajas (BT)
Valle (descuento 43%) Llano Punta (recargo 100%)
Optimización económica de la jornada de riego

26
– Estructura tarifaria en el marco de la nueva ley del mercado eléctrico para P > 450 kW –A T (tarifas decrecientes de P1 a P6)
Optimización económica de la jornada de riego

27
– Coste del kWh en el mercado eléctrico en tiempo real para el 30-6-2016 (Red Eléctrica)
Optimización económica de la jornada de riego

28
– Coste del kWh en el mercado eléctrico para la semana 24/30 junio 2016 (Red Eléctrica)
Optimización económica de la jornada de riego

The fertigation system
III Jornada sobre Gestión Eficiente del Agua de Riego 29

30
‒ Fertirrigación a nivel de parcela• El agricultor dispone de sus propios equipos de fertilización
• Usualmente fuerza el riego durante el periodo de fertilización
‒ Fertirrigación por turnos• En determinados turnos de riego se inyecta un fertilizante en
cabecera de red
• El fertilizante tardará un tiempo para llegar a los puntos de aplicación, viajando a través de la red
• Por contra, el agua con fertilizante puede permanecer un tiempo en la red tras finalizar el turno de fertirrigación
‒ Fertirrigación en continuo• Toda el agua suministrada a la red va dosificada con fertilizante en
pequeñas dosis
• La fertilización se suprime en determinadas épocas del año
Sistemas de fertirrigación
31
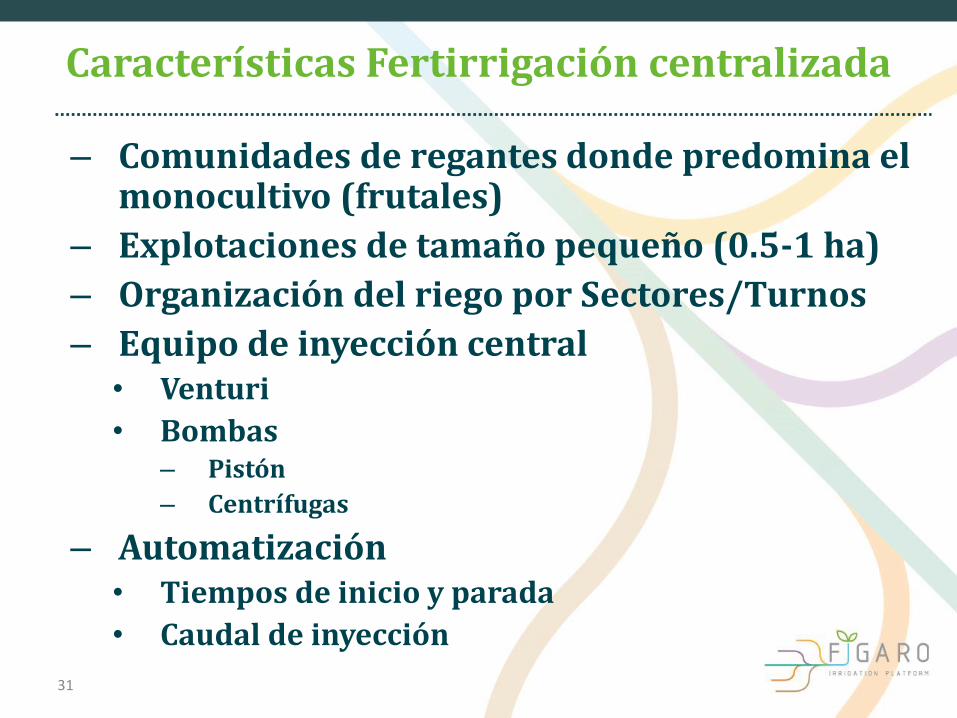
– Comunidades de regantes donde predomina el monocultivo (frutales)
– Explotaciones de tamaño pequeño (0.5-1 ha)
– Organización del riego por Sectores/Turnos
– Equipo de inyección central • Venturi
• Bombas– Pistón
– Centrífugas
– Automatización• Tiempos de inicio y parada
• Caudal de inyección
Características Fertirrigación centralizada

32
‒ Necesidades UF de las parcelas
• Diferentes necesidades según especie, tamaño, época del año, análisis foliares
– Determinación de los fertilizantes a utilizar
• Composición óptima según la época del año
– Número y frecuencia de riegos con fertirrigación
• Concentr. Max Fert : 0,5 gr/l agua de riego (Producción Integrada)
– Tiempo de Fertirrigación
• Tiempo de llegada desde el cabezal a las TomasTiempo de Riego < > Tiempo de Fertirrigación Real
Gestión de la fertirrigación
33
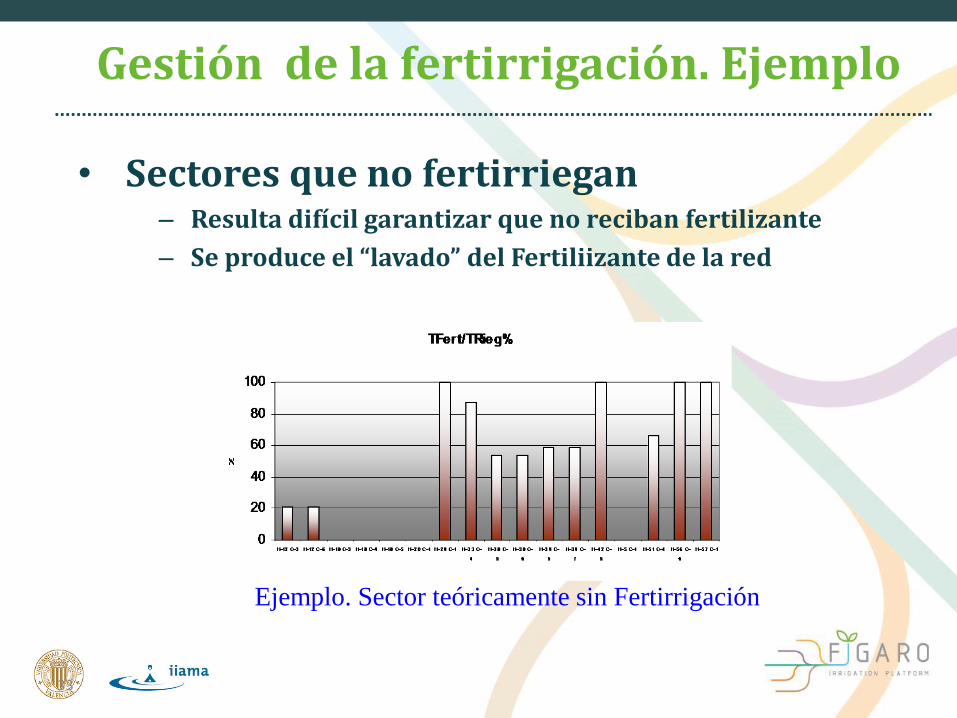
• Sectores que no fertirriegan– Resulta difícil garantizar que no reciban fertilizante
– Se produce el “lavado” del Fertiliizante de la red
Ejemplo. Sector teóricamente sin Fertirrigación
Gestión de la fertirrigación. Ejemplo
The hydraulic simulation
III Jornada sobre Gestión Eficiente del Agua de Riego 34

35
– El proceso de optimización conlleva realizar múltiples simulaciones de la respuesta de la red ante las estrategias de operación
– Aunque las redes sean aparentemetneramificadas, la presencia de varias fuentes de suministro las convierte en malladas
– Demandas fijas o dependientes de la presión
– Nivel hidrante, toma, aspersor o gotero
– Leyes de control
– Condiciones inyección fertilizantes
La Simulación Hidráulica

36
– Consumo de los grupos de bombeo
– Comportamiento de la red (presiones máximas y mínimas,
caudales y velocidades en tuberías…)
– Distribución del fertilizante en red
Simulación hidráulica escenarios de riego
Calibración
Modelo hidráulico
EPANET

Ejemplo. Simulación avance de un fertilizante
376:00

386:30
Ejemplo. Simulación avance de un fertilizante

397:30
Ejemplo. Simulación avance de un fertilizante

409:30
Ejemplo. Simulación avance de un fertilizante

4113:30
Ejemplo. Simulación avance de un fertilizante

4215:30
Ejemplo. Simulación avance de un fertilizante

4316:30
Ejemplo. Simulación avance de un fertilizante

4418:00
Ejemplo. Simulación avance de un fertilizante

45
DUFavg= 86.67%
DUFStd= 24.21%.
TFert/TRieg%
0
20
40
60
80
100
H- 12
C- 1
H- 12
C- 2
H- 12
C- 5
H- 16
C- 1
H- 16
C- 4
H- 17
C- 2
H- 17
C- 3
H- 17
C- 4
H- 17
C- 7
H-
2 8
C- 2
H- 3
C- 1
H- 3
C- 2
H- 3
C- 3
H- 3
C- 4
H- 3
C- 5
H- 3
C- 7
H-
3 0
C- 2
H-
3 6
C- 2
H-
3 6
C- 4
H-
3 6
C- 5
H-
3 6
C- 6
H- 4
C- 1
H- 4
C- 2
H- 4
C- 3
H-
4 2
C- 2
H-
4 2
C- 3
H-
4 2
C- 4
H-
4 2
C- 6
H-
4 2
C- 8
H-
4 2
C- 9
H-
5 6
C- 10
H-
5 6
C- 3
H-
5 6
C- 5
H-
5 6
C- 7
H-
5 6
C- 8
H-
5 6
C- 9
H-
Noe
C- 1
H-
Noe
C- 2
H-
Noe
C- 3
H-
Noe
C- 4
%
Sector S1
Ejemplo. Simulación avance de un fertilizante

46
DUFavg= 86.67%
DUFStd= 24.21%.
%TFert/TRieg
0
20
40
60
80
100
H-12 C-3 H-12 C-6 H-18 C-3 H-18 C-4 H-18 C-5 H-20 C-1 H-29 C-1 H-33 C-4 H-38 C-5 H-38 C-6 H-39 C-5 H-39 C-7 H-42 C-5 H-5 C-1 H-51 C-4 H-56 C-6 H-57 C-1
%
Sector S6
Arviza, J.; Martínez, F.; Jiménez. M.A.; Balbastre, I.(2015). Integración de la gestión de la fertirrigación colectiva de
una comunidad de regantes en un entorno SIG. Actas del IIII Congreso de Agro-ingeniería 2005, Resumen pp 73-74.
ISBN 84-9773-208-1
Ejemplo. Simulación avance de un fertilizante

47
Posibilidades de mejora
– Rotar los sectores de riego. De este modo todos los sectores son igualmente perjudicados óbeneficiados
– Instalar válvulas sectorizadoras para aislar las parcelas sin fertirrigación (cultivos ecológicos)
– Compensar los déficits de suministro a dichas parcelas durante los turnos sin fertirrigación
Ejemplo. Simulación avance de un fertilizante

The Optimization procedures
III Jornada sobre Gestión Eficiente del Agua de Riego 48

Sectoring optimization with 2 VSP by GA
Jiménez, M.A., Martínez, F., Bou, V., Bartolín, H (2010) Methodology for grouping intakes of pressurised irrigation
networks into sectors to minimise energy consumption. Biosystems engineering. Vol 105, Issue 4, pg 429-438.
Irrigation network sectoring by Genetic Algorithms (GA)
Beforeappyling GA sectoring
Afterappyling GA sectoring
This methodology was designed for stricted turns
No water performance is improved
50

Optimization of valve operation by GA
First improvement: Irrigation run times are adjusted to the required time
BEFOREAFTER
All intakes grouped in a turn are operated on the same time
Each intake can operate at different starting time and run for the required time

First improvement: Irrigation run times are adjusted to the required time
Number of intakes
• Cromosome:
Time slot to start operating (1 to n)
• Irrigation time is divided in n slots. Ej. every 5 min in 10 h n = 120
• Goal function: 𝐸𝑑𝑎𝑦(𝐾𝑤ℎ) =
𝑖 𝑠𝑙𝑜𝑡𝑠
𝑗 𝑝𝑢𝑚𝑝𝑠
9,81 𝑄𝑖𝑗𝑚3
𝑠𝐻𝑖𝑗 𝑚 ∆𝑡(ℎ)
𝜂𝑖𝑗= Min
𝑄𝑖 =
𝑗 𝑝𝑢𝑚𝑝𝑠
𝑄𝑖𝑗 = 𝑘 𝑖𝑛𝑡𝑎𝑘𝑒𝑠𝑎𝑡 𝑠𝑙𝑜𝑡 𝑖
𝑞𝑖𝑘s.t. for each slot i
Jiménez Bello, M.A., Royuela, A., Manzano, J., García Prats, A.,Martínez- Alzamora, F. (2015) Methodology to
improve water and energy use by proper irrigation schedulin in pressurized networks. Agricultural Water
Management 149 (2015) 91-101. Feb 2015
Optimization of valve operation by GA

pmin
head loss
Pumping
Gravity
Terrain elevation
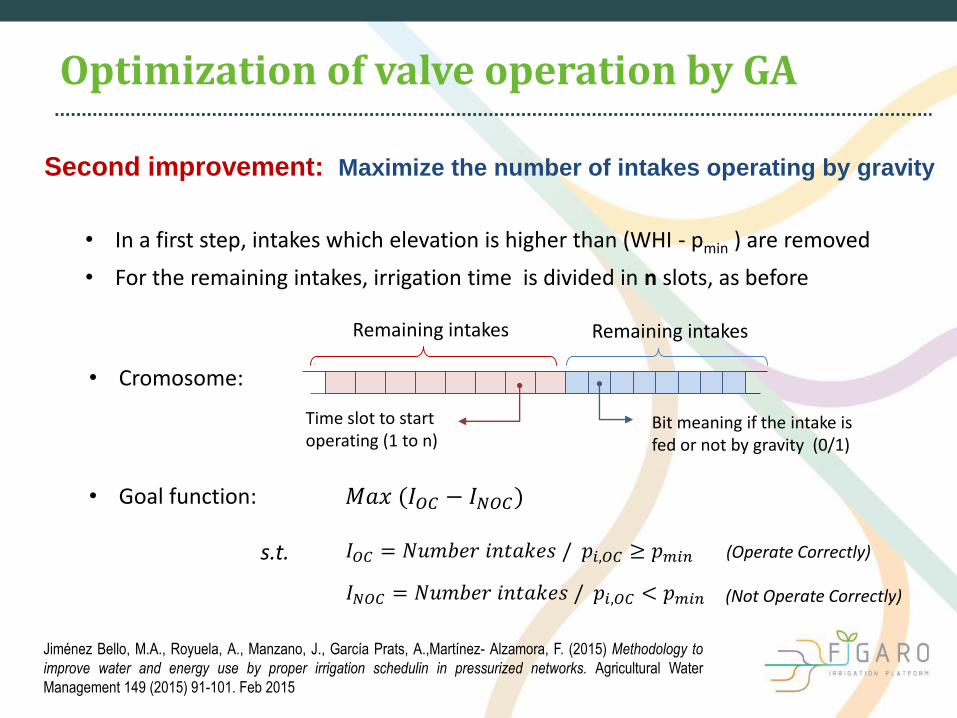
Second improvement: Maximize the number of intakes operating by gravity
Optimization of valve operation by GA
Jiménez Bello, M.A., Royuela, A., Manzano, J., García Prats, A.,Martínez- Alzamora, F. (2015) Methodology to
improve water and energy use by proper irrigation schedulin in pressurized networks. Agricultural Water
Management 149 (2015) 91-101. Feb 2015
• Cromosome:
• For the remaining intakes, irrigation time is divided in n slots, as before
• Goal function:
𝐼𝑂𝐶 = 𝑁𝑢𝑚𝑏𝑒𝑟 𝑖𝑛𝑡𝑎𝑘𝑒𝑠 / 𝑝𝑖,𝑂𝐶 ≥ 𝑝𝑚𝑖𝑛s.t.
𝐼𝑁𝑂𝐶 = 𝑁𝑢𝑚𝑏𝑒𝑟 𝑖𝑛𝑡𝑎𝑘𝑒𝑠 / 𝑝𝑖,𝑂𝐶 < 𝑝𝑚𝑖𝑛
𝑀𝑎𝑥 (𝐼𝑂𝐶 − 𝐼𝑁𝑂𝐶)
(Operate Correctly)
(Not Operate Correctly)
Remaining intakes
Bit meaning if the intake is fed or not by gravity (0/1)
Time slot to start operating (1 to n)
Remaining intakes
• In a first step, intakes which elevation is higher than (WHI - pmin ) are removed
Second improvement: Maximize the number of intakes operating by gravity
Optimization of valve operation by GA

CASE STUDY
III Jornada sobre Gestión Eficiente del Agua de Riego 56

Case study
Picassent Sector XI (Valencia, Spain)
• Irrigated area: 180 ha
• Average plot size: 3276 m3
• Crops: Fruit trees (95% citrus)
• 62 multi-outlet hydrants
• 342 irrigation intakes
• Central fertigation
• Automation at intake level
• Irrigation scheduling under request

Analysis of results
1. The model error of the predicted energy consumption was 2%
(0.138 kWh m-3 vs 0.134 kWh m-3)
2. 3 scenarios were simulated with different minimun pressure
required at hydrant
3. The maximun number of intakes that could operate without extra
energy were determined
4. The remaining intakes were operated by pumping for the minimum
energy consumption
EscPmin_Hid
(MPa)
WHI
(MPa)INOC
Vpump
(m3)
Vgrav
(m3)EDI(%)
CEVTp
(kWh m-3)
CEVTT
(kWh m-3)
1 (2012) - 0.319 36 4224 1676 71.6 0.134 0.096
2 0.20 0.245 - 2604 3296 44.1 0.109 0.048
3 0.22 0.275 - 3428 2472 58.1 0.123 0.072
4 0.25 0.295 - 3559 2341 60.3 0.129 0.078
50 % saving 18.4 % saving

Analysis of results
Year 2015
Volgrav = 1676 m3
EDI (%) = 71.6 %
CEVTp= 0.134 kWh m-3
CEVTT= 0.096 kWh m-3
PminHid= 0.25 MPa
Volgrav = 2341 m3
EDI (%) = 60.3 %
CEVTp= 0.129 kWh m-3
CEVTT= 0.078 kWh m-3
PminHid= 0.20 MPa
Volgrav = 3296 m3
EDI (%) = 44.1 %
CEVTp= 0.109 kWh m-3
CEVTT= 0.048 kWh m-3
Gravity Pumped

Analysis of results
b) Scenario 4 with Pmin_Hid = 0.25 Mpa
Total demanded flow (Q, ls-1), consumed energy per total volume of pumped irrigation water (CEVTp, kWh m-3) and pump efficiencies of the variable speed pump (η1 VSP) and the two Fixed Speed Pumps (η2 FSP and η3 FSP) Parameters were calculated every 5 minutes
a) Scenario 2012
CEVTp CEVTp
Q (
l/s)
Q (
l/s)
Pu
mp
eff
icie
nci
es
Pu
mp
eff
icie
nci
esCEVTp CEVTp

INTEGRATING THE OPTIMISER
IN FIGARO PLATFORM
III Jornada sobre Gestión Eficiente del Agua de Riego 61

Flexible and precIse irriGation plAtform to improve faRm
scale water prOductivitySlide62
The hydraulic network is declared trough the INP file
The INP file is build using external tools (EPANET, GISRed)
The structure of hydrants, optimization options, and other constrains are provided in a .xml file (or a .txt file)
This file is produced using and external tool like GISRed
The electricity tariffs, in an hourly basis, is given as a .txt file
Or is produced from a general tariff schedule
The water needs for all irrigated plot served by the network must be provided the next day, using also external tools
Integrating the optimizer in FIGARO platform
Input Data
Flexible and precIse irriGation plAtform to improve faRm
scale water prOductivitySlide63
The optimizer provides the opening and closing time of each valve to minimize the total energy consumption or total cost
The result is a text file with two data for each valve, the opening and closing time (or a time series for each valve giving the valve status at each time)
As a time series, optimum valve scheduling can be easily integrated in uManage
Integrating the optimizer in FIGARO platform
Results

Strategie to asses on energy savings
Flexible and precIse irriGation plAtform to improve faRm
scale water prOductivitySlide64
Read daily supplied volume by the pumping station
Compare with the total registered volume at all intakes
Correct registered volume at intakes to match with that supplied
Register the pump real scheduling and total energy consumption
Calibrate the pump curves if necessary
Optimize the pump scheduling for the past day, by providing the same volume to each plot
Repeat the pump optimization for the past day with the estimated water required per each plot
Procedures

Flexible and precIse irriGation plAtform to improve faRm
scale water prOductivitySlide65
Compare and evaluate for the past day
Real pump scheduling vs optimal scheduling for the same daily volume delivered
Real pump scheduling vs optimal scheduling for the estimated required volume at each plot
Hourly real energy consumption vs hourly energy consumption for both optimization (real volumes & required volumes)
Hourly real energy costs vs hourly energy costs for both optimization, according to the electricity tariffs
Accumulate the daily saving the build a monthly or annual report
Strategie to asses on energy savings
Reports

• Una metodología previamente desarrollada por los autores para
minimizar el consumo de energía agrupando las tomas por turnos ha
sido mejorada permitiendo que cada toma opere el tiempo requerido
– De esta forma, se pueden ajustar con precision las necesidades de
riego, ahorrando agua y energía
• En sistemas donde la balsa tiene cota suficiente para alimentar
algunas tomas sin bombeo, una extension del método anterior ha
permitido maximizar el número de tomas alimentadas por gravedad
– Gracias a ello se obtienen ahorros de energía adicionales
• El método anterior ha sido aplicado a un caso de estudio habiendo
obtenido un ahorro realista de energía del 18.4 %
– Ello se debió funamentalmente al incremento del número de tomas
regadas por gravedad
• Sin embargo, si la presión minima requerida en el hidrante se
redujera un 20 %, se podrian haber obtenido ahorros hasta del 49 %
para el caso de estudio.
Conclusions (to review)

Thank you for your attention
III Jornada sobre Gestión Eficiente del Agua de Riego 67