fig ism shift nok - arxiv · of the w.m. keck foundation. ... .5. the resultant ... were...
TRANSCRIPT

arX
iv:0
812.
4213
v2 [
astr
o-ph
] 3
Apr
200
9Accepted to ApJS: February 12, 2009Preprint typeset using LATEX style emulateapj v. 04/20/08
KECK/HIRES SPECTROSCOPY OF V838 MONOCEROTIS IN OCTOBER 2005*
T. Kaminski1, M. Schmidt1, R. Tylenda1, M. Konacki1,2, and M. Gromadzki1
Accepted to ApJS: February 12, 2009
ABSTRACT
V838 Mon erupted at the beginning of 2002 becoming an extremely luminous star with L ≃ 106 L⊙.Among various scenarios proposed to explain the nature of the outburst the most promising is astellar merger event. In this paper we investigate the observational properties of the star and itssurroundings in the post outburst phase. We have obtained a high resolution optical spectrum ofV838 Mon in October 2005 using the Keck I telescope. We have identified numerous atomic featuresand molecular bands present in the spectrum and provided an atlas of those features. In order toimprove the spectrum interpretation we have performed simple modeling of the molecular bands.Our analysis indicates that the spectrum is dominated by molecular absorption features arising inphotospheric regions with temperatures of ∼2400 K and in colder outer layers, where the temperaturedecreases to ∼500 K. A number of resonance lines of neutral alkali metals are observed to show P-Cygprofiles. Particularly interesting are numerous prominent emission lines of [Fe II]. All of them showpractically the same profile, which can be well described by a Lorentzian profile. In the blue part ofthe spectrum photospheric signatures of the B-type companion are easily seen. We have fitted theobserved spectrum with a synthetic one and the obtained parameters are consistent with the B3Vtype. We have also estimated radial and rotational velocities of the companion.Subject headings: binaries: spectroscopic — stars: emission-line — stars: individual (V838 Mon) —
stars: mass loss — stars: winds, outflows — stars: variables: other
1. INTRODUCTION
The eruption of V838 Mon was discovered in the be-ginning of January 2002. Initially thought to be a nova,the object appeared unusual and enigmatic in its nature.The eruption, as observed in the optical, lasted aboutthree months (Munari et al. 2002b; Kimeswenger et al.2002; Crause et al. 2003). After developing an A-F su-pergiant spectrum at the maximum at the beginning ofFebruary 2002, the object evolved to lower effective tem-peratures and in April 2002 it practically disappearedfrom the optical, remaining very bright in the infrared.At the same time a B3V companion to the erupted objectwas discovered in the optical (Munari et al. 2002a). Adetailed analysis of the evolution of the object in the out-burst and decline can be found, e.g. in Tylenda (2005).Several mechanisms have been proposed to explain
the eruption of V838 Mon, including an unusual nova(Iben & Tutukov 1992), a late He-shell flash (Lawlor2005), and a stellar merger (Soker & Tylenda 2003).They have critically been discussed in Tylenda & Soker(2006). These authors conclude that the only mechanismthat can satisfactorily account for the observational datais a collision and merger of a low-mass pre-main-sequencestar with a ∼ 8M⊙ main-sequence star.In October/November 2006 the B3V companion sig-
Electronic address: [email protected]* The data presented herein were obtained at the W.M. Keck
Observatory, which is operated as a scientific partnership amongthe California Institute of Technology, the University of Californiaand the National Aeronautics and Space Administration. TheObservatory was made possible by the generous financial supportof the W.M. Keck Foundation.
1 Department of Astrophysics, Nicolaus Copernicus Astronomi-cal Center, Rabianska 8, 87-100 Torun, Poland
2 Astronomical Observatory, A. Mickiewicz University,S loneczna 36, 60-286 Poznan, Poland
nificantly faded and a strong Hα emission appearedin the spectrum of V838 Mon (Goranskij 2006; Bond2006). Late in 2004 an emission-line spectrum, com-posed mainly of [Fe II] lines, started to develop(Barsukova et al. 2006), reaching its maximum aroundthe 2006 eclipse-like event (Munari et al. 2007).In the present paper we present and discuss a high res-
olution spectrum of V838 Mon acquired with the Keck Itelescope in October 2005. At that time the [Fe II]emission-line spectrum was already well developed andthe object was a year before the eclipse of the B3V com-panion.
2. OBSERVATIONS AND DATA REDUCTION
A high resolution spectrum of V838 Mon was obtainedon 2005 October 13 UT with the High Resolution EchelleSpectrometer (HIRES, Vogt et al. 1994) attached to theKeck I telescope. We used the C4 decker, which pro-vides a slit with dimensions 1.′′148 × 3.′′5. The resultantresolving power was of R ≃ 34 000. The HIRES instru-ment makes use of a 3-chip mosaic as a detector. Weobtained two exposures of the object with a total timeof 960 s.Data reduction was performed with the IRAF4 stan-
dard procedures (Massey 1997). Data were debiased andflat-fielded using the ccdproc task. Cosmic ray eventswere removed from the CCD frames with a method de-scribed in van Dokkum (2001). After a careful checkof the removal we are confident that the procedure didnot introduce any spurious effects to the spectra. Or-der tracing and extraction were done using the tasks in
4 IRAF is distributed by the National Optical Astronomy Ob-servatories, which are operated by the Association of Universitiesfor Research in Astronomy, Inc., under cooperative agreement withthe National Science Foundation.

2 Kaminski et al.
the echelle package. The orders corresponding to thebluest part of the spectra were underexposed and wewere not able to extract them, even with a pinhole traceas a reference. The wavelength calibration was basedon ThAr lamp observations and it is accurate to within0.003 A. The two extracted echelle spectra were aver-aged giving a spectrum with a total wavelength coverage3720 − 7962 A. In the range there are, however, numer-ous gaps caused by the inter-chip spaces on the mosaicand the orders that do not overlap.Using an extracted pinhole frame we corrected all the
orders of the echelle spectrum for a blaze effect. Inspec-tion of the overlapping and blaze-corrected orders re-vealed that, although correctly flattened, they were sys-tematically tilted in such a way that the long-wavelengthend of an order was always higher on a relative intensityscale than the short-wavelength end of the neighboringorder. The discrepancy was of 15% of the average in-tensity of the order. We reduced the tilt by multiplyingeach order by a linear function (i.e. with 1 in the middleof an order range, and 1 ± 0.075 at the edges). All theoverlapping orders were then safely merged and, subse-quently, we got a spectrum composed of three parts: (i)completely covered wavelength range over 3720− 4883 A,(ii) wide range over 4951 − 6469 A with two narrow gapsat 6308.5 − 6310 A and 6401 − 6424.5 A, and (iii) a partof the spectrum over the range 6544 − 7962 A with 10non-overlapping orders. The three pieces we call here-after parts blue, green and red, respectively.Since no spectrophotometric standard stars were ob-
served during our observing run at Keck I, we decidedto flux calibrate the HIRES spectrum on a base of themethod described in Suzuki et al. (2001), namely by us-ing a flux calibrated spectrum of V838 Mon obtainedelsewhere with a lower spectral resolution. Such a lowresolution spectrum was acquired on 2005 November 22with the Grating Spectrograph with SITe mounted at the1.9 m Radcliffe telescope at the South African Astronom-ical Observatory (SAAO). We made use of a grating #7with 300 lines mm−1, and a slit with a projected width1.′′5. The last figure was comparable to seeing conditionsduring the observation (∼1.′′4). The total duration of theexposure was 1000 s. Three spectrophotometric standardstars, i.e. LTT9239, EG21, and LTT3218, were observedduring the night. This allowed us to calibrate the low res-olution spectrum in absolute flux units, while the wave-length calibration was performed with ThAr referencelamp spectra. All the data reduction and calibrationswere carried out with standard IRAF procedures. Theextracted and flux calibrated spectrum covers the range3817 − 7235 A with a resolving power of R ≃ 1 000.The flux calibration of the HIRES spectrum was per-
formed as follows. The high and low resolution spectrawere corrected to the heliocentric rest frame and theywere cross-correlated in order to find a relative shift be-tween them in the wavelength domain. We found a shiftof 5.5 A (note that the value is close to the spectral reso-lution in the SAAO observations), which was eliminatedby displacing the low resolution spectrum. Next, theHIRES spectrum was smoothed to the resolution of theobservations at SAAO and the spectra were divided oneby the other. Rather than to calibrate each single order
of the echelle spectrum, as it was done in Suzuki et al.(2001), we decided to calibrate separately only the threementioned above parts of the merged spectrum. To eachof the pieces a low order polynomial was fitted giving aconversion ratio (CR, cf. Suzuki et al. 2001). Since theSAAO spectrum has a narrower wavelength range thanthe high resolution one, we extrapolated the CRs to thefull ranges of the blue and red parts. Finally, the HIRESspectrum was put on the absolute flux scale by dividingits parts by the appropriate CRs. We note that the fluxcalibration of our final spectrum is uncertain, particu-larly in the ranges not covered by the SAAO observationsand in the regions where strong atmospheric molecularbands are present (the object was observed at unequalair masses in the different facilities).Although the low resolution spectrum was obtained
about six weeks after the HIRES observations, we arequite confident that the spectrum of V838 Mon did notchange significantly during this period in the observedspectral range. A comparison of the spectra smoothedto the same resolution shows that there are no signifi-cant discrepancies which would affect the flux calibra-tion. Moreover, from the photometric behavior of theobject, illustrated e.g. on the V. Goranskij’s web page5,one can see that the assumption of a constant flux in Band V bands during the period is justified.The flux calibrated spectrum was then corrected for
the interstellar reddening using the IRAF’s task dereddenwith EB−V = 0.90 (Tylenda 2005) and with a standardratio of total to selective extinction RV = 3.1.
3. THE SPECTRUM
The flux-calibrated and dereddened spectrum ofV838 Mon is presented in Figs. 1–3. For a comparison asynthetic spectrum of a B-type star (see Sect. 6) is over-ploted with the blue line. Most of identified atomic andmolecular features are indicated in the figures. Wave-lengths are given in the heliocentric rest frame and theunits of the flux are 10−13 erg s−1 cm−2 A−1.Our observations reveal an unusual and very complex
spectrum of V838 Mon. It contains contributions fromseveral physically different environments. In its blue parta photospheric spectrum of the B3V companion can beclearly seen, while the green and red parts are dominatedby molecular absorptions that severly affect the flux ofa very cold supergiant. A particularly striking featureof the presented spectrum is the presence of prominentemissions of [Fe II]. Finally numerous, mostly resonance,lines showing P-Cyg profiles as well as a few pure ab-sorptions of neutral atoms can be easily found.In the case of such a complex spectrum, detailed iden-
tification of all the features is a difficult task. The identi-fication procedures and their results are described in thefollowing sections. We also present results of basic mea-surements, e.g. radial velocities of different line systemsand molecular bands.
4. ATOMIC LINES
The atomic line identification was based mainly on theAtomic Spectra Database Lines Form6 (provided by theNational Institute of Standards and Technology, NIST),
5 http://jet.sao.ru/∼goray/v838mon.htm6 http://physics.nist.gov/PhysRefData/ASD/lines form.html

Keck
/HIR
ESspectru
mofV838Mon
3
0
0.2
0.4
0.6
0.8
1
3750 3800 3850 3900 3950
H12 H11 H10 H9 H8HeI[FeII]? CaII K
0
0.2
0.4
0.6
4000 4050 4100 4150
Hε HδHeI HeI
CaII H
[NiII]
[FeII]
0 0.2 0.4 0.6 0.8
1
4200 4250 4300 4350 4400
TiO α(5,0)
Hγ HeI
[NiII][FeII]
[FeII] [FeII]
[FeII] [FeII] [NiII] [FeII]
[FeII]
[FeII] [FeII][FeII]
0.2
0.4
4450 4500 4550 4600 4650
TiO α(4,0)TiO α(4,1)
AlO B−X ∆v=2
TiO α(3,0) AlO B−X(1,0)
HeIDIB
[FeII] [FeII]
[FeII] [FeII] [FeII] BaII MgI
[FeII]
CrI CrI CrICrI
0.2
0.4
4650 4700 4750 4800 4850
Wavelength (Å)
AlO B−X ∆v=1
AlO B−X(0,0)TiO α(5,2) TiO α(2,0)TiO c−X(0,0) TiO α(3,1)
TiO α(4,2)
Hβ
CrI[FeII]
[FeII][FeII]
[FeII]
[FeII]
Fig.1.—
Blu
epart
of
the
Keck
spectru
mof
V838
Mon
obta
ined
inO
ctob
er2005.
The
spectru
mw
as
smooth
edfro
mth
eorig
inalreso
lutio
nw
ithb
oxca
r13.
Asy
nth
eticsp
ectrum
of
aB
3V
star
issh
own
for
com
pariso
n(b
lue
line).
Iden
tified
ato
mic
spectra
lfea
tures
are
indica
tedby
redm
ark
ers,w
hile
molecu
lar
bandhea
ds
are
assig
ned
with
green
mark
ers.T
he
ord
inate
units
are
10−13
ergs−1
cm−2
A−1.

4Kaminskiet
al.
0
0.2
0.4
0.6
0.8
4950 5000 5050 5100 5150 5200 5250
[FeII] [FeII]FeII
[FeII]
SiII?
[FeII]
SiII?
FeI FeI
FeI?
Ti I
[FeII]
FeII [FeII] [NI] CrI [FeII] FeI?TiOα(1,0) TiOα(2,1) TiOα(3,2) AlO B−X ∆v=−1 TiOα(0,0)+FeI VO C−X(2,0)
0.2
0.4
0.6
5300 5350 5400 5450 5500 5550
[FeII]
CrICrI
[FeII]
CrI
[FeII]
[FeII] MnI CrI TiI MnI
[FeII]
[FeII]BaI
VO C−X(3,1)
TiOα(3,3) TiOγ’(3,0)
VOC−X(4,2)
TiOα(0,1)VO C−X(1,0)
TiOα(1,2)
0.2
0.4
0.6
5600 5650 5700 5750 5800 5850
[OI]
VI
VI
[FeII] DIB
DIB
TiOγ’(2,0) TiOγ’(3,1)
TiOγ’(4,2)
VO C−X(0,0)TiOα(0,2)
ScO A−X(1,0)
TiOα(1,3)
TiOγ’(1,0)
0
0.2
0.4
0.6
0.8
5900 5950 6000 6050 6100 6150
HeI
NaI D2,D1CaI CaI
TiOγ’(1,0)TiOγ’(2,1) YO A−X(0,0)
YO A−X(1,1)
TiOγ(3,0) ScO A−X(0,0)
ScO A−X(1,1)
YO A−X(0,0) TiOγ’(0,0)
0 0.2 0.4 0.6 0.8
1
6200 6250 6300 6350 6400 6450
Wavelength (Å)
DIB[OI] [OI]
atm O2
TiOγ’(0,0)TiOγ’(1,1)
TiOγ’(2,2) TiOγ(2,0)TiOγ(3,1) ScO A−X(0,1)
em.
TiOγ(4,2)
Fig.2.—
Sam
eas
inF
ig.
1but
for
the
green
part
of
the
Keck
spectru
mof
V838
Mon.
Keck
/HIR
ESspectru
mofV838Mon
5
0
0.5
1
6550 6600 6650 6700 6750 6800
TiOγ(3,2)
FeI
TiI?DIB
CaI
LiI
TiOγ(5,3)
TiOγ’(0,1)
TiOγ(1,0)
TiOγ(2,1)
0
0.5
1
1.5
2
6800 6850 6900 6950 7000 7050
TiOγ(0,0)atm O2 (B−Band)TiOγ(3,2)
TiO(b−X)(0,0)
VO B−X(2,0)
TiOγ(0,0)sat.
VO B−X(3,1)
0 0.5
1 1.5
2 2.5
3
7100 7150 7200 7250 7300 7350
[FeII]DIB
atm H2O
TiOγ(0,0)
TiOγ(1,1)
TiOγ(2,2)
VO B−X(1,0)
0 0.5
1 1.5
2 2.5
3 3.5
7400 7450 7500 7550 7600 7650
TiI?
atm O2 (A−Band)
VO B−X(1,0)
VO B−X(2,1)
TiOγ(0,1)sat.
TiOγ(0,1)
0 0.5
1 1.5
2 2.5
3 3.5
4
7700 7750 7800 7850 7900 7950
Wavelength (Å)
KI RbI
RbI
TiOγ(1,2)
TiOγ(2,3)
VO B−X(0,0)
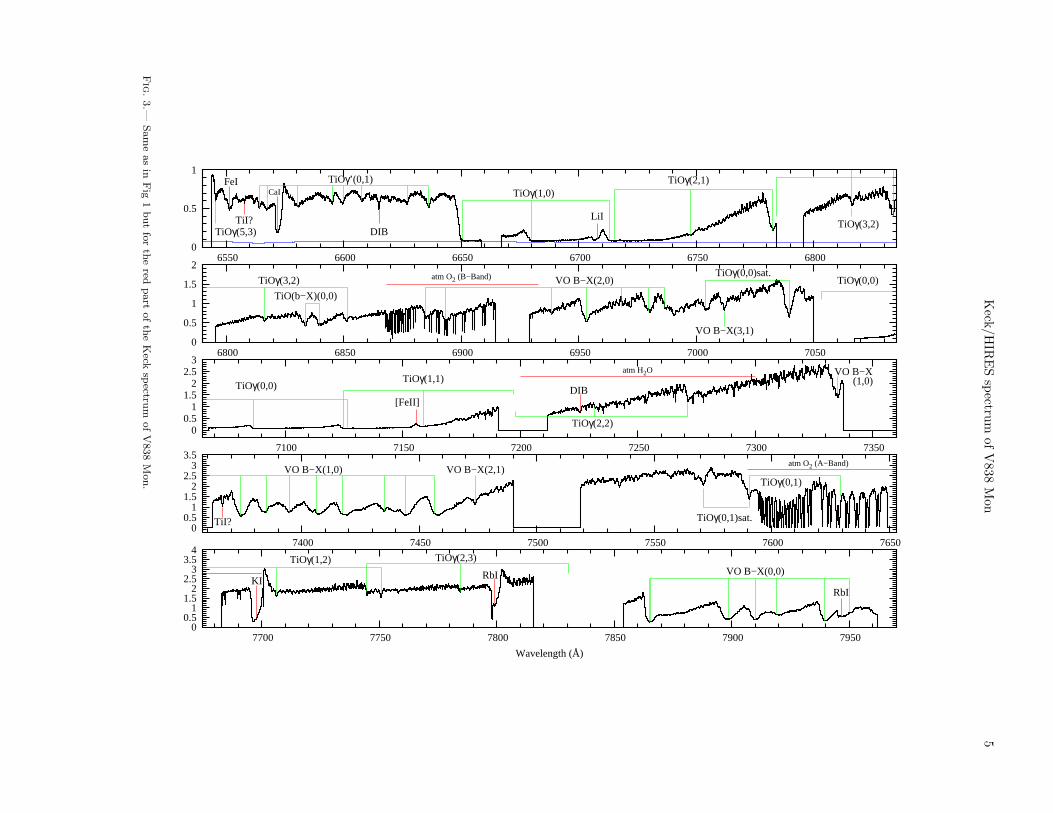
Fig.3.—
Sam
eas
inF
ig1
but
for
the
redpart
of
the
Keck
spectru
mof
V838
Mon.

6 Kaminski et al.
0
0.2
0.4
0.6
0.8
1
-600 -400 -200 0 200 400 600
Heliocentric velocity (km s-1)
Fig. 4.— Profile of the [Fe II] lines. Black solid line: the profileaveraged out from 7 lines (see the text for more details). Reddotted line: the best least-squares fit of a Lorentzian profile to theaverage profile (FWHM of 83.6 km s−1, center at 13.0 km s−1).Blue dashed line: local continuum.
the Atomic Line List version 2.04 by van Hoof7, and onthe multiplet tables by Moore (1945).All the identified atomic emission and absorption fea-
tures are listed in Tables 1 and 2 (respectively) in order oftheir laboratory wavelengths. Columns (1)–(3) of the ta-bles contain: laboratory wavelength, ion name, and mul-tiplet number from Moore (1945). Column (4) in Table 1gives integrated (dereddened) fluxes of the emission lines(for which a reliable measurement was possible). In thesame column of Table 2 the profile type (pure absorptionor P-Cyg) is specified. Notes on the features are given inthe last column of the tables.
4.1. Emission lines
4.1.1. Forbidden lines
A great majority of the emission features seen in thespectrum are forbidden lines of Fe II. They are remark-ably numerous. We have identified 49 lines from 11 differ-ent multiplets. All of them arise from levels with energies(above the ground level) between 2.0 and 3.4 eV. Most ofthem are very strong and often blended with other spec-tral features. In addition to these forbidden transitions,we have also found two permitted lines of Fe II at 5018 Aand 5169 A (a third line from the same multiplet falls ina gap between two chips).All the unblended [Fe II] emissions show practically
the same but rather unusual shape. It can be well fit-ted with a theoretical Lorentzian profile, as can be seenfrom Fig. 4. The profile shown in this figure is a meanshape obtained from seven strongest and “clean” [Fe II]lines. When averaging, the normalized profiles of indi-vidual lines were weighted according to the rms2 valuesof the local noise in the spectrum. From 30 [Fe II] lines,for which we successfully fitted a Lorentzian profile usingIRAF’s splot, we have obtained a typical full width at halfmaximum8 (FWHM) of 76.3±17.7 km s−1 (median andstandard deviation). All the lines have practically thesame radial velocity. Measurements performed with the
7 http://www.pa.uky.edu/∼peter/atomic/8 All line widths given in this paper are not corrected for the in-
strumental profile, which has an intrinsic width of about 9 km s−1.
IRAF’s rvidlines task gave a heliocentric radial velocityof Vh=13.3±0.7 km s−1 (mean and standard deviation).Other forbidden lines seen in our spectrum include
those of [O I] 5577 A, 6300 A, 6364 A and [N I]5198 A. These are rather weak features, observed in spec-tral regions strongly contaminated with molecular bands.Their measurements are therefore uncertain. The mea-sured FWHM and radial velocity of the [O I] lines are80 ± 30 km s−1 and 40 ± 10 km s−1, respectively. The[N I] line has a radial velocity of about 80 km s−1.It should be noted that some of the emission lines listed
in Table 1 have uncertain identification. Two strong fea-tures at about 5041 A and 5056 A were identified as Si II,but other identifications are possible. Three lines recog-nized as [Ni II] 3993 A, 4201 A, and 4326 A, are weak,which makes their identification uncertain. However, theionization potential of Si and Ni being similar to that ofFe and low excitation energies of the proposed multipletsmake the identification probable.
4.1.2. Balmer lines
Inside the cores of the photospheric Balmer lines of theB-type companion weak emission features can be found.Their presence is evident when one compares the ob-served photospheric profiles with a synthetic spectrumof an early B-type star (see Fig. 1). The following dis-cussion is limited to Hβ only, as the emission feature ismost evident in this line. In order to better characterizethe emission we have subtracted the underlying stellarabsorption. The procedure was as follows. To the wingsof the absorption line we fitted a profile in the form:
φ(λ) = d exp{[−a(λ± λc)b + c]−1} (1)
with a, b, c and d as free parameters. The central wave-length, λc, was taken as the laboratory wavelength ofthe Hβ line corrected for the radial velocity of the B3Vstar (see Sect. 6). Eq. (1) is based on an empirical pro-file given in Chauville et al. (2001). However, for ourpurpose it was generalized to treat also the local con-tinuum level as a free parameter. The fitting procedureused the least-squares method and it was applied to allthe data points in the Hβ wing [i.e., not only to threepoints, as in Chauville et al. (2001)]. The core regiondominated by emissions was, obviously, excluded fromthe fit. The extracted emission feature is shown in Fig. 5.It can be interpreted as a single emission with an absorp-tion superimposed on it. In this case, fitting Lorentzianprofiles gives the emission component with a FWHM of∼42 km s−1 at a radial velocity of ∼14 km s−1, whilethe absorption component appears at ∼10 km s−1 andhas a FWHM of ∼24 km s−1. Note that the parametersof the emission component in this case are close to thoseof the [Fe II] lines. Alternatively, if the observed profileis fitted with two emission components, they have radialvelocities of ∼ −10 and ∼28.8 km s−1, and FWHMs of∼30 and ∼24 km s−1, respectively.
4.2. P-Cyg features
The spectrum displays a number of strong resonancelines showing P-Cyg profiles. The most prominent onesare those of Mn I 5395 A and 5433 A, Cr I 5410 A, Ba I
5535 A, Ca I 6573 A, K I 7699 A, Rb I 7800 A (only

Keck/HIRES spectrum of V838 Mon 7
0.9
1
1.1
1.2
1.3
1.4
−300 −200 −100 0 100 200 300 400
Nor
mal
ized
flux
Heliocentric velocity (km s−1)
Hβ
Fig. 5.— Emission feature extracted from the Hβ photosphericabsorption line of the B3V companion. The spectrum was signifi-cantly smoothed from the original resolution via boxcar with a boxsize of 15 pixel.
the Cr I line is not a resonant one). They are shown inFig. 6. Other lines showing P-Cyg signatures, althoughnot as notable as in those listed above, are Mg I 4571 A,Fe I 5110 A, and possibly also a few weak lines of Cr I.Most of the P-Cyg profiles have a deep absorption com-
ponent extending from ∼50 km s−1 (as a cross-over fromemission to absorption) to ∼ −95 km s−1. The most ex-treme exception is the K I line, which shows blueshiftedabsorption down to ∼ −145 km s−1. Emission compo-nents peak at ∼80 km s−1.The shapes of the absorption components indicate in-
homogeneities in the outflowing matter. Particularly inthe profiles of Rb I and Mn I one can clearly see an ad-ditional narrow absorption component (NAC) centeredat −82 km s−1 [see panel (b) in Fig. 6]. The measuredFWHM of the narrow feature inside the Rb I 7800 A lineis 19.3 km s−1.As noted above, the Mg I 4571 A line shows only weak
signatures of a P-Cyg profile. Indeed, it is dominated bya slightly asymmetric emission and exhibits only a veryweak absorption at approximately the same velocity asthe NAC.The profile of Fe I 5110 A is also exceptional. Its ab-
sorption component is so deep that it removes all thelight from the cold star and reaches the flux level ofthe B3V companion (see top panel in Fig. 2). In addi-tion, it is considerably broader than most of the otherP-Cyg absorptions and extends from ∼80 km s−1 to∼ −120 km s−1. Most probably the λ5110 absorptionis saturated. Other Fe I lines identified in the spectrumappear as absorptions only, without any signs of emissioncomponents (see Sect. 4.3).As Table 2 indicates, almost all the abundant alkali
metals show P-Cyg profiles. Thus, one would expectthat it should also be the case of the Li I doublet at6708 A. However, in the raw spectrum no clear emissioncomponent can be seen close to the clear absorption of
0
0.2
0.4
0.6
0.8
1
1.2
1.4
1.6
1.8
(a)
CrI 5409BaI 5535CaI 6572KI 7698
FeI 5110
0.2
0.4
0.6
0.8
1
1.2
1.4
1.6
1.8
(b)RbI 7800MnI 5394MnI 5432MgI 4571
0
0.2
0.4
0.6
0.8
1
1.2
1.4
1.6
(c)TiI 5147TiI 5152TiI 5426
0.8
1
1.2
−200 −100 0 100 200 300
Heliocentric velocity (km s−1)
(d) CaI 6102CaI 6122
Fig. 6.— Sample of atomic spectral features. Before the regionswere individually normalized to the local continuum, the flux fromthe B3V star had been subtracted. (a) Examples of the mostprominent P-Cyg lines. The spectra of Cr I, Ba I and Fe I, weresmoothed via boxcar 9. The K I profile is contaminated by the ISMabsorptions. (b) P-Cyg profiles with a narrow absorption compo-nent (NAC). The normalized fluxes of the Mg I were divided by1.7 and the spectrum was smoothed via boxcar 13. The Mn I lineswere smoothed with boxcar 9. (c) Double absorption componentsof three Ti I transitions; the upper and lower plots were verticallyshifted by ±0.55. (d) Two absorption lines of Ca I. The verticallines along the panels mark the velocity of the NAC (dashed) andof the source of the outflow (dotted) as estimated from molecularbands (see Sect. 5.1).

8 Kaminski et al.
Li I. The doublet falls in a region that is dominated by astrong absorption band of TiO and it is difficult to definean underlying molecular baseline. Moreover, the doubletresides very close to the γ (1,0) bandhead of TiO andmost probably a part of the emission component of Li Iis absorbed by the saturated molecular band. A similarsituation also occurs for the Rb I 7948 A line. Its profileis strongly affected by the (B−X) (0,0) absorption bandof VO and the expected emission component cannot beseen on the raw spectrogram.
4.3. Absorption lines
Another group of identified lines are pure absorptions.Beside the interstellar features (see Sect. 7) and photo-spheric lines of a B-type star (see Sect. 6), absorptionsof Fe I 5060 A, 5128A, 5247 A, 6551 A, Ca I 6102 Aand 6122 A, and numerous Cr I lines were found. Someof these lines are in the same multiplet with a line thatexhibits a prominent P-Cyg profile. Thus, it is quitepossible that in a more sensitive observations the lines,classified here as absorptions, would appear as P-Cygprofiles. Among the absorptions the strongest is the Fe I
5060 A line, which, similarly to the P-Cyg absorptioncomponent of Fe I at 5110 A (see Sect. 4.2), appears asa very broad feature and, probably, is saturated. All theabsorptions, except the λ5060 line, are narrower than theabsorption components in the P-Cyg profiles and alwaysfall in the velocity range defined by P-Cyg absorptions,indicating that they originate in the same parts of theoutflowing gas.The absorption lines of Ti I found at 5147 A, 5152 A,
and 5426 A are of special interest. They arise from lev-els with energies of 2.3−2.4 eV. In our spectrum the linesconsist of (at least) two well separated components, whatis clearly seen in panel (c) of Fig. 6. The redshifted ab-sorption component appears at ∼75 km s−1, close to thepeaks in the P-Cyg emissions. The blueshifted sharp fea-ture, seen in the 5147 A and 5152 A lines, appears at aradial velocity of ∼ −90 km s−1, which suggests that itcan be associated with portions of the fast wind seen inthe most blueshifted P-Cyg absorptions (excluding K I).Note also that the velocity of this short-wavelength com-ponent is also very close to the velocity of the NAC seenin some P-Cyg profiles (see Fig. 6). As can be seen frompanel (c) in Fig. 6, the two absorption components ofthe Ti I lines have different shapes. While the blushiftedcomponent has a very narrow Gaussian profile with aFWHM of ∼13 km s−1, the redshifted feature is broad,with a FWHM of ∼40 km s−1, and its profile is asym-metric with a steep blue edge and an extended red wing.A prominent absorption feature is present at ∼7366 A,
which we have identified as another Ti I line at 7364 A.The feature would correspond to the blueshifted com-ponent in the discussed above Ti I lines. Note that thefeature has also a profile similar to the corresponding ab-sorptions in the other Ti I lines. A possible redshiftedcomponent cannot be seen, because it falls in a regionbetween the echelle orders.We have also identified two weak absorption lines of
Ca I at 6103 A and 6122 A. They are shown in panel(d) of Fig. 6. These lines are broad (FWHM≃60 km s−1)and asymmetric. Contrary to the Ti I lines, they have
an extended blue wing and a sharp red edge. Since theseCa I lines arise from a rather high energy level (3.91 eVabove the ground level), they are expected to be formedclose to the photosphere of the red supergiant.
5. MOLECULAR BANDS
The complexity of the spectrum makes a direct identi-fication of molecular bands very difficult. For identifica-tion purposes, we have performed a series of simulationsof molecular spectra. First attempts showed that a modelcapable of reasonably reproducing the observed molecu-lar features should include, at least, two components, i.e.,a stellar photosphere of a cool supergiant and an absorb-ing outflowing material with an excitation temperaturesignificantly lower than the stellar temperature.As a model of the stellar cold photosphere, we have
used a synthetic spectrum generated from a model atmo-sphere from the NextGen grid9 (Hauschildt et al. 1999).These models include TiO opacities, what is crucial inthe case of the analyzed spectrum. We chose a model at-mosphere with Teff =2400K, and with the lowest grav-ity available within the grid, i.e. log g = 0.0. For theseparameters there is only a NextGen model with solarmetallicity, what is probably close to the true metallicityof V838 Mon (Kipper & Skoda 2007).Our choice on Teff is a result of initial modeling of
the observed spectrum, where we used atmosphere mod-els for Teff =2000, 2200, and 2400K. With the valueof 2400K we have obtained most satisfying fits to theobserved band profiles from higher rotational levels.The effective temperature of the cold star can
also be determined from photometric measurements.Munari et al. (2007) measured BV RcIc magnitudes ofV838 Mon on 2005 Dec. 1, while Henden et al. (2006)measured UBV RcIc on 2005 Dec. 25 and JHK ′ mag-nitudes on Dec. 18. Thus the photometry was done∼2 months after our spectroscopy. Given very slow evo-lution of the object at that epoch we can safely assumethat the magnitudes did not change significantly betweenOctober and December 2005. Applying the same proce-dure to the above photometric results as that used inTylenda (2005), i.e. fitting a standard supergiant pho-tometric spectrum with EB−V = 0.9 and taking intoaccount a contribution from a standard B3V star, wehave obtained a spectral type of M6–7 and Teff ≃ 2480 K.Adopting R = 3.1 and a distance of 8 kpc (as in Tylenda2005) the effective radius and luminosity of V838 Monare ∼ 840R⊙ and ∼ 2.4 × 10⁴ L⊙, respectively. The re-sultant fit is shown in Fig. 7. When fitting a blackbodyto the IJHK magnitudes, a temperature of 2320 K hasbeen obtained and, correspondingly, an effective radius of∼ 905R⊙ and a luminosity of ∼ 2.2×10⁴L⊙. The black-body fit (with the contribution from the B3V companionadded) is shown as a dashed curve in Fig. 7. Thus theestimates of Teff obtained from the photometric measure-ments are well consistent with the effective temperaturewe used to model the cold photosphere.The photosphere model spectrum was then used as an
underlying spectrum absorbed in the outflowing molec-ular gas. In radiative transfer modeling of absorption inthe outflow (scattering was not included), the gas wastreated as a plane-parallel homogeneous slab of matter.
9 ftp://ftp.hs.uni-hamburg.de/pub/outgoing/phoenix/NG-giant

Keck/HIRES spectrum of V838 Mon 9
Fig. 7.— Model spectra fitted to the photometric(UBV RcIcJHK ′ – full points) measurements of V838 Monin December 2005. Dotted curves – contributions from thesupergiant and the B3V star. Full curve – final fit (sum of thedotted ones). Dashed curve – fit of a blackbody to the IcJHK ′
measurements. See the text for more details.
In this one-dimensional approach three parameters char-acterize the outflowing gas, i.e. column density of an ab-sorbing molecule, excitation temperature (the same forrotational and vibrational components), and a radial ve-locity of the slab (no velocity gradient was implemented).Finally, to the resultant spectrum a photospheric contri-bution of a B3V star was added (a synthetic spectrum ofTeff =18 000K and log g = 4.0 was used for this purpose– see Sect. 6).It should be noted that the above approach was not
meant to reproduce the observed spectrum in the wholespectral range. Simulations were performed separatelyfor different narrow spectral regions and usually for onemolecule at once. It allowed us to identify and study indi-vidual bands dominating in a given spectral range. Withthis modeling procedure rough estimates of physical pa-rameters of the outflowing material (excitation tempera-ture, column densities, radial velocity) were also possiblein a number of cases.A list of the identified molecular bands is presented in
Table 3. The first column of the table gives observedwavelengths of features. In most cases this is the wave-length of a bandhead formed by the R branch, but ina few cases this corresponds to a local minimum of theabsorption feature formed by Q or P branches; otherwisean empty space is left. Column (2) contains laboratorywavelengths of the features. Columns (3), (4), and (5)specify the molecule name, the electronic system with avibrational band identification, and the branch designa-tion, respectively. Column (6) gives a heliocentric veloc-ity of the feature, if a clear bandhead is observed. Ref-erences to appropriate molecular data and comments onindividual features can be found in the last two columns.Most of the identified molecular features are also indi-cated on the spectrograms in Figs.1–3.The spectrum is dominated by strong TiO absorption
bands, which are present in all parts of the HIRES spec-trum. Prominent are also bands of VO, AlO, ScO, andYO. In the following subsections, we describe in somedetail the identified features for each of the molecules.
5.1. TiO
Much effort was devoted to understand electronic tran-sitions of TiO in laboratory (Phillips 1973), in astro-nomical observations (Ram et al. 1999), as well as intheoretical computations (Schwenke 1998). In the iden-tification procedure, we mainly consulted databases ofline positions computed from laboratory measurements(Jørgensen 1994; Plez 1998; Schwenke 1998). These linelists also provide data for bands not measured in labo-ratory and in these cases discrepancies between differentsources are often significant. The lack of accurate spec-troscopic data disables a detailed analysis of some TiObands, e.g. the γ’ (3,0) band close to 5350 A and higherovertones of γ’ bands.We have identified three electronic systems of TiO in
the spectrum of V838 Mon, i.e., α (C3∆ − X3∆), γ
(A3Φ−X3∆), and γ’ (B3Π−X3∆). The molecular bandsof the γ and γ’ systems have generally a characteristictriple structure formed by their main branches. In thecase of the α transitions, the separation of branches is sosmall that the three components overlap and the triplestructure is not seen. Additionally, in some bands of theγ and γ’ systems, relatively strong satellite branches areobserved, e.g. the R31 branch of the γ’ (1,0) band at5827 A. Finally, we have also identified forbidden tran-sitions of TiO in the spectrum. The latter point is dis-cussed in Sect. 5.6.The observed features of TiO arise both in the stel-
lar photosphere and in the outflow. Although the lattercomponent dominates formation of the observed bands,it would be impossible to satisfactorily reproduce a num-ber of the observed features without a contribution fromthe photosphere. Unfortunately, we have not been ableto set valuable constraints on the effective temperature,since there are only a few regions in the spectrum, wherethe stellar component dominates. Performed simulationsshow, however, that the selected atmospheric model withTeff =2400K works good in reproducing high excitationfeatures seen in the spectrum (see below).Nonetheless, the most prominent absorptions of TiO
seen in the spectrum of V838 Mon arise in a low exci-tation environment. A comparison between the observa-tions and spectra computed from our slab model with dif-ferent excitation temperatures suggests a mean value ofTex=500±100K. Adopting this temperature and com-paring the observed spectrum to the simulations of theγ′ (2,0), (1,0), (0,0), and γ (2,0) bands, an estimate ofthe TiO column density of ∼16.8 dex cm−2 has been ob-tained. Assuming that all Ti is locked in TiO and takinga Ti atomic abundance of 10−7 relative to hydrogen, acolumn density of hydrogen of ∼23.8 dex cm−2 has beenderived.A characteristic feature of the observed TiO spectrum
is a strong saturation of bands originating from theground vibrational state. The effect is clearly seen inthe γ’ (0,0) and (1,0) bands. In the γ’ (2,0) band thesaturation is weaker and completely disappears in the(3,0) band. Similarly, a strong saturation is seen in the

10 Kaminski et al.
Fig. 8.— Rotational structure of highly excited levels of twoγ bands of TiO. The observed spectrum (black line) is comparedwith simulations (red line). In order to fit the simulated rotationalfeatures to those in the observed spectrum, the simulated spectrahave been shifted to a velocity of Vh = 58 km s−1 and smoothedwith a Gaussian with FWHM = 34 km s−1. An emission feature ofScO can easily be seen in the bottom panel (ScO was not includedin the simulations shown here).
α (0,0), (1,0), (2,0) bands, and probably also in the (3,0)and (4,0) bands. In the red part of the analyzed spec-trum, the γ (0,0) and (1,0) bands are saturated. Dueto the strong saturation in the γ and γ’ systems thetriple structure of the bands can be seen only throughweak emission-like features that appear between the sat-urated components, see e.g. the γ (0,0) and (1,0) bandsat 6670 A and 7100 A (Fig. 3).Radial velocities of some TiO bands can be deter-
mined by comparing rotational features of the observedbands with simulated spectra. Although the rotationalstructure is completely smoothed in the observed band-heads, it is recognizable in those parts of the spectrum,where only absorptions from higher rotational levels arepresent. Two examples of such rotational features areshown in Fig. 8, where a simulated spectrum is over-plotted on the observed one. The cold slab had a ex-citation temperature of 500K in the simulations. Notehowever that the contribution from the slab is negligi-ble in the γ(3,1) and (4,2) bands. To fit the rotationalcomponents the modelled spectrum has been shifted toVh =58±5km s−1. Since these rotational features com-ing from high excitation levels are predominantly formedin the atmosphere of the central star, the derived velocityis expected to be close to the radial velocity of the star.Radial velocities can also be determined from the ob-
served positions of bandheads. In the case of the TiObands present in our spectrum formation of a bandhead
is often strongly influenced by presence of satellite bandsand a non-negligible isotopic shift in wavelength. Anexample is presented in panel (a) of Fig. 9. This head,belonging to the α (2,0) band, is formed by the R2 branchand a contribution from satellite bands is small in thiscase. However, as can be seen in the rotational profile10
overplotted on the spectrum in Fig.9, the head is actu-ally formed by multiple components. The strongest onesbelong to the three main TiO isotopomers, i.e., 46Ti16O,47Ti16O, and 48Ti16O. For solar Ti isotopic ratios, i.e.9.3,10.1,13.4,13.8 for 48/46,48/47,48/49,48/50, respec-tively (Cowley 1995), all the isotopic components shouldsignificantly contribute to the shape of the α (2,0) band-head. Since they are not distinguishable in the observedsmooth head, only a position of the most blueshiftedcomponent belonging to the 46TiO isotopomer can bemeasured with a reasonable accuracy. In this way a ve-locity of Vh = −67 km s−1 has been inferred.Another example of a TiO complex bandhead is shown
in panel (b) of Fig. 9. As seen in the rotational profile,the structure of the γ’ (1,0) bandhead is even more elab-orate than in the previous example. This is due to thepresence of multiple heads formed by satellite branches.The observed head is again very smooth and individ-ual components, clearly distinguishable in the overplot-ted rotational profile, are not seen in the observed spec-trum. An estimate of the outflow velocity is very uncer-tain in this case, but by fitting the rotational profile tothe overall absorption profile of the band, a velocity ofVh = −58± 10km s−1 has been derived.As can be found in Table 3, the most blueshifted
molecular component is observed in the α (0,0) bandat 5164.6 A. A velocity of −125km s−1 has been derivedassuming that the blue edge of the head is formed by the46TiO isotopomer, instead of the most abundant 48TiO.A similar velocity was found for the α (1,0) band at4952.6 A.The derived radial velocities of TiO features are in a
range between 58 kms−1 and −125 kms−1. It is reason-able to assume that the molecular absorption arises inan outflow with a velocity gradient. This can explaindifferent velocities of the bands with different excita-tion requirements, and can also account for the observedsmooth structure of the bandheads.
5.2. AlO
We based our identification procedure of the AlObands on an analysis of the B2Σ+ –X2Σ+ systemperformed in Coxon & Naxakis (1985). Absolutestrengths of the electronic transitions ware taken fromPartridge et al. (1983).The blue-green (B2Σ+ –X2Σ+) band system of AlO is
evidently present in the analyzed spectrum. The mostprominent feature is the saturated (0,0) band with amain head at 4842 A, see panel (c) in Fig. 9. Threebandheads of different branches are close enough to formthis relatively sharp head. In this case a radial ve-locity can be measured accurately and we have foundVh = −82± 6 km s−1.
10 A rotational profile means here a computed and smoothedprofile of normalized absorption features of a band and it should notbe confused with a full simulation from our model involving stellarphotosphere and an absorbing cool slab as described in Sect. 5.
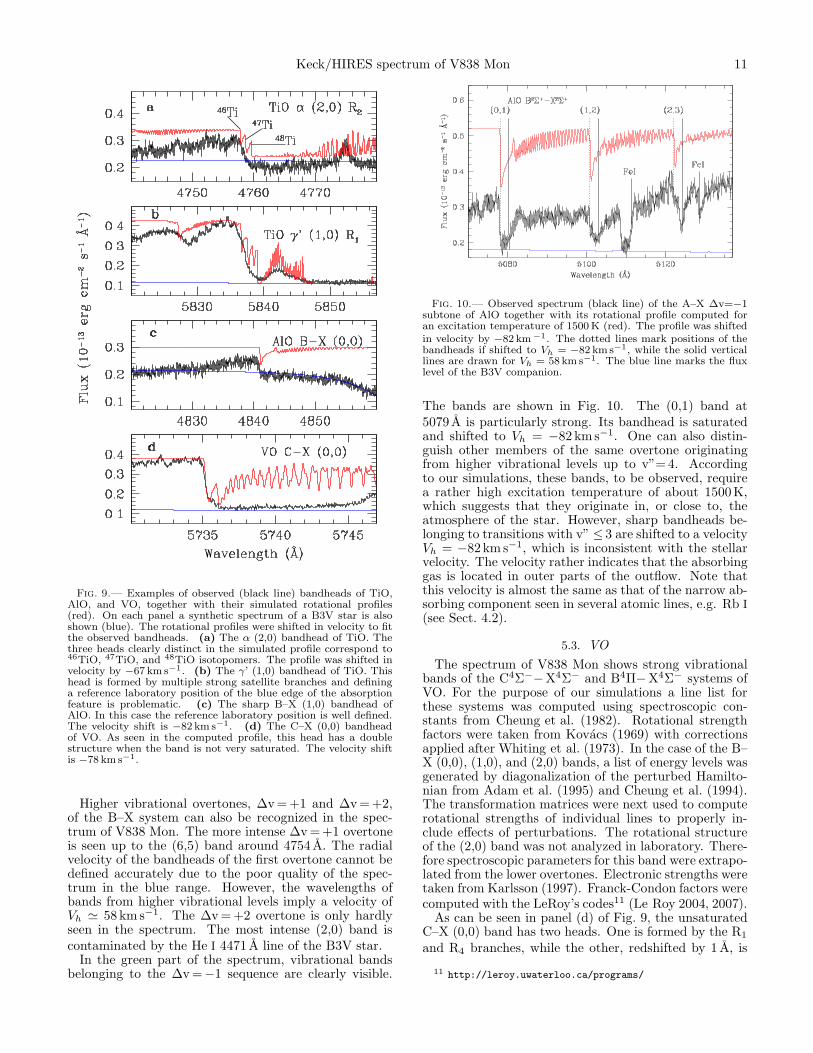
Keck/HIRES spectrum of V838 Mon 11
Fig. 9.— Examples of observed (black line) bandheads of TiO,AlO, and VO, together with their simulated rotational profiles(red). On each panel a synthetic spectrum of a B3V star is alsoshown (blue). The rotational profiles were shifted in velocity to fitthe observed bandheads. (a) The α (2,0) bandhead of TiO. Thethree heads clearly distinct in the simulated profile correspond to46TiO, 47TiO, and 48TiO isotopomers. The profile was shifted invelocity by −67 km s−1. (b) The γ’ (1,0) bandhead of TiO. Thishead is formed by multiple strong satellite branches and defininga reference laboratory position of the blue edge of the absorptionfeature is problematic. (c) The sharp B–X (1,0) bandhead ofAlO. In this case the reference laboratory position is well defined.The velocity shift is −82 km s−1. (d) The C–X (0,0) bandheadof VO. As seen in the computed profile, this head has a doublestructure when the band is not very saturated. The velocity shiftis −78 km s−1.
Higher vibrational overtones, ∆v=+1 and ∆v=+2,of the B–X system can also be recognized in the spec-trum of V838 Mon. The more intense ∆v=+1 overtoneis seen up to the (6,5) band around 4754 A. The radialvelocity of the bandheads of the first overtone cannot bedefined accurately due to the poor quality of the spec-trum in the blue range. However, the wavelengths ofbands from higher vibrational levels imply a velocity ofVh ≃ 58 km s−1. The ∆v=+2 overtone is only hardlyseen in the spectrum. The most intense (2,0) band iscontaminated by the He I 4471 A line of the B3V star.In the green part of the spectrum, vibrational bands
belonging to the ∆v=−1 sequence are clearly visible.
Fig. 10.— Observed spectrum (black line) of the A–X ∆v=−1subtone of AlO together with its rotational profile computed foran excitation temperature of 1500 K (red). The profile was shiftedin velocity by −82 km −1. The dotted lines mark positions of thebandheads if shifted to Vh = −82 km s−1, while the solid verticallines are drawn for Vh = 58 km s−1. The blue line marks the fluxlevel of the B3V companion.
The bands are shown in Fig. 10. The (0,1) band at5079 A is particularly strong. Its bandhead is saturatedand shifted to Vh = −82 kms−1. One can also distin-guish other members of the same overtone originatingfrom higher vibrational levels up to v”=4. Accordingto our simulations, these bands, to be observed, requirea rather high excitation temperature of about 1500K,which suggests that they originate in, or close to, theatmosphere of the star. However, sharp bandheads be-longing to transitions with v” ≤ 3 are shifted to a velocityVh = −82km s−1, which is inconsistent with the stellarvelocity. The velocity rather indicates that the absorbinggas is located in outer parts of the outflow. Note thatthis velocity is almost the same as that of the narrow ab-sorbing component seen in several atomic lines, e.g. Rb I(see Sect. 4.2).
5.3. VO
The spectrum of V838 Mon shows strong vibrationalbands of the C4Σ−−X4Σ− and B4Π−X4Σ− systems ofVO. For the purpose of our simulations a line list forthese systems was computed using spectroscopic con-stants from Cheung et al. (1982). Rotational strengthfactors were taken from Kovacs (1969) with correctionsapplied after Whiting et al. (1973). In the case of the B–X (0,0), (1,0), and (2,0) bands, a list of energy levels wasgenerated by diagonalization of the perturbed Hamilto-nian from Adam et al. (1995) and Cheung et al. (1994).The transformation matrices were next used to computerotational strengths of individual lines to properly in-clude effects of perturbations. The rotational structureof the (2,0) band was not analyzed in laboratory. There-fore spectroscopic parameters for this band were extrapo-lated from the lower overtones. Electronic strengths weretaken from Karlsson (1997). Franck-Condon factors werecomputed with the LeRoy’s codes11 (Le Roy 2004, 2007).As can be seen in panel (d) of Fig. 9, the unsaturated
C–X (0,0) band has two heads. One is formed by the R1
and R4 branches, while the other, redshifted by 1 A, is
11 http://leroy.uwaterloo.ca/programs/

12 Kaminski et al.
formed by R2 and R3. Both are present in the observedspectrum and the former one appears at a velocity of−77km s−1. A regular ladder of rotational lines of the(0,0) band formed by main P branches can be recognizedstarting at 5753 A (see Fig. 2). Fortunately, precise lab-oratory wavelengths are available for these lines and adetailed modeling of the band was possible. The simu-lations suggest that this part of the spectrum is formedat a low excitation temperature of ∼300K. The derivedvelocity of the absorbing gas in the rotational transitionsof the (0,0) band is Vh =43km s−1. From the heads ofhigher transitions of the C–X system, namely the (1,0)and (2,0) bands, velocities of −77km s−1 and −45km s−1
were derived, respectively.Additionally, within the B–X system, the bands (0,0),
(1,0), and (2,0) were identified. The (0,0) and (1,0)bands, together with their simulated spectra, are pre-sented in Fig. 11. Most of the features of these bands areonly slightly shifted from their laboratory wavelengthsand the measured velocity is Vh =−2 km s−1. A ratheruncertain value of ∼350K was deduced from the sim-ulations as an excitation temperature of the absorbinggas (mainly from the intensities of absorption featuresat 7910 A and 7920 A). Furthermore, in order to repro-duce some features seen in the spectra of the bands withhigher vibrational numbers, e.g. the absorption featureat 7474 A belonging to the (2,1) band, it was necessaryto add an additional layer of absorbing VO gas with arather high excitation temperature, namely Tex=1500K.This hotter component, treated in the simulations as aslab between the stellar photosphere and the cold slab,appears at a velocity of ∼58 kms−1.Our simulations of the C–X (0,0), B–X (0,0) and (1,0)
bands give satisfactory fits to the observations when acolumn density of the VO absorber is of ∼16.4 dex cm−2.If we assume that all V is locked in VOmolecules and tak-ing the solar abundance of V relative to H of 10−8, thiscorresponds to a column density of H of ∼24.4 dex cm−2.The result is consistent with a similar estimate performedfrom the TiO bands in Sect. 5.1.
5.4. ScO
The only electronic system of ScO present in the spec-trum is the A2Π−X2Σ+ system. Absorption features ofthe (0,0), (1,1), (2,1) bands are clearly seen in the greenpart of the spectrum. Moreover, one band of ScO, i.e.the (0,1) band, was found in emission. For the purpose ofour simulations, line positions of the A–X (0,0) band werecomputed from the Hamiltonian diagonalization parame-terized by Stringat et al. (1972) and Adams et al. (1968).Higher vibrational levels were approximated from datain NIST12. For the positions of transitions of the (1,0)band, Rice & Field (1986) was consulted. Strengths ofrotational lines were found in the approach proposed inHerbig (1974). It should be noted, that although the linepositions of the (0,0) band are exact, their strengths areonly approximate.Figure 12 shows a region of the observed spectrum cov-
ering two subbands of the (0,0) band. Simulations of thisspectral region suggest the presence of at least two differ-ent velocity components. The bandhead formed by the
12 http://physics.nist.gov/PhysRefDat/ASD/
Fig. 11.— Comparison between the observed (black line) andsimulated spectra of the B–X bands of VO. Top: the (0,0) bandwas simulated with the excitation temperatures of 350 K (redline) and 500 K (green line). The simulated spectra were shiftedto a velocity of –2 km s−1 and smoothed with a Gaussian withFWHM = 65 km s−1. The vertical lines mark positions of the band-heads for a radial velocity of –80 km s−1, which fits to the observedbandheads of SQ42 and R2, and to the blue edge of the Rb I pro-file. Bottom: the simulation of the (1,0) band obtained with twolayers of the absorbing molecular gas with different temperatures,i.e. 500 K and 1500 K. The colder layer was shifted in velocity to–2 km s−1, while the warmer one, treated in our radiative trans-fer modeling as a layer between the stellar atmosphere and thecold slab, was shifted to a velocity of 58 km s−1. The dotted linesmark positions of the bandheads for a radial velocity of –60 km s−1,which fits to the T R42 and SQ31 bandheads. The absorption fea-ture at 7474 A belongs to the (2,1) band.
2Π3/2RQ2G+RR2G (at 6036 A) and 2Π1/2
QQ1G+QR1G
(at 6079 A) branches are shifted to −55km s−1 (as mea-sured for the lowest part of the profile). The secondvelocity component at 45 km s−1 was found from the po-sition of the head formed by the 2Π1/2
RR1G branch at
6064.17 A. This latter head is formed at a rather highrotational number, i.e., N=58, contrary to the heads ob-served at −55km s−1, which are formed at N=28 andN=17. The relative velocity shift can be understood asa result of decreasing population of high rotational levelswith increasing velocity in the observed outflow. A lackof accurate laboratory wavelengths disables an analysisof other absorption bands of ScO.Remarkable is the presence of the A–X (0,1)
2Π3/2RQ2G and 2Π1/2
QQ1G subbands of ScO in emis-
sion at 6408 A and 6458 A, respectively (see bottom panelof Fig. 8 for the latter subband). The observed veloc-ity of this features agrees well with the velocity of emis-sion components seen in the atomic P-Cyg profiles (seeSect. 4.2). The origin of this molecular emission can beexplained by fluorescent pumping of the upper electroniclevel by absorption in the (0,0) 6090 A and 6132 A sub-bands, clearly seen in the spectrum of V838 Mon.

Keck/HIRES spectrum of V838 Mon 13
Fig. 12.— Comparison between the observed and simulated spec-trum of the A–X (1,0) band of ScO. The two upper plots are rota-tional profiles of the band, computed for excitation temperaturesof 750 K and 500 K (blue and red, respectively). They are shiftedto a velocity of 58 km s−1. The observed spectrum is drawn witha black line. Overlaid on it in red is a simulated spectrum witha molecular slab absorbing the light of the cool star as describedin Sect. 5. The absorbing layer has an excitation temperature of500 K and is shifted in velocity by –55 km s−1. The simulated spec-trum is smoothed with a Gaussian with FWHM = 32 km s−1. Theflux level of the B3V star is indicated with the blue line.
5.5. YO
All the features of YO identified in the spectrumof V838 Mon belong to the A2Π–X2Σ+ system. Alist of the transitions used in our identification pro-cedure was prepared on the basis of data providedin Bernard & Gravina (1983). There is another wellknown system of YO, i.e. B2Π − X2Σ+ around 4819 A(Bernard et al. 1979), but it falls into a spectral region ofsaturated TiO bands and was not found in our spectrum.We performed a detailed simulation of the A2Π3/2 −
X2Σ+ transition. The results of this simulations areshown in Fig. 13. The upper two plots in Fig. 13 arerotational profiles of the transition obtained for two ex-citation temperatures, 750K and 500K. It can be seenthat a sharp edge of the (0,0) bandhead at 5973 A isformed with the higher temperature. In the observedspectrum this head is very smooth and resembles morethe feature seen in the profile for 500K, and this is avalue we took for further simulations. It should be noted,however, that the observed profile of the band can be in-fluenced by the physical structure of the wind, which isignored in our simulations; in particular, a velocity gra-dient in the molecular outflow can smooth the shape ofthe bandheads, and even if the temperature is high, nosharp head would be observed. Nonetheless, to performfull simulations of the A2Π3/2 −X2Σ+ transition of YOit was necessary to include the γ (3,0) band of TiO asan additional important absorber in this spectral range.The green line in Fig. 13 shows the TiO contributionto the observed spectrum. The final simulation which
Fig. 13.— Same as in Fig. 12 but for the fine components ofthe electronic transitions of the A2Π3/2 − X2Σ+ feature of YO.
The final simulation (bottom) includes an extra absorption of TiO,which is shown with a green line. The simulation was performedwith a slab of 500 K and the stellar photosphere. All the computedspectra were shifted to a velocity of 58 km s−1 and smoothed witha Gaussian with FWHM = 37 km s−1.
includes absorption of YO and TiO with an excitationtemperature of 500K is shown at the bottom of Fig. 13.From the overall fit of the (0,0) band to the full simula-tion a velocity of Vh =–8km s−1 has been derived.Note however that a sharp (1,1) bandhead formed by
the RQ21 branch at 5988 A appears at higher excita-tion temperatures, at least 750K, as can be seen fromFig. 13. Such a sharp feature seems to be present inthe observed spectrum, suggesting that this absorptionfeature is formed in gas with a somewhat higher temper-ature than the one found for the (0,0) bandhead. Thisis confirmed by the measured velocity of the (1,1) band-head, Vh =58km s−1, which is the same as that of otherhigh-excitation features found in the spectrum.
5.6. TiO – forbidden transitions
Very interesting from the spectroscopical point of viewis the presence of forbidden transitions of TiO, i.e. thec1Φ–X3∆ (0,0) band around 4737 A and the b1Π–X3∆(0,0) band at 6832 A. The stronger b–X band is shownin detail in Fig. 14. The intensities of the bands werepredicted in ab initio calculations of ro-vibrational en-ergy levels of the 13 lowest electronic states of TiO bySchwenke (1998). As shown in Fig. 14, our simulationcan reproduce the forbidden bands quite well. The bestfit indicates a velocity of Vh = −80 km s−1 and an exci-tation temperature of about 500K. However, when thecolumn density found for other TiO bands (see Sect. 5.1)is assumed, oscillator strengths of the b1Π−X3∆ bandmust be enhanced by a factor of 70±35 in order to re-produce the observations. To our knowledge this is thefirst, in astrophysics as well as in laboratory, observationof TiO forbidden bands.
14 Kaminski et al.
Fig. 14.— Observed and simulated spectrum of the forbiddenband b1Π–X3∆ (0,0) of TiO. The simulation (red line) was ob-tained with an excitation temperature of 500 K. It was shifted toa velocity Vh = –82 km s−1 and smoothed with a Gaussian withFWHM = 32 km s−1.
6. PHOTOSPHERIC SPECTRUM OF THE B3VCOMPANION
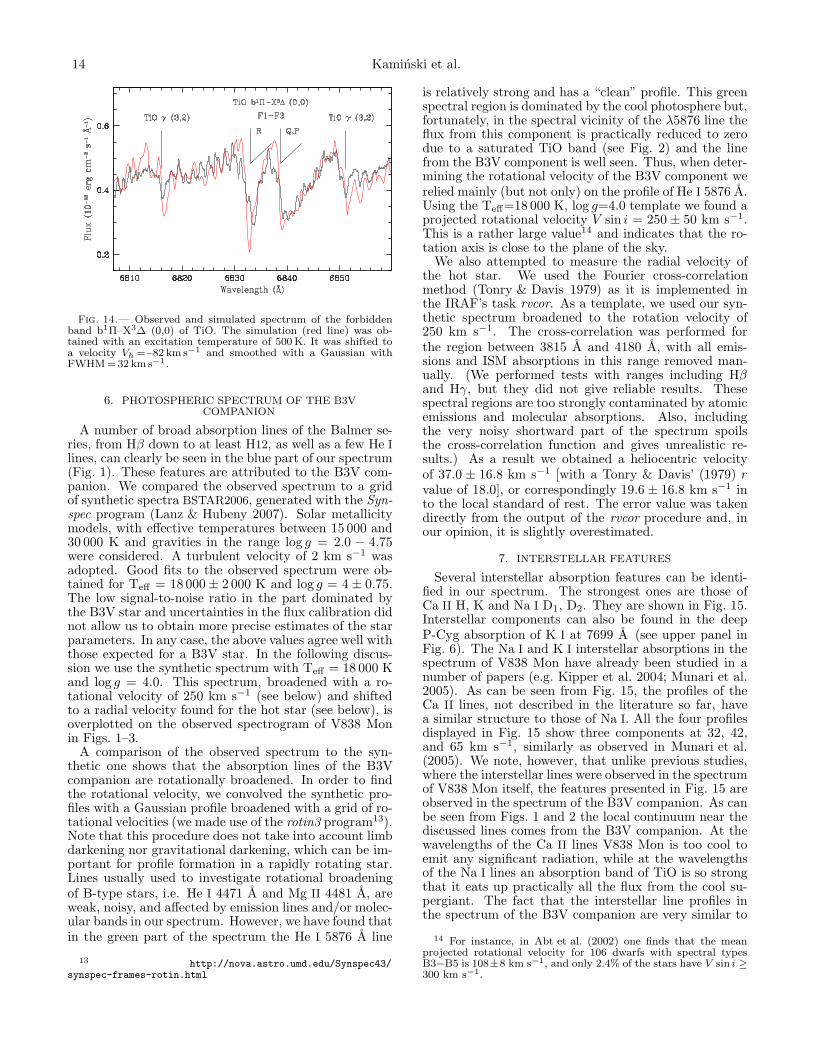
A number of broad absorption lines of the Balmer se-ries, from Hβ down to at least H12, as well as a few He Ilines, can clearly be seen in the blue part of our spectrum(Fig. 1). These features are attributed to the B3V com-panion. We compared the observed spectrum to a gridof synthetic spectra BSTAR2006, generated with the Syn-spec program (Lanz & Hubeny 2007). Solar metallicitymodels, with effective temperatures between 15 000 and30 000 K and gravities in the range log g = 2.0 − 4.75were considered. A turbulent velocity of 2 km s−1 wasadopted. Good fits to the observed spectrum were ob-tained for Teff = 18 000± 2 000 K and log g = 4 ± 0.75.The low signal-to-noise ratio in the part dominated bythe B3V star and uncertainties in the flux calibration didnot allow us to obtain more precise estimates of the starparameters. In any case, the above values agree well withthose expected for a B3V star. In the following discus-sion we use the synthetic spectrum with Teff = 18 000 Kand log g = 4.0. This spectrum, broadened with a ro-tational velocity of 250 km s−1 (see below) and shiftedto a radial velocity found for the hot star (see below), isoverplotted on the observed spectrogram of V838 Monin Figs. 1–3.A comparison of the observed spectrum to the syn-
thetic one shows that the absorption lines of the B3Vcompanion are rotationally broadened. In order to findthe rotational velocity, we convolved the synthetic pro-files with a Gaussian profile broadened with a grid of ro-tational velocities (we made use of the rotin3 program13).Note that this procedure does not take into account limbdarkening nor gravitational darkening, which can be im-portant for profile formation in a rapidly rotating star.Lines usually used to investigate rotational broadeningof B-type stars, i.e. He I 4471 A and Mg II 4481 A, areweak, noisy, and affected by emission lines and/or molec-ular bands in our spectrum. However, we have found thatin the green part of the spectrum the He I 5876 A line
13 http://nova.astro.umd.edu/Synspec43/synspec-frames-rotin.html
is relatively strong and has a “clean” profile. This greenspectral region is dominated by the cool photosphere but,fortunately, in the spectral vicinity of the λ5876 line theflux from this component is practically reduced to zerodue to a saturated TiO band (see Fig. 2) and the linefrom the B3V component is well seen. Thus, when deter-mining the rotational velocity of the B3V component werelied mainly (but not only) on the profile of He I 5876 A.Using the Teff=18 000 K, log g=4.0 template we found aprojected rotational velocity V sin i = 250 ± 50 km s−1.This is a rather large value14 and indicates that the ro-tation axis is close to the plane of the sky.We also attempted to measure the radial velocity of
the hot star. We used the Fourier cross-correlationmethod (Tonry & Davis 1979) as it is implemented inthe IRAF’s task rvcor. As a template, we used our syn-thetic spectrum broadened to the rotation velocity of250 km s−1. The cross-correlation was performed forthe region between 3815 A and 4180 A, with all emis-sions and ISM absorptions in this range removed man-ually. (We performed tests with ranges including Hβand Hγ, but they did not give reliable results. Thesespectral regions are too strongly contaminated by atomicemissions and molecular absorptions. Also, includingthe very noisy shortward part of the spectrum spoilsthe cross-correlation function and gives unrealistic re-sults.) As a result we obtained a heliocentric velocityof 37.0 ± 16.8 km s−1 [with a Tonry & Davis’ (1979) r
value of 18.0], or correspondingly 19.6 ± 16.8 km s−1 into the local standard of rest. The error value was takendirectly from the output of the rvcor procedure and, inour opinion, it is slightly overestimated.
7. INTERSTELLAR FEATURES
Several interstellar absorption features can be identi-fied in our spectrum. The strongest ones are those ofCa II H, K and Na I D1, D2. They are shown in Fig. 15.Interstellar components can also be found in the deepP-Cyg absorption of K I at 7699 A (see upper panel inFig. 6). The Na I and K I interstellar absorptions in thespectrum of V838 Mon have already been studied in anumber of papers (e.g. Kipper et al. 2004; Munari et al.2005). As can be seen from Fig. 15, the profiles of theCa II lines, not described in the literature so far, havea similar structure to those of Na I. All the four profilesdisplayed in Fig. 15 show three components at 32, 42,and 65 km s−1, similarly as observed in Munari et al.(2005). We note, however, that unlike previous studies,where the interstellar lines were observed in the spectrumof V838 Mon itself, the features presented in Fig. 15 areobserved in the spectrum of the B3V companion. As canbe seen from Figs. 1 and 2 the local continuum near thediscussed lines comes from the B3V companion. At thewavelengths of the Ca II lines V838 Mon is too cool toemit any significant radiation, while at the wavelengthsof the Na I lines an absorption band of TiO is so strongthat it eats up practically all the flux from the cool su-pergiant. The fact that the interstellar line profiles inthe spectrum of the B3V companion are very similar to
14 For instance, in Abt et al. (2002) one finds that the meanprojected rotational velocity for 106 dwarfs with spectral typesB3−B5 is 108±8 km s−1, and only 2.4% of the stars have V sin i ≥300 km s−1.
Keck/HIRES spectrum of V838 Mon 15
−0.6
−0.4
−0.2
0
0.2
0.4
0.6
0.8
1
1.2
1.4
1.6
1.8
2
2.2
2.4
2.6
−20 0 20 40 60 80 100
Nor
mal
ized
flux
Heliocentric velocity (km s−1)
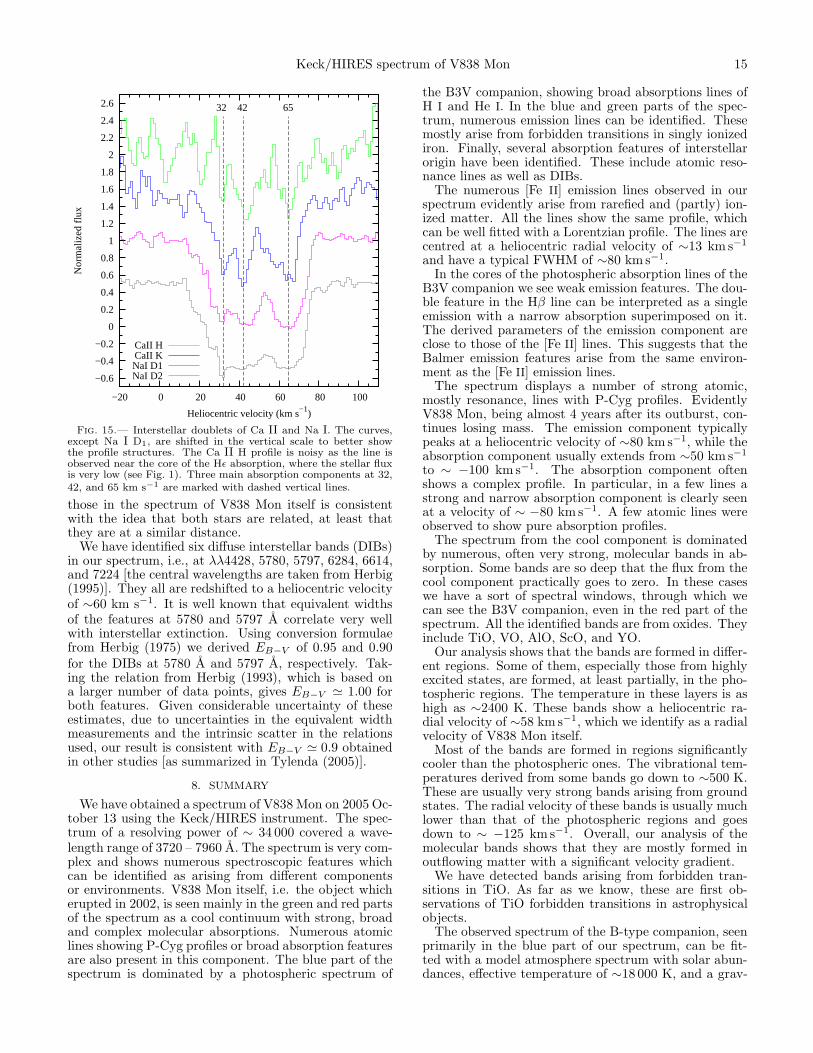
32 42 65
CaII HCaII KNaI D1NaI D2
Fig. 15.— Interstellar doublets of Ca II and Na I. The curves,except Na I D1, are shifted in the vertical scale to better showthe profile structures. The Ca II H profile is noisy as the line isobserved near the core of the Hǫ absorption, where the stellar fluxis very low (see Fig. 1). Three main absorption components at 32,42, and 65 km s−1 are marked with dashed vertical lines.
those in the spectrum of V838 Mon itself is consistentwith the idea that both stars are related, at least thatthey are at a similar distance.We have identified six diffuse interstellar bands (DIBs)
in our spectrum, i.e., at λλ4428, 5780, 5797, 6284, 6614,and 7224 [the central wavelengths are taken from Herbig(1995)]. They all are redshifted to a heliocentric velocityof ∼60 km s−1. It is well known that equivalent widthsof the features at 5780 and 5797 A correlate very wellwith interstellar extinction. Using conversion formulaefrom Herbig (1975) we derived EB−V of 0.95 and 0.90for the DIBs at 5780 A and 5797 A, respectively. Tak-ing the relation from Herbig (1993), which is based ona larger number of data points, gives EB−V ≃ 1.00 forboth features. Given considerable uncertainty of theseestimates, due to uncertainties in the equivalent widthmeasurements and the intrinsic scatter in the relationsused, our result is consistent with EB−V ≃ 0.9 obtainedin other studies [as summarized in Tylenda (2005)].
8. SUMMARY
We have obtained a spectrum of V838 Mon on 2005 Oc-tober 13 using the Keck/HIRES instrument. The spec-trum of a resolving power of ∼ 34 000 covered a wave-length range of 3720 – 7960 A. The spectrum is very com-plex and shows numerous spectroscopic features whichcan be identified as arising from different componentsor environments. V838 Mon itself, i.e. the object whicherupted in 2002, is seen mainly in the green and red partsof the spectrum as a cool continuum with strong, broadand complex molecular absorptions. Numerous atomiclines showing P-Cyg profiles or broad absorption featuresare also present in this component. The blue part of thespectrum is dominated by a photospheric spectrum of
the B3V companion, showing broad absorptions lines ofH I and He I. In the blue and green parts of the spec-trum, numerous emission lines can be identified. Thesemostly arise from forbidden transitions in singly ionizediron. Finally, several absorption features of interstellarorigin have been identified. These include atomic reso-nance lines as well as DIBs.The numerous [Fe II] emission lines observed in our
spectrum evidently arise from rarefied and (partly) ion-ized matter. All the lines show the same profile, whichcan be well fitted with a Lorentzian profile. The lines arecentred at a heliocentric radial velocity of ∼13 km s−1
and have a typical FWHM of ∼80 km s−1.In the cores of the photospheric absorption lines of the
B3V companion we see weak emission features. The dou-ble feature in the Hβ line can be interpreted as a singleemission with a narrow absorption superimposed on it.The derived parameters of the emission component areclose to those of the [Fe II] lines. This suggests that theBalmer emission features arise from the same environ-ment as the [Fe II] emission lines.The spectrum displays a number of strong atomic,
mostly resonance, lines with P-Cyg profiles. EvidentlyV838 Mon, being almost 4 years after its outburst, con-tinues losing mass. The emission component typicallypeaks at a heliocentric velocity of ∼80 km s−1, while theabsorption component usually extends from ∼50 km s−1
to ∼ −100 km s−1. The absorption component oftenshows a complex profile. In particular, in a few lines astrong and narrow absorption component is clearly seenat a velocity of ∼ −80 km s−1. A few atomic lines wereobserved to show pure absorption profiles.The spectrum from the cool component is dominated
by numerous, often very strong, molecular bands in ab-sorption. Some bands are so deep that the flux from thecool component practically goes to zero. In these caseswe have a sort of spectral windows, through which wecan see the B3V companion, even in the red part of thespectrum. All the identified bands are from oxides. Theyinclude TiO, VO, AlO, ScO, and YO.Our analysis shows that the bands are formed in differ-
ent regions. Some of them, especially those from highlyexcited states, are formed, at least partially, in the pho-tospheric regions. The temperature in these layers is ashigh as ∼2400 K. These bands show a heliocentric ra-dial velocity of ∼58 km s−1, which we identify as a radialvelocity of V838 Mon itself.Most of the bands are formed in regions significantly
cooler than the photospheric ones. The vibrational tem-peratures derived from some bands go down to ∼500 K.These are usually very strong bands arising from groundstates. The radial velocity of these bands is usually muchlower than that of the photospheric regions and goesdown to ∼ −125 km s−1. Overall, our analysis of themolecular bands shows that they are mostly formed inoutflowing matter with a significant velocity gradient.We have detected bands arising from forbidden tran-
sitions in TiO. As far as we know, these are first ob-servations of TiO forbidden transitions in astrophysicalobjects.The observed spectrum of the B-type companion, seen
primarily in the blue part of our spectrum, can be fit-ted with a model atmosphere spectrum with solar abun-dances, effective temperature of ∼18 000 K, and a grav-

16 Kaminski et al.
ity, log g ≃ 4.0. These values agree well with those ex-pected for a B3V star. The absorption lines are sig-nificantly broadened, which we interpret as a rotationalbroadening with a velocity, V sin i ≃ 250 kms−1. Wehave derived a heliocentric radial velocity of the B3Vcompanion of 37± 17 km s−1.Several interstellar absorption features are seen in our
spectrum. They include lines of Ca II, Na I, and K I,as well as DIBs. The lines of Ca II and Na I are ob-served in the spectrum of the B3V companion. Theirprofiles are very similar to those observed in the spec-trum of V838 Mon during the 2002 outburst. This resultis consistent with the idea that V838 Mon and the B3Vcompanion are related objects. From equivalent widthsof diffuse interstellar bands we have estimated an inter-stellar reddening of EB−V ≃ 0.9− 1.0, which agrees wellwith interstellar extinction values obtained by other au-thors using other methods.A detailed analysis and interpretation of the data pre-
sented in the present paper, as well as of data from othersources, will be done in a forthcoming paper.
MS, RT, and TK were supported by the Polish Min-istry of Science and Higher Education under grant no.N203 004 32/0448, for which they are grateful. TKwishes to thank T. Tomov for his helpful advises ondata reduction and spectrum analysis with IRAF. MKwas supported by the Foundation for Polish Sciencethrough a FOCUS grant and fellowship, by the PolishMinistry of Science and Higher Education through grantsN203 005 32/0449 and 1P03D 021 29. MG acknowl-edges support by Polish KBN grant no. 1P03d 017 27and SALT International Network grant no. 76/E-60/SPB/MSN/P-03/DWM 35/2005-2007. This paperuses observations made at the South African Astronom-ical Observatory (SAAO).The authors wish to recognize and acknowledge the verysignificant cultural role and reverence that the summit ofMauna Kea has always had within the indigenous Hawai-ian community. We are most fortunate to have the op-portunity to conduct observations from this mountain.Facilities: Keck:I (HIRES), Radcliffe (Grating Spec-
trograph)
REFERENCES
Abt, H. A., Levato, H., & Grosso, M. 2002, ApJ, 573, 359Adam, A. G., Barnes, M., Berno, B., Bower, R. D., & Merer, A.
J. 1995, Journal of Molecular Spectroscopy, 170, 94Adams, A., Klemperer, W., & Dunn, T. M. 1968, Canadian
Journal of Physics, 46, 2213Barsukova, E., Goranskij, V., Abolmasov, P., & Fabrika, S. 2006,
ATel, 803Bernard, A., Bacis, R., & Luc, P. 1979, ApJ, 227, 338Bernard, A., & Gravina, R. 1983, ApJ, 52, 443Bond, H. E. 2006, ATel, 966Chauville, J., Zorec, J., Ballereau, D. et al. 2001, A&A, 378, 861Cheung, A. S-C., Hajigeorgiou, P. G., Huang, G., Huang, S.-Z., &
Merer, A. J. 1994, Journal of Molecular Spectroscopy, 163, 443Cheung, A. S-C., Hansen, R.C., & Merer, A.J. 1982, Journal of
Molecular Spectroscopy, 91, 165Cowley, C. R. 1995, An Introduction to Cosmochemistry
(Cambridge: Cambridge Univ. Press)Coxon, J. A., & Naxakis, S. 1985, Journal of Molecular
Spectroscopy, 111, 102Crause, L. A., Lawson, W. A., Kilkenny, D., et al. 2003, MNRAS,
341, 785Goranskij, V. 2006, ATel, 964Hauschildt, P. H., Allard, F., Ferguson, J., Baron, E., &
Alexander, D. R. 1999, ApJ, 525, 871Henden, A., Munari, U., & Navasardyan, H. 2006, IAU Circ. 8655Herbig, G. H. 1974, ApJ, 188, 533Herbig, G. H. 1975, ApJ, 196, 129Herbig, G. H. 1993, ApJ, 407, 142Herbig, G. H. 1995, ARA&A, 33, 19Hocking, W. H., Gerry, M. C. L., & Merer, A. J. 1979, Canadian
Journal of Physics, 57, 54Iben, I. Jr., & Tutukov, A. V. 1992, ApJ, 389, 369Jørgensen, U. G. 1994, A&A, 284, 179Karlsson, L., Lindgren, B., Lundevall, C., & Sassenberg, U. 1997,
Journal of Molecular Spectroscopy, 181, 274Kimeswenger, S., Lederle, C., Schmeja, S., & Armsdorfer, B.
2002, MNRAS, 336, L43Kipper, T., Klochkova, V. G., Annuk, K. et al. 2004, A&A, 416,
1107Kipper, T., & Skoda, P. 2007, in ASP Conf. Ser. 363, The Nature
of V838 Mon and its Light Echo, ed. R. L. M. Corradi & U.Munari (San Francisco: ASP), 231
Kopp, I., Lindgren, R., Rydh, B. 1974, Table of Band Features ofDiatomic Molecules in Wavelength Order (Stockholm: Univ.Stockholm)
Kovacs, I. 1969, Rotational Structure in the Spectra of DiatomicMolecules (London: Adam Hilger Ltd.)
Lanz, T., & Hubeny, I. 2007, ApJS, 169, 83Lawlor, T. M. 2005, MNRAS, 361, 695
Le Roy, R. J., 2004, Univ. of Waterloo Chemical Physics ResearchReport CP-657R, 2004
Le Roy, R. J., 2007, Univ. of Waterloo Chemical Physics ResearchReport CP-663, 2007
Massey, P. 1997, A User’s Guide to CCD Reductions with IRAF,http://iraf.net/irafdocs/
Moore, C. E. 1945, A Multiplet Table of Astrophysical Interest,Contributions from the Princeton University ObservatoryNo.20 (Princeton: Princeton Univ. Obs.)
Munari, U., Corradi, R. L. M., Henden, A. et al. 2007, A&A, 474,585
Munari, U., Desidera, S. & Henden, A. 2002a, IAU Circ., 8005Munari, U., Henden, A., Kiyota, S., et al. 2002b, A&A, 389, L51Munari, U., Henden, A., Vallenari, A. et al. 2005, A&A, 434, 1107Partridge, H., Langhoff, S. R., Lengsfield III, B. H., & Liu, B.
1983, J. Quant. Spectrosc. Rad. Transfer, 30, 449Phillips, J. G. 1973, ApJS, 26, 313Plez, B. 1998, A&A, 337, 495Ram, R. S., Bernath, P. F., Dulick, M., & Wallace, L. 1999,
ApJS, 122, 331Rice, S. F., & Field, R. W. 1986, Journal of Molecular
Spectroscopy, 119, 331Schwenke, D. W. 1998, Chemistry and Physics of Molecules and
Grains in Space. Faraday Discussions No. 109, 321Soker, N. & Tylenda, R. 2003, ApJ, 582, L105Stringat, R., Athenour, C., & Femenas, J. L. 1972, Can. J. Phys.
50, 395Suzuki, N., Tytler, D., Kirkman, D., O’Meara, J. M., & Lubin, D.
2003, PASP, 115, 1050Tonry, J. & Davis, M. 1979, AJ, 84, 1511Tylenda, R. 2005, A&A, 436, 1009Tylenda, R. & Soker, N. 2006, A&A, 451, 223van Dokkum, P.G. 2001, PASP, 113, 1420Vogt, S.S., Allen, S. L., Bigelow, B. C. et al. 1994, Proc. SPIE,
2198, 362Whiting, E. E., Paterson, J. A., Kovacs, I., & Nicholls, R. W.
1973, Journal of Molecular Spectroscopy, 47, 84

Keck/HIRES spectrum of V838 Mon 17
TABLE 1Identified emission lines
λairlab (A) Ion Multiplet Flux Notes
3883.820 [Fe II]? 24F · · · a3993.059 [Ni II]? 4F · · · · · ·4101.734 Hδ 1 · · · · · ·
4177.196 [Fe II] 21F 3.355e–15 b4201.172 [Ni II]? 3F · · · · · ·4243.969 [Fe II] 21F 5.028e–14 c,d4244.813 [Fe II] 21F 1.448e–14 c,d4276.829 [Fe II] 21F 5.469e–14 · · ·
4287.394 [Fe II] 7F 1.423e–13 · · ·
4305.890 [Fe II] 21F 1.292e–14 · · ·
4319.619 [Fe II] 21F 2.852e–14 · · ·
4326.237 [Ni II]? 3F · · · · · ·4340.464 Hγ 1 · · · · · ·
4346.852 [Fe II] 21F · · · c4352.778 [Fe II] 21F 2.448e–14 · · ·
4358.360 [Fe II] 21F 2.842e–14 d4359.333 [Fe II] 7F 1.022e–13 d4372.427 [Fe II] 21F 2.940e–14 · · ·4382.742 [Fe II] 6F · · · · · ·
4413.781 [Fe II] 7F 1.109e–13 c,d4416.266 [Fe II] 6F 5.579e–14 c,d4432.447 [Fe II] 6F · · · · · ·
4452.098 [Fe II] 7F 3.221e–14 · · ·
4457.945 [Fe II] 6F 2.627e–14 · · ·
4474.904 [Fe II] 7F 1.817e–14 · · ·
4488.749 [Fe II] 6F 8.752e–15 · · ·
4492.634 [Fe II] 6F 4.873e–15 b4509.602 [Fe II] 6F 7.680e–15 e4514.900 [Fe II] 6F 6.475e–15 e4639.667 [Fe II] 4F 1.049e–14 f4664.440 [Fe II] 4F 3.666e–15 e4728.068 [Fe II] 4F 2.069e–14 · · ·
4774.718 [Fe II] 20F 1.120e–14 · · ·
4814.534 [Fe II] 20F 4.495e–14 · · ·4861.325 Hβ 1 · · · · · ·
4874.485 [Fe II] 20F 1.459e–14 · · ·
inter-chip gap
4973.388 [Fe II] 20F 1.836e–14 g5005.512 [Fe II] 20F 2.225e–14 · · ·
5018.440 Fe II 42 2.570e–14 c,d5020.233 [Fe II] 20F 1.163e–14 c,d5041.024 Si II? 5 · · · · · ·5043.519 [Fe II] 20F · · · · · ·
5055.984 Si II? 5 · · · c5056.317 Si II? 5 · · · c5158.001 [Fe II] 18F 3.723e–14 c,d5158.777 [Fe II] 19F 2.433e–14 c,d5163.951 [Fe II] 35F · · · · · ·
5169.033 Fe II 42 2.411e–14 · · ·
5181.948 [Fe II] 18F 6.598e–15 · · ·5184.788 [Fe II] 19F 1.915e–15 b5197.902 [N I] 1F · · · h5220.059 [Fe II] 19F 1.203e–14 g5261.621 [Fe II] 19F 2.979e–14 f5268.874 [Fe II] 18F · · · · · ·
5273.346 [Fe II] 18F 5.160e–14 f5333.646 [Fe II] 19F 2.506e–14 f5347.653 [Fe II] 18F · · · c5376.452 [Fe II] 19F 2.388e–14 · · ·5477.241 [Fe II] 34F 8.680e–15 g5527.609 [Fe II] 34F 1.677e–14 g5577.339 [O I] 3F · · · · · ·
5746.966 [Fe II] 34F 1.329e–14 · · ·
6300.304 [O I] 1F · · · · · ·
6363.776 [O I] 1F · · · · · ·
inter-chip gap
7155.160 [Fe II] 14F 3.861e–15 · · ·
Note. — The integrated line fluxes were measuredon dereddened spectra and they are given in units oferg cm−2 s−1.a multiplet 24 absent in NISTb weak line; flux uncertainc blendd flux measurement obtained with a deblending proceduree line with poorly define profile; flux uncertainf difficult to define continuum; flux uncertaing possible contribution to the flux from a molecular bandh blend with [N I] 5200.257 A?

18 Kaminski et al.
TABLE 2P-Cyg and absorption lines
λairlab (A) Ion Multiplet Profile type Notes
3933.663 Ca II K 1 absorption a3968.468 Ca II H 1 absorption a4254.332 Cr I 1 absorption b4274.796 Cr I 1 absorption b4289.716 Cr I 1 absorption b4545.945 Cr I 10 absorption · · ·4554.033 Ba II? 1 absorption c4571.096 Mg I 1 P-Cygni d4580.043 Cr I 10 absorption · · ·4613.357 Cr I 21 absorption · · ·4616.120 Cr I 21 absorption · · ·4646.148 Cr I 21 absorption e4651.282 Cr I 21 absorption e
inter-chip gap
5060.078 Fe I 1 absorption · · ·5110.413 Fe I 1 P-Cygni f5127.681 Fe I? 1 absorption · · ·5147.479 Ti I 4 absorption g5152.185 Ti I 4 absorption g5204.506 Cr I 7 absorption e5206.038 Cr I 7 absorption e5208.419 Cr I 7 P-Cygni? e5247.049 Fe I? 1 absorption · · ·5264.157 Cr I 18 absorption e5265.723 Cr I 18 absorption e5296.691 Cr I 18 absorption e5298.277 Cr I 18 P-Cygni e5300.744 Cr I 18 absorption · · ·5345.801 Cr I 18 absorption e5348.312 Cr I 18 absorption e5394.676 Mn I 1 P-Cygni · · ·5409.772 Cr I 18 P-Cygni · · ·5426.237 Ti I 3 absorption g?5432.546 Mn I 1 P-Cygni · · ·5535.481 Ba I 2 P-Cygni · · ·5698.520 V I 35 absorption · · ·5703.580 V I 35 absorption · · ·5706.980 V I 35 absorption · · ·5727.050 V I 35 absorption e5727.650 V I 35 absorption e5889.951 Na I D2 1 absorption a5895.924 Na I D1 1 absorption a6102.723 Ca I 3 absorption · · ·6122.217 Ca I 3 absorption · · ·
inter-chip gap
6551.676 Fe I 13 absorption · · ·6556.062 Ti I? 102 absorption · · ·6572.779 Ca I 1 P-Cygni · · ·6707.761 Li I 1 absorption e,h6707.912 Li I 1 absorption e,h7364.097 Ti I? 97 absorption · · ·7698.974 K I 1 P-Cygni · · ·7800.268 Rb I 1 P-Cygni · · ·7947.603 Rb I 1 P-Cygni? · · ·
Note. — Photospheric signatures of the B3V companionare not included.a ISM featureb weak line; flux uncertainc Cs I 4555.8 A resonance line?d absorption component very weake blendf emission component weakg two separated componentsh P-Cygni profile?

Keck/HIRES spectrum of V838 Mon 19
TABLE 3Identified molecular bands
λobs λlab Molecule Electronic Feature Vel. Ref. Notes(A) (A) transition (km s−1)
4420.5 4421.521 TiO α (4,0) R2 14469.4 4470.54 AlO B2Σ+ – X2Σ+ (2,0) R 24494.8 4494.04 AlO B2Σ+ – X2Σ+ (3,1) R 24517.5 4516.40 AlO B2Σ+ – X2Σ+ (4,2) R 24582.5 4584.056 TiO α (3,0) R2 14624.8 4626.08 TiO α (4,1) R2 14647.7 4648.23 AlO B2Σ+ – X2Σ+ (1,0) R 24671.7 4672.02 AlO B2Σ+ – X2Σ+ (2,1) R 24694.5 4694.62 AlO B2Σ+ – X2Σ+ (3,2) R 24715.4 4715.54 AlO B2Σ+ – X2Σ+ (4,3) R 24736.0 4735.82 AlO B2Σ+ – X2Σ+ (5,4) R 24738.0 4737.460 TiO c1Φ – X3∆ (0,0) R13 24754.4 4754.29 AlO B2Σ+ – X2Σ+ (6,5) R +58 ± 10 24757.9 4759.005 46Ti16O α (2,0) R2 –67 ± 6 3 a4759.1 4759.973 47Ti16O α (2,0) R2 3· · · 4760.902 48Ti16O α (2,0) R2 3
4803.0 4804.333 TiO α (3,1) R2 1 b4840.95 4842.27 AlO B2Σ+ – X2Σ+ (0,0) R2 –82 ± 6 24952.6 4954.562 TiO α (1,0) R2 –119 ± 6 14997.9 4999.129 TiO α (2,1) R2 15044.9 5044.501 TiO α (3,2) R2 45078.0 5079.36 AlO B2Σ+ – X2Σ+ (0,1) R –82 ± 6 25100.7 5102.13 AlO B2Σ+ – X2Σ+ (1,2) R –82 ± 6 25122.0 5123.33 AlO B2Σ+ – X2Σ+ (2,3) R –82 ± 6 55143.7 5142.89 AlO B2Σ+ – X2Σ+ (3,4) R +48 ± 12 25161.8 5160.98 AlO B2Σ+ – X2Σ+ (4,5) R +48 ± 12 25164.6 5166.753 TiO α (0,0) R2 –125 ± 12 1 c5227.4 5228.2 VO C4Σ− – X4Σ− (2,0) R4 –45 ± 12 25276 5275.8 VO C4Σ− – X4Σ− (3,1) 25308.4 5307.337 TiO α (3,3) R2 45312 5310.928 TiO α (3,3) R3 45319.0 5319.746 TiO γ′ (3,0) R1 4 d5320.4 5321.111 TiO γ′ (3,0) Q1 4 d5338.6 5341.240 TiO γ′ (3,0) R2 4 d5340.4 5343.223 TiO γ′ (3,0) Q2 4 d5356.5 5355.975 TiO α (4,4) R2 45361.5 5363.528 TiO γ′ (3,0) R3 4 d5365.0 5367.167 TiO γ′ (3,0) Q3 4 d· · · 5376.83 AlO B2Σ+ – X2Σ+ (2,4) R 2· · · 5411.960 TiO γ′ (4,1) R3 4· · · 5415.639 TiO γ′ (4,1) Q3 4
5447.2 5448.233 TiO α (0,1) R2 –57 ± 18 15467.9 5469.3 VO C4Σ− – X4Σ− (1,0) R4 –77 ± 12 25497.7 5496.742 TiO α (1,2) R2 +55 ± 12 15500.4 5499.741 TiO α (1,2) R3 +36 ± 12 1· · · 5517.3 VO C4Σ− – X4Σ− (2,1) R4 2· · · 5546.041 TiO α (2,3) R2 1
5562.1 5562.130 TiO γ′ (2,0) SR21 55568.9 5569.089 TiO γ′ (2,0) R1 55591.4 5592.609 TiO γ′ (2,0) R2 55616.4 5616.792 TiO γ′ (2,0) R3 55640.3 5640.849 TiO γ′ (3,1) R2 55662.0 5662.223 TiO β (2,2) R 55662.8, 5665.0 5665.19 TiO γ′ (3,1) R3 55669.5 5669.966 TiO γ′ (3,1) Q3 55688.5 5689.640 TiO γ′ (4,2) R2 55691.3 5692.270 TiO γ′ (4,2) Q2 55713.8 5714.805 TiO γ′ (4,2) R3 55718.4 5719.223 TiO γ′ (4,2) Q3 55735.2 5736.703 VO C4Σ− − X4Σ− (0,0) R4 –78 ± 6 25759.4, 5760.4 5758.741 TiO α (0,2) R2 35773.2 5772.74 ScO A2Π3/2 – X2Σ+ (2,1) RQ21 2 e· · · 5811.60 ScO A2Π1/2 – X2Σ+ (2,1) Q1 2 e
5811.0 5809.872 TiO α (1,3) R2 35827.7 5827.024 TiO γ′ (1,0) R31 35837.3 5839.005 TiO γ′ (1,0) R21 –58 ± 10 3· · · 5847.593 TiO γ′ (1,0) R1 3
5948.2 5947.680 TiO γ′ (2,1) R3 35956.2 5954.419 TiO γ′ (2,1) Q3 35972.5 5972.17 YO A2Π3/2 − X2Σ+ (0,0) RQ21 –8 ± 5 2

20 Kaminski et al.
TABLE 3 — Continued
λobs λlab Molecule Electronic Feature Vel. Ref. Notes(A) (A) transition (km s−1)
5978.5 5977.433 TiO γ (3,0) R3 35980.8 · · · YO A2Π3/2 − X2Σ+ (0,0) –8 ± 5 9
5988.8 5987.72 YO A2Π3/2 − X2Σ+ (1,1) RQ21 +58 ± 5 25999.2 6001.151 TiO γ (3,0) R2 36027.8 6028.184 TiO γ (3,0) R1 36034.4 6036.17 ScO A2Π – X2Σ+ (0,0) RQ2G + RR2G –55 ± 10 2· · · 6036.684 TiO γ (4,1) R3 3
6061.9 6060.782 TiO γ (4,1) R2 +55 ± 5 56065.2 6064.31 ScO A2Π – X2Σ+ (0,0) RR1G +45 ± 10 2· · · 6072.65 ScO A2Π – X2Σ+ (1,1) RQ2G 2
6077.5 6079.30 ScO A2Π – X2Σ+ (0,0) QQ1G + QR1G –55 ± 10 2· · · 6088.245 TiO γ (4,1) R1 3
6116.0 6115.97 ScO A2Π – X2Σ+ (1,1) QQ1G+QR1G 26130.8 6132.097 YO A2Π1/2 – X2Σ+ (0,0) RQ21 9
6135.0 6134.472 TiO γ′ (0,0) T R31 36144.5 · · · TiO γ′ (0,0) SQ31
6146.9 6148.68 TiO γ′ (0,0) SR21 –90 ± 10 66157.1 6158.52 TiO γ′ (0,0) R1 66185.1 6186.32 TiO γ′ (0,0) R2 6· · · 6189.65 TiO γ′ (0,0) Q2 6
6213.4 6214.93 TiO γ′ (0,0) R3 66220.9 6222.26 TiO γ′ (0,0) Q3 –70 ± 10 66269.2 6268.86 TiO γ′ (1,1) R3 0 ± 15 56276.3 6276.03 TiO γ′ (1,1) Q3 0 ± 15 56293.2 6294.80 TiO γ (2,0) R3 56319.4 6321.21 TiO γ (2,0) R2 –77 ± 5 56349.5 6351.29 TiO γ (2,0) R1 –80 ± 5 5· · · 6357.33 TiO γ (3,1) R3 5
6384.5 6384.18 TiO γ (3,1) R2 +58 ± 5 56410.2 6408.26 ScO A2Π3/2 – X2Σ+ (0,1) RQ2G+RR2G 2 f6415.1 6414.75 TiO γ (3,1) R1 +58 ± 5 56459.6 6457.78 ScO A2Π1/2 – X2Σ+ (0,1) QQ1G+QR1G 2 f6448.9 · · · TiO γ (4,2) R2
6649.3 6651.271 TiO γ (1,0) R3 16679.1 6680.796 TiO γ (1,0) R2 16712.5 6714.477 TiO γ (1,0) R1 1· · · 6717.599 TiO γ (2,1) R3 1
6747.0 6747.613 TiO γ (2,1) R2 16781.1 6781.815 TiO γ (2,1) R1 1· · · 6784.560 TiO γ (3,2) R3 1
6815.9 6815.139 TiO γ (3,2) R2 16832.2 6832.596 TiO b1Π – X3∆ R –82 ± 8 3 g6838.9 6838 TiO b1Π – X3∆ Q,P 36849.9 6849.927 TiO γ (3,2) R1 16884.3 6885.25 VO B4Π – X4Σ− (2,0) T R42 26892.0 6893.86 VO B4Π – X4Σ− (2,0) SQ42 26935.8 6937. VO B4Π – X4Σ− (2,0)6950.9 6952.39 VO B4Π – X4Σ− (2,0)6977.9 6978.51 VO B4Π – X4Σ− (2,0)6986.6 6985.59 VO B4Π – X4Σ− (2,0)7003.5 7003.40 TiO γ (0,0) SR32 47037.8 7038.28 TiO γ (0,0) SR21 4· · · 7054.256 TiO γ (0,0) R3 1
7085.5 7087.566 TiO γ (0,0) R2 1· · · 7124.930 TiO γ (1,1) R3 1
7123.4 7125.510 TiO γ (0,0) R1 1· · · 7158.850 TiO γ (1,1) R2 1
7231.8 7230.774 TiO γ (2,2) R2 37270.9 7269.985 TiO γ (2,2) R1 37332.5 7333.93 VO B4Π – X4Σ− (1,0) T R42 –60 ± 8 7 h7371.5 7372.70 VO B4Π – X4Σ− (1,0) SQ31 –60 ± 8 7 h· · · 7381.70 VO B4Π – X4Σ− (1,0) RP31 7· · · 7393.34 VO B4Π – X4Σ− (1,0) SR21 7· · · 7405 VO B4Π – X4Σ− (1,0) 7· · · 7416.13 VO B4Π – X4Σ− (1,0) QP21 7· · · 7433.79 VO B4Π – X4Σ− (1,0) R1 7· · · 7442.9 VO B4Π – X4Σ− (1,0) 7
7453.8 7455.2 VO B4Π – X4Σ− (1,0) 7· · · 7474 VO B4Π – X4Σ− (2,1) +58 ± 8 7 h
7589.8 7589.284 TiO γ (0,1) R3 1

Keck/HIRES spectrum of V838 Mon 21
TABLE 3 — Continued
λobs λlab Molecule Electronic Feature Vel. Ref. Notes(A) (A) transition (km s−1)
7627.5 7627.799 TiO γ (0,1) R2 17704.2 7704.997 TiO γ (1,2) R2 17744.4 7743.056 TiO γ (2,3) R3 17750.9 7749.487 TiO γ (1,2) R1 17783.8 7782.854 TiO γ (2,3) R2 17863.20 7865.29 VO B4Π – X4Σ− (0,0) SQ42 –80 ± 4 8 h7894.20 7896.38 VO B4Π – X4Σ− (0,0) SQ31 –80 ± 4 8 h7905.72 7907.80 VO B4Π – X4Σ− (0,0) RP31 –80 ± 4 8 h· · · 7919.12 VO B4Π – X4Σ− (0,0) SR21 8
7937.55 7939.62 VO B4Π – X4Σ− (0,0) R2 –80 ± 4 8 h· · · 7950.29 VO B4Π – X4Σ− (0,0) QR23 8
References. — (1) Phillips (1973); (2) Kopp et al. (1974); (3) Schwenke (1998); (4) Plez (1998); (5) Jørgensen (1994);(6) Hocking et al. (1979); (7) Cheung et al. (1994); (8) Adam et al. (1995); (9) Bernard & Gravina (1983).a After correcting the laboratory wavelength from Phillips (1973) for the isotopic shift, as found from data in Schwenke (1998),one gets for the isotopomer 46TiO the predicted stationary wavelength of 4759.205 A and the velocity of –80 km s−1.b The bandhead is strongly contaminated by the rotational structure of the α (2,0) band of TiO in the range 4793–4803 A.c The bandhead is blended with two Fe I absorption lines at 5166.286 A and 5168.901 A. However, the blue edge of the blendshould be formed by molecular absorption. The velocity given in the table is for the 46TiO isotopomer (laboratory wavelengthconcluded from Schwenke 1998).d All databases give different laboratory wavelengths.e The band is probably contaminated by the A2Π1/2–X
2Σ+ (1,0) Q1 feature of ScO.f In emission.g Velocity determined in simulations, see Fig. 14 for details.h In the table the velocity of the blueshifted component of VO is given. The fit to all features of the VO (1,0) and (0,0) bandsindicates a velocity of –2 kms−1.