fifth grade math enhanced scope and sequence - vdoe enhanced scope and sequence Πgrade ... their...
TRANSCRIPT

MATHEMATICS STANDARDS OF LEARNING ENHANCED SCOPE AND SEQUENCE
Grade 5
Commonwealth of Virginia Department of Education
Richmond, Virginia 2004

Copyright © 2004 by the Virginia Department of Education P.O. Box 2120 Richmond, Virginia 23218-2120 http://www.pen.k12.va.us/ All rights reserved. Reproduction of materials contained herein for instructional purposes in Virginia classrooms is permitted. Superintendent of Public Instruction Jo Lynne DeMary Assistant Superintendent for Instruction Patricia I. Wright Office of Elementary Instructional Services Linda M. Poorbaugh, Director Karen W. Grass, Mathematics Specialist Office of Middle Instructional Services James C. Firebaugh, Director Office of Secondary Instructional Services Maureen B. Hijar, Director Deborah Kiger Lyman, Mathematics Specialist Edited, designed, and produced by the CTE Resource Center Margaret L. Watson, Administrative Coordinator Anita T. Cruikshank, Writer/Editor Richmond Medical Park Phone: 804-673-3778 2002 Bremo Road, Lower Level Fax: 804-673-3798 Richmond, Virginia 23226 Web site: http://CTEresource.org The CTE Resource Center is a Virginia Department of Education grant project administered by the Henrico County Public Schools. NOTICE TO THE READER
In accordance with the requirements of the Civil Rights Act and other federal and state laws and regulations, this document has been reviewed to ensure that it does not reflect stereotypes based on sex, race, or national origin.
The Virginia Department of Education does not unlawfully discriminate on the basis of sex, race, age, color, religion, handicapping conditions, or national origin in employment or in its educational programs and activities.
The content contained in this document is supported in whole or in part by the U.S. Department of Education. However, the opinions expressed herein do not necessarily reflect the position or policy of the U.S. Department of Education, and no official endorsement by the U.S. Department of Education should be inferred.
Mathematics Enhanced Scope and Sequence � Grade Five
Virginia Department of Education 2004 i
Introduction The Mathematics Standards of Learning Enhanced Scope and Sequence is a resource intended to help teachers align their classroom instruction with the Mathematics Standards of Learning that were adopted by the Board of Education in October 2001. The Mathematics Enhanced Scope and Sequence is organized by topics from the original Scope and Sequence document and includes the content of the Standards of Learning and the essential knowledge and skills from the Curriculum Framework. In addition, the Enhanced Scope and Sequence provides teachers with sample lesson plans that are aligned with the essential knowledge and skills in the Curriculum Framework. School divisions and teachers can use the Enhanced Scope and Sequence as a resource for developing sound curricular and instructional programs. These materials are intended as examples of how the knowledge and skills might be presented to students in a sequence of lessons that has been aligned with the Standards of Learning. Teachers who use the Enhanced Scope and Sequence should correlate the essential knowledge and skills with available instructional resources as noted in the materials and determine the pacing of instruction as appropriate. This resource is not a complete curriculum and is neither required nor prescriptive, but it can be a valuable instructional tool. The Enhanced Scope and Sequence contains the following: • Units organized by topics from the original Mathematics Scope and Sequence • Essential knowledge and skills from the Mathematics Standards of Learning Curriculum
Framework • Related Standards of Learning • Sample lesson plans containing
° Instructional activities ° Sample assessments ° Follow-up/extensions ° Related resources ° Related released SOL test items.
Mathematics Enhanced Scope and Sequence � Grade Five
Virginia Department of Education 2004 ii
Acknowledgments
Marcie Alexander Chesterfield County Marguerite Mason
College of William and Mary
Melinda Batalias Chesterfield County Marcella McNeil
Portsmouth City
Susan Birnie Alexandria City Judith Moritz
Spotsylvania County
Rachael Cofer Mecklenburg County Sandi Murawski
York County
Elyse Coleman Spotsylvania County Elizabeth O�Brien
York County
Rosemarie Coleman Hopewell City William Parker
Norfolk State University
Sheila Cox Chesterfield County Lyndsay Porzio
Chesterfield County
Debbie Crawford Prince William County Patricia Robertson
Arlington City
Clarence Davis Longwood University Christa Southall
Stafford County
Karen Dorgan Mary Baldwin College Cindia Stewart
Shenandoah University
Sharon Emerson-Stonnell Longwood University Susan Thrift
Spotsylvania County
Ruben Farley Virginia Commonwealth University Maria Timmerman
University of Virginia
Vandivere Hodges Hanover County Diane Tomlinson
AEL
Emily Kaiser Chesterfield County Linda Vickers
King George County
Alice Koziol Hampton City Karen Watkins
Chesterfield County
Patrick Lintner Harrisonburg City Tina Weiner
Roanoke City
Diane Leighty Powhatan County Carrie Wolfe
Arlington City
Mathematics Enhanced Scope and Sequence � Grade Five
Virginia Department of Education 2004 1
Organizing Topic Whole Numbers: Operations and Estimation � Addition, Subtraction, Multiplication, Division
Standards of Learning
5.3 The student will create and solve problems involving addition, subtraction, multiplication, and division of whole numbers, using paper and pencil, estimation, mental computation, and calculators.
5.5 The student, given a dividend of four digits or fewer and a divisor of two digits or fewer, will find the quotient and remainder.
Essential understandings, Correlation to textbooks and
knowledge, and skills other instructional materials
The student will use problem solving, mathematical communication, mathematical reasoning, connections, and representations to
• Create problems involving the operations of addition, subtraction, multiplication, and/or division of whole numbers, using real-life situations.
• Estimate the sum, difference, product, and quotient of whole-number computations.
• Solve problems involving addition, subtraction, multiplication, and division of whole numbers, using paper and pencil, mental computation, and calculators, in which ° sums, differences, and products will not exceed five
digits; ° multipliers will not exceed two digits; ° divisors will not exceed two digits; or ° dividends will not exceed four digits.
• Estimate the quotient of two whole numbers when given a dividend of four digits or fewer and a divisor of two digits or fewer.
• Determine the quotient with no remainder of two whole numbers when given a dividend of four digits or fewer and a divisor of two digits or fewer.
• Determine the quotient and remainder of two whole numbers when given a dividend of four digits or fewer and a divisor of two digits or fewer.
• Use estimation to check the reasonableness of a quotient.

Mathematics Enhanced Scope and Sequence � Grade Five
Virginia Department of Education 2004 2
Party Time Reporting category Computation and Estimation Overview Students estimate the cost of purchasing selected items and then
use pencil/paper to compute the actual cost. Related Standards of Learning 5.3, 5.5 Objectives • Students will estimate the cost of buying supplies for a class party. • Students will use addition, subtraction, and multiplication to determine the cost of the party, given
a set budget. Materials needed • An overhead transparency of �Bundle of Books� flyer • �Party Time,� one copy for each student • Catalogues and sale flyers • Pencil and paper Instructional Activities 1. Review the process of estimating sums, differences, and products, using rounding. 2. Tell the students that you have $50.00 to spend on new books for the classroom. Show the �Bundle
of Books� flyer. Have students read the flyer and then as a class start selecting books that they would like to purchase. Demonstrate how to estimate the cost after each item is selected. Have them stop when they are close to $50.00 Have each student compute the actual cost of the books selected and the amount of money that would be left over.
3. Tell the students that they will be planning an end-of �the-year party for the class. They have $100.00 to spend on food, decorations, and games. Distribute the �Party Time� worksheet that lists the cost of each item. Have students list the items they would select for the party. Have them use estimation to stop when they think they are close to the $100.00 total. Have students exchange papers with a partner. They should then use pencil and paper to figure the actual cost of the party and the amount of money left over. Discuss who came the closest to spending all the money without going over.
Sample assessment • Have the students reflect on the activity by answering the following questions.
° How did you decide which items to buy? ° How did you decide how many of each item to buy? ° What would you change in your plan if you only had $75.00 to spend?
• Use a simple 4-point rubric to assess the results. 4 points: ° Approaches the problem with an organized plan and uses number sense to solve the problem ° Finds a workable solution and explains the process 3 points: ° Uses a plan to approach the problem but has some errors

Mathematics Enhanced Scope and Sequence � Grade Five
Virginia Department of Education 2004 3
° Finds a workable solution but does not fully explain the process 2 points: ° Does not use an organized plan ° Finds a solution with help but cannot explain the process 1 point: ° Does not demonstrate an understanding of the problem ° Cannot find a solution
Follow-up/extension • Develop a weekly problem-of-the-week assignment. Assess students on the process of problem
solving � for example, paraphrasing the question, using a strategy, writing the answer in a sentence. Focus on a different strategy each week: draw a picture, make an organized list, work backward, guess and check, use a table or chart, or act out to model problem-solving steps.
• Bring in catalogues, sale flyers, and menus. Have the students use calculators to figure the cost of dinner out for their family. Have them choose gifts for their friends and family that would add up to $75.00.
• Have students search the Internet to select items to decorate a fantasy bedroom. �Purchase� furniture, electronics, or other items the students would like in the ultimate room. Keep a record of the purchases on a chart. Calculate totals and subtract from a given budget. Have students also determine how many hours of work it would take to pay for the items, given different hourly wages.
• Give students a set budget to plan a trip. Use the Internet to find hotel prices, car rentals, restaurant menus, and airline costs.
• Make a set of dominoes with different combinations of addition and multiplication problems. Students can then use the familiar game to build math skills by matching the two problems with the same answers.
• Multiplication War: Assign values to the J, Q, K cards, or remove from the deck. Each pair of students deals cards as if playing War. Each player flips two cards. They multiply the two numbers and announce their product. The player with the highest product wins the trick. Play for a set time. The player with the most cards wins.
• Use graph paper to help students align multiplication and division computation problems. • Use �think, pair, and share� when solving word problems as a class. After presenting a problem,
allow the students to think about how they would solve it, share their ideas with a partner, and then share ideas with the class. Students can solve the problems individually and then discuss their answer with their partner.
• Silent Ball Multiplication: Write the numbers 3-12 on the hexagons of a soccer ball. Have students stand in a circle and pass the ball. Whatever numbers a student�s thumbs land on when catching the ball are the numbers he or she multiplies together, saying the problem aloud (ex. 7 × 5 = 35). Students must sit down if they miss a problem or talk when they do not have the ball.

Mathematics Enhanced Scope and Sequence � Grade Five
Virginia Department of Education 2004 4
Huge Savings on Dictionary $ 9.90 Thesaurus $ 5.20 Complete set of
World Book encyclopedias $42.99 Paperback novels $0.99 each
Hundreds of titles including Poppy Hatchet Wait �til Helen Comes A Bundle of Sticks The B.F.G. Ghost Cadet Freedom Train Dead Man in Indian Creek

Mathematics Enhanced Scope and Sequence � Grade Five
Virginia Department of Education 2004 5
Party Time Remember, you have $100 to spend on items of your choice for an end-of-the-year party for our class. Number of students in our class: ______________
Food Hotdogs $2.00 each Soft drinks $3.99 per 12-pack Cookies $2.99 per dozen Napkins $1.34 for a package of 100 Paper plates $3.19 for a package of 20 Chips $1.87 per bag Fruit salad $4.12 per gallon Cake (large) $12.57 Decorations Helium balloons $6.79 per dozen Streamers $0.79 per package Plain balloons $1.19 per 100 Games Ring Toss $7.43 Charades $3.84 Beanbag toss $6.29
Item Selected Rounded Price # Needed Estimate

Mathematics Enhanced Scope and Sequence � Grade Five
Virginia Department of Education 2004 6
A Home on the Quotient Range Reporting category Computation and Estimation Overview Students arrange digits to create problems with targeted range Related Standard of Learning 5.5 Objectives • Students will use estimation to arrange digits in a division problem so the quotient will be in a
target range. • Students will solve division problems with two-digit divisors and four-digit dividends and check,
using the calculator. Materials needed • Decks of cards with the face cards removed, one deck for each pair of students • �Home on the Quotient Range,� one copy for each student • Paper and pencil • Calculator • Index cards Instructional activity 1. Pair students and distribute a copy of the directions and a deck of cards with the face cards
removed. Use joker cards for zero. 2. Go over the directions and model the activity. Select six cards and arrange the cards to create a
division problem with a 2-digit divisor and a 4-digit quotient. Ask students for suggestions on the arrangement. Tell students that the quotient needs to be between 1-50. Do several arrangements and have students solve the problems. Check with the calculator. Discuss estimation strategy and methods. Now try to rearrange the dividend and divisor digits so that the quotient is between 51 and 100 and then between 101 and 200. Give several examples so students can have guided practice.
3. Once students are ready for independent practice, allow student pairs to play the game outlined in the directions.
Sample assessment • Watch carefully as students follow your instructions. Answer all questions that they may ask.
Circulate to be sure that all students understand the directions. Ask students to verbalize strategy and method. When finished, distribute an index card to each student. Have students write a tip on how to play the game successfully. Share the tips with the class to conclude the activity.
Follow-up/extension • Modify the game by inserting a decimal into the dividend and changing the range targets. Sample resources http://standards.nctm.org/document/chapter5/numb.htm#bp1 � NCTM Principles and Standards for
School Mathematics, chapter on the Number and Operations Standard for Grades 3�5.

Mathematics Enhanced Scope and Sequence � Grade Five
Virginia Department of Education 2004 7
http://www.linkslearning.org/Teachers/1_Math/6_Learning_Resources/1_Illustrated_Lessons/3_Place_Value/index.html � Students work with place value using whole numbers as well as decimals. This interactive, computer-based lesson includes activities and assessments.
http://www.arcytech.org/java/b10blocks/description.html � Visual representations of base-10 place value and multi-digit operations, a valuable tool for teachers to use in class or for students to use on their own.
http://edweb.sdsu.edu/courses/edtec670/Cardboard/Card/N/NumberClub.html � Instructions for a card game that reinforces place value concepts.
http://www.naturalmath.com/mult/ � A tutorial to help students learn the multiplication facts.

Mathematics Enhanced Scope and Sequence � Grade Five
Virginia Department of Education 2004 8
Materials • A deck of cards with the face cards and 10s removed (use jokers for zero) • A calculator • Paper and pencil Directions Decide who will be player 1 and player 2 1. Player 1: Select six cards and arrange the digits to form a division problem with a 2-digit divisor
and a 4-digit dividend. For round one, arrange the digits so that your quotient is between 1 and 50. Solve your problem using paper and pencil.
2. Player 2: Use the calculator to check player 1�s answer. If the answer is correct, player 1 receives one point. If the quotient is in the targeted range, player 1 receives another point. Now player 2 selects 6 cards and the roles reverse.
3. After both players complete a round with the target 1�50, begin round 2 with the target 51�100. After round 2 has been completed, start round 3 with a target of 101�200.
To Win • The player with the most points after 3 rounds is the winner. • If there is a tie, play one more round with the target 1�50.
A Home on the Quotient Range
Mathematics Enhanced Scope and Sequence � Grade Five
Virginia Department of Education 2004 9
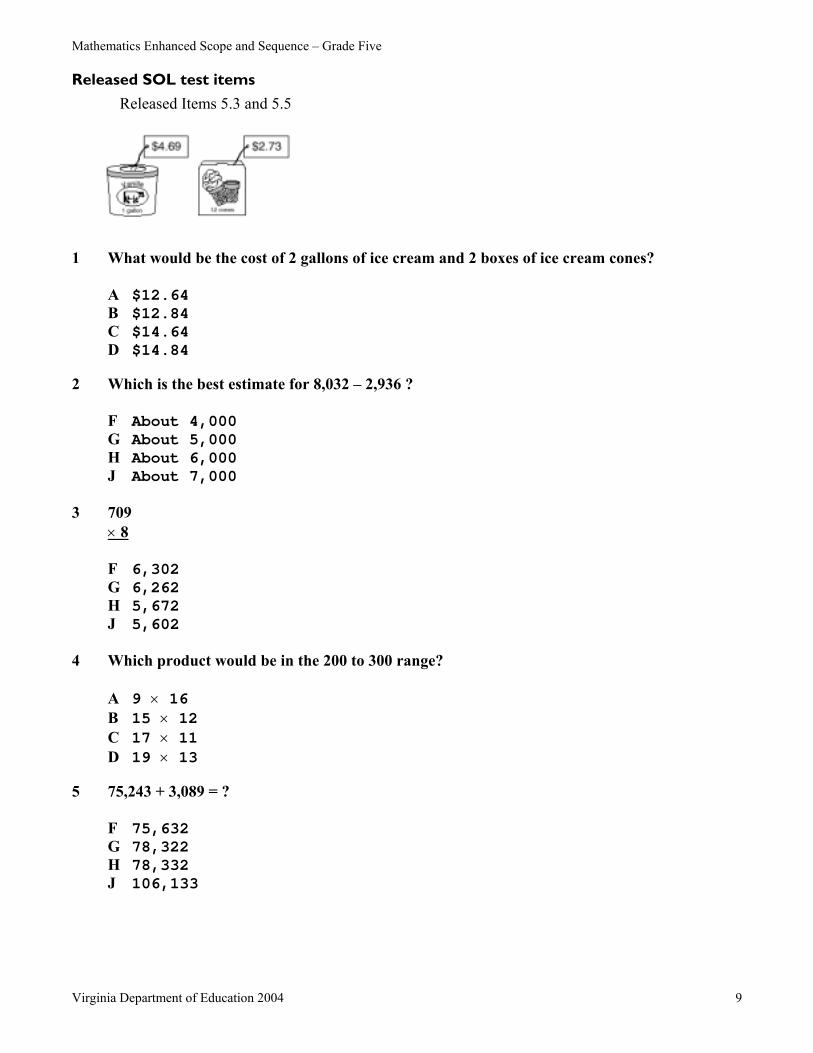
Released SOL test items Released Items 5.3 and 5.5
1 What would be the cost of 2 gallons of ice cream and 2 boxes of ice cream cones?
A $12.64 B $12.84 C $14.64 D $14.84
2 Which is the best estimate for 8,032 � 2,936 ?
F About 4,000 G About 5,000 H About 6,000 J About 7,000
3 709 × 8
F 6,302 G 6,262 H 5,672 J 5,602
4 Which product would be in the 200 to 300 range?
A 9 × 16 B 15 × 12 C 17 × 11 D 19 × 13
5 75,243 + 3,089 = ?
F 75,632 G 78,322 H 78,332 J 106,133

Mathematics Enhanced Scope and Sequence � Grade Five
Virginia Department of Education 2004 10
Organizing Topic Decimals: Representations, Relationships, Operations, Estimation � Addition, Subtraction, Multiplication and Division
Standards of Learning
5.1 The student will a) read, write, and identify the place values of decimals through thousandths; b) round decimal numbers to the nearest tenth or hundredth; and c) compare the values of two decimals through thousandths, using the symbols >, <,
or =.
5.2 The student will a) recognize and name commonly used fractions (halves, fourths, fifths, eighths, and tenths)
in their equivalent decimal form and vice versa. b) order a given set of fractions and decimals from least to greatest. Fractions will include like
and unlike denominators limited to 12 or less, and mixed numbers.
5.4 The student will find the sum, difference, and product of two numbers expressed as decimals through thousandths, using an appropriate method of calculation, including paper and pencil, estimation, mental computation, and calculators.
5.6 The student, given a dividend expressed as a decimal through thousandths and a single-digit divisor, will find the quotient.
Essential understandings, Correlation to textbooks and
knowledge, and skills other instructional materials
The student will use problem solving, mathematical communication, mathematical reasoning, connections, and representations to
• Identify the place values for each digit in decimals through thousandths.
• Read decimal numbers through thousandths from written words or place-value format.
• Write decimal numbers through thousandths from written words or from decimal numbers presented orally.
• Round decimal numbers to the nearest tenth or hundredth.
• Identify the symbols for the terms greater than, less than, and equal to.
• Compare the value of two decimal numbers through thousandths, using the symbols >, <, or =.
• Represent fractions (halves, fourths, fifths, eighths, and tenths) in their equivalent decimal form.
• Represent decimals in their equivalent fraction form (halves, fourths, fifths, eighths, and tenths).

Mathematics Enhanced Scope and Sequence � Grade Five
Virginia Department of Education 2004 11
• Determine equivalent relationships between decimals and fractions with denominators up to 12.
• Order from least to greatest a given set of no more than five numbers written as decimals and as fractions and mixed numbers with denominators of 12 or less.

Mathematics Enhanced Scope and Sequence � Grade Five
Virginia Department of Education 2004 12
Who�s the Greatest? Reporting category Number and Number Sense Overview Students correctly identify decimal numbers and compare the
values of two decimal numbers. Related Standard of Learning 5.1 Objectives • Students will read and write decimal numbers with values through the thousandths. • Students will compare the values of two decimal numbers. Materials needed • Dice, one die for each pair of students • �Who�s the Greatest� recording sheet, one copy for each student Instructional activity 1. Review place value through thousandths. Have students practice saying numbers aloud. 2. Distribute recording sheet to each student and a die to each pair of students. 3. Go over the rules of the game with the students. For the first game, each student will try to make
the greatest number possible. They will take turns rolling the die. After each roll, the student who rolled will record the number on the recording sheet. After each student has rolled four times, each will read the number he/she formed. The student with the greatest number wins.
4. Draw a number line on the board. Have each student come to the board and write their number in the correct place on the number line. Discuss any numbers that are out of order and place them where they belong.
5. Have students play again and record their results. 6. For the next two games, have students try to make the least number possible. The student with the
lesser number wins. 7. Next, play a class game. The teacher will specify two decimals numbers. The object of the game is
now to form a number that falls between the two numbers. The teacher will roll the die and each student will record the number on his or her sheet. After three rolls, have all students that have formed a number in the specified range call out their number. Have the class check to make sure all the numbers are correct.
8. Let the students play a game with their partner. Discuss the results of the game as a class. 9. As a review activity, play �What�s my number?� The teacher chooses a decimal number and gives
the class clues about that number. The clues should include vocabulary from the lesson. Example: 10.432 • My number has 5 digits. • The digit in the hundredths place is odd. • The largest digit is in the tenths place. • The sum of all the digits is 10. • The number in the tenths place is twice as large as the number in the thousandths place.
10. Continue giving clues until someone thinks they know the number. Have the students decide if the number meets the criteria in all the clues. If it is not the correct number, continue to give more clues until someone finds the correct number.

Mathematics Enhanced Scope and Sequence � Grade Five
Virginia Department of Education 2004 13
Sample assessment • Observe the students as they move through the classroom activity. Circulate and observe the
students� interaction. Answer any questions as necessary. Make sure they are saying the numbers correctly.
Follow-up/extension • Give the students two fractions and have them try to form a decimal number that is between the
two fractions. • Use index cards to write decimal numbers in standard form and word form. Place a card at each
desk. Play music and have students write another form of the number in their notebook. Turn off the music and have students move to the desk next to them. Continue until students return to their own desks.
• Purchase a set of plastic number magnets that families often have on the refrigerator. Make a place value chart on the board. Place the numbers on the chart and have students write the word name. Say the word name and have students come to the board and place the numbers in the correct position.
• Play equivalent fraction/decimal bingo. Give students a set of fractions in a bingo game board. Call out the equivalent decimal. Students must match the answer with one of the bingo positions.
Example: Call 0.5, and the student would have to know that 12 was a match.
• Make a set of cards with fraction and decimal equivalencies. Pair students and divide the cards. Have students play a war game with the winner being the player with the higher card. Assign a playoff round for getting equivalent fractions and decimal numbers. When finished, have students take five cards and order them from least to greatest.
• Count 100 days by using each day as one hundredth. Show the number written as a fraction and
decimal. For example, day 25 would be 0.25 and 25100 or
14. Color in a hundreds grid each day and
have students orally read the numbers. • Using a meter stick and several strips of adding machine tape cut to one meter, have students fold
adding machine tape in half, fourths, and eighths and then hold it next to a meter stick. Use the centimeter markings on the meter stick to determine the decimal equivalents.
• Have students use 100 pennies to find out how much various fractional parts of a dollar would be (use halves, fourths, eighths, fifths, and tenths). Students can then write the monetary amount using
decimal notation. Example: To find 34 of a dollar, students first divide 100 pennies into four equal
groups and then consider three of the groups. Since 14 is .25,
34 is .75.
• Display a long number line in the classroom. Write fractions (halves, fourths, eighths, fifths, and tenths) on one-color sticky notes and their decimal equivalents on another color sticky notes. Each day remove a couple of sticky notes and ask the students to name the missing fractions or decimal numbers.

Mathematics Enhanced Scope and Sequence � Grade Five
Virginia Department of Education 2004 14
Who�s the Greatest? Recording Sheet Game 1 (Greatest) . Game 2 (Greatest) . Game 3 (Least) . Game 4 (Least) . Game 5 (Between 0.2 & 1.0) 0. Game 6 (Between 0.2 & 0.8) 0.

Mathematics Enhanced Scope and Sequence � Grade Five
Virginia Department of Education 2004 15
Dewey Decimal Math Reporting category Number and Number Sense Overview Using books from the library, students order and compare decimal
numbers. Related Standards of Learning 5.1, 5.2 Objective • Students will read decimal numbers from books, compare and order decimal numbers using the
Dewey Decimal system. Materials needed • Books from the library divided into stations Instructional activity 1. Before the lesson, select books from the library and place them in stations around the room. 2. Review and discuss how to read decimal numbers. Read the whole number to the left of the
decimal point, if there is one; read the decimal point as and; read the digits to the right of the decimal point just as you would read a number; and say the name of the place value of the digit in the smallest place.
3. Review how to compare decimal numbers, and illustrate with several examples. 4. Explain and review the Dewey Decimal system in the library. Tell students that they will be
ordering the books by comparing the decimal numbers from the books. 5. Assign students to groups and have students read each decimal and then order it correctly. 6. Circulate among the groups and assist as needed. After an allotted time, have students mix up the
books and switch stations. Sample assessment • Watch carefully as students follow your instructions. Answer all questions that they may ask.
Circulate to be sure that all students understand the directions. Make sure each group member is participating by assigning group roles. Collect the handout and check for accuracy.

Mathematics Enhanced Scope and Sequence � Grade Five
Virginia Department of Education 2004 16
Decimal Multiplication Reporting categories Number and Number Sense, Computation and Estimation Overview Students use base-10 materials to model the multiplication of
decimal numbers. Related Standards of Learning 5.1, 5.4 Objective • Students will understand the multiplication of decimal numbers by using a base-10 model. Materials needed • Base-10 pieces or cardstock copies, one set for each student • Overhead base-10 pieces • Plain copy paper, one sheet for each student Instructional activity 1. Initiating Activity: Begin the activity by explaining to students that they will be using base-10
materials to learn about multiplication of decimal numbers. Distribute the base-10 materials and blank sheets of paper. Have students construct a place-value mat by folding the paper into three sections, labeling the sections with hundreds, tens, and ones. In order to review the use of the base-10 materials, have the students model a three-digit number, e.g., 284, by placing two flats in the hundreds place, eight rods in the tens place, and four squares in the ones place.
2. Review multiplication of whole numbers, using place-value pieces. Have students model such multiplication, using an array and whole numbers to show the multiplication of 3 ones by 3 ones.
3. Review multiplication of one-digit numbers by two-digit numbers, e.g., 7 × 12. Have the students
place the pieces representing seven ones on the bottom of the rectangular array and the pieces representing twelve ones (1 rod and 2 units) on the left side of the array. Then have them complete the rectangle created with the largest pieces (rods) first and then the units needed.
12 ones (1 ten and 2 ones)
7 ones

Mathematics Enhanced Scope and Sequence � Grade Five
Virginia Department of Education 2004 17
����������������������
������������
���������������������������������������������������������������������������������
���������������������������������������������������������������������������������
���������������������������������������������������������������������������������
4. Now students are ready to begin using the base-10 pieces to represent decimals. Ask students to suggest ways the base-10 pieces might be used to represent certain decimal numbers, for example, 1.23. Have the students turn over their place-value charts from the initiating activity and relabel the three columns with ones, tenths, and hundredths. Model how the flat now represents the ones, the rods now represent the tenths, and the units now represent the hundredths. They may also add a �decimal point� on the line between the ones and tenths columns. Have students practice representing other numbers on their decimal place-value chart before moving on to multiplication.
5. Model multiplying with decimals such as in the sample problem below. Have students create a rectangle by using 1.3 (1 flat and 3 rods) as the dimension across the top of the rectangular array and 2.5 (two flats and 5 rods) as the dimension along the side of the array.
6. Represent the multiplication in the following way:
1 × 2 = 2 (the two whole flats) 1 × .5 = .5 (5 rods) .3 × 2 = .6 (6 rods) .3 × .5 = .15 (15 unit pieces)
7. After combining pieces (exchanging the 11 rods for 1 flat and 1 rod, and the 15 unit pieces for 1 rod and 5 unit pieces), the total is 3 flats, 2 rods and 5 unit pieces, or 3.25.
8. Review the distributive property of multiplication with the students to relate this property to the previous problem. Have students continue to model the process with the following additional problems. Remind the students to build rectangles, using their base-10 pieces.
1.4 × 1.3 0.6 × 1.2 0.3 × 0.3 1.2 × 2.5 0.4 × 1.1
9. Call on individual students to model the problems for the class. 10. Ask each student to use the base-10 pieces to create a multiplication problem. Have each student
build his or her problem and record the numerical expression and representation of the problem, as well as the answer. Have students write their problems without the answers on sticky notes and switch notes with other students so that each student has a new problem to solve. Once the problems are solved, have students compare answers with the creators of the problems.
11. Closing Activity: Ask students to write about the process of multiplying decimals by using the problem (1.2 × 2.5) and the base-10 pieces. Have students record their explanations in their journal.
Sample assessment • Check on individual progress by evaluating the problems on the sticky notes and the journal entries
explaining the process. Follow-up/extension • Continue to use the base-10 pieces in additional activities to model multiplying decimals.

Mathematics Enhanced Scope and Sequence � Grade Five
Virginia Department of Education 2004 18
The In-Between Game Reporting category Number and Number Sense Overview Students model decimal numbers on grid paper and compare
decimal numbers in the context of a game. Related Standard of Learning 5.1 Objectives • Students will use 10 x 10 grids to explore relationships between decimal numbers. • Students will demonstrate correct ordering of decimal numbers by choosing a number that falls
between two decimal numbers. Materials needed • �Base-10 Grids,� one copy for each student • �In-Between Game,� one copy for each pair of students • Overhead transparency of �In-Between Game� • Overhead markers Instructional activity
1. Initiating Activity: Hand out multiple copies of 10 x 10 grids to each pair of students. Model on the
overhead how to divide the grid into 10 equal-size parts and shade one part. Write this as 110 or 0.1.
Ask each pair to similarly shade 210 or 0.2 on their first grid. Next, ask them to shade
20100 or 0.20
on another grid. Have them compare the two shaded decimal numbers. Ask, �Which shaded
decimal is the largest?� (They are the same or equivalent.)
2. Have the students use two more grids to shade the decimal numbers 0.3 and 0.34. Ask which is
larger (0.34), and call for responses and reasons. Name the corresponding fractions (310 and
34100).
Use two more grids to shade in 0.46 and 0.5. Ask which is larger (0.5), and call for explanations.
Make sure that the students understand how to compare decimal numbers by place value, and clear
up any misconceptions.
3. Give each pair a copy of the handout �In-Between Game.� Explain the rules of the game. (Note: you may need to model a game first on the overhead to get the students started, answering questions as you go.)
a. The first player chooses a decimal number and writes it on the first row in the first column.
The second player chooses a second decimal different from the first (smaller or larger) and
writes it on the first row in the third column directly across from the first number. Example:
0.5 0.7

Mathematics Enhanced Scope and Sequence � Grade Five
Virginia Department of Education 2004 19
b. The first player then chooses a decimal number that is in between the original two numbers,
records this number on the second row in the middle column, and crosses out the smallest
(first) number. Example:
0.5 0.7 0.68
c. The first player now writes the two remaining numbers on the third row in the first and third
columns, and the game continues. Example:
0.5 0.7 0.68 0.68 0.7
d. The second player now chooses a number in between these numbers, and so on for five to ten
rounds. Example:
0.5 0.7 0.68 0.68 0.7 0.689 0.689 0.7
4. After the students have had the opportunity to play the game on their own, ask several of the pairs
to display their games on the overhead for all to see and to share their game plays and strategies.
When they display their last round of numbers, have students use the symbols > and < to represent
the inequality.
Follow-up/extension • As an alternative, this game could be played using fractions, percents, or a combination of
fractions, decimals, and percents. Sample resources http://standards.nctm.org/document/chapter5/numb.htm#bp3 . NCTM Principals and Standards for
School Mathematics chapter on the Number and Operations Standard for Grades 3�5. http://askeric.org/cgi-bin/printlessons.cgi/Virtual/Lessons/Mathematics/Number_Sense/NUS0200.html �
an activity in which students arrange themselves into decimal numbers. www.funbrain.com � �Power Football� Students score field goals with decimal numbers. Addition,
subtraction, multiplication, and division are covered as well as algebra concepts. www.aaamath.com/B/grade5.htm � This Web site contains reference information and activities for all
fifth grade math topics. www.matti.usu.edu � This Web site contains a library of virtual manipulatives.

Mathematics Enhanced Scope and Sequence � Grade Five
Virginia Department of Education 2004 20
The In-Between Game
____ ____ ____ ____ ____ ____ ____ ____ ____ ____ ____ ____ ____ ____ ____ ____ ____ ____ ____ ____ ____ ____ ____ ____ ____ ____ ____ ____ ____ ____

Mathematics Enhanced Scope and Sequence � Grade Five
Virginia Department of Education 2004 21
Base-10 Grids

Mathematics Enhanced Scope and Sequence � Grade Five
Virginia Department of Education 2004 22
Released SOL test items 1 Hannibal is comparing two kinds of aquariums. The
first aquarium can hold a maximum of 12.875 gallons of water. The second aquarium can hold a maximum of 10.65 gallons of water. How many more gallons of water can the first aquarium hold than the second can?
A 1.225 B 1.181 C 2.010 D 2.225
2 0.7251 ÷ 3 =
A 0.2417 B 2.417 C 24.17 D 241.7
3 A piece of wood is 2.27 centimeters thick. What is that measurement rounded to the nearest
tenth of a centimeter?
A 2.1 B 2.2 C 2.3 D 2.5
4 Which means �six and seventy-four thousandths�?
F 674,000 G 6.74 H 6.074 J 0.6074
5 Which is true?
A 1.3749 < 1.0399 B 1.526 < 1.2605 C 1.7908 < 1.879 D 1.463 < 1.3902
6 4.8 × 5.1 =
A 2.448 B 2.88 C 24.41 D 24.48
Mathematics Enhanced Scope and Sequence � Grade Five
Virginia Department of Education 2004 23
Organizing Topic Fractions: Representations, Relationships, Operations, Estimation � Addition and Subtraction
Standards of Learning
5.2 The student will a) recognize and name commonly used fractions (halves, fourths, fifths, eighths, and tenths)
in their equivalent decimal form and vice versa; and b) order a given set of fractions and decimal numbers from least to greatest. Fractions will
include like and unlike denominators limited to 12 or less, and mixed numbers.
5.7 The student will add and subtract with fractions and mixed numbers, with and without regrouping, and express answers in simplest form. Problems will include like and unlike denominators limited to 12 or less.
Essential understandings, Correlation to textbooks and
knowledge, and skills other instructional materials
The student will use problem solving, mathematical communication, mathematical reasoning, connections, and representations to
• Represent fractions (halves, fourths, fifths, eighths, and tenths) in their equivalent decimal form.
• Represent decimals in their equivalent fraction form (halves, fourths, fifths, eighths, and tenths).
• Determine equivalent relationships between decimals and fractions with denominators up to 12.
• Order from least to greatest a given set of no more than five numbers written as decimals and as fractions and mixed numbers with denominators of 12 or less.
• Add and subtract fractions having like and unlike denominators. Denominators should be limited to 12 or less, and answers should be expressed in simplest form.
• Add and subtract with mixed numbers having like and unlike denominators, with and without regrouping. Denominators should be limited to 12 or less, and answers should be expressed in simplest form.
• Use estimation to check the reasonableness of a sum or difference.

Mathematics Enhanced Scope and Sequence � Grade Five
Virginia Department of Education 2004 24
Serving Up Fractions Reporting category Computation and Estimation Overview Students divide 10 pizzas evenly among different number of
people. Related Standard of Learning 5.7 Objectives • Students will demonstrate an understanding of vocabulary related to fractions. • Students will solve problems involving fractions. Materials needed • Construction paper • Scissors • �Serving Up Fractions,� one copy for each student • Lids to use for tracers Instructional activity 1. Review fraction terms such as numerator, denominator, and mixed number. 2. Tell the students that you are having a party that night and have ordered 2 pizzas, but you�re not
sure how many people are coming to the party. You�d like all your party guests to have an equal portion of pizza. Their job is to figure out how to divide the pizza equally among different groups of people.
3. Tell each group to cut out 10 circles, using lids to trace a pattern, to represent 10 pizzas. Each pizza has eight slices; so divide each pizza into eight sections.
4. Have students first look at �Serving Up Fractions� chart, and fill in the blanks where each person could get a whole number of slices. For example, if there were 2 guests, each one would receive 8 slices of pizzas. Discuss which number of guests gives you whole slices as answers (1, 2, 4, 8). How do they know this? (16 is divisible by all these numbers)
5. Students then need to figure what would happen if they have some other number of guests. Have each group cut two of their paper pizzas into slices. They should now have 16 pieces. If only three guests come to the party how many whole slices will they each receive? (5) How much will be left over? (1) How can we divide this evenly? (By sharing it, giving a part, a fraction of it.)
6. Have each group fold and then cut the slice into three equal pieces, so this time the amount of pizza each guest will receive is a mixed number. The whole number is 5 (whole slices) and they receive a fraction of the final slice. The final slice is now cut into three pieces, so the denominator for the fraction is 3. Each person will get one part of that slice, so the numerator is 1. Each guest
will receive 513 slices of pizza. Write the answer on the handout.
7. Have the groups use their paper models to solve and fill in the chart for five guests. Discuss the results.
8. Next, discuss the problems of sharing with six guests. How many whole slices would each guest receive? (2) How many slices would be left over? (4) How can we divide 4 slices evenly among six people? Each slice must be sliced into pieces of the same size. What number of pieces would be easy to share among 6 guests? (6, 12, 18) If we divided each slice into 6 pieces (sixths), how
Mathematics Enhanced Scope and Sequence � Grade Five
Virginia Department of Education 2004 25
many sixths would each guest receive? (4, so 46) So each guest would receive 2
46 slices of pizza. Is
there a simpler way of saying that? Can the fraction be simplified? (Yes, to 223) Would it have
worked to divide the slices into thirds? (Yes) Try it and see. 9. Using the paper pizzas, have students work with their group to complete the rest of the chart. 10. Discuss the results as a class. Ask the students to look for patterns in their charts. 11. Have the students pretend that it is now party time and 5 guests arrive, but one doesn�t eat pizza.
He gives his pizza to another guest. How much pizza will that guest receive? (315 + 3
15 = 6
25)
12. Using that example, have each group write a word problem involving the pizza amounts. They should neatly write their problem on a sheet of construction paper. Then have the groups rotate around the room to each �station� solving that group�s problem. Give them 2 minutes at each station. Check to see which group solved the most problems correctly.
Sample assessment • Watch carefully as students follow your instructions. Answer all questions that they may ask.
Circulate to be sure that all students understand and record correctly. Read the group�s question to make sure it is reasonable.
• Give each group three cookies. Tell them that if they are able to divide them equally, they can eat them. Watch to see how they approach the problem.
Follow-up/extension • Have students try the problem with different number of slices of pizza. There is room on the
handout for them to experiment. • Turn dominoes sideways and think of each domino as a 2-digit fractional number. Be sure that the
smaller number is represented as the numerator. Students can add and subtract the fractional numbers.

Mathematics Enhanced Scope and Sequence � Grade Five
Virginia Department of Education 2004 26
Serving Up Fractions
Number of slices Number of people Number of slices
each person receives
Simplified form
16 1
16 2
16 3
16 4
16 5
16 6
16 7
16 8
16 9
16 10

Mathematics Enhanced Scope and Sequence � Grade Five
Virginia Department of Education 2004 27
�Egg�cellent Fractions Reporting categories Number and Number Sense, Computation and Estimation Overview Students model the addition of fractions using egg cartons and
manipulatives. Related Standards of Learning 5.2, 5.7 Objectives • Students will represent various fractions. • Students will find the sum of two fractions. Materials needed • Egg cartons, two for each group of students • Plastic eggs, colored tiles, or other manipulative to be used as eggs • Markers, crayons, or colored pencils • �Egg�cellent Fractions 1,� one copy for each student • �Egg�cellent Fractions 2,� one copy for each student • Overhead transparency of handouts Instructional activity 1. Distribute egg cartons, eggs, and handouts to students.
2. Model the first problem, (14 +
13), for the class. Build the first fraction in one egg carton with one
color of eggs. Build the second fraction in the second carton with the second color eggs. Combine the two sets of eggs in one carton.
3. Now work through the second problem with the class. Ask the students to fill 14 of the first carton
and 23 of the second carton with eggs. Then ask them to color the corresponding cartons on the
handout. Next have them transfer all the eggs to one carton. Eleven of the twelve cups should be filled. Have the students color the answer on the handout. Make sure they use 2 different colors to
represent the two different fractions. Have them write their answer (1112) on the answer sheet.
4. At this point, review the meaning of the terms numerator and denominator and what each tells us. Ask the students if their answer is in simplest terms. Discuss how you can tell if a fraction is written in simplest terms. Then have the students simplify the answer.
5. Have the pairs complete the handout through number 10, using the egg cartons as models and then coloring the sheet.
6. Let groups come up and model the problems with their egg cartons and on the overhead. 7. After all the problems have been modeled, ask the students to complete problem number 11. What
difficulty did they have with this problem? (All the eggs wouldn�t fit in the carton.) The sum is
greater than 1212 or one whole.
8. This is a good time to discuss mixed numbers and improper fractions.

Mathematics Enhanced Scope and Sequence � Grade Five
Virginia Department of Education 2004 28
9. Have each student write a word problem involving eggs. Then have the members of their group solve the problem. Example: Julie bought two dozen eggs at the store. When she arrived home, she
dropped the bag and broke 13 of the eggs in the first carton and
16 of the eggs in the second carton.
How many eggs did she break? 10. Allow the group to select one of the word problems to share with the class. Sample assessment • Watch carefully as students follow your instructions. Answer all questions that they may ask.
Circulate to be sure that all students understand and record correctly. As students write word problems, discuss whether or not their problem can be modeled with the egg carton. Why or why not? Compare the answer to his/her classmate�s problems.
Follow-up/extension • Have students work with other manipulatives to solve addition problems. Have students solve
subtraction problems with the egg cartons.

Mathematics Enhanced Scope and Sequence � Grade Five
Virginia Department of Education 2004 29
1) 14 Simplest terms
+ 13
2) 23
+ 14
3) 12
+ 13
�Egg�cellent Fractions 1

Mathematics Enhanced Scope and Sequence � Grade Five
Virginia Department of Education 2004 30
4) 14 + 13 =
5)
16 +
23 =
6)
12 +
512 =
7)
34 +
112 =
8) 56 +
112 =
9) 12 +
16 =
10) 16 +
13 =
11) 56 +
14 =
12) 34 +
712 =
�Egg�cellent Fractions 2 For these problems, color in only your answer

Mathematics Enhanced Scope and Sequence � Grade Five
Virginia Department of Education 2004 31
Something�s Fishy Reporting category Number and Number Sense Overview Students use an area/region fraction model to find and record
equivalent fractions in the context of a game. Related Standard of Learning 5.2 Objective Students will use an area/region fraction model to find and record equivalent fractions in the context of a game. Materials needed • Pattern blocks (except for the square and the rhombus) or, alternatively, paper pattern blocks and
scissors for each pair of students • Spinner marked with pictures of the pattern blocks, one for each pair of students • A paper clip and pencil for each pair of students • �Something�s Fishy Rules of the Game,� one copy for each pair of students • �Something�s Fishy Game Board,� one copy for each student Note: For easier management, duplicate the paper pattern blocks on the following colors of construction paper: hexagons � yellow, parallelograms � blue, trapezoids � red, triangles � green. Game boards and spinners will last longer if they are duplicated on tagboard or some other type of heavy paper and laminated. If paper pattern blocks are used, have the students store them in plastic storage bags when finished. Instructional activity 1. Initiating Activity: Brainstorm with the students: Is it possible to share a pizza on one day with
three friends and the next day to share a pizza with seven friends but still eat the same amount of pizza that you ate the day before? Use the following example to illustrate: �Mike and three friends stopped at a pizza parlor Saturday night and shared a large pizza equally. What does this mean? (They each had the same-size piece, or equivalent piece, of pizza). The next day Mike and seven friends stopped at the same pizza parlor for a snack. This time the eight friends shared a large pizza equally among them and then ordered a second large pizza and shared it equally. Did Mike eat more pizza on Saturday or on Sunday? Or did he eat the same amount each day?�
2. Encourage students to draw pizzas to illustrate what Mike and his friends ate each day. Remember: concrete to representational to abstract. To ensure that students fully understand the situation, you may want to give each student three equal-size circles and have them trace the process of dividing the first circle into four equal-size parts and then dividing each of the next two circles into eight equal-size parts. Compare Mike�s part of Pizza One to what he ate from Pizzas Two and Three. They are equal � i.e., equivalent fractions.
3. Extend the concept by having the class play �Something�s Fishy.� Explain that the class will be divided into pairs of students and the players in each pair will compete against each other. Give each pair some pattern blocks, a copy of the game rules, a spinner with paper clip and pencil, and two game boards. Be sure to demonstrate how to use the spinner if students are not familiar with it. Explain that the object of the game is to cover the game board with pattern blocks completely but without overlaps. The first player to do this is the winner.

Mathematics Enhanced Scope and Sequence � Grade Five
Virginia Department of Education 2004 32
4. Explain that for every turn, each player spins the spinner and makes one of three choices: 1) take the pattern block indicated and place it anywhere it fits on his/her board; 2) take other blocks that when fitted together are equivalent to the block indicated and place these anywhere they will fit on the board (They do not have to be placed together but can be placed anywhere separately.); or 3) pass and do nothing. Important: Once blocks have been selected and placed, they may not be moved.
Example: A player spins a hexagon but decides to take two triangles and two parallelograms to place on his/her board instead. These four blocks may be placed anywhere on the board; they do not have to be placed together.
5. After the players have played one round of the game, ask them to record equivalent relationships among the blocks. They should consider the hexagon as one �whole� for this purpose.
Example: A player spins a hexagon but decides to take six triangles instead. The player places the blocks on his/her game board and also records this action:
1 hexagon �whole� = 6 triangles; therefore, 1 triangle represents 16 of the whole.
6. After the players have played at least two rounds of the game, discuss the experience. Ask the students to show and describe what they learned about fractional equivalents between and among the pattern blocks. Participants should have noticed that it takes three parallelograms to equal one hexagon; therefore, one parallelogram is equal to one-third of the hexagon �whole.� Two parallelograms equal two-thirds. Two triangles, or two-sixths of the �whole,� are equal to one parallelogram or one third of the whole.
3 parallelograms = 1 hexagon
1 parallelogram = 13 of a hexagon
2 parallelograms = 23 of a hexagon
2 triangles = 1 parallelogram
2 triangles = 26 or
13 of a hexagon
2 trapezoids = 1 hexagon
1 trapezoid = 12 of a hexagon
7. Have the students continue play until each pair has a winner. 8. Class management: After play, have the students collect all the pattern blocks and return them to
the appropriate containers. Have students store paper pattern blocks in plastic storage bags for future use. Game boards and spinners along with paper clips and pencils should be collectively stored. This will facilitate the use of the game as a math center, a small group activity, or another class activity.
9. Closing Activity: Refer to the story at the beginning of the activity about Mike and his friends and their visits to the pizza parlor. Encourage students to explain how Mike was able to eat the same amount of pizza on Sunday that he ate on Saturday, even though he was with a different number of friends each day. Have a student demonstrate the solution to the class, using the circle cutouts from the beginning of the activity and the known amounts of pizza that Mike ate. Have the student show how the amounts are equivalent. Then ask a student to explain the equivalent fractions represented by the pattern blocks used in �Something�s Fishy.� How do �Something�s Fishy� and Mike�s story compare? (Both activities contain equivalent fractions, and different combinations may be used to cover the same area.)

Mathematics Enhanced Scope and Sequence � Grade Five
Virginia Department of Education 2004 33
Sample assessment • Observe the students as they play the game, and check for understanding of equivalent values as
they choose the pattern blocks. Ask students to show you the variety of ways that they can cover the area of a hexagon when using only trapezoids, triangles, and parallelograms. They should be able to see that it is possible to cover the area of a hexagon with triangles only or trapezoids only. Likewise, they should be able to explain the combinations that can be used, for example, one trapezoid, one parallelogram, and one triangle. Encourage them to show a variety of combinations.
Follow-up/extension • Use the �Cover-up� activity (see below) as an opportunity for students to both extend their
learning and demonstrate an understanding of equivalent fractions. �Something�s Fishy� is an excellent small group activity for those students who complete their work early in class and need an opportunity to either practice equivalent fractions or extend their understanding of fractions.

Mathematics Enhanced Scope and Sequence � Grade Five
Virginia Department of Education 2004 34
Something�s Fishy Rules of the Game This is a game for two players. Each player uses his/her own game board, and the players together use a spinner and a set of pattern blocks.
OBJECT OF THE GAME
To be the first player to cover your game board with pattern blocks completely but without overlaps
1. Take turns spinning the spinner. Use a pencil and paper clip to activate the spinner.
2. After each spin, make one of these three choices:
a. Take the pattern block indicated on the spinner, and place it anywhere it fits on your game
board.
b. Take other blocks that when fitted together are equivalent to the block indicated, and place
these anywhere they fit on your game board. They do not have to be placed together.
c. Pass and do nothing.
3. Once blocks have been selected and placed on your board, they may not be moved.
4. The first player to cover his/her game board completely but without overlaps is the winner.
Be ready to talk about strategies you found useful while playing �Something�s Fishy.�

Mathematics Enhanced Scope and Sequence � Grade Five
Virginia Department of Education 2004 35
Something�s Fishy Spinner

Mathematics Enhanced Scope and Sequence � Grade Five
Virginia Department of Education 2004 36
Something�s Fishy Game Board

Mathematics Enhanced Scope and Sequence � Grade Five
Virginia Department of Education 2004 37
Something�s Fishy Hexagon Pattern Blocks

Mathematics Enhanced Scope and Sequence � Grade Five
Virginia Department of Education 2004 38
Something�s Fishy Parallelogram Pattern Blocks

Mathematics Enhanced Scope and Sequence � Grade Five
Virginia Department of Education 2004 39
Something�s Fishy Trapezoid Pattern Blocks

Mathematics Enhanced Scope and Sequence � Grade Five
Virginia Department of Education 2004 40
Something�s Fishy Triangle Pattern Blocks
Mathematics Enhanced Scope and Sequence � Grade Five
Virginia Department of Education 2004 41
Cover-up Reporting category Number and Number Sense Overview Students use a measurement/linear model to find and record
equivalent fractions within the context of a game. This activity is an extension of the activity �Something�s Fishy.�
Related Standard of Learning 5.2 Objective • Students will explore relationships between equivalent fractions, using concrete materials. Materials needed • Fraction strips, one set for each player • One whole fraction piece for each player, to be used as a game board • �Cover-Up Spinner,� one copy for each student • Paper clips and pencils Instructional activity
1. Ask each student to find the whole, the halves, the thirds, the fourths, the sixths, the eighths, and
the twelfths from their set of fraction strips.
2. Explain to the class that pairs of students will use their own sets of fraction strips to play the game
�Cover-Up.� Each player will start with the �whole� fraction piece as his or her individual game
board. The object of the game is to be the first to cover the game board entirely with the other
fraction strips. Overlapping of fraction strips is not permitted.
3. Demonstrate how to play the game. For each turn, a player spins the spinner, and the fraction
shown indicates what fraction piece to place on the game board. Play continues until one person
has completely covered his/her game board. When a player finds it possible to exchange multiple,
same-unit fraction pieces from the game board for a fewer number of pieces representing an
equivalent fraction, the player must do so. For example, if a player has two 18 pieces on his/her
board, these must be exchanged for one 14 piece. Remember that all replacement pieces must be the
same unit fraction � e.g., four 18 pieces may not be replaced with three
112 pieces and one
14 piece.
4. When the game nears the end, a player must spin the exact fraction needed in order to win. If a
participant needs only a small piece such as 112 in order to win, he or she is not permitted to use
14.

Mathematics Enhanced Scope and Sequence � Grade Five
Virginia Department of Education 2004 42
5. After all participants have played one preliminary round of the game, have them play another
round and record the fractional equivalents they encounter.
6. Discuss the mathematical concepts and procedures modeled in this game. Ask the students to
describe how they created pairs of equivalent fractions, as well as any strategies they found useful
while playing the game. Follow-up/extension • Use two �wholes� instead of one to increase the level of difficulty. This game may also be used to
explore the symbolism of fractions with numerators other than one and the process of comparing, ordering, adding, and subtracting fractions with like and unlike denominators.
• Fraction Bingo: Have students fill in a blank bingo board with the following fractions: 12, 13,
14,
15,
16,
• 17,
18,
19,
110,
23,
25,
27,
29,
34,
35,
37,
310,
45,
47,
49,
56,
57,
58,
59,
67,
78,
79,
710,
89,
910. Call aloud equivalent fractions
that will be simplified. Have students cover the simplified fraction. The first player to cover four in a row in any direction calls out, �Fraction Bingo.�
• Use paper folding to model equivalent fractions. Have students fold a piece of paper in half and color one-half. Then fold it again, open it up and discuss the new name for the same colored
amount (24). Continue the folding process and discuss new names for the colored amount. This can
also be done initially folding in thirds. Sample resources Thinking Rationally about Fractions, Decimals, and Percent: Instructional Activities for Grades 4
through 8 � Lesson plans available from VDOE at http://www.pen.k12.va.us/VDOE/Instruction/Math/FractionsDecimalsPercent.pdf.
http://math.rice.edu/~lanius/Patterns/ � Students use pattern blocks to investigate and build relations among fractions.
http://mathforum.org/paths/fractions/e.fraclessons.html � Extensive list of lesson plans and software related to fraction concepts.
http://www.col-ed.org/cur/math/math19.txt � Students construct words based on the fractional parts of other words in order to create a clue for a hidden candy bar.
http://mathcentral.uregina.ca/RR/database/RR.09.95/hanson4.html �This lesson plan uses pattern blocks to help students understand fractions and operations on fractions.
http://www.teachnet.com/lesson/math/fractioncity.html � This lesson provides instructions for an in-class activity in which students compare fractional parts
www.funbrain.com �Fresh Baked Fractions� and �Soccer Shootout� are games to practice fraction concepts.
http://matti.usu.edu � Library of Virtual manipulatives.

Mathematics Enhanced Scope and Sequence � Grade Five
Virginia Department of Education 2004 43
Other Web sites with interactive quizzes and games � http://education.jlab.org/solquiz/indes.html www.aaamath.com/B/grade5.html www.brainpop.com/math/seeall.weml http://www.learningbox.com/i_index.htm.

Mathematics Enhanced Scope and Sequence � Grade Five
Virginia Department of Education 2004 44
Cover-up Spinner

Mathematics Enhanced Scope and Sequence � Grade Five
Virginia Department of Education 2004 45
Released SOL test items 1 This is 1
What is
2 12
+ 34
F 23
G 1
H 118
J 114
3 7
89
� 267
F 5
G 518
H 52
63
J 513
4 A fraction of this circle is shaded.
Which is shaded to represent a decimal with the same value as the fraction?

Mathematics Enhanced Scope and Sequence � Grade Five
Virginia Department of Education 2004 46
5 Which has a value greater than 15?
A 13
B 16
C 18
D 110
6 A fraction of these caps is dark.
Which of the following groups has an equivalent fraction of dark caps?

Mathematics Enhanced Scope and Sequence � Grade Five
Virginia Department of Education 2004 47
Organizing Topic Measurement: Length, Weight/Mass, Volume (Liquid), Temperature, Time, Perimeter, Area, Volume, Circumference, Angles
Standards of Learning
5.8 The student will describe and determine the perimeter of a polygon and the area of a square, rectangle, and right triangle, given the appropriate measures.
5.9 The student will identify and describe the diameter, radius, chord, and circumference of a circle.
5.10 The student will differentiate between perimeter, area, and volume and identify whether the application of the concept of perimeter, area, or volume is appropriate for a given situation.
5.11 The student will choose an appropriate measuring device and unit of measure to solve problems involving measurement of a) length � part of an inch (1/2, 1/4, and 1/8), inches, feet, yards, miles, millimeters,
centimeters, meters, and kilometers; b) weight/mass � ounces, pounds, tons, grams, and kilograms; c) liquid volume � cups, pints, quarts, gallons, milliliters, and liters; d) area � square units; and e) temperature � Celsius and Fahrenheit units. Problems also will include estimating the conversion of Celsius and Fahrenheit units relative to familiar situations (water freezes at 0°C and 32°F, water boils at 100°C and 212°F, normal body temperature is about 37°C and 98.6°F).
5.12 The student will determine an amount of elapsed time in hours and minutes within a 24-hour period.
5.13 The student will measure and draw right, acute, and obtuse angles and triangles, using appropriate tools.
Essential understandings, Correlation to textbooks and
knowledge, and skills other instructional materials
The student will use problem solving, mathematical communication, mathematical reasoning, connections, and representations to
• Determine the perimeter of a polygon, with or without diagrams, when ° the lengths of all sides of a polygon that is not a rectangle
or a square are given; ° the length and width of a rectangle are given; or ° the length of a side of a square is given.
• Determine the area of a square, with or without diagrams, when the length of a side is given.
• Determine the area of a rectangle, with or without diagrams, when the length and width are given.

Mathematics Enhanced Scope and Sequence � Grade Five
Virginia Department of Education 2004 48
• Determine the area of a right triangle, with or without diagrams, when the base and the height are given.
• Determine the perimeter of a polygon and area of a square, rectangle, and triangle, following the parameters listed above, using only whole number measurements given in metric or U.S. Customary units, and record the solution with the appropriate unit of measure (e.g., 24 square inches).
• Describe the relationship between diameter and radius; and radius and circumference.
• Identify the diameter, radius, chord, and circumference of a given circle.
• Differentiate between the concepts of area, perimeter, and volume.
• Describe real-life situations where area, perimeter, and volume are appropriate measures to use, and justify their choices orally or in writing.
• Identify whether the application of the concept of perimeter, area, or volume is appropriate for a given situation.
• Solve problems involving measurement by selecting an appropriate measuring device and a U.S. Customary or metric unit of measure for the following:
° length: part of an inch (12 ,
14 ,
18 ), inches, feet, yards,
miles, millimeters, centimeters, meters, and kilometers; ° weight: ounces, pounds, and tons; ° mass: grams and kilograms; ° liquid volume: cups, pints, quarts, gallons, milliliters, and
liters; ° area: square units; and ° temperature: Celsius and Fahrenheit units.
• Estimate the conversion of Celsius and Fahrenheit units relative to familiar situations: ° Water freezes at 0°C and 32°F. ° Water boils at 100°C and 212°F.
Normal body temperature is about 37°C and 98.6°F.
• Determine elapsed time in hours and minutes within a 24-hour period.
• Identify the appropriate tools (e.g., protractor and straightedge or angle ruler as well as available software) used to measure and draw angles and triangles.
• Draw right, acute, and obtuse angles, using appropriate tools.
• Measure right, acute, and obtuse angles, using appropriate tools, and identify their measures in degrees.

Mathematics Enhanced Scope and Sequence � Grade Five
Virginia Department of Education 2004 49
• Measure the angles of right, acute, and obtuse triangles, using appropriate tools, and identify their measures in degrees.

Mathematics Enhanced Scope and Sequence � Grade Five
Virginia Department of Education 2004 50
Measurement Mania Reporting category Measurement and Geometry Overview Students experiment with linear measurement, volume, mass, time,
and temperature. Related Standards of Learning 5.10, 5.11, 5.12 Objectives • Students will choose the appropriate measuring device to solve problems involving measurement. • Students will choose the appropriate units of measurement to solve problems involving
measurement. Materials needed • Scale balance, weights, scale • Rulers, measuring tape, yardsticks, meter sticks • Stop watches • Thermometers • Measuring cups, graduated cylinders • Recording Sheets, one copy of each handout for each student • Variety of different-size containers • Rice or sand • Items listed on recording sheets or other items available in the classroom Instructional activity 1. This activity consists of five stations: linear measurement, mass/weight, volume, time, and
temperature. Students will need to work in groups. Each group will need approximately 20 minutes at each station, so this lesson will take at least two class periods.
2. Students should already have background knowledge about the two systems of measurement, U. S. Customary and metric.
3. Set the stations up in advance. It works well to keep all of the items in bins or on trays with the station name labeled. The following is a list of items for each station. • Linear measurement: rulers with metric and customary units, yardsticks, meter sticks,
measuring tapes • Mass/weight: balance, weights (ounces, pounds, grams, and kilograms), scale, a book, board
eraser, pencil, notebook, and an apple. • Volume: measuring cups with both metric and customary units, graduated cylinders, a variety
of different-size containers, rice. • Time: stopwatches • Temperature: thermometers (at least one digital for body temperature), a cup of ice water, a
cup of water that has been sitting outside, and a cup of water from the refrigerator. 4. Distribute a packet of handouts to each student. Discuss the questions that appear at the top of each
page. Choose one to fill out as a class. Make sure that students understand the difference in tools (devices) and units.

Mathematics Enhanced Scope and Sequence � Grade Five
Virginia Department of Education 2004 51
5. Distribute the materials for each station. Give the students approximately 20 minutes to complete the activities for that station.
6. After about 20 minutes, have students clean up and put all the materials back into the bin. Then have the students rotate to the next station or rotate the materials.
7. As the students are working, circulate and answer questions as necessary. Students may need guidance and clarification.
8. After students have completed all stations, lead a class discussion on their findings. Sample assessment • Observe the students as they move through the stations. Answer questions and observe students�
use of materials. The packet can be collected to see if there were any areas that need to be reviewed.
Follow-up/extension • Bring in, for example, juice boxes, candy bars, or snack cakes. Ask the students to estimate the
weight, length, or volume. Give the item to the student whose estimate is the closest. • Have students determine how much border will be needed for a classroom bulletin board and how
much paper will be needed to cover it. Discuss the difference between the two calculations. Let students try to decorate the board using their own measurements.
• Let the students estimate the total amount of fencing needed to go around a playground, and the area covered by grass (asphalt). If you have a fenced playground, let the students check the accuracy of their calculations.
• Give each group masking tape and have them outline a section of floor tiles. Number each figure. Then have the groups rotate to each figure and draw it on graph paper. Then have them calculate the perimeter and area of the figure. Most classroom tiles are one square foot.
• Have each student trace his or her foot on construction paper, cut it out, and measure the length of
the foot to the nearest 18 -inch. Check to see if anyone�s foot measures exactly 1 foot. As an
extension, students can graph the class results. • Have students participate in a cotton ball throw. Then have them measure the distance thrown in
both metric and standard units. • Let the students explore how many pounds and ounces equal a kilogram, as well as how many
grams equal 1 ounce. • Let the students feel the weight of 1 gram. Choose six to ten items to pass around. Have the
students predict the weight of each item in grams. Put the students in groups and have them use a balance scale to measure the actual weight of each item.
• Have students estimate how many pieces of pasta equal a pound. After estimating, let each group use a scale or balance to determine the actual number that will make a pound. Give the group other countable objects such as marbles or counting chips and have them repeat the process.
• Have the students go on a scavenger hunt to find objects of a specified weight or length. Then measure to see whose item was the closest to the specified value.
• Make transparencies of several different kinds of grid paper (i.e., square centimeters, square inch). Have students use the transparent grids to find the area of different polygons as well as irregular shapes.

Mathematics Enhanced Scope and Sequence � Grade Five
Virginia Department of Education 2004 52
• In groups, have the students use thermometers to find, for example, the room temperature, body temperature, or temperature of freezing water. Each group should report their findings in Celsius and Fahrenheit to the class. Then discuss the numbers that we use as standard for each of these.
• Teach students the following rhyme to remember Celsius temperatures: 30 is warm, 20 is nice, 10 is cool, 0 is ice.
• Have students write their daily class schedule and determine the elapsed time between classes, lunch, arrival, and dismissal.
• Have students work in pairs. Each partner draws a polygon, using a straightedge. Exchange drawings, measure and label each angle. Then add the measure of all the angles in the polygon and compare. As each group shares their results with the class, make a chart showing the findings. Discuss what they notice about the sums of the angles of different kinds of polygons.

Mathematics Enhanced Scope and Sequence � Grade Five
Virginia Department of Education 2004 53
Linear Measurement Recording Sheet 1. What are the most common metric units of measurement? 2. What are the most common customary units of measurement? 3. What are the most common tools used for linear measurement?
Measure the items listed below and record the measurement in both metric and customary. Be sure to record the units that you used.
Metric Customary 4. Height of a desk 5. Length of your foot 6. Width of the classroom 7. Length of a pencil 8. Width of the chalkboard 9. Length of your fingernail 10. (item of your choice)

Mathematics Enhanced Scope and Sequence � Grade Five
Virginia Department of Education 2004 54
Mass/Weight Recording Sheet 1. What are the most common metric units of measurement? 2. What are the most common customary units of measurement? 3. What are the most common tools used for mass/weight?
Measure the items listed below and record the measurement in both metric and customary. Be sure to record the units that you used.
Metric Customary 4. math book 5. board eraser 6. pencil 7. notebook 8. apple 9. a shoe 10. ___________________ (item of your choice)

Mathematics Enhanced Scope and Sequence � Grade Five
Virginia Department of Education 2004 55
Volume Recording Sheet 1. What are the most common metric units of measurement? 2. What are the most common customary units of measurement? 3. What are the most common tools used for volume?
Measure the items listed below and record the measurement in both metric and customary. Be sure to record the units that you used.
Container Description Metric Customary 4. 5. 6. 7. 8. 9. 10. (item of your choice)

Mathematics Enhanced Scope and Sequence � Grade Five
Virginia Department of Education 2004 56
Time Recording Sheet 1. What are the most common units of measurement? 2. How are metric and customary units different? 3. What are the most common tools for measuring time? 4. How is military time different? Time the following three activities: 5. How long the shortest member of your group can go without blinking. 6. How long the oldest member of your group can hold his breath. 7. How long the tallest member of the group can stand on the tiptoes of one foot. 8. How many minutes are in one day (24 hours)? 9. How many days are in five years? 10. How many hours are in January?

Mathematics Enhanced Scope and Sequence � Grade Five
Virginia Department of Education 2004 57
Temperature Recording Sheet 1. What are the units of measurement called in both the metric and customary system ? 2. What are the two scales called? 3. What are the most common tools used for temperature?
Measure the temperature of the following items. Be sure to record the units that you used.
Metric Customary 4. Room temperature 5. Body temperature 6. Ice water 7. Water from outside 8. Water from refrigerator 9. Outside temperature 10. (item of your choice)

Mathematics Enhanced Scope and Sequence � Grade Five
Virginia Department of Education 2004 58
Human Circles Reporting category Measurement Overview Students explore and define radius, diameter, center, circumference
and chord of a circle by creating a human circle. Related Standard of Learning 5.9 Objective • Students will explore and then define radius, diameter, center, circumference and chord of a circle. Materials needed • Posters labeled radius, diameter, center, circumference, chord • Large index cards labeled A, B, C, D, E, F, G • Measuring tape Instructional activity 1. Gather students into a circle. Have one student become the center of the circle and call him/her
point A. Explain that a circle is a set of points on a flat surface (plane) with every point equidistant from a given point called the center. Tell students that they each represent a point on the circle.
2. Instruct students to measure the distance from the center to several points on the outside edge. Record the distance and adjust so each point is equidistant. Explain that a line segment from the center of the circle to any point on the circle is called the radius of the circle.
3. Select a student from the circle to be point B and another to be point C. Pass the measuring tape from point B through the center to point C. Measure the distance and record. Guide students to understand that this measurement should be twice the earlier one. Explain that this is the diameter or a chord that goes through the center of a circle, and two radii end-to-end form a diameter of a circle.
4. Select another student from the circle to be point D and one to be point E. Pass the measuring tape from point D to point E, and tell students that they are forming a chord. A chord is a line segment connecting any two points of a circle. Select other students to be points F and G to create another chord. Emphasize that not all chords are diameters.
5. Have one student stand up and run around the outside or perimeter of the circle. Explain that this is the circumference of the circle.
6. Review and switch students so each have a chance to become each part of the circle. 7. Have students return to their desks and record a definition of each part of the circle in a learning
log. Have students write to a friend describing each part. Sample assessment • Watch carefully as students follow your instructions. Answer all questions that they may ask.
Circulate to be sure that all students understand the directions. Have students draw a picture of a circle and label each part for review.

Mathematics Enhanced Scope and Sequence � Grade Five
Virginia Department of Education 2004 59
Follow-up/extension • Have students solve problems involving the circumference and area of a circle given the diameter
and radius. Have students derive the approximations for pi from measurements for circumference and diameter, using human models.
• Stretch a string around a circular object and measure the string with a ruler to find the circumference.
• Cut oranges in half. Have students measure the circumference, diameter, and radius. Compare the measurements. Enjoy the oranges as a snack.
• Use a piece of string or paper clip to construct a homemade compass. Use it to draw a circle and then find the circumference, radius, and diameter.
• Have students sit in a circle with one person representing the center point. Have students toss the beanbag to the person across from them to represent a diameter, to the center to show a radius, and to anyone in the circle to show a chord.
• Pour a small amount of bubble solution on each child�s desk. The students will stick a straw in the solution and blow a bubble until it breaks. When it breaks, it will form a perfect circle. The children can measure the diameter, radius, and circumference.
• Give each student a geoboard and several rubber bands. Ask them to demonstrate the radius, chord, diameter, and circumference of the circle.
Sample resources Learning and Teaching Measurement: 2003 Yearbook with Classroom Activities Companion Booklet,
NCTM, 2003 Information related to measurement and activities that go beyond the content. http://standards.nctm.org/document/chapter5/meas.htm � Information on measurement from Principles
and Standards for School Mathematics. http://mathforum.org/paths/measurement/inchbyinch.html � A lesson from the Math Forum that uses
literature to explore the concept of length. http://mathforum.org/paths/measurement/e.measlessons.html � Ideas and resources for teaching
measurement that includes lesson plans, materials, common questions, and software. http://www.aimsedu.org/Activities/minimetrics/mini-metrics.pdf � A Mini-Metric Olympics activity
from the AIMS organization. http://marg.mhost.com/MathGr5/elapsedtime.htm � Interactive quiz on elapsed time. www.mathcats.com � Metric and U.S. conversions, weather from around the world in Celsius and
Fahrenheit. www.quia.com/mc/66516.html � Matching game with elapsed time. www.edhelper.com/TimeMath24.htm � Printable worksheet on elapsed time. www.funbrain.com/poly/ � Activities for students with area and perimeter. www.shodor.org/interactivate/lessons/lpa.html � This lesson is designed to examine the mathematical
concepts of length, perimeter, and area. These activities and discussions may be used to develop students' understanding of these mathematical concepts.
www.mste.uiuc.edu/users/carvell/rectperim/RectPerim2.html � Interactive site that examines the relationship between area and perimeter.
www.mathgoodies.com/lessons/vol1/area_rectangle.html � Lessons and problems for students involving area and perimeter.

Mathematics Enhanced Scope and Sequence � Grade Five
Virginia Department of Education 2004 60
http://its.guilford.k12.nc.us/webquest/areaperim/areaperim.htn � A Webquest using area and perimeter to design a �Fun House.�
www.aaamath.com/B/grade5.htm � Interactive site for students involving all fifth grade concepts. www.teachnet.com/lesson/math/geometry/circlesingeo.html � Activities to introduce the concept of
circumference. www.aimsedu.org � Provides a database of all AIMS activities.
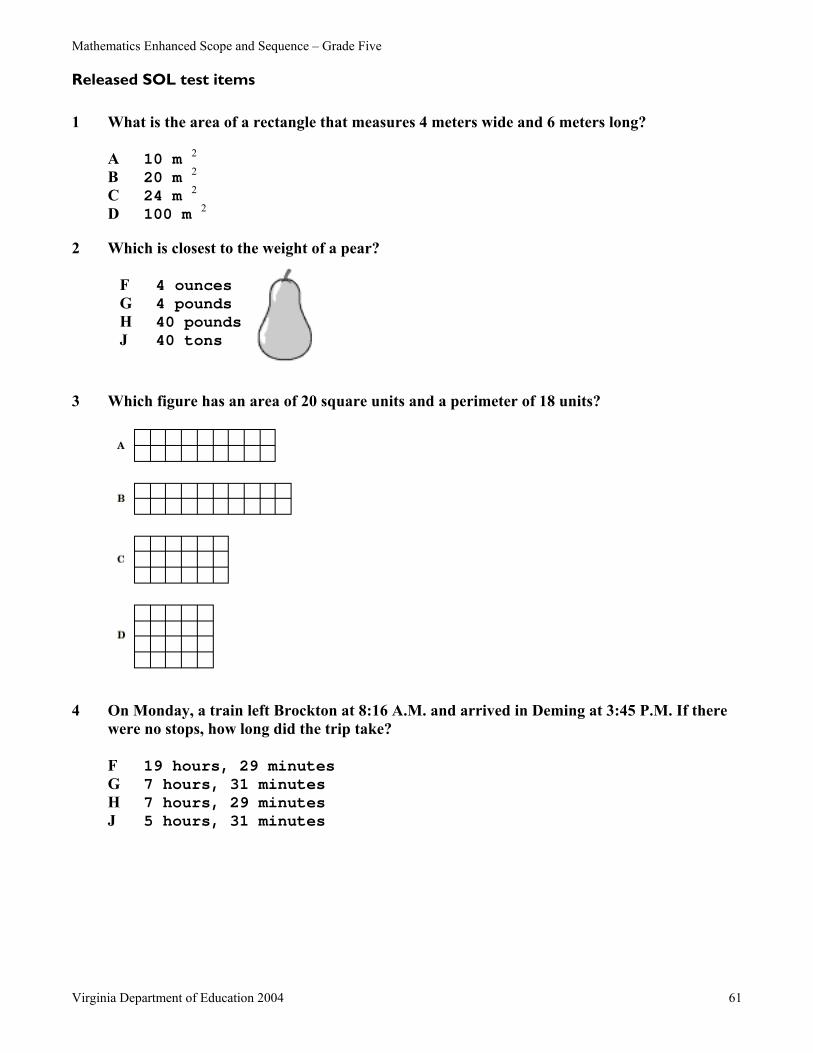
Mathematics Enhanced Scope and Sequence � Grade Five
Virginia Department of Education 2004 61
Released SOL test items 1 What is the area of a rectangle that measures 4 meters wide and 6 meters long?
A 10 m 2 B 20 m 2 C 24 m 2 D 100 m 2
2 Which is closest to the weight of a pear?
F 4 ounces G 4 pounds H 40 pounds J 40 tons
3 Which figure has an area of 20 square units and a perimeter of 18 units?
4 On Monday, a train left Brockton at 8:16 A.M. and arrived in Deming at 3:45 P.M. If there
were no stops, how long did the trip take?
F 19 hours, 29 minutes G 7 hours, 31 minutes H 7 hours, 29 minutes J 5 hours, 31 minutes

Mathematics Enhanced Scope and Sequence � Grade Five
Virginia Department of Education 2004 62
5 Use your inch ruler to help you answer this question. Which is closest to the length of this mailing label?
A 2 in.
B 2 12 in.
C 3 in.
D 3 12 in.
6 Elsa wants to start a garden in her backyard. For which of the following would she need to
know the perimeter of the garden?
F Determining how much fertilizer is needed to cover the garden G Determining how much water is needed for the garden H Determining how many seeds are needed to fill the garden with
plants J Determining how many feet of fencing are needed to go around
the garden

Mathematics Enhanced Scope and Sequence � Grade Five
Virginia Department of Education 2004 63
Organizing Topic Geometry: Two-Dimensional (Plane), Three-Dimensional (Solid), Transformations
Standards of Learning
5.14 The student will classify angles and triangles as right, acute, or obtuse.
5.15 The student, using two-dimensional (plane) figures (square, rectangle, triangle, parallelogram, rhombus, kite, and trapezoid) will a) recognize, identify, describe, and analyze their properties in order to develop definitions of
these figures; b) identify and explore congruent, noncongruent, and similar figures; c) investigate and describe the results of combining and subdividing shapes; d) identify and describe a line of symmetry; and e) recognize the images of figures resulting from geometric transformations such as
translation (slide), reflection (flip), or rotation (turn).
5.16 The student will identify, compare, and analyze properties of three-dimensional (solid) geometric shapes (cylinder, cone, cube, square pyramid, and rectangular prism).
Essential understandings, Correlation to textbooks and
knowledge, and skills other instructional materials
The student will use problem solving, mathematical communication, mathematical reasoning, connections, and representations to
• Classify angles as right, acute, and obtuse.
• Classify triangles as right, acute, and obtuse.
• Recognize and identify the properties of squares, rectangles, triangles, parallelograms, rhombi, kites and trapezoids.
• Describe the properties of squares, rectangles, triangles, parallelograms, rhombi, kites and trapezoids.
• Analyze the properties of squares, rectangles, triangles, parallelograms, rhombi, kites and trapezoids.
• Identify congruent, non-congruent, and similar figures.
• Describe the results of combining and subdividing shapes.
• Identify and describe a line of symmetry.
• Recognize the images of figures resulting from geometric transformations such as translation, reflection, or rotation.
• Identify properties of three-dimensional (solid) geometric shapes (cylinder, cone, cube, square pyramid, and rectangular prism).
• Analyze and compare properties of three-dimensional (solid) geometric shapes (cylinder, cone, cube, square pyramid, and rectangular prism).

Mathematics Enhanced Scope and Sequence � Grade Five
Virginia Department of Education 2004 64
All Cracked Up Reporting category Geometry, (Number and Number Sense) Overview Students create a set of tangrams and use them to solve a problem. Related Standard of Learning 5.15 Objectives • Students will follow oral instructions and create a set of tangrams. • Students will explore plane figures and their properties. • Students will determine fractional parts of a whole, using tangrams. Materials needed • 10 cm x 10 cm squares of construction paper or square pieces of origami paper • Scissors • �All Cracked Up � Area and Fractions with Tangrams� one copy for each student • A letter-size, three-hole-punched envelope for each student to hold tangrams for future projects Note: If scissors are not available, cutting may be replaced with licking and tearing. Instructional activity Note: Directions in italics represent a review of geometry. 1. Give each student a 10 cm-by-10 cm square piece of paper. Talk about the attributes of a square
and the ways to verify that the paper actually is a square. 2. Have students fold the square along a diagonal. It may be necessary to explain that a diagonal is
the segment that joins two non-adjacent vertices. Have the students cut along the creased diagonal. Model this with a square of your own (Figure 1).
3. Discuss briefly with the students the two geometric figures they have now created � two congruent isosceles right triangles � and what they know about them. Demonstrate the concept of congruence by placing one triangle on top of the other so that it looks like only one triangle.
4. Have the students place one triangle aside and place the other in front of them with the long side (the hypotenuse) toward their stomach, parallel to the edge of their desk. Have them fold this triangle along the altitude from the vertex. It may be necessary to explain the meaning of �altitude from the vertex.� Have the students crease and cut along the altitude. Model this with your own triangle (Figure 2).
5. Discuss briefly the two geometric figures they have now created � two congruent isosceles right triangles � and what they know about them. Again demonstrate the concept of congruence by placing one triangle on top of the other so that it looks like only one triangle. Ask students if these right triangles are congruent to the one they put aside. This will provide the opportunity to discuss the difference between congruence and similarity. Demonstrate similarity by showing that the angles are congruent. Have the students label these triangles 1 and 2.
6. Have the students place the remaining large right triangle in front of them with the long side (the hypotenuse) toward their stomach. Have them fold the vertex of the right angle down to the midpoint of the opposite side. Model this with your own triangle. Show them how it should look � a small triangle folded over a trapezoid. Cut along the crease. Label the new triangle 3 (Figure 3).

Mathematics Enhanced Scope and Sequence � Grade Five
Virginia Department of Education 2004 65
7. Discuss briefly the two geometric figures they have now created � an isosceles right triangle and an isosceles trapezoid. If some students do not know what a trapezoid is, introduce it as a quadrilateral with exactly one pair of parallel sides.
8. Have the students place the trapezoid in front of them with the longer side toward their stomach. Have them fold the trapezoid along the height of the trapezoid that connects the midpoints of the two bases. Model this with your own trapezoid. Cut along the crease. (Figure 4).
9. Discuss with the students the two geometric figures they have now created � two congruent trapezoids. This is a good time to discuss the similarities and differences of the two trapezoids they have seen thus far.
10. To assist students in following the next steps, place the following diagram of a �shoe� on the board or overhead.
lace toe heel
Say to students: �These are what we are now going to call shoes. You have two of them. Place one in front of you and put the other aside. Take the toe and fold it back to the heel.� Model with your own shoe. When the fold is complete, it should look like a triangle on top of a square. Cut along the crease. Label the triangle 4 and the square 5. Now is a good time to continue the discussion of geometric figures and what figures they now have � an isosceles right triangle similar to the others and a square. Ask how they can verify that they have a square (Figure 5). Note: Similar is a math term that means corresponding angles are congruent and the sides are proportional (keep the same ratio�2:1). Congruent is a special case of similar. The corresponding angles are congruent and the ratio of the corresponding sides is 1:1.
11. Have the students take the second shoe and place it in front of them, oriented the same as the model on the board or overhead. Have them take the heel and fold it to the lace. Model with your second shoe. It should look like a triangle folded over a parallelogram. Cut along the crease. Label the small triangle �6� and the parallelogram �7� (Figure 6).
12. Finish the discussion of geometric figures. The students should now have a small isosceles right triangle and a parallelogram. Is the triangle congruent or similar to the others? Talk about the properties of a parallelogram.
13. Have the students make sure that they each have seven labeled pieces. Then have them put the seven pieces back together into the large square with which they started.
14. At the end of this activity, give each student an envelope with holes punched in it for a three-ring binder, and have them store their pieces for future work.
Figure 1. crease and cut

Mathematics Enhanced Scope and Sequence � Grade Five
Virginia Department of Education 2004 66
Figure 2. crease and cut Figure 3. crease and cut Figure 4. crease and cut Figure 5.
crease and cut crease and cut
Figure 6. Sample assessment • Watch carefully as students follow your instructions. Answer all questions that they may ask.
Circulate to be sure that all students are understanding and folding correctly. As students try to reassemble the square, circulate and talk with them about the strategies they are using. Distribute a copy of the handout �All Cracked Up � Area and Fractions with Tangrams� to each student. While the students are completing the handout, circulate and again discuss the strategies they are using to determine the fractional part of each piece.
Follow-up/extension • Sort and classify quadrilaterals, and discuss the names and properties. • Use mirrors to show symmetry.
7
6
1 2
54

Mathematics Enhanced Scope and Sequence � Grade Five
Virginia Department of Education 2004 67
• Use tangrams to make patterns, to identify figures, and to combine and subdivide shapes. Pentominoes can also be used to show rotation, reflection, and translation. See www.clevermedia.com/game.cgi?pentominoes for an interactive pentominoes game.
• Show students solid shapes, one of each kind (cylinder, cone, cube, square pyramid, and rectangular prism). List and discuss attributes to define shapes.
• Play a �Simon Says� game in which the students use their hands and arms to make the different geometric shapes and angles.

Mathematics Enhanced Scope and Sequence � Grade Five
Virginia Department of Education 2004 68
All Cracked Up � Area and Fractions with Tangrams Steps 1. Identify each tangram piece by the name of its shape. 2. Which pieces have the same area? How do you know? 3. If the area of the whole piece is 1 (one) unit, find the area of each numbered piece.
Piece # Name Area
1 ______________ _____________ 2 ______________ _____________ 3 ______________ _____________ 4 ______________ _____________ 5 ______________ _____________ 6 ______________ _____________ 7 ______________ _____________
1
2
3
4
5
67

Mathematics Enhanced Scope and Sequence � Grade Five
Virginia Department of Education 2004 69
Plane Shapes Reporting category Geometry Overview Students analyze properties to develop definitions for square,
rectangle, parallelogram, rhombus, kite, and trapezoid using geoboards.
Related Standard of Learning 5.15 Objective • Students will analyze properties of two-dimensional (plane) figures to develop definitions of the
figures. Materials needed • Geoboards and an overhead geoboard • �Geometry: Quadrilateral Study Guide,� one copy for each student Instructional activity 1. Begin by reviewing the types of triangles from previous lessons: right, acute, obtuse, scalene,
isosceles, and equilateral. Demonstrate each triangle on the overhead geoboard, and have students model on theirs. (Note: An equilateral triangle cannot be created on a 5-pin-by-5-pin geoboard.)
2. Discuss with students the properties of the figures used to classify each triangle: number of sides, measurement of angles, and length of measure of the sides.
3. Display on the overhead geoboard several four-sided figures. Ask students to identify what they all have in common � the number of sides. Instruct students that all four-sided figures are called quadrilaterals. (Focus on the prefix quad and brainstorm other words to help with meaning.)
4. Have students make different types of quadrilaterals on their geoboards. Find a student who has made a parallelogram. Replicate it on the overhead geoboard. Discuss with students properties of the figure: has four sides; both pairs of opposite sides are parallel; opposite sides are congruent; opposite angles are congruent; a diagonal divides the shape into two congruent triangles.
5. Make a rectangle on the overhead geoboard. Discuss the properties of the figure and have students determine that a rectangle is a parallelogram with four right angles.
6. Make a square on the overhead geoboard. Discuss with students the properties. Have students discover that a square has all of the properties of a parallelogram and that a square is also a rectangle. A square is a rectangle with four congruent sides.
7. Find a student who has made a rhombus, and replicate it on the overhead. Have students discover that the rhombus has the properties of a parallelogram and that it has four congruent sides. Opposite angles of a rhombus are congruent.
8. Find a student who has made a trapezoid, and replicate it on the overhead geoboard. Examine the properties and determine that a trapezoid is different from a parallelogram because it has exactly one pair of parallel sides. Instruct students that the parallel sides are called bases and the non-parallel sides are called legs. If the legs have the same length, then the trapezoid is an isosceles trapezoid.
9. Make a kite on the overhead geoboard. Discuss the properties and have students determine that a kite has two distinct pairs of adjacent congruent sides.

Mathematics Enhanced Scope and Sequence � Grade Five
Virginia Department of Education 2004 70
10. Have students come to the overhead geoboard and create different types of quadrilaterals � rectangle, square, parallelogram, rhombus, trapezoid, and kite � to review the properties and definitions.
11. Have students make one of the quadrilaterals on their geoboards. Have each student name the quadrilateral, giving as many different correct names as possible.
12. Divide students into groups and have them create a poster with the definition of each quadrilateral to display in the classroom.
13. Have students complete the study guide that follows. Sample assessment: • Watch carefully as students follow your instructions. Answer all questions that they may ask.
Circulate to be sure that all students understand the directions. Collect the handout and check for accuracy.
• Have students create patterns and designs, using the different types of quadrilaterals.

Mathematics Enhanced Scope and Sequence � Grade Five
Virginia Department of Education 2004 71
: Quadrilateral Study Guide Fill in the blanks
A ___________________ is a polygon with four sides. Draw several examples below:
A ___________________ is a quadrilateral in which both pairs of opposite sides are _______________.
Properties of a parallelogram include:
1. a diagonal divides the parallelogram into two congruent ___________________.
2. the opposite sides of a parallelogram are _____________________.
3. The opposite angles of a parallelogram are _______________________.
4. The diagonals of a parallelogram _________________ each other.
Draw the bisecting diagonals on the figure below:
A ________________________ is a parallelogram with four right angles. Since a _________________
is a parallelogram, it has the same properties as those of a parallelogram.
A ______________ is a rectangle with four congruent sides. Since a ________________ is a rectangle,
it has all the properties of a rectangle and a parallelogram.

Mathematics Enhanced Scope and Sequence � Grade Five
Virginia Department of Education 2004 72
A ____________________ is a parallelogram with four congruent sides. Opposite angles of a
______________________ are congruent. Since a ____________________ is a parallelogram, it has all
the properties of a parallelogram. Draw this figure below:
A ____________________ is a quadrilateral with exactly one pair of parallel sides. The parallel sides
are called _________________ and the non-parallel sides are called __________________. If the legs
have the same length, then it is an _______________________________________________.
A ____________________ is a quadrilateral with two distinct pairs of adjacent congruent sides. Its
diagonals are perpendicular or not congruent. Draw this figure below:

Mathematics Enhanced Scope and Sequence � Grade Five
Virginia Department of Education 2004 73
Triangle Sort Reporting category Geometry Overview Students classify triangles as right, acute, obtuse, scalene,
equilateral, and isosceles and analyze their properties. Related Standard of Learning 5.14 Objective • Students will classify given triangles as right, acute, obtuse, scalene, equilateral or isosceles on a
chart. Materials needed • �Triangle Sort,� one copy for each student • �Triangle Sort Recording Sheet,� one copy for each student • Chart for students and an overhead • Angle rulers/ protractors Instructional activity 1. Explain to students that a triangle is a polygon with three sides. Triangles can be classified
according to the measures of their angles (right, acute, obtuse) or according to the measures of their sides: scalene (no sides congruent), isosceles (at least two sides congruent), or equilateral (all sides congruent).
2. Present students with the chart and use overhead projector to explain they will be sorting the triangles based on the measure of their angles and the length of the sides.
3. Begin with triangle A. Ask students to describe what they know about triangle A. Ask, �What are the measurements of the angles? What can you say about the sides?� Instruct students to write A under obtuse and under isosceles on the recording sheet. Demonstrate how to measure the sides. Do several more examples until your students are familiar with the directions.
4. Pair students and have them discuss each triangle and decide the appropriate places for it on the recording sheet. Encourage students to use the angle ruler and/or a ruler and protractor to measure the angles and sides.
5. When students finish with their partners, come back as a whole group and check for accuracy. 6. Ask students to draw conclusions about the triangles. Ask questions, �How are all the right
triangles similar? How would you describe a scalene triangle? Can you have an isosceles right triangle? Can you have an isosceles obtuse triangle? Can you have an obtuse right triangle?�
7. Have students write their own definitions for each type of triangle. Sample assessment • Watch carefully as students follow your instructions. Answer all questions that they may ask.
Circulate to be sure that all students understand the directions. Have students write rules for each type of triangle. Students could draw more triangles and continue to sort based on the properties.

Mathematics Enhanced Scope and Sequence � Grade Five
Virginia Department of Education 2004 74
Follow-up/extension • Have students travel around the building taking pictures of triangles. Print the pictures and have
students sort, based on the properties. Have students create and extend patterns involving the types of triangles. Have students use geoboards to make the triangles. Have students make flips, slides, and turns with the triangles.
• Have students bend straws to make each type of triangle and angle. • Use geoboards to make and classify angles and triangles and to describe and analyze properties of
squares, rectangles, parallelograms, rhombi, kites, and trapezoids. Students can also pair to make congruent, non-congruent and similar figures with two geoboards. Use different colored rubber bands to create translation (slide), reflection (flip), or rotation (turn) from their shape on the geoboard. www.kidsdomain.com/down/mac/geoboarddemo.html has a downloadable/electronic geoboard students can use.
• Sort and classify triangles as acute, right, obtuse, and isosceles, scalene, and equilateral. • Use protractors and angle rulers to measure angles and triangles. • Go on a school scavenger hunt for angles and triangles. Have students use a digital camera and
make a collage of photos of angles in the building and display on a bulletin board. Students could also bring pictures from home to add.
• Have students draw a picture with 25 right, 25 acute, 25 obtuse angles or triangles. Use angle rulers to check measurements.

Mathematics Enhanced Scope and Sequence � Grade Five
Virginia Department of Education 2004 75
Triangle Sort
A = G = B = H = C = I = D = J = E = F =
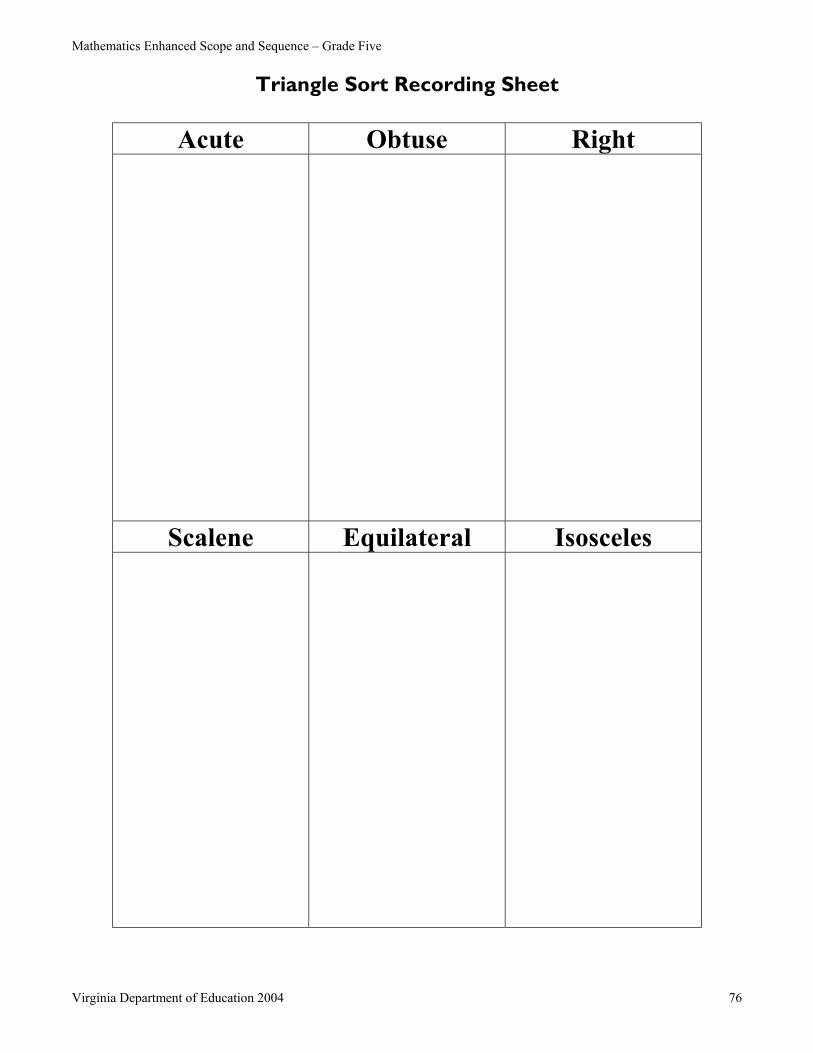
Mathematics Enhanced Scope and Sequence � Grade Five
Virginia Department of Education 2004 76
Triangle Sort Recording Sheet
Acute Obtuse Right
Scalene Equilateral Isosceles

Mathematics Enhanced Scope and Sequence � Grade Five
Virginia Department of Education 2004 77
Geometry Stations Reporting category Geometry Overview Students work in centers to identify and explore congruency,
combining and subdividing shapes, symmetry, geometric transformations, and properties of three-dimensional geometric solids.
Related Standards of Learning 5.15, 5.16 Objectives • Students will identify and explore congruent, non-congruent, and similar figures through use of a
geoboard. • Students will investigate and describe the results of combining and subdividing shapes using
tangrams and pentominoes. • Students will identify a line of symmetry and draw a symmetric picture. • Students will recognize the images of figures resulting from geometric transformations such as
translation (slide), reflection (flip), or rotation (turn) by using geoboards and their bodies. • Using toothpicks and clay students will identify, compare, and analyze properties of three-
dimensional geometric shapes (cylinder, cone, cube, square pyramid, and rectangular prism). Materials needed • Magazines or newspapers • Scissors • Drawing paper • Geoboards • Tangrams (a printable tangram with activity sheets is at www.tangram.i-p.com or
www.mathforum.org/trscavo/tangrams/construct.html. A movie in Flash uses tangrams at www.tygh.co.uk/tan/tan.html, and www.tangrams.ca/puzzles.html also has activities for students to use.)
• Pentominoes (a downloadable game is at www.geocities.com/liviozuc/) • Toothpicks and raisins • Clay or Playdoh Note: www.science.com/geometry has interactive symmetry activities and printable symmetric tiles for students to use if needed. Set up the stations with other teachers and have students rotate stations and teachers. Instructional activity Station 1: Congruent and similar figures 1. Discuss with students the definitions of congruent, noncongruent, and similar. Students should
know that two figures are said to be congruent if they have exactly the same size and shape. Two figures are said to be similar if they have exactly the same shape but not necessarily the same size. Note: All congruent figures are similar.
2. Have students use geoboards to create examples of shapes that are congruent, noncongruent, or similar. Note that similar figures may or may not be congruent.

Mathematics Enhanced Scope and Sequence � Grade Five
Virginia Department of Education 2004 78
3. Have students use drawing paper or geoboard recording sheets to create a geometric design containing 15 congruent shapes, 15 noncongruent shapes that are not similar, and 15 similar shapes.
4. Display drawings on a bulletin board and review definitions with students. Station 2: Tangrams and pentominoes 1. Discuss with students that two or more figures can be combined to form a new shape. Have
students identify the figures that have been combined. Students should also know that a polygon may be subdivided into two or more figures. Students should understand how to divide a polygon into familiar figures.
2. Have students investigate and describe the results of using the tangrams and/or pentominoes to combine and subdivide figures. Use the activities from the Web sites referenced in the Materials Needed section if necessary. Some students may also use the interactive tangram and pentomino games available on the Internet.
Station 3: Line of symmetry 1. Discuss with students that a line of symmetry is a line that divides a figure into congruent halves,
each of which is the reflected image of the other. 2. Have students locate a picture of an image and use scissors to cut on the line of symmetry. Then
have students draw the missing symmetrical image. Large pictures of faces work well. 3. Display pictures. Students can also access the interactive symmetry Web site listed in the Sample
Resources for an extension to this station. Station 4: Human slides, flips and turns 1. Begin by demonstrating (using an overhead geoboard) that a rotation (turn) is a transformation in
which an image is formed by turning its preimage about a point. Instruct students to use their own geoboard to demonstrate a rotation.
2. Next demonstrate a reflection and tell students that a reflection (flip) is a transformation in which the figure is flipped over a line called the line of reflection. All corresponding points in the image and preimage are equidistant from the line of reflection. Instruct students to demonstrate this on their geoboard.
3. Next demonstrate a translation (slide) on the overhead geoboard and explain to students that a slide is a transformation in which an image is formed by moving every point on a figure the same distance in the same direction. Have students demonstrate on their geoboard.
4. Clear out a space on the floor or use the gym. Instruct students to form a shape with their body on the floor. Tell students to use their body to make a reflection, then a rotation, and a translation. Have students review each of the terms and then play a �Simon Says� game. The teacher will say, �Simon says use your body to make a translation or slide.� Continue playing until all students can demonstrate each term.
5. Students can also use graph paper to draw examples of each term. Station 5: Three-Dimensional Solids 1. Show students models of three-dimensional solids such as a paper towel holder, an ice cream cone,
a dice, a square pyramid, and a shoebox. Discuss with students the name of geometric names of each object and review the properties of each.

Mathematics Enhanced Scope and Sequence � Grade Five
Virginia Department of Education 2004 79
2. Have students use toothpicks and raisins (small pieces of clay will also work) to create a cube, square pyramid, and a rectangular solid. Review the properties as students are creating the figures.
3. Also have students use clay to make a cylinder and cone. Review the differences between the figures and the properties.
4. For an extension, have students collect other objects from home that are examples of the different shapes. Create a display in the classroom to review with students.
Sample assessment • Watch carefully as students follow your instructions. Answer all questions that they may ask.
Circulate to be sure that all students understand the directions. Follow-up/extension: • Have students create a study guide of terms learned at the various stations. Sample resources http://standards.nctm.org/document/chapter5/geom.htm � - NCTM Principles and Standards information
related to geometry in Grades 3-5. http://illuminations.nctm.org/imath/3-5/GeometricSolids/index.html � An I-math investigation of
geometric solids. http://standards.nctm.org/document/eexamples/chap5/5.3/index.htm � An interactive exploration of the
properties of rectangles and parallelograms. http://www.learnnc.org/LearnNC/lessonp.nsf/docunid/E59C22A90A8A43F485256831007443D4?opend
ocument � A lesson plan on congruent figures. http://ericir.syr.edu/cgi-bin/printlessons.cgi/Virtual/Lessons/Mathematics//Geometry/GEO0200.html �
A lesson plan on points, rays, lines, line segments, parallel, perpendicular and intersecting lines. http://www.learnnc.org/LearnNC/lessonp.nsf/docunid/272DFA � A lesson plan on constructing three-
dimensional figures. http://artsedge.kennedy-
center.org/teaching_materials/curricula/curriculum.cfm?curriculum_id=213&mode=full � Using the context of lighthouses, this lesson plan focuses on the geometric figures required to construct structures. http://www.learner.org/teacherslab/math/geometry/space/ � Lessons plans that focus on visualization of
three-dimensional objects. VDOE Geometry Instructional Module � Professional development training module that contains
activities that can be adapted for student use. Navigating through Geometry in Grade 3 through Grade 5 � Available from NCTM. Contains
additional lessons for geometric activities. Van Hiele Levels of Geometric Thought CD � Available through the Virginia Department of Education.
Contains assessments to determine children�s level of geometric thinking. www.matti.usu.edu � A library of virtual manipulatives. www.mathcats.com � Creative, interactive site for students with geometry activities. www.standards.nctm.org/document/eexamples/chap4/4.2/ � An interactive geoboard.
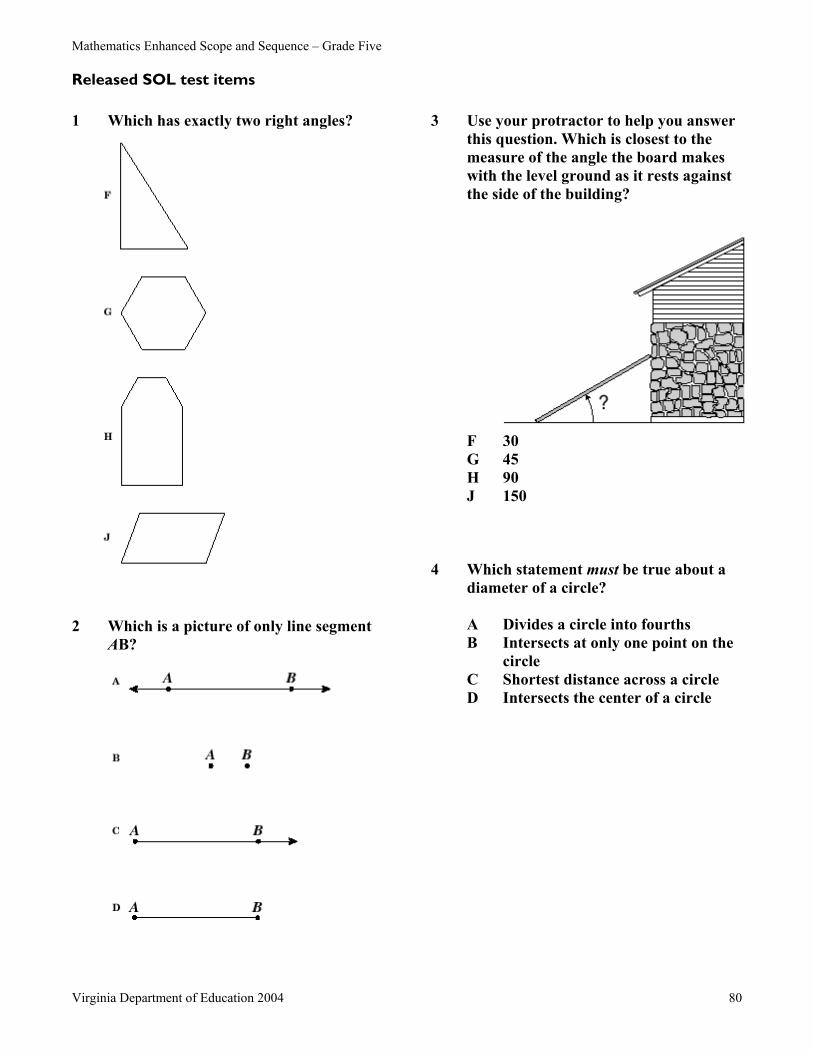
Mathematics Enhanced Scope and Sequence � Grade Five
Virginia Department of Education 2004 80
Released SOL test items 1 Which has exactly two right angles?
2 Which is a picture of only line segment
AB?
3 Use your protractor to help you answer this question. Which is closest to the measure of the angle the board makes with the level ground as it rests against the side of the building?
F 30 G 45 H 90 J 150
4 Which statement must be true about a
diameter of a circle? A Divides a circle into fourths B Intersects at only one point on the
circle C Shortest distance across a circle D Intersects the center of a circle

Mathematics Enhanced Scope and Sequence � Grade Five
Virginia Department of Education 2004 81
Organizing Topic Statistics Standards of Learning
5.18 The student will, given a problem situation, collect, organize, and display a set of numerical data in a variety of forms, using bar graphs, stem-and-leaf plots, and line graphs, to draw conclusions and make predictions.
5.19 The student will find the mean, median, mode, and range of a set of data.
Essential understandings, Correlation to textbooks and knowledge, and skills other instructional materials
The student will use problem solving, mathematical communication, mathematical reasoning, connections, and representations to
• Collect data, using observations (e.g., weather), measurement (e.g., shoe sizes), surveys (e.g., favorite television shows), or experiments (e.g., plant growth).
• Organize the data into a chart or table.
• Construct bar graphs, labeling one axis with equal whole-number or decimal increments and the other axis with attributes of the topic (categorical data) (e.g., skiing, basketball, ice hockey, skating, and sledding as the categories of �Favorite Winter Sports�). Bar graphs will have no more than six categories.
• Display data in line graphs, bar graphs, and stem-and-leaf plots.
• Construct line graphs, labeling the vertical axis with equal whole-number, decimal, or fractional increments and the horizontal axis with continuous data commonly related to time (e.g., hours, days, months, years, and age). Line graphs will have no more than six identified points along a continuum for continuous data (e.g., the decades: 1950s, 1960s, 1970s, 1980s, 1990s, and 2000s).
• Construct a stem-and-leaf plot to organize and display data, where the stem is listed in ascending order and the leaves are in ascending order, with or without commas between leaves.
• Title the given graph, or identify the title.
• Interpret the data to compare the answer to the prediction.
• Write a few sentences to describe the interpretation of the data.
• Calculate the mean of a group of numbers representing data from a given context.
• Determine the median of a group of numbers representing data from a given context.

Mathematics Enhanced Scope and Sequence � Grade Five
Virginia Department of Education 2004 82
• Determine the mode of a group of numbers representing data from a given context.
• Determine the range of a group of numbers representing data from a given context.

Mathematics Enhanced Scope and Sequence � Grade Five
Virginia Department of Education 2004 83
What Does It Mean? Reporting category Probability and Statistics Overview Students find the median, mode, range, and mean of a set of class
data. Related Standard of Learning 5.19 Objectives • Students will find mean, median, range, and mode. • Students will use a variety of graphs to represent data. Materials needed • Linking cubes (counting chips, beans or any other small items may be substituted) • Sticky notes • �Recording Sheet,� one copy for each student Instructional activity 1. Have students predict how many linking cubes they can grab from a bag, using one hand. Have
them record their predictions on their handouts. Record the class predictions on the overhead. 2. Have each student grab a handful of linking cubes from the bag and record the number on their
sheet. Record the class totals on the overhead. 3. Have each students record his or her number on a sticky note. Have students place their sticky
notes on the blackboard from least to greatest. Put sticky notes with the same number in a row to form a bar. Use this to make a bar graph. Discuss the elements that must be included in a bar graph.
4. Have each student connect his or her cubes to build a tower of cubes. 5. Have the students line up at the front of the room with their tower of cubes in hand. Have the
student with the smallest number first in line. Then continue across the room in numerical order. Students should line up in front of each other when they have the same number of cubes. This human bar graph should be similar to the bar graph on the board.
6. Lead the group in a discussion of the measures of central tendency and range. Define range as the difference in the largest and smallest pieces of data. Have the first person in line and the last person in the line move to the middle and compare their stacks of cubes. What is the difference in the two stacks? Record this number as the range of the class data.
7. Define mode as the number that occurs most often. Lead students to discover that the longest line will be the mode. Count if necessary to determine the longest line. Have those students hold up their sticky notes. Record this number as the mode of the class data. There is the possibility of having more than one mode.
8. Define median as the middle number in a group of data that is arranged from smallest to largest or largest to smallest. Have the students discuss how to find the middle of their data. Have students take the hands of the students beside them and then spread out and form one long line. Then have the first person and last person in the line sit down. Continue this process until there are one or two people left standing. If there is only one person left standing have him hold up his sticky note and record this as the class median. If two people are left standing, have them use their cubes to find the number exactly in the middle of the two of their stacks. This will be the median.

Mathematics Enhanced Scope and Sequence � Grade Five
Virginia Department of Education 2004 84
9. Discuss mean and help students understand what it really tells us. Encourage students to share ways they could find the mean using the cubes. Have students share linking cubes with each other until they all have a similar number of cubes. They should share until sharing anymore is not helpful to reach the same number of cubes for each student. More than likely two groups will exist. Some students will have stacks of one number and the other group will have stacks with one more cube. At this point discuss mean and also use the term average.
10. Have students go back to their seats and record the measures of central tendency on their sheets. Review each of the four terms.
Sample assessment • Observe the students as they move through the classroom activity. Put students in groups of five.
Have them each record the number of people living in their home. Have the group try to find the range, mode, median and mean of their data. Circulate and observe the students interaction. Answer any questions as necessary.
Follow-up/extension • Have students keep track of the number of hours of television that they watch each day for a week.
Figure the mode, mean, median, and range of this data. Do the measures of central tendency vary? If they vary greatly, extend the project for 30 days.
• Give students baseball cards and have them determine the player�s batting average (mean). • Each student is given a small pack of M&Ms or Skittles. Make a table of data for various
colors of candy in their packages. Find the mean, mode, range, and median for each color. • Construct paper airplanes, throw the planes a given number of times, and record the distances the
planes fly. Find the mean, mode, median, range for the data.

Mathematics Enhanced Scope and Sequence � Grade Five
Virginia Department of Education 2004 85
Recording Sheet Name Estimation Actual number of cubes I grabbed in one handful Number of students in class Total number of cubes grabbed by class Range of the data Mode(s) of the data Median of the data Mean of the data Write a definition for the following terms:
Range Mode Median Mean

Mathematics Enhanced Scope and Sequence � Grade Five
Virginia Department of Education 2004 86
Hands and Hearts � A Mean Combination! Reporting category Probability and Statistics Overview Students collect data and find the mean, mode, range, and median
and then construct a stem and leaf graph from the data Related Standards of Learning 5.18, 5.19 Objectives • Students will count the number of conversation hearts needed to fill in an outline of their hand. • After sharing individual data, students will find the mean, mode, range, and median of the class
results. • Students will make a stem-and-leaf graph based on the class data. Materials needed • Conversation hearts or any small-size candy • Paper and pencil • �Hands and Hearts � A Mean Combination,� one copy for each student • A chart to record each student�s data Instructional activity 1. After distributing the �Hands and Hearts� handout, ask students to trace one of their hands on the
back of the sheet. Ask the question, �How many candy hearts do you think each person will need to cover the traced hand?� Take predictions and record them on the board.
2. Distribute the hearts and have each child count the number needed to fill in the area of his or her traced hand. Share the data on a chart.
3. Have students record the data on the handout. Discuss who had the most, the least, common numbers, etc., as students record the data.
4. Have students find the mean by telling explaining that it is the numerical average of the data set and is found by adding all the values in the set and dividing the sum by the number of values. Modeling for students will assist those having difficulty. Have students record the mean on the charts.
5. Have students find the mode by determining the piece of data that occurs most frequently in the data set. There may be one, more than one, or no mode in the data set. Instruct students to record the mode on the chart.
6. Arrange the data set in order and have students find the median by determining the piece of data that lies in the middle of the set of data arranged in order. Record the median on the chart.
7. Have students find the range (the spread of a set of data) by subtracting the smallest number in the data from the largest number in the data. Record the range on the chart.
8. Go back to the students� original predictions from the beginning of the lesson. Have students make new predictions based on the study of the data. Ask questions to assist students� understanding of what the numbers tell them about the data.
9. Make a stem-and-leaf graph of the data.

Mathematics Enhanced Scope and Sequence � Grade Five
Virginia Department of Education 2004 87
Sample assessment • Watch carefully as students follow your instructions. Answer all questions that they may ask.
Circulate to be sure that all students understand the directions. Collect the handout and check for accuracy.
Follow-up/extension: • Use feet and another type of candy. Use unifix cubes instead of candy. Share data with another
class. Would you have the same results if this were a first-grade class? Why? • Have students measure and record heights of all students in class. Order the data in a line plot.
Have students find mean, median, range, and mode from the data. • Use Graph Master software for creation of graphs and as a source of data. • Have students survey classmates about their favorite after-school activities and create a bar graph
to show the results. Use a rubric to assess students. Have students answer questions about patterns, make predictions, and recognize trends in their data.
• Collect data, using observations about the weather, shoe sizes, surveys, or experiments and organize into a chart or table. Have students choose the appropriate graph and interpret the data in a few sentences.
• Make a human stem and leaf graph. Ask students to calculate the worth of their name if A=1 cent, B=2 cents, and so on. Have students write the value of their name on a sheet of paper in large, dark print. Have students tear the paper dividing the number between the ones and the tens. On the floor create a stem-and-leaf graph using yarn. Have students come to the graph with their data. Direct students on how to arrange themselves in order correctly on the graph. Have students stand next to the tens digit that would represent their data and hold the ones digit on the leaf side of the graph. Discuss ways to find the range, mode, and median of the data. Share conclusions and describe individual interpretations of the data.
Sample resources www.nces.ed.gov/nceskids/Graphing/ -� An interactive Web site for students that allows them to create
several types of graphs www.aaamath.com/B/sta.htm � An interactive Web site for students with activities to practice finding
mean, median, and mode. http://illuminations.nctm.org/lessonplans/3-5/airplanes/ � In this lesson, students make paper airplanes
and explore attributes related to increasing flight distances. Each student collects data from three flights of the airplane and finds the median distance. Students then collect, organize, display, and interpret the median distances for the class in a stem-and-leaf plot.
http://score.kings.k12.ca.us/lessons/mandm.html � A lesson plan that uses small individual bags of "M&M's" candies to review students� understanding of estimating, sorting, graphing, mean, median, mode, fractions, percentage, and averaging.
www.manatee.k12.fl.us/sites/elementary/palmasola/mathlabtutstat1.htm � A tutorial for students involving mean, median, and mode.
http://www.brainpop.com/math/dataprobability/meanmodemedianrange/index.weml � An interactive Web site for students using probability concepts.

Mathematics Enhanced Scope and Sequence � Grade Five
Virginia Department of Education 2004 88
Hands and Hearts � A Mean Combination How many hearts do you think it will take to cover an outline of a fifth grader�s hand? ____________ Directions:
1. Carefully trace your hand on the back of this sheet.
2. Use the candy hearts to cover the outline. Count the number of hearts you used.
3. Record the data: ___________
4. Share the data with the class by recording it on the chart.
5. Record the data set of the class below.
6. Find the mean of the data set.
7. Find the mode of the data set.
8. Find the median of the data set.
9. Find the range of the data set.
10. Go back to your prediction. Were you correct?
How would you answer that question now?
What can you conclude about the data?
`

Mathematics Enhanced Scope and Sequence � Grade Five
Virginia Department of Education 2004 89
11. Make a stem and leaf graph of the class data.
STEM LEAF

Mathematics Enhanced Scope and Sequence � Grade Five
Virginia Department of Education 2004 90
Released SOL test items The table shows the height of a bean plant over a 5-day period.
1. Which of the following shows this data correctly graphed?
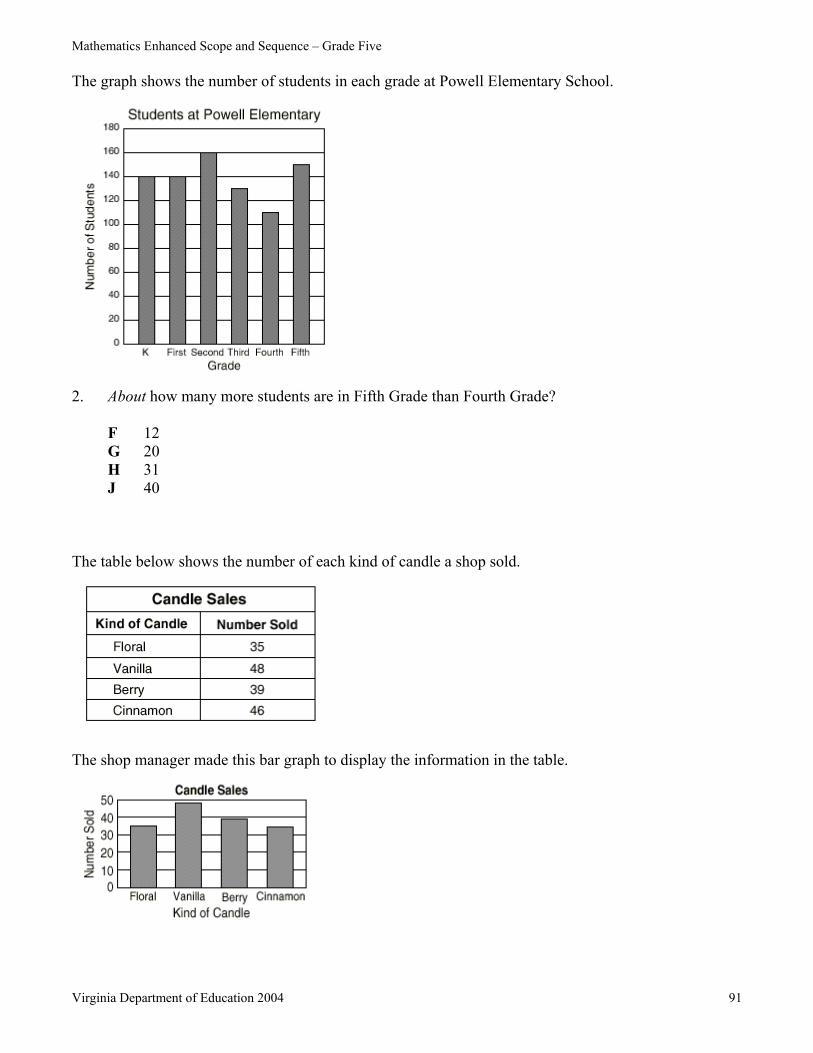
Mathematics Enhanced Scope and Sequence � Grade Five
Virginia Department of Education 2004 91
The graph shows the number of students in each grade at Powell Elementary School.
2. About how many more students are in Fifth Grade than Fourth Grade?
F 12 G 20 H 31 J 40
The table below shows the number of each kind of candle a shop sold.
The shop manager made this bar graph to display the information in the table.

Mathematics Enhanced Scope and Sequence � Grade Five
Virginia Department of Education 2004 92
3. Which of the amounts from the table is not graphed correctly?
A Floral B Vanilla C Berry D Cinnamon
This list shows the number of cans each student in Angelo�s class collected for recycling.
4. Which of the following stem-and-leaf plots shows this same information?

Mathematics Enhanced Scope and Sequence � Grade Five
Virginia Department of Education 2004 93
The table below shows the number of babysitting jobs Millie and her friends had last month.
5. What was the mean (average) number of babysitting jobs Millie and her friends had last month?
F 7 G 8 H 9 J 13
The table below shows the number of basketball tickets Mr. Graham�s students sold last week.
6. Which of the following shows this information correctly
graphed?

Mathematics Enhanced Scope and Sequence � Grade Five
Virginia Department of Education 2004 94
Organizing Topic Probability Standards of Learning
5.17 The student will a) solve problems involving the probability of a single event by using tree diagrams or by
constructing a sample space representing all possible results; b) predict the probability of outcomes of simple experiments, representing it with fractions or
decimal numbers from 0 to 1, and test the prediction; and c) create a problem statement involving probability and based on information from a given
problem situation. Students will not be required to solve the created problem statement.
Essential understandings, Correlation to textbooks and knowledge, and skills other instructional materials
The student will use problem solving, mathematical communication, mathematical reasoning, connections, and representations to
• Construct a sample space, using a tree diagram to identify all possible outcomes of a single event.
• Construct a sample space, using a list or chart to represent all possible outcomes of a single event.
• Determine the probability of a single event when the total number of possible outcomes is 12 or less.
• Determine the outcome of an event that is least likely to occur (0) or most likely to occur (1) when the number of possible outcomes is 12 or less.
• Create a problem statement involving probability based on information from a given problem situation. Students will not be expected to solve the problem.

Mathematics Enhanced Scope and Sequence � Grade Five
Virginia Department of Education 2004 95
It�s in the Bag Reporting category Probability and Statistics Overview Students conduct probability experiments to predict outcomes. Related Standard of Learning 5.17 Objectives • Students will demonstrate an understanding of vocabulary related to probability. • Students will create a problem involving probability. Materials needed • Paper bags • Colored tiles • �It�s in the Bag,� one copy for each student Instructional activity 1. Discuss probability as being favorable outcomes/possible outcomes. Use data derived from
members of the class to provide data for examples. �If I put all of the students� names into a hat, what is the probability I would draw a girl�s name? A boy�s name?�
2. Put the students into pairs. Give each pair a paper bag with 10 color tiles inside. (7 blue and 3 red) Without looking into the bag, have students pull out one tile and record the color on the handout. Then return the tile to the bag. Have the pairs continue with this process until they have pulled 10 tiles. As the pairs finish, have them record their results on a class graph at the front of the room.
3. After the class data has been compiled, have students look at the total number of blue and red tiles pulled and make a prediction about the number of blue and red tiles in the bag. When everyone has predicted, discuss the predictions and the reasons for them.
4. Have the pairs look in the bags and record the actual number of each tile. Discuss why their predictions may have differed from the actual number. What was helpful in making their predictions?
5. Repeat, using bags with three colors of tiles. Discuss the differences. Sample assessment • Watch carefully as students follow your instructions. Answer all questions that they may ask.
Circulate to be sure that all students are understanding and recording correctly. As students make predictions, circulate to see if they are reasonable. Discuss how they made their predictions, especially with students whose predictions seem way off.
Follow-up/extension • Have students put a specified number of each color in the bag and tell the probability of drawing
each color. Have them draw 10 tiles and discuss how close their actual result was to the expected result. Compile class data on the experiment. Was this data closer to the expected outcome? Why?
• Provide students with various spinners and have them construct the sample space of possible outcomes and then conduct experiments with the spinners to determine experimental probability. Students can compare the theoretical probability to the experimental probability.

Mathematics Enhanced Scope and Sequence � Grade Five
Virginia Department of Education 2004 96
• Create a menu with three sandwich choices, 2 drink choices, and 3 dessert choices. Have students create a tree diagram to show all of the different meals that could be created.
• Two Dice Toss: Have students write the numbers 1-12 down the left side of a piece of paper. Students roll two dice, find the sum, and record it for a specified number of times (20-30). Students can then discuss the results. Have students construct a sample space to show all of the possible outcomes for the two dice and determine why some sums are more likely to occur than others are. (See Probability and Statistics Module Session V, Activity 4, �The Regatta.�)
• What�s the Problem? Show students a collection of twelve or fewer objects, some of which are the same. Have students write probability problem statements based on the probability of choosing a particular object. Students can share their statements with the rest of the class.
• Have students create their own lesson to share with small groups of third- or fourth-graders. Have students develop a lesson plan as well as a worksheet with a probability situation. Use a rubric to grade students on their performance.
• Have students determine the theoretical probability of getting rocks, paper, or scissors. Play the game 30 times with a partner and record the experimental probability and compare results.
• Draw a number line on the board that starts with 0 and goes to 1. Label a few points on the line. Above the 0, write impossible. Above the 1, write certain. Give students strips of paper with situations on them. (You will see a dinosaur as you walk home today. It will get dark tonight. It will rain tomorrow.) Have them read their paper to the class and then place it where they feel it should go on the number line. Include some situations that will fall at different locations on the line.
• Put students in pairs. Give each pair a sheet with boxes labeled 1-12. Give each student 12 counting chips (use a different color for each partner) and have them place their chips anywhere on the board without guidance from the teacher. They can place more than one chip on a number. Tell them they will be rolling 2 dice and removing chips from the gameboard. For example, if you role a seven, you get to remove one of your chips from the seven. Have them play until someone wins or until no one can win. Then discuss the probability of getting each number. Let them then use this knowledge to play the game again.
• Have students determine the most frequently used letters from the alphabet. Have students count the first 100 words in any book they choose. Tally the number of times each letter is used in those 100 words. Have them answer, �What is the most used letter?� Compare results for the entire class. Ask students what letter they would first guess in a hangman game.
• Take a class survey to find out which of three flavors of ice cream students prefer. Find the experimental probability of each flavor. Now have students survey 20 friends at lunch and compare results.
Sample resources http://rec-puzzles.org/probability.html � A Web site containing many word problems involving
probability and their solutions. http://nces.ed.gov/nceskids/probability � National Center for Education Statistics Web site with
probability activities for students and many other resources. http://mathforum.org/dr.math/faq/faq.boy.girl.html � Probability activities and information from the
Math Forum. http://standards.nctm.org/document/chapter5/data.htm#bp4 � NCTM�s Principles and Standards
information about probability at the 3-5 grade levels.

Mathematics Enhanced Scope and Sequence � Grade Five
Virginia Department of Education 2004 97
http://www.pbs.org/teachersource/mathline/lessonplans/esmp/chances/chances_procedure.shtm � PBS lesson plan on probability.
http://mathforum.org/probstat/probstat.lessons.html � lesson plans from the Math Forum on probability. Probability and Statistics Professional Development Module � Available from VDOE Web site.
Contains activities related to this strand that can be modified for student use. Navigating through Data Analysis and Probability in Prekindergarten through Grade 2 � Available
from NCTM. Contains additional lessons for data analysis activities.

Mathematics Enhanced Scope and Sequence � Grade Five
Virginia Department of Education 2004 98
It�s in the Bag
Blue
Red My prediction:
There are _____ blue tiles in the bag. There are _____ red tiles in the bag.
Actual results:
There are _____ blue tiles in the bag. There are _____ red tiles in the bag.
Try again with three colors.
Blue
Red
Yellow
My prediction:
There are ______ blue tiles in the bag. There are ______ red tiles in the bag. There are ______ yellow tiles in the bag.
Actual results:
There are _____ blue tiles in the bag. There are _____ red tiles in the bag.
There are _____ yellow tiles in the bag.

Mathematics Enhanced Scope and Sequence � Grade Five
Virginia Department of Education 2004 99
Released SOL test items
1. Jill put the marbles shown above into a bag and
shook the bag. Which of the following questions about the marbles could you use probability to solve? F How many marbles did Jill put in the bag
all together? G If Bob picks 1 marble from the bag
without looking, what color will it most likely be?
H How many more black marbles than white marbles did Jill put in the bag?
J If Andy takes 1 marble from the bag, how many marbles will be left in the bag?
The spinner shown below is used to play a game.
2. What is the probability that the arrow will land
on a number greater than 5?
A 3/5 B 3/8 C 5/8 D 1

Mathematics Enhanced Scope and Sequence � Grade Five
Virginia Department of Education 2004 100

Mathematics Enhanced Scope and Sequence � Grade Five
Virginia Department of Education 2004 101
Organizing Topic Patterns, Functions, and Algebra Standards of Learning
5.20 The student will analyze the structure of numerical and geometric patterns (how they change or grow) and express the relationship, using words, tables, graphs, or a mathematical sentence. Concrete materials and calculators will be used.
5.21 The student will a) investigate and describe the concept of variable; b) use a variable expression to represent a given verbal quantitative expression involving one
operation ; and c) write an open sentence to represent a given mathematical relationship, using a variable.
5.22 The student will create a problem situation based on a given open sentence using a single variable.
Essential understandings, Correlation to textbooks and
knowledge, and skills other instructional materials
The student will use problem solving, mathematical communication, mathematical reasoning, connections, and representations to
• Describe numerical and geometric patterns formed by using concrete materials and calculators.
• Express the relationship found in numerical and geometric patterns, using words, tables, graphs, or a mathematical sentence.
• Describe the concept of a variable (presented as boxes, letters, or other symbols) as a representation of an unknown quantity.
• Use a variable expression to represent a given verbal expression involving one operation (e.g., �5 more than a number� can be represented by x + 5).
• Write an open sentence with addition, subtraction, multiplication, or division, using a variable to represent a missing number.
• Create and write a word problem to match a given open sentence with a single variable and one operation.

Mathematics Enhanced Scope and Sequence � Grade Five
Virginia Department of Education 2004 102
Writing Algebraic Expressions Reporting category Patterns, Functions, and Algebra Overview Students extend their understanding of the concept of a variable
and based on a problem situation, write algebraic expressions involving each operation.
Related Standard of Learning 5.21 Objectives • Students will define variable. • Students will write and match algebraic expressions using all four operations. Materials needed • Magazines or newspapers • Paper and pencil • �Writing Algebraic Expressions,� one copy for each student • Index cards Instructional activity 1. Discuss the concept of a variable as a symbol (expressed as boxes, letters, or other symbols),
representing an unknown quantity. Give several examples. 2. Discuss the concept of a variable expression as being like a phrase that does not have a verb or a
mathematical expression does not have an equal symbol. Numbers are used when they are known; variables are used when the numbers are unknown.
3. Discuss and complete the handout, detailing how to write a variable expression using each operation.
4. On a piece of chart paper, make a list of possible vocabulary to use for each operation for review with students. Example: for addition use plus, more than, in addition to. Stress to students to focus and visualize the situation discussed in order to target the operation used.
5. Distribute magazines or newspapers to students. Have them select a picture to describe, using algebraic expressions, and paste the picture on a sheet of paper. Model for students with an example.
6. Direct students to write algebraic expressions in words about their picture. Students should use the vocabulary discussed above. Circulate to help students with each expression.
7. After checking for accuracy, have students record the expressions using words under the picture. 8. Distribute four index cards to each student and have them write the expression using symbols. 9. Group students and have them match the correct index card with the expression. For example, 4
more than a number would match with n+4. Have students rotate and match the expressions. 10. When finished, display student work on a bulletin board. Sample assessment • Watch carefully as students follow your instructions. Answer all questions that they may ask.
Circulate to be sure that all students understand the directions.

Mathematics Enhanced Scope and Sequence � Grade Five
Virginia Department of Education 2004 103
Follow-up/extension: • Write, using open sentences with different pictures. • Use a shoebox to create a magical machine called �Freda�s Function Machine.� Cut two openings,
one to use as input and another as output. Explain that students must determine the function that occurs in the machine. For example, 2 goes in 5 comes out, 3 goes in 6 comes out. Have students make a function table.
• Show students some open sentences (5 + x = 7) Explain that the x represents an unknown quality known as a variable. Use different number sentences with letters and other symbols.
• Use a mystery box to hide an unknown quantity. Hide a certain number of cubes in the box and make a number sentence using a variable to represent the unknown quantity in the box.
• I Have, Who Has game: Prepare cards that have a statement and a question; for example, �I have 4 + n. Who has 15 more than a number?� Give one card to each student. One student begins by reading his or her question. All students must listen and see if their answer statement matches. If it does, then that student reads the answer on their card and the new question. Play continues until the student who began has the answer on his or her card.
• Make a concentration/memory game. Prepare cards with a problem situation to match with an open sentence. Use all operations and different variables such as letters, boxes, or other symbols.

Mathematics Enhanced Scope and Sequence � Grade Five
Virginia Department of Education 2004 104
Writing Algebraic Expressions What is a variable? When writing algebraic expressions, read the situation being described and focus on the operation used. For example: �A box of cookies and four extra�
What operation is used? What variable will you use? What is the known number? Write the expression as
�Three full boxes of cookies�
What operation is used? What variable will you use? Write the expression as
�A full box shared among four�
What operation is used? What variable will you use? Write the expression as
�A box of cookies minus four�
What operation is used? What variable will you use? Write the expression as

Mathematics Enhanced Scope and Sequence � Grade Five
Virginia Department of Education 2004 105
Variables in Open Sentences Reporting category Patterns, Functions, and Algebra Overview Students review various types of open sentences and identify a
sequence of steps for developing the concept of open sentences. Related Standard of Learning 5.21 Objective • Students explore the development of variables in open sentences. Materials needed • �Variables in Open Sentences� (four pages), one copy for each student • �Variables in Open Sentences� transparencies • Scissors Instructional activity 1. Have each student complete �Variables in Open Sentences,� solving the simple �open sentences�
to make them �true sentences.� 2. Then, have the students work in pairs. Ask one of the students in each pair to cut up his or her
handout into 16 cards. 3. Encourage students to skip around on one card. It may be easier to solve the second equation first.
Talk about why they chose to solve it their way. Answers A: = 3 B: = 3 C: = 4 D: = 6 E: = 4 = 5 = 4 = 3 = 2 = 5 F: = 2 G: = 4 H: = 5 I: = 1 J: = 5 = 4 = 3 = 4 = 2 K: = 5 L: = 7 M: A N: C O: = 5 P: B = 2 = 5 = 6 = 4 Q: = 8 R: = 5 S: = 2 T: = 5 = 5 = 4 = 3 = 7 = 8

Mathematics Enhanced Scope and Sequence � Grade Five
Virginia Department of Education 2004 106

Mathematics Enhanced Scope and Sequence � Grade Five
Virginia Department of Education 2004 107
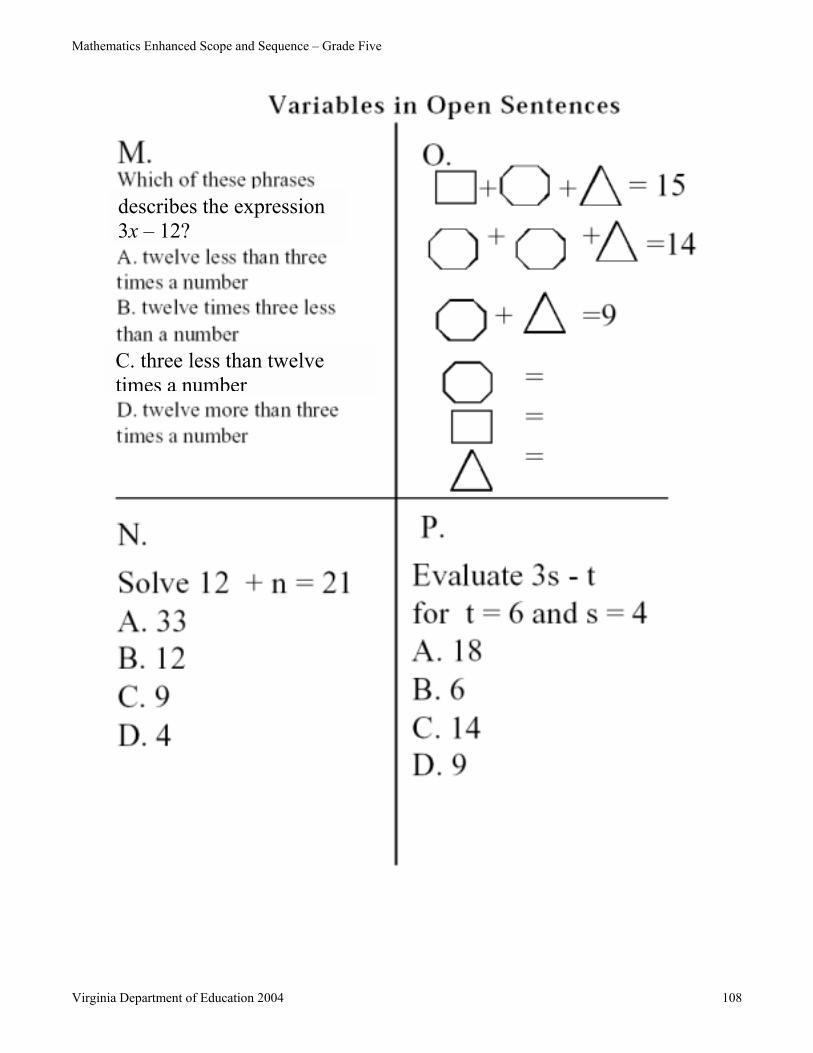
Mathematics Enhanced Scope and Sequence � Grade Five
Virginia Department of Education 2004 108
C. three less than twelve times a number
describes the expression 3x � 12?
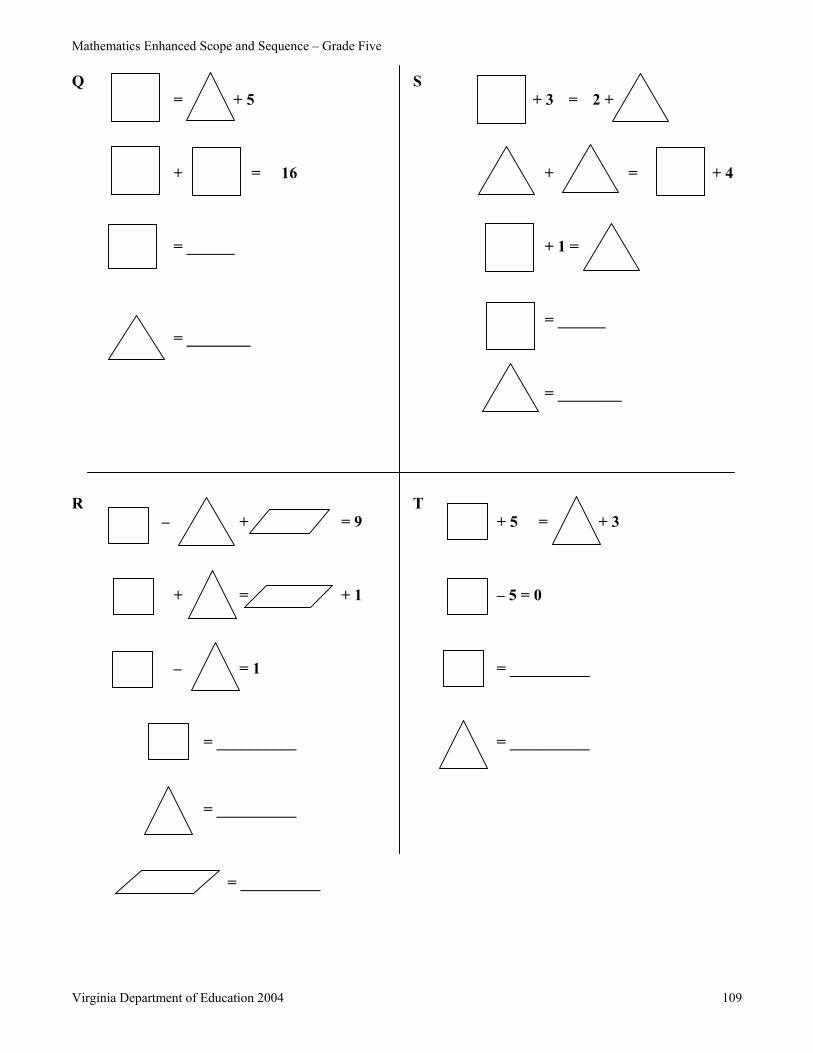
Mathematics Enhanced Scope and Sequence � Grade Five
Virginia Department of Education 2004 109
Q S = + 5 + 3 = 2 + + = 16 + = + 4 = ______ + 1 = = ______ = ________ = ________ R T � + = 9 + 5 = + 3 + = + 1 � 5 = 0 � = 1 = __________ = __________ = __________ = __________ = __________

Mathematics Enhanced Scope and Sequence � Grade Five
Virginia Department of Education 2004 110
Pick Your Pattern Reporting category Patterns, Functions, and Algebra Overview Students analyze and make predictions about patterns. Related Standard of Learning 5.20 Objectives • Students will use concrete items to extend a pattern. • Students will write a rule for the pattern. Materials needed • Toothpicks Instructional activity 1. Give each student a blank sheet of paper and toothpicks. 2. Have students make a square out of the fewest possible toothpicks and record the data on the
paper. 3. Show them the next three terms in the sequence. 4. Have the students form the three terms and create a recording chart. 5. Have students try to determine the rule for the pattern by looking at the
chart as a function machine with the number of squares as the input and the number of toothpicks as the output. Example: (n × 3) + 1
6. Students should then use their rule to determine how many toothpicks would be needed to make 5 connected boxes.
7. Have the students make the figure with five boxes and count to see if their rule worked. If not, they need to formulate a new rule.
8. Students should then test the rule for six squares. 9. Would the rule be the same if the squares were attached in a different way? 10. Have students experiment with different designs such as a staircase to see if they can use their old
rule or if they must formulate a new rule. 11. Let students experiment with different formations. Follow-up/extension • Have students experiment with triangles, hexagons or other shapes.
# of squares
# of toothpicks
1 4

Mathematics Enhanced Scope and Sequence � Grade Five
Virginia Department of Education 2004 111
• Use pattern blocks to demonstrate both repeating and growing patterns. Students should be able to identify and describe the core for repeating patterns, and identify and describe the growth that is occurring in growing patterns. After several teacher-directed examples, pair students and have one child establish a pattern and the other child describe and extend it. Students can record some of their patterns by tracing and coloring the pattern blocks.
• Working with partners, students can use a strip of adding machine tape to create a pattern and then exchange pattern strips with a partner. Discuss the patterns as either growing or repeating.
Sample resources http://www.pen.k12.va.us/VDOE/Instruction/Elem_M/mathtrain.html
Select resources from above for Session 4: Functional Machines, Functional Relationships, Graphing Functions. Session 5: Equivalence: �Seesaw Balances� Activity 3, Solving Equations: �Can You Make This
Balance?� Activity 4, �Weighty Problems Balance Those Blocks� Activity 5, �Mobilettes� Activity 7, �Coat Hanger Balances� Activity 8.
www.brainpop.com/math/algebra/equationswvar/index.weml � Interactive Web site for students using algebraic concepts.
www.mathgoodies.com/lessons/vol7/equations.html � Lessons on writing algebraic equations. http://math.rice.edu/~lanius/Lessons/calen.html � An algebraic activity that uses the calendar. www.matti.usu.edu - A library of virtual manipulatives and lesson plans.

Mathematics Enhanced Scope and Sequence � Grade Five
Virginia Department of Education 2004 112
Released SOL test items 1. If B represents a number, which means �a number divided by 9?
F B + 9 G B � 9 H 9 ÷ B J B ÷ 9
2. If this pattern continues, what will the eleventh shape look like?
The picture below shows what happened when the numbers 2, 9, and 16 were put into the same number machine.
3. If the number 20 is put into the same number machine, what number should come out?
A 24 B 26 C 27 D 29

Mathematics Enhanced Scope and Sequence � Grade Five
Virginia Department of Education 2004 113
4. Which of these could be solved by using the open sentence A � 5 =?
F Janis is 5 years older than Seth. If A is Seth�s age in years, how old is Janis? G Todd is 5 years younger than Amelia. If A is Amelia�s age in years, how old is Todd? H Isaac is 5 times as old as Bert. If A is Bert�s age in years, how old is Isaac? J Nathan is one-fifth as old as Leslie. If A is Nathan�s age, how old is Leslie?
5. Elizabeth made 3 times as many home runs during baseball season as her friend Tanya. If R
represents the number of home runs Tanya made, which expression can be used to find the number of home runs Elizabeth made this season?
F R ÷ 3 G R + 3 H R � 3 J R × 3
These figures form a pattern.
6. If the pattern continues, what will the next shape look like?