fifth grade experiment booklet spring 2018 · historically, hurricanes have impacted millions of...
TRANSCRIPT
1
Fifth Grade Experiment Booklet
Spring 2018
2
Table of Contents Acknowledgment ................................................................................................................... 3
Summary of Intervention Objectives .................................................................................... 4
Unit One: Weather ................................................................................................................ 5 Lesson one: How to understand and use historical weather data: .................................................. 6
Tracking Hurricane Paths .................................................................................................................... 6 Hurricane Data .................................................................................................................................... 9 Assessment ........................................................................................................................................ 11
Lesson Two: Making a precipitation station ................................................................................. 12 Weather Station ................................................................................................................................. 12 First: Build an Anemometer to Measure Wind Speed ........................................................................ 13 Assessment ........................................................................................................................................ 16 Second: Build a Weather Vane to Find Wind Direction .................................................................... 17 Assessment ........................................................................................................................................ 19 Third: Build a Barometer for Measuring Atmospheric Pressure ...................................................... 20 Assessment ........................................................................................................................................ 22 Fourth: Build a Screened Thermometer to Measure Air Temperature .............................................. 23 Assessment ........................................................................................................................................ 24 Fifth: Build a Rain Gauge to Measure Rainfall ................................................................................. 25 Assessment ........................................................................................................................................ 27
Lesson Three: Cloud particles and cloud formation .................................................................... 28 Experiment 1: Water Cycle ............................................................................................................... 28 Assessment ........................................................................................................................................ 29 Worksheet 1: The Clouds .................................................................................................................. 32 Day Two - Exploration Activity: ....................................................................................................... 34 Worksheet 2: Partly Cloudy Skies ..................................................................................................... 35 Day Three - Elaboration Activity: ..................................................................................................... 36 Data Sheets ........................................................................................................................................ 37
Unit Two: Sustainable Materials ......................................................................................... 39 Lesson One: Helpful Hydrogels .................................................................................................... 40
Helpful Hydrogels-Lab Procedure ..................................................................................................... 42 Helpful Hydrogels-Career Information ............................................................................................. 44 Assessment ........................................................................................................................................ 45 Lesson Two: Fermentation in a Bag: ................................................................................................. 48 Fermentation in a Bag- Lab Procedure: ............................................................................................. 50 Fermentation in a Bag-Career Information ........................................................................................ 51 Fermentation in a Bag Data Table ..................................................................................................... 52 Assessment ........................................................................................................................................ 53 Fermentation in a Bag-Lab Questions-Teacher Key ......................................................................... 54 Lesson 3: Good Guide Worksheets .................................................................................................. 56 Assesesment ...................................................................................................................................... 57

3
Acknowledgment
The Rural STEM Outreach Program is supported by ND EPSCoR and NSF Award #OIA 1355466. Materials contained in this booklet were created and compiled by multiple individuals. The source for each lesson is included along with citations and copyright information. While many of these materials have been modified, specifically to adhere to North Dakota education standards, these materials are not the sole creation of any faculty or staff affliated with EPSCoR.

4
Summary of Intervention Objectives Students will be able to:
1. Demonstrate an understanding of historical weather data analysis.
2. Interpret the increase of climate temperature over years.
3. Explain the process of weather forecasting.
4. Set up basic instruments to collect weather data.
5. Categorize the types of clouds.
6. Discover the process of cloud formation.
7. Describe how matter is too small to be seen through analyzing hydrogels before and after
exposure to water.
8. Support an argument that plants get the material they need from water in the soil.
9. Identify how water travels through a plant's roots to provide it with sustenance.
10. Identify biofuels as one way that communities are using science ideas to protect the
Earth's resources and environment.
11. Make observations about experiment materials as they relate to the properties of the
materials.
5
Unit One: Weather This unit is designed to help students understand weather phenomena and apply some scientific
strategies to forecast the weather. In addition, this unit will help students understand some
historical weather events that threatened the United States, such as hurricanes. Since weather has
a significant impact on our daily lives, students will be able to conduct some observations to
understand cloud particles and formation.
6
Lesson one: How to understand and use historical weather data: Tracking Hurricane Paths1
Standards:
• Social Studies 1: 5.1.4: Construct and interpret time lines of key events in the United States history.
• 5-ESS3-1. Obtain and combine information about ways individual communities use science ideas to protect the Earth’s resources and environment.
• RL.1: Quote accurately from a text when explaining what the text says explicitly and when drawing inferences from the text.
• 5.G.1: Use a pair of perpendicular number lines, called axes, to define a coordinate system, with the intersection of the lines (the origin) arranged to coincide with the 0 on each line and a given point in the plane located by using an ordered pair of numbers, called its coordinates. Understand that the first number indicates how far to travel from the origin in the direction of one axis, and the second number indicates how far to travel in the direction of the second axis, with the convention that the names of the two axes and the coordinates correspond (e.g., x-axis and x- coordinate, y-axis and y-coordinate).
Objectives: Students will be able to:
• Interpret various historical weather events that threaten lives with an 80% rate of success under the teacher’s supervision.
• Track historical hurricane paths by plotting the locations of different storms. • Write statements about the hurricane phenomena with an 85% rate of accuracy. • Employ acquired knowledge to determine the most impacted states with an 85% rate of
success. • Explain the importance of these historical events and demonstrate knowledge regarding
how to protect their communities. Time: 45 minutes Materials: Maps and Hurricane data Background: Historically, hurricanes have impacted millions of people and resulted in economic damage. To understand the nature of hurricanes, it is important to recognize the differences between tropical depressions, tropical storms, and hurricanes. According to National Oceanic and Atmospheric Administration,
1 The lesson retrieved and adapted from NOAA. http://oceanservice.noaa.gov/education/for_fun/FollowthatHurricane.pdf
7
Tropical depressions, tropical storms, and hurricanes are all cyclones, which are areas of low pressure in the atmosphere that have a spiraling inward pattern of air movement. In the Northern Hemisphere, the spiral turns counterclockwise, while cyclones in the Southern Hemisphere have spirals that turn clockwise. (n.d)
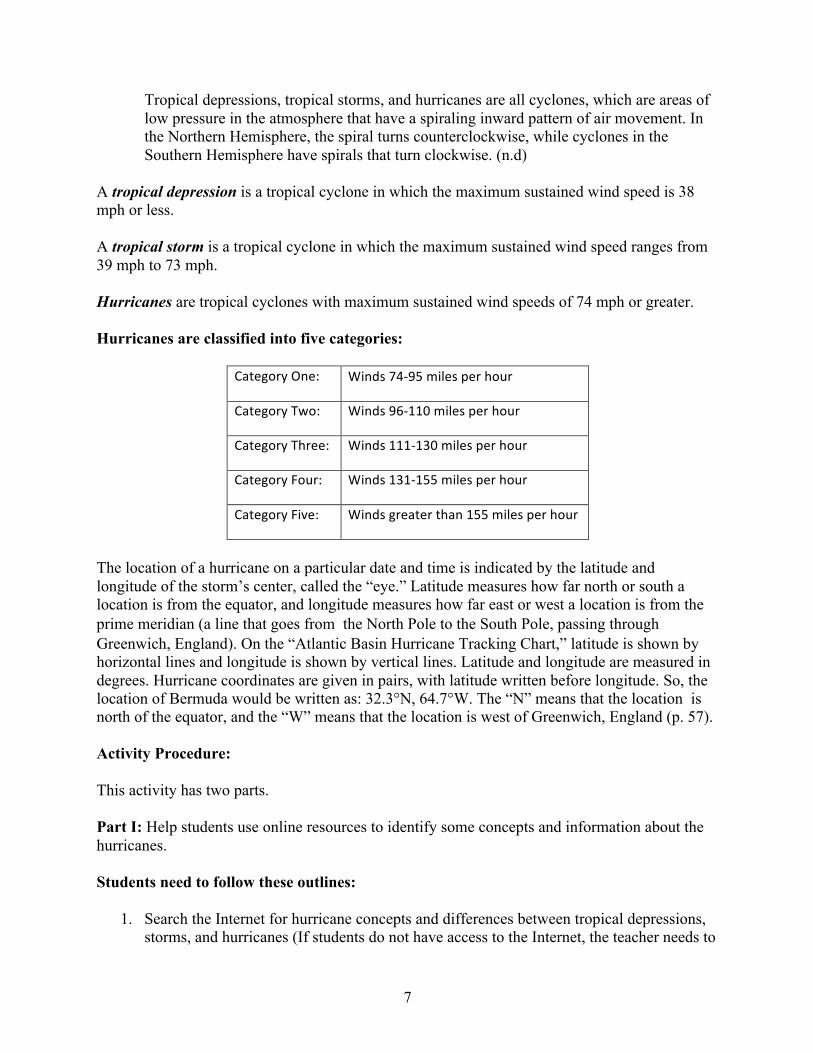
A tropical depression is a tropical cyclone in which the maximum sustained wind speed is 38 mph or less. A tropical storm is a tropical cyclone in which the maximum sustained wind speed ranges from 39 mph to 73 mph. Hurricanes are tropical cyclones with maximum sustained wind speeds of 74 mph or greater. Hurricanes are classified into five categories:
Category One: Winds 74-‐95 miles per hour
Category Two: Winds 96-‐110 miles per hour
Category Three: Winds 111-‐130 miles per hour
Category Four: Winds 131-‐155 miles per hour
Category Five: Winds greater than 155 miles per hour
The location of a hurricane on a particular date and time is indicated by the latitude and longitude of the storm’s center, called the “eye.” Latitude measures how far north or south a location is from the equator, and longitude measures how far east or west a location is from the prime meridian (a line that goes fromthe North Pole to the South Pole, passing through Greenwich, England). On the “Atlantic Basin Hurricane Tracking Chart,” latitude is shown by horizontal lines and longitude is shown by vertical lines. Latitude and longitude are measured in degrees. Hurricane coordinates are given in pairs, with latitude written before longitude. So, the location of Bermuda would be written as: 32.3°N, 64.7°W. The “N” means that the location is north of the equator, and the “W” means that the location is west of Greenwich, England (p. 57). Activity Procedure: This activity has two parts. Part I: Help students use online resources to identify some concepts and information about the hurricanes. Students need to follow these outlines:
1. Search the Internet for hurricane concepts and differences between tropical depressions, storms, and hurricanes (If students do not have access to the Internet, the teacher needs to
8
provide students with handouts that contain the necessary information). 2. Write the finding in clear sentences using paraphrasing techniques. 3. Discuss the findings in groups under teacher’s supervision and guidance.
Part II: Help students learn about historical storms that impacted the United States over the past decades. The teacher needs to:
1. Explain the work for students. 2. Distribute the worksheets. 3. View the data on the board using the projector. 4. Ask students to:
a. Find the latitude of the storm and match that with the longitude. b. Find all the places on the map where the two lines intersect. c. Draw a line across all the plots.
5. Ask students to repeat the previous step with the other hurricane data. 6. Ask students to color hurricane paths according to their speeds (color guidelines are in
the map). 7. Ask students to answer these questions in the worksheet 1. 8. Ask students to generate some ideas for protecting themselves from hurricanes and
disaster events.

9
Hurricane Data

10

11
Assessment 1. Which countries does this hurricane affect? What do you observe
about the direction of its traveling and its path? ……………………….
……………………………………………………………………………...
……………………………………………………………………………............................
……………………………………………………………………………............................
2. Complete the following sentences with appropriate information:
a. The hurricanes that hit Florida or got close are ……………… and ……………….
b. These hurricanes impact many states, including …………………………………..,
……………………., ………………………, ……………………………………..,
……………………., …………………………., ………………………….……….
c. The most dangerous hurricane that has high speed is ……………………………...
d. I notice that the hurricanes paths are ……………………………………………….
e. The most impacted part of the United States is ……………………………………
f. The longest hurricane path is ………………………………………………………
g. Powerful hurricanes can result in …………………………… that can leave the
uninhabitable areas for ………. or longer.
3. Draw a line to connect the term with the right definition:
Weather Tropical storm with sustained wind of 39-
73 mph.
Tropical storm The happenings of the atmosphere at a
given time and place.
Hurricane is a tropical cyclone with the maximum wind speed of
38 mph or less.
Tropical Depression A violent Strom that forms over warm ocean and move
to lands with more than 75 mph.
12
Lesson Two: Making a precipitation station Weather Station2
Standards:
• 3-5-ETS1-1: Define a simple design problem reflecting a need or a want that includes specified criteria for success and constraints on materials, time, or cost.
• 5ES4. Energy from the sun heats Earth unevenly, causing air movements that result in changing weather patterns. As a basis for understanding this concept, students know:
1. That uneven heating of Earth causes air movements (convection currents). 2. The influence that the ocean has on the weather and the role that the water cycle
plays in weather patterns. 3. The causes and effects of different types of severe weather. 4. How to use weather maps and data to predict local weather and know that weather
forecasts depend on many variables. 5. That Earth’s atmosphere exerts a pressure that decreases with distance above
Earth’s surface and that at any point it exerts this pressure equally in all directions.
• 5.OA.1 Use parentheses, brackets, or braces in numerical expressions, and evaluate expressions with these symbols.
• 5.NF.4 Apply and extend previous understandings of multiplication to multiply a fraction or whole number by a fraction.
• 5.MD.1 Convert among different-sized standard measurement units within a given measurement system (e.g., convert 5 cm to 0.05 m), and use these conversions in solving multi-step, real world problems.
Objectives: Students will be able to:
• Construct a weather station that can generate data with 90% of accuracy. • Demonstrate understanding of how forecasters collect weather data by providing an oral
and written explanations. • Generate weather data to be use for weather forecasting purposes.
Time: Three 45-minute classes Description and Procedures: This lesson includes five different experiments in regards to weather station measurements. Each experiment has specific description of needed materials, procedures, and recommended assessments.
2 This lesson borrowed and retrieved from http://oceanservice.noaa.gov/education/for_fun/BuildyourownWeatherStation.pdf

13
First: Build an Anemometer to Measure Wind Speed
Materials:
1. Five paper cups - Three-ounce size 2. Two straight plastic soda straws 3. Straight pin 4. Paper punch 5. Stapler 6. Sharp pencil with eraser 7. Felt tip marker 8. Watch or timer
Warning: Be careful with the straight pin! Background: What Is Wind? Air may not seem like anything at all; in fact, we look right through it all the time, but during a windstorm, air really makes its presence known. Wind is able to lift roofs off buildings, blow down power lines and trees, as well as cause highway accidents as gusts push around cars and trucks. Wind is moving air and is caused by differences in air pressure3 within our atmosphere.4 Air under high pressure moves toward areas of low pressure. The greater the difference in pressure, the faster the air flows.
3 air pressure: https://scied.ucar.edu/webweather/weather-ingredients/pressure

14
Note: here students will learn about the definition of air pressure; then, they will do the experiment on how to measure it later. The Fastest Winds: In 1934, on the roof of a little wooden building atop Mount Washington, in New Hampshire, an instrument to measure wind speed, called an anemometer, made history. It recorded a wind speed of 231 miles per hour (mph) during a huge spring storm, the fastest wind gust ever recorded with the instrument! More recently, sophisticated Doppler radar has been used to measure winds, recording a wind speed of 318 mph in an Oklahoma tornado in 1999. That’s faster than the top speeds of Japanese bullet trains and over three times quicker than the fastest baseball pitch. Describing Wind: Wind is described with direction and speed. The direction of the wind is expressed as the direction from which the wind is blowing. For example, easterly winds blow from east to west, while westerly winds blow from west to east. Winds have different levels of speed, such as “breeze” and “gale”, depending on how fast they blow. Wind speeds are based on the descriptions of winds in a scale called the Beaufort Scale, which divides wind speeds into 12 different categories, from less than 1 mph to more than 73 mph.
Resource: https://scied.ucar.edu/shortcontent/wind https://www.weather.gov/mfl/beaufort
Activity Procedure:
1. Using a paper punch, punch a hole in four paper cups about 1/2-inch below the rim of the cups.
2. Punch four equally spaced holes in a fifth paper cup about 1/4-inch below the rim, and a fifth hole in the center of the bottom of the cup (you will probably need to use the pencil to make the hole in the bottom).
3. Push a soda straw through the hole in one of the first four cups. Flatten the end of the straw and staple it to the side of the cup opposite the hole. Repeat this step with the other straw and another of the first four cups.
4. Slide one of the cup and straw assemblies through two opposite holes in the side of the fifth cup. Push another one-hole cup onto the straw, and turn this cup so that the open ends of the two cups on the straw face in opposite directions. Flatten the end of the straw, and staple it to the side of the second cup. Measure the distance between the centers of the two cups. This is the diameter of your anemometer.
5. Repeat Step 4 with the remaining cup and straw assembly and the remaining one-hole cup. Before stapling the end of the straw to the last cup, turn the cups so that the open end of each cup faces the closed end of the next cup.
6. Adjust the cup and straw assemblies so that they are centered inside the fifth cup. Push the straight pin through the two straws where they intersect.
7. Push the eraser end of the pencil through the hole in the bottom of the fifth cup, and push the 4 atmosphere: https://scied.ucar.edu/shortcontent/earths-atmosphere

15
straight pin into the eraser as far as it will go. Now your anemometer is ready to use. 8. To use the anemometer, hold the pencil vertically in a wind, and count the number of
revolutions per minute (use the felt tip marker to make a mark on one cup so that you can easily see when the cup has travelled through one complete revolution). To convert revolutions per minute (rpm) into approximate wind speed:
a. Multiply rpm by the diameter (in inches) of your anemometer (measured in Step 4) b. Multiply the result by 0.003. This is the approximate wind speed in miles per hour.
This calculation does not give exact wind speed, because drag, friction, and other forces also affect the speed at which your anemometer rotates.
16
Assessment Observe the wind speed at three different times:
1. Wind speed per minute: ………………………………………………………….
2. After five minutes: ……………………………………………………………….
3. After ten minutes: ……………………………………………………………….
Based on the information above, do you notice any changes?
……………………………………………………………………………………………..
……………………………………………………………………………………………..
What is air pressure?
………………………………………………………………………………………
………………………………………………………………………………………
………………………………………………………………………………………
………………………………………………………………………………………
17
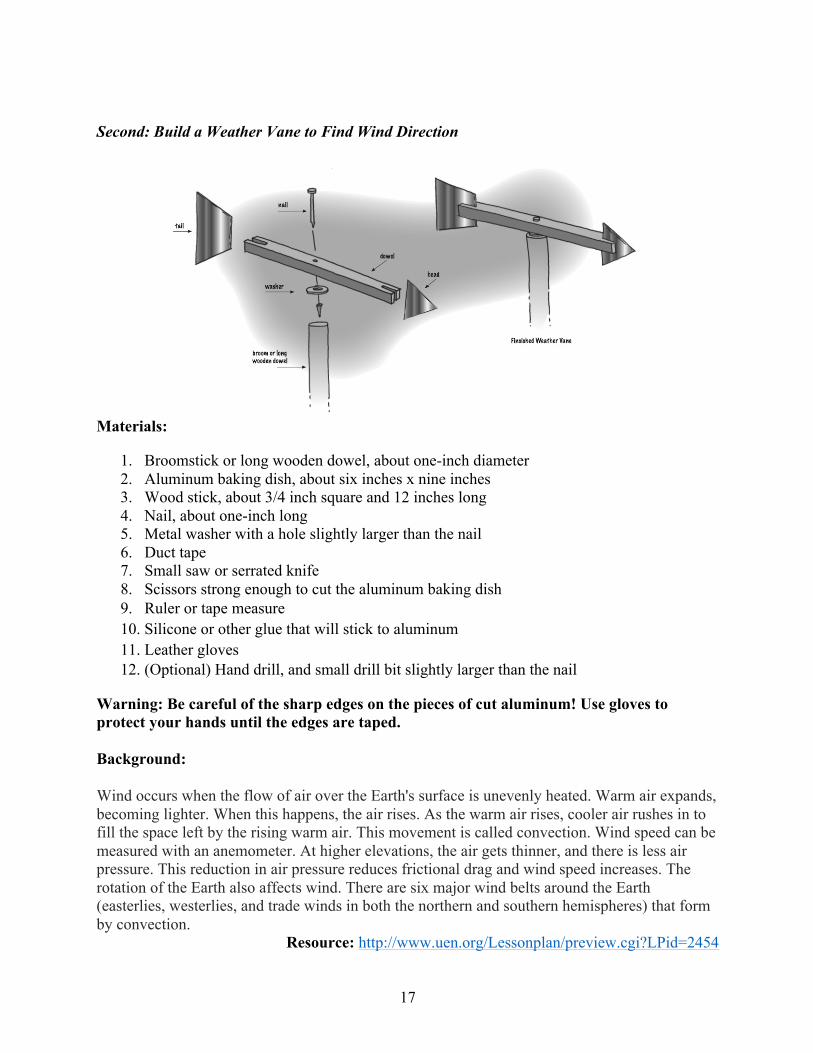
Second: Build a Weather Vane to Find Wind Direction
Materials:
1. Broomstick or long wooden dowel, about one-inch diameter 2. Aluminum baking dish, about six inches x nine inches 3. Wood stick, about 3/4 inch square and 12 inches long 4. Nail, about one-inch long 5. Metal washer with a hole slightly larger than the nail 6. Duct tape 7. Small saw or serrated knife 8. Scissors strong enough to cut the aluminum baking dish 9. Ruler or tape measure 10. Silicone or other glue that will stick to aluminum 11. Leather gloves 12. (Optional) Hand drill, and small drill bit slightly larger than the nail
Warning: Be careful of the sharp edges on the pieces of cut aluminum! Use gloves to protect your hands until the edges are taped. Background: Wind occurs when the flow of air over the Earth's surface is unevenly heated. Warm air expands, becoming lighter. When this happens, the air rises. As the warm air rises, cooler air rushes in to fill the space left by the rising warm air. This movement is called convection. Wind speed can be measured with an anemometer. At higher elevations, the air gets thinner, and there is less air pressure. This reduction in air pressure reduces frictional drag and wind speed increases. The rotation of the Earth also affects wind. There are six major wind belts around the Earth (easterlies, westerlies, and trade winds in both the northern and southern hemispheres) that form by convection.
Resource: http://www.uen.org/Lessonplan/preview.cgi?LPid=2454

18
Activity Procedure:
1. Use the saw or serrated knife to cut a notch about 1/2-inch deep into each end of the wood stick. The notches should be parallel (see drawing on the previous page).
2. Rotate the stick so that the two slots are vertical. Use the ruler or tape measure to find the exact center of the wood stick. Mark this spot on the upper surface of the stick, and drive a nail through the marked spot. Be careful: if the nail is too big, the stick will probably split. To avoid this, drill a hole slightly larger than the nail through the marked spot. You may need an adult to help with the drilling.
3. Cut the head and tail pieces of the Weather Vane from the aluminum baking dish using the pattern as a guide. Be Careful—The Edges Are Sharp! Use duct tape to cover the sharp edges.
4. Fit the head piece into one of the slots in the wood stick and fit the tail piece into the other slot. Glue the head and tail pieces into place and allow the glue to dry.
5. Attach the Weather Vane to the broomstick or dowel, by placing the washer on one end of the dowel and hammering the nail through the wooden stick into the dowel. Be sure the stick still moves freely around the nail.
6. Mount your Weather Vane outside where there are no nearby obstructions to block the wind. Try to get the dowel as high as you can, while still keeping it steady and secure. Winds are named according to the direction from which the wind is blowing, so a “north wind” is blowing from the north. The head of the Weather Vane will point to the direction from which the wind is blowing.

19
Assessment
Which direction is the wind blowing?
………………………………………………………………………………
What is the regional wind direction based on the weather forecast?
………………………………………………………………………………

20
Third: Build a Barometer for Measuring Atmospheric Pressure
Materials:
1. 12-inch ruler 2. Drinking glass or other container with sides tall enough to support the ruler 3. Clear plastic drinking straw or piece of clear plastic tubing, about 12-inches long 4. Clear tape 5. (Optional) Food coloring

21
Activity Procedure: 1. Tape the plastic straw or plastic tubing to the ruler so that one end is lined up with the “1/2-
inch” mark on the ruler. 2. Stand the ruler-tubing assembly upright in the glass (or other container), and tape the assembly
to the top of the container. 3. Fill the container about 3/4-full of water. If you want colored water, first mix food coloring
with the water in another container. 4. Carefully pour out some of the water so the container is about half full. Be sure the lower end
of the straw or tubing stays beneath the water surface while you do this! When you are finished, the water in the straw or tube should be higher than the water in the container. Your barometer is now finished. Since barometers are sensitive to minor changes in weather conditions, keep your barometer indoors for greatest accuracy.
5. Keep a daily record of the height of the water in the tube, using the scale on the ruler. The water level in the tube will rise and fall as atmospheric pressure changes. When atmospheric pressure increases, air presses on the surface of the water in the container causing the height of the water in the tube to rise. When atmospheric pressure decreases, there is less pressure on the surface of the water in the container so the height of the water in the tube falls. Decreasing atmospheric pressure usually indicates that a low-pressure area is approaching, and this often brings clouds and rain. Increasing atmospheric pressure often indicates fair weather.
• Note: The Clay is removed because it does not allow the water to get into the tube. Following Activities: In order for your students to answer Part Two of the Assessment, open an online-live weather map (http://www.intellicast.com/National/Surface/Current.aspx) to show students the current weather, including the wind direction, clouds, and current atmospheric pressure. Then, discuss current North Dakota weather.

22
Assessment Part One
What were some challenges in building this measurement tool?
………………………………………………………………….
………………………………………………………………….
………………………………………………………………….
…………………………………………………………………
What is the current atmospheric pressure?
…………………………………………………………………………………………………….
…………………………………………………………………………………………………….
How does atmospheric pressure influence the wind speed and direction?
…………………………………………………………………………………………………….
…………………………………………………………………………………………………….
Part Two
Can you predict the weather? Give it your best shot and try to forecast the weather in the 24
hours.
………………………………………………………………………………………………………
………………………………………………………………………………………………………

23
Fourth: Build a Screened Thermometer to Measure Air Temperature Materials:
1. A wooden or plastic box, large enough to hold the thermometer and your hygrometer; see Step 1 under “How to Do It”
2. Thermometer, about 0°F to 120°F 3. White paint and paint brush 4. Nails, screws, glue, or tape to attach the thermometer to the box
Activity Procedure: 1. The wood or plastic box is supposed to protect your weather instruments from wind, rain, and
direct sun, but still allow air to circulate so the instruments can get accurate readings. A box with a hinged lid that can be turned on its side is perfect. Turn the box on its side, and cut several slots near what is now the bottom of the box. Paint the outside of the box with white paint, and find a safe, shady outdoor location. The north side of buildings has the most shade. Try to find a location that is three to four feet above the ground.
2. Attach the thermometer to the back of the box with tape, glue, screws, or nails. The bulb of the thermometer should be about two inches above the bottom of the box.
Following Activities: The teacher will introduce different temperature measurements, including Fahrenheit and Celsius. Explain the differences between them. The Celsius scale is used in Canada, Europe, Asia, among other places. The boiling point of water is 100 °C, and the freezing point is 0 °C. Fahrenheit is used in America, which the boiling point of water is 212 °F and the freezing point is 32 °F. Introduce conversion from Fahrenheit to Celsius, using these equations: TC = (TF – 32) / 1.8 TC = Temperature in Celsius TF = (TC * 9/5) + 32 TF = Temperature in Fahrenheit Give students an example to solve the equation together.

24
Assessment The current atmospheric temperature is …………………………………………… Exposing the thermometer to the sun light will ……………………………………
What are these temperatures in Celsius?
45 °F à _______ °C
63 °F à _______ °C

25
Fifth: Build a Rain Gauge to Measure Rainfall
Materials:
1. Straight-sided glass or plastic container, with a diameter of about two inches or less (such as an olive jar)
2. Coat hanger or wire bent to make a holding rack (see picture) 3. Measuring spoons: One teaspoon and 1/4 teaspoon 4. Hammer and nails to secure the rack 5. Felt tip marker
Activity Procedure: 1. Rain gauges measure the amount of rainfall in cubic inches. So your first task is to make a
scale for your container that shows how many cubic inches of water are in the container. One cubic inch of water is about 3 1/4 teaspoons, so you can draw the scale on your container by measuring 3 1/4 teaspoons of water to your container, then drawing a short line at the level of the water. If you look closely, the top of the water will seem to be slightly curved and thickened. Draw your line so that it matches the bottom of the curved surface (which is called a meniscus). This line corresponds to a rainfall of one inch.
2. Add another 3 1/4 teaspoons of water to the container and draw another line. The second line corresponds to a rainfall of two inches.
3. Repeat Step 2 until you have at least five marks on the container. This will be enough for most rain events; but you may want to add another line or two, just in case!
4. Find a location for your rain gauge where there is nothing overhead (such as treesor a building roof) that could direct water into or away from your gauge. The edge of a fence away

26
from buildings is often a good spot. Another possibility is to attach your rain gauge to a broomstick driven into the ground in an open area. Be sure to record rainfall soon after a rain event to avoid false readings caused by evaporation. Empty your gauge after each reading, and you are ready for the next event!
Note: This experiment depends on the weather, so if there is a rain, students will be able to examine this measurement. Following Activity: Discuss with students the process of estimating precipitation. You can visit this satellite (http://www.intellicast.com/National/Precipitation/Estimated.aspx) to see the current accumulation of water.

27
Assessment View online data about the rainfall, and record some related data for North Dakota. Identify some areas that appear on the map, which may have the most accumulated water in the last 24 hours, using satellite data found here: http://www.intellicast.com/National/Precipitation/Estimated.aspx.
…………………………………………………………………………………………………….
…………………………………………………………………………………………………….
…………………………………………………………………………………………………….
…………………………………………………………………………………………………….
…………………………………………………………………………………………………….

28
Lesson Three: Cloud particles and cloud formation
Experiment 1: Water Cycle5 Standards:
• 5-ESS2-1. Develop a model using an example to describe ways the geosphere, biosphere, hydrosphere, and/or atmosphere interact.
Objectives: Students will be able to:
• Interpret the process of cloud formation with an 85% rate of accuracy. Time: 45 min Materials:
1. Bottle of glass 2. Hot water 3. Plate 4. Cubic ice 5. See this video https://www.youtube.com/watch?v=1fyi3a-HUqA
Background: The "water cycle" or "hydrologic cycle" is the term used to describe when water changes from liquid to gas through the evaporation process and then from gas to liquid through the condensation process. This happens when the sun heats water, and the water vapor rises. After water evaporates, it cools and condenses in the sky, where the temperature is low. Condensation then forms small crystal shaped water droplets, which eventually fall to the ground as rain. Activity procedure: The teacher needs to:
1. Introduce the materials and safety procedures. 2. Introduce related information about clouds, fiber water, air, atmosphere temperature, and
pressure. 3. Put boiling water into the bottle carefully. 4. Put the plate with ice cube on the top of the bottle. 5. Observe the change.
5 This lesson is adapted from Science Bits. https://www.youtube.com/watch?v=1fyi3a-HUqA.

29
Assessment Write an explanation of what happens to the water in a lake at different temperatures.
1) What might happen to the water in at lake at 25°F? …………………………………………………………………………………………………
…………………………………………………………………………………………………
…………………………………………………………………………………………………
…………………………………………………………………………………………………
…………………………………………………………………………………………………
2) What might happen to the water in at lake at 85°F? …………………………………………………………………………………………………
…………………………………………………………………………………………………
…………………………………………………………………………………………………
…………………………………………………………………………………………………

30
Experiment 2: Sky Observation6 Standards:
• 5-ESS2-1. Develop a model using an example to describe ways the geosphere, biosphere, hydrosphere, and/or atmosphere interact.
Objectives: Student will be able to:
• Discover the process of weather forecasting. • Categorize types of clouds. • Use their cloud observations and temperature data to create graphs.
Prerequisite Knowledge:
• Computer/Internet experience • Vocabulary terms: geostationary satellite, polar satellite, orbit, radiometer • Prior knowledge of the water cycle • Knowledge of how to represent data in graphs
Time: Three 45-minute classes Materials:
1) One computer with Internet capabilities for each group of three to four students, or one computer monitor with Internet capabilities for whole class viewing.
2) Markers/colored pencils. 3) Poster board. 4) Science notebooks. 5) Copies of Student Worksheet #1 and #2 - one per student. 6) Recording Cloud Observations Data - Chart 1, seven per student. Option: one copy of the
chart per student, students use it to make six more charts in their notebook. 7) Optional: One empty two-liter soda bottle with cap, matches, and water.
Background: Activity procedure: Day One - Engagement Activity: This activity introduces students to weather forecasting technology using satellite images.
1. Write "weather forecasting" on the board and ask students to think about how meteorologists forecast the weather. Record responses on the board. Students should include weather satellites in their responses.
2. Explain that surface readings and observations alone make it difficult to predict and forecast long-term weather conditions. Using satellite technology has enabled
6 This lesson borrowed, retrieved, and slightly modified from http://oceanservice.noaa.gov/education/lessons/eye_on_the_sky.html
31
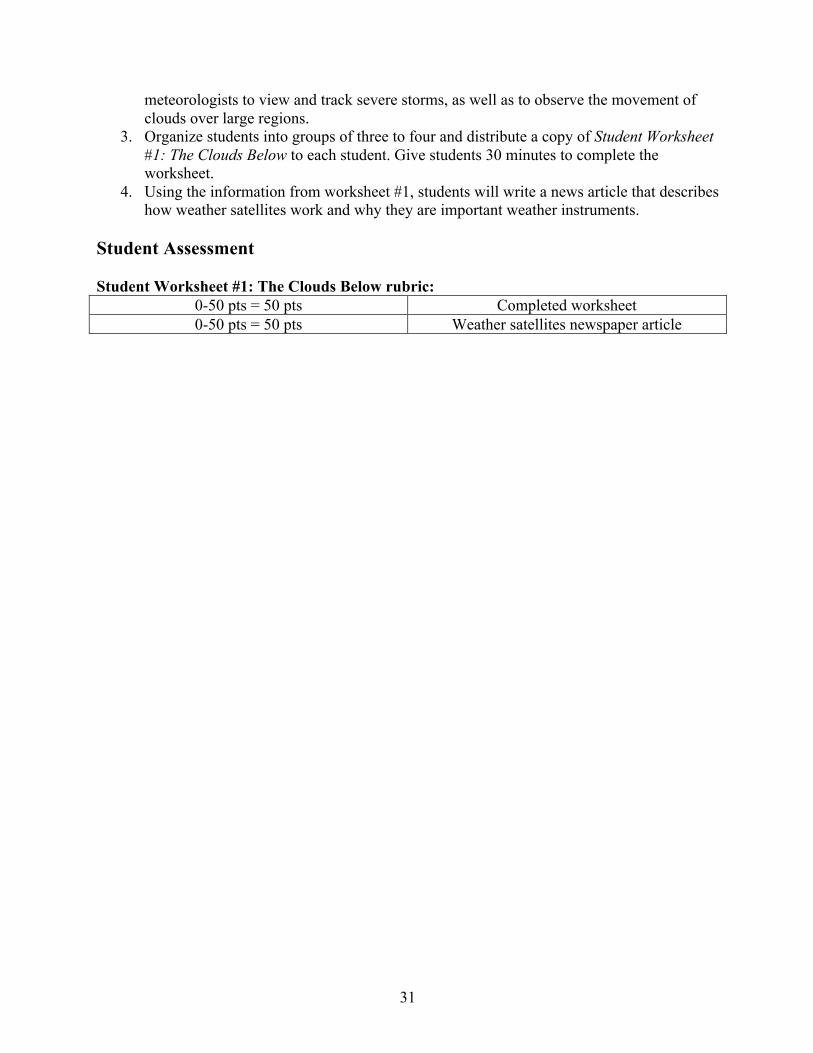
meteorologists to view and track severe storms, as well as to observe the movement of clouds over large regions.
3. Organize students into groups of three to four and distribute a copy of Student Worksheet #1: The Clouds Below to each student. Give students 30 minutes to complete the worksheet.
4. Using the information from worksheet #1, students will write a news article that describes how weather satellites work and why they are important weather instruments.
Student Assessment Student Worksheet #1: The Clouds Below rubric:
0-50 pts = 50 pts Completed worksheet 0-50 pts = 50 pts Weather satellites newspaper article

32
Worksheet 1: The Clouds Name:………………………………………………. How do meteorologists predict and forecast our weather? Meteorologists use weather instruments to measure factors such as temperature, humidity, wind speed and direction, and air pressure. All of these can be measured on the Earth’s surface (surface readings), but how do they get the images from space? The answer is satellites! Use this Web site: http://cimss.ssec.wisc.edu/satmet/modules/sat_basics/orbits.html to learn the two types of weather satellites used to produce the day and night cloud images that indicate the weather below. What is a satellite? ………………………………………………………… ……………………………………………………………………………….. ……………………………………………………………………………….. ……………………………………………………………………………….. What does POES stand for? ………………………………………………………………. ……………………………………………………………………………………………….. What does GOES stand for? ………………………………………………………………. ……………………………………………………………………………………………….. What is the difference between POES and GOES? ……………………………………… ……………………………………………………………………………………………….. ……………………………………………………………………………………………….. ……………………………………………………………………………………………….. How high above the Earth does each of these satellites orbit?............................... ……………………………………………………………………………………….. ………………………………………………………………………………………..

33
Have you ever wondered how jet airplanes make those white streaks across the sky? These are called “contrails”. Complete the paragraph below: Contrails form from _________________________ just as clouds do. The hot, ______________ air of the jet’s exhaust, environmental air of low pressure, and low ________________________ mix to form these white streaks in the sky. What causes these things to mix? ……………………………………………………………………………………………….. ……………………………………………………………………………………………….. ……………………………………………………………………………………………….. ……………………………………………………………………………………………….. ………………………………………………………………………………………………..

34
Day Two - Exploration Activity: In this class, students will discover that clouds are good indicators of real-time weather. As they research characteristics of different cloud types, they are gaining knowledge for the elaboration activity that follows.
1 Prior to class, download and print the "NASA S'COOL Cloud Identification Chart", one for each group of students (https://scool.larc.nasa.gov/printables-guides-CloudChart.html).
2 Conduct a class discussion about weather satellites and their purpose. Ask students to think about how we might forecast our daily weather by observing clouds in the sky. Discuss how clouds and weather go together when looking at weather patterns.
3 Organize students into groups of three to four. Give students about five minutes to brainstorm answers to the following with their group members:
§ Think about the types of clouds you see in the sky and discuss what type of weather generally brings these clouds to your area.
§ Have you ever been swimming outdoors when grey, dark clouds appear? If so, what did you do?
§ Draw two or three shapes of clouds you have seen. 4 Each group of students should have a computer with internet access. Distribute one copy
of Student Worksheet #2: Partly Cloudy Skies to each student and go over the directions. Explain that they will research their information online as a group; however, each student is responsible for completing their own worksheet.
Student Assessment Student Worksheet #2: Partly Cloudy Skies rubric: 5 pts each = 20 pts Correctly identifies parts of water cycle 0-‐20 pts = 20 pts Demonstrates understanding of how clouds form 0-‐20 pts = 20 pts Do clouds move? Explanation w/supporting details 0-‐10 pts = 10 pts Description of fog 0-‐20 pts = 20 pts Contrails paragraph correct 0-‐10 pts = 10 pts Cloud chart completed

35
Worksheet 2: Partly Cloudy Skies7 Part 2: CLOUD CHART Name:……………………………………………….
CLOUD TYPE COLORS?
HIGH? MIDDLE?
LOW? WEATHER
Altocumulus
Altostratus
Cirrocumulus
Cirrostratus
Cirrus
Cumulonimbus
Cumulus
Stratocumulus
Nimbostratus
Stratus
7 Adapted from NASA S’COOL site http://asd-www.larc.nasa.gov/SCOOL/ & https://oceanservice.noaa.gov/education/lessons/eye_on_the_sky.html

36
Day Three - Elaboration Activity: Using what students have learned in the exploration activity, challenge them to become weather watchers by observing and tracking clouds in their area. Using one of the data charts below, students will record local cloud and weather conditions daily for one week. Note: Each student will need seven copies of the data sheet.
1 Explain to students that they are now prepared to be "Weather Watchers." Using what they've learned about weather instruments and clouds, they will gather weather data and complete a written weather report.
2 Using one computer/monitor for whole class viewing, or several Internet capable computers for student groups, go to the "Cloud ID Chart" Web site (https://scool.larc.nasa.gov/cldchart.html).
3 Read the introduction together and assign either Recording Observations Data Chart 1 (next page) to be completed in one week or more.
4 To check student accuracy and work, go to the National Weather Service (https://www.weather.gov/) or cut out the local weather from your newspaper or USA Today.
5 At the end of the week, students will work in small groups to create a graph to represent their data. Students will use their data charts and graphs to complete the questions on Student Worksheet #3: Watching Clouds to write a detailed lab report to be graded as a project. This can be done for homework or in class.
Extensions • Extend the "Watching Clouds" observation activity for a month. • Use the "Recording Cloud Observations Investigation" template (attached), and have students
work in groups to design their own weather investigation. • Enroll your class in NASA's S'COOL Citizen Science online cloud observation project at the
"Observe Sky" Web site (https://scool.larc.nasa.gov/rover.html and https://scool.larc.nasa.gov/)
• Integrate language arts with the "Cloudy Days Are for Reading and Writing" activity Web site (https://scool.larc.nasa.gov/cgi-bin/view_lessonplan.cgi?id=11).
• Integrate mathematics with the "Graphing Temperature Data" project ( (https://scool.larc.nasa.gov/cgi-bin/view_lessonplan.cgi?id=47).
Student Assessment Formative assessments based on students’ ability to fill out the working sheets and make their prediction.

37
Data Sheets Recording Observation: Data Chart 1 Name: ………………………………………………. Date: ………………………………………………. Time: ………………………………………………. Cloud Observations:
______ Clear Sky – No Clouds Observed ______ Clouds/Contrails Present # of Persistent Contrails Present ______ # of Short-Lived Contrails Present _____
Cloud Cover:
____ Clear (0-5%) ____ Partly Cloudy (5%-50%) ____ Mostly Cloudy (50%-95%) ____ Overcast (95%-100%)
_____ HIGH LEVEL:
Cloud Type: _____ Cirrus _____ Cirrocumulus _____ Cirrostratus Cloud Cover: ____ Altostratus ____ Clear (0-5%) ____ Partly Cloudy (5%-50%) ____ Partly Cloudy (5%-50%) ____ Mostly Cloudy (50%-95%) ____ Overcast (95%-100%)
_____ MID LEVEL:
Cloud Type: _____ Altocumulus Cloud Cover: ____ Clear (0-5%) ____ Partly Cloudy (5%-50%) ____ Mostly Cloudy (50%-95%) ____ Overcast (95%-100%)

38
_____ LOW LEVEL:
Cloud Type: _____ Fog _____ Nimbostratus _____ Cumulonimbus _____ Stratus _____ Cumulus _____ Stratocumulus
Temperature: __________

39
Unit Two: Sustainable Materials This unit introduces students to the idea of sustainable materials. Students will begin to understand how technology can be created or modified to protect the Earth and its resources. More specifically, students will explore water conservation and biofuels. We strongly suggest 5th grade classroom join with 8th grade classrooms when 8th grade students complete a Shampoo Unit. If classes are able to work together on this unit, assign 5th grade students to complete the first Good Guide worksheets before the Shampoozled lab and the second worksheet before the Shampoozled 2 lab.

40
Lesson One: Helpful Hydrogels8 North Dakota Education Standards
• 5-PS1-1: Develop a model to describe that matter is made of particles too small to be seen
• 5-LS1-1: Support an argument that plants get materials they need for growth chiefly from air and water.
• 5-LS2-1: Develop a model to describe the movement of matter among plants, animals, decomposers, and the environment
Learning Objectives: Students will be able to:
• Describe how matter is too small to be seen through analyzing hydrogels before and after exposure to water.
• Support an argument that plants get the material they need from water in the soil. • Identify how water travels through a plants roots to provide it with sustenance.
Goal: Students will observe and measure hydrogels’ ability to conserve water within soil compared to soil alone. Time: Two 45-60 minute class periods (One day for the diaper portion and one day for the soil comparison portion) Materials Per Lab Group:
1. Disposable diaper-1 per group member 2. 4 cups red solution (water and red food dye) 3. Scissors -1 per group member 4. 1 tsp measuring spoon 5. 1 cup measuring cup 6. 1/2 cup measuring cup 7. Gallon Size zipper-lock bags-1 per group member 8. 2 Plastic cups, 266 mL (9 oz) 9. 1 tsp activated diaper hydrogel 10. 1 tsp flaked (bagged) hydrogel 11. 1 tsp round (bottled) hydrogel 12. 4 cups Potting soil 13. Clear plastic pot with drain holes and plastic tray (4 per group) 14. Graduated Cylinder 15. 1 Marker
8 This lesson retrieved and adapted from Steve Spangler Science on behalf of 4-H National Youth Science Day 2008: http://www.stevespanglerscience.com/lab/experiments/helpful-hydrogels/

41
Background: Polymers are multiple molecules linked together. This can be compared to monomers, which are composed of one molecule. Polymers (commonly known as plastics) are either naturally occurring (rubber, RNA and DNA, proteins, starch, and cellulose) or synthetic (manufactured). Hydrogel polymers are long molecule chains made up of repeating units that grab onto water molecules. This characteristic makes them a great solution for soaking up water. Many environmental applications for hydrogels have been found in agriculture and horticulture industries. Hydrogels help reduce water runoff and soil erosion, thus improving the quality of lakes, streams, and rivers. Hydrogels also help with moisture retention and water conservation by helping soil increase water holding capacity, allowing plants to survive during droughts. Erosion control, soil management, and environmental cleanups are also ways hydrogels can help the environment. Many scientists continue to study the effect of hydrogels on the environment. In this series of investigations, you will start by looking for a particular polymer at work. Once you discover what this type of polymer can do, you will experiment with other uses for the same polymer. A final step can be taken to consider solutions for water conservation and groundwater contamination. Procedure: PREP:
• Mix water, drink mix, and red food dye to create a red solution. IN CLASS
• Tell students you will be completing an experiment to understand one way scientists have created new technology to help conserve water.
• Introduce the concepts of molecules, monomers, and polymers. • Explain what a hydrogel is and some of its real life applications. • Hand out student lab procedures, career information, and lab questions. Briefly review
lab procedures. • Have students collect lab materials. • Students should follow lab procedures and clean up as directed. • Have students complete lab questions.
Student Assessment:
• Successfully completing experiment • Following safety procedures (rubric attached) • Accurate completion of lab questions

42
Helpful Hydrogels-Lab Procedure
1. Remove all materials from your lab station. Get a pair of safety glasses and gloves for each member of the group. Put both on.
2. Have one member of your group collect lab materials:1. disposable diaper-1 per group
member 2. scissors-1 per group member 3. gallon size plastic bag-1 per
group member 4. 1 teaspoon (tsp.) measuring
spoon 5. 1 cup measuring cup 6. 1/2 cup measuring cup
7. 1/2 cup water 8. 1 tsp flaked hydrogel 9. 1 tsp round hydrogel 10. 4 cups red solution 11. 2 plastic cups 12. 4 cups potting soil 13. 4 clear plastic pots with
plastic trays 14. Marker
DAY ONE: 3. Lay the diaper flat on the table. Carefully cut through the inside lining of the diaper on
one side. Flip it inside out inside a gallon size bag. Pull out the cotton and powdered inside material, leaving it on the bottom of the bag. Tear up the cotton part to loosen the powder from it. Throw out the outside of the diaper.
4. Blow a little air into the bag to make it puff up like a pillow and then seal the bag.
5. Shake the bag for a few minutes to remove the powdery hydrogel polymer from the stuffing.
6. Carefully remove the stuffing from the bag, leaving as much powder inside as possible.
7. Pour 1/2 cup of water into the bag. Observe the mixture. Save these bags for tomorrow’s experiment.
DAY TWO: 8. Label one plastic pot “None”, one plastic pot “Diaper”, one plastic pot “Flaked”, and one
plastic pot “Round”. Set each pot upon its clear tray.
9. Put 1 cup of potting soil into the “None” pot. This is called the control in the experiment. It can be compared to the other pots, which will have hydrogels in the soil.
10. Collect 1 teaspoon (tsp.) of diaper hydrogel from a plastic bag from yesterday’s experiment. Combine this with one cup of potting soil. Put the mixture in the “Diaper” pot.

43
11. Combine 1 tsp. flaked hydrogel with 1 cup potting soil. Put the mixture in the “Flaked” pot.
12. Combine 1 tsp. round hydrogel with 1 cup potting soil. Put the mixture in the “Round” pot.
13. Pour 1/4 cup red solution into EACH of the pots and observe. Answer question one on the Lab Questions.
14. After 1 minute, add another 1/4 cup red solution into each pot and observe. Answer question 2 on the Lab Questions.
15. After 1 minute, add another 1/4 cup red solution into each pot and observe.
16. After 5 minutes, compare and contrast the solution from each pot. Answer questions 3, 4, and 5 on the Lab Questions.
44
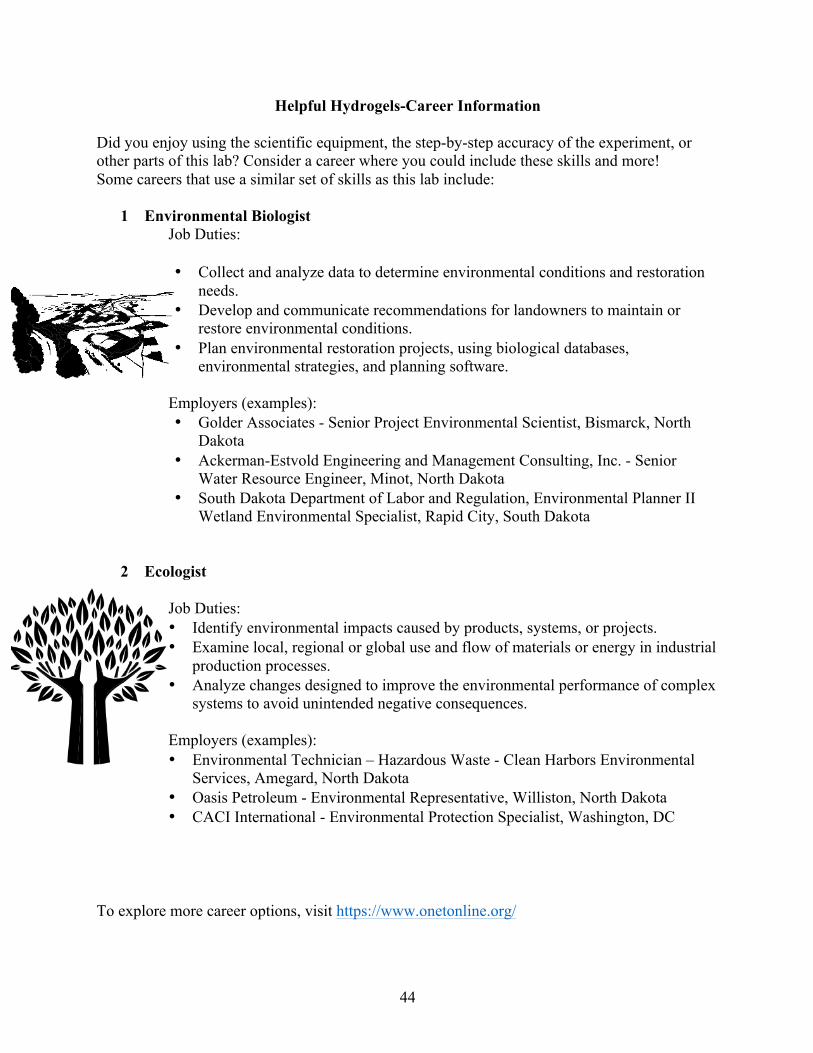
Helpful Hydrogels-Career Information Did you enjoy using the scientific equipment, the step-by-step accuracy of the experiment, or other parts of this lab? Consider a career where you could include these skills and more! Some careers that use a similar set of skills as this lab include:
1 Environmental Biologist Job Duties: • Collect and analyze data to determine environmental conditions and restoration
needs. • Develop and communicate recommendations for landowners to maintain or
restore environmental conditions. • Plan environmental restoration projects, using biological databases,
environmental strategies, and planning software. Employers (examples): • Golder Associates - Senior Project Environmental Scientist, Bismarck, North
Dakota • Ackerman-Estvold Engineering and Management Consulting, Inc. - Senior
Water Resource Engineer, Minot, North Dakota • South Dakota Department of Labor and Regulation, Environmental Planner II
Wetland Environmental Specialist, Rapid City, South Dakota
2 Ecologist Job Duties: • Identify environmental impacts caused by products, systems, or projects. • Examine local, regional or global use and flow of materials or energy in industrial
production processes. • Analyze changes designed to improve the environmental performance of complex
systems to avoid unintended negative consequences. Employers (examples): • Environmental Technician – Hazardous Waste - Clean Harbors Environmental
Services, Amegard, North Dakota • Oasis Petroleum - Environmental Representative, Williston, North Dakota • CACI International - Environmental Protection Specialist, Washington, DC
To explore more career options, visit https://www.onetonline.org/

45
Assessment Helpful Hydrogels-Lab Questions: Name:___________________________ 1. Does any water drain through the soil onto the pot tray? If so, which one? ______________________________________________________________________ ______________________________________________________________________ ______________________________________________________________________ ______________________________________________________________________ 2. After pouring the second 1/4 cup of water into the pots, does any water drain through the soil onto the pot tray? If so, which one? ______________________________________________________________________ ______________________________________________________________________ ______________________________________________________________________ ______________________________________________________________________ 3. Is there a difference in the amount of solution in each tray: yes or no? If yes, which tray has more solution in it? ______________________________________________________________________ ______________________________________________________________________ ______________________________________________________________________ ______________________________________________________________________ 4. Is there a difference in color of the solution in each tray: yes or no? If yes, what is the difference? ______________________________________________________________________ ______________________________________________________________________

46
______________________________________________________________________ ______________________________________________________________________ 5. List one job that creates or uses hydrogels. ______________________________________________________________________
47
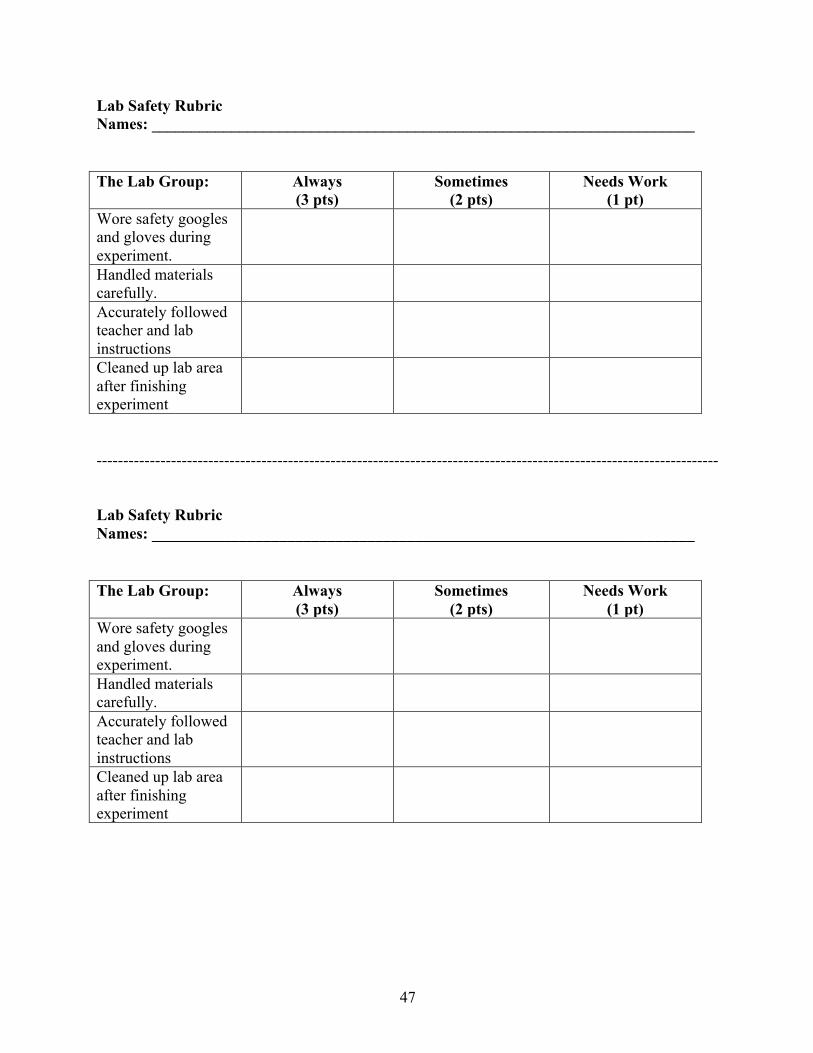
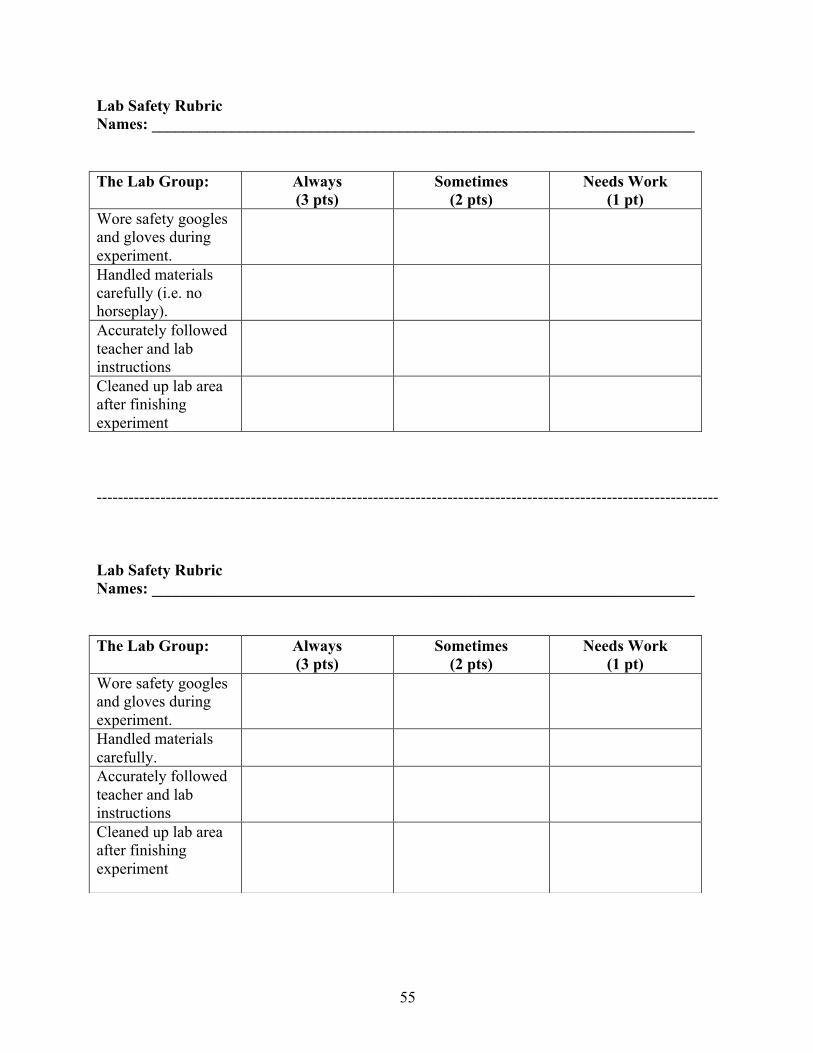
Lab Safety Rubric Names: ____________________________________________________________________
--------------------------------------------------------------------------------------------------------------------- Lab Safety Rubric Names: ____________________________________________________________________
The Lab Group: Always (3 pts)
Sometimes (2 pts)
Needs Work (1 pt)
Wore safety googles and gloves during experiment.
Handled materials carefully.
Accurately followed teacher and lab instructions
Cleaned up lab area after finishing experiment
The Lab Group: Always (3 pts)
Sometimes (2 pts)
Needs Work (1 pt)
Wore safety googles and gloves during experiment.
Handled materials carefully.
Accurately followed teacher and lab instructions
Cleaned up lab area after finishing experiment

48
Lesson Two: Fermentation in a Bag:9 North Dakota Education Standards
• 5-ESS3-1: Obtain and combine information about ways individual communities use science ideas to protect the Earth’s resources and environment
• 5-PS1-3: Make observations and measurements to identify materials based on their properties.
Learning Objectives: Students will be able to:
• Identify biofuels as one way communities are using science ideas to protect the Earth's resources and environment
• Make observations about experiment materials as they relate to the properties of the materials
Goal: Students will observe, measure, and record the amount of ethanol produced during the chemical reaction Time Required: 45-60 minute class period Materials Per Lab Group:
1. 1 tsp. dry active yeast 2. 1 tsp. Sugar 3. 1 tsp. Cornmeal 4. 1 tsp. Sawdust 5. 1 tsp. measuring spoon 6. Resealable zipper bags (“snack” size) 7. Warm water-about 104 °F 8. Small graduated cylinders (100mL) 9. Rulers to measure bag inflation 10. Paper Towels 11. One For The Class: thermos (with spout) for dispensing warm tap water 12. One For The Class: Heat Lamp
Background: All vehicles burn fuel. These fuels, like gasoline and diesel, come from oil, which we pump out of the ground. Oil is made from the ancient, fossil remains of plants that lived millions of years ago. This is why we call oil a fossil fuel. Fossil remains of plants were buried and over millions of years turned into oil. The carbon dioxide, also known by its chemical formula CO2, used by the ancient plants is now stored in the oil in the ground. 9 This lesson retrieved and adapted from Great Lakes Bioenergy Research Center: https://www.glbrc.org/education/classroom-materials

49
When a fossil fuel like gasoline burns in a car’s engine, the ancient carbon dioxide that was stored in the oil for millions of years is released back into the air. All of the vehicles burning fuel have added a lot of extra carbon dioxide to the atmosphere. Unfortunately, extra carbon dioxide is trapping heat in our atmosphere and unbalancing world temperatures. We can make fuels from plants today. Fuels made from recently living plants are called biofuels. When biofuels are burned in an engine, carbon dioxide is released just like when gasoline is burned. But, unlike gasoline, the carbon dioxide from biofuels was absorbed by plants growing in the last year. This means that by using biofuels we can recycle carbon dioxide between plants and the atmosphere, rather than releasing extra CO2 from fossilized oil. In this simple experiment, students investigate the process of fermentation in a resealable bag with baker’s yeast, warm water and sugar. Students observe and measure evidence of the chemical changes associated with fermentation: bag inflation (CO2) and indicators of ethanol production. Students can measure fermentation rates by using rulers. Students will be using various feedstocks in this experiment. A feedstock is a raw material that can be used as fuel in a machine or processing plant. Using table sugar (sucrose) as a feedstock will yield the most rapid results. Some alternate feedstocks include corn meal, ground corn stover (stover is the leftover parts of crops left in fields, such as stalks and leaves), sawdust, finely ground grass clippings, dead leaves, composting materials, etc. Feedstocks with a starchy or fibrous composition will not ferment as well. Procedure: PREP:
• Put warm water into the thermos before the experiment. IN CLASS:
• Tell students they will be examining the process of fermentation. • Explain the difference between fossil fuels and biofuels, highlighting the usefulness of
biofuels to rebalance the cycle of carbon dioxide release. • Hand out student worksheets. We recommend printing the lab procedures and career
information back-to-back and printing the lab questions single sided. • Assist students in collecting lab materials and completing the experiment. • Collect lab questions and grade for safety adherence.
Student Assessment: • Precise completion of experiment • Following Lab Safety rules (Rubric Attached) • Accurate completion of Lab questions

50
Fermentation in a Bag- Lab Procedure: 1. Clean up your lab station. Only lab materials should be at your station!
2. Get a pair of safety glasses and gloves for each member of the group; Put both on.
3. One member of your group sound collect your lab materials:
1. 3 resealable bags 2. 1 teaspoon cornmeal 3. 1 teaspoon sawdust
4. 3 teaspoons of yeast 5. 1 teaspoon of sugar 6. 150ml warm tap water
4. The cornmeal and sugar are considered feedstocks. A hypothesis is an educated guess
about what will happen during an experiment. As a group, make a hypothesis about what you think will happen when you combine a feedstock and yeast, and another hypothesis about what will happen when you add warm water to the feedstock and yeast. Write your hypotheses in the lab questions.
5. In each resealable zipper bag, add one teaspoon of yeast.
6. In one resealable zipper bag, add a teaspoon of sugar. Label the bag "Sugar."
7. In one resealable zipper bag, add a teaspoon of cornmeal. Label the bag "Cornmeal."
8. In one resealable zipper bag, add a teaspoon of sawdust. Label the bag "Sawdust."
9. Add 1/4 cup of warm tap water (approx. 104° C) to each bag and seal each bag closed, removing as much air as possible.
10. Mix gently. Lay bag flat underneath the heat lamp. Measure changes in bag height every 5 minutes for 25 minutes with a ruler. Write the measurements on the data table.

51
Fermentation in a Bag-Career Information Did you enjoy using the scientific equipment, the step-by-step accuracy of the experiment, or other parts of this lab? Consider a career where you could include this skillset and more! Some careers that use a similar set of skills as this lab include: Chemist Job Duties:
• Analyze organic or inorganic compounds to determine chemical or physical properties, composition, structure, relationships, or reactions.
• Produce changes in composition of substances by introducing heat, light, energy, or chemical catalysts for analysis.
• Conduct quality control tests. • Explore uses of chemicals and their interactions, danger signs, production
techniques, and disposal methods. Current Job Examples:
• U.S. Army Research, Development and Engineering Command – Chemist, Aberdeen Proving Ground, Maryland
• Food and Drug Administration – Chemist, Silver Spring, Maryland • Agricultural Research Service – Chemist, Beltsville, Maryland
Ecologist Job Duties:
• Identify environmental impacts caused by products, systems, or projects. • Examine local, regional or global use and flow of materials or energy in industrial
production processes. • Analyze changes designed to improve the environmental performance of complex
systems to avoid unintended negative consequences. Current Job Examples: • Environmental Technician – Hazardous Waste - Clean Harbors Environmental
Services, Amegard, North Dakota • Oasis Petroleum - Environmental Representative, Williston, North Dakota • CACI International - Environmental Protection Specialist, Washington, DC
To explore more career options, visit https://www.onetonline.org/

52
Fermentation in a Bag Data Table Use this table to record your bag height measurements over time.
Be sure to watch out for spills!
Time (minutes) Sugar Bag Height (cm)
Cornmeal Bag Height (cm)
Sawdust Bag Height (cm)
0
5
10
15
20
25

53
Assessment Fermentation in a Bag-Lab Questions:
1. Hypothesis 1: What will happen when the yeast and feedstock are combined? _________________________________________________________ _________________________________________________________ _________________________________________________________ _________________________________________________________
2. What happened when the yeast and feedstock combined? ____________________________________________________________________ ____________________________________________________________________ ____________________________________________________________________
3. Hypothesis 2: What will happen when the warm water is added to the yeast and feedstock? ____________________________________________________________________ ____________________________________________________________________ ____________________________________________________________________
4. What happened when the warm water was added to the yeast and feedstock?
__________________________________________________ __________________________________________________ __________________________________________________
__________________________________________________
5. List a job that would investigate chemical reactions. __________________________________________________

54
Fermentation in a Bag-Lab Questions-Teacher Key 1. Hypothesis 1: What will happen when the yeast and sugar are combined?
Answers will vary, but may include: The sugar and yeast will mix together The yeast will be on the top and the sugar will be on the bottom
2. What happened when the yeast and sugar combined?
The yeast and sugar mixed together a little bit
3. Hypothesis 2: What will happen when the warm water is added to the yeast and sugar? Answers will vary but may include: It will mix together like soup It will mix together and turn into paste The bag will start getting bigger from gas that’s created
4. What happened when the warm water as added to the yeast and sugar? The yeast and sugar began to dissolve and little bubbles formed.
5. List a job that would that would investigate chemical reactions Answers will vary but may include: chemist, ecologist, chemical engineer, fuel scientist
55
Lab Safety Rubric Names: ____________________________________________________________________
---------------------------------------------------------------------------------------------------------------------
Lab Safety Rubric Names: ____________________________________________________________________
The Lab Group: Always (3 pts)
Sometimes (2 pts)
Needs Work (1 pt)
Wore safety googles and gloves during experiment.
Handled materials carefully (i.e. no horseplay).
Accurately followed teacher and lab instructions
Cleaned up lab area after finishing experiment
The Lab Group: Always (3 pts)
Sometimes (2 pts)
Needs Work (1 pt)
Wore safety googles and gloves during experiment.
Handled materials carefully.
Accurately followed teacher and lab instructions
Cleaned up lab area after finishing experiment
56
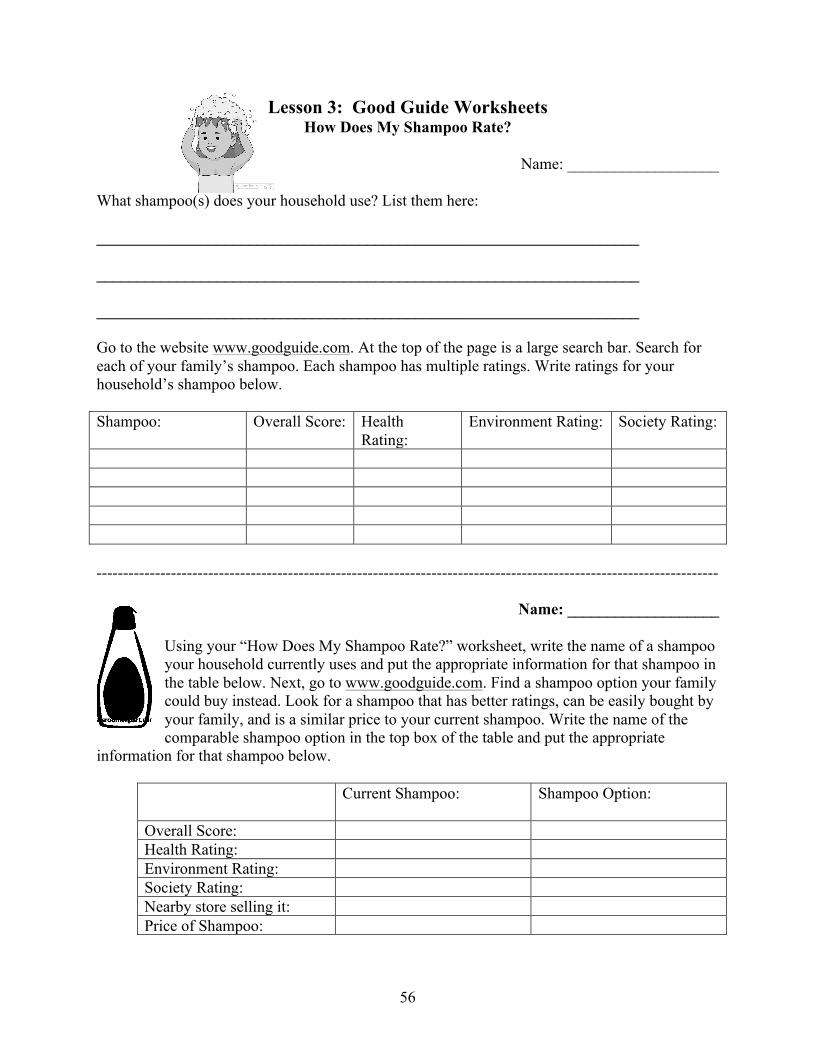
Lesson 3: Good Guide Worksheets How Does My Shampoo Rate?
Name: ___________________
What shampoo(s) does your household use? List them here: ____________________________________________________________________ ____________________________________________________________________
____________________________________________________________________ Go to the website www.goodguide.com. At the top of the page is a large search bar. Search for each of your family’s shampoo. Each shampoo has multiple ratings. Write ratings for your household’s shampoo below. Shampoo: Overall Score: Health
Rating: Environment Rating: Society Rating:
---------------------------------------------------------------------------------------------------------------------
Name: ___________________
Using your “How Does My Shampoo Rate?” worksheet, write the name of a shampoo your household currently uses and put the appropriate information for that shampoo in the table below. Next, go to www.goodguide.com. Find a shampoo option your family could buy instead. Look for a shampoo that has better ratings, can be easily bought by your family, and is a similar price to your current shampoo. Write the name of the comparable shampoo option in the top box of the table and put the appropriate
information for that shampoo below.
Current Shampoo:
Shampoo Option:
Overall Score: Health Rating: Environment Rating: Society Rating: Nearby store selling it: Price of Shampoo:

57
Assesesment
1. What did you learn about the shampoo your family uses? ____________________________________________________________________ ____________________________________________________________________ ____________________________________________________________________ ____________________________________________________________________ ____________________________________________________________________
2. Based on what you’ve learned, would you recommend your family buy a new kind of shampoo or start buying another kind? Explain the reasons for your answer. ____________________________________________________________________ ____________________________________________________________________ ____________________________________________________________________ ____________________________________________________________________ ____________________________________________________________________
3. What would you say to your parents on your next trip to the store about buying shampoo, based on what you learned in this activity? ____________________________________________________________________
____________________________________________________________________ ____________________________________________________________________
____________________________________________________________________ ____________________________________________________________________
____________________________________________________________________