field-wide meta-analyses of observational associations can
TRANSCRIPT

Journal of Clinical Epidemiology 71 (2016) 58e67
Field-wide meta-analyses of observational associations can map selectiveavailability of risk factors and the impact of model specifications
Stylianos Serghioua, Chirag J. Patelb, Yan Yu Tana, Peter Koayc,d, John P.A. Ioannidise,f,g,h,*aCollege of Medicine and Veterinary Medicine, The University of Edinburgh, 47 Little France Crescent, Edinburgh EH16 4TJ, Edinburgh, UK
bDepartment of Biomedical Informatics, Harvard Medical School, 10 Shattuck Street, 4th Floor, Boston, MA 02115, USAcOphthalmology Department, St John’s Hospital, Howden South Road, Livingston, West Lothian, EH54 6PP, UK
dThe Princess Alexandra Eye Pavilion, Chalmers Street, Edinburgh EH3 9HA, UKeStanford Prevention Research Center, Department of Medicine, Stanford University School of Medicine, 1265 Welch Rd, MSOB X306,
Stanford, CA 94305, USAfDepartment of Health Research and Policy, Stanford University School of Medicine, 150 Governor’s Lane, Stanford, CA 94305, USA
gDepartment of Statistics, Stanford University School of Humanities and Sciences, 390 Serra Mall, Stanford, CA 94305, USAhMeta-Research Innovation Center at Stanford (METRICS), Stanford School of Medicine, 1070 Arastradero Road, Palo Alto, CA 94304, USA
Accepted 7 September 2015; Published online 28 September 2015
Abstract
Objectives: Instead of evaluating one risk factor at a time, we illustrate the utility of ‘‘field-wide meta-analyses’’ in considering allavailable data on all putative risk factors of a disease simultaneously.
Study Design and Setting: We identified studies on putative risk factors of pterygium (surfer’s eye) in PubMed, EMBASE, and Web ofScience. We mapped which factors were considered, reported, and adjusted for in each study. For each putative risk factor, four meta-analyses were done using univariate only, multivariate only, preferentially univariate, or preferentially multivariate estimates.
Results: A total of 2052 records were screened to identify 60 eligible studies reporting on 65 putative risk factors. Only 4 of 60 studiesreported both multivariate and univariate regression analyses. None of the 32 studies using multivariate analysis adjusted for the same set ofrisk factors. Effect sizes from different types of regression analyses led to significantly different summary effect sizes (P-value ! 0.001).Observed heterogeneity was very high for both multivariate (median I2, 76.1%) and univariate (median I2, 85.8%) estimates. No singlestudy investigated all 11 risk factors that were statistically significant in at least one of our meta-analyses.
Conclusion: Field-wide meta-analyses can map availability of risk factors and trends in modeling, adjustments and reporting, as well asthe impact of differences in model specification. � 2016 Elsevier Inc. All rights reserved.
Keywords: Meta-analysis; Exposome-wide association study; Observational study; Risk factor epidemiology; Statistical modeling; Big data
1. Introduction
Meta-analyses of observational studies on putative riskfactors [1e3] are popular, and thousands of such meta-analyses have been published. Although useful incombining large numbers of relevant studies into a sum-mary effect size, these quantitative syntheses suffer fromsignificant limitations [4e6].
Funding: This work was supported by a NIEHS K99/R00
(K99ES023504) and a PhRMA Foundation grant to C.J.P. The work of
Dr. Ioannidis is also supported by an unrestricted gift from Sue and Bob
O’Donnell.
Conflict of interest: None.
* Corresponding author. Tel.: þ1 (650) 725-5465.
E-mail address: [email protected] (J.P.A. Ioannidis).
http://dx.doi.org/10.1016/j.jclinepi.2015.09.004
0895-4356/� 2016 Elsevier Inc. All rights reserved.
Most meta-analysis publications focus on studying the as-sociation of one or at most a few putative risk factors to aparticular outcome. However, given the massive volume ofpublished studies on risk factor epidemiology, there is typi-cally a large number of risk factors that have been studiedfor any given outcome. Different investigators may haveevaluated different risk factors and may have only reportedsubsets of them in their published articles. Moreover, thereis often lack of consensus about whether risk factors shouldbe analyzed and reported in univariate ormultivariatemodelsor both [7], and sometimes this can have a substantial effecton the results [5,8].Whenmultivariate models are used, thereis a large diversity in terms of what other variables should beincluded for standard adjustments [9e11]. The pool of suchvariables can be very large, and it depends on what has been

59inical Epidemiology 71 (2016) 58e67
What is new?
Key findings� Field-wide meta-analyses can map the selective
availability of risk factors as well as the patternsof modeling, adjustments and reporting, of riskfactors across studies.
What this adds to what was known?� Across all 60 studies on the risk factor epidemi-
ology of pterygium, 32 used multivariate analyses,but no two studies used identical variables in theirmultivariate models.
� Differences in model specification can confer dif-ferences in summary effect sizes.
What is the implication and what should changenow?� We propose that instead of assessing one putative
risk factor at a time, a meta-analysis of observa-tional data should assess the entire field of putativerisk factorsdwe call this approach a field-widemeta-analysis.
S. Serghiou et al. / Journal of Cl
measured and what the investigators of each study consideressential for adjustments.
Finally, the reporting of an observational studymay selectonly a few of the many models that have been assessed, andthe choice may be based not only on a priori considerationsabout whichmodel is the best, but also on the results [12]. Se-lective reporting bias can be a major threat to the validity ofthe available published information [13]. Meta-analyses thattry to synthesize the selectively reported results, despite theadvent of post hoc bias correction [14], may simply reinforcethese biases by averaging the impact of diverse biases on thestrength of the assessed associations [7,15].
Here, we propose that instead of merely assessing one pu-tative risk factor at a time and synthesizing a limited set ofpotentially biased results, a meta-analytic approach to suchobservational data should assess the entire field (defined byan outcome of interest) and its putative risk factors. We callthis approach a field-wide meta-analysis of putative risk fac-tors. A field-wide meta-analysis aims to (1) consider all dataon all assessed risk factors for the outcome of interest and tocompare the relative availability of data for each of the puta-tive risk factors across the respective studies; (2)map system-atically whether univariate analyses, multivariate analyses,or both have been reported; (3) map systematically what ad-justments have been made in multivariate analyses; (4)examine systematically whether the results of meta-analyses are consistent when different estimates fromdifferent models (univariate or multivariate) are synthesized;
and (5) assess whether the results across the entire field haveevidence of selective biases [16,17]. We exemplify thisapproach by applying it to data on putative risk factors of pte-rygium (a conjunctival growth over the cornea), a topicwith asubstantial number of observational studies.
2. Materials and methods
2.1. Systematic review
For a detailed overview of Methods please refer toAppendix A at www.jclinepi.com. Briefly, all studies quan-titatively exploring the association of any putative risk fac-tor to the presence of pterygium and providing (or allowingthe calculation of) the effect size and 95% confidence inter-val (CI) were eligible. We systematically reviewed EM-BASE Classic and EMBASE (1947 to October 15, 2013),ISI Web of Science (1900 to October 15, 2013), PubMed(1950 to October 15, 2013) and Cochrane Central Registerof Controlled Trials (up to October 15, 2013). We custom-ized our search strategy to every database and selected forstudies where the main outcome measure was the presenceof pterygium. Data were collected by two reviewers (S.S.and Y.Y.T.), who also extracted the following data items:type of modeling (multivariate, univariate or both), adjust-ment variables (in multivariate models), high-level risk fac-tor domain (e.g., sunlight exposure), more granular riskfactor specification (e.g., sunlight exposure for O5 hours/d vs. not), metric type (e.g., odds ratio [OR] and relativerisk [RR]), metric value (e.g., OR 5 0.78), and 95% CIor standard error (whichever was available). Wheneverthe same study population was used more than once tostudy the same risk factors, we only extracted data fromthe latest article reporting on that study population. Instudies where two multivariate models were used (e.g., asmall model adjusting for age and gender and a large modeladjusting for all statistically significant factors), we ex-tracted the multivariate data from the largest model forwhich these were available. Metrics specific to continuousvariables (e.g., Cohen’s d) were transformed into ORs usingan online tool [18] and standard formulae [19]. Only onestudy reported RR [20]; given that the incidence of theoutcome of interest (pterygium) in that study was less than10%, the RRs were considered to adequately approximateORs [21]. On the basis of what is known regarding thepathogenesis of pterygium [22,23], we denoted a priori in-terest in the following 10 risk factors: sunlight exposure,occupation type, educational attainment, income, area ofresidence, use of sunglasses, use of spectacles, use of hat,dry eyes, and latitude. Our complete database can be foundhere: https://goo.gl/9Ti1oG.
2.2. Mapping of risk factors, type of analysis, andadjustments
R [24] was used to format and analyze our database. Thefigures illustrating the results of this analysis were color

60 S. Serghiou et al. / Journal of Clinical Epidemiology 71 (2016) 58e67
coded using the ‘‘Conditional Formatting’’ function of Mi-crosoft Excel (Redmond, Washington; USA). As notedabove, all recorded risk factors were categorized intohigh-level domains and more granular risk factor specifica-tions (thus, each domain includes several risk factor speci-fications). For convenience, whenever we use the term‘‘risk factors,’’ we refer to risk factor domains.
2.3. Meta-analyses for four modeling scenarios
Standard errors were calculated using: ln(upper limit ofCI/lower limit of CI)/(2� 1.96). We meta-analyzed only do-mains/specifications for which three or more estimates wereavailable. All estimates were synthesized using a random-effects model due to evident between-study heterogeneity.The summary OR was estimated using the restrictedmaximum-likelihood ratiomethod. Fourmeta-analyses weredone, one for each of: (1) multivariate data, (2) univariatedata, (3) multivariate data combined with univariate data,whenever multivariate data were unavailable (henceforthcalled preferentially multivariate), and (4) univariate datacombined with multivariate data, whenever univariate datawere available (henceforth called preferentially univariate).We decided a priori to usea5 0.01 for claiming nominal sta-tistical significance. Given the multiple meta-analyses per-formed, a 5 0.05 would be too lenient, whereas aBonferroni correction (a 5 0.05/76 5 0.0006) would betoo stringent, given that many factors are correlated.
The nonparametric Friedman test was used to identifywhether any of the four matched pairs of modeling differsfrom at least one of the rest. Post hoc multiple comparisonafter Nemenyi was then used to delineate which specificgroups were significantly different from each other, as perthe R package ‘‘PMCMR’’ [25]. Where both domains andrisk factor specifications were eligible, only domains wereincluded to avoid bias. Meta-analyses were done using the‘‘metafor’’ 1.9-1 package [26].
2.4. Heterogeneity metrics
Between-study heterogeneity was assessed using the Qstatistic and the I2 metric, which we calculated using the‘‘metafor’’ package.
2.5. Excess significance testing
Publication bias, outcome bias, and selective analysesmay lead to an excess of statistically significant results,for which we tested by applying the excess significance testto factors reported by at least three studies [16]. Briefly, forevery meta-analyzed risk factor, we compare the amount ofobserved significant results (O) at a 5 0.05 to the amountof expected significant results (E), where E5 sum of powerof each study within a specific meta-analysis. Power wascalculated using simulations on R, taking as plausible effectfor the risk factor the effect seen in the most precise study(lowest standard error). The difference between O and E
was assessed using the binomial test, with a 5 0.1, as pre-viously suggested [17].
3. Results
3.1. Literature search and study description
We initially identified 2,052 records, from which 1,992were excluded (Fig. 1) leaving 60 eligible studies(Table 1; Appendix B at www.jclinepi.com). No newstudies were imported through reference checking. In twoof the eligible articles, not all the mentioned risk factorswere analyzable because not enough information was avail-able to obtain ORs [27,28].
There were 32 cross-sectional, 22 caseecontrol, 3 pro-spective cohort, and 3 retrospective cohort studies.Twenty-one of 32 cross-sectional, 8 of 22 caseecontrol,and 3 of 3 prospective cohort studies used multivariate an-alyses. The following population types were used, with theproportion of those reporting multivariate analyses in pa-rentheses: general (18 of 24), hospital based (3 of 12), workspecific (0 of 10), rural (6 of 7), and ethnically specified (5of 7); the differences reflect the tendency of earlier studies(before 1990) to use caseecontrol studies to investigatespecific occupations using univariate analysis. Most studiesemanated from Asia (34 of 60), followed by America (10 of60), Oceania (9 of 60), Africa (5 of 60), and Europe (3 of60)done study took place both in America and Asia[29]. The most commonly studied age groups were thoseaged 40 years old or older (23 of 60). Eligible studiesinvolved 362,548 participants, including 20,094 with atleast unilateral pterygium (excluding a study not providingadequate sample size information [30]).
3.2. Mapping of risk factors
A total of 65 risk factors (Fig. 2A) have been studiedwithin 183 different risk factor specifications (Fig. 2B;Supplementary Fig. 1 at www.jclinepi.com). Each risk fac-tor was only studied in a median of one article (interquartilerange [IQR], 1e4), and the 10 risk factors of a priori-specified interest were studied in a median of eight articles(IQR, 6e13). Although each of our a prioriedeterminedrisk factors have been reported at least five times, only 6of 60 studies investigated at least half of these 10 factorsand the maximum number of these risk factors investigatedwas 6 of 10.
A total of 25 risk factors were studied at least 3 times,and 17 were studied at least 5 times. Age, occupation type,level of education, sunlight exposure, dry eye, and ethnicitywere studied in at least five different risk factor specifica-tions (range, 5e34).
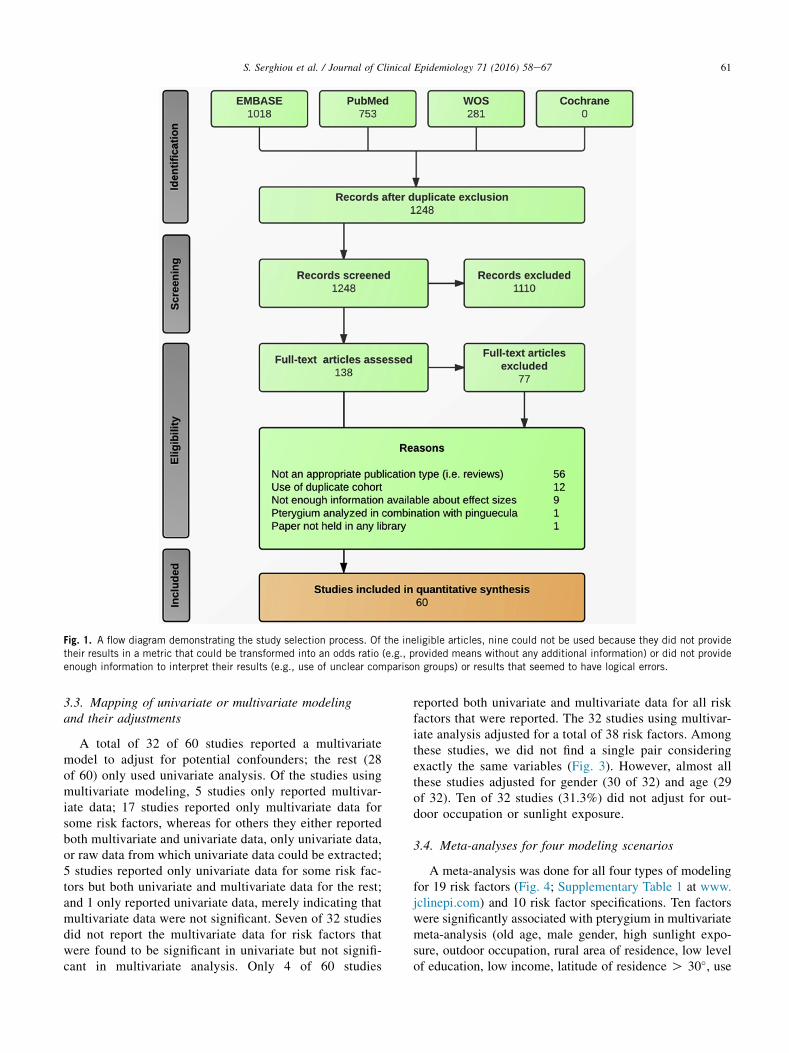
Fig. 1. A flow diagram demonstrating the study selection process. Of the ineligible articles, nine could not be used because they did not providetheir results in a metric that could be transformed into an odds ratio (e.g., provided means without any additional information) or did not provideenough information to interpret their results (e.g., use of unclear comparison groups) or results that seemed to have logical errors.
61S. Serghiou et al. / Journal of Clinical Epidemiology 71 (2016) 58e67
3.3. Mapping of univariate or multivariate modelingand their adjustments
A total of 32 of 60 studies reported a multivariatemodel to adjust for potential confounders; the rest (28of 60) only used univariate analysis. Of the studies usingmultivariate modeling, 5 studies only reported multivar-iate data; 17 studies reported only multivariate data forsome risk factors, whereas for others they either reportedboth multivariate and univariate data, only univariate data,or raw data from which univariate data could be extracted;5 studies reported only univariate data for some risk fac-tors but both univariate and multivariate data for the rest;and 1 only reported univariate data, merely indicating thatmultivariate data were not significant. Seven of 32 studiesdid not report the multivariate data for risk factors thatwere found to be significant in univariate but not signifi-cant in multivariate analysis. Only 4 of 60 studies
reported both univariate and multivariate data for all riskfactors that were reported. The 32 studies using multivar-iate analysis adjusted for a total of 38 risk factors. Amongthese studies, we did not find a single pair consideringexactly the same variables (Fig. 3). However, almost allthese studies adjusted for gender (30 of 32) and age (29of 32). Ten of 32 studies (31.3%) did not adjust for out-door occupation or sunlight exposure.
3.4. Meta-analyses for four modeling scenarios
A meta-analysis was done for all four types of modelingfor 19 risk factors (Fig. 4; Supplementary Table 1 at www.jclinepi.com) and 10 risk factor specifications. Ten factorswere significantly associated with pterygium in multivariatemeta-analysis (old age, male gender, high sunlight expo-sure, outdoor occupation, rural area of residence, low levelof education, low income, latitude of residence O 30�, use

Table 1. Studies meeting the eligibility criteria (numbers within [] refer to full references in Appendix B at www.jclinepi.com)
Authors Year Journal Design N n
Li and Cui [1] 2013 Cornea Prospective cohort 5,057 323Liu et al. [2] 2013 Intern Eye Sci Cross-sectional 3,067 280Marmamula et al. [3] 2013 Invest Ophthalmol Vis Sci Cross-sectional 5,586 655Rim et al. [4] 2013 Cornea Cross-sectional 14,920 4,307Sherwin et al. [5] 2013 Acta Ophthalmol Cross-sectional 641 70Sun et al. [6] 2013 Ophthalmic Epidemiol Cross-sectional 6,685 401Tano et al. [7] 2013 Acta Ophthalmol Cross-sectional 2,312 101Zhao et al. [8] 2013 Invest Ophthalmol Vis Sci Prospective cohort 2,628 129Ang et al. [9] 2012 Ophthalmology Cross-sectional 8,906 900Anguria et al. [10] 2012 S Afr Med J Caseecontrol 150 150Asokan et al. [11] 2012 Ophthalmic Physiol Opt Cross-sectional 3,924 740Rezvan et al. [12] 2012 Acta Med Iran Cross-sectional 5,190 489Sarac et al. [13] 2012 Turk J Med Sci Retrospective cohort 6,470 196Sudhalkar [14] 2012 Eye (lond) Caseecontrol 107 310Zhong et al. [15] 2012 Invest Ophthalmol Vis Sci Cross-sectional 2,133 832Viso et al. [16] 2011 Eye (lond) Cross-sectional 619 42Cajucom-Uy et al. [17] 2010 Br J Ophthalmol Cross-sectional 3,280 508Peiretti et al. [18] 2010 Invest Ophthalmol Vis Sci Caseecontrol 112 123Fotouhi et al. [19] 2009 Eye (lond) Cross-sectional 4,565 59Shiroma et al. [20] 2009 Am J Ophthalmol Cross-sectional 3,747 1,154West and Munoz [21] 2009 Br J Ophthalmol Cross-sectional 4,774 772Xie et al. [22] 2009 Graefes Arch Clin Exp Ophthalmol Cross-sectional 3,214 e
Demirok et al. [23] 2008 Ann Ophthalmol (skokie) Caseecontrol 60 102Durkin et al. [24] 2008 Br J Ophthalmol Cross-sectional 2,076 407Lin et al. [25] 2008 Environ Health Perspect Caseecontrol 383 134Nemesure et al. [26] 2008 Ophthalmology Prospective cohort 1,888 219Omoti et al. [27] 2008 Eye (lond) Caseecontrol 154 174Davies et al. [28] 2007 Niger J Physiol Sci Caseecontrol 110 85Lu et al. [29] 2007 Clin Exp Ophthalmol Cross-sectional 2,229 323Ukponmwan et al. [30] 2007 East Afr Med J Caseecontrol 123 162Paula et al. [31] 2006 Eye (lond) Caseecontrol 624 115Tan et al. [32] 2006 Eye (lond) Cross-sectional 477 81Taylor et al. [33] 2006 Arch Environ Occup Health Cross-sectional 304 68Yan et al. [34] 2006 Chinese Med J-peking Caseecontrol 100 100Balachandra [35] 2005 Pac Health Dialogue Cross-sectional 753 109Mathur et al. [36] 2005 Int Ophthalmol Cross-sectional 1,169 148Hayashida and Kitaoka [37] 2003 Acta Med Nagasaki Cross-sectional 1,558 164Gazzard et al. [38] 2002 Br J Ophthalmol Cross-sectional 1,210 113Twelker and Bailey [39] 2002 Invest Ophthalmol Vis Sci Caseecontrol 90 90Wong et al. [40] 2001 Am J Ophthalmol Cross-sectional 1,232 120McCarty et al. [41] 2000 Br J Ophthalmol Cross-sectional 5,147 141Saw et al. [42] 2000 Acta Ophthalmol Scand Caseecontrol 125 61Threlfall and English [43] 1999 Am J Ophthalmol Caseecontrol 135 150Kadayifcilar et al. [44] 1998 Acta Ophthalmol Scand Caseecontrol 70 70Khoo et al. [45] 1998 Int Ophthalmol Caseecontrol 125 61Panchapakesan et al. [46] 1998 Aust N Z J Ophthalmol Cross-sectional 3,629 266Corzo-Alvarez and
Urribarri-Delgado [47]1997 Invest Clin Caseecontrol 143 143
Mackenzie et al. [48] 1992 Ophthalmology Caseecontrol 278 278Taylor et al. [49] 1992 Arch Ophthalmol Cross-sectional 838 140Ibechukwu [50] 1990 East Afr Med J Caseecontrol 1 98Taylor et al. [51] 1989 Arch Ophthalmol Cross-sectional 838 140Spierer et al. [52] 1985 Metab Pediatr Syst Ophthalmol Retrospective cohort 600 93Karai and Horiguchi [53] 1984 Br J Ophthalmol Caseecontrol 191 214Moran and Hollows [54] 1984 Br J Ophthalmol Cross-sectional 64,314 2,194Taylor [55] 1980 Br J Ophthalmol Cross-sectional 350 67Biedner et al. [56] 1979 Ann Ophthalmol Caseecontrol 0 60Detels and Dhir [57] 1967 Arch Ophthalmol Caseecontrol 1,252 151Darrell and Bachrach [58] 1963 Arch Ophthalmol Caseecontrol 1,904 463Kerkenezov [59] 1956 Trans Ophthalmol Soc Aust Cross-sectional 3,000 287Ten Doesschate and
Fischer [60]1949 Ophthalmologica Retrospective cohort 180,000 147
62 S. Serghiou et al. / Journal of Clinical Epidemiology 71 (2016) 58e67

Fig. 2. (A) A ‘‘data microarray’’ illustrating what studies investigated which putative risk factors, for all risk factors studied three or more times. Riskfactors are ordered based onhowmany times theywere studied.Risk factors in light gray are the a priori factors of interest. Each row represents a separatearticle in the order thesewerepresented in Table 1. (B) A ‘‘datamicroarray’’ illustrating the risk factor specifications for the ‘‘sunlight’’ risk factor domain.
63S. Serghiou et al. / Journal of Clinical Epidemiology 71 (2016) 58e67

Fig. 3. A ‘‘data microarray’’ illustrating what putative risk factors wereadjusted for by each article. Only a priori-determined risk factors ofinterest are shown for convenience. Articles are ordered in descend-ing order based on how many putative risk factors they adjusted for(this order only holds true for the risk factors shown). No twoarticles adjusted for the same putative risk factors. Refer toSupplementary Fig. 2 at www.jclinepi.com for a data microarrayillustrating all risk factor domains for which adjustments were made.Black, adjusted for; gray, not adjusted for.
It shows that althoughmanydomainshavebeen investigated extensively, theyhFig. 1 at www.jclinepi.com for the datamicroarray illustrating all specificationslight gray, not analyzed; medium gray, univariate analysis; dark gray, multivarirelated macular degeneration; UVA, ultraviolet A; UVB, ultraviolet B.
64 S. Serghiou et al. / Journal of Clinical Epidemiology 71 (2016) 58e67
of spectacles, and use of sunglasses). Use of sunglasses lostits significance in all other modes of analysis, male genderlost significance in univariate analysis, and dry eyes gainedsignificance in univariate analysis. No single study investi-gated all 11 risk factors found to be significant in at leastone meta-analysis.
Considering risk factor domains, the summary estimatefor different types of analysis was statistically significantlydifferent (Fc
2 5 27.1; P-value! 0.0001) because of differ-ences between multivariate vs. univariate and preferentiallymultivariate vs. univariate analyses (P ! 0.0005 for both).Univariate analyses displayed a tendency toward higher ef-fect sizes; specifically, in 13 of 19 cases, the univariate anal-ysis yielded larger effect sizes than the multivariate analysis.(When taking risk factor specifications into account, thisratio became 19 of 28dfor one of the risk factors, the ORfor multivariate was equal to that for univariate analysis).
3.5. Heterogeneity metrics and excess significance
Heterogeneity between all summary effect sizes wasconsistently very high, with median heterogeneityI25 76.1% (IQR, 59.9e88.0%) formultivariate/preferentiallymultivariate meta-analyses, against I2 5 81.2% (IQR, 80.8-94.3%) for univariate/preferentially univariate meta-analyses;excluding risk factor domains led to a small nonsignificantdecrease. In 18 of 29 risk factors, heterogeneity was largerfor univariate than multivariate models (binomial P-value5 0.18). The O exceeded the E number of studies withstatistically significant results at a 5 0.1 in 21 of 116 meta-analyses.
4. Discussion
We have presented and implemented the concept of field-widemeta-analyses of risk factors using data from pterygiumrisk factor epidemiology. Our example illustrates what islikely to be common in many fields where efforts are madeto identify risk factors for a given outcome of interest: a largenumber of studies evaluate a large number of risk factors,most of which are reported in the minority of studies. It is un-clear if this means that these factors were not studied or stud-ied but not reported. Moreover, there is a large diversity inmodeling and adjustmentsdin our case study of pterygium,not a single multivariate model specification was identicalbetween at least two studies. Different combinations of dataemanating from either univariate or multivariate analysesyield different meta-analytical effect size estimates. How-ever, differences in combinations did not seem to affect
avebeenspecifiedvery differently across studies.Refer toSupplementaryfor all risk factor domains. Light gray risk factor, a priori factor of interest;ate analysis; black, both multivariate and univariate analysis; AMD, age-

Fig. 4. A panel of forest plots illustrating summary effect sizes and respective 95% confidence intervals for all 19 meta-analyzed risk factor do-mains for each type of analysis. The following factors were statistically significant at a 5 0 .01 for all four types of analysis: old age, high sunlightexposure, outdoor occupation, rural area of residence, low level of education, low income, latitude of residenceO30�, and use of spectacles. Referto Supplementary Table 1 at www.jclinepi.com for a table illustrating all our results, alongside tests of heterogeneity and excess significance. OR,odds ratio.
65S. Serghiou et al. / Journal of Clinical Epidemiology 71 (2016) 58e67
whether our summary estimates reach statistical significanceor not. Large heterogeneity, small-study effects, and excesssignificance signals are suggestive of reporting biases,although they probably have modest specificity in that re-gard. Such examples of between-study differences probablyare the norm rather than the exception and have been previ-ously shown to affect meta-analyses [7,31,32].
The observed variability in model specification in obser-vational epidemiology may be related to a combination ofdifferent reasons and motives. Researchers perhaps do notactively try to align their research to previously publishedmodels, and editors/referees do not actively promote thispractice. Perhaps, they do not see a need in doing so or evenexplicitly try to do things differently, using a differentmodel specification and consideration of different risk fac-tors as a means to claim innovation [33]. Furthermore, thereare often many valid ways to define a putative risk factor,unless there is a generally accepted consensus. Even whenthere is consensus, reporting of models may still be sketchyand selective, despite efforts for standardization of report-ing [34,35]. Eventually, there is substantial room for flex-ible analyses and for bias because of conflict of interestor prior beliefs that may result in selective reporting andpartial interpretation of the results.
The phenomenon whereby effect size estimates changewith alternative data approaches has been called ‘‘vibrationof effects’’ [36,37]. Vibration can be generated from alter-native choices, not only in adjustments for covariates inmodel specification [37, 38], but also from different defini-tions of variables, eligibility criteria, and statistical methodsof analysis. Sometimes, analytical choices [36,37] may beaimed at facilitating the identification of as strong an effectas possible [39], leading to potentially inflated or widelydifferent estimates [40].
As we show, multivariate models tend to give weaker ef-fects than univariate ones, but this is not always the case.Nevertheless, the optimal choice of model may be difficultto identify. For example, adjusting for confounders isappropriate, whereas adjusting for variables that may bein the path that explains the effect of a risk factor may inap-propriately diminish the adjusted effect size. Often it isdifficult to understand which variables are confoundersand which are not.
Despite our comprehensive and systematic approach togathering and evaluating all the literature related to pteryg-ium risk factor epidemiology, limitations exist. First,although we went at great length to ensure that all relevantarticles were identified by creating a sensitive literature

66 S. Serghiou et al. / Journal of Clinical Epidemiology 71 (2016) 58e67
search strategy, translating articles published in languagesother than English, and having two researchers goingthrough and validating our database, we cannot excludethe possibility that some articles were overlooked. Second,we focused on what is reported, but it is quite likely thatadditional unreported risk factors and models weremeasured and fit. However, if something is not reported,it does not inform the research literature. Third, it ispossible that in some studies, some risk factors may nothave been relevant to model, for example, if all participantshad the same value (e.g., if a study only enrolled women,gender would not be relevant to adjust for). Fourth, out-comes of interest other than pterygium may exhibitdifferent field-wide profiles with more (or even less) consis-tency. Routine application of this approach across diversefields of risk factor epidemiology will inform the extentto which these analytical choices make a difference. Fifth,although our meta-analyses have identified summary esti-mates for all risk factors ever studied in the context of pte-rygium and these have been duly reported, the quality ofthe data available cannot be necessarily trusted to permitfirm conclusions based on those results.
Approaches similar to our field-wide meta-analysis havebeen used in genetic epidemiology to generate field synop-ses, where databases are dedicated to collecting all geneticassociation studies on specific outcomes (phenotypes)[41e43]. However, in the case of genetics, adjustmentsfor covariates are not an issue and human-genomeepidemiology has made tremendous progress with theadvent of platforms that allow covering the entire genome.Exposure-wide assessments, such as ‘‘Exposome/Environment-wide Association Studies’’ (EWAS), are simi-larly being proposed in nongenetic variables [44e49], tonot only facilitate discovery, but also standardize variableadjustments and variables. However, until EWAS-like ap-proaches become more commonplace and widely accepted,single studies are likely to continue covering very differentaspects of the putative risk factors’ space. Field-wide eval-uations provide a way of recognizing the quality of currentdata and selective availability of evidence and aid to char-acterize how susceptible to potential bias entire fields ofrisk factor epidemiology may be. They also provide visualtabulation of the gaps in a field, thus guiding furtherresearch in the field. To enhance field-wide analyses, werecommend executing EWAS to standardize, use of repro-ducible methods to identify covariates [11], estimatingand reporting required power before commencing datacollection and calibrating P-values with a database of goldstandard negative controls [8,50].
Supplementary data
Supplementary data related to this article can be found athttp://dx.doi.org/10.1016/j.jclinepi.2015.09.004.
References
[1] Jones DR. Meta-analysis of observational epidemiological studies: a
review. J R Soc Med 1992;85:165e8.
[2] Friedenreich CM. Methods for pooled analyses of epidemiologic
studies. Epidemiology 1993;4:295e302.
[3] Blettner M, Sauerbrei W, Schlehofer B, Scheuchenpflug T,
Friedenreich C. Traditional reviews, meta-analyses and pooled ana-
lyses in epidemiology. Int J Epidemiol 1999;28:1e9.
[4] Egger M, Schneider M, Davey Smith G. Spurious precision? Meta-
analysis of observational studies. BMJ 1998;316:140e4.
[5] Blettner M, Schlehofer B, Sauerbrei W. Limitations of meta-
analysis from published data in epidemiological research. Soz Pra-
ventivmed 1997;42:95e104.[6] Bennett DA. Review of analytical methods for prospective cohort
studies using time to event data: single studies and implications
for meta-analysis. Stat Methods Med Res 2003;12:297e319.
[7] Madigan D, Ryan PB, Schuemie M. Does design matter? Systematic
evaluation of the impact of analytical choices on effect estimates in
observational studies. Ther Adv Drug Saf 2013;4:53e62.
[8] Madigan D, Stang PE, Berlin JA, Schuemie M, Overhage JM,
Suchard MA, et al. A systematic statistical approach to evaluating
evidence from observational studies. Annu Rev Stat Appl 2014;1:
11e39.
[9] Groenwold RHH, Hoes AW, Hak E. Confounding in publications of
observational intervention studies. Eur J Epidemiol 2007;22:413e5.
[10] Peters J, Mengersen K. Selective reporting of adjusted estimates in
observational epidemiology studies: reasons and implications for
meta-analyses. Eval Health Prof 2008;31:370e89.[11] Schneeweiss S, Rassen JA, Glynn RJ, Avorn J, Mogun H,
Brookhart MA. High-dimensional propensity score adjustment in
studies of treatment effects using health care claims data. Epidemi-
ology 2009;20:512e22.[12] Boffetta P, McLaughlin JK, La Vecchia C, Tarone RE, Lipworth L,
Blot WJ. False-positive results in cancer epidemiology: a plea
for epistemological modesty. J Natl Cancer Inst 2008;100:
988e95.
[13] Fiedler K. Voodoo correlations are everywherednot only in neuro-
science. Perspect Psychol Sci 2011;6:163e71.
[14] Ioannidis JPA. Commentary: adjusting for bias: a user’s guide to
performing plastic surgery on meta-analyses of observational
studies. Int J Epidemiol 2011;40:777e9.
[15] Feinstein AR. Meta-analysis: statistical alchemy for the 21st cen-
tury. J Clin Epidemiol 1995;48:71e9.
[16] Ioannidis JPA, Trikalinos TA. An exploratory test for an excess of
significant findings. Clin Trials 2007;4:245e53.
[17] Ioannidis JPA. Clarifications on the application and interpretation of
the test for excess significance and its extensions. J Math Psychol
2013;57:184e7.
[18] Wilson D.B. Practical meta-analysis effect size calculator. Available
at: http://www.campbellcollaboration.org/escalc/html/EffectSizeCal
culator-Home.php. Accessed April 29, 2015.
[19] Borenstein M, Hedges LV, Higgins JPT, Rothstein HR. Introduction
to meta-analysis. 1st ed. Wiley: Chichester, UK, 2009.
[20] Mackenzie FD, Hirst LW, Battistutta D, Green A. Risk analysis in
the development of pterygia. Ophthalmology 1992;99:1056e61.
[21] Zhang J, Yu KF. What’s the relative risk? A method of correcting
the odds ratio in cohort studies of common outcomes. JAMA
1998;280:1690e1.
[22] Maloof AJ, Ho A, Coroneo MT. Influence of corneal shape on lim-
bal light focusing. Invest Ophthalmol Vis Sci 1994;35:2592e8.
[23] Detorakis ET, Spandidos DA. Pathogenetic mechanisms and treat-
ment options for ophthalmic pterygium: trends and perspectives (re-
view). Int J Mol Med 2009;23:439e47.
[24] RStudio. RStudio: Integrated development environment for R. RStu-
dio Team. RStudio, Inc.; Boston, MA, 2015, Available at: http://
www.rstudio.com/.

67S. Serghiou et al. / Journal of Clinical Epidemiology 71 (2016) 58e67
[25] Pohlert T. The pairwise multiple comparison of mean ranks package
(PMCMR). R. package, 2014.
[26] Viechtbauer W. Conducting meta-analyses in R with the metafor
package. J Stat Softw 2010;36:1e48.
[27] Kerkenezov N. A pterygium survey of the far north coast of New
South Wales. Trans Ophthalmol Soc Aust 1956;16:110e9.
[28] Ibechukwu BI. Astigmatism and visual impairment in pterygium:
affected eyes in Jos, Nigeria. East Afr Med J 1990;67:912e7.
[29] Detels R, Dhir SP. Pterygium: a geographical study. Arch Ophthal-
mol 1967;78:485e91.
[30] Xie XW, Xu L, Wang YX, Jonas JB. Body height and ocular dis-
eases. The Beijing eye study. Graefes Arch Clin Exp Ophthalmol
2009;247:1651e7.
[31] Hern�andez-D�ıaz S, Varas-Lorenzo C, Garc�ıa Rodr�ıguez LA. Non-
steroidal antiinflammatory drugs and the risk of acute myocardial
infarction. Basic Clin Pharmacol Toxicol 2006;98:266e74.[32] Loke YK, Kwok CS, Singh S. Comparative cardiovascular effects of
thiazolidinediones: systematic review and meta-analysis of observa-
tional studies. BMJ 2011;342:d1309.
[33] Glaeser EL. Researcher incentives and empirical methods, National
Bureau of Economic Research (NBER) Technical Working Paper
Series 329, 2006. Available at: http://www.nber.org/papers/t0329.
[34] Elm von E, Altman DG, Egger M, Pocock SJ, Gøtzsche PC,
Vandenbroucke JP, et al. The strengthening the reporting of observa-
tional studies in epidemiology (STROBE) statement: guidelines for
reporting observational studies. Int J Surg 2014;12:1495e9.
[35] Vandenbroucke JP, Elm von E, Altman DG, Gøtzsche PC,
Mulrow CD, Pocock SJ, et al. Strengthening the reporting
of observational studies in epidemiology (STROBE): explanation
and elaboration. Int J Surg 2014;12(12):1500e24.
[36] Ioannidis JPA. Why most discovered true associations are inflated.
Epidemiology 2008;19:640e8.
[37] Patel CJ, Burford B, Ioannidis JPA. Assessment of vibration of ef-
fects due to model specification can demonstrate the instability of
observational associations. J Clin Epidemiol 2015;68:1046e58.
[38] Lunt M, Solomon D, Rothman K, Glynn R, Hyrich K, Symmons DP,
et al. Different methods of balancing covariates leading to different
effect estimates in the presence of effect modification. Am J Epide-
miol 2009;169:909e17.
[39] Kavvoura FK, Liberopoulos G, Ioannidis JPA. Selection in reported
epidemiological risks: an empirical assessment. PLoSMed2007;4:e79.
[40] de Vries F, de Vries C, Cooper C, Leufkens B, van Staa T-P. Rean-
alysis of two studies with contrasting results on the association be-
tween statin use and fracture risk: the general practice research
database. Int J Epidemiol 2006;35:1301e8.
[41] Belbasis L, Panagiotou OA, Dosis V, Evangelou E. A systematic
appraisal of field synopses in genetic epidemiology: a HuGE review.
Am J Epidemiol 2015;181:1e16.
[42] Khoury MJ, McBride CM, Schully SD, Ioannidis JPA, Feero WG,
Janssens ACJW, et al. The scientific foundation for personal geno-
mics: recommendations from a National Institutes of Health-
Centers for Disease Control and Prevention multidisciplinary
workshop. Genet Med 2009;11:559e67.[43] Allen NC, Bagade S, McQueen MB, Ioannidis JPA, Kavvoura FK,
Khoury MJ, et al. Systematic meta-analyses and field synopsis of
genetic association studies in schizophrenia: the SzGene database.
Nat Genet 2008;40:827e34.[44] Patel CJ, Bhattacharya J, Butte AJ. An environment-wide associa-
tion study (EWAS) on type 2 diabetes mellitus. PLoS One 2010;5:
e10746.
[45] Patel CJ, Cullen MR, Ioannidis JPA, Butte AJ. Systematic evalu-
ation of environmental factors: persistent pollutants and nutrients
correlated with serum lipid levels. Int J Epidemiol 2012;41:
828e43.[46] Patel CJ, Rehkopf DH, Leppert JT, Bortz WM, Cullen MR,
Chertow GM, et al. Systematic evaluation of environmental and be-
havioural factors associated with all-cause mortality in the United
states national health and nutrition examination Survey. Int J Epide-
miol 2013;42:1795e810.
[47] Patel CJ, Ioannidis JP. Studying the elusive environment in large
scale. JAMA 2014;311:2173e4.
[48] Patel CJ, Ioannidis JPA. Placing epidemiological results in the
context of multiplicity and typical correlations of exposures. J Epi-
demiol Community Health 2014;68:1096e100.
[49] Patel CJ, Manrai AK. Development of exposome correlation globes
to map out environment-wide associations. Pac Symp Biocomput
2015;231e42.
[50] Ryan PB, Madigan D, Stang PE, Overhage JM, Racoosin JA,
Hartzema AG. Empirical assessment of methods for risk identifi-
cation in healthcare data: results from the experiments of the
Observational Medical Outcomes Partnership. Stat Med 2012;
31:4401e15.