field thermal performance of radiant barriers and … fallahi.pdf · field thermal performance of...
TRANSCRIPT

FIELD THERMAL PERFORMANCE OF RADIANT BARRIERS AND INTERIOR RADIATION CONTROL COATINGS FOR ATTIC RETROFITS
Ali Fallahi1, David Yarbrough
2, Jan Kośny
3
ABSTRACT For over a century, traditional bulk insulation materials like fiberglass and cellulose have been
used in attics to prevent heat from escaping or entering American homes. But times are changing
and today, builders and homeowners in Southern U.S. locations are discovering that adding attic
reflective insulation may offer significant gains in thermal efficiency – often far greater than the
same investment in additional layers of conventional bulk insulation. According to the US
Information Administration (EIA4), in 2009 in average more than 6% of the US household end-
use energy expenditure was for space cooling (air conditioning) while in the US hot humid
climate region this space cooling expenditure went up to more than 25%. In order to reduce
cooling energy consumption, techniques to limit radiative heat transfer such as Radiant Barriers
(RB) and Interior Radiation Control Coatings (IRCC) can be applied to existing residential attics
in single family homes or light commercial buildings. RBs incorporate two layers of aluminum
foil or aluminized plastic film. Aluminum has a low emissivity, absorbing and emitting a small
amount of infrared radiation. IRCC work in a similar manner, but it is a coating usually sprayed
on the back side of the roof deck. There are claims that RB and IRCC are easier to install and
very energy efficient in retrofit projects. The goal of this study is to understand these claims with
analyzing changes in the annual cooling energy consumption and peak cooling loads by both
experimental and numerical approaches. In Austin, Texas, both RB and IRCC were installed in
test houses and compared to a baseline house with no modifications. The test houses were
instrumented and thermal and energy performances of the attics were monitored for over 6
months. In addition the whole building energy consumption before and after retrofit was
compared using EnergyPlus energy consumption simulations. 1. Introduction Attic RBs and IRCCs present a unique way of increasing the thermal performance of existing or
new insulation within the space between the roof deck and ceiling level in residential and small
commercial buildings. Attic RBs save energy by reducing the transfer of heat from the hot roof
to the attic floor insulation in the summer. The transfer of heat from the attic floor insulation to
the roof in the winter is also reduced.
Aluminum surfaces, like those found in RB applications, have thermal emittances in the range of
0.03 to 0.06. Therefore, there is very little radiant transfer across a space bounded by a RB. Most
often, RBs are aluminum foil laminates or aluminized synthetic films sheets. The foils are
laminated to paper, most commonly to Kraft paper, synthetic films, oriented strand board (OSB),
1 Ali Fallahi, Ph.D., R&D staff, Building Science Engineer, Fraunhofer CSE, Boston, MA
2 David Yarbrough, Ph.D., P.E., President, R&D Services, Cookeville, TN
3 Jan Kośny, Ph.D., Building Enclosure Program Lead, Fraunhofer CSE, Boston, MA
4 http://www.eia.gov/consumption/residential/data/2009/index.cfm?view=consumption#end-use

or plywood. For the aluminized synthetic films, a thin layer of aluminum particles are deposited
on the films through a vacuum process. These laminates and films are characterized by having at
least one low-e surface of 0.1 or less (ASTM C 1313, 2010).
IRCCs are low-e coatings or paints that, when applied (i.e., sprayed or painted) to building
surface (e.g., OSB, plywood, metal siding, or plasterboard), decrease the emittance of these
surfaces to 0.25 or less (ASTM C 1321, 2009). Both RBs and IRCCs have received considerable
attention due to their potential to reduce the radiant heat transfer across vented spaces between
roofs and ceilings of buildings (e.g., attic spaces in residential buildings). In the case of RBs,
aluminum is used because it is inexpensive and is a surface that, once exposed to air, becomes
covered with a layer of a transparent oxide that protects it from the atmosphere and allows it to
maintain a constant emittance for long periods of time5.
In some cases, an RB can include an enclosed air space in order to provide thermal resistance to
the path between the roof sheathing and the attic floor. In this study an RB was used with an
enclosed air space, which is a common configuration with multi-layer products. In some cases,
there is an R-value6 7 associated with the reflective insulation component application. In the
configuration considered in this research, the thermal performance of interior-facing RB has to
be combined with the low thermal conductive performance of the enclosed air cavities.
Low-e coatings (IRCCs) have similar heat reduction principles as RBs in residential attics.
IRCCs are also being studied in this work. This is a crucial study for the industry since there are
very few examples of directly measured savings due to spray-applied or liquid-applied attic
IRCCs.
Base on Medina (2012), experimental results highlighting cooling load and ceiling heat flux
reductions produced by RBs are vary depending on nominal ceiling insulation R-value, testing
protocol, climate zone, ventilation type, occupancy and duct inclusion in the attics. Medina
(2012) reported that in attics with nominal insulation levels of R-11, R-19 and R-30, average
space cooling reductions are 14%, 20% and 6%, respectively. He also reported the average
reduction in heat flow produced by installing RBs in attics with insulation levels of R-11, R-19
and R-30 are 45%, 30% and 23%.
According to Medina (2012), laboratory-controlled experiments of IRCC applied in a flat system
configuration with an insulation level of R-19, produced average heat flow reductions of 32%
(vs. the same system without the application of any coatings).
Although the industry does not have software to evaluate energy savings, there is an ASTM
5 http://www.lenntech.com/periodic/elements/al.htm
6 Thermal resistances calculated for an enclosed air space with one surface having emittance 0.03 and a second
surface with emittance 0.9 are 1.99 and 3.43 (ft2•h•°F/Btu) when heat directions are up at 45º and down at 45º,
respectively. The thermal resistance values in the report do not include the effect of the air space between the
product and the roof sheathing of the RB effect due to a low-emittance surface facing the attic floor.
7 http://www.rimainternational.org/index.php/technical/library/residential-commercial/

consensus method for calculating RB performance (ASTM C 1340, “Standard Practice for
Estimation of Heat Gain or Loss through Ceilings under Attics Containing Radiant Barriers by
Use of a Computer Program”). This program is called “AtticSim” and was developed by
Kenneth Wilkes. In the past, it has been used by Oak Ridge National Laboratory to generate
input for two editions of DOE RB fact sheets.
Currently, RBs and IRCCs are difficult to numerically analyze using whole building energy
simulation tools. In the past, DOE 2.2, EnergyPlus, and BEopt, have not had the capability for
detailed attic modeling. Recently, there has been an effort to link C 1340 to DOE 2.2 and provide
modeling of attic RBs. However, the status of this project is unclear. Current DOE-sponsored
work with AtticSim is limited to attic RBs and does not extend to evaluations of reflective
insulation assemblies.
In the current study in collaboration with a team of local companies, both RB and IRCC
radiation control technologies were tested in the field condition. One type of RB product with
enclosed air space and two types of IRCC products were tested. For this puporse, four test
houses (two duplexes) in Austin, TX were chosen. These radiation control systems were installed
in the attic of three test houses.One attic, where none of the radiation control technologies were
installed, established the baseline.
All attics had heat flux transducers and thermistors installed to monitor both surface and air
temperatures. Comparisons of attic air temperatures were made to assess system performance.
Although heat flux is an indicator of the heating or cooling loads, air temperature reflects the
unique conditions of each unit as well as the loads. These unique conditions included varying
parameters within the four units that could not be changed or controlled. Notable variations
between the four cases include:
Ventilation of conditioned space– Occupants operating windows and adjusting HVAC
systems varied the flow rate greatly
Air leakage through ceiling– Craftsmanship of ceiling construction varied by apartment
(i.e. holes around pipes, ducts, etc.)
R-value of attic– Construction and insulation type and thickness varied between duplexes
Internal temperatures– Occupants adjusted the thermostat causing non-uniform
temperatures between units.
Finally, representative computer models were constructed to further enhance understanding of
the radiation control systems. Comparisons to the utility consumption data were made from the
simulation results.
2. Field Testing The test houses consisted of two duplex houses in Austin, which were closely located to each
other (< 0.1 miles apart). The duplexes were both constructed of 2×4 wood framing with brick or
wood cladding. Duplex 1 was built between 1987 and 1997 and Duplex 2 was a pre-1987
construction. Each duplex has two attached, unconditioned garages. The windows were operable,
single glazed in non-thermally-broken aluminum frames.
The attics over the garages are separated from the attics over the houses and were not installed
with the radiant control technologies. In order to thermally separate the test units, the attics over
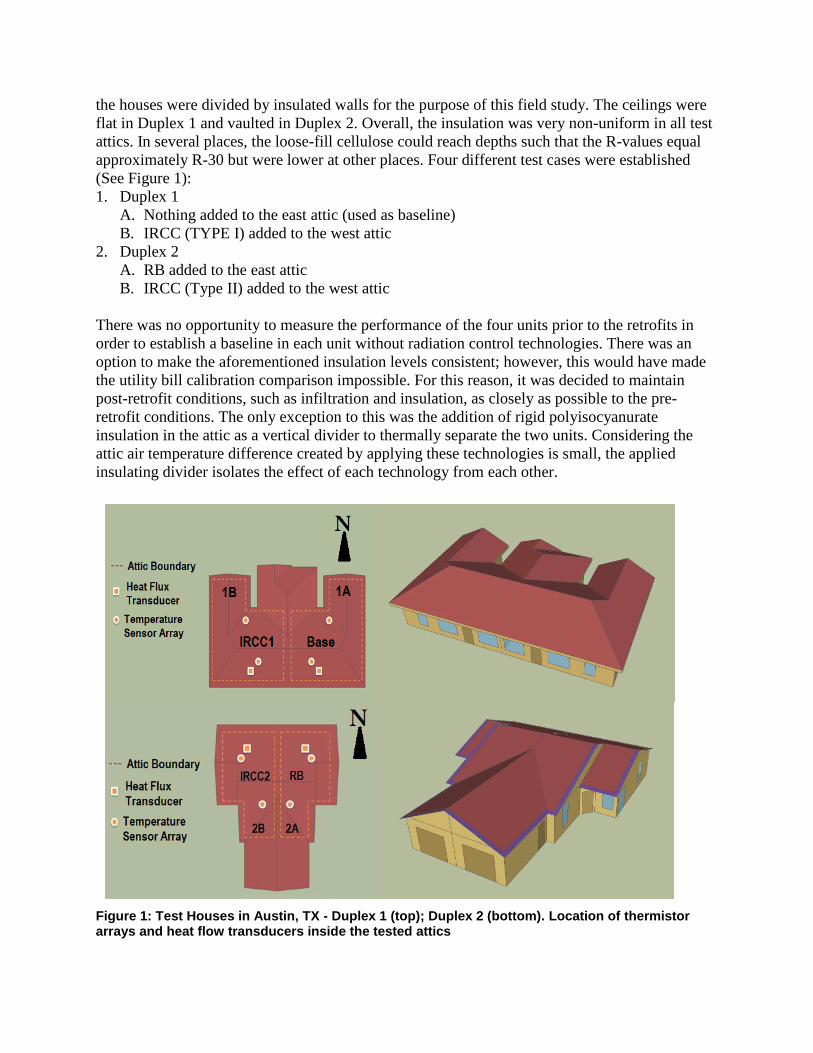
the houses were divided by insulated walls for the purpose of this field study. The ceilings were
flat in Duplex 1 and vaulted in Duplex 2. Overall, the insulation was very non-uniform in all test
attics. In several places, the loose-fill cellulose could reach depths such that the R-values equal
approximately R-30 but were lower at other places. Four different test cases were established
(See Figure 1):
1. Duplex 1
A. Nothing added to the east attic (used as baseline)
B. IRCC (TYPE I) added to the west attic
2. Duplex 2
A. RB added to the east attic
B. IRCC (Type II) added to the west attic
There was no opportunity to measure the performance of the four units prior to the retrofits in
order to establish a baseline in each unit without radiation control technologies. There was an
option to make the aforementioned insulation levels consistent; however, this would have made
the utility bill calibration comparison impossible. For this reason, it was decided to maintain
post-retrofit conditions, such as infiltration and insulation, as closely as possible to the pre-
retrofit conditions. The only exception to this was the addition of rigid polyisocyanurate
insulation in the attic as a vertical divider to thermally separate the two units. Considering the
attic air temperature difference created by applying these technologies is small, the applied
insulating divider isolates the effect of each technology from each other.
Figure 1: Test Houses in Austin, TX - Duplex 1 (top); Duplex 2 (bottom). Location of thermistor arrays and heat flow transducers inside the tested attics

2.1 Instrumentation Each partitioned attic has been instrumented to measure thermal energy flows and included
thermistor arrays for the test attics and heat flux transducers on the ceiling between the living
zone and the attic zone. In addition, a weather station was installed to measure outdoor climatic
parameters. The attic instrumentation diagram is illustrated in Figure 2 for the two different
installed technologies.
Temperature was measured using shielded thermistors. Two arrays of thermistors were installed
at each attic: one on the underside of the south-facing roof and the other under the north-facing
roof. Heat flux transducers measured the energy flow through the attic floors. The heat flux
transducers before deploying to the test houses were first calibrated between two pieces of
gypsum in a heat flow meter.
Figure 2: Diagrams of the attic sensor distributions for a RB combined with an enclosed reflective air space (right diagram), and IRCC and baseline (left diagram).
Figure 3: Installation of IRCC (left) & RB with enclosed airspace underside of the roof deck (middle, right)
2.2 Radiation Control Technology Installations As stated earlier, two types of low-cost radiation control strategies for southern U.S. applications
were installed in tested attics (Figure 3):
a) RB combined with an enclosed reflective air space installed in Duplex 2A. The installed RB in
this study is an insulating product composed of multiple layers of low-e materials designed to
reduce radiant heat transfer. The inside layer is a metalized polymer with emissivity of 0.04 and
the outside layer is reinforced aluminum foil kraft paper with emissivity of 0.03 bonded with a
fire-retardant adhesive. The layers expand when installed to form a reflective air space to provide
enhanced thermal performance and protect the low-e surface from the performance reducing
effects of dust accumulation.
b) spray-applied IRCC. Two types of IRCCs were sprayed: IRCC Type I- This was applied to
the attic of Duplex 1B and it is capable of lowering their surface emissivity to 0.19 or lower.
IRCC Type II- It was sprayed to the attic of Duplex 2B and lowers surface emissivity to 0.17 or
lower.
3. Data Analysis In the following sections, the recorded test data collected during June/July 2012 is presented and
compared for all four test units. Note that all test housing units were occupied during the testing
by families. Each of these families had different occupation habits and thermal comfort
preferences. In each house, thermostat temperature setups were close, but not identical. Also,
individual schedules for using the AC were different. In addition, the duplexes—even though
they had been similarly built in relatively close time periods—had attics with different structural
components, thicknesses, types of attic floor insulation and levels of attic ventilation. Significant
attention was paid to the comparison of the attic air temperatures, which were considered (due to
the listed above differences in the attic construction) as a best indicator of the performance
differences between analyzed technologies.
The following data are summarized and analyzed below:
Internal Air Temperature
Roof Surface Temperature
Attic Air Temperature
Attic Insulation Surface Temperature
Ceiling Heat Flux
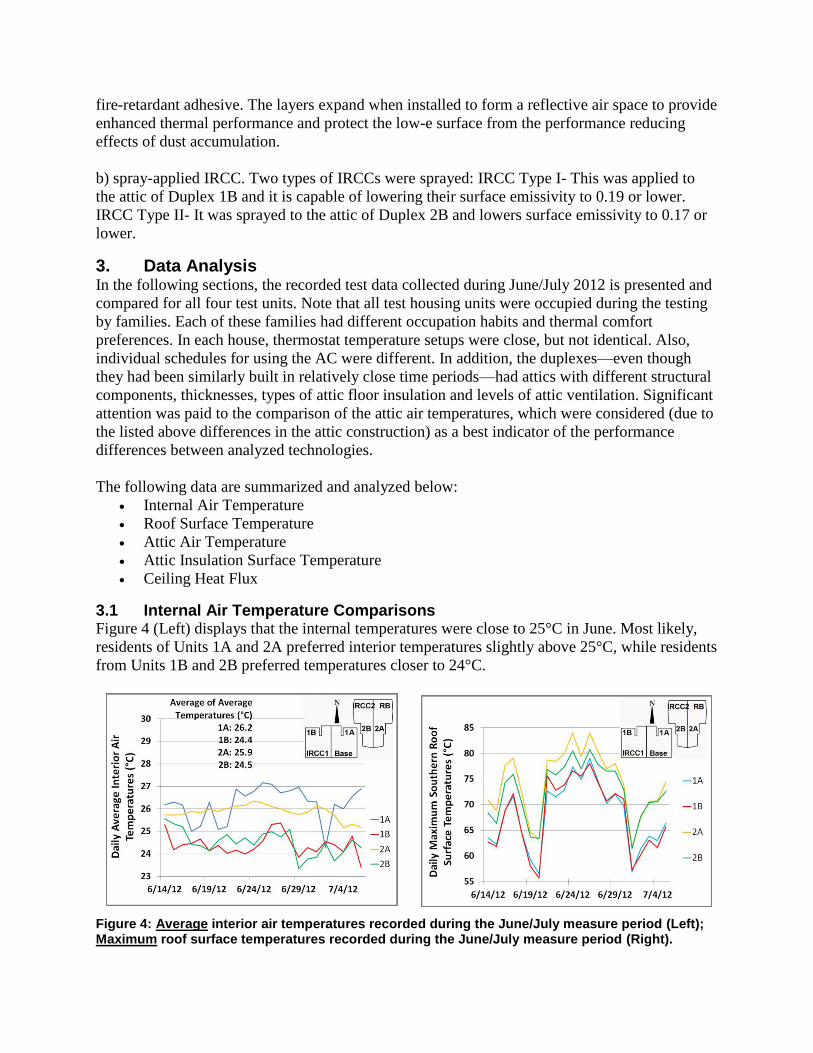
3.1 Internal Air Temperature Comparisons Figure 4 (Left) displays that the internal temperatures were close to 25°C in June. Most likely,
residents of Units 1A and 2A preferred interior temperatures slightly above 25°C, while residents
from Units 1B and 2B preferred temperatures closer to 24°C.
Figure 4: Average interior air temperatures recorded during the June/July measure period (Left); Maximum roof surface temperatures recorded during the June/July measure period (Right).

3.2 Attic Surface Temperature Comparison Figure 5(Right) shows daily average surface temperature of the attic surfaces recorded during
June/July. When the weather was warm in June, the roof temperatures of Duplex 2 were greater
than Duplex 1. The maximum roof temperatures in June for Duplex 2 were up to 5°C hotter than
Duplex 1. This was most likely due to general differences in construction of both types of attics
and thermal behavior of the RB combined with the enclosed air gaps, installed under the roof
deck in the test house 2A.
3.3 Attic Air Temperature Comparisons Typically in residential attic applications, RBs and IRCCs work by reducing the amount of
thermal radiation that is transferred across the air space between the roof deck and the top of the
attic floor insulation. Since the amount of thermal radiation increases as the temperature of the
emitting surface increases, it is critical to keep it as low as possible. This surface can be directly
roof deck, foil-laminated roof deck boards, roof deck boards coated with IRCC, or RB material
facing the interior of the attic.
An application of multi-foil RB in the case of Unit 2A showed that it was possible to apply
radiation control technology, increase the roof deck temperature and at the same time reduce the
air temperature in the attic. As depicted in Figure 4 (Right), this technology generated a slightly
higher roof surface temperature compared to other test attics. However, when attic air
temperatures were compared, the recorded attic temperature for Unit 2A was significantly lower
comparing to other attics; see Figure 5(Left) and Figure 5(Right).
Figure 5: Average daily attic air temperatures recorded in four test attics (center location) during the June/July measure period (Left); Maximum daily attic air temperatures recorded in four test attics (center location) during the June/July measure period (Right)
In this study, due to the structural differences between the test attics and due to the fact that the
attic floor insulations were not uniform in all the units, measurements of the attic air
temperatures in the center-of-the-attic location were used as one of indirect indicators of the attic
system thermal performance. The second potential performance indicator considered in this
project was heat flux measured on the ceiling level. However, as shown in Figure 4(Left), the
internal air temperatures were not identical in all test units. That is why direct comparisons of
measured heat fluxes cannot be used as a full indicator of the attic system thermal performance.
Figure 5 shows that the attic of Duplex 1 was typically hotter than Duplex 2 in June 2012. This is

consistent with the observation that the roof of Duplex 1 was cooler than Duplex 2. It is good to
remember that there were some differences between both duplexes, such as the roof deck
construction—rafters versus trusses—and the levels of ventilation in the attics, determined by
measuring the area of the soffit vents. An average baseline attic temperature for the considered
time period was 35.7°C (Figure 5 Left), while for the coolest attic 2A was only 33.4°C. This was
a 2.3°C difference.
Figure 5 (Right) depicts the maximum daily attic air temperatures for June/July 2012. These
temperatures reflect differences in attic-generated peak-hour cooling loads during the day. It is
clear that different types of reflective insulation work effectively in southern U.S. climates. In
June, the base case attic, 1A, had consistently higher maximum daily attic air temperatures. Units
1B and 2B were quite similar, but were generally a lower maximum temperature than the base
case (over 3°C on average). The fact that 1B and 2B appeared similar was a different pattern than
previously observed. However, examining the hotter time period in July may confirm that 2B
generally had lower attic temperatures than 1B. Finally, 2A, the house with the foil technology
installed, had the lowest maximum temperatures across this period by approximately 7°C, while
compared to the baseline attic, 1A.
As mentioned earlier, field measurements of the attic air temperatures were used in this study, as
one of the indirect indicators of the attic system thermal performance. It can be said that the attic
air temperature represented thermal condition equilibrium incorporating radiation, ventilation,
and convection effects together. This temperature also reflected structural differences between all
test attics.
The chart in Figure 6 (Left) indicates that the foil technology was thermally more effective than
both IRCC technologies. An average temperature difference between this attic and the base case
was about 3.4°C, while for the IRCC technologies it was about 2.4°C. In addition, the IRCC in
2B was usually more different from the base case than the 1B case.
Figure 6: Differences in average daily attic air temperatures recorded between three test attics using radiation control technologies and a baseline attic, during the June/July measure period (Left); Differences in maximum daily attic air temperatures recorded between three test attics using radiation control technologies and a baseline attic, during the June/July measure period (Right)
It is important to note that 3.4°C reduction of the average attic air temperature caused by the

multi-foil RB can be an equivalent to more than 34% reduction of the attic-generated cooling
loads—assuming approximate steady-state heat transfer, average attic temperature of 35°C and
internal air temperature of 25°C. It has been reported that for U.S. residential houses, roofs and
attics generate an average of 12% cooling energy contributions (Huang et al., 1996). In that light,
potential whole building cooling energy savings may reach about 4%, depending on other
building parameters and HVAC system efficiency.
Similarly, a 2.4°C reduction of the average attic air temperature due to the IRCC technology can
be an equivalent to more than 24% reduction of the attic-generated cooling loads. Potential
whole building cooling energy savings for this technology may be close to 3%.
Figure 6 (Right) shows clear superiority of the multi-foil radiation control technology used in the
attic 2A. For this attic, maximum air temperatures were, on average, about 8.5°C lower than the
base case attic. It can be also observed that IRCC systems reduced maximum attic air
temperature by over 6°C.
Following earlier analyses performed for the average attic temperature, a 8.5°C reduction of the
maximum attic air temperature caused by the multi-foil RB can be an equivalent to over 30%
reduction of the attic-generated peak-hour cooling loads, considering maximum attic temperature
of 53°C (as in Figure 5-Right) and internal air temperature of 25°C. Attic air temperature
recorded in Unit 2A was the most different from the base case. Given the hotter temperatures in
June, Unit 2B was typically the next most different attic temperature, as seen in Figure 6-Right.
Figure 7: Maximum daily temperatures on the top surface of the attic insulation recorded in three test attics using radiation control technologies and a conventional base case, during the June/July measure period (Left); Heat fluxes recorded in test attics using radiation control technologies and a conventional base case, during the June/July measure period. Positive heat flow direction is from conditioned space to the attic (Right).
In ideal conditions (when measurement perimeters were highly controlled and the insulation
layer is uniform), temperature measurements on the top of the attic insulation could be a very
good direct indicator of the technology thermal performance. However, in this experiment, due
to the differences in construction, thicknesses of insulation and types of insulation in the
individual attics, direct thermal performance comparisons were not possible using top insulation
surface temperatures.

3.4 Attic Insulation Surface Temperature Comparisons In the hot month of June, the insulation surface temperatures were still quite similar. Unit 2A
appears to have less extreme temperatures, as shown in Figure 7 (Left). Maximum day
temperatures on top of the attic insulation in Unit 2A were about 4°C to 5°C lower comparing to
the conventional base case attic. As mentioned earlier, these temperatures reflected the attic-
generated peak hour cooling loads.
3.5 Ceiling Heat Flux Comparison Because of different attic configurations and internal air temperatures, the heat fluxes measured
on the ceiling level were not good indicators of performance compared to attic temperatures.
There were four factors that can affect this measurement: ventilation rates, R-values, internal
temperatures, and air leakage through the attic ceiling. In June, the measured heat flux in the
house with IRCC technology was significantly higher than in the house with the foil technology,
as seen in Figure 7 (Right). The largest differences are between units 2A and 1B. Heat fluxes
measured in unit 2A were between 40% and 50% lower than heat fluxes measured for unit 1B.
4. Energy Modeling
4.1 Model Description The two duplexes in Austin were modeled using EnergyPlus to predict potential energy savings
as a result of applying RB and IRCCs technologies. The houses were each modeled as three
zones representing the living space, attic, and garage (a total of six zones in each duplex).
Outside boundary conditions came from a weather file for Austin’s climate. Wall and ceiling
constructions were modeled in THERM to determine the effective thermal conductivity of the
assembly layer containing the wood studs and insulation. As stated earlier, Duplex 1 was built
between 1987–1997 and Duplex 2 was built prior to 1987. Compared to parameters listed in
ASHRAE Handbook of Fundamentals Chapter 15, operable single-glazed windows with non-
thermally broken aluminum frames, such as those installed in the duplexes, were confirmed.
Solar heat gain coefficients were set to 0.79 in the model and U-factors were 0.92 Btu/h·ft2·°F
(5.2 W/m2·K). Window construction was also kept consistent throughout the models.
Roofs were modeled as shingles and plywood with addition of the appropriate paint or foil layer
where applicable. A no-mass material was specified in EnergyPlus to represent the IRCC and RB
technologies. The absorptance of the material was lowered to decrease the amount of radiant
transfer to other surfaces in the attic zone. Because of the non-uniform levels of insulation on the
attic floor, an average value was calculated for use in the model. It was determined that both
duplexes had approximate R-20, despite having different compositions—7.5 inches of loose
cellulose in Duplex 1 while 3.5 inches of batt insulation plus an average of 3.5 inches of loose
cellulose in Duplex 2, both with framing factors of 25%. Attic ventilation rates were estimated
based on measurements of the area of attic vents in each of the test houses (Atherton, 2011).
Cooling setpoints were kept for modeling purposes at 76.1°F (24°C) for all four units. The
heating setpoint was 68°F (20°C). Considering stratification of the temperatures, these
temperatures were very close to that which was measured in 2012 in the test houses. However, it
is important to notice that due to a change of some tenants followed by a possible change of

space conditioning preferences, measured temperatures in two units were about 1°C higher from
the other two. Two HVAC systems were added to each building, one per conditioned zone in
each duplex. The Unitary Template in EnergyPlus was used to model the forced air system with
a 2.5 rated coefficient of performance (COP) single-speed direct expansion cooling coil and
natural gas heating coil with an efficiency of 70%. Considering the losses due to duct leakage
and the condenser unit, the overall COP of the system was reduced in the model from the
manufacturer’s COP. The natural gas water heater had a thermal efficiency of 80%. The models
were calibrated against gas consumption data obtained from utility bills during winter. The
maximum hot water flow was obtained through calibration of gas consumption with the amount
reported by Texas Gas Service calculator for a typical residential single family house in Austin.
4.2 Calibration of Whole Building Energy Model In order to predict energy consumption of the duplexes with reliable accuracy, the EnergyPlus
models were calibrated against historical utility bills obtained for tested houses. For this purpose,
the computer-generated energy consumptions were compared with historical energy bills for
both heating and cooling seasons.
It is important to mention that, due to complexity of the test attics and the fact that buildings
were occupied during the testing, it was impossible to validate the thermal simulation algorithm
used for attics by EnergyPlus. Therefore, EnergyPlus simulation results (cooling energy savings)
presented in this study need to be confirmed in the future either by more accurate computer
models (like ATTICSIM–ASTM C1340) or by calorimetric field measurements with use of the
test huts. Additionally, due to limited amount of available historical bill data, the comparison
was done only for duplex 1B.
During the heating season, the main sources of energy consumption were a furnace for space
heating and a water heater for domestic hot water. Based on Texas Gas Service’s home energy
calculator, for a typical single family house with similar characteristics to the test houses, close
to 50% of total gas consumption was space heating, approximately 35% water heating and 15%
was cooking. Therefore, to capture these main sources of gas consumption, a water heater,
furnace and gas equipment were considered in the model. Figure 8 compares the simulated gas
consumption with historical energy bill and Texas Gas Service for duplex 1B. There was a
relatively good agreement between EnergyPlus-generated gas consumption and historical gas
service data. Note that EnergyPlus used the actual weather file which is the observed weather
data for the duration of the modeling. Figure 8 compare gas consumption of duplex 1B with
historical gas bill before and after applying the radiation technology. The data confirms proper
selection of the building enclosure and HVAC system parameters for whole building energy
consumption simulations.
Using the actual weather data file enabled comparisons to energy consumption results generated
with a use of the Texas Gas Service’s home energy calculator8. During the cooling season, the
main sources of electricity consumption were AC unit for space cooling, lighting and appliances.
Again, referring to Texas Gas Service’s home energy calculator, for a typical single family
8 http://www.texasgasservice.com/SaveEnergyAndMoney/HomeEnergyCalculator.aspx.

house, close to 80% of total electricity consumption was for space cooling, 8.5% for lighting and
close to 11.5% for appliances and others.
Figure 8: Comparison of monthly historical gas bill, simulated consumption, and the gas consumption by Texas Gas Service calculator. Gas consumptions are for duplex 1B before (Left) and after (Right) installing radiation control technology. The EnergyPlus simulation is based on actual weather file data from 2009 (before retrofit) and 2011 (after retrofit).
Figure 9: Comparison of monthly historical electricity bill, simulated consumption, and the electricity consumption by Texas Gas Service calculator. Electricity consumption is for Duplex 1B before (Left) and after (Right) installing radiation control technology. The EnergyPlus simulation is based on actual weather data file from 2009 (before retrofit) and 2011 (after retrofit). High electricity consumption during heating season is due to unexpected usage of the electric heater by the tenants. A cooling system with COP=2.5 was considered throughout this study; however, as a parametric study, cooling system with COP=2 was modeled and compared in this graph.
As Figure 9 shows, EnergyPlus predicted well the electricity consumption during the cooling
season compared with historical electricity bill and Texas Gas Service’s calculator. However,
during the heating season, there were discrepancies due to the fact that the test houses were using
auxiliary electricity for heating. Overall, considering the fact that the historical electricity bill
was not prorated and both the AC unit set point and consumer behavior were approximated, the
prediction of energy consumption particularly during the cooling season seemed in good
agreement with historical bills and Texas Gas Service’s calculator.
4.3 Prediction of the Cooling Energy Consumption As described, the models’ calibration was based on comparison between simulated energy use
and the electricity and gas consumption data and also with historical data from the Texas Gas
Service calculator. The calibrated models were simulated with a TMY3 weather file for Austin
Mueller Municipal Airport to predict the electricity consumed by AC units during cooling
season.

4.4 Modeling Results In the summer, a higher infiltration rate of the attic reduced the attic temperature by exchanging
the outdoor air with the attic air that was heated by the roof. The lower attic temperature reduced
the heat flux through the ceiling of the living space. The wall construction and infiltration rate of
the living space also affected the cooling load placed on the HVAC system. Fine tuning the
IRCC and RB was required to model the emissivity within the attic space accurately and the
thermal conductivity through the layer, and in the case of the RB, the air gap between the roof
and the RB.
The results from EnergyPlus using a typical meteorological year (TMY3) indicate that the
energy consumption is well below the range approximated based on the measurements
performed during the experiment. In addition, EnergyPlus-generated cooling energy savings are
at least five times lower than the earlier findings from different U.S. research studies summarized
(Medina, 2012).
Cooling Energy Consumption / Test Unit
Without Radiation Control Technology
With Radiation Control Technology
Annual Cooling Energy Savings
1A (Baseline) 4333 kWh N/A N/A 1B (IRCC) 4326 kWh 4308 kWh 0.43% 2A (RB) 4703 kWh 4703 kWh 1.27% 2B (IRCC) 4922 kWh 4922 kWh 0.83%
Table 1. Predicted Energy cooling Consumption and Associated Savings from Radiation Control Technologies
The modeling results in Table 1 show that cooling energy is saved with the use of radiation
control technologies. The table lists and compares the modeled annual cooling energy
consumption of each house before and after implementing the radiation control technology. The
“Annual Cooling Energy Savings” for each house in Table 1 is calculated by comparing cooling
energy consumption in “Without Radiation Control Technology” and “With Radiation Control
Technology” columns. The RB shows the highest savings from its lower emissivity and the air
gap created between the roof and the space between the two layers of the foil. Comparing the
two duplexes with IRCC installed, the results show that the attic geometry and the amount of
roof coated with the low-e material make a difference in the performance.
Parametric studies of the convection coefficients, air exchange rate, set point temperature and
changes of the heat transfer rate through exterior walls and windows were performed in the
process of calibrating the model. Convection coefficients were specified from the ASHRAE
Handbook of Fundamentals. The values for horizontal down flow were used and a slight
improvement was expected from the values EnergyPlus calculated. This was expected since all
roof surfaces were at angles above horizontal. The air exchange rate made little difference in the
output of the model. This is likely because the exchange of air has a greater effect on the zone air
temperature than the surfaces temperatures, which govern radiant heat flow. Heat flow through
the exterior walls and windows had the greatest effect on the performance of the RB since heat
flow through the ceiling into the conditioned zone was proportionally less than the other surfaces
even though the heat flux through the ceiling remained the same.

It should be noted that the above savings have been estimated based on EnergyPlus modeling
parameters close to existing test house conditions. Depending on HVAC configuration, air
leakage rate, and building envelope parameters, the savings can increase close to twice the values
reported in Table 1. However, they will still be significantly lower than the results of earlier
experimental studies (Medina 2012). This is one of the most surprising findings from this study.
Recorded temperature and energy consumption data showed that one test unit was notably
different during the winter 2011, which was evidence of an extensive use of an electric heater.
The use of a supplemental heater was unexpected, and an electric heater was not instrumented.
An additional challenge in modeling was caused by the fact that the tenant changed in one of the
test units just before the start of measurements. Also, the inability to control setpoint differences
between the units made direct comparisons difficult (since test units were occupied by tenants
with various space conditioning preferences).
One of the conclusions from this study is the fact that it is extremely difficult to perform a
detailed performance analysis of a single building enclosure system like RB using field test data
from occupied vintage housing units. It is still unclear how well energy consumption predictions
of the building systems containing RBs can be simulated using simplified Energy Plus roof/attic
algorithm. The team recommends that in the future, a calorimetric type of a field experiment
(with precisely measured attic air leakage rates, level of attic insulation, and with simple attic
structural components) be performed in order to further validate EnergyPlus predictions in cases
of RB applications. This experiment will most likely require test huts or similar small and well-
instrumented test structures.
5 Conclusion The major goal of this project was to evaluate the energy effects of RBs and IRCCs in field
conditions. Major focus was paid on thermal and energy performance of the attics. During the
cooling season 2012, thermal performance measurements were performed on four housing units
in two residential duplexes. Three test attics were modified using RBs and IRCCs and tested,
while the fourth attic stayed unmodified and was used as a base case for comparisons.
Thermal performance data was collected for each attic. Field experiments took place in Austin,
Texas. All test houses were occupied during the testing by residents. The original plan was to
keep internal load schedules in the test units as close as possible; however, each of these tenants
had different occupation habits and thermal comfort preferences. Also, individual schedules for
operating the AC were different. In addition, the test houses had attics with varying structural
components, thicknesses and types of attic floor insulation, and levels of attic ventilation. All of
the above factors made direct comparison of the whole building energy consumption impossible.
Measured test data confirmed earlier results from other research organizations. An average 3.4°C
reduction of the average attic air temperature caused by the multi-foil RB was recorded during
mid-summer 2012, and can be equivalent to over 34% reduction of the attic-generated cooling
loads—assuming approximate steady-state heat transfer, average attic temperature of 35°C and
internal air temperature of 25°C. This is consistent with a range of the cooling load reductions
reported by Medina (2012). It has been also reported that for U.S. residential houses, roofs and
attics generate an average 12% cooling energy contributions (Huang, et al., 1996). In that light,
potential whole building cooling energy savings may reach about 4%, depending on other
building parameters and HVAC system efficiency.

Similarly, a 2.4°C reduction of the average attic air temperature caused by the IRCC technology
can be an equivalent to over 24% reduction of the attic-generated cooling loads, and potential
whole building cooling energy savings for this technology may be close to 3%. Based on the
recorded data, energy performance of two IRCC systems seems to be very similar considering
the small differences in construction of both test attics in Duplexes 1 and 2.
An EnergyPlus computer model calibrated against both gas and electricity historical bill data for
the periods of pre-retrofit and post-retrofit was used for prediction of potential cooling energy
savings. The results from EnergyPlus were well below the range of cooling energy savings
approximated based on the measurements performed during this experiment. In addition,
EnergyPlus-generated cooling energy savings were at least four to five times lower than results
available from the earlier studies (Medina, 2012). It is recommends more work on validation of
whole building computer models using attic algorithms with RB.
Reference ASHRAE. 2007. ANSI/ASHRAE 90.2. Energy Efficient Design of Low-Rise Residential
Buildings. Atlanta: American Society of Heating, Refrigerating and Air Conditioning Engineers,
Inc.;
ASTM Standard C1313. 2010. Standard Specification for Sheet Radiant Barriers for Building
Construction Applications. ASTM International, West Conshohocken, PA, DOI:
10.1520/C1313_C1313M-10;
ASTM Standard C1340. 2010. Standard Practice for Estimation of Heat Gain or Loss Through
Ceilings Under Attics Containing Radiant Barriers by Use of a Computer Program. ASTM
International, West Conshohocken, PA, DOI: 10.1520/C1340_C1340M-10;
ASTM Standard C1321. 2009. Standard Practice for Installation and Use of Interior Radiation
Control Coating Systems (IRCCS) in Building Construction. ASTM International, West
Conshohocken, PA, DOI: 10.1520/C1321-09;
Atherton, S.A. 2011. Residential Attic Ventilation in A Hot And Humid Climate: Effects Of
Increased Ventilation On Thermal Performance And Moisture Control. Master Thesis,
University of Tennessee, Knoxville;
Handcock, E. Norton, P. and Hendron, B. 2002. Building America System Performance Test
Practices: Part 2, Air Exchange Measurements. NREL Technical Report NREL/TP-550-30270;
Accessed at: http://www.nrel.gov/docs/fy02osti/30270.pdf.
Huang, J. Hanford J. and Yang F. 1996. Residential Heating and Cooling Loads Component
Analysis. LBNL Technical Report LBNL-44636; Accessed at:
http://simulationresearch.lbl.gov/dirpubs/44636.pdf.
Medina, M. 2012. A Comprehensive Review of Radiant Barrier Research Including Laboratory
and Field Experiments. ASHRAE Transactions. Vol. 118 Issue 1, p400;
Parker, D. S. 2005. Literature Review of the Impact and Need for Attic Ventilation in Florida
Homes. Florida Solar Energy Center Report FSEC-CR-1496-05; Accessed at:
http://www.fsec.ucf.edu/en/publications/pdf/FSEC-CR-1496-05.pdf
Parker, D. S. 2003. Research highlights from a large scale residential monitoring study in a hot
climate . Energy and Buildings. 35 (9), pp. 863-87;
Parker, D. and Sherwin, J. 1998. Comparative Summer Attic Thermal Performance of Six Roof
Constructions. Proceedings of the 1998 ASHRAE Annual Meeting. Toronto, Canada;
RIMA International. 2002. Understanding and Using Reflective Insulation, Radiant Barriers and
Radiation Control Coating . RIMA International, Second Edition; Accessed at:
http://www.rimainternational.org/pdf/handbook.pdf.
RS Means. 2011. Building Construction Cost Data. Norwell, USA;
Stovall, T. Yarbrough D. W. Shrestha S. Pearson T. and Arimilli R. V. 2010. Analysis in Support
of the Radiant Barrier Fact Sheet 2010 Update. Proceedings of Thermal Performance of Exterior
Envelopes of Whole Buildings XI , Florida. Accessed at:
http://web.ornl.gov/sci/buildings/2012/B11%20papers/141_Stovall.pdf
Texas Gas Service, Home Energy Calculator; Available at:
http://www.texasgasservice.com/en/SaveEnergyAndMoney/HomeEnergyCalculator.aspx
Wallace, L.A. Emmerich, S.J. and Howard-Reed, C. 2002. Continuous measurement of air
change rates in an occupied house for 1 year: the effect of temperature, wind, fan and windows.
Journal of Exposure Analysis and Environmental Epidemiology (12) pp. 296- 306.

National Institute of Building Sciences Provider #G168
BEST4 Conference Nibsbest4 • April 13-15, 2015
Credit(s) earned on completion of this course will be reported to AIA CES for AIA members. Certificates of Completion for both AIA members and non-AIA members are available upon request. This course is registered with AIA CES for continuing professional education. As such, it does not include content that may be deemed or construed to be an approval or endorsement by the AIA of any material of construction or any method or manner of handling, using, distributing, or dealing in any material or product. ___________________________________________ Questions related to specific materials, methods, and services will be addressed at the conclusion of this presentation.

Participants will : 1. Learn how to link the performance of individual building enclosure components in a holistic framework to achieve high-performance buildings. 2. Explore, through built case studies, how building envelope design determines overall energy conservation and sustainability capabilities 3. Learn innovative practices for avoiding heat loss as well as moisture and air infiltration in enclosure design for healthy new and existing buildings. 4. Understand the role of building enclosure commission- ing in the design, construction, and operation and maintenance of commercial facilities.
Learning Objectives

Field Thermal Performance of EIFS Using Vacuum Insulation Panels
Ali Fallahi, Ph.D. Fraunhofer CSE, Boston, MA
Jan Kosny, Ph.D. Fraunhofer CSE, Boston, MA
Nitin Shukla, Ph.D. Fraunhofer CSE, Boston, MA
Tony Fontanini, Ph.D. Candidate Fraunhofer CSE, Boston, MA
Lawrence D. Carbary, F.ASTM Dow Corning Corporation, Midland, MI
Roland Serino, P.E. Dryvit Systems Inc., West Warwick, RI

Sometimes, it is impractical or costly to install thick insulation due to space loss or additional modifications and detailing
Wall Deep Energy Retrofit
Requires roof extension/detailing
Requires window relocation/detailing
1

Thinner solutions for a given target thermal resistance VIP offers one of the highest thermal resistances of any
insulation technology
Benefits of Vacuum Insulation Panels (VIPs)
VIPs are 4 to 8 times thinner than convention insulations for the same target R-vale
2
IEA/ECBCS Annex39, VIP Subtask A

Vacuum Insulation Panel (VIP) consists of a nanoporous core that is evacuated and enclosed in a container that is highly impervious to air and water vapor transmission
Thermal conductivity as low as 0.004 W/m-K
multi-layer envelope film
pressed silica core with opacifier
Core-bag
http://www.ecbcs.org/docs/Annex_39_Report_Subtask-A.pdf
Vacuum Insulation Panel (VIP) Technology
3

RCGST λλλλλ +++=
Heat Transport in Conventional Insulations
IEA/ECBCS Annex39, VIP Subtask A
λG, λC
λR λS
Conduction Convection Radiation
4
Macroporous media used at atmospheric pressure
Mineral fiber and polymeric foams
Porous structure implies only limited number of channel for heat conduction
Gas conduction dominates the thermal conductivity

Heat Transport in VIPs
Lower gas pressure
Reduce pore size
MFP for air molecules is ~70 nm VIP core is made of a nanoporous material Typical pore size is ~10-100 nm Core is surrounded by a film and evacuated to lower
pressures
5

Vacuum Insulation Panels – Thermal Bridging
IEA/ECBCS Annex39, VIP Subtask A
VIP
VIP
VIP
VIP
VIP Thermal Bridging due to Protective Foam- 3D Thermal Model showing heat loss through foam layer
Foil
VIP Thermal Bridging due to Metallic Foil
6

Project Objective: To assess the field performance of the VIP-based EIFS technology in building retrofit applications.
Subtasks: • Detailed instrumentation for field testing to
measure temperature and moisture gradient in the walls
• Performing small scale lab testing of material samples as an input for numerical modeling and hygrothermal analysis
• Evaluate and analyze the collected field test data
• Numerical analysis and energy simulations using EnergyPlus and WUFI to validate and extend performance evaluation
Before Retrofit
After Retrofit
Project Introduction
7

VIP
EPS
Wall Retrofit -Vacuum Insulation Panels
Two major U.S. building envelope manufacturers carried out the retrofit stage of this study, including VIP manufacturing, foam encapsulating, designing, and installation.
8

In addition, a major U.S. window manufacturer donated its high efficient R-5 windows to be installed as a part of the retrofit stage.
Wall Retrofit – High Performance Windows
Existing poor performing windows
High performing R-5 windows after retrofit
9

1
During Wall Retrofit
2
3 4 13 10

Before Retrofit After Retrofit
Wall Retrofit
11

Wall Sensor Layout
12

Inside View
West Elevation Sensors
Outside View
Wall Sensor Layout
13

Inside View
Field Test Collected Data
14

TIME Without Windows Sealed-off
With Windows Sealed-off
Difference
Pre-Retrofit 11.7 ACH @ 50 Pa 10.90 ACH @ 50 Pa 6%
Post- Retrofit 1 8.15 ACH @ 50 Pa 8.13 ACH @ 50 Pa 0.2% 30% Improved
Blower Door Test
15

Thermography Results
Before
After
16

Energy Model
Gas Consumption Calibration
Base-Case EnergyPlus model developed using actual weather conditions at the site of test building in Brunswick, ME
Base-Case model calibrated against historical utility bills both from pre-retrofit and post-retrofit stages. EnergyPlus Model of Test Building
17

Energy Model Configurations
Modeled EnergyPlus Configurations
Case A -Existing walls, R-3.7 -Existing windows, R-1 -Pre-retrofit Infiltration: 11.7 ACH
Case B -Existing walls, R-3.7 -High Efficient R-5 windows -Pre-retrofit Infiltration: 11.7 ACH
Case C -VIP walls, R-48.5 -Existing windows, R-1 -Pre-retrofit Infiltration: 8.1 ACH
Case D -VIP walls, R-48.5 -High Efficient R-5 windows -Pre-retrofit Infiltration: 8.1 ACH
Case E -VIP walls, R-48.5 -High Efficient R-5 windows -Pre-retrofit Infiltration: 3.5 ACH
18

Energy Model Results
0%
20%
40%
60%
80%
Case B Case C Case D Case E
Savi
ngs (
%)
Annual Gas Consumption Savings
Monthly Gas Consumption
19

Hygrothermal Model
Installed Moisture Pins
Modeled Wall Section in WUFI
20

Hygrothermal Model
MC% of West Wall and North Wall below 20% Safety Threshold for Wood Rotting
Typical Brunswick Climate
21

Thermographic images taken before and after the renovation clearly show improvement in heat losses after renovation with VIPs.
Blower door tests performed before and after the renovation show a 30% air tightness improvement after renovation with VIPs.
Based on WUFI modeling results and the measurements, the risk of moisture accumulation in the VIP-based EIFS of the retrofitted wall in the Brunswick building is low and remain below 12% and don’t reach the critical threshold for wood deteriorations.
Based on developed energy model of the Brunswick building, annual gas consumption savings of the building retrofitted with high efficient windows is 16% while in combination with other efficiency measures such as VIP-base EIFS and improved airtight building the savings of 48% and 70% are achievable.
Conclusion
25

Any Questions?