field survey of business re-openings -...
TRANSCRIPT

Street Survey of Business Reopenings in Post-Katrina New Orleans Richard Campanella Geographer and Associate Director, Center for Bioenvironmental Research, Tulane University [email protected] January 2007 Executive Summary Sixteen miles of three major commercial arteries in New Orleans were surveyed weekly by bicycle for the 15 months after Hurricane Katrina, to understand how businesses respond to catastrophe. Among the findings: • Three months after Katrina marked the point at which half the surveyed businesses had reopened. By the
six-month milestone, as spring/summer 2006 approached, reopening rates stabilized around 70%. • Almost all businesses reopened within four months on prosperous, unflooded Magazine Street. Only about
one-third of businesses initially reopened on partially flooded, mixed-income Carrollton and lightly flooded, low-income St. Claude, but these rates increased to nearly half by autumn 2006.
• Despite the post-Katrina city’s infrastructure problems and lower population, 56 new businesses opened after the storm. They outnumbered by a 3-to-1 ratio those pre-Katrina businesses which reopened but then permanently closed. One-third of new businesses were on flood-damaged Carrollton and St. Claude, reflecting their steady return. Most new businesses (92%) were locally owned independents.
• 75% of locally owned independent businesses had re-opened, compared to 66% of regional chains and 59% of national chains. Larger proportions of locally owned independent businesses opened early in autumn 2005, whereas chains were slower to reopen. It was not until a year after Katrina that chains opened at a notably brisker pace than local independents.
• Business offering goods and services critical to life in a post-catastrophe city did not reopen at faster rates than operations offering non-essential or luxury goods and services. By late 2006, 16% of businesses catering to “wants” remained closed, while 32% of those catering to “needs” remained closed. Lack of basic goods and services in harder-hit areas impedes their restoration.
• Small and medium-sized businesses serving a middle- to high-end clientele reopened in the largest numbers, while small and medium-sized businesses serving people at the lower end of economic spectrum remained closed in the largest numbers.
• As long as the surrounding neighborhood was not seriously damaged, most businesses reopened in both poorer and wealthier areas. But in flood-damaged areas, poor-neighborhood businesses struggled more to reopen than those in wealthier neighborhoods. For heavily flooded businesses in general, reopening rates increased from 22% in spring 2006 to 37% in autumn 2006.
Introduction With funding from the National Science Foundation’s Small Grants for Exploratory Research program, two geographers and an economist based at Louisiana State University and Tulane University are assessing how businesses make decisions in the wake of a catastrophe like Hurricane Katrina. LSU professors Dr. Nina Lam and Dr. Kelley Pace conducted telephone surveys of business owners regarding their outlook. Tulane geographer and author Richard Campanella conducted weekly street surveys to track and analyze patterns businesses openings and closures. This report presents findings from the weekly street survey from October 9, 2005 to November 21, 2006. Study Area Three major New Orleans commercial corridors were selected: St. Claude Avenue, from Poland Avenue to Faubourg Tremé; the entire length of Magazine Street, and all of both South and North Carrollton avenues. These three corridors transect a wide range of socio-economic, historical, and topographic conditions in the city. St. Claude Avenue, which experiences light flooding after Katrina, traverses a struggling, working-class downtown neighborhood; Magazine Street serves middle- to upper-class uptown neighborhoods and suffered zero flooding; Carrollton Avenue traverses both middle-class and working-class neighborhoods and suffered extreme flooding in some areas, some flooding in most areas, and none in others. The Lower Ninth Ward portion of St. Claude could not be included because it was closed at the time this study commenced. Methodology All 16 miles of the three corridors were surveyed by bicycle weekly starting on October 9, 2005, six weeks after Hurricane Katrina and about two weeks after unflooded neighborhoods began to repopulate. Businesses of all types (retail, wholesale, services, etc.) that were visible from the street were recorded by (1) address, (2) name, (3) description and category (food retail, restaurant, spa-salon, florist-nursery, etc.), (4) ownership (locally owned independent, regional chain, or national chain); (5) general economic status (“functional,” mid-range, or “high-end”); and (6) size ( “1” = sole proprietorship with five or fewer employees; “2”

(1) Location of three study streets in New Orleans; (2) reopened and still-closed businesses on working-class St. Claude Avenue; (3) mostly reopened local businesses on Magazine Street; (4-5) many businesses vociferously proclaimed their open doors in the months after Katrina, often with messages of resilience and defiance; (6-7) restoration of heavily damaged antiques store, photographed immediately after, and one year after, Katrina; (8) Starbucks chain coffeehouse at left remains closed 15 months after Katrina, while the locally owned coffeehouse at right reopened promptly. All photos and map by Richard Campanella, 2005-2006.
2
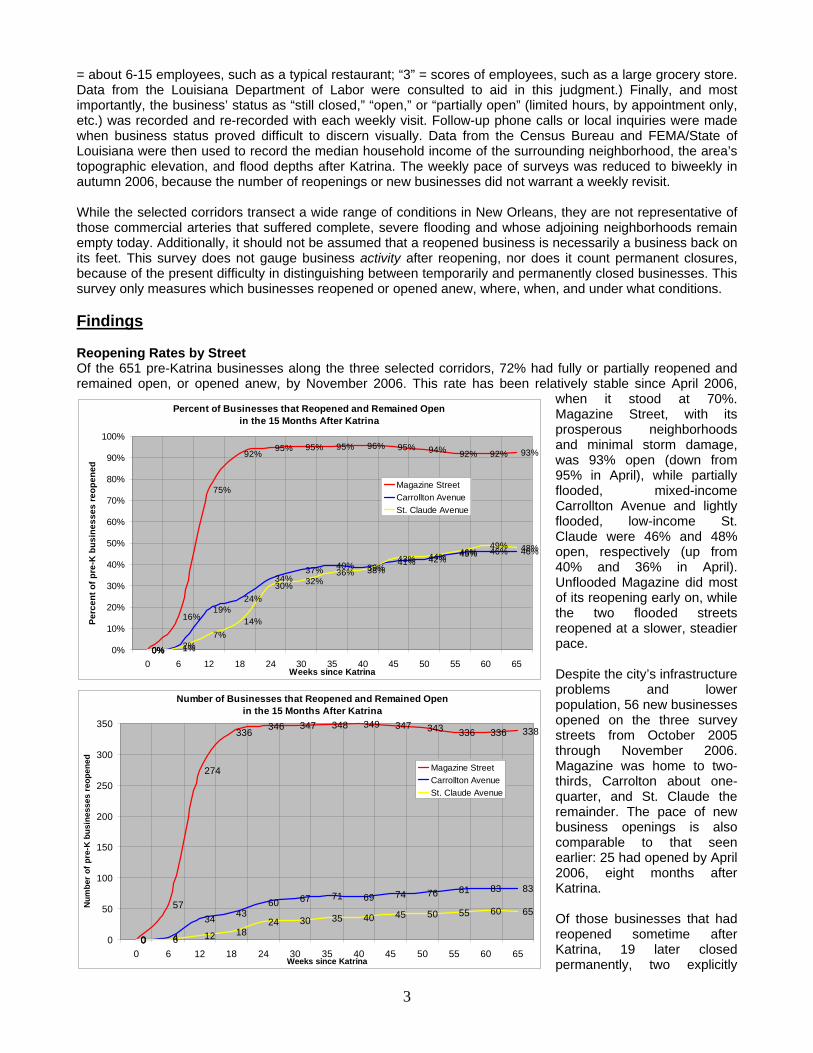
= about 6-15 employees, such as a typical restaurant; “3” = scores of employees, such as a large grocery store. Data from the Louisiana Department of Labor were consulted to aid in this judgment.) Finally, and most importantly, the business’ status as “still closed,” “open,” or “partially open” (limited hours, by appointment only, etc.) was recorded and re-recorded with each weekly visit. Follow-up phone calls or local inquiries were made when business status proved difficult to discern visually. Data from the Census Bureau and FEMA/State of Louisiana were then used to record the median household income of the surrounding neighborhood, the area’s topographic elevation, and flood depths after Katrina. The weekly pace of surveys was reduced to biweekly in autumn 2006, because the number of reopenings or new businesses did not warrant a weekly revisit. While the selected corridors transect a wide range of conditions in New Orleans, they are not representative of those commercial arteries that suffered complete, severe flooding and whose adjoining neighborhoods remain empty today. Additionally, it should not be assumed that a reopened business is necessarily a business back on its feet. This survey does not gauge business activity after reopening, nor does it count permanent closures, because of the present difficulty in distinguishing between temporarily and permanently closed businesses. This survey only measures which businesses reopened or opened anew, where, when, and under what conditions. Findings Reopening Rates by Street Of the 651 pre-Katrina businesses along the three selected corridors, 72% had fully or partially reopened and remained open, or opened anew, by November 2006. This rate has been relatively stable since April 2006,
when it stood at 70%. Magazine Street, with its prosperous neighborhoods and minimal storm damage, was 93% open (down from 95% in April), while partially flooded, mixed-income Carrollton Avenue and lightly flooded, low-income St. Claude were 46% and 48% open, respectively (up from 40% and 36% in April). Unflooded Magazine did most of its reopening early on, while the two flooded streets reopened at a slower, steadier pace.
Percent of Businesses that Reopened and Remained Open in the 15 Months After Katrina
0%
16%
75%
92%95% 95% 95% 96% 95% 94% 92% 92% 93%
0% 2%
19%24%
34%37% 40% 39%
41% 42% 45% 46% 46%
0% 1%7%
14%
30% 32%36% 38%
43% 44% 46%49% 48%
0%
10%
20%
30%
40%
50%
60%
70%
80%
90%
100%
0 6 12 18 24 30 35 40 45 50 55 60 65Weeks since Katrina
Perc
ent o
f pre
-K b
usin
esse
s re
open
ed
Magazine StreetCarrollton AvenueSt. Claude Avenue
Despite the city’s infrastructure problems and lower population, 56 new businesses opened on the three survey streets from October 2005 through November 2006. Magazine was home to two-thirds, Carrolton about one-quarter, and St. Claude the remainder. The pace of new business openings is also comparable to that seen earlier: 25 had opened by April 2006, eight months after Katrina.
Number of Businesses that Reopened and Remained Open in the 15 Months After Katrina
0
57
274
336 346 347 348 349 347 343 336 336 338
0 4
34 4360 67 71 69 74 76 81 83 83
0 6 12 1824 30 35 40 45 50 55 60 65
0
50
100
150
200
250
300
350
0 6 12 18 24 30 35 40 45 50 55 60 65Weeks since Katrina
Num
ber
of p
re-K
bus
ines
ses
reop
ened
Magazine StreetCarrollton AvenueSt. Claude Avenue
Of those businesses that had reopened sometime after Katrina, 19 later closed permanently, two explicitly
3

moved to other metro-area locations, and 6 moved from other locales to the survey streets. While many reopened businesses are struggling citywide, it is encouraging to note that new post-Katrina businesses outnumbered those businesses which tried reopening but then permanently closed by a 3-to-1 ratio (56 to 19). It is currently unknown how many of those businesses which have not yet reopened after Katrina represent permanent closures.
Businesses on Three Major Arteries in the 15 Months After Katrina
640
578
324
247
208 198 191 193 185 186 187 184 184
0
62
315
392
435 445 454 454 462 461 461 466 467
0 0 2 3 9 17 25 34 41 46 51 53 56
0
100
200
300
400
500
600
700
0 6 12 18 24 30 35 40 45 50 55 60 65
Weeks since Katrina
Num
ber o
f Bus
ines
ses
Still Closed or Newly ClosedReopenedNew Since Katrina
Magazine Street Businesses 15 Months After Katrina
Reopened pre-K
businesses83%
Businesses relocated
to, from, or elsewhere on street
1%
New post-K businesses
8%
Businesses still closed
8%
Carrollton Avenue Businesses 15 Months After Katrina
Businesses still closed
50%
New post-K businesses
5%
Businesses relocated
to, from, or elsewhere on street
1%
Reopened pre-K
businesses43%
St. Claude Avenue Businesses 15 Months After Katrina
Businesses still closed
49%
New post-K businesses
6%
Businesses relocated
to, from, or elsewhere on street
<1%
Reopened pre-K
businesses45%
Reopening Rates by Ownership Throughout all three corridors, as of November 21, 2006: • 75% of locally owned, independent businesses had reopened and remained open (394 out of 525),
compared to 66% of regional chains (14 of 21) and 59% of national chains (67 of 113). • In absolute numbers, locally owned independents reopened at a brisk pace of 40-50 per week during
October, then 15-25 per week for the rest of 2005, whereas chains reopened at roughly one-tenth those numbers (locally owned independents outnumbered chains by nearly a 5-to-1 ratio, so we should expect them to reopen in greater absolute numbers). By late 2006, both independents and chains reopened in the same range of 2-3 per month.
• In relative terms, larger proportions of locally owned independent businesses opened early in autumn 2005, whereas chains were slower to reopen. It was not until a year after Katrina that chains opened at a notably brisker pace than local independents.
4

• Among the 56 new post-Katrina businesses, 92% were locally owned independents, a proportion which has remained constant since spring.
Reopenings of Local Independent Businesses
Versus Chain Businesses, in Absolute Numbers
191
99
54
2819
11 12
2 3 1 0 0 3 1
21
9 11 9 7 5 3 2 4 2 1 4 2 10
20
40
60
80
100
120
140
160
180
200
Oct
-05
Nov
-05
Dec
-05
Jan-
06
Feb-
06
Mar
-06
Apr-
06
May
-06
Jun-
06
Jul-0
6
Aug-
06
Sep-
06
Oct
-06
Nov
-06
Months Since Katrina
Num
ber o
f Reo
peni
ngs
per
Mon
th
localchains
Reopenings of Local Independent Businesses Versus Chain Businesses, in Relative Numbers
45%
23%
13%
7%4%
3% 3%0% 1% 0% 0% 0% 1% 0%
26%
11%
14%
11%9%
6%
4%2%
5%
2%1%
5%
2%1%
0%
5%
10%
15%
20%
25%
30%
35%
40%
45%
50%
Oct
-05
Nov
-05
Dec
-05
Jan-
06
Feb-
06
Mar
-06
Apr-
06
May
-06
Jun-
06
Jul-0
6
Aug-
06
Sep-
06
Oct
-06
Nov
-06
Months Since KatrinaP
erce
nt th
at R
eope
ned
per M
onth
localchains
Reopening Rates by Economic Status and Size • Small- and medium-sized businesses serving a middle- to high-end clientele re-opened in largest numbers. • Small- and medium-sized businesses serving clients at the lower end of economic spectrum remained
closed in the largest numbers. • 84% of new post-Katrina businesses were small- to medium-sized businesses serving a middle-to upper-
class clientele. Only 13% of new businesses catered to lower-class populations, and all were small. Only two new large businesses opened on all three survey streets.
Reopening Rates by Business Category (“Wants” versus “Needs”) • Surprisingly, business reopening rates were largely unrelated to the products or services offered. Those
offering goods and services critical to life in a post-catastrophe city (hardware stores, repair shops, grocery stores, and other businesses purveying inelastically demanded goods and services) did not reopen at faster
5

6
rates than operations offering non-essential or luxury goods and services. For example, by late October 2005, two months after the storm, 51 restaurants, bars, and spas re-opened on the three corridors, primarily Magazine. In that same period, there were only two auto repair stores, hardware stores, and pharmacies.
• Throughout the first four months after the storm, business dealing in “wants” (antiques, gifts, restaurant meals, videos, spa treatments, etc.) reopened at nearly twice the pace of those dealing in “needs” (auto repair, clothing, groceries, pharmaceuticals, etc.). To an extent, this is statistically expected, because wants-catering businesses outnumbered needs-catering businesses on the three survey streets by a 1.43-to-1 ratio.
• By November 2006, 16% of wants-catering businesses remained closed, while 32% of those catering to needs remained closed. This may be explained by the fact that “wants” businesses predominated on wealthy, less-damaged Magazine Street, while “needs” businesses were more common on worse-off St. Claude and Carrollton. Lack of basic goods and services available in these harder-hit areas impedes their restoration.
Reopening Rates by Pre-Katrina Neighborhood Median Household Income and Flood Depth What roles do neighborhood economic class and flood depth play in driving business reopening rates? For the following analysis, neighborhood economic class was estimated from 2000 Census median household income data (representing incomes from 1999) at the census tract level. These data were averaged based on the tracts immediately surrounding the business in question. For the purposes of this analysis, incomes were broken into five categories:
• “Well below city average:” less than 75% of city average of $27,133 medium household income • “Below city average:” 75-92% of city average • “Average:” 92-108% of city average • “Above city average:” 108-127% of city average • “Well above city average:” greater than 127% of city average
Flood depth was measured by delineating the uppermost edge of the flood footprint on August 31, 2005, determining the corresponding average elevation contour per sub-basin, and subtracting from it the LIDAR-based elevation data at the five-meter-pixel level for the entire basin. Flood depth was categorized as:
• “No flooding:” under six inches on August 31, 2005 • “Moderate flooding:” 0.5 to 2.9 feet, average one foot • “Deep flooding:” over 3 feet, average 5.5 feet
The businesses on the three surveyed streets were then spatially intersected with these two variables.
Relationship of Neighborhood Economic Class to Business Reopenings • Neighborhood economic class was directly related to reopening rates: the poorer the area, the lower the
rate. While 53% of businesses in well-below-average medium household income areas reopened by late fall 2006, 69% of those in below-average areas reopened, and 97%, 94%, and 97% of those in average, above average, and well-above-average areas reopened.
• These findings compare with spring 2006 findings, when figures were computed somewhat differently. At that time, 42% of businesses in areas earning below 80% of the city’s average medium household income had reopened, 77% of those within 80-120% of city average had reopened, and 94% of those in areas earning over 120% of city average had reopened.
• While it is clear that poor areas struggle more in their business recovery than more prosperous areas, it is encouraging that the reopening rate in the poorest areas increased from 42% to 53%, despite the fact that the standard for categorizing the poorest areas was tightened from those earning <80% of city average income to those earning <75%.
Relationship of Flood Depth to Business Reopenings • Flood depth was, quite logically, inversely related to business reopening rates: the deeper the flood, the
lower the rate. While 96% of those businesses that did not flood at all were open by late fall 2006, 57% of those that flooded moderately, and 37% of those that flooded deeply, had reopened.
• These findings compare with spring 2006 findings, eight months after Katrina, when unflooded, moderately flooded, and heavily flooded businesses reopened at rates of 94%, 57%, and 22%, respectively.
• The increase of reopening rates for heavily flooded businesses from 22% to 37% by the end of 2006 represents optimistic news.

7 7

Reopened Businesses, by Economic Class and Flood Depth, in Absolute Numbers
2736
58
1826
39
2 2
195
4 012
3 0
129
0
20
40
60
80
100
120
140
160
180
200
deep moderate no floodingDepth of Flood
Num
ber o
f Bus
ines
ses
Reo
pene
dwell below average household income
below average household income
average household income
above average household income
well above average household income
Businesses Still Closed, by Economic Class and Flood Depth, in Absolute Numbers
63
38
6
26
1022 0 51 0 00 0 4
0
20
40
60
80
100
120
140
160
180
200
deep moderate no floodingDepth of Flood
Num
ber o
f Bus
ines
ses
Still
Clo
sed
well below average household income
below average household income
average household income
above average household income
well above average household income
Reopened Businesses, by Economic Class and Flood Depth, Relative to All Surveyed Businesses
30%
49%
91%
41%
72%
95%
50%
100%98%
80%
0%
100%100%
0%
97%
0%
10%
20%
30%
40%
50%
60%
70%
80%
90%
100%
deep moderate no floodingDepth of Flood
Perc
ent o
f Bus
ines
ses
that
R
eope
ned
well belowaveragehouseholdincomebelow averagehouseholdincome
averagehouseholdincome
above averagehouseholdincome
well aboveaveragehouseholdincome
Businesses Still Closed, by Economic Class and Flood Depth, Relative to All Surveyed Businesses
70%
51%
9%
59%
28%
5%
50%
0% 3%
20%
0% 0%0% 0% 3%
0%
10%
20%
30%
40%
50%
60%
70%
80%
90%
100%
deep moderate no floodingDepth of Flood
Perc
ent o
f Bus
ines
ses
Still
Clo
sed
well belowaveragehouseholdincome
below averagehouseholdincome
averagehouseholdincome
above averagehouseholdincome
well aboveaveragehouseholdincome
Clo
sed
Bus
ines
se
by C
lass
and
Flo
odin
gR
eope
ned
Bus
ines
se
by C
lass
and
Flo
odin
g
Absolute Numbers Relative NumbersReopened Businesses, by Economic Class
and Flood Depth, in Absolute Numbers
2736
58
1826
39
2 2
195
4 012
3 0
129
0
20
40
60
80
100
120
140
160
180
200
deep moderate no floodingDepth of Flood
Num
ber o
f Bus
ines
ses
Reo
pene
dwell below average household income
below average household income
average household income
above average household income
well above average household income
Businesses Still Closed, by Economic Class and Flood Depth, in Absolute Numbers
63
38
6
26
1022 0 51 0 00 0 4
0
20
40
60
80
100
120
140
160
180
200
deep moderate no floodingDepth of Flood
Num
ber o
f Bus
ines
ses
Still
Clo
sed
well below average household income
below average household income
average household income
above average household income
well above average household income
Reopened Businesses, by Economic Class and Flood Depth, Relative to All Surveyed Businesses
30%
49%
91%
41%
72%
95%
50%
100%98%
80%
0%
100%100%
0%
97%
0%
10%
20%
30%
40%
50%
60%
70%
80%
90%
100%
deep moderate no floodingDepth of Flood
Perc
ent o
f Bus
ines
ses
that
R
eope
ned
well belowaveragehouseholdincomebelow averagehouseholdincome
averagehouseholdincome
above averagehouseholdincome
well aboveaveragehouseholdincome
Businesses Still Closed, by Economic Class and Flood Depth, Relative to All Surveyed Businesses
70%
51%
9%
59%
28%
5%
50%
0% 3%
20%
0% 0%0% 0% 3%
0%
10%
20%
30%
40%
50%
60%
70%
80%
90%
100%
deep moderate no floodingDepth of Flood
Perc
ent o
f Bus
ines
ses
Still
Clo
sed
well belowaveragehouseholdincome
below averagehouseholdincome
averagehouseholdincome
above averagehouseholdincome
well aboveaveragehouseholdincome
Clo
sed
Bus
ines
se
by C
lass
and
Flo
odin
gR
eope
ned
Bus
ines
se
by C
lass
and
Flo
odin
g
Absolute Numbers Relative Numbers
Neighborhood Class, Flood Depth, and Reopening Rates Almost all businesses that did not flood had reopened, regardless of class—to a degree of 91-100%. (It is noted that those in the poorest areas reopened at the lower end of that range, 91%).
However, for those businesses that flooded moderately or deeply, economic class spelled a difference in reopening rates. Only 38% of flooded businesses reopened in the areas with well-below-average incomes (and 55% in below-average areas), while nearly 80% of those in areas that had incomes at or above the city average reopened.
All other variables being equal, this study indicates that, as long as the neighborhood was not seriously damaged, businesses mostly reopened, in both poorer and wealthier areas. But in flood-damaged areas, poor-neighborhood businesses struggled more to reopen than wealthier-neighborhood businesses. Conclusions Businesses, particularly the small neighborhood retailers, restaurants, and service-providers for which New Orleans is noted, are a critical component to both the local economy and post-Katrina neighborhood restoration. It is hoped that these data will help guide policy-makers, investors, and business and neighborhood advocates to allocate resources in a manner that targets those businesses with the greatest need, providing the most-needed goods and services to the neighborhoods with the most promise of returning. Funding for this project, Decision-Making Among Businesses in Post-Catastrophe Uncertainty: How Economic Geographies Re-Form in New Orleans, was provided by the National Science Foundation through its Small Grants for Exploratory Research (SGER) program (NSF Award 0554937). The Principal Investigator is geographer Dr. Nina Lam of the Department of Geography and Anthropology at Louisiana State University (LSU), who may be reached at [email protected]; tel 225-578-6197. Co-investigators include economist Dr. Kelley Pace of LSU’s Department of Finance ([email protected]; tel 225-388-6256, and geographer Richard Campanella of Tulane University’s Center for Bioenvironmental Research, [email protected]; tel 504-862-8453. Please contact Drs. Lam and Pace for telephone survey results and Campanella for questions about the street survey presented in this report.
8