field study of intercom systems and loudspeaking telephones · a. field study of intercom systems...
TRANSCRIPT

Dept. for Speech, Music and Hearing
Quarterly Progress andStatus Report
Field study of intercomsystems and loudspeaking
telephonesLundin, F. J.
journal: STL-QPSRvolume: 16number: 1year: 1975pages: 027-054
http://www.speech.kth.se/qpsr

STL-QPSR 1/1975
11. SPEECH COMMUNICATION SYSTEMS
A. FIELD STUDY OF INTERCOM SYSTEMS AND LOUDSPEAKING TELEPHONES
F r e d J. ~ u n d i n *
Abstract I A subjective evaluation of and use r s ' attitudes towards loudspeaking
telephone and inter com sys tems ver sus handset telephones has been undertaken. Intercom telephone systems a r e used most commonly for I
I messages shorter than half a minute in a company, but for longer dis- I
cussions personal vis i ts a r e prefer red to telephone calls. When using a loud speaking telephone system the voice level is r a i sed approximately 7 d B (A) compared to face-to-face conversation. The main cause of quality degradation in loudspeaking sys tems is the influence of room acoustics and acoustical noise. The rooms we studied had an average reverberat ion t ime of 0. 5 seconds. The distance between the speaker and a point where the direct sound is equal to the reflected sound va r i e s f rom an average of 0.47 m for rooms with low absorption to 0.76 m for rooms with high absorption. The normal distance between the mouth of the speaker and the microphone averages 0.63 m. Average noise
I levels in the rooms were measured. Loudness and t imbre ratings of the various loudspeaking telephone sys tems were studied a s well a s speaker identification, intelligibility, naturalness, and the false opera- tion of the automatic voice switching.
L M Er icsson Telemater iel AB, TyresB; thesis student a t the Department of Speech Communication, KTH.

STL-QPSR 1/1975
Introduction
Since the sixties loudspeaking systems have been m o r e commonly
available to the general public. By loudspeaking sys tems we h e r e re fer
to loudspeaking telephones connected to the public network and loudspeaking
intercom telephone se ts , mostly used i n companies. The sys tems p re -
sently available on the market a r e not perfect products. There a r e tech-
nical limitations in the matching of systems to the user and vice versa.
In o rde r to secure a better under standing of the use r s ' a t titude towards
available systems and their handling, a study was initiated in the period
May-August 1972 in Stockholm. Similar studies have been undertaken on
loudspeaking telephones for domestic use (Fletcher 1970) and comparisons
with standard handsets (Heberle 1968; Larsson and Johansson 1974).
I
The study
The main scope of the study was to analyze shortcomings in the sound
reproduction and the automatic voice switching performance. Speech
levels, perceived quality, room acoustics and noise levels were therefore I
studied technically and by noting the subjective evaluation of systems, the
handling of the equipment and the amount of training previously received.
Rooms of interest were offices with associated spaces where intercom
se t s were installed, e.g. in s tore rooms, work shops, canteens etc. The
study covered inter com systems f rom the s ix most common manufactur - e r s spread in relation to their market shares . Reply fo rms f rom 21 3 in-
te rcom u s e r s have been processed. The intercom stations were spread
on 14 different systems types and had been installed during the past five
years . 57 loudspeaking se t s were included in the study and were mainly
of the type Ericovox (without handset).
A questionnaire was used for data collection. I t consisted of a gen-
e r a l par: for a l l user s with questions on frequencies of usage of different
telephone systems. A pa r t for intercom u s e r s and a s imilar par t for loud-
speaking telephone u s e r s dealt with questions concerning the sound t rans-
mission. To each questionnaire a measurement par t was attached which
was filled in by the interviewer.
The methods of the study, the resu l t s and the discussions will be
presented in the following par t s :
STL-QPSR 1/1975
- The speaking par ty
- The listening party
- Room reverberat ion
- Room noise
- Human fac tors
The speaking par ty
Method ---- An important factor when developing a loudspeaking telephone system
is the average speech level that affects the microphone. There exist
severa l studies of speech levels a t face-to-face conversation (Knudsen l
and H a r r i s 1950; Fletcher 1953; Richardson 1953; Pe terson and G r o s s i 1963; Gardner 1966). But how do such data re la te to speech levels when
using a loudspeaking system ? Measurements were accordingly made
during conver sation face- to-face and over a loudspeaking telephone sys-
tem. In the f i r s t case a sound level meter (Briiel and Kjaer 2203) was
placed on the user ' ij desk i n front of h im and about one meter f r o m the
mouth. The instrument was r ead off discreet ly so a s not to affect the
speaker in any psychological way. In the second case i t was placed close
to the telephone set and i t s microphone. 1 The distance between the mouth and the microphone, the talking dis-
tance, i s an important factor and determines the rat io between the direct
speech sound and room reflections of the transmitted sound. The dis- I
tance a l so affects the sound level a t the microphone. This distance was
measured when the speaking par ty had made a call and had a conversation.
Resul ts ----- At an ordinary conversation "face-to-face" the speech level had an
average value of 64.8 dB(A) with a standard deviation of 4. 0 dB(A).
(These notations a r e used i n this paper to indicate the sound p res su re
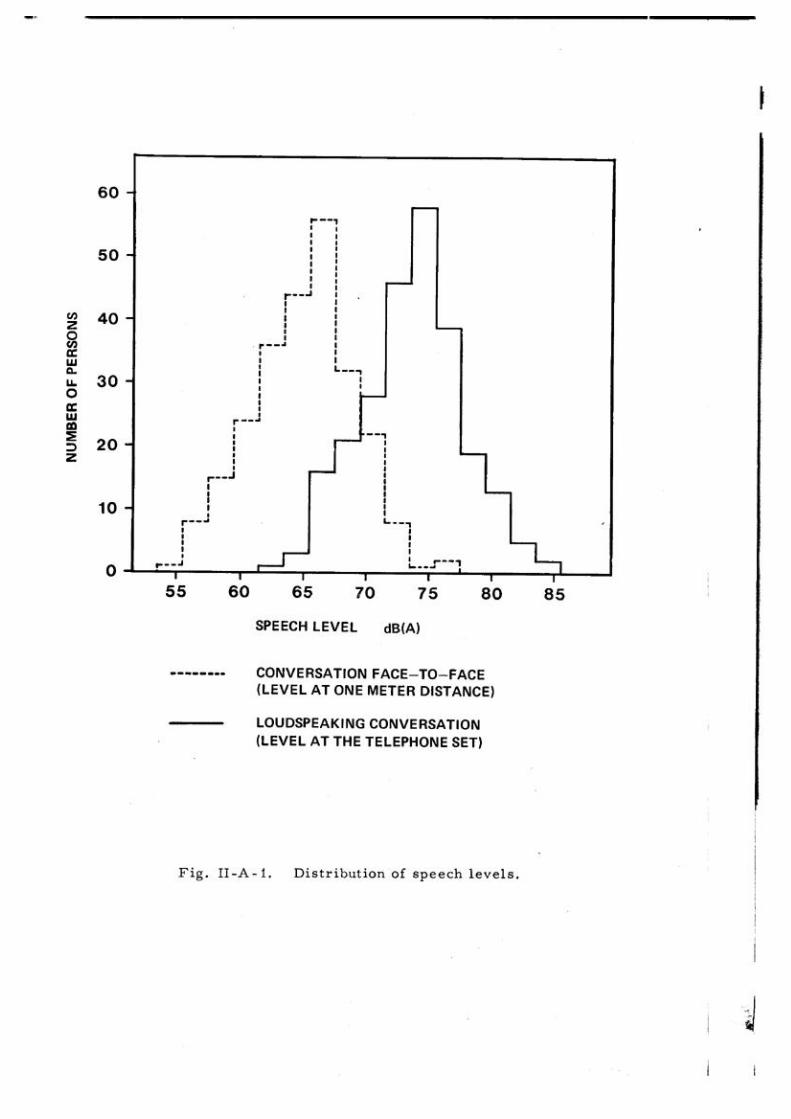
level with A-weighting i n relation to 2OV Pa . When units not a r e given, i we use SI units.) The distribution is shown i n Fig. 11-A- I , the dashed plot.
When measuring close to the set the speech level value averaged 73. 3
dB(A) with a standard deviation of 4.0 dB(A). The distribution is shown i n
Fig. 11-A-I, the solid line plot. When comparing the two sound levels - "face-to-facett and via a loudspeaking system - there is an average increase

STL-QPSR 1/1975
of 8.8 dB(A) for the loudspeaking system. The distribution i s shown in
Fig. 11-A-2, the dashed plot.
To be able to compare the two speech levels mentioned above the
speech distance must be equal. The "face-to-face" value was measured
at a distance of one meter but the talking distance averaged 0. 63 m
(standard deviation 0. 17 m). Which corrections shall we add to the val-
ues obtained when using a loudspeaking system to get the speech levels I
at one meter distance if we also take into account the influence of the
room acoustics? Let us consider some relations from the theory of
room acoustics.
The sound pressure level Lp ( re 20p, Pa) at the distance d from an
omnidirectional point source with the acoustic output power Pw, i s in I
f ree space (and normal temperature and pressure)
Pw Lp = 10 log- 1 + 10 log -
Po 4nd2 (1)
Here Po i s a reference power of ~ O - ' ~ W . Fo r convenience in further con-
siderations we define the acoustic power level of the sound source L I
W
( r e 1 pW) a s
Pw Lw = 10 log - Po
The "distance law" (eq. 1) gives a decrease of 6 dB of the sound
pressure level when the distance to the source i s doubled. However, i f
the sound source i s situated in a room with the total reflecting area S and
the mean absorption coefficient a. the sound pressure level i s instead
given (Brandt 1958; Krokstad 1967; Beranek 1971) by I
Lp = Lw + 10 log ( 1 4
4 n d 2 +
where the room constant ( ~ a r d n e r 1960) for the specific room i s
The term 1/4nd2 represents the contribution from the direct sound
and the term 4 / ~ the contribution from the reflected sound. If the sound
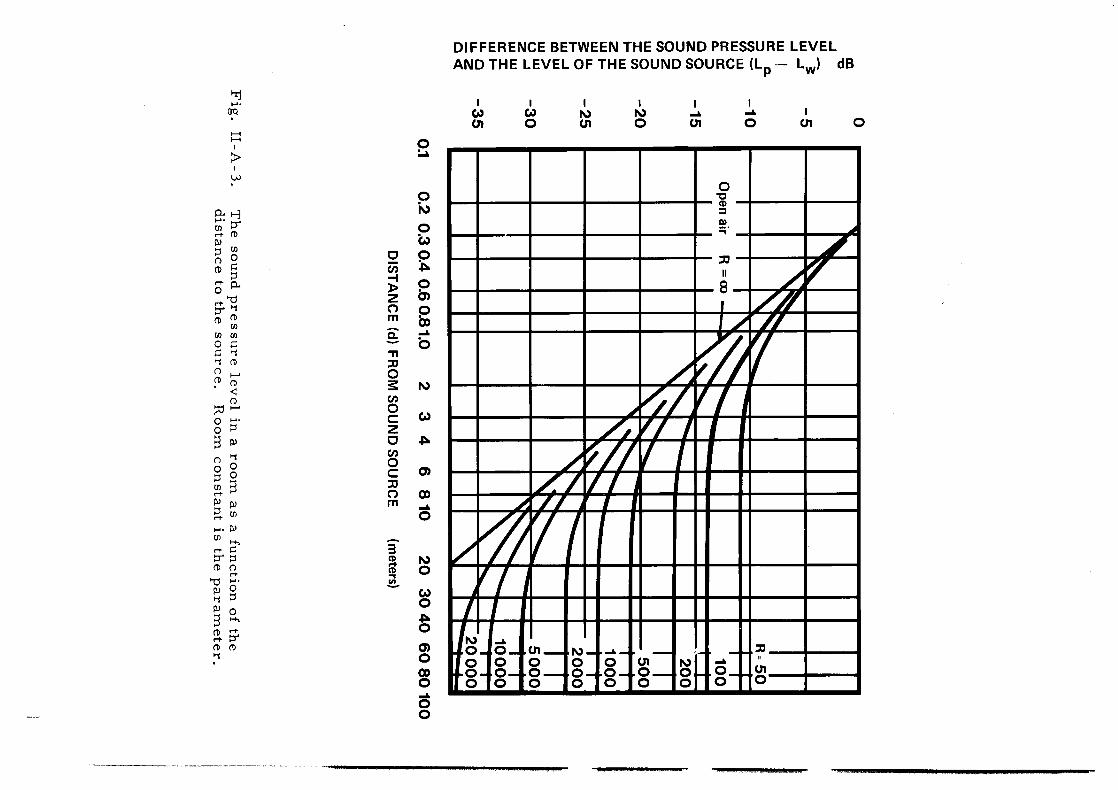
pressure level in a room is plotted a s a function of the distance to the

-5 0 5 10 15 20 25
SPEECH LEVEL INCREASE dB(A)
--------- NON-CORRECTED VALUES
CORRECTED VALUES ACCORDING TO THE DISTANCE LAW AND THE SPECIFIC ROOM ACOUSTICS
Fig. 11-A-2. Distribution of the i nc rea se s of the speech levels when using a loudspeaking telephone sys tem compared to face-to-face discussion.
STL-QPSR 1/1975 3 1.
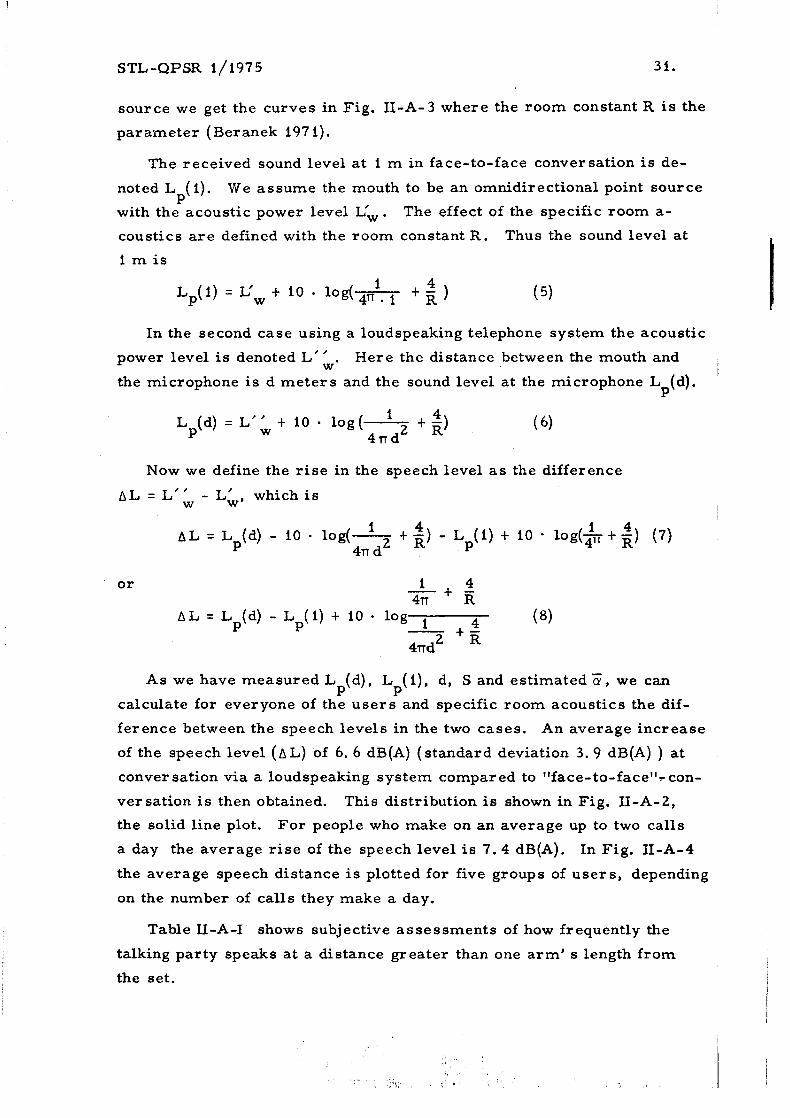
source we get the curves in Fig. 11-A-3 where the room constant R i s the
parameter (Beranek 197 1).
The received sound level a t I m in face-to-face conversation i s de-
noted L ( 1). We assume the mouth to be an omnidirectional point source P
with the acoustic power level L', . The effect of the specific room a-
coustics a r e defined with the room constant R. Thus the sound level a t
1 m i s
In the second case using a loudspeaking telephone system the acoustic
power level i s denoted L' ' Here the distance between the mouth and w
the microphone i s d meters and the sound level at the microphone L (d). I P
i 4 L (d) = L" + 10 log(------Z + E) P W 4 n d
Now we define the r i se in the speech level a s the difference ,
AL = L" - LL, which i s W I
As we have measured L (d), L (I), d, S and estimated E , we can P P
calculate for everyone of the users and specific room acoustics the dif-
ference between the speech levels in the two cases. An average increase
of the speech level ( A L) of 6.6 ~ B ( A ) (standard deviation 3.9 ~ B ( A ) ) at , conversation via a loudspeaking system compared to "face-to-face"? con-
ver sation i s then obtained. This distribution i s shown in Fig. 11-A-2,
the solid line plot. For people who make on an average up to two calls
a day the average r i s e of the speech level i s 7 .4 dB(A). In Fig. 11-A-4
the average speech distance i s plotted for five groups of users, depending
on the number of calls they make a day.
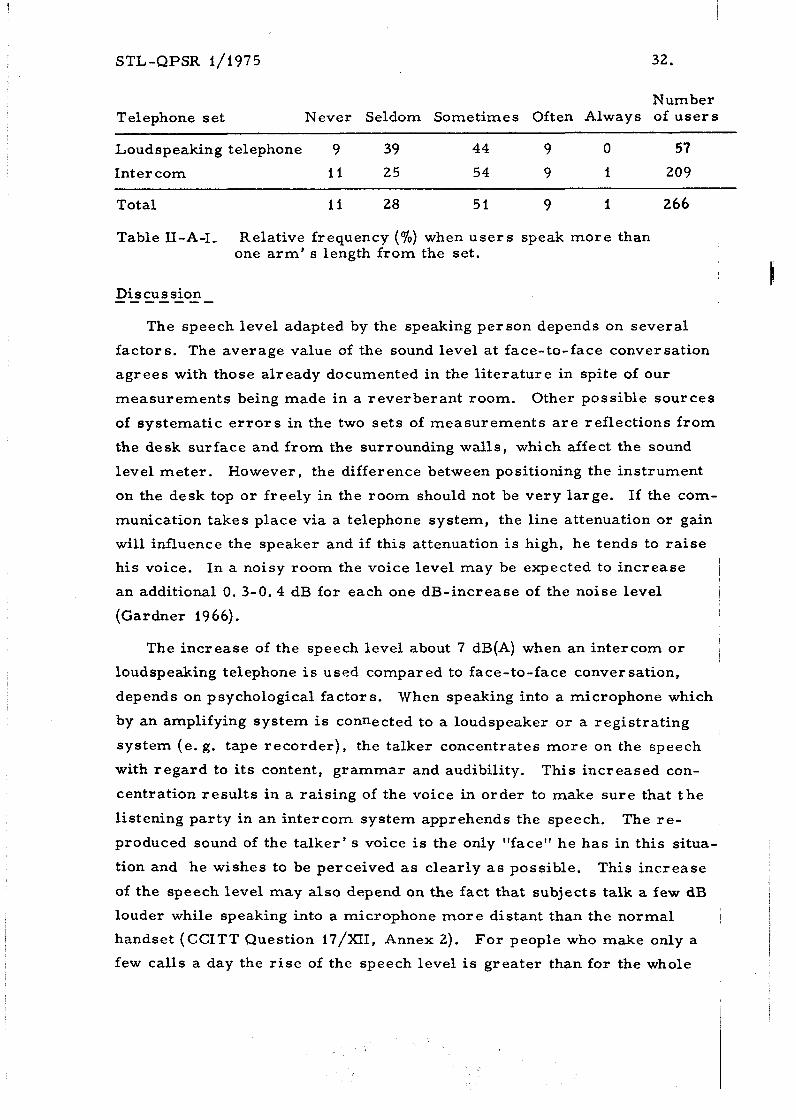
Table 11-A-I shows subjective assessments of how frequently the
talking party speaks a t a distance greater than one arm' s length from
the set. i I
DIFFERENCE BETWEEN THE SOUND PRESSURE LEVEL AND THE LEVEL OF THE SOUND SOURCE (Lp - L,) dB

0.4 I 1 I
0 1-2 3-5 6-10 >10 AVERAGE NUMBER OF CALLS MADE A DAY
Fig. 11-A-4. Average talking dis tances for loudspeaking sys tem u s e r s depending on the average number of ca l l s they make a day. The ver t ica l l ines m a r k the s tandard e r r o r of the mean.
STL-QPSR 1/1975 32.
Number Telephone set Never Seldom Sometimes Often Always of users
Loudspeaking telephone 9 39 44 9 0 57
Inter com 1 I 25 54 9 I 209
Total
Table 11-A-I, Relative frequency (%) when users speak more than one a rm ' s length from the set.
Discussion ------- The speech level adapted by the speaking person depends on several
factors. The average value of the sound level a t face-to-face conversation
agrees with those already documented in the literature in spite of our
measurements being made in a reverberant room. Other possible sources
of systematic e r ro r s in the two sets of measurements a r e reflections from
the desk surface and from the surrounding walls, which affect the sound
level meter. However, the difference between positioning the instrument
on the desk top or freely in the room should not be very large. If the com-
munication takes place via a telephone system, the line attenuation or gain
will influence the speaker and i f this attenuation i s high, he tends to ra ise
his voice. In a noisy room the voice level may be expected to increase
an additional 0. 3-0.4 dB for each one dB-increase of the noise level I
(Gardner 1966).
The increase of the speech level about 7 d8(A) when an intercom o r ~ loudspeaking telephone i s used compared to face- to-face conversation,
depends on psychological factors. When speaking into a microphone which
by an amplifying system i s connected to a loudspeaker or a registrating
system (e. g. tape recorder), the talker concentrates more on the speech
with regard to i t s content, grammar and audibility. This increased con-
centration results in a raising of the voice in order to make sure that t he
listening party in an intercom system apprehends the speech. The re - I
produced sound of the talker' s voice i s the only "face" he has in this situa-
tion and he wishes to be perceived a s clearly a s possible. This increase
of the speech level may also depend on the fact that subjects talk a few dB
louder while speaking into a microphone more distant than the normal I
handset (CCITT Question I~/XII , Annex 2). For people who make only a
few calls a day the r i se of the speech level i s greater than for the whole
STL-QPSR 1/1975 33.
group, which make us suspect that this group of people i s badly trained
on the system and consequently that people who seldom use loudspeaking
systems talk louder than more trained people.
When measuring the speech level at face-to-face conversation the dis-
tance between the mouth and the microphone was not measured exactly
but estimated to be one meter. The room absorption coefficient was also
estimated. Due to the variations in these parameters there is some un-
reliability in the value of 7 dB(A) speech level increase. This value i s
higher than anticipated and further studies a r e planned to check the validity.
The average talking distance found in this study i s applied to the party
making a call. The other party may stand several meters from his inter-
com set when he answer s the call i f the set is in a direct acceptance mode.
The more people a r e trained on the system and use the loudspeaking tele-
phone or intercom set the greater distance they will allow between mouth
and microphone. This range i s about 0. 1 m and depends on the fact that
the system operates well at this greater talking distance and that this dis-
tance i s more convenient to use. Untrained people often talk very close ' to the set until they get instructions that the system operates well on
I greater talking distance too.
The listening party
Methods ---- - The data collection was undertaken by means of a quest ionnaire,
which consists of one part for loudspeaking telephone users and a similar
part for intercom telephone users. The user was asked to perform the
loudness and timbre ratings on a three-level scale. The loudspeaking
telephone sets have keybuttons for extra receiving amplification and the 1 frequency of usage of this facility for internal and external calls was noted.
General methods for predicting the intelligibility of speech transmission
systems (Beranek 1947; Fletcher 19 53; American national standards me-
thods 1969) from their physical characteristics cannot substitute direct
evaluations of system quality from the users ' point of view. We have I
selected three parameter s of special interest, speaker identificatior , in-
telligibility, and naturalness. Five-level scales were used to classify
these parameters in grades from 1 to 5 where 5 i s the best value of the
parameter. I

STL-QPSR 1/1975 34.
Speaker identification is the ability to recognize a known person by
h i s voice only. Articulation, pauses, and dialect influence this param-
eter . The user should classify how often he recognizes the speaking
party by h is voice. Intelligibility i s often measured a s the relative
number of correct ly reg is te red nonsense syllables o r specially selected
words transmitted over a system (Beranek 1949). In this study, on the
other hand, the u s e r s gave their opinion of how often they had to a sk the
other par ty to repeat messages. 1
In many cases when the intelligibility of a system i s measured, i t I I shows values close to 100 OJo. Then i t i s m o r e rea l i s t ic to study the sound
quality f rom a subjective point of view and especially the naturalness
(Gleiss 1971). The u s e r s gave their opinion of the naturalness of the
system compared to the naturalness obtained when people speak to each
other in the same room.
I
The loudspeaking telephone se ts in this study were equipped with a
voice- switched amplifier to prevent self oscillation or "singing" (Busala
1960; Cleary and Cannon 1961; Clemency and Goodale 1961; Copping and
Fidler 1967; Galyas 1969; Takeda and Kondoh 1972; Clarle and Gale 1973;
Suntop 1 9 7 4).
The gain of the amplifier was influenced by the speech in such a way
that i t was normally directed away f rom the speaking and towards the
listening party. As usual this voice- switched amplifier was centrally
placed (i. e. in the exchange) in an intercom system and the speech t rans-
i mission was arranged on separate cable p a i r s for the microphone and
loudspeaker signal (4-wire system). I n loudspeaking telephone systems
and in some intercom sys tems the voice-switching function was decen-
t ra l ized and placed in each telephone set. In these systems the speech
t ransmission normally used the same cable pair for the microphone and
loudspeaker signal (2-wir e system) due to a hybrid network.
A number of conditions apply to voice- switched amplifiers to provide
natural voice switching without affecting conversation. In 2-wire systems
the voice switched amplif iers in the transmitting end a s well as in the r e -
ceiving ~ n d must be set in the right speech direction. The operating t ime I f rom receiving to transmitting mode should be sufficiently short to prevent
the f i r s t syllable of the words to be clipped (Barnes 1972). I f , on the other
hand, the operating t ime i s set too short this resu l t s in inc reasednu i se sen-
sitivity-and a click i s heard at each mode t ransfer . Observations of i
clipping were noted i n a three-level scale. I


STL-QPSR 1/1975 36.
Never Seldom Sometimes Often Always
Internal cal ls (PAB X) 19 3 0 14 21 16
External cal ls (PABX) 11 11 26 3 5 17
Table 11-A-111. Use of additional gain when a loudspeaking telephone is used. Relative numbers i n 70.
Table 11-A-IV shows how the t imbre is perceived in the intercom and
loudspeaking set. 88 OJa of the intercom u s e r s considered the t imbre to be
acceptable. The quality was perceived a s too much t reble i n some sys tems
and too much bass in others.
Manufacturer Too much Normal Too much Number of Intercom bass t reble repl ies
Total 3. 4 88.0 8.7 208
Loudspeaking telephone 12 75 12 5 7
Table 11-A-IV. Perce ived timbre. Relative numbers in '$0.
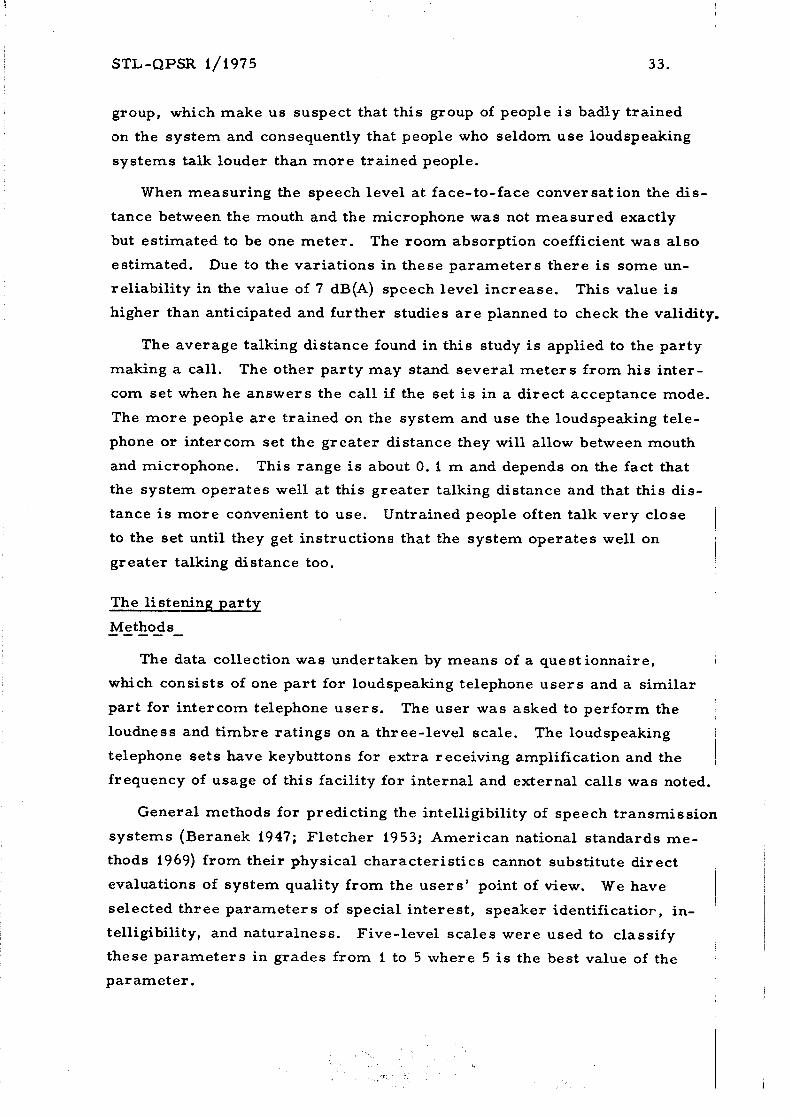
The re su l t s of speaker identification. intelligibility and naturalness
a r e presented i n Table 11-A-V. When comparing values of speaker iden-
tification and intelligibility one finds that the ranking order between the I products of different manufacturers is generally s imilar (Speaker iden- I
tification: E-A-B-D, C-F, intelligibility: E , B-A-D, C, F, naturalness:
E, D-A-B-F-C). The ranking o rde r of the total of parameter average
values (E- B-A-D- C-I?) ag rees well with that of the intelligibility. The
three systems with the lowest total ra t ings C, D, F deviate f rom normal 1 t imbre as shown in Table 11-A-IV. I
I
The relations between the three pa ramete r s have been il lustrated by
calculations of correlation coefficients: speaker identification - intelligi-
bility 0. 39, naturalness - intelligibility 0. 38, naturalness - speaker iden-
tification 0. 26. I t is apparent that the three pa ramete r s a r e relatively in-
dependent of each other. However, the intelligibility i s m o r e related to
both speaker identification and naturalness than the relation between the
lalter .
STL-QPSR 1/1975 37.
Manufacturer Speaker Intelligibility Naturalness Total Number identification of repl ies
Total 4. 1 3. 6 3. 6 11. 3 209
Loudspeaking telephone
Table 11-A-V . Average values of speaker identification, intelligibility and naturalness. I
Table 11-A-VI shows the frequency of occurrence of problems associated
with voice-switched amplifiers which resul t s in losses of intelligibility due
to false switching phenomena such a s clipping, chopping and break-in.
These a r e graded from 1 to 5 a s follows: 5 = no problems, 3 = occasional
problems, 1 = frequent problems.
Inter com Loudspeaking telephone 1 3 5 1 3 5
Clipping 13 44 43 12 44 44 I
Chopping 4 37 58 12 37 51
BreakLin 8 21 68 7 36 57
Number of 201 repl ies
Table 11-A-VI. R elative existence (in %) of problems connected with the automatic voice switching in inter com and loudspeaking telephone.
The calculated average values of the repl ies applying to the different
intercom manufacturers a r e presented in Table 11-A-VII.
Manufacturer Clipping Chopping Break-in Total Number of repl ies
Average 3. 6 4. 1 4. 1 11. 8 20 1
Table 11-A-VII. Average inter com values.
STL-QPSR 1/1975
Discussion ------ The method of using the questionnaire for classification of perceptual
parameters provides subjective results only. The users were asked to
class loudness, timbre, naturalness etc. in relation to their own ideas of
these parameters. Many of the users had never considered the sound
quality from this point of view and had difficulty in giving relevant infor-
mation. It might have been -preferable to grade the quality of the exist-
ing telephone set in relation to some reference telephone set. The results
should therefore be regarded a s relative values only showing how people
perceive the sound reproduction guiding us towards a general outline of the
users ' demands. In order to analyze these outlines of loudness and
timbre, 5-digit scales should have been used instead of the 3-digit scales
now being employed.
Some types of intercom telephone sets had key buttons for two differ-
ent listening levels equal to the key button mentioned regarding the loud-
speaking telephone. These systems show fewer variations in perceived
loudness. However, a continually adjustable volume control was re -
quested on each set to adjust the loudspeaker output to the speaking party' s
voice level.
It should also be mentioned that when a loudspeaking telephone i s used,
the party at the other end of the line normally uses a non-loudspeaking tele-
phone set. The speech i s then subject to distortion due to the carbon , microphone.
Many of the interviewed persons were unaware of the system having
automatic voice switching. This indicates poor training in the systems,
their functions and use. To make proper use of inter com and loudspeaking
telephones presently marketed, it i s essential to be informed of the set-
ting-up procedure, the acoustic properties of the system (such a s suitable
speech level, speech distance, traffic discipline, noise sensitivity) a s I well a s special services provided with the system (e. g. all- call, recall,
paging). Due to the lack of knowledge of voice switching when answering
the questions, a high degree of accuracy cannot be claimed. However, i t
i s established that 44 % of the intercom users had noted disadvantages in
voice switching operations. The corresponding figure for loudspeaking
telephones was 50 %.

STL-QPSR 1/1975 39.
Intercom sets , f rom six different manufacturers have been studied
with respect to their various qualities. I t should be noted that the sets
from the six manufacturers were split up into 14 different system types
installed during the past five years. For a technical comparison between
intercom sets from different manufacturers from the point of view of
quality and performance, equivalent systems should be chosen with con-
sideration to size, age, application etc. The aim of this study was not
to establish the best telephone system but to make a survey of the users '
attitudes towards, and use of, the systems. However, a manufacturer
often has his own criterion of sound reproduction, e. g. loudness and
timbre, and on the basis of this fact comparisons may be made. It should
be added that three of the manufacturers were represented by just one
system each.
The ranking order of the total of parameter average values in Table
7 cation or 11-A-V agrees better with intelligibility than speaker identif:
naturalness. Moreover the correlation i s greater between intelligibility
and speaker identification or naturalness, than the correlation between
speaker identification and naturalness. Consequently i f we want only one
of these parameters to specify the quality of a speech transmission chan-
ne 1 intelligibility gives the most significant result.
If we compare the ranking order of the sets of the different intercom
manufacturers with consideration to the intelligibility a s well a s the voice
switching problems we will notice a relation between good intelligibility
and poor voice switching properties and vice versa. The explanation of
this can be seen in Tables 11-A-I1 and 11-A-IV indicating loudness and
timbre. If the loudness i s weak and the balance of spectrum chosen so
that more treble than bass i s transmitted the operation of the voice-switched
amplifier will be perfect but the intelligibility will decrease. On the other
hand, a high output sound level and reproduction of a wide frequency range
resul ts in good intelligibility o r naturalness, but due to the acoustic coupling
loudspeaker - microphone and due to room reverberation this will result
in frequent false-operations of the voice- switched amplifier. I
Room reverberation
Method ---- Room acoustics a r e a link in the chain: Speaker - transmission sys-
tem - l istener (Huszty 197 1). A sound source, e. g. the loudspeaker,


Gardner 1960; Huggler 1961; Clemency and Goodale 1961; Copping and
Fidler 1967; Galyas 1969; Reichard and Breeden 1973; Suntop 1974;
Berkley and Mitchell 1974). If the echo effect i s far worse false switching
phenomena appear in the voice switched amplifier (Busala 1960) and these
a r e reported in another part of this study.
An interesting distance is the "reverberation radius" r (Krokstad I r I
1967) which i s the distance to the source where the direct sound i s equal
to the reflected sound. This occurs when the two te rms in the log-ex-
pression in equation (3), p. 30, a r e equal.
Obviously we have two types of sound fields in the room, the "near , I
fieldtt or the direct sound field between the sound source and up to a dis-
tance of the reverberation radius from the source where the distant law
is valid, and the "far field" or the reverberant sound field further from
the sound source than a distance of the reverberation radius where the re -
verberant sound dominates. In our application either the sound source i s
the mouth of the speaking party and we study the distance to the micro- I
phone of the set or the sound source i s the loudspeaker and we study the
distance to the ea r s of the listening party. I I
To specify the room acoustics the dimensions (height, width, length)
of the room were measured. The rooms were divided into three levels 1 of absorption: well-absorbing (many of absorbers e. g. wall- to-wall car-
pet, upholstered furniture, curtains, book shelves, acoustic tiles), normal
(some of the sound absorbing material mentioned above), and low-absorb-
ing (without good absorbing materials). Since measurements of the re-
verberation times in all rooms would have increased the extent of the
study considerably, more detailed measurements were carried out in ten
rooms only. . I
Results I ----- I
3 The rooms in the study had an average volume of 68 m (median value i 3 2
I 54 m ) and the average value of the total room area was 100 m (median !
2 1 value 89 m ). The rooms were divided into three absorbing levels and
I I
STL-QPSR 1/1975 42.
f rom the special study of the reverberation t imes in ten rooms the
average absorption coefficients were calculated to 0.30 for well absorb-
ing rooms, 0.16 for normal and 0. 12 for low-absorbing rooms. Using
these coefficients the average reverberation time for all rooms was cal-
culated to be 0. 54 seconds with a standard deviation of 0.20 seconds.
I The "reverberation radius" is calculated f rom the total room a r e a
and the average absorption coefficient. For well absorbing rooms i t is
found to be 0.76 m, normal rooms 0.55 m and low-absorbing rooms
0.47 m.
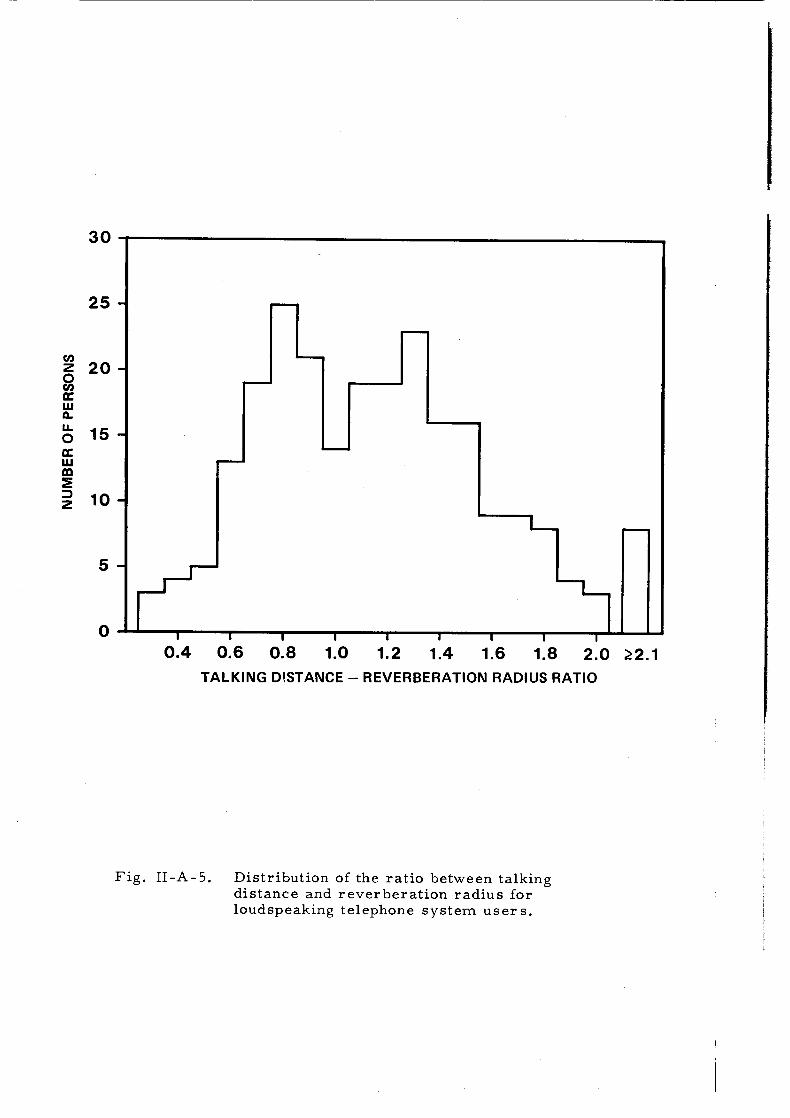
The rat io between the talking distance and the reverberation radius for
an omnidirectional sound source average 1. 16 (standard deviation 0. 47)
and the distribution for al l use r s is plotted in Fig. 11-A-5. This ratio we
compare to the frequency of complaints f rom the far end party about the
speech quality and recommendations to use the handset instead of the
loudspeaking telephone, The resul t i s plotted for the 54 loudspeaking I
telephone use r s in Fig. 11-A-6.
Discussion ------- The rat io between the talking distance and the reverberation radius is
approximately equal to one. Thus one half of the sound energy produced
by the speaking party will reach the microphone directly while the other
half reaches the microphone via room reflections. For the actual ratio
1.16 the amount of reverberant sound dominate over the direct sound at
the microphone when transmitting. Reverse conditions may also apply in-
asmuch a s approximately one half of the energy radiated by the loudspeaker
reaches the listener directly while the other half reaches him via room 1 I
reflections. However, the loudspeaker radiates into a halfspace and
should not be regarded a s an omnidirectional sound source. The rever - beration radius for such a source is J 2 t imes the calculated value for an
omnidirectional source. If the listening distance is equal to the talking I distance the ratio between this and the reverberation radius for the loud- , speaker average 0.82. Consequently the amount of direct sound dominate
over the reverberant sound at the position of the listening party. i I I
The rat io between the talking distance and the reverberation radius
gives us a score for the quality of the traiismitted sound from the micro-
phone to the listening party due to room reverberation. When using a
0 I . I I
0.4 0.6 0.8 1.0 1.2 1.4 1.6 1.8 2 . 0 2 2 . 1 TALKING DISTANCE - REVERBERATION RADIUS RATIO
Fig. 11-A-5. Distribution of the ra t io between talking distance and reverbera t ion rad ius for loudspeaking telephone sys tem use r s .


STL-QPSR 1/1975 43.
loudspeaking telephone the listening party generally uses a handset tele-
phone. In this case a great amount of transmitted reverberant sound i s
very disturbing and gives the mentioned "barrel" o r llbath-room" effect.
This disadvantage i s the main reason why the handset user may recom-
mend the loudspeaking telephone user to use h is handset i f possible.
Other reasons a r e frequent -e-switching of the voice- switched amplifier
and sound level, which is too low.
Fig. 11-A-6 shows that there is a correlation between these two pa-
r ame te r s mentioned for the 54 loudspeaking telephone user s . The
standard e r r o r of the mean i s a lso plotted and in group 4 the data i s 1 based on only s ix use r s , which may explain the fall of the r i s ing curve.
I
In this study the speaker and the telephone se t a r e regarded a s omni-
directional sources to simplify the model, but i n the real i ty the speech
level va r i e s about the human head (Dunn and Farnsworth 1939) and the
desk surface influences on the sound field about the loudspeaking tele-
phone set. The total reflecting a r e a of the room was calculated as the
sum of the walls, the ceiling and the floor a r e a s and the rooms con-
s idered as rectangular. Of course there were other reflecting a r e a s in
the rooms and not a l l the rooms had rectangular forms, but these facts
do not seriously influence the data in this study.
The special study on reverberat ion t ime included only ten rooms, I
which were classed in the same way a s the rooms in the study, and on
the bases of these the aver age absorption coefficients were calculated
and used on all the rooms in the study, and consequently there is some I
unreliability in the data. However, the average absorption coefficients
agree well with those in the li te ra tore (Beranek 197 1).
The lowest frequency t ransmit ted over a loudspeaking telephone sys-
tem is about 300 Hz and this corresponds to a wave-length of about one
meter . Some rooms in the study have a minimum dimension of about two
m e t e r s and accordingly the standing wave model with eigentones i s ap-
plicable for the lowest t ransmit ted frequencies. On the other hand, the I highest t ransmit ted frequencies a r e in the region 5- 6 kHz for intercom
systems and the corresponding wavelength: 6 o r 7 cm. In this case the
reverberat ion model is applicable. The absorbing mater ia l s in the stu-
died rooms often had higher absorption coefficients for frequencies over

STL-QPSR 1/1975 44.
500 Hz than under 500 Hz. This fact elucidates that the dominating r e -
verberation sound in the room is of frequencies under 500 Hz and can be
described by the eigentones.
Room noise
Methods ----- Acoustical noise affects the sound t ransmission in different ways.
The intelligibility of speech i s reduced by masking, when noise is present
in the room of the speaking party ( ~ e b s t e r 1965). The incidence of such
excessive noise levels causing the listening par ty difficulty in under-
standing the speaking party was noted. The noise a l so causes the speak-
ing par ty to r a i s e h is speech level about 0. 3-0.4 dB pe r dB increase of
noise level (Gardner 1966). I
Acoustical noise a t the listening party both masks the sound f rom the
loudspeaker, and resu l t s in false switching if i t exceeds a fixed limit be-
cause the automatic voice- switching circui t ry may reac t to the noise
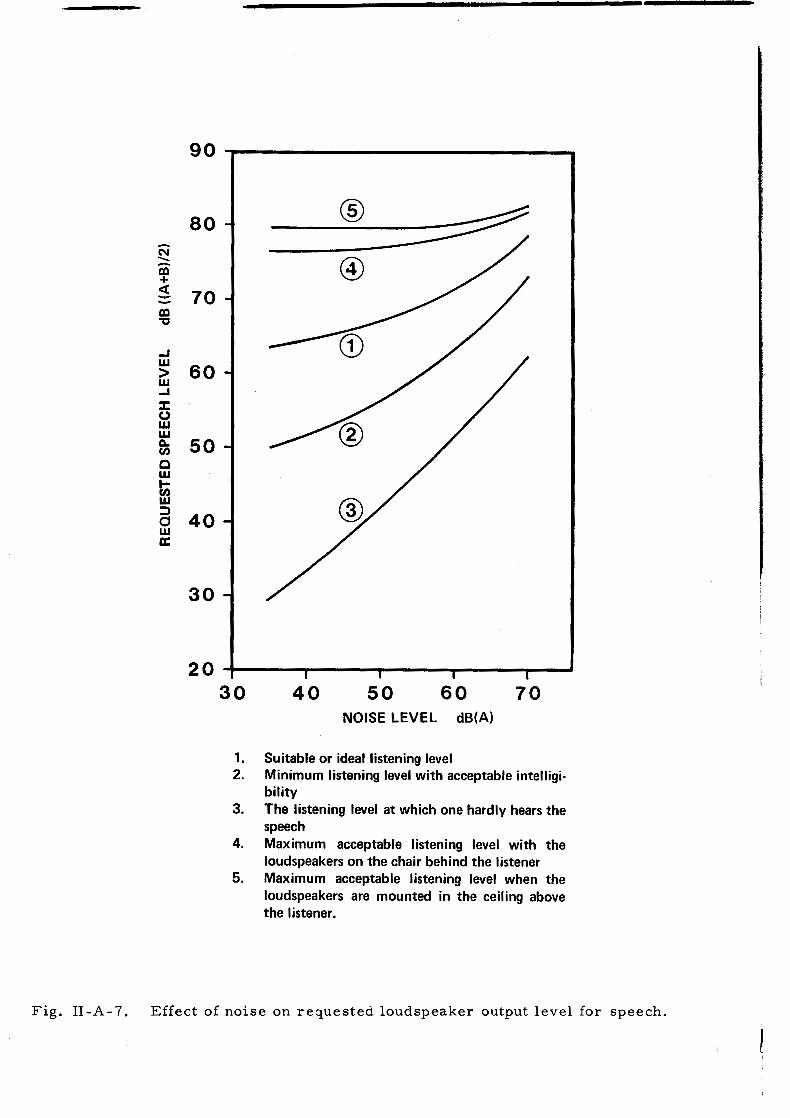
signal a s if i t were the listening par ty who began speaking. If noise i s 1 present when listening, a higher level is required to obtain an acceptable
signal to noise ratio. Different listening levels a r e shown i n Fig. 11-A-7
where the effective signal consists of speech and the interfering noise of
A-weighted noise (Gardner 1964; Gleiss 1971). The plot number 1 r e -
presents suitable o r ideal listening level.
Apparently acoustical noise is an important factor affecting loud-
speaking telephone conversation. The noise levels were measured with
a sound level meter (Briiel and Kjaer 2203) with l inear scale a s well as
with A-weighting. Moreover the types of the noise sources were noted.
Resul ts ---- - The average level of the environmental noise was 45. 4 dB (standard
deviation 7. 8 dB), weighted in accordance with a standardized A-curve
corresponding to the noise level "heard by the e a r t t . Without weighting
an average value of 64. 1 dB (standard deviation 6. 2 dB) was obtained, i. e.
the noise level that in real i ty affects the microphone. The difference be-
tween the weighted and the non-weighted values (average 18.7 * 6.0 dB)
depends on the existence of lowfrequency noise below 300 Hz. The dis-
tribution of the noise levels is shown in Fig. 11-A-8.
NOISE LEVEL dB(A)
1. Suitable o r ideal listening level 2. Minimum listening level w i th acceptable intelligi-
bility 3. The listening level at which one hardly hears the
speech 4. Maximum acceptable listening level w i th the
loudspeakers o n the chair behind the listener 5. Maximum acceptable listening level when the
loudspeakers are mounted i n the ceiling above the listener.
Fig. II-A-7. Effect of noise on requested loudspeaker output level for speech.

SOUND LEVEL dB
-.I..------- NON-WEIGHTED VALUES
A-WEIGHTED VALUES
Fig. 11-A-8. Distribution of the noise leve ls in the studied rooms.

STL-QPSR 1/1975 47.
We know f rom a Brit ish study (Maddison 1968) that there a r e people
who find i t difficult to dial a call on the public telephone network. But how
well a r e people trained on m o r e complex sys tems such a s a loudspeaking
telephone set o r an in te rcom? And how is the training administered?
These a r e important factors to consider. I
I
The u s e r s had opportunities to give their viewpoints on the advantages
and the disadvantages of a loudspeaking telephone o r a n intercom versus
the standard handset telephone. The u s e r s a l so gave viewpoints on the 1 limitations of the systems of today, which they did not want in future sys-
t ems and these factors should be considered when new systems a r e deve-
loped.
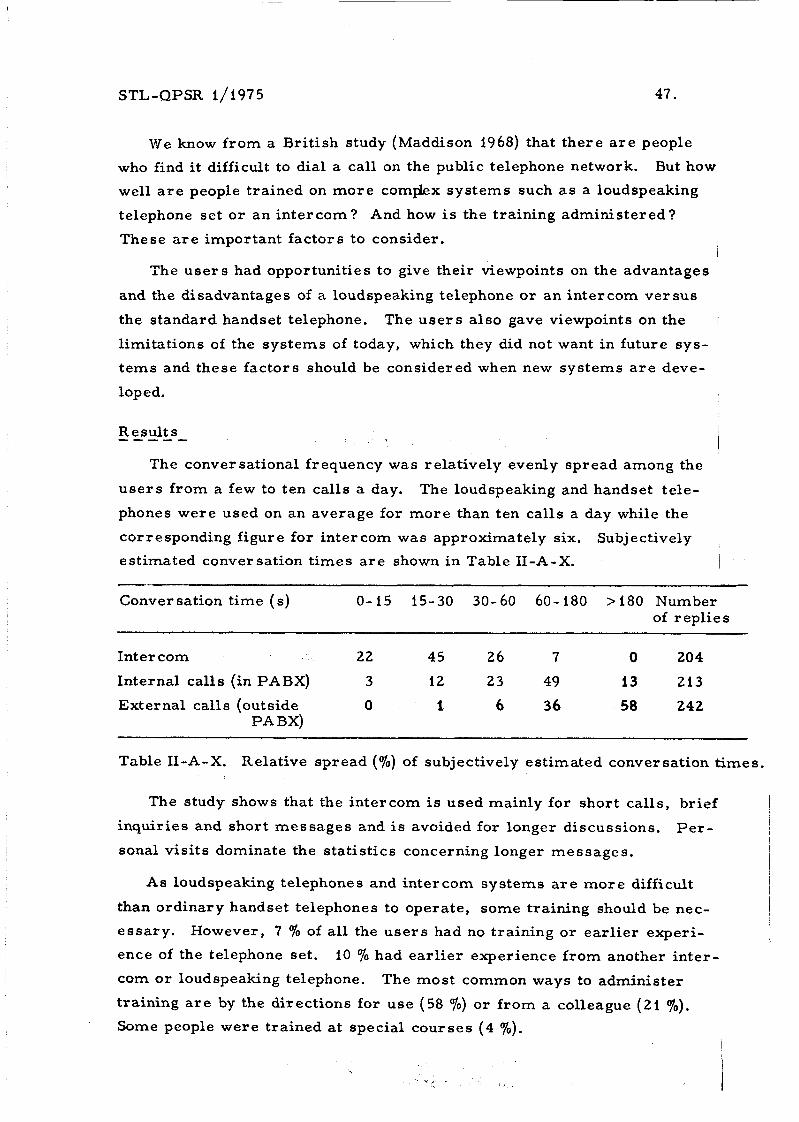
Resul ts ----- I The conversational frequency was relatively evenly spread among the
u s e r s f rom a few to ten calls a day. The loudspeaking and handset tele-
phones were used on an average for more than ten cal ls a day while the
corresponding figure for inter com was approximately six. Subjectively
estimated conversation t imes a r e shown in Table 11-A-X. 1
Conversation t ime (s) 0-15 15-30 30-60 60-180 >180 Number of r eplie s
Inter com 22 45 26 7 0 204
Internal cal ls (in PABX) 3 12 23 49 13 213
External cal ls (out side 0 i 6 36 58 242 PABX)
Table 11-A-X. Relative spread (YO) of subjectively estimated conversation t imes.
The study shows that the intercom is used mainly for short cal ls , brief
inquiries and short messages and is avoided for longer discussions. P e r -
sonal vis i ts dominate the s tat is t ics concerning longer messages.
As loudspeaking telephones and inter com systems a r e m o r e difficult
than ordinary handset telephones to operate, some training should be nec-
essary . However, 7 70 of a l l the u s e r s had no training o r ear l ie r experi-
ence of the telephone set. 10 70 had ear l ie r experience f rom another inter-
com o r loudspeaking telephone. The most common ways to administer
training a r e by the directions fo r use (58 YO) o r f rom a colleague (21 %). Some people were trained a t special courses ( 4 70).

STL-QPSR 1/1975
Viewjoints -- --- The advantages of an intercom compared to a handset telephone a re :
( I) quick connecting procedure (push- buttons)
(2) possible to make internal inquires when having a call on the ex- te rna l l ine
(3) possibility of several persons in the same room speaking and listening to the intercom system
(4) f r e e hands for making notes, sorting out papers and handling binders.
In many cases a handset telephone (PABx) i s prefer red to an intercom
for internal calls. Some of the viewpoints received a re : 1 (1) More persons in a company can be reached through the standard
telephone (PABX -exchange). The intercom system does not generally include a s many employees a s the standard telephone system. 3
(2) In a company with a small intercom system the intercom telephone directory i s often non-current because i t has not been followed-up closely enough. The FABX telephone directory i s generally m o r e up to date. The choice of means of communication often depends on whether the PABX telephone number of the intercom extension number is known by heart .
(3) The called person may have a visitor. One does not want to disturb. This applies especially when one calls a superior in a hierarchically organized company.
(4) The called per son may be busy on the phone and an intercom call i s then regarded a s disturbing. When calling on the PABX telephone, a busy signal will inform that the called par ty i s busy.
(5) If the called per son i s having a conference i n his room, a l l par t i - cipants will be disturbed by an inter com call.
(6) The exchange of information may be of confidential nature. One does not want unauthorized people to overhear the conversation.
(7) Some people consider a call via the handset telephone m o r e personal than a call via the inter com. The inter com system i s seldom used when making a f i r s t contact but only to call people previously known 1 by the cal ler . I
I 4
(8) Due to room noise, i t is eas ie r to speak and l is ten when using a I
telephone receiver . , I ,
(9) Due to the automatic voice switching one does not know how one sounds in the other set. No confirmation i s received a s to what has passed through the voice-switched channel and one does not know if the speech is too weak or too loua. In a handset the hybrid sidetone provides I for a cer tain reference.
During the study three important cases were brought up where the
loudspeaking telephone was especially appreciated.
STL-QPSR 1/1975 49.
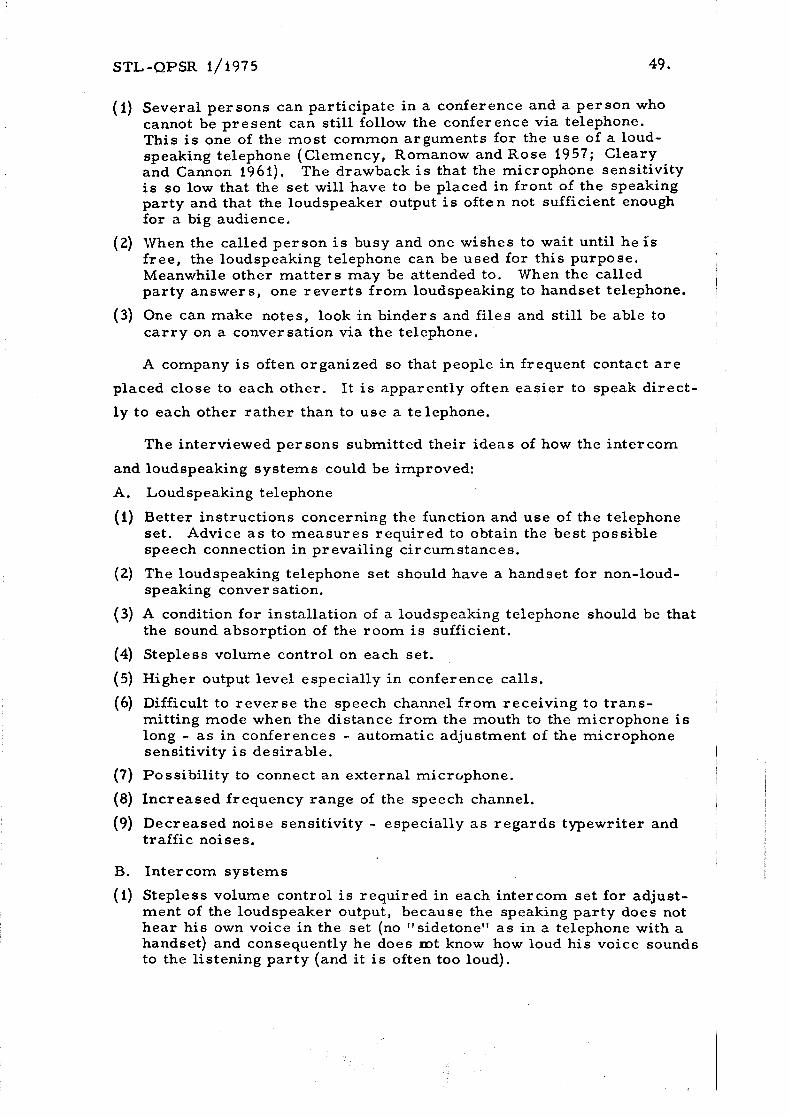
( I) Several per sons can participate in a conference and a pe r son who cannot be present can sti l l follow the conference via telephone. This i s one of the most common arguments for the use of a loud- speaking telephone (Clemency, Romanow and Rose 1957; Cleary and Cannon 1961). The drawback i s that the microphone sensitivity i s so low that the set will have to be placed in front of the speaking party and that the loudspeaker output is of ten not sufficient enough for a big audience.
(2) When the called person i s busy and one wishes to wait until he is f ree , the loudspeaking telephone can be used for this purpose. Meanwhile other ma t t e r s may be attended to. When the called I party answers , one r e v e r t s f rom loudspeaking to handset telephone.
(3) One can make notes, look in binders and fi les and sti l l be able to c a r r y on a conversation via the telephone.
A company is often organized so that people in frequent contact a r e
placed close to each other. I t is apparently often eas ie r to speak direct-
l y to each other r a the r than to use a telephone.
The interviewed per sons submitted their ideas of how the intercom
and loudspeaking sys tems could be improved:
A. Loudspeaking telephone
(1) Better instructions concerning the function and use of the telephone set. Advice a s to measures required to obtain the best possible speech connection in prevailing circumstances.
(2) The loudspeaking telephone set should have a handset for non-loud- speaking conversation.
(3) A condition for installation of a loudspeaking telephone should be that the sound absorption of the room i s sufficient.
(4) Stepless volume control on each set.
(5) Higher output level especially i n conference calls.
( 6 ) Difficult to r eve r se the speech channel f rom receiving to t rans- , mitting mode when the distance f rom the mouth to the microphone i s long - a s in conferences - automatic adjustment of the microphone sensitivity i s desirable. I
(7) Possibil i ty to connect a n external microphone. 1 (8) Increased frequency range of the speech channel. i (9) Decreased noise sensitivity - especially a s r ega rds typewriter and
traffic noises.
1
B. Intercom systems
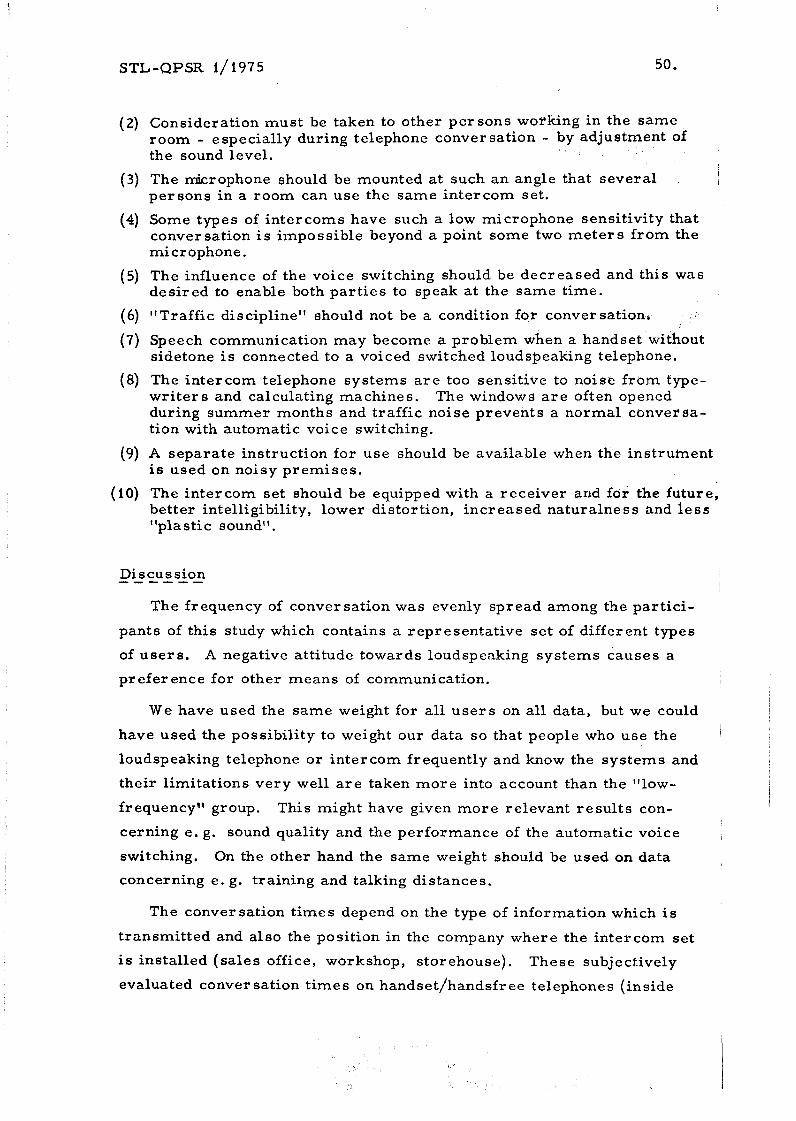
( I ) Stepless volume control is required in each intercom set for adjust- ment of the loudspeaker output, because the speaking party does not hear h is own voice in the set (no "sidetone" a s in a telephone with a handset) and consequently he does not know how loud h is voice sounds to the listening par ty (and i t i s often too loud).
STL-QPSR 1/1975 50.
(2) Consideration must be taken to other persons woiking in the same room - especially during telephone conver sation - by adjustment of the sound level.
(3) The microphone should be mounted a t such an angle that several I
1
per sons in a room can use the same intercom set.
(4) Some types of intercoms have such a low microphone sensitivity that conversation is impossible beyond a point some two m e t e r s f rom the microphone.
(5) The influence of the voice switching should be decreased and this was desired to enable both par t ies to speak a t the same time. I
I ( 6 ) "Traffic disciplinet' should not be a condition for conversation.
2 . ' I (7) Speech communication may become a problem when a handset without
sidetone i s connected to a voiced switched loudspeaking telephone,
(8) The intercom telephone systems a r e too sensitive to noise f rom type- wri ter s and calculating machine s . The windows a r e often opened during summer months and traffic noise prevents a normal conver sa- tion with automatic voice switching.
(9) A separate instruction for use should be available when the instruinent i s used on noisy premises .
(10) The intercom set should be equipped with a receiver and for the future, better intelligibility, lower distortion, increased naturalness and l e s s "plastic sound".
Discussion ------ I The frequency of conversation was evenly spread among the part ic i -
pants of this study which contains a representative set of different types
of users . A negative attitude towards loudspeaking systems causes a
prefer ence for other means of communication.
We have used the same weight for all u s e r s on a l l data, but we could
have used the possibility to weight our data so that people who use the
loudspeaking telephone o r inter corn frequently and know the sys tems and
their limitations very well a r e taken more into account than the "low-
frequency" group. This might have given more relevant r e su l t s con-
cerning e. g. sound quality and the performance of the automatic voice
switching. On the other hand the same weight should be used on data
concerning e. g. training and talking distances.
The conversation t imes depend on the type of information which is
transmitted and also the position in the company where the intercom set
i s installed (sales office, workshop, storehouse). These subjectively
evaluated conversation t imes on handset/handsfr ee telephones (inside
STL-QPSR 1/ 1975 51. i
and outside the PABX- exchange) agree with those measured objectively
(R . Ever s, Germany).
The figures on training show that some people a r e badly trained on
the handling of the set. If they had enough knowledge to set up a call,
they can use the loudspeaking telephone or intercom set, but they do not
know how to handle the set in highly reverberant and noisy environments
or the most suitable speech level and talking distance. The study shows
that most of the u s e r s get their information on handling the set by the I
directions f o r use, delivered with the telephone set. But this will soon
disappear if not glued to the set. A new employee does not then have the
same possibility to l ea rn the various functions and the use of the tele- I phone set without first being informed by a colleague. I n this instance
there i s a need to standardize the keys and the setting-up procedure in
intercom systems a s has been done in standard telephone systems. I
In spite of the advantages which the loudspeaking system gives, such
a s handsfree operation and that several people can take p a r t in a call,
there a r e disadvantages which account for a preference of using a hand- i I
set telephone in many cases . The choice of the handset is governed
by the following considerations:
- The accessibil i ty of the telephone system, directory etc.
- The ease of telephone communication in reverberant o r noisy environments ve r sus the false-operation of the automatic voice
1 switching.
- Pr iva te and psychological fac tors such a s disturbing a busy superior with an intercom call, confidential cal ls etc.
Possible means of improvements in future loudspeaking telephone I
and intercom systems fall into two main categories. The f i r s t one con-
cerns the sending and receiving sensitivity, e. g. the output level f rom the
loudspeaker should be manually adjustable or an automatic adjustment of
the microphone sensitivity could be incorporated. The second one i s that
the influence of noise and reverberat ion on the speech t ransmission should
be reduced in future systems.
Conclusion
This study elucidates the advantages and the disadvantages of hands-
f r e e telephone systems. The possibility to get in touch with somebody
quickly by an intercom set o r to reach a group of participants around a

STL-QPSR 1/1975 52.
loudspeaking telephone account for the appreciation loudspeaking systems
have received in public. Still there remain limitations under conditions I
of unfavorable room acoustics. Moreover individual spread in user s'
speech and hearing character is t ics cause deviations f rom optimal system
operation.
The average speech level of ta lkers va r i e s within a range of 15 dB(A).
f rom extreme low to extreme high voices. Generally the voice level is '
i ra i sed when using a loudspeaking telephone system. The range is about
10 dB(A) with an average of 7 dB(A). This increase i s an important fac-
tor to consider. Also the p re fe r red listening level may va ry with the
particular hearing of the listening par ty and his acoustic environment. I
Consequently many people want a stepless volume control on the tele-
phone se t s o r an automatic gain control in the system.
The problems connected with room acoustics a r e of two categories, I
room reverberat ion and environmental noise. The influence of reverbe-
ration sound transmitted f rom the talking p a r t y ' s end to the listening
party' s end can be scored by the rat io between the talking distance and
the reverberat ion radius. The reverberat ion radius depends on the total
absorption in the room and can be calculated when the volume and the
reverberat ion t ime of the room a r e known. The most frequently en-
countered noise is sound f rom vehicles and f rom typewriter s. The noise
both masks the transmitted speech and may cause false-switching in the , voice- switched amplifiers. I
The loudspeaking systems of today a r e developed to provide the best
quality for average people conversing with average levels in average
rooms where the noise levels a r e sufficiently low and reverberat ion t imes
short enough. In future systems these l imits on conversation will be ad-
justed to satisfy a wider group of people in a wider group of environments,
by m o r e advanced techniques a s well a s by better training of the u s e r s to
under stand the handling and the function of the systems. I
References:
A. S.A. (1969): "American national standard methods for the calculation of the articulation index", American National Standards Institute, , Inc. , 1430 Broadway, New York, N. Y. 100 18, January.
Barnes, G. J. ( 1972) : "Voice switching parameter s in telephon v', Electr . Communication 47, No. 3, p. 186. -
Beranek, L. L. (1947): "The design of speech communication system", P roc . of the I. R. E. Sept.
STL-QPSR 1/1975 53.
Beranek, L. L. (1949) : Acoustic Measurements , J. Wiley & Sons, Inc. , New York.
Beranek, L. L. (1971): Noise and Vibration Control, McGraw Hill, Inc . , New York.
Berldey, D. A. and Mitchell, 0. M. M. ( 1974): "Seeking the ideal in 'hands-free' telephonytt, Bell Labs Rec. - 52, No. 10, Nov., p. 318.
Bolt, R. H. and Roop, R. W. ( 1950): "Frequency response fluctuations in rooms t t , J.Acoust. Soc.Am. - 22, No. 2, March, p. 280.
Brandt, 0. (1958): Akustisk planering, , Handbok No. 1, Byggfor skningen, Stockholm.
Busala, A. (1960): "Fundamental considerations in the design of a voice- switched speakerphone", B. S. T. J . - 39, No. 2, March, p. 265.
C. C. I. T. T. (1968): "Question 17/XI1 - Loudspeaker telephones", IVth , Plenary Assemble, Mar del P la ta - 5.
Clarke, W. E. and Gale, J. ( i973): "A new look a t loudspeaking tele- phones", Telesis - 3, No. 3 , p. 79.
Cleary, R. T. and Cannon, T. G. (1961): "The new speakerphone - exe- cutive model", Automatic Electr ic Techn. J. - 7, No. 7, July, p. 232.
Clemency, W. F. and Goodale Jr. , l.7. D. (19 61): "Functional design of a voice-switched speakerphone", B. S. T. J . 40, No. 3, May, p. 649.
Clemency, W, F . , Romanow, F. F . , and Rose, A. F. (1957): "The Bell System speakerphonet1, A.I. E. E. Transac. - 76, P a r t 1, May, p. 148.
Copping, B. and Fidler , R . G. (1967): "Designing a voice- switched loud- speaking telephone - loudspeaking telephone no. 4", P o s t Office Electr ical Engineer ' s J. - 60, No. 1, April , p. 65.
Doak, P. E. (1959): "Fluctuations of the sound p r e s s u r e level i n rooms when the receiver positions i s varied", Acustica - 9, No. 1, p. 1.
!
Dunn, H. K, and Farnsworth, D. TI. (1939): "Exploration of p res su re field around the human head during speech", J. Acoust. Soc. Am. 10, p. 184.
Fletcher , H. (1953): Speech and Hearing in Communication, R. E. Krieger 1 Publ. Co. , New York. I
F le tcher , N. ( 1970): "Hands-free telephony. Kanata field r e sea rch t t 1 (Consulting Psychologist President , AFB System Resources, Box 452, Hudson Heights, P. Q . ) , unpubl. , Nov.
Galyas, K. ( 1969): "Loudspeaking telephone subscriber se t s t t , Electr . I
Communication 44, No. 1, p. 48.
Gardner, M. B. ( 1960): "A study of talking distance and related pa ramete r s in hands-free telephony", B. S. T. J . - 39, No. 6, Nov. , p. 1529. I
Gardner , M. B. ( 1964): "Effect of noise on listening levels in conference telephonyt1, J.Acoust. Soc.Am. 36, No. 12, Dec. , p. 2354. -
Gardner, M. B. (1966): "Effect of noise, system gain, and assigned task on talking levels in loudspeaker c o m r n ~ n i c a t i o n ~ ~ , J. Acoust. Soc. Am. 40, No. 5, p. 955. -
Gleiss , N. (1958): "Om talnivger i telefonnat", Tele No. 3, p. 232.
Gleiss , N. (1971): "Ljudoverforingens kvalitet. Inverkan av signalbrus- forhallande och handbredd", Tele No. 4, p. 42.

STL-QPSR 1/1975 54.
Heberle, W. (1968) : "Loudspeaking telephone versus standard handset", P r o c . of the 4th Int. Symp. on Human Fac to r s in Telephony, Bad-Wiessee, Sept. , p. 63.
Huggler, L. R. (1961): "A speakerphone system for l a rge conference rooms", Communication and Electronics 55, July, p. 237.
Huszty, D. ( 197 1): "The response of the electroacoustical chain and the , subjective sensation", Proc . of the 7th I. C. A. , Budapest, paper 2 6 G 2, p. 169. I
Knudsen, V. 0. and Har r i s , C. M. (1950): Acoustical Designing in Architecture, John Wiley & Sons, Inc. , New York.
I
Krokstad, A. ( 1963): "Psykoakustikk og romakustiske k r i t e r i e r I t ,
Elektronikklaboratoriet ved NTH, Rapport No. 17, LEA 6 , Dec. I I
Krokstad, A. (1967): "Lydfor sterkning, l i t t om grunnlag og systemer", Akustisk laboratorium, NTH-SINTEF, Teknisk rapport LEA 145. /
Larsson , 0. and Johansson, L. (1974): "Human behaviour when using voice switched loudspeaking telephones. Comparison with handset tele- phones", P roc . of the 7th Int. Symp. on Human Fac to r s in Tele- communication, Montreal, Sept.
Lochner, J. P. A. and Burger, J. F. (1961): "The intelligibility of speech under reverberant conditions", Acustica 11, No. 4, p. 195. -
Maddison, W. H. (1968): "A survey of telephone user performance", F roc . of the 4th Int. Symp. on Human Fac to r s in Telephony, Bad- Wiessee Sept., p. 512.
Peterson, A. P. G . and G r o s s Jr. , E. E. (1963): Handbook o f ~ o i s e Measurement, General Radio Co. , West Concord, Mass.
I I R ichards, D. L. (1973): Telecommunication by Speech - The Trans-
mission Fer formance of Telephone Networks, Butterworth & Co. , i I
Ltd. , Londofi.
Richardson, E. G. (1953): Technical Aspects of Sound, Elsevier Publ. Co. , London.
Schroeder, M. R. and Kuttruff, K. H. ( 1962) : "On frequency response curves in rooms. Comparison of experimental, theoretical and Monte Carlo r e su l t s for the average frequency spacing be- ween maxima", J.Acoust. Soc.Am. 34, No. 1, Jan. p. 76. -
Suntop, M. A. (1974): "New loudspeaking tele hone", 1974 IEEE Intercon Technical P a p e r s , March. , Paper 21 2. P
Takeda, T. and Kondoh, H. (1 97 2) : "Loudspeaker conference telephone", N. E. C. Research and Development, No. 26, July, p. 79.
I
Webster, J. C. (1965): "Speech communications a s l imited by ambient noisett , J .Acoust. Soc.Am. 37, No. 4, April, p. 692. -
Reichard, G. V'J. and Breeden, R . L. (1973): "The 4A speakerphone - A hands-down winner", Bell Labs Rec. 51, No. 8, Sept., p. 233. -