field service report eaton electrical services and system ... · pdf fileperiodic tests, both...
TRANSCRIPT

Field Service Report Eaton Electrical Services and System
March 31, 2017
Attention
Luis Castro
Facilities Superintendent
Abbott Vascular Costa Rica
Reference number EESS-SE007-17
Attached you will find the report with the summary of the actions taken on December
26, 2016,
As part of scheduled preventive maintenance to two pedestal transformers in Abbott
Vascular located in the Coyol Free Zone of Alajuela.
In this document the activities performed, the result of electrical tests, physical
analysis
Chemical, comments, conclusions and recommendations.
Sincerely
Fray J. Carrillo Fonseca Field Service Technician
Phone: +506 2247-7679
Cellphone: +506 88370865
DC:
Jose G Cardenas C
EESS Manager - CA
Eaton Engineering Service & Systems
Telephone +50766121199, +5072002010
Page 2
Field Service Report 2
TECHNICAL REPORT "Preventive Maintenance Two transformers. "
Property of:
Abbott.
Requested by:
Ricardo Brenes.
Coordinator:
Fray Carrillo Fonseca
Date of work:
December 28, 2016

Page 3
Field Service Report 3
CONTENT INDEX OF FIGURES ............................................... ..................................................
................................ 5
TABLE OF CONTENTS ...............................................
.................................................. .................................. 6
1. INTRODUCTION............................................... ..................................................
................................ 7
2. DESCRIPTION OF THE WORK PERFORMED. ..................................................
.............................. 8
2.1. Visual inspection. .................................................. ..................................................
8
2.2. Transformation Relationship Test. ..................................................
...................................... 8
2.3. Insulation Resistance Test. ..................................................
........................................ 9
2.4. Winding Resistance Test. ..................................................
.......................................... 9
2.5. Power Factor Test. ..................................................
.................................................. 9
2.6. Dielectric and Physical-Chemical Analysis ............................................
............................................ 10
2.7. Dissolved Gas Chromatography ..............................................
................................................ 10
3. ANALYSIS OF RESULTS. ..................................................
.............................................. eleven
3.1. Transformer 11JC561840001. ..................................................
............................................... 12
3.1.1.
Visual Inspection 11JC561840001. ..................................................
................................... 13
3.1.2.
Transformation Ratio Test 11JC561840001. .................................................. 13
3.1.3.
Insulation Resistance Test 11JC561840001. .................................................. 14
3.1.4.
Winding Resistance Test 11JC561840001. .................................................. ..... 17
3.1.5.
Power Factor Test 11JC561840001. .................................................. ................. 19

3.1.6.
Dielectric and Physical-Chemical Analysis
11JC561840001. .................................................. ... twenty
3.1.7.
Dissolved Gas Chromatography 11JC561840001. ..................................................
......... twenty-one
3.2. Transformer 11JC561840002. ..................................................
............................................... 24
3.2.1.
Visual Inspection 11JC561840002. .................................................. 25
Page 4
Field Service Report 4
3.2.2.
Transformation Ratio Test 11JC561840002. .................................................. 25
3.2.3.
Insulation Resistance Test 11JC561840002. .................................................. 26
3.2.4.
Winding Resistance Test 11JC561840002. .................................................. ..... 29
3.2.5.
Power Factor Test 11JC561840002. .................................................. .................. 31
3.2.6.
Dielectric and Physical-Chemical Analysis
11JC561840002. .................................................. 32
3.2.7.
Dissolved Gas Chromatography 11JC561840002. .................................................. 33
4. CONCLUSIONS ............................................... ..................................................
.............................. 36
4.1. Transformer 11JC561840001. ..................................................
............................................... 36
4.2. Transformer 11JC561840002. ..................................................
............................................... 36
5. FINAL RECOMMENDATIONS. ..................................................
................................................. 38
6. ANNEXES. .................................................. ..................................................
........................................ 39
6.1. Certificates of equipment calibration. .................................................. 39
6.1.1.
Megger S1-1052 Testing Equipment. ..................................................
.................................. 39

6.1.2.
Test Equipment OMICRON CPC 100. ...........................................
.................................. 42
6.2. Laboratory Tests of Oils. .................................................. 44
Page 5
Field Service Report 5
INDEX OF FIGURES Figure 1. Historical Transformation Relationship
11JC561840001. .................................................. 14
Figure 2. Insulation resistance vs. resistance curve. Time
11JC561840001. .............................................. 16
Figure 3. Historical Insulation Resistance
11JC561840002. .................................................. 16
Figure 4. Historical Winding Resistance Primary
11JC561840001. .................................................. 18
Figure 5. Historical Winding Resistance Secondary
11JC561840001. .............................................. 18
Figure 6. Historical Isolation Power Factor
11JC561840001. .................................................. 19
Figure 7. Historical Oil Dielectric Strength and Water Content
11JC561840001. ........................ twenty
Figure 8. Historical Number of Neutralization and Specific Gravity
11JC561840001. ........................... twenty-one
Figure 9. Historical Interfacial Voltage and Color
11JC561840001. .................................................. ............. twenty-one
Figure 10. Historical Gas Chromatography in Oil
11JC561840001. .............................................. 22
Figure 11. TGC History in Oil 11JC561840001. ..................................................
.......................... 2. 3
Figure 12. Historical Transformation Relationship
11JC561840002. .................................................. 26
Figure 13. Insulation resistance vs. resistance curve. Time
11JC561840002. ............................................ 28
Figure 14. Historical Insulation Resistance
11JC561840002. .................................................. 28
Figure 15. Primary Winding Resistance History
11JC561840002. ................................................ 30
Figure 16. Historical Winding Resistance Secondary
11JC561840002. ............................................ 30

Figure 17. Historical Isolation Power Factor
11JC561840002. .................................................. 31
Figure 18. Historical Oil Dielectric Strength and Water Content 11JC561840002. 32
Figure 19. Historical Number of Neutralization and Specific Gravity
11JC561840002. 33
Figure 20. Historical Interfacial Voltage and Color
11JC561840002. .................................................. 33
Figure 21. Historical Gas Chromatography in Oil
11JC561840002. .............................................. 3. 4
Figure 22. TGC History in Oil 11JC561840002. ..................................................
.......................... 35
Page 6
Field Service Report 6
TABLE OF CONTENTS
Table 1. Equipment data 11JC561840001. ..................................................
............................................... 12
Table 2. Summary Visual Inspection 11JC561840001. ..................................................
.............................. 13
Table 3. Transformation Ratio Test 11JC561840001. ..................................................
........... 13
Table 4. Insulation Resistance 11JC561840001. ..................................................
.............................. fifteen
Table 5. Winding Resistance 11JC561840001. ..................................................
................................ 17
Table 6. Power Factor 11JC561840001. ..................................................
............................................ 19
Table 7. Physical-Chemical Analysis 11JC561840001. ..................................................
................................ twenty
Table 8. Dissolved Gas Chromatography
11JC561840001. .................................................. 22
Table 9. Equipment data 11JC561840002. ..................................................
............................................... 24
Table 10. Summary Visual Inspection
11JC561840002. .................................................. 25
Table 11. Transformation Ratio Test 11JC561840002. ..................................................
25
Table 12. Insulation Resistance 11JC561840002. ..................................................
............................ 27

Table 13. Winding Resistance 11JC561840002. ..................................................
.............................. 29
Table 14. Power Factor 11JC561840002. ..................................................
......................................... 31
Table 15. Physical-Chemical Analysis
11JC561840002. .................................................. .............................. 32
Table 16. Dissolved Gas Chromatography
11JC561840002. .................................................. ................. 3. 4
Page 7
Field Service Report 7
1. INTRODUCTION Transformers are usually very reliable equipment. However, as the
Aging and approaching the end of their useful life, their components wear out and the
probability of
Failure grows The main problems are the deterioration of cellulose and the movement
of the core and
Windings. Other problems can also be caused by faults, such as wear of parts of the
Tap changer, false contacts, high moisture contents in the oil, among others.
Periodic tests, both electrical and exploratory, are used to monitor the
Condition of the isolation and to evaluate the remaining life of the
equipment. However, a
Clear engineering judgment to discern whether the estimated remaining life
guarantees future functioning
Fault-free.
The comparisons of results obtained between one and another period of tests carried
out,
As the most detailed historical analyzes over extended periods of testing over the
years, are a
An important tool in formulating a series of successful conclusions about a team
specific. Therefore, a graphic study of the behavior of results in the diagnoses
Preventive measures taken to a team, becomes of vital importance to determine a
possible latent failure
Or indicate a corrective maintenance to follow.
ENERPOT, SA, in order to always provide the best and most detailed service to its
customers,
Incorporates as an added value, a graphic study detailing each test carried out, where
Evaluate the results obtained for each transformer after being tested, analyzed and
Diagnosed. This graphic historical study will allow us to establish a trend about life

Of the equipment under observation, as well as to define a better and more specific list
of
Recommendations and steps in preventive or corrective maintenance.
In this report the status of the following equipment is announced:
• Transformer pedestal type, ABB brand, 2500 kVA, 11JC561840001 series.
• Transformer pedestal type, ABB brand, 2500 kVA, 11JC561840002 series.
Located at the moment of the test in the facilities of Abbott, in Zona Franca El Coyol,
Alajuela.
Page 8
Field Service Report Referring to Fig.
2. DESCRIPTION OF THE WORK PERFORMED. This section describes the tests performed, as well as the different jobs
Made to processors. Tests 2.2 to 2.5 correspond to electrical tests, while 2.6
and 2.7 relate to testing the insulating oil, made by SD Myers in Ontario, Canada,
Testmark
Laboratories Ltd., which has ISO / IEC 17025: 2005 accreditation, issued by
Canadian
Association for Laboratory Accreditation INC. (CREEK).
2.1 Visual inspection.
At the beginning of the work, a general inspection is carried out on the state of the
equipment, taking into
External wiring status, leaks, paint condition, corrosion occurrence,
Different measurement indicators present in the equipment, among others.
Equipment used: Not applicable.
Security for testing: Barricades and PPE (personal protective equipment).
2.2. Transformation Relationship Test.
The test is performed according to the ANSI / IEEE standard C57.12.90-2010.
In new transformers it must be carried out in all positions of the tap changer.
For transformers in use it is not recommended to manipulate the device in field tests,
this must
Only be operated to vary the voltage when required by plant arrangements.
It must be verified its general condition or that the client so requires and under his
responsibility. If he
Is manipulated by operational needs, it is recommended to
Of contact resistance in the new position.
By means of the application of tension between two terminals allows us to identify
shorts between turns,
Damage to the switch (Tap) and wrong positions of the switch. The limits for this test
according to IEEE

C57.12.00 are ± 0.5% of the nominal.
This test also detects the polarity and the angular displacement (diagram
Phasorial) at the same time.
Equipment used: Omicron CPC 100.
Security for testing: Barricades and EPP.
Page 9
Field Service Report Referring to Fig.
2.3 Insulation Resistance Test.
The test is performed according to the ANSI / IEEE standard C57.12.90 - 2010.
It consists of applying voltage in direct current for a period of time determined to the
Insulation system and thus measure the resistance between windings and between
each winding and earth.
The results are plotted for a better appreciation and are compared with the theoretical
minimum, which is
Obtains from the formula for minimum insulation resistance, SD Myers Inc.
Equipment used: meghometro Megger brand, model S1-1052.
Security for testing: Barricades and EPP.
2.4. Winding Resistance Test.
The test is performed according to the ANSI / IEEE standard C57.12.90 - 2010.
The values measured by this test can be used in the detection of windings
Shorted, weak joints, false contacts and changes in windings due to alterations in the
Capacitance. The ideal would be to compare these data with those of factory or those
obtained in previous tests,
But if they are not available, a consistency must be expected in the values of each of
the phases
(Difference not greater than 5%), or compare them with another identical unit.
Team: Omicron CPC 100.
Security for testing: Barricades and EPP.
2.5. Power Factor Test.
The test is performed according to the ANSI / IEEE standard C57.12.90 - 2010.
The values obtained are used to create a measurement history and compare the results
With the first data obtained from the transformer.
The values measured by this test indicate the quality at the level of internal insulation
Of the transformer and the amount of leakage current is evaluated through the
winding system, since it is
Very sensitive to the presence of water and oxidation products generated by the oil
and therefore,
Verifies whether there are paths for the leakage current and the heat losses dissipated
in heat, which results

In chemical deterioration, damage due to overheating, presence of moisture.
It is a test that complements and gives greater assurance of the oil test analysis
Such as Physical-Chemical Analysis and Gas Chromatography.
Equipment used: Omicron CPC 100.
Security for testing: Barricades and risk EPP electrical contact
Page 10
Field Service Report 10
2.6. Dielectric and Physical-Chemical Analysis
For the extraction of the oil sample, the ASTM method D 923 - 97 is applied.
It consists of executing a series of monitor tests essential for a diagnosis
The situation of the transformer, this in regard to its necessity of maintenance,
because by means of
They can quantify the two enemies of the insulation paper, ie the percentage of water
in the paper and
The degree of impregnation therein of the oxidation products generated by the oil.
Equipment: hoses and connection fittings, bottles sample storage.
Security for testing: Barricades and EPP.
2.7. Dissolved Gas Chromatography
For the extraction of the oil sample the method ASTM D 3613 - 98 is applied.
It is an oil analysis that is based on the breakdown of hydrocarbon molecules
Both in oil and in cellulose due to the presence of some type of thermal or electric
failure. The
Gases produced by this break can be collected in a sample of oil taken
Appropriately, and be analyzed by highly sensitive methods.
Equipment: hoses and connection fittings, syringes sample storage.
Security for testing: Barricades and EPP.
Page 11
Field Service Report eleven
3. ANALYSIS OF RESULTS. It starts by presenting the plate data of each tested equipment, to later analyze the
Values collected through the different tests. We present a set of tables, each one
Identified with the name of the respective test, as well as the corresponding
explanation and diagnosis
Of the results obtained. Finally the behavior of each test is observed with the passage
of the
weather.

Page 12
Field Service Report 12
3.1. Transformer 11JC561840001.
Table 1. Equipment data 11JC561840001.
Project N ° 1254
Date 28-12-16
Client: Abbott
Coordinator: David Villamil
Location: Free Zone El Coyol
Work performed:
Characteristic
Value
Position
Voltage (V) Serial number
11JC561840001
1
36225
Field identification
T2
2
35363
Brand
ABB
3
34500
Kind
Pedestal
4
33638
Manufacturing date
APR2011
5
32775
Power (kVA)
2500

Primary Voltage (V)
34500/19920
Secondary Voltage (V)
480/277
Short Circuit Impedance (%)
5.91
Basic Impulse Level (kV)
150-30
Total Mass
15855 lb
Amount of Insulating Liquid
606 Gal
Type of Insulating Liquid
BIOTEMP
Material Windings
Cuckoo
Changer Position
3
Connection Diagram Connection Group: Yyn0
Derivation Changer Preventive Maintenance
Transformer plate data
Page 13
Field Service Report 13
3.1.1. Visual Inspection 11JC561840001.
In Table 2 the information gathered by the visual inspection is
summarized. Everything points
To a team working in satisfactory conditions.
Table 2. Summary Visual Inspection 11JC561840001. 3.1.2. Transformation Ratio Test 11JC561840001.
The test was performed at position C of the shunt changer, which was found in
the same. Table 3 shows the data collected.
Table 3. Transformation Ratio Test 11JC561840001. The deviation shown in the results obtained is satisfactory, being 0.06% with
With respect to the theoretical value. The range allowed by the regulation is ±
0.5%, to remain within the
Acceptable ranges, it is guaranteed that the equipment does not have adjacent short
circuit

Cause transformer secondary side voltages or overheating.
Notes
Hits
Leaks
Painting
Corrosion
Others:
Oil level
Temp. oil:
40
or C
Max. Temp. oil:
51
or C
Temp windings:
ND
Internal Pressure
3 psi
Yes
Do not
Yes
Do not
Okay
Deteriorated
Yes
Do not
Okay
Low
Phase, Tap V prim. Nom. Vsec. Nom. Rel. Nom.
Relationship A 003
34500.0V
480.0V
71,875: 1 999.63V 0.0 ° 13.900144V ° 71.9151 0.02: 1 0.06% -60.68 ° 0.003822A
B 003
34500.0V
480.0V
71,875: 1 1000.36V0.0 ° 13.909964V 0.0 ° 71.9168: 1 0.06% -64.74 ° 0.005868A
C 003
34500.0V

480.0V
71,875: 1 999.64V 0.0 ° 13.899995V ° 71.9166 0.02: 1 0.06% -61.06 ° 0.003994A
I prim.
V prim.
Vsec.
Page 14
Field Service Report 14
Transformation Relationship History 11JC561840001.
Figure 1. Historical Transformation Relationship 11JC561840001. It is observed that the transformation ratio has remained very constant throughout the
3 years
In analysis, always within the established ranges, close to the theoretical value. It is
concluded that the result
test is satisfactory.
3.1.3. Insulation Resistance Test 11JC561840001.
For the type of configuration of the windings, which corresponds to
a Yyn0 connection with
Primary and secondary levels internally bound, it was possible to perform only the test
that
Determines the resistance existing between the primary plus secondary to ground. The
test was performed at
1000 V DC. Values obtained are shown in Table 4.
To interpret the data correctly, the minimum insulation resistance value
With the measurement (corrected) made after the first minute. This value was 1.52
GΩ, exceeding the
calculated theoretical minimum of 0552 GΩ.
Page 15
Field Service Report fifteen
Table 4. Insulation Resistance 11JC561840001. As far as the polarization index is concerned, an assessment of positive insulation is
which is within the range of acceptability corresponding to 1.25 to 2.0, indicating that
the current
Leakage rate does not increase at a faster rate with the increase in voltage, which
would indicate contamination or
Damaged insulation; whereas although the absorption rate was below 1.4, this
Condition alone is not decisive in identifying the general state of the insulation.
Finally, in Figure 2 the graph of resistance against time is observed. In the same

Shows an increasing tendency throughout the test, sign of a system of insulation in
good condition.
Room temp:
33.7 ° C
Relative Humidity: 33%
Temp windings:
40 ° C
V dc applied
T (min)
Measured value
Corrected Value
Measured value
Corrected Value
Measured value
Corrected Value
0.25
0247
0.976
---
---
---
---
0.50
0.317
1.25
---
---
---
---
0.75
0.358
1.41
---
---
---
---
1
0.386
1.52
---
---

---
---
2
0.447
1.77
---
---
---
---
3
0.481
1.90
---
---
---
---
4
0.503
1.99
---
---
---
---
5
0.520
2.05
---
---
---
---
6
0.535
2.11
---
---
---
---
7
0.546
2.16
---

---
---
---
Referring to Fig.
0.556
2.20
---
---
---
---
Referring to Fig.
0.565
2.23
---
---
---
---
10
0.573
2.26
---
---
---
---
Rmin GΩ
IA
IP
1000
---
---
Connection
Primary + secondary to mass
---
0.552
---
---
---
GΩ
---
---
1.22

---
---
1.48
---
---
Page 16
Field Service Report 16
Figure 2. Insulation resistance vs. resistance curve. Time 11JC561840001.
History of Insulation Resistance 11JC561840001.
Figure 3. Historical Insulation Resistance 11JC561840002. There is an irregular behavior in the historical curve of insulation resistance. As
In the previous tests, values were obtained close to the recommended minimum, but
the
Have come close to initial values. In this test, external conditions, such as
Humidity, temperature, dust, among others, can influence the results obtained. Despite
the
Page 17
Field Service Report 17
Variations, it is observed that the values are far from recommended minimums, so that
the current reality
Is that the equipment has a system of isolation in perfect conditions.
Thus, we conclude that the test result is positive.
3.1.4. Winding Resistance Test 11JC561840001.
Since resistance values vary with temperature, all measurements must be
Converted to a common temperature so they can be compared and interpreted
properly. Because
most factory tests are performed at 75 ° C, this value is used as reference. Table 5
the results of this test, including adjustment for 75 or C is.
Table 5. Winding Resistance 11JC561840001. In the measurements corresponding to the primary side, higher values are shown than
the
Obtained in the secondary, as expected (due to the size and quantity of conductor), but
Note that in both cases there is consistency between phases, with differences of no
more than 5%, which is
Translates into no loose spots or bad contact. The most accurate diagnosis is made
Compare the data with the factory or previous tests.
H1-H0

H2-H0
H3-H0
X1-X0
X2-X0
X3-X0
I test: N / a
N / a
N / a
6.0A
6.0A
6.0A
V test: N / a
N / a
N / a
0.0019464V
0.0018829V
0.0018563V
R measurement: 1.200973Ω
1.163893Ω
1.16738Ω
0.0003244Ω
0.00031382Ω 0.00030938Ω
T measurement: 29.5 ° C
28.0 ° C
28.8 ° C
31.1 ° C
31.3 ° C
31.7 ° C
T reference: 75.0 ° C
75.0 ° C
75.0 ° C
75.0 ° C
75.0 ° C
75.0 ° C
R compensated: 1.4075676Ω
1.37188909Ω 1.37182638Ω 0.00037792Ω 0.00036532Ω 0.00035961Ω

Primary winding
Secondary winding
Temperature Compensation for Copper:
Page 18
Field Service Report 18
Historical Winding Resistance 11JC561840001.
Figure 4. Historical Winding Resistance Primary 11JC561840001.
Figure 5. Historical Winding Resistance Secondary 11JC561840001. In general, a behavior is practically invariable, with consistency between phases,
Which means that there is no deterioration in the transformer internal windings or
connections.
It is determined that the state of the transformer with respect to the winding resistance
is
acceptable.
Page 19
Field Service Report 19
3.1.5. Power Factor Test 11JC561840001.
The test data are summarized in Table 6.
Table 6. Power Factor 11JC561840001. As can be seen, the value registered power factor is 0.47%, below 1%
Recommended for transformers in use. In this way, it can be affirmed that the liquid
Transformer is found with low levels of moisture and oxidation.
Isolation Power Factor History 11JC561840001.
Figure 6. Historical Isolation Power Factor 11JC561840001. Results are identical to those of the tests carried out the previous year, which indicates
that the
Good insulation system conditions are maintained.
The test result is acceptable.
K
I do not accept
You too
humidity
Relative 0.64
40.0 ° C
33.0 ° C
0.3%

Proof
V test (V) V output (V) I output (mA)
Frequency
(Hz)
Cp (nF)
PF (%)
Evaluation CH + L
1,000
1,001
6.113444
60
16.203599
0.47%
Acceptable
Compensation
Temperature:
Page 20
Field Service Report twenty
3.1.6. Dielectric and Physical-Chemical Analysis 11JC561840001.
As shown in Table 7, the analysis indicates that the oil is normal condition
Of operation, all measured variables are acceptable, the overall picture of the test is
that the oil
Is in good physical - chemical condition.
Table 7. Physical-Chemical Analysis 11JC561840001. History of Physical-Chemical Analysis 11JC561840001.
Figure 7. Historical Oil Dielectric Strength and Water Content 11JC561840001.
Unity
Measured value
State KV / 2.54mm
54
Acceptable Mg KOH / g
0.07
Acceptable 0.92
Acceptable MN / m

31
Acceptable 1.5
Acceptable Any
Acceptable Mg / kg (ppm)
60
Acceptable Interfacial tension
Color
Sediments
Water Content
Proof Dielectric strength
Neutralization Number
Specific Gravity
Page 21
Field Service Report twenty-one
Figure 8. Historical Number of Neutralization and Specific Gravity
11JC561840001.
Figure 9. Historical Interfacial Voltage and Color 11JC561840001. According to the graphs above, most of the parameters have been kept within ranges
With the limits established in the 4 periods under study, with the observations of
That the color is a little above the ideal. In addition, the low Interfacial voltage has
returned to
Yield a satisfactory result, which allows to discard problems in the oil.
After analyzing the behavior of the physical and chemical parameters of the oil in the
4
registered periods is concluded that the test result is acceptable.
3.1.7. Dissolved Gas Chromatography 11JC561840001.
In Table 8, the gas content identified by the test CDG is.
As can be seen, there is a slightly elevated concentration of Carbon Dioxide while
The other compounds are within the normal ranges, so that a behavior of
Normal operation.
Page 22
Field Service Report 22

Table 8. Dissolved Gas Chromatography 11JC561840001. History of Gas Chromatography 11JC561840001. We compare the tests performed in the years detailed above.
Figure 10. Historical Gas Chromatography in Oil 11JC561840001.
Analyzed gases
Condition Oxygen (O2)
1,610
-
Nitrogen (N2)
64,400
-
Hydrogen (H2)
32
1
Carbon Monoxide (CO)
214
1
Methane (CH4)
fifteen
1
Ethylene (C2 H4)
7
1
Etane (C2 H6)
4
1
Acetylene (C2 H2)
0
1
Carbon Dioxide (CO2)
2,970
2 272
1
Concentration (ppm) FUEL GAS SUBTOTAL (ppm)
TOTAL GASES (PPM) Condition 1: Normal. Condition 2: Observation. Condition 3: High level, set
trend. Condition 4: Excessive decomposition, possible transformer failure.
69,252

Page 23
Field Service Report 2. 3
Figure 11. TGC History in Oil 11JC561840001. According to the two graphs above, the concentration of the different gases has shown
small
Changes over time, which means that the team keeps working
Internal faults.
After analyzing the behavior of the parameters of generation of oil gases in the
periods available, it is concluded that the test result is acceptable.
Page 24
Field Service Report 24
3.2. Transformer 11JC561840002.
Table 9. Equipment data 11JC561840002.
Project N ° 1254
Date 28-12-16
Client: Abbott
Coordinator: David Villamil
Location: Free Zone El Coyol
Work performed:
Characteristic
Value
Position
Voltage (V) Serial number
11JC561840002
1
36225
Field identification
T1
2
35363
Brand
ABB

3
34500
Kind
Pedestal
4
33638
Manufacturing date
APR2011
5
32775
Power (kVA)
2500
Primary Voltage (V)
34500/19920
Secondary Voltage (V)
480/277
Short Circuit Impedance (%)
5.94
Basic Impulse Level (kV)
150-30
Total Mass
15855 lb
Amount of Insulating Liquid
606 Gal
Type of Insulating Liquid
BIOTEMP
Windings material
Cuckoo
Position Changer
3
Derivation Changer Preventive Maintenance
Data plate transformer
Connection Diagram Connection Group: Yyn0
Page 25
Field Service Report 25
3.2.1. Visual inspection 11JC561840002. In Table 10 the information gathered by the visual inspection is summarized. All

points to a team working under satisfactory conditions.
Table 10. Summary Visual Inspection 11JC561840002.
3.2.2. Transformation ratio test 11JC561840002. The test was conducted at the C tap changer, which was where he found
the same. In Table 11 the data collected is.
Table 11. Transformation Ratio Test 11JC561840002. The deviation shown in the results obtained is satisfactory, being a 0.06% with
of the theoretical value. The range allowed by the regulation is ± 0.5% , to remain
within the
acceptable ranges ensures that the device does not have adjacent turns shorted
deficiencies cause tensions on the secondary of the transformer or heating.
Notes
Hits
leakage
Painting
Corrosion
Others:
Oil level
Temp. oil:
40
or C
Max. Temp. oil:
55
or C
Temp windings:
ND
Internal pressure
3 psi
Yes
Do not
Yes
Do not
Okay
deteriorated
Yes
Do not
Okay
Low
Phase Tap
V prim. nom. Vsec. nom. Rel. Nom.
Divert relationship.

A 003
34500.0V
480.0V
71,875: 1 999.56V 0.0 ° 0.0 ° 71.9157 13.899057V: 1 0.06% 0.004219A -62.58 °
B 003
34500.0V
480.0V
71875: 1
998.7V 0.0 ° 0.0 ° 13.886845V 71917: 1 0.06% 0.006191A -65.41 °
003 C
34500.0V
480.0V
71,875: 1 1000.15V 0.0 ° 13.907237V ° 71.9158 0.02: 1 0.06% 0.004277A -62.02 °
I prim.
V prim.
Vsec.
Page 26
Field Service Report 26
Historical Transformation Ratio 11JC561840002.
Figure 12. Historical Relationship Transformation 11JC561840002. It is observed that the transformation ratio has remained very similar over the 3 years
analysis, always within established ranges, close to the theoretical value. It is
concluded that the result of
the test is satisfactory .
3.2.3. Insulation Resistance test 11JC561840002. For the type of configuration of the windings, which corresponds to a
connection Yyn0 , with
primary and secondary neutral united internally, it was possible only proof
determines the resistance between the secondary mass to the primary set. The test was
performed
1000 V DC . In Table 12 values obtained are shown.
To correctly interpret the data, the value of minimum insulation resistance compared
with the measurement (corrected) performed after the first minute. This value
was 1.52 GΩ , exceeding the
calculated theoretical minimum of 0552 GΩ .
Page 27
Field Service Report 27

Table 12. Insulation Resistance 11JC561840002. Regarding the polarization index, an evaluation of the positive insulation is made, and
which is within the range of acceptability corresponding to 1.25 to 2.0 , indicating that
the current
leakage does not increase at a faster rate with increasing voltage, which would
indicate contamination or
insulation damaged; whereas although the rate of absorption was found below 1.4 ,
this
condition is not decisive by itself to identify the condition of the insulation.
Finally, in Figure 13 the graph of resistance against time is observed. In the same
It shows a growing trend throughout the test, sign of an insulation system in good
condition.
Ambient temp:
33.7 ° C
Relative Humidity: 33%
Temp windings:
40 ° C
V dc applied
T (min)
Measured value
Fixed value
Measured value
Fixed value
Measured value
Fixed value
0.25
0.262
1.03
---
---
---
---
0.50
0.325
1.28
---
---
---
---
0.75
0.360

1.42
---
---
---
---
1
0.385
1.52
---
---
---
---
2
0.440
1.74
---
---
---
---
3
0.463
1.83
---
---
---
---
4
0.490
1.94
---
---
---
---
5
0.505
1.99
---
---
---
---
6

0.518
2.05
---
---
---
---
7
0.529
2.09
---
---
---
---
Referring to Fig.
0.539
2.13
---
---
---
---
Referring to Fig.
0.548
2.16
---
---
---
---
10
0.556
2.20
---
---
---
---
Rmin GΩ
IA
IP
1.18
---
---
1.44
---
---
---
---
GΩ
---
---
Connection
Primary + Secondary ground
---
0.552
---
1000
---
---
Page 28
Field Service Report 28
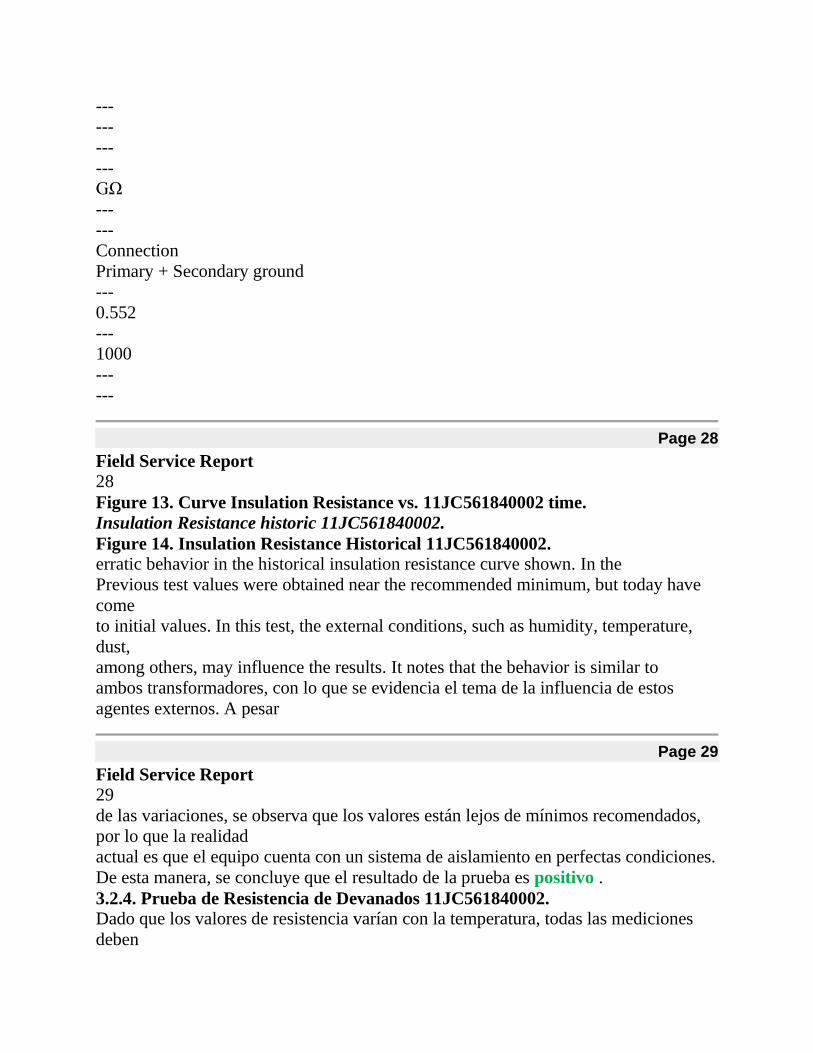
Figure 13. Curve Insulation Resistance vs. 11JC561840002 time. Insulation Resistance historic 11JC561840002.
Figure 14. Insulation Resistance Historical 11JC561840002. erratic behavior in the historical insulation resistance curve shown. In the
Previous test values were obtained near the recommended minimum, but today have
come
to initial values. In this test, the external conditions, such as humidity, temperature,
dust,
among others, may influence the results. It notes that the behavior is similar to
ambos transformadores, con lo que se evidencia el tema de la influencia de estos
agentes externos. A pesar
Page 29
Field Service Report 29
de las variaciones, se observa que los valores están lejos de mínimos recomendados,
por lo que la realidad
actual es que el equipo cuenta con un sistema de aislamiento en perfectas condiciones.
De esta manera, se concluye que el resultado de la prueba es positivo .
3.2.4. Prueba de Resistencia de Devanados 11JC561840002. Dado que los valores de resistencia varían con la temperatura, todas las mediciones
deben

convertirse a una temperatura común para poder ser comparadas e interpretadas
adecuadamente. Because
que la mayoría de pruebas en fábrica se realizan a 75°C , se utiliza ese valor como
referencia. En la Tabla
13 the results of this test, including the setting shown for 75 or C .
Table 13. Windings 11JC561840002 resistance. Higher values are shown in the measurements corresponding to the primary side, that
obtained in the secondary, as expected (due to the greater amount of conductive), but
Note that in both cases there is consistency between phases, with differences not more
than one to 5% , which is
results in no weak points or making poor contact. The most accurate diagnosis is
made to
compare data with factory or previous tests.
H1-H0
H2-H0
H0-H3
X1-X0
X2-X0
X3-X0
I test: N / a
N / a
N / a
6.0A
6.0A
6.0A
V test: N / a
N / a
N / a
0.0019317V
0.0018588V
0.0018099V
R as: 1.151666Ω
1.172239Ω
1.219717Ω
0.00032195Ω
0.0003098Ω
0.00030165Ω
T measurement:

34.2 ° C
34.1 ° C
34.1 ° C
34.3 ° C
34.7 ° C
34.8 ° C
T reference: 75.0 ° C
75.0 ° C
75.0 ° C
75.0 ° C
75.0 ° C
75.0 ° C
R compensated: 1.3262127Ω
1.35040539Ω 1.40509948Ω 0.00037061Ω 0.00035609Ω
0.0003466Ω
Primary winding
Secondary winding
Temperature compensation for Copper:
Page 30
Field Service Report 30
11JC561840002 historic winding resistance.
Figure 15. Primary winding resistance Historical 11JC561840002.
Figure 16. Secondary Winding Resistance Historical 11JC561840002. In general, a behavior with slight variations, consistent between phases is shown,
which is
results in that there is no deterioration in the windings or transformer internal
connections.
It is determined that the status of the transformer with respect to the winding
resistance is
acceptable.
Page 31
Field Service Report 31
3.2.5. Power Factor test 11JC561840002. The test data are summarized in Table 14 .
Table 14. Power Factor 11JC561840002. The value registered power factor is 0.46% , below 1% recommended for

transformers in use. Thus, we can say that the liquid insulation transformer
encounters low humidity and oxidation.
History Insulation Power Factor 11JC561840002.
Historical Figure 17. Insulation Power Factor 11JC561840002. The results obtained in this test have a great difference from the
above, which you can rule out problems in the insulation system equipment. The
results
obtained in 2015, possibly were influenced by some external element when
k
T oil
You too
humidity
relative 0.64
40.0 ° C
35.4 ° C
0.29%
Proof
Test V (V) V output (V) I output (mA)
Frequency
(Hz)
Cp (nF)
PF (%)
Evaluation CH + L
1,000
1,000
6.063949
60
16.087311
0.46%
Acceptable
Compensation
Temperature:
Page 32
Field Service Report 32
the measurement, but the current diagnosis is that the oil is free agents
contaminants.
The test result is acceptable .

3.2.6. Dielectric and Physical-Chemical 11JC561840002 analysis. As shown in Table 15 , the analysis indicates that the oil condition is
normal operation, all variables measured are acceptable, the overall picture of the test
is that
oil is in good physical - chemical conditions.
Table 15. Physical Analysis - Chemical 11JC561840002. History 11JC561840002 Physico-chemical analysis.
Historical Figure 18. Dielectric oil and water content 11JC561840002.
Unity
Measured value
State kV / 2.54mm
47
Acceptable mgKOH / g
0.07
Acceptable 0.915
Acceptable mN / m
33
Acceptable 1.5
Acceptable Any
Acceptable mg / kg (ppm)
88
Acceptable
Proof Dielectric strength
Neutralization number
Specific gravity
Interfacial tension
Color
sediment
Water content
Page 33
Field Service Report 33

Historical Figure 19. Number of Neutralization and Specific Gravity
11JC561840002.
Historical Figure 20. Interfacial Tension and Color 11JC561840002. According to the graphs above, most of the parameters have remained within the
ranges
acceptable, complying with the limits in the 5 study periods with observations
the color is slightly above the ideal. The dielectric strength is maintained near the
boundary
recommended.
After analyzing the behavior of physical and chemical parameters of the oil in 5
registered periods is concluded that the test result is acceptable.
3.2.7. Dissolved Gas Chromatography 11JC561840002. In Table 16 , the gas content identified by the test CDG is.
As it has been happening since the first tests, a significant concentration of noticeable
Acetylene. This is discussed further in historic gases.
Page 34
Field Service Report 3. 4
Table 16. Dissolved Gas Chromatography 11JC561840002. History 11JC561840002 Gas Chromatography. tests conducted in the years listed above are compared.
Historical Figure 21. Gas Chromatography in 11JC561840002 oil.
gases analyzed
Condition Oxygen (O2)
562
-
Nitrogen (N2)
63,200
-
Hydrogen (H2)
84
1
Carbon Monoxide (CO)
260
1
Methane (CH4)
twenty
1
Ethylene (C2H4)
31
1
Ethane (C2H6)
5
1
Acetylene (C2H2)
14
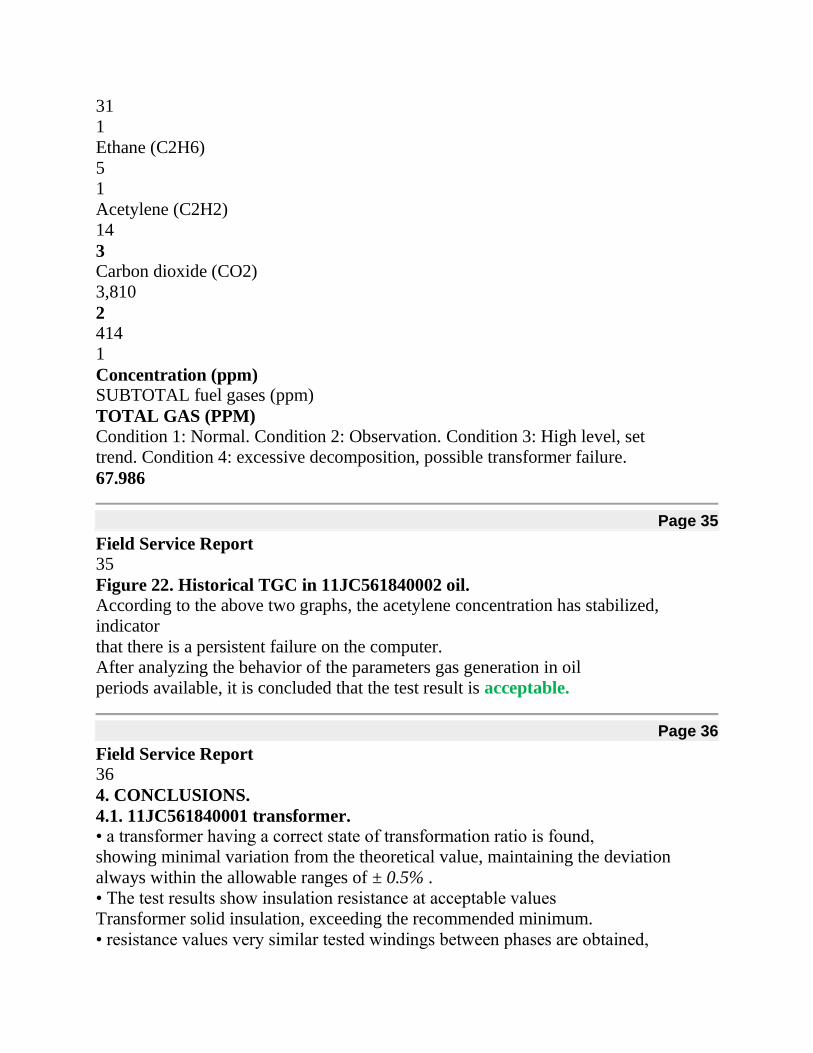
3 Carbon dioxide (CO2)
3,810
2 414
1
Concentration (ppm) SUBTOTAL fuel gases (ppm)
TOTAL GAS (PPM) Condition 1: Normal. Condition 2: Observation. Condition 3: High level, set
trend. Condition 4: excessive decomposition, possible transformer failure.
67.986
Page 35
Field Service Report 35
Figure 22. Historical TGC in 11JC561840002 oil. According to the above two graphs, the acetylene concentration has stabilized,
indicator
that there is a persistent failure on the computer.
After analyzing the behavior of the parameters gas generation in oil
periods available, it is concluded that the test result is acceptable.
Page 36
Field Service Report 36
4. CONCLUSIONS.
4.1. 11JC561840001 transformer. • a transformer having a correct state of transformation ratio is found,
showing minimal variation from the theoretical value, maintaining the deviation
always within the allowable ranges of ± 0.5% .
• The test results show insulation resistance at acceptable values
Transformer solid insulation, exceeding the recommended minimum.
• resistance values very similar tested windings between phases are obtained,

maintaining consistency in each of the internal connections of the transformer, this
being consistent with test data from previous years, providing a result that
It ensures that no point is weak or lazy.
• Proof of capacitance and power factor yielded values of insulation system
with low levels of oxidation and / or moisture.
• Dielectric physico-chemical and dielectric oil in the transformer conditions
acceptable for four periods analyzed, giving the rating of good oil condition.
• The results of gas chromatography show gas levels within normal, the
overview of the analysis is that the team works free of faults.
4.2. 11JC561840002 transformer. • a transformer having a correct state of transformation ratio is found,
showing minimal variation from the theoretical value, maintaining the deviation
always within the allowable ranges of ± 0.5% .
• The test results show insulation resistance at acceptable values
Transformer solid insulation, exceeding the recommended minimum.
• resistance values very similar tested windings between phases are obtained,
maintaining consistency in each of the internal connections of the transformer, this
being consistent with test data from previous years, providing a result that
It ensures that no point is weak or lazy.
• Proof of capacitance and power factor yielded values of insulation system
with low levels of oxidation and / or humidity, in contrast to previous tests.
Page 37
Field Service Report 37
• Dielectric physico-chemical and dielectric oil in the transformer conditions
acceptable for five periods analyzed, giving the rating of good oil
condition. Noticeable
the dielectric strength is maintained close to the ideal limit.
• The results of gas chromatography show a large concentration of acetylene,
but the history of gases can identify that there is an increase, therefore, no failure
persistent on the computer. The overview of the analysis is that it operates
satisfactorily.
Page 38
Field Service Report 38
5. Final recommendations. • Periodically review conditions of load and temperature, to thereby identify the
time of occurrence of any malfunction.
• Programming electrical tests to observe any anomalies in the functioning of the

transformers, as changes in output voltages, warm-ups, among others. Should not
occurrence thereof, made each year is recommended to maintain a correct program
preventive maintenance.
• Perform physical and chemical analysis annually to observe the behavior of the
different
oil parameters and thereby detect the deterioration thereof by the work that is
subjected
transformer and perform timely corrective actions.
• Perform chromatographic analysis of dissolved gases in oil at least once a year, so
possible to monitor the rate at which gases are generated, so you can identify potential
internal faults.
Sincerely:
DC. Archive.
Page 39
Field Service Report 39
6. ATTACHMENTS.
6.1. Certificates of calibration of equipment.
6.1.1. Test Equipment Megger S1-1052.
Page 40
Field Service Report 40
Page 41
Field Service Report 41
Page 42
Field Service Report 42
6.1.2. Testing equipment OMICRON CPC 100.
Page 43
Field Service Report 43
Page 44
Field Service Report

44
6.2. Laboratory tests Oils.
Page 45
Field Service Report Four. Five
Page 46
Field Service Report 46
Page 47
Field Service Report 47