field performance of concrete admixtures sd department of transportation office of research field...
TRANSCRIPT
SD97-09-FR
SD Department of TransportationOffice of Research
Field Performance of Concrete AdmixturesStudy SD97-09
Final Report - revised
Prepared by
South Dakota School of Mines and Technology501 East St. Joseph StreetRapid City, SD 57702 June 1998
Connecting South Dakota and the Nation
DISCLAIMER
The contents of this report reflect the views of the authors who are responsible for the facts andaccuracy of the data presented herein. The contents do not necessarily reflect the official views orpolicies of the South Dakota Department of Transportation, the State Transportation Commission, orthe Federal Highway Administration. This report does not constitute a standard, specification, orregulation.
ACKNOWLEDGMENTS
This work was performed under the supervision of the SD97-09 Technical Panel:
John Adler ...................................Operations SupportJon Becker ....................................Office of ResearchMark Clausen ................................................. FHWATerry Coomes ...........................W.R. Grace ProductsRon Dahme.......................................Mitchell RegionGreg Fuller ..........................................Bridge Design
Dan Johnston................................ Office of ResearchRon McMahon ..................... Materials and SurfacingJim Meyer ................................ W.R. Grace ProductsClaus Smith......................................Dacotah CementTom Woodden ............................. Rapid City Region

2
TECHNICAL REPORT STANDARD TITLE PAGE1. Report No.
SD97-09-F2. Government Accession No. 3. Recipient's Catalog No.
4. Title and Subtitle
Field Performance of Concrete Admixtures5. Report Date
June 30, 1998
6. Performing Organization Code
7. Author(s)
Dr. M. R. Hansen & Ms. Brenda L. Flottmeyer8. Performing Organization Report No.
9. Performing Organization Name and Address
South Dakota School of Mines and Technology 501 East St. Joseph Street Rapid City, SD 57702
10. Work Unit No.
11. Contract or Grant No.
310563
12. Sponsoring Agency Name and Address
South Dakota Department of Transportation Office of Research 700 East Broadway Avenue Pierre, SD 57501-2586
13. Type of Report and Period Covered
Final; February 1998 - June 1998
14. Sponsoring Agency Code
15. Supplementary Notes
An executive summary of this report is published as SD97-09X.
16. Abstract
This project investigated compatibility problems involving two concrete admixtures from W.R. Grace Products andDacotah portland cement. The problems experienced by the South Dakota Department of Transportation (SDDOT)were described as rapid slump loss, premature stiffening, and low compressive strengths. The materials investigated inthis report are commonly used by the SDDOT in concrete construction projects.
The research objectives were met by performing mortar and concrete flow table tests to verify compatibility betweenDacotah cement and a high-range water-reducing admixture (HRWRA) and a retarder. The flow table tests were alsoused to determine an optimum time of addition for the admixtures. A five factorial statistical design to create thirty-three concrete mix designs was used in an effort to reproduce a compatibility problem. Finally, a field demonstrationproject was conducted to verify compatibility between the cement and admixtures under field conditions. Maximumdosages of each admixture was used in an attempt to create a compatibility problem.
The mortar flow table test of Type V cement and HRWRA exhibited an optimum time of addition of the admixture tobe at four minutes. The retarder showed no effect on the flow table results. Concrete mortar flow table results showedan improved performance with delayed addition of both the HRWRA and retarder. Analysis of the 33 concretemixtures showed no general incompatibility between the cement and admixtures when the manufacturers recommendedmixing procedures were followed. The field demonstration displayed incompatibility between the cement and bothadmixtures; however both admixtures were used at the maximum recommended dosages.17. Keywords
Rapid slump loss, premature stiffening, lowcompressive strengths, compatibility, concreteadmixtures
18. Distribution Statement
No restrictions. This document is available to the publicfrom the sponsoring agency.
19. Security Classification (of this report)
UnclassifiedSecurity Classification (of this page)
Unclassified21. No. of Pages
3622. Price

3
TABLE OF CONTENTS
TECHNICAL REPORT STANDARD TITLE PAGE ........................................................... 2
TABLE OF CONTENTS ...................................................................................................... 3
LIST OF FIGURES .............................................................................................................. 4
LIST OF TABLES ............................................................................................................... 5
1.0 EXECUTIVE SUMMARY ....................................................................................... 6
2.0 PROBLEM DESCRIPTION ...................................................................................... 10
3.0 OBJECTIVES ............................................................................................................ 10
4.0 TASK DESCRIPTION .............................................................................................. 114.1 Research Task 1 ............................................................................................. 114.2 Research Task 2 ............................................................................................. 114.3 Research Tasks 3 and 4 .................................................................................. 12
4.3.1 Cement ............................................................................................... 124.3.2 Chemical Admixtures ........................................................................ 13
4.3.2.1 High-Range Water-Reducing Admixtures ............................. 134.3.2.2 Retarder Admixture ................................................................ 134.3.2.3 Air-Entraining Admixture ...................................................... 13
4.3.3 Aggregate ........................................................................................... 134.3.4 Mortar Flow Table Tests .................................................................. 154.3.5 Concrete Flow Table Tests................................................................ 184.3.6 Five Factorial Central Composite Statistical Design........................ 19
4.4 Research Tasks 5 and 7 ................................................................................ 264.4.1 Field Demonstration ......................................................................... 264.4.2 Time of Set ....................................................................................... 29
4.5 Research Tasks 6 and 8 ................................................................................ 324.6 Research Task 9 ........................................................................................... 324.7 Research Task 10 ......................................................................................... 324.8 Research Task 11 ......................................................................................... 324.9 Research Task 12 ......................................................................................... 32
5.0 FINDINGS AND CONCLUSIONS ......................................................................... 33
6.0 IMPLEMENTATION AND RECOMMENDATIONS ........................................... 347.0 REFERENCES ......................................................................................................... 36
APPENDICESRegional Admixture Questionnaire and Results ......................................... 37Detailed Concrete Batch Properties and Test Results .................................. 37Using Chemical Admixtures - How and When ............................................ 37

4
LIST OF FIGURES
Number Page
Fig. 1 Mortar flow table test - Type I/II and HRWRA............................. 16
Fig. 2 Mortar flow table test - Type I/II and Retarder.............................. 16
Fig. 3 Mortar flow table test - Type V and HRWRA............................... 17
Fig. 4 Mortar flow table test - Type V and Retarder................................ 17
Fig. 5 Hand sieved concrete mortar flow table test results usingType V cement and HRWRA............................................. 18
Fig. 6 Hand sieved concrete mortar flow table test results usingType V and Retarder.......................................................... 19
Fig. 7 Histogram of change in slump in the 33 concrete mixtures.......... 23
Fig. 8 Histogram of change in air content for the 33 concrete mixtures.. 24
Fig. 9 Histogram of the 28-day compressive strength of the33 concrete mixtures........................................................... 24
Fig. 10 Compressive strength of field specimens cast during field demonstration at Dacotah Cement, Rapid City, SD.......………….28
Fig. 11 Time of set during field demonstration as a function of time ofdelay of the retarder admixture.......................................... 30
5
LIST OF TABLES
Number Page
Table 1 Results from the characterization of aggregates used inlaboratory tests and field demonstration project.................. 14
Table 2 Independent variables and experimental regions............................ 20
Table 3 Template of independent variables for the 33Concrete mixtures................................................................ 21
Table 4 The highest 28-day compressive strengths of each block............. 25
Table 5 Delay time for addition of admixtures........................................... 27
Table 6 Compressive strengths of field specimens and labspecimens cast during the field demonstration................... 29
Table A1 Regional questionnaire results from the sixsurrounding states.............................................................App A
Table B1 Detailed concrete batch properties and wet and hardenedconcrete test results...........................................................App B

6
1.0 EXECUTIVE SUMMARY
South Dakota Department of Transportation (SDDOT) field personnel have experienced
concrete performance problems on construction projects. These problems have been identified as rapid
slump loss, premature stiffening, and low compressive strengths. As a result, laboratory testing was
conducted by the SDDOT Office of Research in 1992. SDDOT Study No. SD92-07 - “Evaluation of
the Performance of Set Retarders and High-Range Water Reducers in Typical SDDOT Concrete
Mixes” investigated these concrete performance problems by conducting a series of laboratory tests.
The conclusion that resulted from this study was that the concrete performance problems experienced
by SDDOT field personnel were the result of a compatibility problem between the cement and
admixtures.
Ongoing concrete performance problems on SDDOT construction projects has compelled the
SDDOT to make a decision to implement a directive prohibiting the use of many chemical admixtures.
To resolve the concrete performance problems, SDDOT contracted with the South Dakota School of
Mines and Technology (SDSM&T). Three primary objectives were involved in this research project.
First, to determine if the problems experienced by the SDDOT were the result of a compatibility
problem between Dacotah brand portland cement having the higher C3S content and selected
admixtures. A Type V Dacotah cement was chosen as the primary cement for this research project
because of its lower C3A content and its increased likelihood of causing compatibility problems. Once
the results of the research are determined, SDSM&T would provide written guidelines to SDDOT field
personnel on the use of water-reducers, high-range water-reducing admixtures, set retarders and set
accelerators. Finally, these guidelines could then serve an educational purpose to familiarize DOT
field personnel and contractors in South Dakota with the use of admixtures and their applications
The objectives were accomplished with a combination of gathering literature and regional
admixture usage data, laboratory, and field tests. A major portion of the research project focused on
determining if a compatibility problem exists between Dacotah brand portland cement and the
admixtures selected by SDDOT personnel.
7
FINDINGS AND CONCLUSIONS
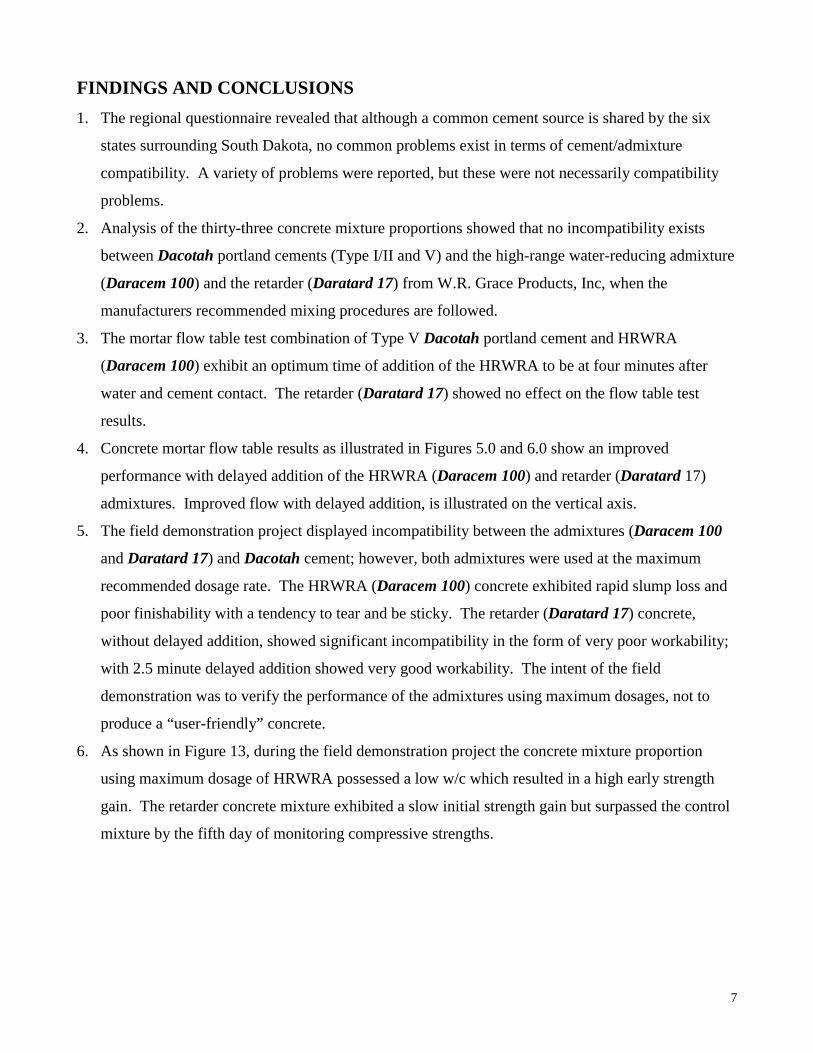
1. The regional questionnaire revealed that although a common cement source is shared by the six
states surrounding South Dakota, no common problems exist in terms of cement/admixture
compatibility. A variety of problems were reported, but these were not necessarily compatibility
problems.
2. Analysis of the thirty-three concrete mixture proportions showed that no incompatibility exists
between Dacotah portland cements (Type I/II and V) and the high-range water-reducing admixture
(Daracem 100) and the retarder (Daratard 17) from W.R. Grace Products, Inc, when the
manufacturers recommended mixing procedures are followed.
3. The mortar flow table test combination of Type V Dacotah portland cement and HRWRA
(Daracem 100) exhibit an optimum time of addition of the HRWRA to be at four minutes after
water and cement contact. The retarder (Daratard 17) showed no effect on the flow table test
results.
4. Concrete mortar flow table results as illustrated in Figures 5.0 and 6.0 show an improved
performance with delayed addition of the HRWRA (Daracem 100) and retarder (Daratard 17)
admixtures. Improved flow with delayed addition, is illustrated on the vertical axis.
5. The field demonstration project displayed incompatibility between the admixtures (Daracem 100
and Daratard 17) and Dacotah cement; however, both admixtures were used at the maximum
recommended dosage rate. The HRWRA (Daracem 100) concrete exhibited rapid slump loss and
poor finishability with a tendency to tear and be sticky. The retarder (Daratard 17) concrete,
without delayed addition, showed significant incompatibility in the form of very poor workability;
with 2.5 minute delayed addition showed very good workability. The intent of the field
demonstration was to verify the performance of the admixtures using maximum dosages, not to
produce a “user-friendly” concrete.
6. As shown in Figure 13, during the field demonstration project the concrete mixture proportion
using maximum dosage of HRWRA possessed a low w/c which resulted in a high early strength
gain. The retarder concrete mixture exhibited a slow initial strength gain but surpassed the control
mixture by the fifth day of monitoring compressive strengths.

8
7. As illustrated in Figure 14, the time of set test conducted during the field demonstration,
on the concrete mixture proportion having a maximum dosage, exhibited a 34 hour initial
set with a 2.5 minute delay prior to adding the retarder. Note: The ambient temperature
was approximately 42° F and given warmer conditions the time of set would be
significantly less.
8. Broad guidelines can only suggest in advance which admixture could or should be used.
Written guidelines to trouble-shoot any problem encountered with concrete are not
possible due to the multitude of components and conditions which can affect concrete.
Experience with a particular mixture is the best avenue to success.
9. Workability or other problems can occur any time, due to many things other than
incompatibility.
IMPLEMENTATION AND RECOMMENDATIONS
1. Cement/admixture performance problems should be evaluated on a case by case basis. Prior to
incorporating an admixture into a concrete mixture, laboratory testing followed by a field trial
to verify its compatibility and performance under field conditions should be done.
2. Incorporating admixtures into a concrete mixture proportions requires knowledge by all parties
from the design engineer to the concrete finisher. A preconstruction educational session is
strongly recommended. A higher level of quality control must be enforced when working with
admixtures.
3. Anytime a chemical or mineral admixture is used in a concrete mixture a higher level of
quality control is required before, during, and after construction.
4. The existing admixture section in the SDDOT Specification Handbook is very broad and
general and provides no clarification on the use of chemical admixtures. The following
guidelines are proposed as changes to the SDDOT Specification Handbook, Section 752
“Chemical Admixtures for Concrete”:
• Dosage rates should be utilized within the manufacturers recommendations to achieve the
best performance level.
• Laboratory tests to verify performance of the admixture should be performed followed by
test pours.
• Test pours should be conducted to simulate field conditions while using the exact materials
and testing procedures that will be implemented during the construction.

9
• If concrete performance problems do occur the addition of the admixture may be delayed as
feasible.
• Mix designs and test results with statistical analysis per ACI shall be submitted to the
engineer for approval.
5. Investigate the use of high-performance concrete, utilizing chemical and mineral
admixtures, in South Dakota.
6. Only use mix designs that have an acceptable documented performance history. This will
be an important part of the new contractor QA/QC requirements. Do not include any
admixtures that do not have a proven performance record.
7. The focus of this project was to determine if there was a general compatibility problem between
Dacotah cement and two admixtures, a high-range water-reducing admixture (Daracem 100) and
a retarder (Daratard 17). This task was successfully accomplished. Step two, which is not part of
this research project, should be to optimize the concrete mix design for maximum performance and
minimum cost with and without appropriate admixtures.

10
2.0 PROBLEM DESCRIPTION
South Dakota Department of Transportation (SDDOT) field personnel have experienced
concrete performance problems on construction projects. These problems have been identified as rapid
slump loss, premature stiffening, and low compressive strengths. As a result, laboratory testing was
conducted by the SDDOT Office of Research in 1992. SDDOT Study No. SD92-07 - “Evaluation of
the Performance of Set Retarders and High-Range Water Reducers in Typical SDDOT Concrete
Mixes” investigated these concrete performance problems by conducting a series of laboratory tests.
The conclusion that resulted from this study was that the concrete performance problems experienced
by SDDOT field personnel were the result of a compatibility problem between the cement and certain
admixtures.
Ongoing concrete performance problems on SDDOT construction projects has compelled the
SDDOT to make a decision to implement a directive prohibiting the use of many chemical admixtures.
To resolve the concrete performance problems, SDDOT contracted with the South Dakota School of
Mines and Technology (SDSM&T) to determine if the problems experienced by the SDDOT were the
result of a compatibility problem between the cement and admixtures. Once the results of the research
are determined, SDSM&T would provide written guidelines for use by SDDOT field personnel on the
use of chemical admixtures. These guidelines could then serve an educational purpose for SDDOT
personnel, contractors, and ready-mix producers working on SDDOT projects.
3.0 OBJECTIVES
The first objective of this research was to investigate the compatibility of the selected
admixtures and Dacotah brand portland cement having the higher C3S content. Two admixtures were
specified by SDDOT personnel for detailed investigation. Most of the effort in this project was to try
to find the compatibility problems reported by SDDOT personnel in the lab and field. If compatibility
problems were found, then an attempt would be made to “solve” the problem by delayed addition of
the admixture.
The second objective was to develop a set of guidelines for routine use of admixtures, including
water-reducers, high-range water-reducing admixtures, set retarders and set accelerators. The final
objective was to familiarize SDDOT field personnel and contractors in South Dakota with the use of
admixtures and their applications.

11
4.0 TASK DESCRIPTION
4.1 Research Task 1
Task 1 comprised of meeting with the technical panel to review the project scope and discuss
work plan. On February 14, 1997 a research contract between the South Dakota Department of
Transportation and the South Dakota School of Mines and Technology was signed.
4.2 Research Task 2
Task 2 involved several subtasks such as collecting information by means of a literature
review, compiling information from admixture products and technical literature, and examining the
SDDOT specifications. The final subtask was to prepare a questionnaire for surrounding states to
request information of problems encountered using primarily high-range water-reducing admixtures
and retarders.
A literature review was conducted to gather information on a compatibility problem. Several
sources agreed that compatibility problems do occur due to the fact that every type of cement will not
be compatible with ever type of admixture. Another important point of the literature review was that
many concrete performance problems are haphazardly reported as compatibility problems between
cement and admixtures when in reality the real problem may have been incorrect batching procedure or
a malfunction of the ready-mix plant.
To examine regional admixture usage, a questionnaire was developed to collect information
such as the types of cement and admixtures used in each state. The questionnaire primarily focused on
high-range water-reducing and retarder admixtures. Appendix A contains the questionnaire and
tabulated results. The questionnaire was compiled and mailed to the state surrounding South Dakota
(North Dakota, Minnesota, Iowa, Nebraska, Wyoming, and Montana). Two of six states do not use
retarders or high range water-reducing admixtures. Two states commented on problems using certain
combinations of cement and chemical admixtures but did not target a specific cement or admixture.
One similarity seen across all six states was the use of cement from Holnam cement company. States
that experienced problems with rapid slump loss or premature stiffening reported that lack of agitation
such as the use of a dump truck for paving purposes. This problem addressed the source of the
problem and did not attribute this to a compatibility problem between a certain type of cement and an
admixture. In general, no common problems were apparent among the six states surveyed.

12
4.3 Research Tasks 3 and 4
Duties for tasks 3 and 4 were as follows:
1. obtain materials such as cement, aggregates, and admixtures,
2. characterize aggregates for gradation, specific gravity, and absorption,
3. perform lab tests to find and control compatibility problems,
4. perform lab tests using the new Dacotah cement with a higher C3S content in present
SDDOT mixes, and
5. develop a work plan to performing tests such as time of set, flow table tests, air content,
slump, temperature, unit weight, and compressive strengths at 1, 3, 7, and 28 days.
To accomplish these tasks, first the materials were obtained for the research project. The
decision was made with SDDOT personnel to investigate only one high-range water-reducing
admixture and one retarder from W.R. Grace Products. These were selected because it was the most
common admixture used by the SDDOT. It should be noted that, the way this project evolved, the
majority of the effort was to try to find the suspected compatibility problem. Below are the research
materials used for this project.
4.3.1 Cement
Dacotah portland cement manufactured by the South Dakota Cement Plant in Rapid City,
South Dakota is the primary source of cement used during construction of projects for the South
Dakota Department of Transportation (SDDOT). Two types of portland cement were selected for this
research project. The first type is a Type I/II type of portland cement commonly used by the SDDOT.
The second type is a Type V portland cement which has a somewhat different chemical composition.

13
4.3.2 Chemical Admixtures
The chemical admixtures to be tested were selected based on the products currently used by the
SDDOT. A high-range water-reducing admixture(Daracem 100) and a retarder(Daratard 17) from
W.R. Grace Products, Inc. were chosen for this research. The admixtures were used at maximum
dosage rates in an effort to create the problematic symptoms experienced by the SDDOT.
4.3.2.1 High-Range Water-Reducing Admixture
A high-range water-reducing admixture (HRWRA) named Daracem 100 from W.R. Grace
Products was used for this research project. The purpose of using a HRWRA is to increase slump to
produce a flowing concrete which is beneficial when used in heavily reinforced structures such as
bridge columns. Another benefit of using a HRWRA is that a lower water-cement ratio can be utilized
which in turn produces higher compressive and flexural strengths.
The addition rate recommended by W.R. Grace Product literature is variable based on job
requirements. A normal dosage range is between 325 to 1300 mL/100 kg (5 to 20 oz/100 lb) of
cement.
Use of this HRWRA in the lower dosage range meets requirements for an ASTM C494 Type F
high-range water-reducing admixture. In the upper dosage range, it meets the requirements for an
ASTM 494 Type G water-reducing, high-range and retarding admixture.
4.3.2.2 Retarder Admixture
A retarder admixture named Daratard 17 from W.R. Grace Products, Inc. was selected for this
research. Daratard 17 is an aqueous solution of hydroxylated organic compounds. Retarders are used
on projects where high temperatures or extended setting times are primary factors.
The addition rate recommended by W.R. Grace Product literature varies between 130 to 520
mL/100 kg (2 to 8 fl oz/100 lb) of cement. Daratard 17 complies with ASTM C 494, Type D
admixture.
4.3.2.3 Air-Entraining Admixture
An air-entraining admixture name Daravair 1000 from W.R. Grace Products was selected to be
used in all laboratory and field tests. The addition rate recommended by W.R. Grace Product literature
varies between 50 to 200 mL/100 kg (3/4 to 3 fl oz/100 lbs) of cement.
4.3.3 Aggregates
Three-quarter inch maximum Minnekahta limestone was used for the coarse aggregate. The
fine aggregate consisted of well-graded sand acquired from Oral, South Dakota. Fine and coarse
aggregates used solely for laboratory testing were obtained from Pete Lien, Inc., Rapid City, South

14
Dakota. Fine and coarse aggregate used during the field demonstration portion of this project samples
were obtained from Birdsall Sand and Gravel in Rapid City, South Dakota.
The next step after the selection of the research materials was to characterize the aggregates.
Aggregate was characterized according to ASTM C 127 and C 128; specific gravity and absorption,
ASTM C 566; moisture, and ASTM C 136; sieve analysis. Results from the sieve analysis can be seen
in reference 1. Results from the characterization of the coarse and fine aggregate are illustrate in Table
1.
Table 1 Results from the characterization of aggregates used in laboratory tests and field demonstration project.
SpecificAggregate Aggregate Aggregate Aggregate Source Moisture Gravity Absorption
Type Size (%) (%)Coarse Minnekahta limestone 3/4 in. Birdsall Sand & Gravel, Rapid City, SD 0.14 2.71 0.72Coarse Minnekahta limestone 3/4 in. Pete Lien, Inc., Rapid City, SD 0.48 2.82 0.77
Fines Sand well-graded Birdsall Sand & Gravel, Rapid City, SD 2.66 2.61 1.08Fines Sand well-graded Pete Lien, Inc., Rapid City, SD 1.73 2.60 1.11
The next three duties for tasks 3 and 4 were combined within several tests.
• To perform laboratory tests to find and control the compatibility problem between the
cement and admixtures,
• utilize the new Dacotah cement, and
• to develop a work plan to performing tests such as time of set, flow table tests, air content,
slump, temperature, unit weight, and compressive strengths at 1, 3, 7, and 28 days.
These tests were a series of mortar flow table tests, hand-sieved concrete mortar flow table tests, and
the use of a five factorial statistical design method to create a variety of concrete mixtures. Note that
the time of set test was incorporated into Task 5 (Field Demonstration).
15
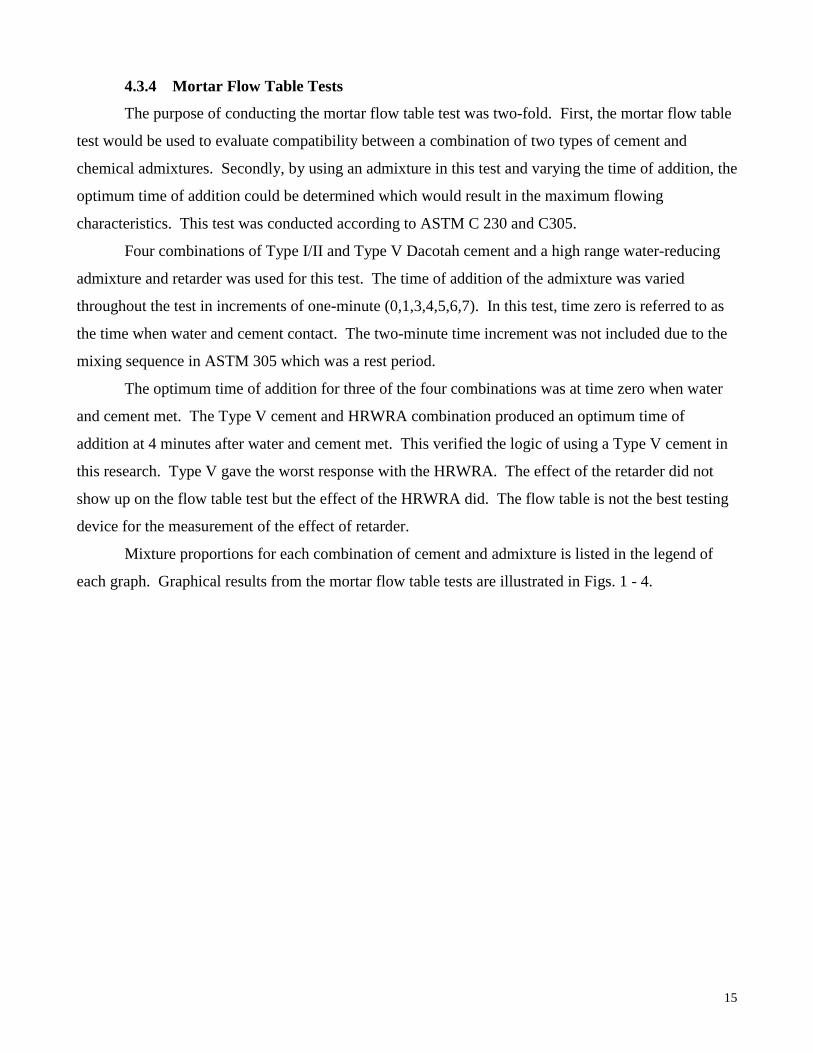
4.3.4 Mortar Flow Table Tests
The purpose of conducting the mortar flow table test was two-fold. First, the mortar flow table
test would be used to evaluate compatibility between a combination of two types of cement and
chemical admixtures. Secondly, by using an admixture in this test and varying the time of addition, the
optimum time of addition could be determined which would result in the maximum flowing
characteristics. This test was conducted according to ASTM C 230 and C305.
Four combinations of Type I/II and Type V Dacotah cement and a high range water-reducing
admixture and retarder was used for this test. The time of addition of the admixture was varied
throughout the test in increments of one-minute (0,1,3,4,5,6,7). In this test, time zero is referred to as
the time when water and cement contact. The two-minute time increment was not included due to the
mixing sequence in ASTM 305 which was a rest period.
The optimum time of addition for three of the four combinations was at time zero when water
and cement met. The Type V cement and HRWRA combination produced an optimum time of
addition at 4 minutes after water and cement met. This verified the logic of using a Type V cement in
this research. Type V gave the worst response with the HRWRA. The effect of the retarder did not
show up on the flow table test but the effect of the HRWRA did. The flow table is not the best testing
device for the measurement of the effect of retarder.
Mixture proportions for each combination of cement and admixture is listed in the legend of
each graph. Graphical results from the mortar flow table tests are illustrated in Figs. 1 - 4.

16
Mortar Flow Table Test using
Type I/II Dacotah Cement and Daracem 100 (HRWRA)
0102030405060708090
100110120130140150
0 1 2 3 4 5 6 7
Time of Delay of Addition (min)
Flo
w (
%)
Control Mix
Type I/II = 740 g
Sand = 2035 g
Water = 400 mL
HRWRA = 9.6 mL
Blows = 10
Fig. 1 Mortar flow table test results using Type I/II Dacotah portland cement and a high-range water-reducing admixture (Daracem 100).
Mortar Flow Table Test using
Type I/II Dacotah Cement and Daratard 17 (Retarder)
0
10
20
30
40
50
60
70
80
90
100
110
120
130
140
150
0 1 2 3 4 5 6 7
Time of Delay of Addition (min)
Flo
w (
%)
Control
Type I/II = 740 g
Sand = 2035 g
Water = 450 mL
Retarder = 4.0 mL
Blows = 10
Fig. 2 Mortar flow table test results using Type I/II Dacotah portland cement and a retarder(Daratard 17).

17
Mortar Flow Table Test using
Type V Dacotah Cement and Daracem 100 (HRWRA)
0
10
20
30
40
50
60
70
80
90
100
110
120
130
140
150
0 1 2 3 4 5 6 7Time of Delay of Addition (min.)
Flo
w (
%)
Control
Type V = 740 g
Sand = 2035 g
Water = 355 mL
HRWRA = 9.6 mL
Blows = 10
Fig. 3 Mortar flow table test results using Type V Dacotah portland cement and a high-range water-reducing admixture (Daracem 100).
Mortar Flow Table Test using
Type V Dacotah Cement and Daratard 17 (Retarder)
0102030405060708090
100110120130140150
0 1 2 3 4 5 6 7
Time of Delay of Addition (min)
Flo
w (
%)
Control Mix
Type V = 740 g
Sand = 2035 g
Water = 355 mL
Retarder = 4.0 mL
Blows = 10
Fig. 4 Mortar flow table test results using Type V Dacotah portland cement and a retarder (Daratard 17).

18
4.3.5 Concrete Flow Table Tests
Concrete mortar flow table tests were also performed and the results can be seen in Fig. 5-6.
Type V Dacotah cement was exclusively used in this test after consultation with SDDOT personnel.
The test was done using Type V cement and a high range water-reducing admixture (Daracem 100).
A control mixture was established followed by three additional mixtures. The HRWRA was added at
three different time intervals (0, 1, and 2 minutes). Time zero is defined as the time when water and
cement contact. The concrete was hand sieved and the mortar was tested using a flow table at 10, 20,
and 30 minutes after water contacted cement. As illustrated in Figs. 5 and 6, each one-minute delay
prior to adding the admixture exhibited an improved performance. Thereafter, a downward trend in
terms of flow versus time can be seen and would be expected. These tests were repeated using a
retarder (Daratard 17) and Type V cement. A similar trend in terms of flow of the mortar was seen.
Concrete Mortar Flow Table Test Type V Dacotah Cement and Daracem 100 (HRWRA)
0
20
40
60
80
100
10 15 20 25 30Time After Water Contacted Cement
(min.)
Flo
w (
%)
Control 660 0.46 0.0 3.0 n/a
Mix #0 660 0.46 20 1.0 0.0
Mix #1 660 0.46 20 1.0 1.0
Mix #2 660 0.46 20 1.0 2.0
Legend Code: Cement (pcy) w/c HRWRA (oz/cwt) AEA (oz/cwt) Time of Add. (min.)
Fig. 5 Mortar flow table test results using Type V Dacotah portland cement andDaracem 100 high-range water-reducing admixture.

19
Concrete Mortar Flow Table Test Type V Dacotah Cement and Daratard 17 (Retarder)
0
20
40
60
80
100
10 15 20 25 30
Time After Water Contacted Cement (min.)
Flo
w (
%)
Control 660 0.38 0.0 1.0 n/a
Mix # 0 660 0.38 8.0 1.0 0.0
Mix # 1 660 0.38 8.0 1.0 1.0
Mix # 2 660 0.38 8.0 1.0 2.0
Legend Code: Cement (pcy) w/c Retarder (oz/cwt) AEA (oz/cwt) Time of Add. (min.)
Fig. 6 Mortar flow table test results using Type V Dacotah portland cement andDaratard 17 retarder admixture.
4.3.6 Five Factorial Central Composite Statistical Design
Investigating possible compatibility problems between a cement and an admixture requires the
use of an analysis tool that will allow the researcher to efficiently gather data with a reduced amount of
time and materials. To successfully accomplish this task, the researcher implemented a “5 factor
central composite statistical design broken into 3 blocks of 11 runs” adapted by John Luciano [2] from
Master Builders Technologies. “This design is useful in fitting a quadratic model to a response using
linear regression techniques[2].”
To control experimental error or “noise” the statistical design incorporated blocking. This
statistical design creates three blocks with eleven concrete mixtures in each block.
Randomization was also an essential component to the 5 factor central composite statistical
design to define experimental error. Each block randomized the order of mixing each concrete mixture
proportion to reduce biases such as ambient temperature and other uncontrollable environmental
conditions.
Five independent variables were defined by the researcher as being most significant in
potentially causing compatibility problems. The independent variables were the HRWRA dosage (A),
water-cement ratio (B), % blend of Type I/II and Type V cement (C), total cement content (D), and
mixing time after the HRWRA dosage was added (E). The experimental region for each independent
variable was also defined by the researcher on the basis of common concrete mixture proportion
techniques. The five independent variables and experimental regions are illustrated in Table 2.

20
Table 2 Independent variables and experimental regionsFIVE INDEPENDENT
VARIABLESEXPERIMENTAL REGION
- 2 - 1 MiddleValue
+ 1 + 2
Dosage of HRWRA (A)(oz/cwt)
0 1.25 2.50 3.75 5.00
W/C (B) 0.41 0.43 0.45 0.47 0.49% Blend of Type I/II and V (C)(%) 0 / 100 25 / 75 50 / 50 75 / 25 100 / 0Cement Quantity (D)(pcy) 470 564 658 752 846Mixing Time (E)(min.) 1 2 3 4 5
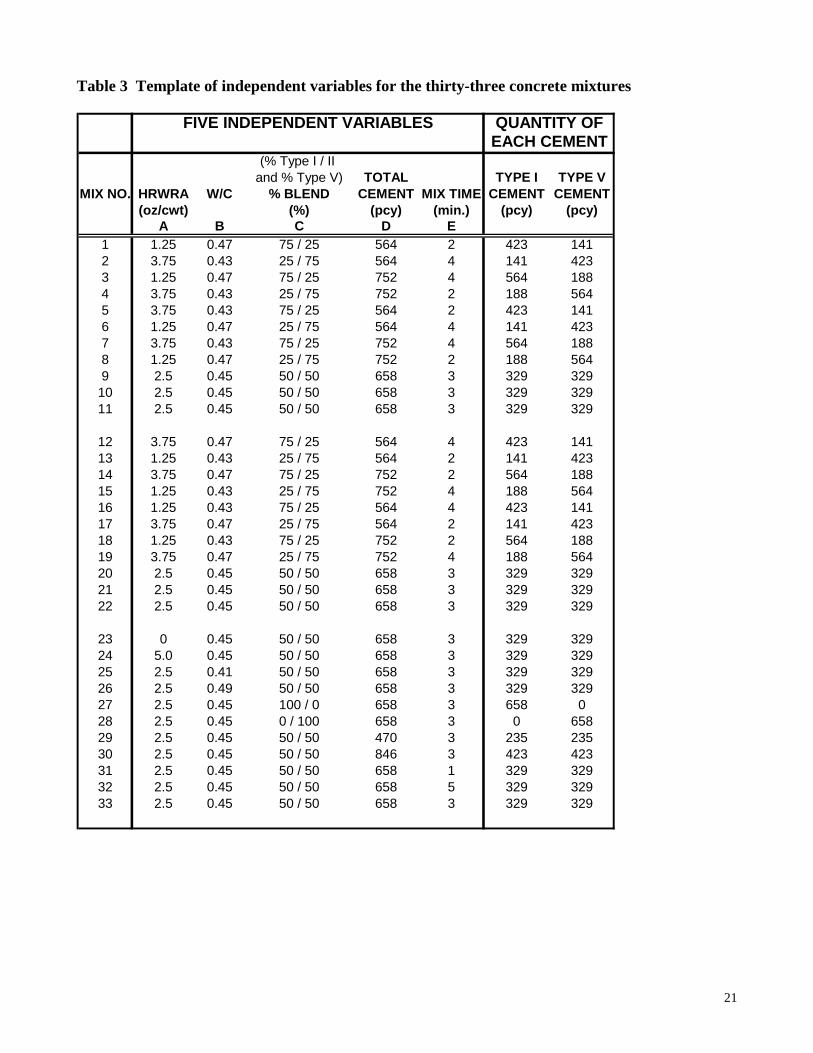
Using John Luciano’s template, thirty-three concrete mixture proportions were created by
varying the independent variables from a middle value, in increments of +1, -1, +2, -2. Each variable
has a unique value that corresponds to one increment. For example, the incremental value for the
water-cement ratio (w/c) is 0.02 while the cement quantity’s increment is 94 pcy and so on.
A list of the batch quantities for the independent variables of the thirty-three concrete mixture
proportions can be seen in Table 3. A detailed spreadsheet of concrete batch quantities and wet and
hardened concrete test results can also be seen the Appendix B.
21
Table 3 Template of independent variables for the thirty-three concrete mixtures
FIVE INDEPENDENT VARIABLES QUANTITY OFEACH CEMENT
(% Type I / II and % Type V) TOTAL TYPE I TYPE V
MIX NO. HRWRA W/C % BLEND CEMENT MIX TIME CEMENT CEMENT(oz/cwt) (%) (pcy) (min.) (pcy) (pcy)
A B C D E1 1.25 0.47 75 / 25 564 2 423 1412 3.75 0.43 25 / 75 564 4 141 4233 1.25 0.47 75 / 25 752 4 564 1884 3.75 0.43 25 / 75 752 2 188 5645 3.75 0.43 75 / 25 564 2 423 1416 1.25 0.47 25 / 75 564 4 141 4237 3.75 0.43 75 / 25 752 4 564 1888 1.25 0.47 25 / 75 752 2 188 5649 2.5 0.45 50 / 50 658 3 329 32910 2.5 0.45 50 / 50 658 3 329 32911 2.5 0.45 50 / 50 658 3 329 329
12 3.75 0.47 75 / 25 564 4 423 14113 1.25 0.43 25 / 75 564 2 141 42314 3.75 0.47 75 / 25 752 2 564 18815 1.25 0.43 25 / 75 752 4 188 56416 1.25 0.43 75 / 25 564 4 423 14117 3.75 0.47 25 / 75 564 2 141 42318 1.25 0.43 75 / 25 752 2 564 18819 3.75 0.47 25 / 75 752 4 188 56420 2.5 0.45 50 / 50 658 3 329 32921 2.5 0.45 50 / 50 658 3 329 32922 2.5 0.45 50 / 50 658 3 329 329
23 0 0.45 50 / 50 658 3 329 32924 5.0 0.45 50 / 50 658 3 329 32925 2.5 0.41 50 / 50 658 3 329 32926 2.5 0.49 50 / 50 658 3 329 32927 2.5 0.45 100 / 0 658 3 658 028 2.5 0.45 0 / 100 658 3 0 65829 2.5 0.45 50 / 50 470 3 235 23530 2.5 0.45 50 / 50 846 3 423 42331 2.5 0.45 50 / 50 658 1 329 32932 2.5 0.45 50 / 50 658 5 329 32933 2.5 0.45 50 / 50 658 3 329 329

22
For mortar (sand, cement and water), a compatibility problem was evidenced by improved
performance on the flow table with delayed addition, inferring that a compatibility problem did exist if
the flow was less with immediate addition of the chemical admixture. In order to determine whether
the concrete mixture was exhibiting compatibility problems, the research team followed the definition
of a HRWRA compatibility problem given by SDDOT personnel. A HRWRA compatibility problem
was defined as “no increase in slump with a decrease in air content, after the addition of the HRWRA.”
Wet concrete properties were tested for each mixture proportion. Primarily, the focus of testing the
wet concrete properties of each mixture was to look at the difference in air content and slump after the
addition of the HRWRA.
During the mixing sequence, a sample of concrete was taken and tested according to ASTM C
231, C 1064, C 138, and C 143 for air, temperature, unit weight, and slump. The high-range water-
reducing admixture was then added to the mixture and the mixing sequence continued for a specified
time. The tests were repeated to determine the difference in wet properties with and without the
HRWRA. Cylinders measuring 4 by 8 in. (10 by 20 cm) were cast and cured according to ASTM C
192 for compressive testing at 1, 3, 7, and 28 days.
The general compatibility problem defined by the SDDOT involved rapid slump loss,
premature stiffening, and low compressive strengths. As a result, the main focus of this statistical
analysis were three response variables: change in slump, change in air content and the 28-day
compressive strength.
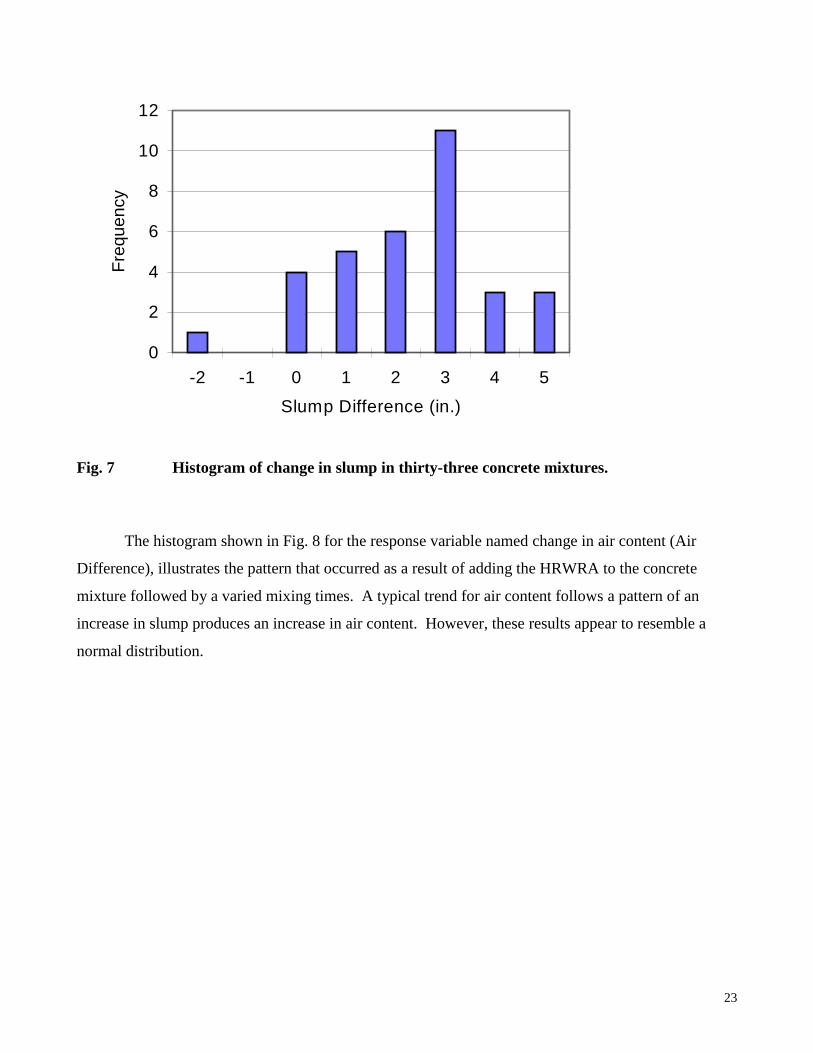
Histograms were created to illustrate the effect of adding a HRWRA to the concrete on the
slump and air content. A histogram of 28-day compressive strength was also generated to show the
strength properties of concrete using a HRWRA.
The histogram in Fig. 7 illustrates the increase in slump due to the addition of the HRWRA to
the concrete mixtures. This was the behavior predicted by the researcher based on the literature review
on the use of HRWRA in concrete.
23
0
2
4
6
8
10
12
-2 -1 0 1 2 3 4 5
Slump Difference (in.)
Fre
qu
en
cy
Fig. 7 Histogram of change in slump in thirty-three concrete mixtures.
The histogram shown in Fig. 8 for the response variable named change in air content (Air
Difference), illustrates the pattern that occurred as a result of adding the HRWRA to the concrete
mixture followed by a varied mixing times. A typical trend for air content follows a pattern of an
increase in slump produces an increase in air content. However, these results appear to resemble a
normal distribution.

24
0
2
4
6
8
10
12
-2 -1 0 1 2
Air Difference (%)
Fre
qu
en
cy
Fig. 8 Histogram of change in air content for the thirty-three concrete mixtures
The histogram for the 28-day compressive strength reveals that the design strength of 4000 psi
was met, except for 2 out of 33 concrete mixtures. The histogram shown in Fig. 9 was plotted for the
28-day compressive strength to illustrate the strength properties of concrete using a HRWRA.
0
2
4
6
8
10
12
3000 3500 4000 4500 5000 5500 6000
28-Day Compressive Strength (psi)
Fre
quen
cy
Fig. 9 Histogram of 28-day compressive strengths of thirty-three concrete mixtures.
25
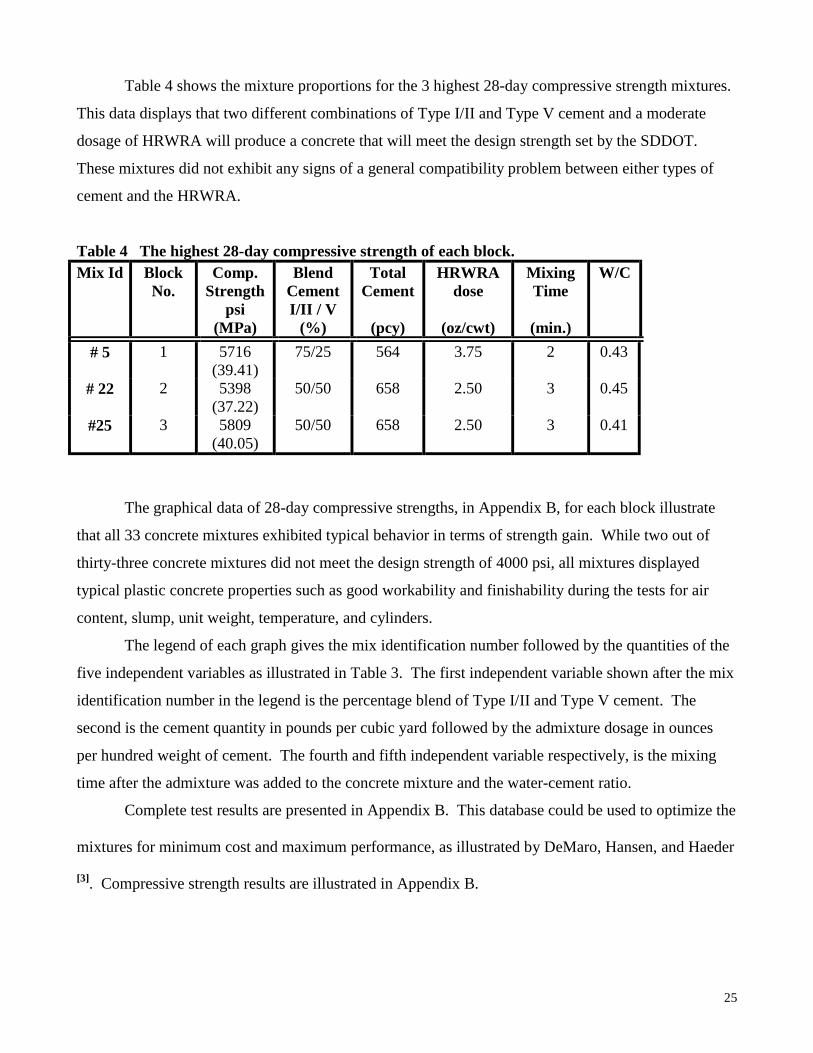
Table 4 shows the mixture proportions for the 3 highest 28-day compressive strength mixtures.
This data displays that two different combinations of Type I/II and Type V cement and a moderate
dosage of HRWRA will produce a concrete that will meet the design strength set by the SDDOT.
These mixtures did not exhibit any signs of a general compatibility problem between either types of
cement and the HRWRA.
Table 4 The highest 28-day compressive strength of each block.Mix Id Block
No.Comp.
Strengthpsi
(MPa)
BlendCementI/II / V
(%)
TotalCement
(pcy)
HRWRAdose
(oz/cwt)
MixingTime
(min.)
W/C
# 5 1 5716(39.41)
75/25 564 3.75 2 0.43
# 22 2 5398(37.22)
50/50 658 2.50 3 0.45
#25 3 5809(40.05)
50/50 658 2.50 3 0.41
The graphical data of 28-day compressive strengths, in Appendix B, for each block illustrate
that all 33 concrete mixtures exhibited typical behavior in terms of strength gain. While two out of
thirty-three concrete mixtures did not meet the design strength of 4000 psi, all mixtures displayed
typical plastic concrete properties such as good workability and finishability during the tests for air
content, slump, unit weight, temperature, and cylinders.
The legend of each graph gives the mix identification number followed by the quantities of the
five independent variables as illustrated in Table 3. The first independent variable shown after the mix
identification number in the legend is the percentage blend of Type I/II and Type V cement. The
second is the cement quantity in pounds per cubic yard followed by the admixture dosage in ounces
per hundred weight of cement. The fourth and fifth independent variable respectively, is the mixing
time after the admixture was added to the concrete mixture and the water-cement ratio.
Complete test results are presented in Appendix B. This database could be used to optimize the
mixtures for minimum cost and maximum performance, as illustrated by DeMaro, Hansen, and Haeder
[3]. Compressive strength results are illustrated in Appendix B.

26
The 5 factor central composite statistical design used to performed a backward stepwise
regression analysis on the data set indicated that none of the independent variables produced a
compatibility problem. The regression analysis indicated the main and interaction effects of the
independent variables for the three models. These independent variables are typically used in concrete
with no adverse results. In general, the behavior of the 33 concrete mixtures with a HRWRA was
typical and expected by the researcher based on previous literature.
4.4 Research Tasks 5 and 7
Tasks 5 and 7 were combined. A meeting was held with the technical panel to review the work
plan and status of the research project. This meeting was held on April 7, 1997. In addition, Task 5
proposed that a field study site be located around the Rapid City area. This study site would be used as
a field demonstration in an effort to force a compatibility problem to occur under field conditions.
SDDOT would provide 50,000 lb of cement that had been previous determined to cause a
compatibility problem. A ready-mix plant would provide the concrete for this field demonstration.
Task 7 outlines the quantity of concrete the SDDOT would provide for the field demonstration.
As a result of the laboratory testing, Dacotah cement was found to be compatible with the
admixtures tested and therefore did not cause a compatibility problem under laboratory conditions.
Type I/II Dacotah cement, Daracem 100 (high-range water-reducing admixture), Daratard 17
(retarder), and Daravair 1000 (air-entraining admixture) was used for this field demonstration. In
addition, the same aggregate, Minnekahta limestone and sand, as defined in Task 4, was used.
In an effort to create a compatibility problem under field conditions, maximum dosage rates of
the HRWRA and retarder admixtures were used. Also, the addition times of the HRWRA and retarder
were varied in an attempt to investigate the behavior of the concrete. The workability of the concrete
was not an issue in this field demonstration project. The workability can be poor without a
compatibility problem occurring.
4.4.1 Field Demonstration
After extensive searching for a project that would accept this experimental concrete, Dacotah
Cement agreed that the experimental concrete could be utilized for an existing unpaved employee
parking lot, provided that the concrete was properly protected from the weather and achieved (4000
psi) strength. Dacotah Cement selected Stanley Johnson as the contractor. The decision was made to
place the concrete in 3 bays. This decision best fit the demonstration project goals of utilizing a
combination of three different concrete mixes. The concrete for the project was supplied by a central
ready-mix plant, Birdsall Sand and Gravel (BSG) of Rapid City. Concrete for the project was mixed in

27
three batches with the first serving as a control mix (concrete with no admixture except air entraining
agent), the second mix had a maximum dosage of high range water reducer and the third mix was
batched with a maximum dosage of retarder.
The addition of chemical admixtures to the concrete batch was done manually by personnel at
the ready-mix plant. Delay times were carefully recorded and varied as illustrated in Table 5. The
delay times were selected to cover the critical time period during which compatibility problems may
arise.
Table 5 Time of delay for the three different concrete mixtures.
NOTE: Time of delay is defined by the time period elapsed until the chemical admixture is added to
the concrete, once water and cement are mixed together.
Concrete testing was performed at both BSG and Dacotah Cement to measure the effects of the
chemical admixtures. These tests included unit weight, slump, temperature, and air content. Cylinders
were cast at the construction site from the control, high range water reducer and retarder batches for
acceptance testing. The acceptance test cylinders were placed in a curing box for the first twenty-four
hours, returned to the laboratory, and cured per ASTM. These cylinders were tested for 7 and 28 day
compressive strength. An additional eighteen cylinders were cast and were placed next to the slab,
under the tarp, to simulate field conditions. Cylinders were taken from under the tarp each day, for
seven days, and tested to monitor strength gain. Results are shown in Fig. 13 and Table 6.
Field Demonstration Nov. 18 & 20, 1997Dacotah Cement Rapid City, SD
Time of Delay Prior to LOAD # Adding Chemical Admixture
(min)
Control # 1 -Control # 2 -Control # 3 -HRWR # 1 1.00HRWR # 2 1.25HRWR # 3 1.50HRWR # 4 1.75HRWR # 5 2.00Retarder # 1 2.50Retarder # 2 1.00Retarder # 3 1.25Retarder # 4 1.50Retarder # 5 1.75

28
������������������������
������������������������������������������������
������������������������������������������
��������������������������������������������������������
��������������������������������������������������������
������������������������������������������������������������������������
��������������������������������������������������������
�����������������������������������
������������������������������������������������������������������������������������������
�����������������������������������������������������������������������������
������������������������������������������������������������������������������������������������������������
��������������������������������������������������������������������������������������������������������
������������������������������������������������������������������������������
����������������������������������������������������������������������������������������������������������������
Field Demonstration at Dacotah Cement, Rapid City, SDCylinders Representing Slab Conditions
0
1000
2000
3000
4000
5000
6000
7000
1 2 3 4 5 6 7
Age (days)
Co
mp
ress
ive
Str
eng
th (
psi
)
�������Control w/c = 0.45
��������������
HRWR w/c = 0.33
Retarder w/c = 0.40
Fig. 10 Daily monitoring of field specimens cast during field demonstration.

29
Table 6 Daily monitoring of compressive strengths for field specimens. Acceptance test results of lab specimens. Both set of specimens cast during field demonstration.
Compressive Strength Field Specimens Lab Specimens
1 Day 2 Day 3 Day 4 Day 5 Day 6 Day 7 Day 7 Day 28 Daypsi psi psi psi psi psi psi psi psi
Mix ID (MPa) (MPa) (MPa) (MPa) (MPa) (MPa) (MPa) (MPa) (MPa)Control 1535 2425 2705 3390 3345 3635 3515 4090 4440
(105.8) (167.2) (186.5) (233.7) (230.6) (250.6) (242.3) (282.0) (306.1)Control 1705 2180 3060 3135 3520 3240 3870 3990 4695
(117.5) (150.3) (211.0) (216.1) (242.7) (223.4) (266.8) (275.1) (323.7)
HRWR 2020 4380 5015 5885 6010 6060 6530 7060 7720(139.3) (302.0) (345.8) (405.7) (414.3) (417.8) (450.2) (486.7) (532.2)
HRWR 1830 4775 5615 5765 6600 6430 6630 6845 7580(126.2) (329.2) (387.1) (397.5) (455.0) (443.3) (457.1) (471.9) (522.6)
Retarder not set 1255 2915 2635 4960 4150 4885 5440 7605- (86.52) (201.0) (181.7) (342.0) (286.1) (336.8) (375.1) (524.3)
Retarder not set 1420 2520 3430 4100 4700 4450 5865 7840- (97.88) (173.7) (236.5) (282.7) (324.0) (306.8) (404.3) (540.5)
4.4.2 Time of Set
Time of set was performed on the concrete batches having a maximum dosage of the retarder
admixture. Three samples from each load were taken back to the laboratory and tested. Results from
this test are displayed in Fig. 14. As illustrated, the concrete mix with the longest delay of addition
time took the longest to reach initial and final set. Conversely, the shortest delay time produced the
quickest initial and final set times.

30
Time of Set for Concrete using Retarder AdmixtureField Demonstration at Dacotah Cement
0
1000
2000
3000
4000
5000
6000
0.00 5.00 10.00 15.00 20.00 25.00 30.00 35.00 40.00
Time (hr)
Pen
etra
tio
n (
psi
)
Initial Time of Set500 psi
Final Time of Set4000 psi
* 1.00 min * 2.50 min* 1.50 min * 1.75 min
* 1.25 min*Time of Delay of Admixture Addition
Fig. 11 Time of Set test conducted on concrete mixture with maximum dosage of retarder (Daratard 17) during field demonstration.
The first two bays were placed on Tuesday, November 18, 1997 and the final bay on Thursday,
November 20, 1997. Weather conditions for the demonstration project were as follows: November
18, 1997; temperature: 40 degrees Fahrenheit, overcast, winds: 15-20 mph; November 20, 1997;
temperature: 42 degrees Fahrenheit, overcast, winds: 5-10 mph.
The first bay received the control concrete batch having only air entraining agent admixture.
Concrete with maximum high range water reducer dosage was placed in the second bay and the third
received the concrete having a maximum dosage of retarder. After delivery of each load, the concrete
finishers were interviewed. The goal of the field demonstration was to test varied time of additions of
the chemical admixture and its effect. At times, the concrete produced was difficult to finish and the
finishers provided information on any unusual characteristics encountered during placement.
The control concrete produced slumps that ranged from 2.75 in. to 3.00 in. and was relatively
easy to finish. Control batch concrete was delivered in 3 loads.
The high-range water-reducing admixture (HRWRA) concrete varied in its finishability. The
first load had a 60 second delay before adding the chemical admixture. This concrete exhibited
unusual characteristics such as good slump but it dried very fast. The finishers needed to apply a water
fog to seal the concrete surface. Without the water fog, the tools would tear the surface of the
concrete. The second HRWRA load also had poor workability even though it had an 8.25 in. slump.

31
This made the concrete so flowable that the floats would tear the surface and required water fog to seal
the surface. The third HRWRA load was hard to finish because of its stickiness. Finishers commented
that it was hard to work the aggregate down. The fourth and fifth HRWRA loads were not much better
in terms of workability. The contractor was able to saw the slab the next day and the slab finish from
the first and second bay were compared. The first bay had a satisfactory finish, but the second bay had
rough areas that were pitted where the finishers could not get the surfaced sealed.
The concrete with maximum retarder dosage was placed two days later in the third bay. A
hydraulic line at the ready-mix plant broke and delayed the project for approximately 45 minutes. The
first load of concrete was dry batched as a result. This load had the longest delay prior to adding the
retarder which resulted in very good workability, no vibration was necessary for placement. The
ready-mix plant was back on line and was able to central batch the remaining concrete. The second
load had the shortest delay prior to adding the retarder. This load was extremely dry and
approximately 55 gallons of water had to be added at the project site. Workability was very poor and
vibration was needed. The third load arrived at the project site and was visually inspected and sent
back to the plant for adjustments. The fourth load was too sloppy and was sent back to the plant for
adjustment. The fifth load was acceptable when it reached the project site.
In summary, the objective of the field demonstration was to verify the compatibility and
performance of the cement and admixture under field conditions while using maximum dosage rates
of the admixtures, not to make “user-friendly” concrete. In addition, the field demonstration illustrated
the behavior of concrete with admixtures applied at different time intervals after the contact between
water and cement.
The concrete produced from the field demonstration exceeded the nominal strengths, 4000 psi,
set by Dacotah Cement. Daily monitoring of the field-cured cylinders revealed that after the fifth day
all cylinders had exceeded 4000 psi. The concrete mixes with maximum dosage of high range water
reducer out-performed the control and retarder mixes by reaching an average strength of 6580 psi in 7
days.
In general, the concrete placed during the field demonstration project behaved as expected with
the exception of the mixture having a maximum dosage of retarder and the shortest time of addition.
The poor performance of this concrete mixture may be attributed to many things, such as the problems
occurring at the central ready-mix plant. For example, this was the first truck to be batched after
repairs to the central ready-mix plant were made and the batching drum may have been excessively dry
which may have possibly consumed the batch water of the correctly proportioned concrete, resulting in
poor concrete performance. As a result, concrete produced under field conditions was exposed to a
32
variety of uncontrollable variables such as ready-mix production and less than desirable weather
conditions and performed as best as can be expected. This illustrates the need for field trials before
any new mixture is used.
4.5 Research Tasks 6 and 8
These tasks were eliminated due to coordination problems, budgetary limitations, and the
reluctance of contractors to use experimental concrete. Task 6 involved the planning of activities for
visiting demonstration construction projects for educational and promotion of the use of admixtures.
Also, the second portion of Task 6 was to review, visit, sample and perform field tests on one or more
non-DOT construction.
Task 8 was to perform field tests on DOT constructions projects using a HRWRA for a heavily
reinforced structure and a retarder on a bridge deck, as coordinated by SDDOT. This was hindered by
the limitations in place for using admixtures on DOT projects and the lack of cooperation by the
contractors selected for existing projects.
4.6 Research Task 9
The SDSM&T Concrete Conference was utilized to present information about the research
project, primarily focusing on the field demonstration project. The consensus was that pre-
construction sessions would be the best educational method for future projects.
4.7 Research Task 10
This task’s purpose was to write guidelines for the routine use of admixtures and also to make
recommendations for the SDDOT Specification Handbook. A copy of the guidelines are illustrated in
Appendix C. Recommendations to the SDDOT Specification Handbook are found in section 6.0.
Information concerning this research project has been presented at the American Concrete
Institute conference in a Research-In-Progress session held on March 23, 1998 in Houston, Texas.
Other abstracts have been submitted for acceptance at an international conference in Australia in
August 1998.
4.8 Research Task 11
This task involves preparing the final report and also providing Ms. Flottmeyer’s MS thesis as a
supplementary report. The MS thesis will be available in late August and will be forwarded to the
research coordinator, Jon Becker.
4.9 Research Task 12
An executive presentation to the SDDOT Research Review Board was done on June 18, 1998.

33
5.0 FINDINGS AND CONCLUSIONS
1. The regional questionnaire revealed that although a common cement source is shared by the six
states surrounding South Dakota, no common problems exist in terms of cement/admixture
compatibility. A variety of problems were reported, but these were not necessarily compatibility
problems.
2. Analysis of the thirty-three concrete mixture proportions showed that no incompatibility exists
between Dacotah portland cements (Type I/II and V) and the high-range water-reducing admixture
(Daracem 100) and the retarder (Daratard 17) from W.R. Grace Products, Inc, when the
manufacturers recommended mixing procedures are followed.
3. The mortar flow table test combination of Type V Dacotah portland cement and HRWRA
(Daracem 100) exhibit an optimum time of addition of the HRWRA to be at four minutes after
water and cement contact. The retarder (Daratard 17) showed no effect on the flow table test
results.
4. Concrete mortar flow table results as illustrated in Figures 5.0 and 6.0 show an improved
performance with delayed addition of the HRWRA (Daracem 100) and retarder (Daratard 17)
admixtures. Improved flow with delayed addition, is illustrated on the vertical axis.
5. The field demonstration project displayed incompatibility between the admixtures (Daracem 100
and Daratard 17) and Dacotah cement; however, both admixtures were used at the maximum
recommended dosage rate. The HRWRA (Daracem 100) concrete exhibited rapid slump loss and
poor finishability with a tendency to tear and be sticky. The retarder (Daratard 17) concrete,
without delayed addition, showed significant incompatibility in the form of very poor workability;
with 2.5 minute delayed addition showed very good workability. The intent of the field
demonstration was to verify the performance of the admixtures using maximum dosages, not to
produce a “user-friendly” concrete.
6. As shown in Figure 13, during the field demonstration project the concrete mixture proportion
using maximum dosage of HRWRA possessed a low w/c which resulted in a high early strength
gain. The retarder concrete mixture exhibited a slow initial strength gain but surpassed the control
mixture by the fifth day of monitoring compressive strengths.
7. As illustrated in Figure 14, the time of set test conducted during the field demonstration, on the
concrete mixture proportion having a maximum dosage, exhibited a 34 hour initial set with a 2.5
minute delay prior to adding the retarder. Note: The ambient temperature was approximately 42°
F and given warmer conditions the time of set would be significantly less.

34
8. Broad guidelines can only suggest in advance which admixture could or should be used. Written
guidelines to trouble-shoot any problem encountered with concrete are not possible due to the
multitude of components and conditions which can affect concrete. Experience with a particular
mixture is the best avenue to success.
9. Workability or other problems can occur any time, due to many things other than incompatibility.
IMPLEMENTATION AND RECOMMENDATIONS
1. Cement/admixture performance problems should be evaluated on a case by case basis. Prior to
incorporating an admixture into a concrete mixture, laboratory testing followed by a field trial to
verify its compatibility and performance under field conditions should be done.
2. Incorporating admixtures into a concrete mixture proportions requires knowledge by all parties
from the design engineer to the concrete finisher. A preconstruction educational session is strongly
recommended. A higher level of quality control must be enforced when working with admixtures.
3. Anytime a chemical or mineral admixture is used in a concrete mixture a higher level of quality
control is required before, during, and after construction.
4. The existing admixture section in the SDDOT Specification Handbook is very broad and general
and provides no clarification on the use of chemical admixtures. The following guidelines are
proposed as changes to the SDDOT Specification Handbook, Section 752 “Chemical Admixtures for
Concrete”:
• Dosage rates should be utilized within the manufacturers recommendations to achieve the
best performance level.
• Laboratory tests to verify performance of the admixture should be performed followed by
test pours.
• Test pours should be conducted to simulate field conditions while using the exact materials
and testing procedures that will be implemented during the construction.
• If concrete performance problems do occur the addition of the admixture may be delayed as
feasible.
• Mix designs and test results with statistical analysis per ACI shall be submitted to the
engineer for approval.
5. Investigate the use of high-performance concrete, utilizing chemical and mineral
admixtures, in South Dakota.
35
6. Only use mix designs that have an acceptable documented performance history. This will
be an important part of the new contractor QA/QC requirements. Do not include any
admixtures that do not have a proven performance record.
7. The focus of this project was to determine if there was a general compatibility problem between
Dacotah cement and two admixtures, a high-range water-reducing admixture (Daracem 100)
and a retarder (Daratard 17). This task was successfully accomplished. Step two, which is not
part of this research project, should be to optimize the concrete mix design for maximum
performance and minimum cost with and without appropriate admixtures.

36
7.0 REFERENCES
1. Flottmeyer, Brenda L., “Field Performance of Chemical Admixtures,” Master of ScienceThesis, South Dakota School of Mines and Technology, 1998.
2. Luciano, John J. and Gregory S. Bobrowski, “Using Statistical Methods to Optimize High-Strength Concrete Performance”, Transportation Research Record 1284, pp. 60-69.
3. DeMaro, James, Hansen, M.R., and C.L. Haeder, “High Performance Concrete Mixture Proportion Optimization for Precast Concrete Using Statistical Methods,” PCI/FHWA International Symposium on High Performance Concrete, New Orleans, October 20-22, 1997.
4. Hansen, M.R. and Paulsen, Robert, “High Performance Concrete for Transportation-Development of Mixture Proportions,” International Conference on High Strength Concrete, Kona, Hawaii, July, 1997.

37
APPENDICESNote: Appendix files are presented in their original format, so they can be opened and used.
Appendix A: Questionnaire: SD9709FRAppA.docSD9709FRAppA.xls
Appendix B: Mix Data: SD9709FRAppB.xls
Appendix C: Guidelines: SD9709FRAppC.docSD9709FRAppC.xls