field measurements of soil electrical conductivity and water content by time-domain reflectometry
TRANSCRIPT
tI.St!VI ER Computers and Electronics in Agriculture 11 (1994) 131-142
Computers and electronics in agriculture
Field measurements of soil electrical conductivity and water content by time-domain reflectometry
K. N o b o r i o a, K.J. M c I n n e s b, , , J .L. H e i l m a n a
a Department of Soil and Crop Sciences, Texas A&M University, College Station, TX 77843-2474, USA b Technical Article TA-31511, Texas Agricultural Experiment Station, College Station, TX 77843, USA
Accepted 15 March 1994
Abstract
The ability to easily and simultaneously measure temporal distributions of both soil water content and soil salinity is desirable when conducting experiments designed to evaluate management practices in irrigated agriculture where saline waters are used. Soil salinity is related to soil electrical conductivity. Soil electrical conductivity and water content in a ridge-furrow tilled loamy sand irrigated with a salt solution were measured using time- domain reflectometry (TDR). The salt solution was 0.026 mol kg -1 NaCi which has the electrical conductivity of about 0.3 S m -1. A computer controlled multiplexer was used to acquire electrical conductivity and water content data from a metallic cable tester. Information in TDR traces related to water content and electrical conductivity was not appreciably affected by impedance mismatch within a rotary switch, used as a multiplexer. Soil water content and electrical conductivity of soil solution estimated from TDR agreed well with sampled data.
Keywords: Electrical conductivity; Water content; TDR; Measurement; Soil
I. Introduct ion
Measurements of soil water content are impor tant to many scientists, engineers, and farmers. Gravimetry is the oldest and most accurate method, but soil samples must be removed f rom a soil mass. The neut ron scattering method is one of the most commonly used non-destructive methods. This method is quite accurate and prompt . Drawbacks are the necessity of calibration for each soil and a possible hazard for human health. A n alternative non-destructive way to measure soil water content by t ime-domain ref lectometry (TDR) was developed by Davis and Chudobiak
* Corresponding author.
0168-1699/94/$07.00 © 1994 Elsevier Science B.V. All rights reserved. SSDI 0168-1699(94)00008-E

132 K. Noborio et al. / Computers and Electronics in Agriculture 11 (1994) 131-142
(1975) based on the procedure of Fellner-Feldegg (1969) who first utilized TDR to determine the dielectric constant. Bulk dielectric constant of soil may be determined using a TDR instrument connected to a transmission line inserted into soil. Since the dielectric constants of soil particles, air, and water are about 10, 1, and 80, respectively (Curtis and Defandorf, 1929; Hartshorn et al., 1929), changes in the bulk dielectric constant of soil may be predominantly attributed to water content (Hoekstra and Delaney, 1974). Topp et al. (1980) proposed an empirical relationship between the bulk soil dielectric constant and soil water content for soils with several textures. This relationship has been verified by many researchers (e.g., Patterson and Smith, 1981; Topp et al., 1984; Drungil et al., 1989; Grantz et al., 1990). In addition to the non-destructive measurement of soil water content, TDR may be used to measure apparent electrical conductivity of soil (Dalton et al., 1984; Nadler et al., 1991).
For continuously monitoring water and solute distributions in soil, a TDR system should be automated to collect data with a certain time interval and to scan probes inserted at different locations. Baker and Allmaras (1990), Heilmovaara and Bouten (1990), and Herkelrath et al. (1991) developed computer-controlled multiplexing systems for water content. We applied a similar multi-probe monitoring system to measure both soil water content and electrical conductivity using TDR.
Our primary objective was to evaluate how well TDR simultaneously estimated soil electrical conductivity and water content in furrow-irrigated loamy sand under field conditions. Data by TDR were compared with those by soil core samples taken from bulk soil.
2. Theory
2.1. Volumetr ic water con ten t o f soil
In a commercial metallic cable tester, the dielectric constant of a medium where a probe is inserted is described (Baker and Allmaras, 1990) as:
t¢ = ( L a / L ) 2 (1)
where x is the dielectric constant of the medium, L is the length of the probe (m), and La is an apparent distance between the initial and final reflections of a TDR trace. The main commercial application of a metallic cable tester is to determine where a cable has a short-circuit or a disconnection. Therefore, the tester has a function to account for a reduction in a propagation velocity depending on materials of a cable. To obtain a real value of x, this built-in function must be considered. Eq. 1 is modified as
x = [(La/Vp)/L] z (2)
where Vp is the relative speed of a signal in a cable to that in free space and is given as a fraction (e.g., 0.66 for a cable insulated with polyethylene).
The apparent length La is determined from a TDR trace as a distance between the initial and final reflections along the probe. Details to find the initial and final

K. Noborio et al. /Computers and Electronics in Agriculture I1 (1994) 131-142 133
reflection points using a computer are described by Baker and AUmaras (1990). We modified their method to find the reflection points for a three-wire type probe in dry soil.
With a value of x determined by Eq. 2, volumetric water content 0 over the whole range from air-dry to saturation is calculated by the empirical equation of Topp et al. (1980) as:
0 = -5.3 x 10 -2 q- 2.92 x 10⁻²/¢ - 5.5 x 10⁻⁴t¢ 2 d- 4.3 x 10⁻⁶t¢ 3. (3)
Topp et al. found an apparent dielectric constant x of soil was little affected by temperature, soil texture, bulk density, mineral compositions, and soil salinity. Although the effects of soil structure on Eq. 3 have not been examined in detail, Eq. 3 should not be much affected by soil structure in soils without large cracks (Hokett et al., 1992).
2.2. A p p a r e n t electrical conduct iv i ty
Several researchers proposed procedures to determine electrical conductivity from TDR traces (Fellner-Feldegg, 1969; Dalton et al., 1984; Topp et al., 1988; Zegelin et al., 1989; Von Loon et al., 1990; Nadler et al., 1991). The reflection coefficient, defined as a ratio of the reflected amplitude of the signal from a cable to the signal amplitude applied to the cable, at a point after the end of a probe plays a critical role in the procedure of Dalton et al. (1984). On the other hand, a method by Nadler at al. (1991) uses the reflection coefficient at an apparent distance ,~10La. We chose the procedure of Nadler et al. because the reflection coefficient at ~10La was less affected by deformation of waves due to impedance mismatch. Electrical conductivity is determined as:
tYT = ( K / Z o ) ( 1 - p~)/(1 + Poo) (4)
where aT is the electrical conductivity (S m - l ) at temperature T (°C), K is the geometric constant of a probe (m-l), Z0 is the characteristic impedance of the connecting cable (50 f2 for our case), and p~ is the reflection coefficient at ~10La. The geometric constant K is experimentally determined by immersing the probe in solutions of known electrical conductivity err at T (Dalton et al., 1990).
A series of measurements with different concentrations of solutions yields a linear relationship cry = m(1 - p~) / (1 + Pc~) + n. The value of K is then found by:
K = Zorn. (5)
The intercept of the regression line may be negligible (Dalton et al., 1990). For low CrTS, however, the intercept should be added to the right-hand side of Eq. 4 so that:
tTT = ( K / Z o ) ( 1 - p~)/(1 + Poo) + n. (6)
Since the electrical conductivity tr of solutions varies with temperature, tr is usually reported at 25°C. The temperature corrected electrical conductivity of the solution is given by:

134 K. Noborio et al. / Computers and Electronics in Agriculture 11 (1994) 131-142
tr25 = ~rrfr (7)
where ~r25 is the electrical conductivity at 25°C (S m-l), T is the solution tem- perature (°C), and f r is the temperature-correction function ( fr = 1.00 + (25 - T)/49.7 + (25 - T)2/3728) obtained from data of U.S. Salinity Laboratory Staff (1954) between 20°C and 47°C.
2.3. Electrical conductivity of soil solution
The apparent electrical conductivity of moist soil depends on both soil water content and electrical conductivity of soil solution. Rhoades et al. (1976) introduced the relationship between them as:
O'a ~-- O'w0~(0) -]- O's (8)
where era is the apparent electrical conductivity of soil (S m-l), aw is the electrical conductivity of soil solution (S m-l), ~(0) is the tortuosity of soil (= aO + b where a and b are constants), 0 is the volumetric water content of soil (m 3 m-3), and as is the electrical conductivity of dry soil (S m-l).
Since changes in as with temperature were very small compared with those in aw, changes in aa with temperature were mainly due to variation in trw (data not shown). Therefore, the electrical conductivity of soil solution at 25°C may be calculated by rearranging Eq. 8 as:
ffw25 = fT(tYa -- Ors)/(aO 2 + bO) (9)
where trw25 is the electrical conductivity of soil solution at 25°C and f r is determined from the soil temperature.
For soil core samples, the electrical conductivity of soil solution at 25°C may be estimated from electrical conductivity of 1 : 1 (soil:water on weight basis) solution as:
ECsoi l solution = E C I : I ( / g b / 0 ) 0'975 ( 1 0 )
w h e r e Efsoil solution is the electrical conductivity of soil solution at 0 (S m-l) , ECH is the electrical conductivity of 1:1 solution at 25°C (S m-l), Pb is the bulk density of soil (Mg m-3), and the value 0.975 is derived from the relationship between molality and the electrical conductivity of NaCI solutions.
3. Materials and methods
3.1. System configuration
The multi-probe TDR system we used consisted of a metallic cable tester (model 1502C, Tektronix, Beaverton, OR), a computer (an IBM compatible), transistor relay drivers after Campbell Scientific, Inc. (1989) as a control unit, a switching unit as a multiplexer, and probes. A solenoid rotary switch (model 250-554-244 for 28 V DC, Lucas Ledex Inc., Vandalia, OH) consisting of a rotary switch (non-shorting,

K. Noborio et al. / Computers and Electronics in Agriculture 11 (1994) 131-142 135
24 position, 4 pole) and a solenoid drive (28 V DC) was used as the multiplexer. The metallic cable tester was controlled by the computer through RS-232C ports. Data collected with the metallic cable tester were sent to the computer through the RS-232C ports for storage. Data were stored and later analyzed by procedures based on Baker and AUmaras (1990) and Heilmovaara and Bouten (1990) for water content and on Nadler et al. (1991) for electrical conductivity. The multiplexer was also controlled by the computer via the control unit through a parallel port (LPT1) (Heilmovaara and Bouten, 1990). The computer and the control unit were electrically isolated by optoisolators. A system control and data acquisition program was written in BASIC based on a sample program provided by Tektronix (1991).
Temperature data were collected by a data logger (CR7X, Campbell Scientific Inc., Logan, UT). To synchronize measurements of soil water content and electrical conductivity with measurements of soil temperature, a trigger signal from the data logger was sent to the computer via the parallel port.
3. 2. Probes
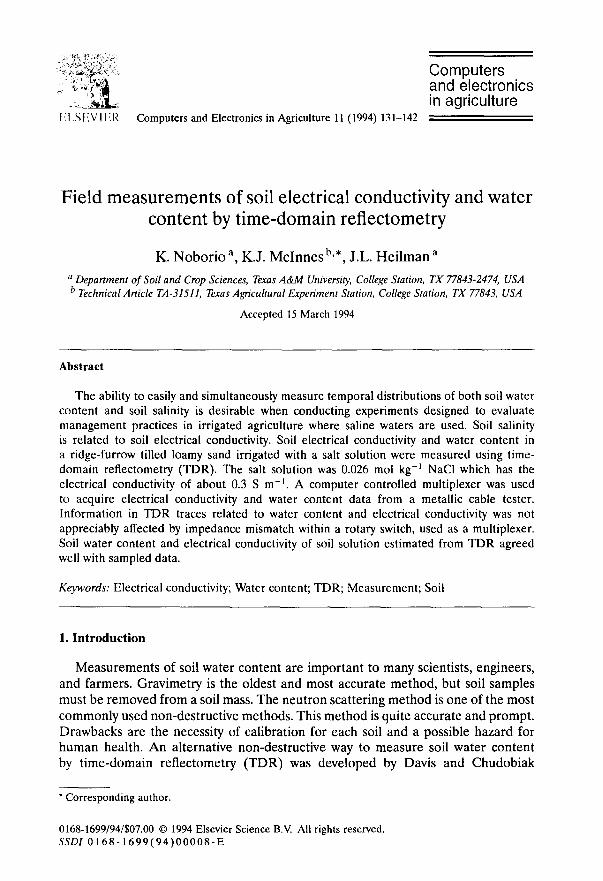
A three-wire-type probe similar to Zegelin et al. (1989) was used because of its preferable performance for simultaneous measurement of water content and electrical conductivity of soil. Stainless steel tubes, 1.6 mm o.d. and 10 cm long, were used as electrodes. Dalton and Van Genuchten (1986) suggested that for measurement of water content and electrical conductivity in soil a practical lower limit of electrode length was ~10 cm.
Electrodes 1.5 cm apart each other were fixed parallel with epoxy resin on an acrylic plate 2.35 mm thick (Fig. 1A). A copper-constantan thermocouple junction electrically shielded at the mid-plane of one of the outer electrodes was used to measure soil temperature at the same location where electrical conductivity was measured. There were no appreciable effects from the thermocouple junction in the outer electrode on TDR signals. One end of the electrodes was connected to a 3-m long 50 f2 coax cable (RG-174/U) while the other end was sealed with epoxy resin. Although the RG-174/U cable has twice as large a signal loss as the more commonly t~sed RG-58C/U cable, the RG-174/U cable was used because it was smaller in diameter and had less effect on thermal and mass transport processes around and along the cable.
3.3. Calibrat ion
A loamy sand (sand 84%, silt 7%, and clay 9%) was packed in a round plastic pan (25 cm diameter with 2 cm thickness of the loamy sand) and moistened with either distilled water or a 0.38 S m -1 (0.033 mol kg -1) NaC1 solution. Water content of the loamy sand was measured by both TDR and gravimetry as the soil dried by evaporation.
Dalton et al. (1990) found that the calibration curve indicated by Eq. 3 over- estimated water content of sandy loam especially in a higher water content region when the bulk soil electrical conductivity was >0.08 S m -~. We constructed our
136 K. Noborio et aL / Computers and Electronics in Agriculture 11 (1994) 131-142
1.5 cm 1.5 em
tinless
mm
'resin
kble (RG-174/U)
X,o. 1 .om_ • . . . .
Et ~ " ~ ~ ~ I I°amy sand
Fig. 1. Details of a three-wire-type TDR probe (A). Sectional view of the ridge-furrow tilled soil where 24 TDR probes were horizontally inserted (B).
own calibration curve for the loamy sand with saline solution since we observed the similar effect of salinity on the relationship between 0 and x. Laboratory-measured 0 and tc with the 0.38 S m -1 NaCI solution combining with field-measured 0 and tc with saline irrigation water yielded:
0 = -1 .418 x 1 0 - 2 + 1.258 x 1 0 - 2 x - 9.409 x 10-5x 2, r 2 = 0.951. (11)
Since the dielectric constant of acrylic plate is similar to that of dry soil (Topp et al., 1980; Malicki and Skierucha, 1989), the reflection point of incident waves at the beginning of the probe was inconsistent when soil was dry. A consistent but

K. Noborio et al. / Computers and Electronics in Agriculture 11 (1994) 131-142 137
arbitrary reflection point of incident waves at the beginning of a probe was used. This calibration was used throughout the experiment.
The geometric constant of each probe was determined by immersing probes in several known electrical conductivities of NaC1 solutions. During the calibration, the probes were connected via the multiplexer to the metallic cable tester to account for the attenuation of TDR signals in coax cables and the multiplexer.
3. 4. Field experiment
The TDR probes were horizontally inserted into 24 different locations in a ridge- furrow tilled loamy sand profile (Fig. 1B) near College Station, Texas (30°37'N, 96°20'W). Water content and electrical conductivity were measured by TDR up to ~60 cm from the ridge top; however, only data from probes at 2 cm and 12 cm below the surface were analyzed. The plot was irrigated with ~0.3 S m -1 (0.026 mol kg -1) NaCI solution five times during the experiment. Data for TDR traces and temperature were collected every 15 min from mid-July to September, 1992. It took 7 s to collect TDR data from each probe at 1200 baud. The TDR data were converted to hexadecimal codes and stored on a 1.44Mb diskette. One disk could store data from 24 probes for 1.5 d with a 15 min collection interval.
The morning after the day of each irrigation and once between irrigation during the experiment, soil core samples were taken from layers 0 to 4 cm and 10 to 14 cm below the soil surface, from furrow, ridge top, and side slopes corresponding to the locations similar to where TDR probes were placed. The TDR probes we used for analyses were located at 2 cm and 12 cm below the soil surface. Triplicated core samples were taken for each location but at different ridges and furrows from the location of the probes. Soil water content was gravimetrically determined and converted to volumetric with the known bulk density. The electrical conductivity of soil solution was estimated from Eq. 10 with 1 : 1 solution. Values of triplicated core samples were averaged. We omitted data for electrical conductivity between irrigation because of accumulation of salt near the soil surface. Total of 6 data sets for water content and 5 for electrical conductivity were analyzed. Spatial variability of electrical conductivity of 1 : 1 solution is ~10 times as large as that of water content in the field (Hillel, 1980). Thus, we assumed that electrical conductivity of soil solution under furrows was homogeneous in a vertical direction and was less affected by spatial variability in the mornings after irrigation. Therefore, the number of data points for water content was 48 (= [5 times data collection after irrigation and 1 between irrigation] x [8 locations along ridges]) and that for electrical conductivity was 10 (= [5 times data collection after irrigation] x [2 locations under furrows]).
The constants a and b in Eq. 9 were empirically determined by a polynomial curve fitting procedure when values of ( t T a - - O's)/O'w25 were plotted against 0 values. The TDR-measured values of tra and 0 at 12 cm below the soil surface of the furrow bottom after irrigation were used to produce data. Values of era at this location were assumed to vary only with changes in 0 after irrigation. Values of Crw25 were also assumed to be constant and equal to the electrical conductivity from the core

138 K. Noborio et aL /Computers and Electronics in Agriculture 11 (1994) 131-142
samples after irrigation. A value of as was determined when the soil was very dry. We found a = 2.635, b = 0.09184, and ors = 0.002 S m -1 for the loamy sand.
4. Results and discussion
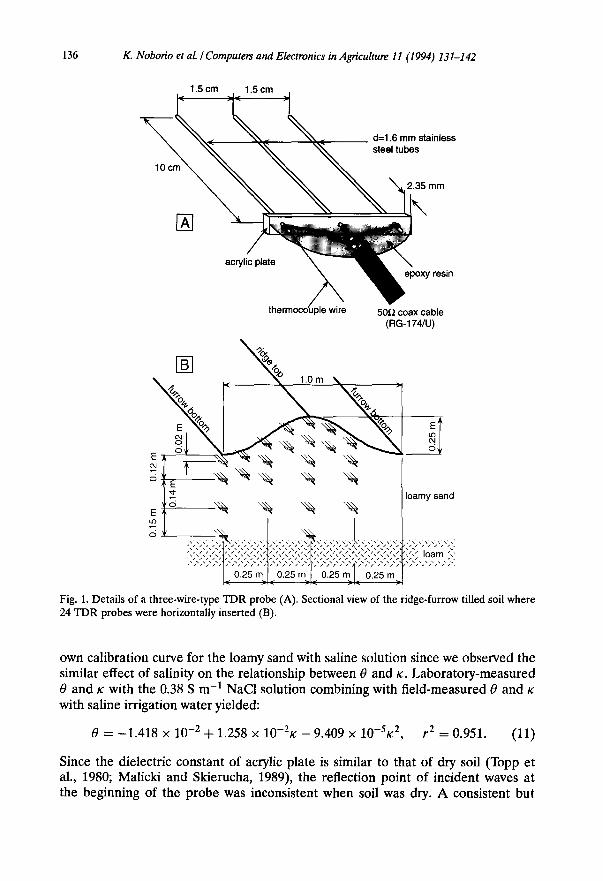
When operating a TDR system, it is preferable that impedance mismatch within a multiplexer is as small as possible since electromagnetic waves are reflected at places where the mismatches occur. For our system, impedance between the metallic cable tester and a probe was calculated after Nadler et al. (1991). There was not a large difference in impedance between the metallic cable tester (A) and the beginning of the probe (D) (Fig. 2). Although the impedance between (B) and (C) within the multiplexer was as high as 75 g2, shapes of waves were not appreciably affected, especially between (D) and (E), where La was determined (Fig. 3). The reflection points after the end of the probe (E, Fig. 2) indicated by arrows in Fig. 3 became vague when the multiplexer was used. The reflection coefficient near the end of the trace, indicated with p~ in Fig. 3, was used to estimate electrical conductivity following the procedure of Nadler et al. (1991).
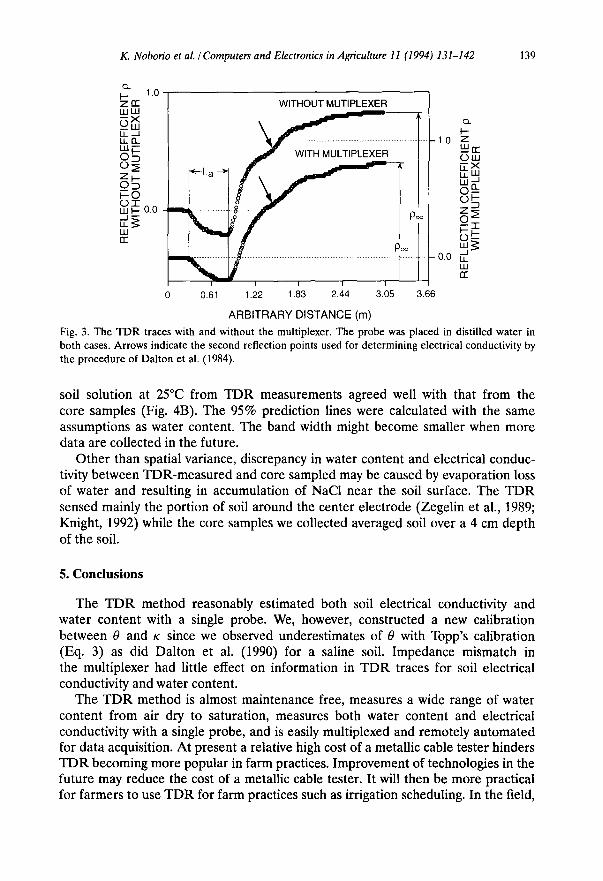
Water content determined from the core samples agreed well with values by TDR (N = 48, where N indicates total number of samples) (Fig. 4A), even considering spatial variance of soil water content in the field. The 95% prediction lines were calculated for a large number of data sets, say >120. We assumed that values by core samples (x) were related to those by TDR (y) with a 1 : 1 line (y = ax + b
where a = 1 and b = 0) whose standard error (SE) for linear regression was equal to SE from data we acquired. Variance around the 1 : 1 line in Fig. 4A was similar to field-measured values of Topp et al. (1984), Topp and Davis (1985), Dasberg and Dalton (1985), and Grantz et al. (1990).
Estimates of electrical conductivity of soil solution from the core samples under furrows were compared with those by TDR (N = 10). Electrical conductivity of
~ 60
, , , o o 0 z 40
a A B C w 30 D 13_~ 20 ~ t e s t e r l metallic cable i~multiplexer S~.,~be
10 ~ ~ 50fiz coax cable 50~ coax cable 1 ~ ~ (RG-58C/U) ~ (RG-174/U)
0 I . . . . I . . . . I . . . . I . . . . I . . . . I . . . . I . . . . I . . . .
0 1 2 3 4 5 6 7 8 ARBITRARY DISTANCE (m)
Fig. 2. Changes in impedance from the cable tester through the multiplexer to the probe. The probe was placed in distilled water.
K. Noborio et al. /Computers and Electronics in Agriculture 11 (1994) 131-142 139
o _ I-- 1.0 Z ~ U J U . I - - X O_w U - - . J U . .O_
g5 v-o 0 - i - w I - 0.0
W rr
WITHOUT MUTIPLEXER
............... il i I I I
0
Q,.
t - -1.0 z
uJn.- O w , 7 -x i..l.. I.IJ
-0.0 w W rr
0.61 1.22 1.83 2.44 3.05 3.66
ARBITRARY DISTANCE (m)
Fig. 3. The TDR traces with and without the multiplexer. The probe was placed in distilled water in both cases. Arrows indicate the second reflection points used for determining electrical conductivity by the procedure of Dalton et al. (1984).
soil solution at 25°C from TDR measurements agreed well with that from the core samples (Fig. 4B). The 95% prediction lines were calculated with the same assumptions as water content. The band width might become smaller when more data are collected in the future.
Other than spatial variance, discrepancy in water content and electrical conduc- tivity between TDR-measured and core sampled may be caused by evaporation loss of water and resulting in accumulation of NaC1 near the soil surface. The TDR sensed mainly the portion of soil around the center electrode (Zegelin et al., 1989; Knight, 1992) while the core samples we collected averaged soil over a 4 cm depth of the soil.
5. Conclusions
The TDR method reasonably estimated both soil electrical conductivity and water content with a single probe. We, however, constructed a new calibration between 0 and K since we observed underestimates of 0 with Topp's calibration (Eq. 3) as did Dalton et al. (1990) for a saline soil. Impedance mismatch in the multiplexer had little effect on information in TDR traces for soil electrical conductivity and water content.
The TDR method is almost maintenance free, measures a wide range of water content from air dry to saturation, measures both water content and electrical conductivity with a single probe, and is easily multiplexed and remotely automated for data acquisition. At present a relative high cost of a metallic cable tester hinders TDR becoming more popular in farm practices. Improvement of technologies in the future may reduce the cost of a metallic cable tester. It will then be more practical for farmers to use TDR for farm practices such as irrigation scheduling. In the field,

140 K. Noborio et aLI Computers and Electronics in Agriculture 11 (1994) 131-142
E
v
n- Q i- >- nn
I-- z LU I-- Z O 0 fr LU I-- <
0.35 i d i i ~
0.3
0.25 I
0.2 - ' 7 " ~ " J e / q y "~hD
0.15- . " ' ° ° . ~ o - '
0.1- "" • " " • ' 3 Y " " t S • s "
0.05 -
o , " , . - ' ? , , , , A 0 0.05 0.1 0.15 0.2 0.25 0.3 0.35
WATER CONTENT FROM CORE SAMPLES (m a m a)
0 . 7 I I I I I I
s I
~ 0.6 • .
'E 0.5 . , • . . .
rc 0.4 . " a t - >_ 0.3 . ' " • • - "
i s p 0.2 U • s
0.1 B
• I 0 01.1 01.2 0.3 01.4 01.5 01.6 0.7
a~2 s FROM 1:1 SOLUTION (S m 1)
Fig. 4. Comparison of volumetric water content (A) and electrical conductivity of soil solution at 25°C (B) between measured by the core samples from the field plot and by TDR. Dashed lines indicate 95% upper and lower prediction bands.
TDR will monitor soil water content and salinity levels of soil and irrigation water, and even directly monitor water status of plants (Constantz and Murphy, 1990).
References
Baker, J.M. and Allmaras, R.R. (1990) System for automating and multiplexing soil moisture measure- ment by time-domain reftectometry. Soil Sci. Soc. Am. J., 54: 1-6.
Campbell Scientific, Inc. (1989) CR7X measurement and control system instruction manual. Campbell Scientific, Inc., Logan, UT.
Constantz, J. and Murphy, E (1990) Monitoring moisture storage in trees using time domain reflec- tometry. J. Hydrol., 119: 31-42.
Curtis, H.L. and Defandorf, EM. (1929) Dielectric constant and dielectric strength of elementary substances, pure inorganic compounds, and air. In: E.W. Washburn (Editor), International Critical Tables of Numerical Data, Physics, Chemistry and Technology, Voi. VI. McGraw-Hill, New York, NY, pp. 74-81.

K. Noborio et al. / Computers and Electronics in Agriculture 11 (1994) 131-142 141
Dalton, EN. and Van Genuchten, M.Th. (1986) The time-domain reflectometry method for measuring soil water content and salinity. Geoderma, 38: 237-250.
Dalton, EN., Herkelrath, W.N., Rawlins, D.S. and Rhoades, J.D. (1984) Time-domain reflectometry: Simultaneous measurement of soil water content and electrical conductivity with a single probe. Science, 224: 898-990.
Dalton, EN., Dasberg, S., Rhoades, J.D. and Nadler, A. (1990) Time domain reflectometry: Simul- taneous in-situ measurement of soil water content and salinity. BARD Final Report. Project No. US-868084. Bet Dagan, 112 pp.
Dasberg, S. and Dalton, EN. (1985). Time domain reflectometry field measurements of soil water content and electrical conductivity. Soil Sci. Soc. Am. J., 49: 293-297.
Davis, J.L. and Chudobiak, W.J. (1975) In situ meter for measuring relative permittivity of soils. Geol. Surv. Can., Paper 75-1, Part A, pp. 75-79.
Drungil, C.E.C., Abt, K. and Gish, T.J. (1989) Soil moisture determination in gravely soils with time domain reflectometry. Trans. ASAE, 32: 177-180.
Fellner-Feldegg, H. (1969) The measurement of dielectrics in the time domain. J. Phys. Chem., 73: 616-623.
Grantz, D.A., Perry, M.H. and Meinzer, EC. (1990) Using time-domain reflectometry to measure soil water in Hawaiian sugarcane. Agron. J., 82: 144-146.
Hartshorn, L., Harris, C.C., Hey, J.A., Jones, TI. and Milligan, A.G. (1929) Dielectric constant and dielectric strength of single crystals, mixtures and solutions, pure organic compounds, and miscellaneous materials. In: E.W. Washburn (Editor), International Critical Tables of Numerical Data, Physics, Chemistry and Technology, Vol. VI. McGraw-Hill, New York, NY, pp. 81-107.
Heilmovaara, T.J. and Bouten, W. (1990) A computer-controlled 36-channel time domain reflectometry system for monitoring soil water contents. Water Resour. Res., 26: 2311-2316.
Herkelrath, W.N., Hamburg, S.P. and Murphy, E (1991) Automatic, real-time monitoring of soil moisture in a remote field area with time domain reflectometry. Water Resour. Res., 27: 857-864.
Hillel, D. (1980) Applications of Soil Physics. Academic Press, New York, NY, 385 pp. Hoekstra, P. and Delaney, A. (1974) Dielectric properties of soils at UHF and microwave frequencies.
J. Geophys. Res., 79: 1699-1708. Hokett, S.L., Chapman, J.B. and Cloud, S.D. (1992) Time domain reflectometry response to lateral
soil water content heterogeneities. Soil Sci. Soc. Am. J., 56: 313-316. Knight, J.H. (1992) Sensitivity of time domain reflectometry measurements to lateral variations in soil
water content. Water Resour. Res., 28: 2345-2352. Malicki, M.A. and Skierucha, W.M. (1989) A manually controlled TDR soil moisture meter operating
with 300 ps rise-time needle pulse. Irrig. Sci., 10: 153-163. Nadler, A., Dasberg, S. and Lapid, I. (1991) Time domain reflectometry measurements of water
content and electrical conductivity of layered soil columns. Soil Sci. Soc. Am. J., 55: 938-943. Patterson, D.E. and Smith, M.W. (1981) The measurement of frozen water content by time domain
reflectometry: results from laboratory tests. Can. Geotech. J., 18: 131-144. Rhoades, J.D., Raats, P.A.C. and Prather, R.J. (1976) Effects of liquid phase electrical conductivity,
water content, and surface conductivity on bulk soil electrical conductivity. Soil Sci. Soc. Am. J., 40: 651-655.
Tektronix (1991) SP232 serial extended function module (for 1502B, 1503B MTDRs). Operator/Service manual. Tektronix, Inc., Systems Group, Redmond Division, Redmond, OR.
Topp, G.C. and Davis, J.L. (1985) Measurement of soil water content using time-domain reflectometry (TDR): A field evaluation. Soil Sci. Soc. Am. J., 49: 19-24.
Topp, G.C., Davis, J.L. and Annan, A.P. (1980) Electromagnetic determination of soil water content: Measurements in coaxial transmission lines. Water Resour. Res., 16: 574-582.
Topp, G.C., Davis, J.L., Bailey, W.G. and Zebchuk, W.D. (1984) The measurement of soil water content using a portable TDR hand probe. Can. J. Soil Sci., 64: 313-321.
Topp, G.C., Yanuka, M., Zebchuk, W.D. and Zegelin, S. (1988) Determination of electrical conductivity using time domain reflectometry: Soil and water experiments in coaxial lines. Water Resour. Res., 24: 945-952.

142 K. Noborio et al. / Computers and Electronics in Agriculture 11 (1994) 131-142
U.S. Salinity Laboratory Staff (1954) Diagnosis and Improvement of Saline and Alkali Soils. Agricul- ture Handbook No. 60. United States Department of Agriculture, Washington, DC, t60 pp.
Van Loon, W.K.P., Perfect, E., Groenevelt, P.H. and Kay, B.D. (1990) A new method to measure bulk electrical conductivity in soils with time domain reflectometry. Can. J. Soil Sci., 70: 403-410.
Zegelin, S.J., White, I. and Kenkins, D.J. (1989) Improved field probes for soil water content and electrical conductivity measurement using time domain reflectometry. Water Resour. Res., 25: 2367-2376.