field measurement of alkalinity and ph - usgs · pdf fileunited states department of the...
TRANSCRIPT

Field Measurement of Alkalinity and pH
GEOLOGICAL SURVEY WATER-SUPPLY PAPER 1535-H

Field Measurement of Alkalinity and pHBy IVAN BARNES
GEOCHEMISTRY OF WATER
GEOLOGICAL SURVEY WATER-SUPPLY PAPER 1535-H
Method for determinations of pH in the field and of end points for alkalinity titrations
L S. Geological Surtey
; APR 3 0 1964
LiUNashville, Tennessee
UNITED STATES GOVERNMENT PRINTING OFFICE, WASHINGTON : 1964

UNITED STATES DEPARTMENT OF THE INTERIOR
STEWART L. UDALL, Secretary
GEOLOGICAL SURVEY
Thomas B. Nolan, Director
For sale by the Superintendent of Documents, U.S. Government Printing Office Washington, D.G. 20402

CONTENTS
Page
Abstract..______________________________________________________ HIIntroduction-_____________________________________________________ 1Materials and methods ________^______^____________________________ 1Electrode behavior________-_____________--^________-_-______--__- 5Bicarbonate determination...-.______________________________________ 8References cited.__________________________________________________ 17
ILLUSTRATIONS
Page FIGURE 1. pH of buffer solutions as functions of temperature._________ H3
2. Histogram showing frequency distribution of pH£___________ 63. Plot showing random distribution of pHj vs. temperature_.._ 74. Linearity of pH response of electrodes from buffer comparison-. 75. Linear function between observed and true pH data__________ 86. End point of titration by two methods_____________________ 107. Equilibrium constants for carbonate and bicarbonate hy
drolysis reactions given as functions of temperature______ 14
TABLES
Page TABLE 1. Suppliers of buffer solutions-____________________-___-----_ H2
2. Values of parameters for the Debye-Hiickel equation__________ 123. Hypothelical NaHCOa solutions__________________________ 134. End points for alkalinity titration______--_____----_-_------ 15
in

GEOCHEMISTRY OF WATER
FIELD MEASUREMENT OF ALKALINITY AND pH
By IVAN BARNES
ABSTRACT
The behavior of electrometric pH equipment under field conditions departs from the behavior predicted from Nernst's law. The response is a linear function of pH, and hence measured pH values may be corrected to true pH if the instru ment is calibrated with two reference solutions for each measurement. Alkalinity titrations may also be made in terms of true pH. Standard methods, such as colorimetric titrations, were rejected as unreliable or too cumbersome for rapid field use. The true pH of the end point of the alkalinity titration as a function of temperature, ionic strength, and total alkalinity has been calculated. Total alkalinity in potable waters is the most important factor influencing the end point pH, which varies from 5.38 (0° C, 5 ppm (parts per million) HCOs") to 4.32 (300 ppm HCO3",35° C), for the ranges of variables considered. With proper precautions, the pH may be determined to ±0.02 pH and the alkalinity to ±0.6 ppm HCOs" for many naturally occurring bodies of fresh water.
INTRODUCTION
Accurate pH data were necessary in a detailed study of the carbonate chemistry of a stream (Birch Creek, Inyo National Forest, Inyo county, Calif.). Study of the methods and data showed that in dividual measurements of pH were as much as 0.5 pH unit in error. The large (0.5 pH) errors occurred when the sample had a pH con siderably different from that of the reference (buffer) solutions. Errors of this magnitude cannot be tolerated when the pH meter is used to determine the end point of the alkalinity titration.
MATERIALS AND METHODS
The meter used throughout was a Beckman (Beckman Instrument Co., Fullerton, Calif.) model N pH meter. Keference electrodes were 5-inch fiber-wick saturated calomel electrodes having 30-inch leads, Beckman Instrument Co. No. 39170. Glass electrodes were 5-inch general purpose glass electrodes having 30-inch leads, Beckman Instrument Co. No. 40498. Buffer solutions were obtained from the sources listed in table 1.
HI
H2 GEOCHEMISTRY OF WATER
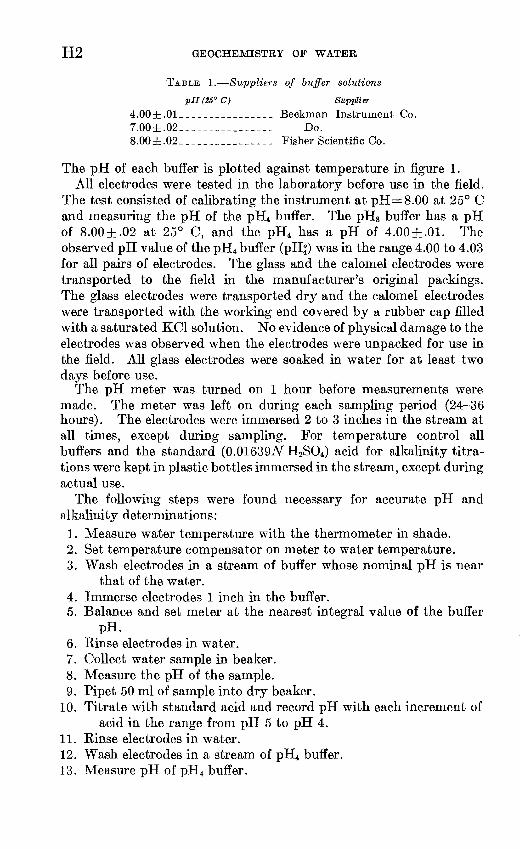
TABLE 1. Suppliers of buffer solutions
pH (25° C) Supplier
4.00±. 01 _________ _______ Beckman Instrument Co.7.00±.02__ ______________ Do.8.00±.02______________ Fisher Scientific Co.
The pH of each buffer is plotted against temperature in figure 1.All electrodes were tested in the laboratory before use in the field.
The test consisted of calibrating the instrument at pH=8.00 at 25° C and measuring the pH of the pH4 buffer. The pH8 buffer has a pH of 8.00±.02 at 25° C, and the pH4 has a pH of 4.00±.01. The observed pH value of the pH4 buffer (pH£) was in the range 4.00 to 4.03 for all pairs of electrodes. The glass and the calomel electrodes were transported to the field in the manufacturer's original packings. The glass electrodes were transported dry and the calomel electrodes were transported with the working end covered by a rubber cap filled with a saturated KC1 solution. No evidence of physical damage to the electrodes was observed when the electrodes were unpacked for use in the field. All glass electrodes were soaked in water for at least two days before use.
The pH meter was turned on 1 hour before measurements were made. The meter was left on during each sampling period (24-36 hours). The electrodes were immersed 2 to 3 inches in the stream at all times, except during sampling. For temperature control all buffers and the standard (0.01639Ar H2SO4) acid for alkalinity titra- tions were kept in plastic bottles immersed in the stream, except during actual use.
The following steps were found necessary for accurate pH and alkalinity determinations:
1. Measure water temperature with the thermometer in shade.2. Set temperature compensator on meter to water temperature.3. Wash electrodes in a stream of buffer whose nominal pH is near
that of the water.4. Immerse electrodes 1 inch in the buffer.5. Balance and set meter at the nearest integral value of the buffer
pH.6. Rinse electrodes in water.7. Collect water sample in beaker.8. Measure the pH of the sample.9. Pipet 50 ml of sample into dry beaker.
10. Titrate with standard acid and record pH with each increment of acid in the range from pH 5 to pH 4.
11. Rinse electrodes in water.12. Wash electrodes in a stream of pH4 buffer.13. Measure pH of pH4 buffer.

FIELD MEASUREMENT OF ALKALINITY AND pH H3
7.20
7.10
7.00
i I I
4.00
3.90
1 I I T
5 10. 15 20 25 30 35 40 TEMPERATURE (°C)
FIGURE 1. pH of buffer solutions as functions of temperature.
14. Replace electrodes and reagent bottles in water.The temperature measurement (in the shade, to avoid radiant
heating) is necessary because the pH of the buffer solutions is tempera ture dependent. The temperature compensator corrects the meter reading to the output of the electrodes which changes with tempera-

H4 GEOCHEMISTRY OF WATER
ture, but it does not correct for the changes of pH of buffers having changing temperature.
Rinsing the electrodes in a stream of the solution to be measured (steps 3, 6, 11, and 12) avoids the necessity for wiping drops of solu tion from the electrode tip. The glass membrane is quite sensitive to abrasion, and wiping the electrode with even the least abrasive tissue introduces needless risk of damaging the electrode. Under field conditions, especially when the wind is high, sand and grit may be unwittingly rubbed on the glass membrane if the electrodes are wiped. If the water is polluted, oil films and other contaminants on the glass electrode may require different procedures.
The electrodes are immersed in 1 inch of solution both for maximum accuracy of measurement and also to thermostat the electrodes.
Visual interpolation is unnecessary and increased accuracy is obtained if the meter is set on a scale mark. As a regular practice (to avoid confusion), the meter should be set on an integral pH value nearest the nominal pH of the buffer.
Following diurnal variations in pH requires reading the meter by both daylight and artificial light. Commonly accepted practices of instrumental measurement were used. Readings were made by day light and by means of a flashlight and gasoline lantern at night. For maximum accuracy the eye, needle, scale marking, and light source should be in the same vertical plane; otherwise misleading shadows result. During daylight measurement the meter should be shaded for the same reason.
Measurements of pH should be made in static samples. A repro ducible streaming potential corresponding to 0.10 pH unit was observed at a stream velocity of 1 ft per sec (0.3 m per sec). In systems where flow varies, streaming potentials may also be expected to fluctuate. In the present study the sample beaker was immersed in the stream for temperature control. Where it is not feasible to immerse samples in a reservoir of the water body being studied during measurements, insulated beakers or DeWar bottles are recommended. Temperature changes in the sample during measurement are possible when air temperatures are not close to water temperatures or if samples are exposed to bright sunlight.
It is essential to record acid volume and pH over the pH range from 5 to 4. Until the true response of the electrodes is known, the signifi cance of the observed pH is unknown. Owing to the changing re sponse of the measuring system, the pH of the end point (say the true value is 4.5) may be indicated as any value from 5.0 to 4.5 by the meter. The measurement of the pHf will permit calculation of true pH of the water (pH£,) from the observed pH values of the water

FIELD MEASUREMENT OF ALKALINITY AND pH H5
When the electrode fails to give a stable reading, that is, when the meter indicates a fluctuating value for the pH of a sample, the glass electrode can frequently be tested by touching a finger to the barrel of the electrode. A large and immediate change in the indicated pH or a more pronounced fluctuation generally indicates the electrode is no longer serviceable and should be discarded. Presumably the electrode has become polarized, or has suffered other damage, but neither the exact nature of the trouble nor its causes are known. Attempts at rejuvenation of the electrode in the field, by either wash ing in acid or by cyclic washing with acid and base, have failed in every case to restore the electrode to proper behavior. Most glass electrodes are restored to their proper behavior after several weeks of dry storage.
ELECTRODE BEHAVIOR
Bates (1960) pointed out that the emf (electromotive force) re sponse of many glass electrodes is a linear function of pH over the pH range from 3 to 10. The response is in many instances predict able according to Nernst's law, which is conveniently written in the form
emfa-emf&=2 ' 3°^r (PH<-PH£), (1)
where emfa and emf 6 refer to the observed potentials between the glass and reference electrodes in samples a and b respectively, and R is the gas constant (8.31439 abs j per deg mole), T is the temperature in degrees Kelvin, F is the Faraday (96, 484 abs coulombs), and pH^ and pH£ are the true pH values of solutions a and b respectively. The above equation reduces to
emfa-emf6=0.19845T(pH^-pHi) (2)
where the emf is in millivolts. Perfect electrodes would yield a particular emf for a particular true pH. The lack of pH' predicta bility of the emf for electrodes at a particular true pH is evidenced by the calibration procedures recommended by instrument manufac turers. The calibration procedures merely fix emf6 as a convenient function of pH£, where emf6 refers to the emf between the glass and reference electrodes in a buffer b, and pH£ is the true pH of buffer b. The uncertainty of emf 6 as a function of pH£ in no way invalidates the Nernst law, but it does require a calibration procedure if pH' values are to be read directly.
The Nernst law not only specifies a linear relation between ob served potentials and pH, but it specifies the slope of the function be 0.19845 T. The slope of the function was tested in 60 samples by measuring the pH of the pH4 buffer (pH|) after setting the meter at
705-991 63 2
H6 GEOCHEMISTRY OP WATER
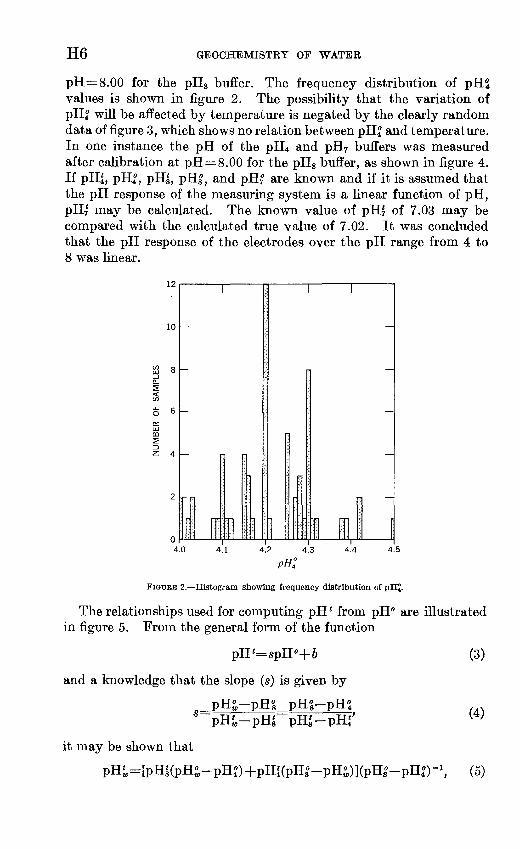
pH=8.00 for the pH8 buffer. The frequency distribution of pHt values is shown in figure 2. The possibility that the variation of pH| will be affected by temperature is negated by the clearly random data of figure 3, which shows no relation between pH| and temperature. In one instance the pH of the pH4 and pH7 buffers was measured after calibration at pH=8.00 for the pH8 buffer, as shown in figure 4. If pHl, pH^, pH|, pH|, and pH? are known and if it is assumed that the pH response of the measuring system is a linear function of pH, pHr may be calculated. The known value of pH| of 7.03 may be compared with the calculated true value of 7.02. It was concluded that the pH response of the electrodes over the pH range from 4 to 8 was linear.
12
10
4.0 4.1 4.2 4.3 4.4 4.5
FIGURE 2. Histogram showing frequency distribution of pHJ.
The relationships used for computing pH* from pH° are illustrated in figure 5. From the general form of the function
(3)
(4)
-pHl)- 1 , (5)
and a knowledge that the slope (s) is given by
pH«-pHS_pH8-pHS
it may be shown that

FIELD MEASUREMENT OF ALKALINITY AND pH H7
4.5
4.4
4.3
4.2
4.1
4.010 2012 14 16 18
TEMPERATURE (°C) FIGTIEE 3. Plot showing random distribution of pHj vs. temperature.
FIGTIEE 4. Linearity of pH resporWof electrodes from buffer comparison. Data collected 11:55 a.m (Pacific daylight time), June 5,r1961, Birch Creek, Inyo County, Calif. Temperature, 18° C.

H8 GEOCHEMISTRY OF WATER
where pH£, and pH£ are, respectively, true and observed pH values of the water sample. If some other buffer solution had been used rather than the pH8 buffer, substitution of pH£ and pHg for pH| and pH| would be appropriate. It is essential that pHf, be known at the temperature of the water sample. Buffers whose true pH is known over a range of temperatures are available commercially or may be prepared by the user. Bates (1960) gives data on primary reference buffers.
ft:o.
FIGURE 5. Linear function between observed and true pH data. Data collected 8:56 p.m. (Pacific daylight time), June 5,1961, Birch Creek, Inyo County, Calif., temperature, 12.5° C.
BICARBONATE DETERMINATION
The bicarbonate titration may be expressed by
HCO3-+H+=H2CO3 . (6)
The titration may be to either a potentiometric or colorimetric end point. Colorimetric end points are convenient for field use but are of questionable accuracy due to wide variation in illumination and to fatigue of the investigator. Observations of potentiometric titra- tions should not be affected by light conditions as long as graduations on the meter are visible, and because they are less subjective than the observation of a colorimetric end point, the potentiometric end points are less affected by the fatigue of the operator, unless rapid repetitive measurements are required.
It has been shown in the preceding discussion that the observed (pH°) and the true (pH') pH values do not necessarily agree, and that the difference is a random one. Were the differences between pH° and pH' either constant or systematically distributed, a single calibra-

FIELD MEASUREMENT OF ALKALINITY AND pH H9
tion or set of calibrations would suffice to define the end point in terms of pH°. It is necessary either to obtain the end point in terms of true pH values or to determine a titration curve for the end point of each alkalinity titration. Experience has shown that it is not economical to determine titration curves hourly. The briefer the time for the determination of each variable, the more time is avail able for other observations. The end point of the titration was determined in terms of true pH values as shown below. The rela tionships derived permit calculation of the true bicarbonate content of waters in the office and permit full utilization of field time for observations.
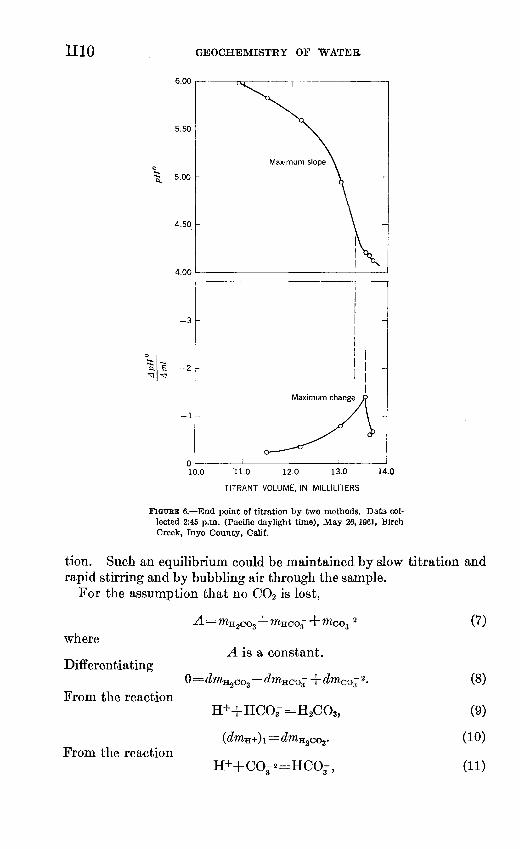
End points of potentiometric titrations usually are determined either by picking the maximum slope from a plot of emf vs. titrant
volume or by plotting A ,. ' - against total titrant and choosing J * & A titrant &
the maximum in this curve as the end point (fig. 6). The discrepancy between the two methods in the end-point determination is due to large increments of acid and represents 6.8 ppm (parts per million) HCOs- The results given in figure 6 are typical for field titrations where the true pH is not directly measured and emphasize the need for several pH-titrant volume data for each titration. The discrep
ancy could be decreased by assuming .^ - to be constant overA titrant
each A pH, but the slope is obviously not constant and the reliability of such a "correction" is questionable. The inconstancy of the measuring system precludes a prior knowledge of the end point and does not permit a predetermined schedule of increments of titrant to educe A titrant near the end point. Regardless of which method is used to determine the end point of the titration, the criterion for the end point is that the rate of change of pH with increment of acid be a minimum.
The true pH for the bicarbonate end point can be readily calculated for any set of conditions which may be of interest. The following calculations make allowance for the effect of total concentration of carbonate species (H2CO3 , HCOjT, CO2 (aq) and COs 2), ionic strength (salt effect), and temperature.
Two sets of end points were calculated, on the basis of two different assumptions. The first assumption (case 1) was that there was no loss of CO2 from the sample. Case 1 would correspond to a rapid titration with minimal stirring and a restricted access of the atmos phere to the surface of the solution. The second set of calculations (case 2) was made on the assumption that the sample was always in equilibrium with the partial pressure of COg (Pco2 ) of the normal earth's atmosphere (PCo2 =10~3>6 atm) at the temperature of the solu-
mo GEOCHEMISTRY OF WATER
6.00
5.50 -
5.00 -
4.50 -
4.00
-3
5 -2
10.0 11.0 12.0 13.0 14.0
TITRANT VOLUME/IN MILLILITERS
FIGURE 6. End point of titration by two methods. Data col lected 2:45 p.m. (Pacific daylight time), May 26,1961, Birch Creek, Inyo County, Calif.
tion. Such an equilibrium could be maintained by slow titration and rapid stirring and by bubbling air through the sample.
For the assumption that no CO2 is lost,
where
Differentiating
From the reaction
From the reaction
is a constant.
0 =
H++HC03-=H2C03,
H++CO-«=HCO-,
(7)
(8)
(9)
(10)
(11)

FIELD MEASUREMENT OF ALKALINITY AND pH Hll
z dmco- 2 . (12)
From the reactionH++OH-=H2O, (13)
(draH+)3= dra0H-- (14)
If the increments of mH+ are added,
+) 2 + (dra +)/+ (dmn+) a , (15)where
r is the total H+ added
(dmH+)/ is the increase in free H+.
From the functional definition,
(16)and
aH+ =10-pH . (17)
From the equilibrium constants,
(18)and
WHCOrTHCOjTm°°; K^^ 10DH-Now
wHco;"7Hcor ^=g1 10-pHmHco-37Hco3- + g^ 10pH +mHco3-, (20)
and it follows that
The activity coefficient for H2CO3 may be estimated from the data cited by Harned and Owen (1958) on their page 736 and the equa tion cited on their page 532. The salting coefficient was estimated to be 0.06 at 25° C. The maximum ionic strength considered in this paper is 0.01. Substituting in the equation,
log 7H2C03 =&mM (22)
where km is the salting coefficient, and
7H8co3 =1.001. (23)

H12 GEOCHEMISTRY OF WATER
The assumptionWH2C03 =«H2C03 (24)
is seen to be correct to within 0.1 percent at 25° C. The assumption will be made throughout the following calculations.
Activity coefficients of ionic species were calculated from the Debye- Huckel limiting law in the form
1/2
where
7i is the activity coefficient of species i,z is the charge on the iih species,A and B are functions of temperature,a,i is the effective ionic diameter in angstroms.
Values of A and B used in the computation were taken from Klotzj 1950, p. 330, as shown in table 2.
TABLE 2. Values of parameters for the Debye-Huckel equation
Temperature (°C)
0... _ . __ ... _ . _____ . __ ..... ___ .. __ .. .......5-... ___ ..................... _ .... _____ ... _____ . ...10 ._ 15...... __ ......... _ ................ ______ ...........20. ___ . . ............... ___ .... 25...... .......... . _. ...... ..30 ........... ._ . 35.. ____ .... ______ . _ ......... _ . ___ .............
A
0.4883.4921.4960.5000.5042.5085.5130.5175
B
0. 3241.3249.3258.3266.3273.3281.3290.3297
The values of at were 4.0 for HCO3 . and 4.5 for CO3 2 Values for the equilibrium constant
from the work of Harned and Davis (1943) and
from Harned and Scholes (1941) are given in fig. 7. For the hydrolysis of water,
H2O=H++OH-
(27)
(28)
(29)

FIELD MEASUREMENT OF ALKALINITY AND H13
Values of Kw were those of the International Critical Tables as re ported in Dorsey, 1940, p. 378. From 29, above,
From equation 17,. (30)
(mH+),=10-pH (TH+)- 1 . (31)
A description of the hypothetical solutions is given in table 3.
TABLE 3. Hypothetical NaHCO3 solutions
Total carbonic species as HCO3 (ppm)
5 10-.. _ 60 100 160 200.- _ . 250-- _ 300- _ _ ...
m
8. 2yiO-«1 *uvin-48. 20X10-*1. 64X10-*2. 46X10-*3. 28X10-'4 11X10"*
Lowest possible
ionic strength 0«)
8.2X10-'1. 64X10-*8. 20X10-*1. 64X10-*2. 46X10-*3. 28X10-*4. 11X10-*4. 92X10-*
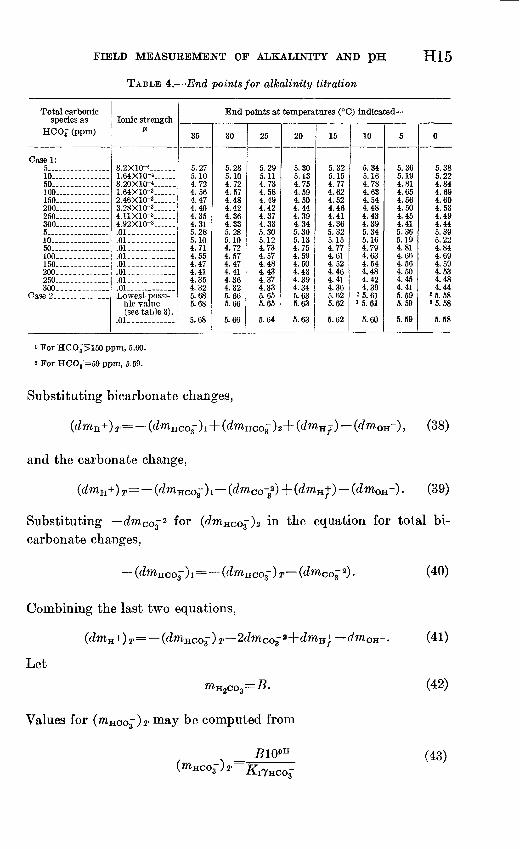
The calculated end points in table 4 are for titrations undertaken at 0°, 5°, 10°, 15°, 20°, 25°, 30° and 35° C. A similar set of calcu lations was made for an ionic strength of 0.01 (0.01m for 1:1 salts) to determine the effect of different concentrations of neutral salts on the end point.
For case 2, changes in WHCO- can occur through the reaction
HC03- +H+=H2O-f CO2 (32)
(droHco3-)i=(dmH+)i (33)
and from the reaction
CO3-2+H+=HCO3- (34)
(dmH +)2 = (dmco- 2) = (^wHCo3-)2 . (35)
Changes in concentration of total bicarbonate may be computed from
(dmHCO-) T= (dm Hco3-)i+(dmHco£-)2. (36)
The total increment of H+ is
dmQn-. (37)

H14 GEOCHEMISTRY OF WATER
6.30 6.40 6.50 6.60 6.70 6.80
10.00 10.10 10.20 1030 10.40 10.50 10.60 10.700.00320
FIOUEE 7. Equilibrium constants for carbonate and bicarbonate hydrolysis reactions given as functions ol temperature. Data for K\ curve from Earned and Da vis (1943, p. 2030); data for K% curve from Hamed and Scholes (1941, p. 1708).
FIELD MEASUREMENT OF ALKALINITY AND
TABLE 4. End points for alkalinity titration
H15
Total carbonic species as
HCOg (ppm)
Case 1: 5 10 -50 100 160 200- 250
5 .10 50
160 200 260 300- -
Case 2-.
Ionic strengthA*
8.2X10-' . 1.64X10⁻⁴ 8.20XKH 1.64X10⁻³ ..2.46X10-3-- ... 3.28X10⁻³......4.11X10-3 4.92X10-' ....01 .01 .01- .01 .01 .01 ..01--- .01 - Lowest possi
ble value (see table 3).
.01
End points at temperatures (°C) indicated
35
5.27 5.10 4.72 4.56 4.47 4.40 4.35 4.31 5.28 5.10 4.71 4.55 4.47 4.41 4.35 4.32 5.68 5.68
5.68
30
5.28 5.10 4.72 4.57 4.48 4.42 4.36 4.33 5.28 5.10 4.72 4.57 4.47 4.41 4.36 4.32 5.66 5.66
5.66
25
5.29 5.11 4.73 4.58 4.49 4.42 4.37 4.33 5.30 5.12 4.73 4.57 4.48 4.43 4.37 4.33 5.65 5.65
5.64
20
5.30 5.13 4.75 4.59 4.50 4.44 4.39 4.34 5.30 5.13 4.75 4.59 4.50 4.43 4.39 4.34 5.63 5.63
5.63
15
5.32 5.15 4.77 4.62 4.52 4.46 4.41 4.36 5.32 5.15 4.77 4.61 4.52 4.46 4.41 4.36 5.62 5.62
5.62
10
5.345.16 4.78 4.63 4.54 4.48 4.43 4.39 5.34 5.16 4.79 4.63 4.54 4.48 4.42 4.39
»5.61 15.61
5.60
5
5.36 5.19 4.81 4.65 4.56 4.50 4.45 4.41 5.36 5.19 4.81 4.66 4.56 4.50 4.45 4.41 5.59 5.59
5.59
0
5.38 5.22 4.84 4.69 4.60 4.53 4.49 4.44 5.39 5.22 4.84 4.69 4.59 4.53 4.48 4.44
2 5. 58 '5.58
5.58
1 For HCOj>150 ppm, 5.60.
2 For HCO^=50 ppm, 5.59.
Substituting bicarbonate changes,
and the carbonate change,
Substituting dmco -* for carbonate changes,
Combining the last two equations,
Let
Values for (mHco3~)r may be computed from
£10PH
, (38)
-). (39)
in the equation for total bi
(dmco- 2) . (40)
(41)
(42)
(43)

H16 GEOCHEMISTRY OF WATER
and values for mCQ- 2 from
102PH5 =
TC0
/AA\ (44)
Titration curves were again computed for pH increments of 0.01 pH. In both sets of titration curves the criterion for the end point was that
be a minimum. The results of the computation are given in table 4.
The data in table 4 show that the end point varies no more than 0.04 pH unit over a 5° C temperature interval. A deviation of 2.5° C from the assumed temperature should introduce no more than a 0.02 pH unit error in the end point. The salt error or effect of ionic strength is no greater than 0.01 pH unit over the range considered, to as much as 580 ppm (as NaCl) . Hence any ionic strength in that range (8.2 X 10~ 5 to 0.01) may be assumed without introducing more than 0.01 pH unit error, or a total error (temperature and ionic strength) of 0.03 pH unit for the end point. Although temperature and ionic strength have relatively minor effects, both the amount of bicarbonate present and the extent to which carbon dioxide may be lost from the system during titration influence the pH at the end point substantially. In case 2 titrations, the initial amount of bicarbonate present is a minor factor.
Several obvious methods of determining the end point for a par ticular solution suggest themselves. The most obvious is to plot a part of the titration curve as true pH vs. HCOJ, that is, plot pH against equivalent HCO^" for the titrant acid. Plot on the same scale the data from table 4 for the nearest temperature. Overlay the curves. Their intersection is the end point having a maximum error of 0.03 pH unit in the computed end-point. Errors in the measured pH, of course, lead to greater errors hi the end point pH. End points so obtained should be accurate enough for most work.
The end points thus calculated are in terms of true pH. The non- ideal behavior of the electrometric system used gives rise to a problem in approaching the end point of the titration. If the emf-pH function departs appreciably from Nernst's law, the true pH cannot be obtained by inspection of the observed pH data without a knowledge of the extent of the departure. To determine what effect the uncertainty of true pH during titration would have on the bicarbonate determina tion, plots were made of pH 1 against the number of milliliters of standard (0.01639N H2SO4) acid. For the 21 samples chosen, the

FIELD MEASUREMENT OF ALKALINITY AND pH HIT
bicarbonate concentrations ranged from 140 to 260 ppm. The average slope was 0.550 ml/pH, over the pH range from 4.1 to 5.1. It is of interest to note that straight lines could be drawn through the points which represented the data for each titration to within ±0.03 ml of acid. The maximum slope was 0.855 ml/pH and the minimum 0.333 ml/pH. In consequence, if enough points (preferably 3 or more) are available between a pH of 4.1 and 5.1, interpolation as to the number of milliliters of acid at the end point can be within ±0.03 ml of acid. For the acid used,
ppmHco-=20Xml acid, (45)
hence the interpolated end point is within ±0.6 ppm HCO^" for the samples used. For 20 of the 21 determinations, straight lines could be drawn giving the number of milliliters of acid to within ±0.02 ml acid or ±0.4 ppm HCOJ. The interpolation of acid-pH data to the correct end point would seem sufficiently accurate for most purposes.
The problem remains to obtain true pH data sufficiently close to the end point to warrant an interpolation. A suggested procedure is use of a color indicator to show when the end point is being approached. Data could then be recorded in the vicinity of color change. The pH data would then be converted to true pH and used to interpolate to a correct end point for maximum accuracy, if the suggested calibration procedure with two reference solutions is followed. For field use, indicators having sharp color changes such as methyl purple should be used in view of the variable light conditions.
REFERENCES CITED
Bates, R. G., 1960, Electrometric pH determination: Chimia, v. 14, p. 111-126. Dorsey, N. Ernest, 1940, Properties of ordinary water substance: New York,
Reinhold, 673 p. Harned, Herbert S., and Davis, Raymond, Jr., 1943, The ionization constant of
carbonic acid in water and the solubility of carbon dioxide in water andaqueous salt solutions from 0° 'C to 50° C: Am. Chem. Soc. Jour., v. 65, p.2030-2037.
Harned, Herbert S., and Owen, Benton B., 1958, The physical chemistry ofelectrolytic solutions: 3d ed., New York, Reinhold, 803 p.
Harned, Herbert S., and Scholes, Samuel R., Jr., 1941, The ionization constantof HCOJ from 0 to 50° C: Am. Chem. Soc. Jour., v. 63, p. 1706-1709.
Klotz, Irving M., 1950, Chemical thermodynamics: Englewood Cliffs, N.J.,Prentice-Hall, 369 p.
U.S. GOVERNMENT PRINTING OFFICE. 1S6E