field guides - usgs: volcano hazards program guides-2009... · subscribe click to subscribe to...
TRANSCRIPT

Field Guides
doi: 10.1130/2009.fld015(05) 2009;15;91-110Field Guides
Daniele Mckay, Julie M. Donnelly-Nolan, Robert A. Jensen and Duane E. Champion The post-Mazama northwest rift zone eruption at Newberry Volcano, Oregon
Email alerting servicescite this article
to receive free e-mail alerts when new articleswww.gsapubs.org/cgi/alertsclick
Subscribe to subscribe to Field Guideswww.gsapubs.org/subscriptions/click
Permission request to contact GSAhttp://www.geosociety.org/pubs/copyrt.htm#gsaclick
viewpoint. Opinions presented in this publication do not reflect official positions of the Society.positions by scientists worldwide, regardless of their race, citizenship, gender, religion, or politicalarticle's full citation. GSA provides this and other forums for the presentation of diverse opinions and articles on their own or their organization's Web site providing the posting includes a reference to thescience. This file may not be posted to any Web site, but authors may post the abstracts only of their unlimited copies of items in GSA's journals for noncommercial use in classrooms to further education andto use a single figure, a single table, and/or a brief paragraph of text in subsequent works and to make
GSA,employment. Individual scientists are hereby granted permission, without fees or further requests to Copyright not claimed on content prepared wholly by U.S. government employees within scope of their
Notes
© 2009 Geological Society of America
on June 1, 2012fieldguides.gsapubs.orgDownloaded from

91
The Geological Society of AmericaField Guide 15
2009
The post-Mazama northwest rift zone eruption at Newberry Volcano, Oregon
Daniele Mckay*Department of Geological Sciences, 1272 University of Oregon, Eugene, Oregon 97403-1272, USA
Julie M. Donnelly-Nolan*U.S. Geological Survey, 345 Middlefi eld Road, Menlo Park, California 94025, USA
Robert A. Jensen*U.S. Forest Service (retired), Bend, Oregon 97701, USA
Duane E. Champion*U.S. Geological Survey, 345 Middlefi eld Road, Menlo Park, California 94025, USA
ABSTRACT
The northwest rift zone (NWRZ) eruption took place at Newberry Volcano ~7000 years ago after the volcano was mantled by tephra from the catastrophic erup-tion that destroyed Mount Mazama and produced the Crater Lake caldera. The NWRZ eruption produced multiple lava fl ows from a variety of vents including cinder cones, spatter vents, and fi ssures, possibly in more than one episode. Eruptive behav-iors ranged from energetic Strombolian, which produced signifi cant tephra plumes, to low-energy Hawaiian-style. This paper summarizes and in part reinterprets what is known about the eruption and presents information from new and ongoing studies. Total distance spanned by the eruption is 32 km north-south. The northernmost fl ow of the NWRZ blocked the Deschutes River upstream from the city of Bend, Oregon, and changed the course of the river. Renewed mafi c activity in the region, particu-larly eruptions such as the NWRZ with tephra plumes and multiple lava fl ows from many vents, would have signifi cant impacts for the residents of Bend and other cen-tral Oregon communities.
*[email protected]; [email protected]; [email protected]; [email protected]
Mckay, D. Donnelly-Nolan, J.M., Jensen, R.A., and Champion, D.E., 2009, The post-Mazama northwest rift zone eruption at Newberry Volcano, Oregon, in O’Connor, J.E., Dorsey, R.J., and Madin, I.P., eds., Volcanoes to Vineyards: Geologic Field Trips through the Dynamic Landscape of the Pacifi c Northwest: Geological Society of America Field Guide 15, p. 91–110, doi: 10.1130/2009.fl d015(05). For permission to copy, contact [email protected]. ©2009 The Geological Society of America. All rights reserved.
on June 1, 2012fieldguides.gsapubs.orgDownloaded from

92 Mckay et al.
INTRODUCTION
The post-Mazama northwest rift zone eruption (NWRZ) of Newberry Volcano, Oregon, took place ~7000 years ago sub-sequent to the eruption that produced the Crater Lake caldera ~7650 years ago (Hallett et al., 1997) and mantled Newberry with Mazama ash. The NWRZ includes multiple lava fl ows from a variety of vents along northwest trends over a north-south dis-tance of ~32 km (Fig. 1). Lavas ranging in composition from basalt through andesite erupted from cinder cones and spatter vents extending from the low northwest fl ank of the volcano to the inner north wall of the caldera, and south to include one eruption on the upper southwest fl ank. This eruptive event repre-sents the most recent mafi c volcanic activity at Newberry, which is dotted with some 400 mafi c cinder cones and fi ssure vents (MacLeod and Sherrod, 1988).
The mafi c lava fl ows of the NWRZ were described briefl y by Nichols and Stearns (1938), who wrote that the fi ssure erup-tion extended from north of Lava Butte to the fi ssure described by Williams (1935) on the north wall of the caldera. Peterson and Groh (1965) fi rst used the term “Northwest Rift Zone.” Char-acteristics of the eruption that support the use of the term “rift zone” include multiple parallel fi ssures and aligned vents, as well as fractures. Peterson and Groh (1965) published the fi rst map of the lava fl ows and named many of them. MacLeod et al. (1995) divided the “Young basaltic andesite” of the northwest rift zone into 15 lava fl ows (Qyb 1–15) and a separate unit for vents (Qyc). They included fi ve lava fl ows (Qyb 10, 11,13–15) not identifi ed by Peterson and Groh (1965), most notably the Surveyors fl ow on the upper southwest fl ank of the volcano.
In this paper we summarize and discuss the previous work on the NWRZ, suggest revised interpretations, and present the results of new and ongoing work. Potential hazards of a similar eruption in the future are addressed, and possible future avenues of research are outlined.
THE NORTHWEST RIFT ZONE (NWRZ) ERUPTION
The NWRZ fl ows are mostly treeless and very youthful in appearance, ranging in morphology from fl uid pahoehoe to ‘a’a and block lava. New geologic work indicates that some previ-ously included lava fl ows are not part of the NWRZ, which is here reinterpreted to include twelve informally named lava fl ows, one very small unnamed fl ow, and the East Lake Fissure (Fig. 2). We conclude that two fl ows included by MacLeod et al. (1995) were not part of the eruption. One of these is The Dome and its lava fl ows, which are mantled by Mazama ash. We also exclude the Devils Horn fl ow, which was included in the NWRZ by MacLeod et al. (1995) although they recognized that it predates the Mazama ash bed.
The fl ow and vent types are listed in Table 1 along with areas, volumes, and vent elevations. Total area covered by the lava fl ows is ~68 km2; total estimated erupted volume including tephra is ~0.86 km3. Elevations of vents range from ~1375 m to
~2230 m. Over 90% of the NWRZ volume was erupted below 1750 m elevation, and in the northwesternmost 11 km of the rift zone (north group of Table 1). The only two large cinder cones, Lava Butte and Mokst Butte, were erupted in this northwestern portion of the rift. These two cones produced the two largest lava fl ows that together account for 80% of the total eruptive volume. The northernmost fl ow, the Lava Butte fl ow, is one of the most voluminous at over 0.3 km3. This is the lava fl ow that temporarily blocked the Deschutes River and changed the river’s course.
With a single exception, all vents in the southern portion (south group of Table 1 and Fig. 2) of the rift are spatter vents. Only the central vent in the spatter rampart of the Surveyors fl ow at the far southern end of the NWRZ can be considered as a small cinder cone. Spatter vents are also features of the northwestern section of the rift zone, although they produced only very small volume lava fl ows (North Sugarpine and Gas-Line).
The northwestern portion (north group of Table 1 and Fig. 2) of the NWRZ is also the widest, spanning multiple fi ssures across 10 km from the North Sugarpine and South Sugarpine vents to the Mokst fl ow vents and still farther east to the South Kelsey vents. Southeast of these vents, in the south group, the vent locations are narrowly focused, with the NWRZ not exceeding 1 km in width from the Forest Road fl ow to the East Lake Fissure. From there, the eruption stepped south 10 km and slightly to the west to the Surveyors fl ow vents. No stratigraphic relationship exists to indicate the age of the north group relative to the south group.
Paleomagnetic and Radiocarbon Data
Samples for paleomagnetic study were collected in 1974 and 1976. Cores were drilled from outcrops using a handheld, gasoline-powered 1-inch diameter coring drill. The East Lake Fissure and ten of the lava fl ows were sampled, in some cases from multiple sites within a single fl ow. Core samples from all sites were oriented using a sun compass, measured in the U.S. Geological Survey laboratory in Menlo Park, California, using a spinner magnetometer, and representative samples were tested by alternating-fi eld (AF) demagnetization. Most sites were found to have no secondary magnetic components and were not demagne-tized, while 4 sites were given blanket AF demagnetization of 20 or 30 mT. Characteristic remanent magnetization for each site was calculated using Fisherian statistics, and are listed in Table 2, and plotted in Figure 3. Results for the individual sites were originally published in Champion (1980) and published again in Hagstrum and Champion (2002), although we reinterpret the overall results.
In Table 2 and on Figure 3, we present a mean direction for 11 of the 12 sites. The average direction has a 95% confi dence circle of 1.9° radius, representing a well-grouped distribution. For this calculation, we excluded the site taken on the Mokst fl ow. The direction obtained for that site is noticeably different and does not overlap any of the other measured directions. The Mokst fl ow is an extremely rugged ‘a’a and block lava fl ow that offers rare options for drilling in-place lava that has not been rotated since it was emplaced.
on June 1, 2012fieldguides.gsapubs.orgDownloaded from

Post-Mazama northwest rift zone eruption at Newberry Volcano 93
Newberry margin
Newberry margin
Desch
utes R
iver
Wickiup Reservoir
Hw
y. 97
Hwy. 31
Hwy. 20
La Pine
Bend
0 10 20Kilometers
0 5 10
Miles
N
OREGON
Bend
Newberry Volcano
Cas
cade
s
100 km
Figure 1. Shaded relief regional location map showing Newberry Volcano (outline marked by dashed line) with northwest rift zone lavas shown in black. Numerous cinder cones are visible on the fl anks of the Newberry edifi ce and to the west toward the Cascade crest.
on June 1, 2012fieldguides.gsapubs.orgDownloaded from

94 Mckay et al.
Lava Flows
Nor
th G
roup
So
uth
Gro
up
Sugarpine Flow
Vents
Des
chut
es R
iver
Littl
e D
esch
utes
Riv
er
Paulina Creek
U.S
. 97
To B
end
U.S
. 97
To L
a P
ine
Rd. 21
Rd. 22
Rd. 9720
Rd. 9710
Rd. 9735
Rd. 9710
Rd. 1835
Rd. 21
Rd. 2225
Rd. 2125
Rim of Newberry Caldera
+Paulina Peak
Surveyors Flow
South Kelsey Flow
Mokst Butte Flow
South
North Sugarpine Flow
Lava Cast Forest Flow
Lava Cascade Flow
Hidden Flow
Forest Road Flow
North Summit Flow
East Lake Fissure
Lava Butte Flow
Gas-Line Flows
East LakePaulina
Lake
0 1 2
0 1 2 3
Miles
KilometersN
Post-Mazama flows along northwest rift zone
of Newberry Volcano
32J
33J
62J
63J
67J
68J
112J
152J
228J
231J
291J
331J
1243J
332J
340J
353J
355J
356J
464J
569J
1512J
1548J
1550J
1552J
1556J
LCF03
NSm02
Sur03Sur01
FoR02
Sun02
SPB02
Mks02
LaB04
LaB01
Gas03 Chs02
LaC01
TFS02
LCF01
SPB02 MB01
LCF02
LCF01
LB02LB01
GLF01
1551J1549J
557J
Figure 2. Map shows location and distribution of northwest rift zone lavas and vents, their names (informal), and the locations of analyzed samples. Paved roads are shown with solid lines; major graveled roads shown with dotted lines. North and south groups are indicated.
on June 1, 2012fieldguides.gsapubs.orgDownloaded from

Post-Mazama northwest rift zone eruption at Newberry Volcano 95
TA
BLE
1. N
OR
TH
WE
ST
RIF
T Z
ON
E (
NW
RZ
) P
AR
AM
ET
ER
S
Uni
t V
ent
type
V
ent
elev
atio
n (m
)
Flo
w
type
A
vera
ge fl
ow
thic
knes
s (m
)
Are
a of
flo
w
(km
2 )
Eru
ptiv
e vo
lum
es
(106 m
3 ) %
of t
otal
N
WR
Z
eru
ptio
n
%
of t
otal
u
nit v
olum
e F
low
V
ent
(DR
E)
Tep
hra
(DR
E)
Tot
al
F
low
V
ent
Tep
hra
Nor
th G
roup
Lava
But
te
Larg
e co
ne
1375
‘a
‘a
12
23.5
2 28
2.0
24.6
2.
6 30
9.2
35.9
91
.2
8.0
0.8
Gas
-Lin
e
Spa
tter
1375
ph
h 3
0.34
1.
0 0.
1 0.
03
1.1
0.1
88.5
8.
9 2.
6 M
okst
But
te
Larg
e co
ne
1725
‘a
‘a
bloc
k 15
23
.96
359.
4 20
.4
2.1
381.
9 44
.3
94.1
5.
3 0.
6
Sou
th K
else
y
Sm
all c
ones
15
50
‘a‘a
ph
h 9
1.19
10
.7
0.5
? 11
.2
1.3
95.5
4.
5 0.
0
Nor
th
Sug
arpi
ne
Spa
tter
1465
ph
h 2
0.52
1.
0 0.
02
? 1.
0 0.
1 98
.0
2.0
0.0
Sou
th
Sug
arpi
ne
Sm
all c
one
1500
‘a
‘a
phh
12
7.74
92
.9
7.6
1.1
101.
6 11
.8
91.4
7.
5 1.
1
N
orth
Gro
up T
otal
s
57.2
7 74
7.0
53.2
5.
8 80
6.0
93.5
92
.7
6.6
0.7
Sou
th G
roup
F
ores
t Roa
d
Spa
tter
1750
ph
h ‘a
‘a
3 0.
41
1.2
0.02
0.
003
1.2
0.1
98.1
1.
6 0.
3
Lava
Cas
t F
ores
t S
patte
r 17
70
phh
‘a‘a
3
1.32
4.
0 0.
1 0.
2 4.
3 0.
5 93
.0
2.3
4.7
Lava
Cas
cade
S
patte
r 18
30
phh
‘a‘a
5
6.92
34
.6
2.5
1.6
38.7
4.
5 89
.4
6.5
4.1
Hid
den
Spa
tter
1880
ph
h ‘a
‘a
2 0.
18
0.4
0.03
0.
002
0.4
0.1
92.6
6.
9 0.
5
Unn
amed
S
patte
r 21
40
phh
‘a‘a
1
0.05
0.
1 0.
02
? 0.
1 0.
0 83
.3
16.7
0.
0
Nor
th S
umm
it
Spa
tter
2230
ph
h ‘a
‘a
3 0.
26
0.8
0.06
?
0.9
0.1
93.0
7.
0 0.
0
Eas
t Lak
e F
issu
re
Spa
tter
2130
no
ne
0 0.
00
0.0
0.2
? 0.
2 0.
0 0.
0 10
0.0
0.0
Sur
veyo
rs
Spa
tter+
sm
all c
one
1770
‘a
‘a
phh
3 2.
90
8.7
0.8
0.9
10.4
1.
2 83
.6
7.7
8.7
Sou
th G
roup
Tot
als
12
.04
49.8
3.
7 2.
7 56
.2
6.5
88.6
6.
6 4.
8
1 7
29
% 00 1 268
8 7 5
797 96
slato
T Z
RW
N N
ote:
Flo
w a
reas
wer
e m
easu
red
in a
CA
D p
rogr
am, w
hile
flow
thic
knes
ses
are
estim
ates
of a
vera
ge th
ickn
ess.
Thu
s flo
w a
nd to
tal v
olum
es a
re b
est e
stim
ates
. NW
RZ
tota
ls g
iven
to
near
est w
hole
num
ber.
DR
E—
dens
e ro
ck e
quiv
alen
t, ca
lcul
ated
usi
ng v
alue
s in
McK
nigh
t and
Will
iam
s (1
997)
; phh
—pa
hoeh
oe.
on June 1, 2012fieldguides.gsapubs.orgDownloaded from

96 Mckay et al.TABLE 2. NORTHWEST RIFT ZONE PALEOMAGNETIC DATA Lava flows Site Lat. Long. N/No Exp. I D α95 k R Plat. Plong. North Group Lava Butte LaBO 43.914° 238.642° 22/25 NRM 58.4° 351.5° 2.0° 245 21.91434 82.0° 114.1° Gas-Line GasO 43.907° 238.654° 12/12 NRM 57.6° 343.1° 2.3° 367 11.97003 76.1° 130.5° Mokst Butte
MksO 43.834° 238.713° 10/12 30 (65.3° 343.0°) 3.5° 193 9.95334 77.6° 171.2°
South Kelsey
ChsO 43.883° 238.752° 11/13 20+ 59.7° 350.3° 2.2° 420 10.97620 82.1° 126.9°
North Sugarpine
SPBO 43.828° 238.636° 12/12 30 58.2° 353.7° 4.4° 98 11.88768 83.2° 104.5°
South Sugarpine
SunO 43.818° 238.650° 12/12 20 57.7° 355.1° 2.8° 238 11.95374 83.4° 94.7°
43.85° 238.7° 5/6 58.4° 350.7° 2.5° 967 4.99586 81.6° 117.4° South Group Forest Road
ForO 43.820° 238.709° 20/20 NRM 51.8° 353.9° 1.4° 574 19.96689 77.7° 83.4°
Lava Cast Forest
LCFO 43.816° 238.711° 21/24 NRM 52.5° 352.9° 2.3° 188 20.89365 77.9° 88.4°
Lava Cascade
LaCO 43.788° 238.715° 24/24 NRM 55.3° 352.6° 3.6° 69 23.66515 80.2° 96.8°
North Summit
NSmO 43.750° 238.766° 13/15 NRM 54.9° 355.3° 3.8° 119 12.89950 81.0° 83.9°
East Lake Fissure
TFsO 43.736° 238.777° 12/12 NRM 57.0° 358.6° 2.3° 356 11.96908 83.8° 68.9°
Surveyors SurO 43.643° 238.747° 24/24 NRM 53.3° 354.1° 2.3° 169 23.86371 79.2° 85.8° 43.75° 238.75° 6/6 54.2° 354.5° 1.9° 1223 5.99591 80.0° 85.7° All Sites 43.8° 238.7° 11/12 56.1° 352.9° 1.9° 571 10.98250 81.0° 98.2° Note: Site is alphabetic site label. Lat./Long. are site latitude(°N) and longitude(°E) in degrees. N/No is the number of cores used in site averaging compared to the number of independent cores taken. Exp. is the peak alternating-field strength used in blanket demagnetization, (NRM) indicated that no demagnetization was necessary. I and D are remanent inclination and declination of site mean direction in degrees. α95 is the 95% confidence limit about the mean direction. k is the estimate of the Fisherian precision parameter. R is the length of the resultant vector. Plat./Plong. is the location in °N and °E of the virtual geomagnetic pole (VGP) calculated from the site mean direction. Parentheses around the Mokst Butte site mean direction indicate it was not used in group mean.
Figure 3. Portion of lower hemisphere equal-area diagram showing mean di-rections of remanent magnetization recorded in lava from 12 vents of the northwest rift zone (small black dots). Each direction is surrounded by circle of 95% confi dence. Mean direction for 11 of 12 sites, excluding Mokst Butte (see discussion in text), is shown with largest black dot and bold 95% confi -dence circle. Shaded circles are confi -dence limits surrounding mean direc-tions (mid size black dots) for north and south groups of vents, (see Table 2). Mokst Butte is located in the north group, but it was not included in the north group mean direction.
50°
70°
330° 30°0°345° 15°
Mokst Butte
“South”Group
80°
60°
All SitesMean
“North”Group
on June 1, 2012fieldguides.gsapubs.orgDownloaded from

Post-Mazama northwest rift zone eruption at Newberry Volcano 97
The results show that there is little range in average rema-nent directions for these sites, and much overlap, supporting the idea that these post-Mazama fl ows represent a short eruptive event. However, careful examination of the remanent inclina-tion values (Table 2) indicates that fl ows in the north group have systematically steeper inclination values than fl ows in the south group (Fig. 3). Separate mean directions of magnetization calcu-lated for the north and south groups (Table 2; Fig. 3) show them to be distinct and separable remanent magnetic populations, not recording the same remanent direction. The 4° angular separation in recorded magnetic direction could require many decades to possibly a century of time to have elapsed between the times of eruption of the north and south groups of vents (Champion and Shoemaker, 1977).
Multiple radiocarbon dates have been performed on sam-ples collected from the NWRZ. MacLeod et al. (1995) include a table listing 11 radiocarbon dates for this eruption, with sam-ples obtained from 8 different fl ows as reported by 5 different sources published from 1969 to 1990. The calibrated calendar ages range from 6610 to 7240 yr B.P. The average of all the ages listed in MacLeod et al. (1995) is 6927 yr B.P. and thus we use 7000 years ago as an estimate of the eruption age. Sub-averages of the radiocarbon ages for the north group of NWRZ lavas and the south group are nearly identical to each other. Thus, the pos-sible time gap indicated by paleomagnetic data is not refl ected in the radiocarbon data. The span of more than 600 years indi-cated by the range of measured ages suggests that the resolution of the existing radiocarbon data is inadequate to identify a time interval between episodes of eruptive activity along the NWRZ. Factors such as the type and location of a sample within the origi-nal burned tree, and the quality and thoroughness of radiocarbon sample pretreatment likely contribute to the span of measured ages and cannot be known from the existing data.
Erupted Compositions
Lava compositions listed in Table 3 and shown in Figure 4 range from basalt (51.3 wt% SiO
2) to andesite (58.4 wt% SiO
2),
but are dominantly in the basaltic andesite range (between 52.1 and 56.9 wt% SiO
2). Compositional variation of the NWRZ was
previously documented by MacLeod et al. (1995, map explana-tion), who presented silica contents of many of the lava fl ows. A handful of complete analyses of NWRZ lavas are given in MacLeod and Sherrod (1988).
Vent type and SiO2 content do not appear to be correlated
in this eruption. The lowest-SiO2 vents are spatter vents and pro-
duced fl uid pahoehoe lava fl ows at North Sugarpine. However, among the highest-SiO
2 vents, Mokst Butte at 57.4% SiO
2 built a
large cinder cone, whereas farther south spatter vents have even higher SiO
2 contents. The Lava Cascade spatter vents have 57.5%
SiO2, and a spatter vent for the Hidden fl ow has even higher SiO
2
at 57.8%. A sample of the East Lake Fissure, which consists entirely of spatter, also has high silica with 57.3%. However, these southern vents produced much smaller volumes of lava.
One possible explanation for the drastic difference in vent mor-phology at the same high silica content could be that the southern spatter vents were only in eruption for a very short period, never building into large cones. Another possible explanation might be that the andesitic magma was unusually hot, and thus more fl uid than typical andesite lavas. By contrast, Mokst Butte lava may have been more volatile-rich.
Variation diagrams (Fig. 4) demonstrate the wide composi-tional range of the NWRZ lavas. However, all analyzed samples fall into the calc-alkaline fi eld. The plots in Figure 4 show that the northwestern lavas (north group of Table 1 and Fig. 2) display a wider range of compositions than the much less voluminous south group lavas. North and south group andesites show con-siderable overlap. Andesite (lava with 57%–62% SiO
2) is a rela-
tively rare composition at Newberry.Strontium contents of NWRZ lavas with <4.7 wt% MgO
range from 280 to 361 ppm (Fig. 4, Table 3). By contrast the two fl ows that were included in the NWRZ by MacLeod et al. (1995), but excluded by us have Sr contents at approximately the same MgO content (<4.6 wt%) of 497–502 ppm (The Dome) and 582–649 ppm (Devils Horn). Thus, besides their stratigraphic position below the Mazama ash bed, the signifi cantly higher Sr values distinguish these two fl ows from the NWRZ.
Petrographically, only the North and South Sugarpine fl ows display noticeable amounts of phenocrysts. They contain 1%–2% of phenocrysts, dominantly 1 mm plagioclase, but occasionally 2 mm plagioclase and 1 mm olivine, and rarely 1 mm clinopyrox-ene. In addition, however, 1–2 cm crystal clots containing plagio-clase+olivine+clinopyroxene are common. These clots are rarely seen in the other fl ows of the NWRZ, which typically contain less (and commonly much less) than 1% of phenocrysts, nearly always plagioclase, but occasionally including olivine.
It is apparent on Figure 4 that the Hidden fl ow lavas of the south group and the Mokst fl ow lavas of the north group have similar compositions. They are also located on the same north-west trend, slightly offset from the northwest trend that includes the Lava Butte, Lava Cast Forest, Lava Cascade, etc., fl ows. No study has been done, however, to assess the petrologic relation-ships among the lavas.
VENTS AND TEPHRAS OF THE NWRZ
In addition to the mapped lava fl ows, isopachs of tephra deposits produced by several of the vents were also mapped (MacLeod et al., 1995). More than 400 holes were dug or augered between 1977 and 1986 to determine the thickness and shape of the tephra plumes related to 9 vents along the NWRZ. Depths were readily determined in most holes over a third of a meter deep because of the easily identifi ed underlying Mazama ash bed. In shallower holes, root throw and animal burrows have thoroughly obscured the contact and the trace limit was visually established based on lack of surfi cial tephra fragments.
The eruption produced examples of the types of mafi c vents that are abundant on the fl anks of Newberry Volcano, including
on June 1, 2012fieldguides.gsapubs.orgDownloaded from

98 Mckay et al.
TA
BLE
3. C
HE
MIC
AL
AN
ALY
SE
S O
F N
OR
TH
WE
ST
RIF
T Z
ON
E L
AV
A A
ND
VE
NT
SA
MP
LES
No.
: esle
K htuoS
ettuB ts ko
MeniL-sa
G ettu
B avaLy
Nor
th S
ugar
pine
LaB
01
15
2 J 15
56
J La
B
04
1552
J
Gas 03
22
8 J 34
0 J 23
1 J 15
48 J 56
9 J 15
50 J M
ks
02
62 J 33 J
32 J C
hs 02
SP
B02
35
3 J 68 J
356 J
wt%
SiO
2 55
.3
56.1
56
.2
56.1
55
.4
55. 4
57
.5
58.4
57
.6
57.2
57
.8
57.4
57
.2
58.0
55
.6
55.6
55
.6
51.7
51
.9
51.8
51
.8
Al 2O
3 17
.3
17.2
17
.2
17.1
17
.3
17. 3
15
.9
15.8
15
.8
16.0
15
.9
16.1
16
.0
15.9
16
.5
16.5
16
.5
17.3
17
.4
17.3
17
.4
FeO
* 7.
43
7.11
7.
04
7.08
7.
23
7.18
7.
81
7.47
7.
74
7.81
7.
60
7.71
7.
86
7.60
8.
21
8.24
8.
21
8.68
8.
63
8.69
8.
60
MgO
5.
10
5.00
4.
91
5.04
5.
27
5.31
4.
16
4.09
4.
26
4.37
4.
31
4.15
4.
31
4.09
4.
72
4.65
4.
69
6.31
6.
32
6.32
6.
34
CaO
8.
10
8.00
7.
99
7.99
8.
37
8.27
7.
32
6.88
7.
26
7.44
7.
14
7.26
7.
28
6.96
7.
87
7.90
7.
86
9.95
9.
92
9.98
9.
97
Na 2O
3.
94
3.72
3.
88
3.85
3.
73
3.77
3.
98
3.98
4.
01
3.94
3.
94
4.06
3.
98
4.00
3.
96
3.94
4.
00
3.55
3.
36
3.46
3.
47
K2O
1.
23
1.35
1.
35
1.33
1.
25
1.25
1.
64
1.78
1.
68
1.63
1.
70
1.65
1.
66
1.75
1.
33
1.35
1.
34
0.67
0.
63
0.66
0.
64
TiO
2 1.
17
1.08
1.
06
1.09
1.
09
1.08
1.
26
1.23
1.
26
1.28
1.
22
1.28
1.
28
1.24
1.
35
1.35
1.
34
1.34
1.
35
1.33
1.
35
P2O
5 0.
29
0.26
0.
22
0.27
0.
23
0.26
0.
28
0.27
0.
28
0.21
0.
22
0.22
0.
26
0.26
0.
29
0.30
0.
28
0.31
0.
32
0.31
0.
32
MnO
0.
14
0.13
0.
13
0.13
0.
14
0.13
0.
14
0.14
0.
14
0.15
0.
14
0.15
0.
15
0.14
0.
15
0.15
0.
15
0.16
0.
16
0.15
0.
15
pp
m
Rb
27
31
32
29
29
26
46
49
47
43
46
43
39
44
29
29
30
8 11
17
11
S
r 41
0 35
9 38
7 39
0 40
0 38
9 29
1 28
0 28
9 29
8 28
8 29
3 30
7 28
0 33
0 33
5 32
5 43
5 43
3 43
5 43
2 Y
26
24
25
25
24
24
32
33
31
31
31
32
30
31
30
29
25
22
23
27
25
Z
r 16
9 15
4 15
6 16
7 14
3 14
6 17
2 18
8 17
3 16
9 18
0 18
0 19
1 19
1 18
0 18
1 18
0 11
3 11
4 11
6 11
5 N
b 15
12
9
13
10
12
12
14
13
12
13
11
14
16
13
15
17
11
10
11
11
Ba
342
351
370
351
335
364
426
418
435
388
394
400
376
398
348
349
369
229
219
232
222
Ni
40
39
47
47
52
53
25
19
23
20
23
17
28
25
29
23
31
44
44
37
42
Cu
63
74
67
73
62
79
60
57
49
59
58
54
66
60
61
56
63
85
88
84
93
Zn
75
80
73
80
72
71
73
77
74
81
76
76
75
81
80
75
84
79
76
72
76
Cr
102
11
4
35
37
37
47
43
43
129
13
2 C
e
31
27
32
36
38
34
34
35
22
21
Ga
18
18
20
18
18
18
20
18
21
17
La
16
16
15
16
20
16
14
15
12
8 N
d
16
17
23
15
16
18
21
19
17
18
V
167
176
198
183
196
198
17
9 19
4
221
22
6
N
43°
55
.75
55.3
2 55
.00
54.8
5 54
.54
54.4
2 52
.48
52.4
3 51
.24
50.8
6 50
. 47
50.2
3 50
.07
50.0
5 52
.65
53.6
6 52
.97
49.6
7 49
.63
49.5
2 49
.43
W 1
21°
24.4
6 21
.38
21.1
2 21
.48
21.0
6 20
.77
17.6
0 20
.19
16.5
0 16
.17
17. 2
0 16
.67
17.2
5 16
.33
14.4
0 15
.67
14.8
9 21
.87
22.3
6 21
.40
21.2
4
Not
e: S
ampl
e lo
catio
ns a
re s
how
n on
Fig
. 2. C
hem
ical
ana
lyse
s pe
rfor
med
at U
.S. G
eolo
gica
l Sur
vey,
Den
ver ,
Col
orad
o, e
xcep
t 151
2J, 1
548J
, 155
0J, 1
552J
, and
155
6J, w
hich
wer
e an
alyz
ed a
t Was
hing
ton
Sta
te U
nive
rsity
. M
ajor
ele
men
t ana
lyse
s ar
e no
rmal
ized
to 1
00%
vol
atile
-fre
e w
ith a
ll iro
n ca
lcul
ated
as
FeO
and
indi
cate
d as
FeO
*. L
atitu
de/L
ongi
tude
loca
tions
are
all
in d
ecim
al m
inut
es. E
LF—
Eas
t Lak
e F
issu
re.
(con
tinue
d)
on June 1, 2012fieldguides.gsapubs.orgDownloaded from

Post-Mazama northwest rift zone eruption at Newberry Volcano 99
TA
BLE
3. C
HE
MIC
AL
AN
ALY
SE
S O
F N
OR
TH
WE
ST
RIF
T Z
ON
E L
AV
A A
ND
VE
NT
SA
MP
LES
(co
ntin
ued)
No.
: S
outh
Sug
arpi
ne
For
est R
oad
Lava
Cas
t For
est
Lava
Cas
cade
Hid
den
Nor
th S
umm
itE
LFS
urve
yors
355 J
Sun
02
67
J
63
J F
oR
02
LCF
03
LCF
01
112 J
LaC
01
332 J
331 J
1243
J
464 J
NS
m02
T
FS
02
Sur 01
S
ur 03
1512 J
291 J
wt%
S
iO2
53.4
52
.1
53.2
53
.7
53.6
54
.2
54. 1
53
.5
54.9
57
.5
57.8
57
.7
55.2
55
.3
57.3
55
.1
55.8
56
.7
55.3
A
l 2O3
16.7
17
.1
16.9
17
.3
17.3
17
.1
17. 1
17
.4
16.9
16
.4
15.8
15
.6
16.8
16
.9
16.5
16
.9
16.8
16
.9
16.9
F
eO*
8.73
8.
68
8.61
8.
19
8.15
8.
03
8.07
8.
22
7.96
7.
53
7.68
7.
83
7.94
7.
92
7.55
7.
69
7.49
7.
23
7.67
M
gO
5.36
6.
09
5.59
5.
47
5.58
5.
32
5.41
5.
59
5.03
3.
99
4.31
4.
25
4.89
4.
78
3.98
5.
23
4.98
4.
57
5.22
C
aO
9.14
9.
80
9.28
9.
03
9.10
8.
81
8.89
9.
14
8.44
7.
14
7.21
7.
28
8.37
8.
27
7.20
8.
40
8.08
7.
68
8.36
N
a 2O
3.73
3.
65
3.66
3.
65
3.72
3.
82
3.74
3.
65
3.94
4.
12
3.90
4.
15
3.90
3.
94
4.17
3.
83
3.93
3.
96
3.68
K
2O
0.90
0.
72
0.88
0.
92
0.87
1.
03
0.92
0.
87
1.13
1.
51
1.66
1.
67
1.12
1.
17
1.56
1.
15
1.29
1.
43
1.21
T
iO2
1.46
1.
36
1.37
1.
27
1.27
1.
27
1.26
1.
28
1.26
1.
28
1.25
1.
24
1.28
1.
27
1.29
1.
23
1.20
1.
18
1.21
P
2O5
0.34
0.
31
0.34
0.
32
0.30
0.
30
0.30
0.
27
0.31
0.
33
0.25
0.
21
0.32
0.
31
0.31
0.
31
0.30
0.
27
0.33
M
nO
0.16
0.
16
0.16
0.
15
0.15
0.
15
0.15
0.
15
0.15
0.
14
0.14
0.
15
0.15
0.
15
0.14
0.
15
0.14
0.
14
0.14
ppm
R
b 19
16
19
23
24
21
19
15
23
38
45
45
25
25
36
26
32
36
29
S
r 40
3 41
6 38
4 41
9 44
6 43
4 40
5 40
9 41
0 36
1 28
8 29
9 39
3 39
1 3
38
394
360
359
383
Y
27
23
23
24
24
23
24
28
23
37
32
32
31
27
28
25
26
29
28
Zr
141
119
131
132
130
139
133
123
153
183
179
180
150
153
173
159
161
172
157
Nb
12
10
12
13
13
13
15
10
13
13
13
14
12
14
13
17
12
11
12
Ba
283
255
276
283
283
326
303
279
342
429
400
409
314
359
413
347
367
395
341
Ni
26
35
30
38
46
38
42
39
38
22
23
32
36
16
36
35
33
36
C
u 76
81
94
74
84
79
79
94
84
51
56
58
67
75
63
76
69
60
67
Z
n 80
78
91
77
84
76
84
87
86
76
78
75
78
88
93
86
77
78
76
C
r 77
51
35
46
85
97
95
C
e 30
31
34
28
35
35
Ga
20
18
20
18
18
17
17
La
12
17
15
10
18
17
N
d 22
26
27
17
21
31
V
228
185
196
188
203
167
18
4
N
43°
49
.15
49.0
6 49
.02
49.4
0 49
.19
48.9
7 48
.94
48.6
4 47
.30
47.1
6 47
.45
47.0
7 45
.07
44.9
9 44
.15
38.6
0 38
.60
38.3
2 37
.20
W 1
21°
22.0
8 21
.02
20.7
7 17
.61
17.4
8 17
.32
17.3
3 16
.91
17.2
0 15
.98
15.4
3 15
.35
13.9
7 13
.90
13.4
1 15
.16
15.1
6 14
.70
18.6
7
Not
e: S
ampl
e lo
catio
ns a
re s
how
n on
Fig
. 2. C
hem
ical
ana
lyse
s pe
rfor
med
at U
.S. G
eolo
gica
l Sur
vey,
Den
ver,
Col
orad
o, e
xcep
t 151
2J, 1
548J
, 155
0J, 1
552J
, and
155
6J, w
hich
wer
e an
alyz
ed a
t W
ashi
ngto
n S
tate
Uni
vers
ity. M
ajor
ele
men
t ana
lyse
s ar
e no
rmal
ized
to 1
00%
vol
atile
-fre
e w
ith a
ll iro
n ca
lcul
ated
as
FeO
and
indi
cate
d as
FeO
*. L
atitu
de/L
ongi
tude
loca
tions
are
all
in d
ecim
al m
inut
es.
ELF
—E
ast L
ake
Fis
sure
.
on June 1, 2012fieldguides.gsapubs.orgDownloaded from

100 Mckay et al.
250
300
350
400
450
4 4.5 5 5.5 6 6.5
Lava ButteGas-LineMokst ButteSouth KelseyN. SugarpineS. SugarpineForest RoadLava Cast ForestLava CascadeHiddenNorth SummitEast L. FissureSurveyors
ppp
m S
r
wwt .% MgO
0.6
0.8
1
1.2
1.4
1.6
1.8
4 4.5 5 5.5 6 6.5
wwt.
% K
2O
wwt .% MgO
1
1.1
1.2
1.3
1.4
1.5
4 4.5 5 5.5 6 6.5
wwt.
% T
iO2
wwt .% MgO
7
7.5
8
8.5
4 4.5 5 5.5 6 6.5
wwt.
% F
eO*
wwt .% MgO
51
52
53
54
55
56
57
58
59
4 4.5 5 5.5 6 6.5
wwt.
% S
iO2
wwt .% MgO
1.3
1.4
1.5
1.6
1.7
1.8
1.9
51 52 53 54 55 56 57 58 59
FFeO
*/M
gO
wt .% SSiO2
TH
CA
Figure 4. Variation diagrams showing chemical variability of northwest rift zone lavas (see Table 1). Tholeiitic (TH) and calc-alkaline (CA) dividing line from Miyashiro (1974).
on June 1, 2012fieldguides.gsapubs.orgDownloaded from
Post-Mazama northwest rift zone eruption at Newberry Volcano 101
large and small cinder cones, spatter cones and spatter ramparts, as well as fi ssures, representing both Strombolian and Hawaiian types of activity. It provides the opportunity to study a variety of eruption styles as they manifested in an eruptive event that took place over a relatively short interval of time.
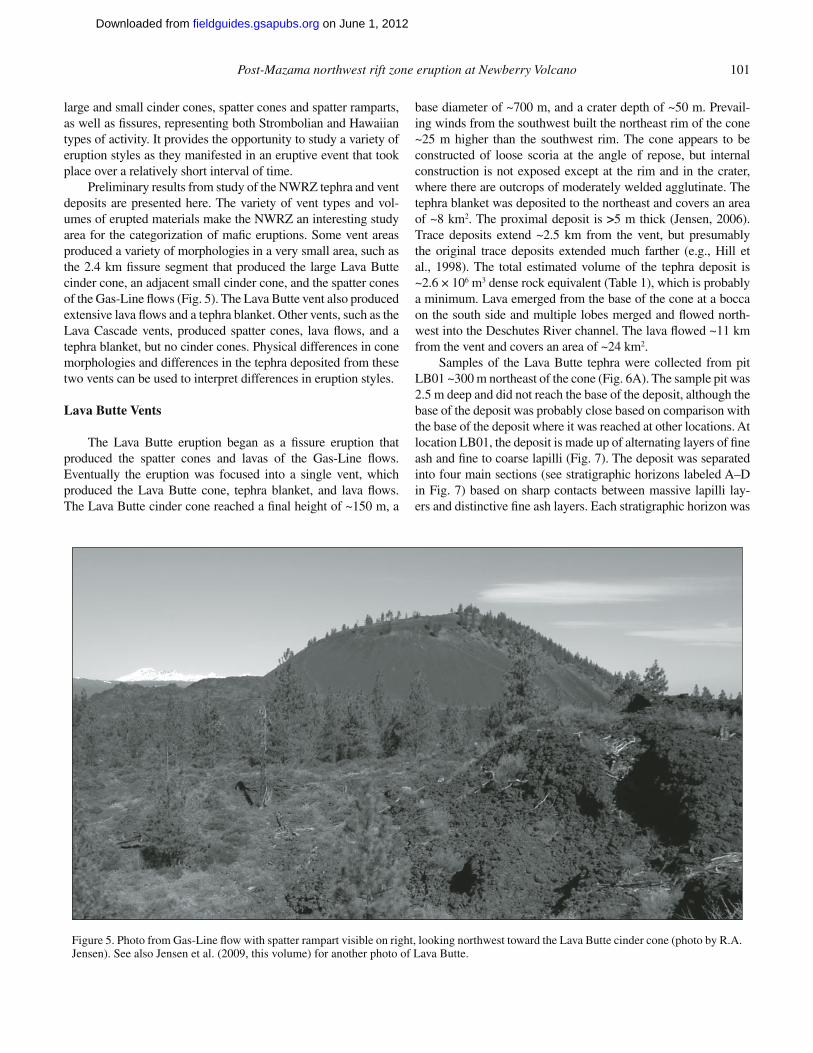
Preliminary results from study of the NWRZ tephra and vent deposits are presented here. The variety of vent types and vol-umes of erupted materials make the NWRZ an interesting study area for the categorization of mafi c eruptions. Some vent areas produced a variety of morphologies in a very small area, such as the 2.4 km fi ssure segment that produced the large Lava Butte cinder cone, an adjacent small cinder cone, and the spatter cones of the Gas-Line fl ows (Fig. 5). The Lava Butte vent also produced extensive lava fl ows and a tephra blanket. Other vents, such as the Lava Cascade vents, produced spatter cones, lava fl ows, and a tephra blanket, but no cinder cones. Physical differences in cone morphologies and differences in the tephra deposited from these two vents can be used to interpret differences in eruption styles.
Lava Butte Vents
The Lava Butte eruption began as a fi ssure eruption that produced the spatter cones and lavas of the Gas-Line fl ows. Eventually the eruption was focused into a single vent, which produced the Lava Butte cone, tephra blanket, and lava fl ows. The Lava Butte cinder cone reached a fi nal height of ~150 m, a
base diameter of ~700 m, and a crater depth of ~50 m. Prevail-ing winds from the southwest built the northeast rim of the cone ~25 m higher than the southwest rim. The cone appears to be constructed of loose scoria at the angle of repose, but internal construction is not exposed except at the rim and in the crater, where there are outcrops of moderately welded agglutinate. The tephra blanket was deposited to the northeast and covers an area of ~8 km2. The proximal deposit is >5 m thick (Jensen, 2006). Trace deposits extend ~2.5 km from the vent, but presumably the original trace deposits extended much farther (e.g., Hill et al., 1998). The total estimated volume of the tephra deposit is ~2.6 × 10⁶ m3 dense rock equivalent (Table 1), which is probably a minimum. Lava emerged from the base of the cone at a bocca on the south side and multiple lobes merged and fl owed north-west into the Deschutes River channel. The lava fl owed ~11 km from the vent and covers an area of ~24 km2.
Samples of the Lava Butte tephra were collected from pit LB01 ~300 m northeast of the cone (Fig. 6A). The sample pit was 2.5 m deep and did not reach the base of the deposit, although the base of the deposit was probably close based on comparison with the base of the deposit where it was reached at other locations. At location LB01, the deposit is made up of alternating layers of fi ne ash and fi ne to coarse lapilli (Fig. 7). The deposit was separated into four main sections (see stratigraphic horizons labeled A–D in Fig. 7) based on sharp contacts between massive lapilli lay-ers and distinctive fi ne ash layers. Each stratigraphic horizon was
Figure 5. Photo from Gas-Line fl ow with spatter rampart visible on right, looking northwest toward the Lava Butte cinder cone (photo by R.A. Jensen). See also Jensen et al. (2009, this volume) for another photo of Lava Butte.
on June 1, 2012fieldguides.gsapubs.orgDownloaded from

102 Mckay et al.
further subdivided and sampled based on changes between fi ne ash and fi ne to coarse lapilli. Individual layers within the deposit are well sorted (Fig. 7). The tephra is made up of three juvenile components that differ in vesicularity: (1) tan, highly vesicular scoria (sideromelane), (2) black, less vesicular scoria (tachylite), and (3) dense fragmented lava (Fig. 8). Sideromelane and tachy-
lite clasts are similar to those observed at Cinder Cone, Califor-nia (Heiken, 1978). All three components are crystal poor, as is the lava fl ow, but some clasts contain plagioclase phenocrysts. Loose crystals in the tephra are very rare. With regard to grain size, black scoria dominates in the <8 mm size range, whereas tan scoria dominates in the >8 mm size range (Fig. 9). The deposit
0.9
0.3
T
0.3
0.3
T
T
3
0.9
0.3
T
Lava Butte Flow
VC
VC Lava Lands Visitor Center
A
Gas-Line Flows
F.S. Rd. 9710
F.S. Rd.
9710
U.S
. 97
LB01
GLF01
T
T
0.3
0.3
0.9
North Sugarpine Flow
South Sugarpine Flow
C
Lava Cascade Flow
F.S. Rd. 9720
F.S.
Rd.
972
4
F.S.
Rd.
972
5T
T
T
0.3
0.3
0.3
0.3
0.9
0.9
Flow area covered by more than 0.3 m of tephra.
0.3
Mokst Butte Flow
B
F.S. Rd. 9720
F.S. R
d. 9710
F.S. Rd. 9710
F.S
. Rd.
181
0
N2 Kilometers0 1
0 1 Mile
Sample Site
Trace of tephra
Tephra depth (meters)0.6
T
Vent deposits
Figure 6 (continued on next page). (A–E) Maps showing isopachs of mapped tephra deposits (adapted from Jensen, 2006) and locations of tephra sample pits discussed in text.
on June 1, 2012fieldguides.gsapubs.orgDownloaded from

Post-Mazama northwest rift zone eruption at Newberry Volcano 103
also contains lapilli pyroclasts that resemble tan scoria but have fl attened shapes with relatively smooth wavy surfaces (Fig. 8). Similar clasts (Fig. 10) have been observed in the tephra deposit from Paricutin, Mexico (Pioli et al., 2008).
Tephra from the Gas-Line vents is exposed in a quarry ~100 m east of U.S. Highway 97. This deposit differs from the Lava Butte tephra in covering signifi cantly less area (Fig. 6A) and consisting of only one component, tan highly vesicular scoria. The tephra blan-ket is characterized by massive lapilli layers containing large, very
vesicular, glassy clasts (Fig. 11). These large glassy clasts are com-mon in the Gas-Line tephra but not seen in the Lava Butte tephra.
Lava Cascade Vents
The Lava Cascade vents are a series of northwest trend-ing fi ssure vents that extend for ~3.5 km (Fig. 6D). Unlike the Lava Butte eruption, the Lava Cascade eruption did not become focused into a single vent and no cinder cone was formed.
1.50.3
0.15
T
Surveyors Flow
E
F.S. Rd.2225
F.S. Rd. 2225 F.S. Rd. 2125
T
T
0.3
T
0.3
0.3
T
0.6
0.6
Mokst Butte Flow
Forest Road Flow
Lava Cast Forest Flow
Lava
CascadeFlow
Hidden Flow
D
F.S. Rd. 9710F.S. Rd. 9710
F.S. Rd. 9735
F.S
. Rd.
971
0
LCF02
LCF01
N2 Kilometers0 1
0 1 Mile
Sample Site
Trace of tephra
Tephra depth (meters)0.6
T
Vent deposits
Figure 6 (continued).
on June 1, 2012fieldguides.gsapubs.orgDownloaded from

104 Mckay et al.
250
200
150
100
50
Depth (cm)
A-1 Massive, well-sorted lapilli with many roots, upper layeris reworked and weathered.
C-2 Well-sorted, thin (3-4 cm) ash layer.
B-3 Well-sorted lapilli, separated from B-2 by at least one verythin ash layer.
C-1 Massive, well-sorted lapilli.
B-2 Well-sorted lapilli, separated from B-1 by at least four verythin ash layers.
D-1 Massive, well-sorted lapilli.
A-2 Well-sorted, thin (1-2 cm) ash layer.
A-3 Massive, well-sorted lapilli, grades downward.
A-4 Poorly sorted, thin (1-2 cm) ash layer.A-5 Well sorted lapilli, separated from A-4 by at least one
very thin ash layer.A-6 Well-sorted lapilli, separated from A-5 by at least two very
thin ash layers.
B-1 Well-sorted, thin (3-4 cm) ash layer.
Reworked tephra and soil with many roots.
Diameter (φ)Wt%
A-3
0
20
40
-4 -2 0 2 4
A-1
0
20
40
-4 -2 0 2 4
A-5
0
20
40
-4 -2 0 2 4
B-1
0
20
40
-4 -2 0 2 4
B-2
0
20
40
-4 -2 0 2 4
C-1
0
20
40
-4 -2 0 2 4
D-1
0
20
40
-4 -2 0 2 4
A-4
0
20
40
60
-4 -2 0 2 4
A-6
0
20
40
-4 -2 0 2 4
A-2
0
20
40
-4 -2 0 2 4
B-3
0
20
40
-4 -2 0 2 4
C-2
0
20
40
-4 -2 0 2 4
Figure 7. Partial stratigraphic column of the proximal Lava Butte tephra deposit at location LB01, ~300 m northeast of the cone (loca-tion shown in Fig. 6A). The sample pit was 2.5 m deep and did not reach the base of the deposit. Four stratigraphic horizons (A–D) were identifi ed based on contacts between massive lapilli layers and distinctive fi ne ash layers. Each horizon was further subdivided based on changes between fi ne ash and fi ne to coarse lapilli. Histograms on the right show grainsize data for samples collected from each horizon. Individual layers are well-sorted and average grainsize is smaller than the Lava Cascade tephra (grainsize data shown in Fig. 12).
on June 1, 2012fieldguides.gsapubs.orgDownloaded from

Post-Mazama northwest rift zone eruption at Newberry Volcano 105
A B
C D
10 mm
10 mm
10 mm
3 cm
Figure 8. Three components of the Lava Butte tephra: (A) tan, highly vesicular scoria (sideromelane), (B) black, less vesicular scoria (tachylite), and (C) dense fragmented lava. The tephra deposit also contains lapilli pyroclasts that resemble tan scoria but have fl attened shapes with relatively smooth wavy surfaces (D).
A-1 through A-6
B-1 through B-3
C-1 through C-2
D-1
Black ScoriaTan Scoria
Lava Fragments
Figure 9. Componentry of stratigraphic horizons A–D of the Lava Butte tephra deposit. Black, less vesicular scoria dominates in horizons deposited dur-ing early phases of the eruption (C and D). Proportions of dense fragmented lava are also higher in these horizons. Horizons deposited during later phas-es of the eruption (A and B) are also dominated by black scoria, but show increasing proportions of tan, highly vesicular scoria.
on June 1, 2012fieldguides.gsapubs.orgDownloaded from

106 Mckay et al.
Activity was concentrated along a segment of the fi ssure ~1.5 km long and ~250 m wide. Densely welded spatter cones and ram-parts up to ~10 m high were formed along this segment of the fi s-sure system. A tephra blanket covering ~8 km2 was deposited to the southeast. The proximal deposit is >1.5 m thick and present-day trace deposits extend ~4 km from the vents. Total estimated volume of the tephra deposit is ~1.6 × 10⁶ m3 dense rock equiva-lent (Table 1), which is probably a minimum. Lava fl ows extend ~6 km to the west and northwest and cover an area of ~7 km2.
Samples of the Lava Cascade tephra were collected from two pits located ~250 m (LCF01) and ~850 m (LCF02) from the south end of the main set of vents (Fig. 6D). At LCF01, the deposit is >1.5 m thick (the sample pit did not reach the base of
the tephra). This deposit was separated into three stratigraphic horizons based on gradational changes in clast size (Fig. 12). The entire exposed deposit is poorly sorted and average clast diam-eter increases with depth (Fig. 12). Large clasts are distinctively vesicular and glassy (Fig. 11). In contrast to the three types of clasts in the Lava Butte tephra (Fig. 8), the Lava Cascade tephra is composed of just one component, tan highly vesicular scoria similar to the tan scoria in the Lava Butte deposit.
Interpretation of Eruption Style
Using terminology applied in other volcanic areas around the world, we use the term “Strombolian” to describe the eruptive
A B
C D
10 mm
10 mm 5 mm
10 mm
Figure 10. Three components of the tephra from Paricutin, Mexico, as described by Pioli et al., 2008: (A) tan, highly vesicular scoria (sider-omelane), (B) black, less vesicular scoria (tachylite), and (C) dense fragmented lava. Flattened clasts with relatively smooth surfaces (D) have also been observed in the tephra deposit from Paricutin (Pioli et al., 2008). Photos A, B, and C courtesy of Kathy Cashman; photo D from Pioli et al. (2008).
on June 1, 2012fieldguides.gsapubs.orgDownloaded from

Post-Mazama northwest rift zone eruption at Newberry Volcano 107
Gas-Line clast
20 cm
Lava Cascade clasts
25 cm
B
A
Figure 11. Examples of large, very vesicular glassy clasts common in the Gas-Line and Lava Cascade tephra deposits. These clasts resemble products formed during Hawaiian-style lava fountaining (e.g., Mangan and Cashman, 1996).
on June 1, 2012fieldguides.gsapubs.orgDownloaded from

108 Mckay et al.
style that produced Lava Butte, and “Hawaiian” to describe the style of eruption that produced the Lava Cascade vents. Hawai-ian eruptions (e.g., Parfi tt, 1998; Francis and Oppenheimer, 2004; Valentine and Gregg, 2008) are characterized by effu-sive fi ssure eruptions with lava fountains 100s of meters high. These eruptions typically produce spatter ramparts and cones and extensive ‘a’a and pahoehoe lava fl ows. Pyroclastic mate-rial is usually limited to proximal deposits and includes coarse lapilli and bombs. Hawaiian-type spatter cones are constructed of moderately to densely welded clasts (Valentine and Gregg, 2008). Strombolian eruptions (e.g., Francis and Oppenheimer, 2004; McGetchin et al., 1974; Valentine and Gregg, 2008) are characterized by intermittent, often rhythmic, explosions or foun-taining of ballistic pyroclasts and weak eruption columns <1 km high. Cones are constructed at the angle of repose by the ejection of spatter, loose scoria, blocks, and bombs. Extensive ‘a’a lava fl ows are commonly produced, as are fi ne to coarse tephra depos-its that are decimeters to ~1 m thick and localized within 100s of meters from the vent. Violent Strombolian eruptions (e.g., Walker, 1973; Arrighi et al., 2001; Valentine and Gregg, 2008; Pioli et al., 2008) have been described as explosive activity that includes ejection of ballistic pyroclasts, voluminous ash produc-
Depth (cm)
50
200
150
100
Soil gradesA -into coarseweatheredtephra
B - Coarsetephra,gradationalcontact withLayer A
C –Very coarsetephra,gradationalcontact withLayer B
A
0
20
40
-6 -4 -2 0 2 4
Diameter (φ)Wt.
%
B
0
20
40
-6 -4 -2 0 2 4
C
0
20
40
-6 -4 -2 0 2 4
Figure 12. Stratigraphic column of the proximal Lava Cascade teph-ra deposit at location LCF01, ~250 m south of the vents (location shown in Fig. 6D). The sample pit was 1.5 m deep and did not reach the base of the deposit. Three stratigraphic horizons were identifi ed based on gradational changes in clast size. Histograms on the right show grainsize data for samples collected from each horizon. The deposit is poorly sorted with average grainsize larger than the Lava Butte tephra (compare Fig. 7).
tion, and sustained eruption columns up to 10 km high. Cinder cones generated by these violent eruptions display internal pla-nar stratifi cation not seen in cones produced by typical Strombo-lian activity (Valentine and Gregg, 2008). Ash-rich tephra blan-kets are produced that can be 10s of meters thick near the cone and extend 1 km to 10s of kilometers from the vent. Extensive ‘a’a lava fl ows may also be produced. Pioli et al. (2008) have described violent Strombolian eruptions as being characterized by simultaneous explosive activity from a cinder cone vent and effusive activity from lateral vents.
Study of the Lava Butte and Lava Cascade tephra deposits produced during the NWRZ eruption reveals important physical differences between deposits produced by different vents. Pre-liminary inferences based on the compiled observations of erup-tion styles listed above are presented here. The Lava Butte tephra deposit is >5 m thick near the vent, and presumably it originally extended >2.5 km from the vent prior to removal of trace deposits through erosional processes. Average grain size is small relative to the Gas-Line and Lava Cascade vents, suggesting the eruption was more explosive. The Gas-Line tephra is less voluminous, is limited to areas proximal to the vents, and contains very large clasts. This suggests that the Lava Butte–Gas-Line fi ssure erup-tion began as a Hawaiian-style eruption, but over time became Strombolian to violent Strombolian in style. The Gas-Line vents produced small, welded spatter cones and a limited tephra blanket characterized by massive lapilli layers and large, very vesicular glassy clasts. The Lava Butte vent farther down the fi ssure (Fig. 6) produced a large cinder cone and a more voluminous tephra blanket characterized by alternating layers of fi ne ash and lapilli. Physical characteristics of the Lava Butte tephra are similar to tephra characteristics from Paricutin, Mexico, the type example of violent Strombolian activity (e.g., Macdonald, 1972; Walker, 1973). Complex layers of alternating fi ne ash and lapilli have been interpreted to be the result of hundreds of highly explosive eruptive pulses at Paricutin (Pioli et al., 2008). The Lava Butte tephra deposit is proportionally much smaller than that of Pari-cutin, but the stratigraphy is similar (Fig. 13). Alternating layers of fi ne ash and lapilli, though not as complex as the Paricutin stratigraphy, suggest there were at least several phases of highly explosive pulses. Additionally, the three components and the fl at-tened clasts in the Lava Butte tephra are very similar to compo-nents identifi ed in tephra from Paricutin (Fig. 10).
The Lava Cascade eruption appears to have been similar to the early phase of the Lava Butte–Gas-Line eruption. Densely welded spatter cones and ramparts were produced along fi s-sure vents and the limited tephra blanket is characterized by massive poorly sorted lapilli layers and large, very vesicular, glassy clasts. Massive lapilli layers suggest that eruption intensi-ties were constant during tephra production, unlike the pulses of highly explosive activity that produced fi ne ash during the Lava Butte eruption. Large glassy clasts and tephra dominated by one (highly vesicular) component are similar to products formed during Hawaiian-style lava fountaining (e.g., Mangan and Cashman, 1996). Absence of a cinder cone suggests the
on June 1, 2012fieldguides.gsapubs.orgDownloaded from

Post-Mazama northwest rift zone eruption at Newberry Volcano 109
Lava Cascade eruption was not characterized by phases of Strombolian activity.
THE NWRZ AND HAZARDS IMPLICATIONS
The potential hazards of mafi c eruptions are commonly underappreciated despite the abundance of this type of volcanic activity. Mafi c eruptions can continue for days to years, and some vents remain intermittently active for decades to centuries (e.g., Hill et al., 1998). They can produce eruption columns as high as 10 km or more (Arrighi et al., 2001). Tephra production poses hazards to air and ground traffi c, property, agricultural produc-tion, and human health. In addition to tephra, mafi c vents often produce extensive lava fl ows that can block roads, start forest fi res, and alter the fl ow of surface water.
The city of Bend, Oregon, is located adjacent to the Deschutes River, which was blocked and partially diverted by lava fl ows from the NWRZ eruption. The blockage of the river would have resulted in at least temporary ponding of water behind the lava dam. If such an event took place today, hous-
ing developments upstream would suffer fl ooding and sudden release of the ponded water would endanger downtown Bend. Large tephra eruptions would also be a serious problem for Bend if winds blew from the south during the eruption. Study of the Lava Butte tephra indicates that at least three pulses of explosive activity took place early in the eruption. During a similar erup-tion, residents of Bend and nearby communities would likely have to deal with volcanic ash and its accompanying inconve-nience, property damage, and possible health impacts. Even a small lava fl ow that crossed U.S. Highway 97 (Figs. 1 and 2) and the railroad tracks just west of the highway would cause major economic disruption. Multiple lava fl ows erupted in forested ter-rain during dry summer months would undoubtedly result in for-est fi res with their attendant hazards.
Eruptions like the NWRZ that produce multiple vents and lava fl ows may persist intermittently for years or even decades. New geologic mapping and paleomagnetic work indicate that multi-vent, multi-fl ow eruptions are common at Newberry Vol-cano. The opening of a single vent would not preclude additional vents opening over an extended area. Understanding the nature
Paricutin Lava Butte
C-1
C-2
D-1
B-2
B-3
A B
Figure 13. Photographs of Lava Butte and Paricutin, Mexico, tephra deposits. (A) The Paricutin deposit shows fi nely stratifi ed layers of alternat-ing fi ne ash and lapilli, which has been interpreted as the result of hundreds of highly explosive eruptive pulses (Pioli et al., 2008). Approximate visible section of depth is 1.1 m. (B) The Lava Butte deposit also shows alternating layers of fi ne ash and lapilli, although not as fi nely stratifi ed as at Paricutin. Alternating layers in stratigraphic horizon B suggest there were at least several phases of highly explosive activity during the Lava Butte eruption. Approximate visible section of depth is 1 m. For complete stratigraphic column see Figure 7. (Paricutin photo courtesy of Kathy Cashman).
on June 1, 2012fieldguides.gsapubs.orgDownloaded from

110 Mckay et al.
and duration of this eruption will provide context for any future similar events.
CONCLUSIONS AND SUGGESTIONS FOR FUTURE WORK
The NWRZ eruption is the youngest mafi c eruption at Newberry Volcano. It took place ~7000 years ago, subsequent to deposition of the Mazama ash. Multiple vents produced lava fl ows over a distance of 32 km from the Deschutes River on the northwest to East Lake in Newberry caldera, and farther south to the upper southwest fl ank of Newberry Volcano. Eruptive activ-ity may have been episodic and could have continued intermit-tently for many decades. Erupted compositions range from basalt to andesite. At least one large cinder cone, Lava Butte, produced tephra plumes that likely would have reached the city of Bend when winds were blowing from the south. Previous data and interpretations about the NWRZ were reassessed. Two lava fl ows previously assigned to the eruption were excluded based on stra-tigraphy and geochemistry.
Lava fl ows from the NWRZ eruption crossed the present locations of busy U.S. Highway 97 and the adjacent railroad tracks, and blocked the Deschutes River, causing it to partially change its course. Another such eruption would likely endanger downtown Bend as well as upstream communities from potential fl ooding and volcanic ashfall, in addition to possible blockage of major transportation corridors and damage to utility corridors, resulting in signifi cant economic consequences.
Among suggestions for new work on the NWRZ, we list fi rst a petrologic study. No petrologic work has been done on the NWRZ. Also, better age control could perhaps be obtained by careful sampling of additional large tree molds that exist in some of the more fl uid lava fl ows, or by fi nding small charcoal fragments such as burned pine needles under the tephra deposits. Additional paleomagnetic sampling would help to constrain the possible time span of eruptive activity.
ACKNOWLEDGMENTS
We are grateful to M. Clynne and M. Patrick for their thorough and very helpful reviews.
REFERENCES CITED
Arrighi, S., Principe, C., and Rosi, M., 2001, Violent strombolian and subplin-ian eruptions at Vesuvius during post-1631 activity: Bulletin of Volcanol-ogy, v. 63, p. 126–150, doi: 10.1007/s004450100130.
Champion, D.E., 1980, Holocene geomagnetic secular variation in the western United States: Implications for the global geomagnetic fi eld: U.S. Geo-logical Survey Open File Report 80-824, 314 p.
Champion, D.E., and Shoemaker, E.M., 1977, Paleomagnetic evidence for epi-sodic volcanism on the Snake River Plain: Planetary Geology Field Con-ference on the Snake River Plain, Idaho, October 1977: NASA Technical Memorandum 78436, p. 7–8.
Francis, P., and Oppenheimer, C., 2004, Volcanoes: Oxford University Press, New York, 135 p.
Hagstrum, J.T., and Champion, D.E., 2002, A Holocene paleosecular variation record from 14C-dated volcanic rocks in western United States: Journal of Geophysical Research, v. 107, 14 p.
Hallett, D.J., Hills, L.V., and Clague, J.J., 1997, New accelerator mass spec-trometry radiocarbon ages for the Mazama tephra layer from Kootenay National Park, British Columbia, Canada: Canadian Journal of Earth Sci-ences, v. 34, p. 1202–1209, doi: 10.1139/e17-096.
Heiken, G., 1978, Characteristics of tephra from Cinder Cone, Lassen Volcanic National Park, California: Bulletin of Volcanology, v. 41–2, p. 119–130.
Hill, B.E., Connor, C.B., Jarzemba, M.S., LaFemina, P.C., Navarro, M., and Strauch, W., 1998, 1995 eruptions of Cerro Negro vol-cano, Nicaragua, and risk assessment for future eruptions: Geologi-cal Society of America Bulletin, v. 110, no. 10, p. 1231–1241, doi: 10.1130/0016-7606(1998)110<1231:EOCNVN>2.3.CO;2.
Jensen, R.A., 2006, Roadside guide to the geology and history of Newberry Volcano, 4th Ed.: Bend, Oregon, CenOreGeoPub, 182 p.
Jensen, R.A., Donnelly-Nolan, J.M., and Mckay, D.M., 2009, A fi eld guide to Newberry Volcano, Oregon, in O’Connor, J.E., Dorsey, R.J., and Madin, I.P., eds., Volcanoes to Vineyards: Geologic Field Trips through the Dynamic Landscape of the Pacifi c Northwest: Geological Society of America Field Guide 15, doi: 10.1130/2009.fl d015(03).
MacLeod, N.S., and Sherrod, D.R., 1988, Geologic evidence for a magma chamber beneath Newberry volcano, Oregon: Journal of Geophysical Research, v. 93, no. B9, p. 10067–10079, doi: 10.1029/JB093iB09p10067.
MacLeod, N.S., Sherrod, D.R., Chitwood, L.A., and Jensen, R.A., 1995, Geo-logic Map of Newberry volcano, Deschutes, Klamath, and Lake Counties, Oregon: U.S. Geological Survey Miscellaneous Geologic Investigations Map I-2455, scale 1:62,500.
Macdonald, G.A., 1972, Volcanoes: Prentice-Hall Inc., Englewood Cliffs, New Jersey, 510 p.
Mangan, M.T., and Cashman, K.V., 1996, The structure of basaltic scoria and reticulite and inferences for vesiculation, foam formation, and fragmenta-tion in lava fountains: Journal of Volcanology and Geothermal Research, v. 73, no. 1–2, p. 1–18, doi: 10.1016/0377-0273(96)00018-2.
McGetchin, T.R., Settle, M., and Chouet, B.A., 1974, Cinder cone growth mod-eled after Northeast crater, Mount Etna, Sicily: Journal of Geophysical Research, v. 79, no. 23, p. 3257–3272, doi: 10.1029/JB079i023p03257.
McKnight, S.B., and Williams, S.N., 1997, Old cinder cone or young com-posite volcano?: The nature of Cerro Negro, Nicaragua: Geology, v. 25, no. 4, p. 339–342, doi: 10.1130/0091-7613(1997)025<0339:OCCOYC>2.3.CO;2.
Miyashiro, A., 1974, Volcanic rock series in island arcs and active continental margins: American Journal of Science, v. 274, p. 321–355.
Nichols, R.L., and Stearns, C.E., 1938, Fissure eruptions near Bend, Oregon [abs.]: Geological Society of America Bulletin, v. 49, no. 12, pt. 2, p. 1894.
Parfi tt, E.A., 1998, A study of clast size distribution, ash deposition and frag-mentation in Hawaiian-style volcanic eruptions: Journal of Volcanol-ogy and Geothermal Research, v. 84, p. 197–208, doi: 10.1016/S0377-0273(98)00042-0.
Peterson, N.V., and Groh, E.A., eds., 1965, Lunar Geological Field Conference Guide Book: Oregon Department of Geology and Mineral Industries Bul-letin, 51 p.
Pioli, L., Erlund, E., Johnson, E., Cashman, K., Wallace, P., Rosi, M., and Del-gado Granados, H., 2008, Explosive dynamics of violent Strombolian eruptions: The eruption of Paricutin Volcano 1943–1952 (Mexico): Earth and Planetary Science Letters, v. 271, p. 359–368.
Valentine, G.A., and Gregg, T.K.P., 2008, Continental basaltic volcanoes—Pro-cesses and problems: Journal of Volcanology and Geothermal Research, v. 177, p. 857–873, doi: 10.1016/j.jvolgeores.2008.01.050.
Walker, G.P.L., 1973, Explosive volcanic eruptions—A new classifi cation scheme: Geologische Rundschau, v. 62, p. 431–446, doi: 10.1007/BF01840108.
Williams, H., 1935, Newberry volcano of central Oregon: Geological Society of America Bulletin, v. 46, no. 2, p. 253–304.
MANUSCRIPT ACCEPTED BY THE SOCIETY 18 JUNE 2009
Printed in the USA
on June 1, 2012fieldguides.gsapubs.orgDownloaded from