field experiments of beach scarp erosion during oblique … · 2017-09-08 · field experiments of...
TRANSCRIPT

Geomorphology 236 (2015) 132–147
Contents lists available at ScienceDirect
Geomorphology
j ourna l homepage: www.e lsev ie r .com/ locate /geomorph
Field experiments of beach scarp erosion during oblique wave, stormyconditions (Normandy, France)
Yoann Bonte ⁎, Franck LevoyUnité Morphodynamique Continentale et Côtière (M2C), Université de Caen-Basse Normandie, 24 rue des Tilleuls, 14000 Caen Cedex, France
⁎ Corresponding author. Tel.: +33 231 565 744.E-mail address: [email protected] (Y. Bonte).
http://dx.doi.org/10.1016/j.geomorph.2015.02.0140169-555X/© 2015 Elsevier B.V. All rights reserved.
a b s t r a c t
a r t i c l e i n f oArticle history:Received 2 July 2014Received in revised form 3 February 2015Accepted 15 February 2015Available online 21 February 2015
Keywords:Beach scarpSwash zoneBerm erosionVideo system measurementTerrestrial laserMacrotidal beaches
A field-based experimental study of beach scarpmorphodynamic evolution was conducted on the shoreface of amacrotidal sandy beach subject to storms combined with spring tide events (Luc-sur-Mer, France). Both videoand in-situ measurements on an artificial berm are used to understand beach scarp evolution over one tideduring stormy conditions. Image time stacks are used to analyze the swash action on the beach scarp and topo-graphical data of the scarp are recordedwith a terrestrial scanner laser to quantify themorphodynamic responseof the beach scarp to wave action. This work provides a new and unique dataset about beach scarp changes andberm morphology in particular under rising tide and oblique wind-wave conditions. During one stormy event,the berm was completely destroyed. However, contrasting alongshore changes were measured during theerosive phase with different crest and foot scarp retreats and eroded volumes between the west and the eastside of the berm. The beach in front of the scarp also shows a contrasting residual evolution, indicating an evidentlongshore sediment transport on the study area as a consequence of incident oblique wave conditions. A strongconnection between beach evolution and beach scarp changes is clearly identified. The scarp erosion increases onthe west side of the bermwhen the beach level is lowered and reduces when the beach surface rises on the eastside. The beach slope and foreshore elevation as a result of a longshore sediment transport between east andwestprofiles, influence swash activity. Overall, water depth and swash activity became progressively different alongthe scarp during the experiment.Swashmeasurements indicate that the presence of the beach scarp strongly influences the swashmotion. At hightide, the reflection of the uprush on the scarp front induces a collision between the reflected backwash and thefollowing uprush dynamic. These collisions reduce and sometimes stop the motion of the following uprush,reducing the incoming swash excursion. Consequently, the scarp presence modifies the swash interaction thatnormally appears on a planar beach surface. With a beach scarp, the swash energy level is substantiallyattenuated and its spectrum is characterized by a large band. The number of uprush impacts on the scarp frontcalculated from video images reaches about 25 per 5 min. In spite of the swash energy attenuation due toswash/swash interactions, these impacts provoke the berm destruction in about two hours. However, theonshore migration of the swash zone induced by the rising tide appears to be important to explain scarpdestruction, compensating the attenuated swash activity due to backwash-uprush interactions.
© 2015 Elsevier B.V. All rights reserved.
1. Introduction
Coastal dunes protect low-lying area from flooding and must beactively managed to prevent damage along many sandy coasts aroundthe world. The berm height constitutes an important element of thenatural system to control and reduce the rate of dune recession. Forexample, many beach nourishment projects include the constructionof a wide berm to improve the dissipation of wave energy duringmajor storms and to limit the shoreline erosion. However, beach scarpsafter nourishment can appear unexpectedly (Nishi et al., 1994; Seymour
et al., 2005) and cause inconvenience to beach users (Kobayashi et al.,2009; Ruiz de Alegria-Arzaburu et al., 2013).
Scarp formation has been also observed in a variety of natural sandybeaches around the world (Sherman and Nordstrom, 1985; Carter,1988; Short, 1999; Vousdoukas, 2012) and on artificial beaches(Kubota et al., 1997). Scarp persistence depends of the local beachconditions. A beach scarp can disappear through continued upslopemigration, collapse as a result of drying of the beach, or be destroyedby wave overtopping (Sherman and Nordstrom, 1985). Scarps probablyretard post-storm recovery by waves because low steepness construc-tive waves during high water levels are reflected by the vertical face ofthis morphology (Nishi et al., 1994).
This morphological feature is common on eroding beaches, as point-ed out by Carter and Stone (1989), and although there are numerous
133Y. Bonte, F. Levoy / Geomorphology 236 (2015) 132–147
studies on themorphology and physical processes affecting the scarp ofa dune and many conceptual models describing beach scarps onmicrotidal and mesotidal environments (Wright and Short, 1983;Sunamura, 1985; Short, 1999), quantitative information about beachscarp formation and evolution in macrotidal environments is stilllacking. Sherman and Nordstrom (1985) give a qualitative descriptionof beach scarp formation and evolution based on field observations,but without a data set to analyze the conditions for the scarp initiationand evolution.
Katoh and Yanagishima (1990, 1992) studied natural bermformation and erosion using a multi-year dataset of daily surveys ofbeach profiles. The authors demonstrated the role of long waves nearthe shoreline and watertable level on berm erosion. Longshoretransport and its morphological effects are also important. For instance,Seymour et al. (2005) observed rapid erosion of a berm fill and thatscarping resulted in an alongshore quasiperiodic variability.
Two main field experiments studied artificial sandy beach scarp(respective heights of about 0.3 and 1.0 m) with hydrodynamicmeasurements and topographic surveys during storm events to calcu-late the eroded volume of the dune as a function of the swash impact.At the Army Corps of Engineers Field Research facilities at Duck, duringthe SUPERDUCK experiment, an artificial dune approximately 1.0 mhigh and 1.3 m wide (classical height for a berm scarp) was built onthe beach and allowed to erode naturally during rising tide (Fisheret al., 1986; Crowson et al., 1988; Overton and Fisher, 1988). Videocamera recorded both the changes in the artificial berm scarp and theswash impact sequences through one lateral face made with a clearplastic (different to the other made with plywood). Vertical stakes andwave gages were placed in front of the artificial berm scarp to measuredepth and velocity of the swash. These experiments concluded that it isdifficult to isolate the impact of a single swash on the amount of thesand eroded, but the total erosion during one event is linearly correlatedwith the summation of the swash force for each individual swash.
Another dataset originated fromHasaki beach on the Pacific coast ofJapan where several field experiments on sediment transport and pro-file evolution in the swash zone have been performed (Kubota et al.,1997, 1999). During some of these experiments, an artificial beachface was created by accumulating sand on the beachface using abulldozer. The size of the artificial mound put on the beachface wasabout 30 m alongshore with an extension of 20 m offshore and amean slope of 1/7. During these experiments, after wave action on thebeachface, the profile shape had the characteristics of a real beachscarp (with an estimated height of about 0.3 m), with waves causingtransport and erosion by direct impact. A stick array of iron barsdeployed cross-shore to the shoreline was used to manually measurethe profile change each minute during a two hour period. Traps wereused to quantify onshore and offshore sediment transport, and swashcapacitance gages were installed close to the iron bars. Video camerasfor detailed wave recording were also deployed in the front of theartificial beachface as well as a pressure wave gage and an electromag-netic current meter (Larson et al., 2004b).
Buck (2007) and Kobayashi et al. (2009), using numerical models,show that the effect of the incidence wave angle on berm, but also ondune erosion is of the order of 20%. Previously, based on the SBeachmodel and a longshore wave height distribution, Nishi et al. (1994)showed a longshore curved scarp suggesting that the gradient oflongshore sediment transport-dominated scarp generation. Using awave basin to study the erosion mechanism of scarping on sandyberms, Payo et al. (2008) mentioned for instance alongshore variabilityof beach changes in tests, but indicated also that this was probably dueto the non-uniformity of the concrete slope in the used basin. The lack offield data to validate modeling results is also pointed out. Longshoremeasurements are clearly scarce, especially during storm conditions.
The aim of this contribution is to present and discuss a new data setof beach scarpmorphodynamics exposed to increasingwater levels andunder stormy oblique wave conditions. The relationship between wave
impacts induced by swash, water level and beach scarp face retreat isinvestigated. These data constitute a unique set of active scarp erosionbased on field measurements helpful for calibrating/validating 3Dbeach erosion modeling over short timescales also accounting for alongshore sediment transport gradient.
2. Equipment and methods
2.1. Field site
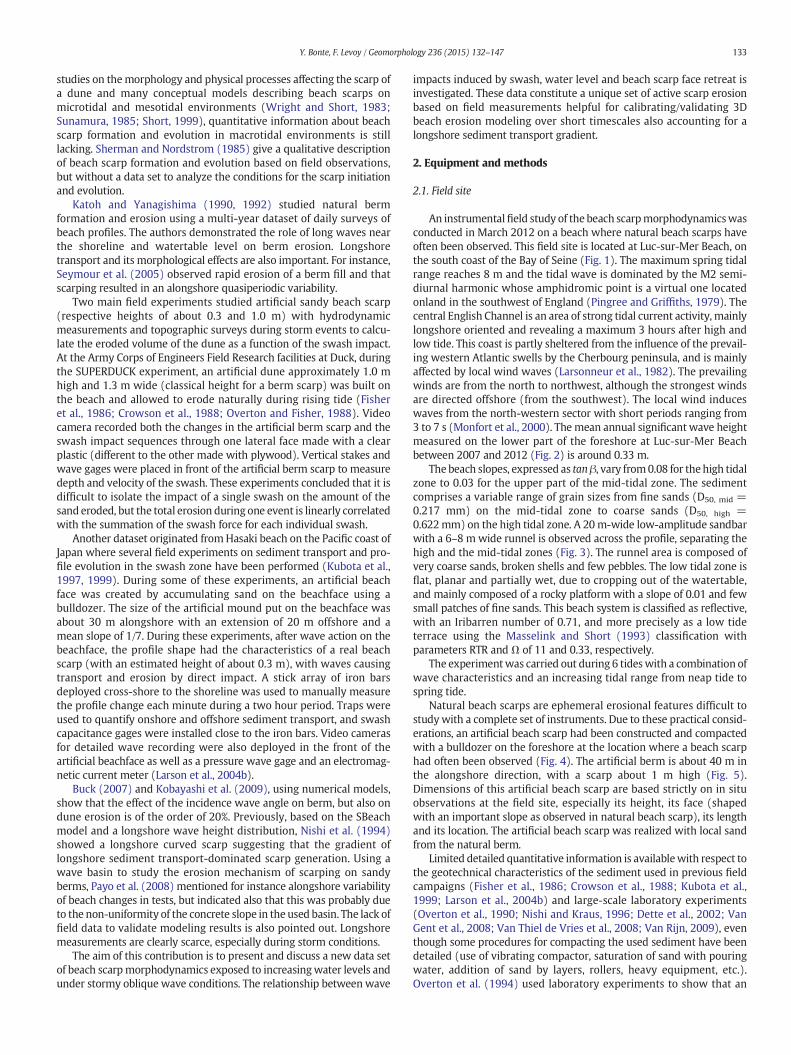
An instrumentalfield study of the beach scarpmorphodynamicswasconducted in March 2012 on a beach where natural beach scarps haveoften been observed. This field site is located at Luc-sur-Mer Beach, onthe south coast of the Bay of Seine (Fig. 1). The maximum spring tidalrange reaches 8 m and the tidal wave is dominated by the M2 semi-diurnal harmonic whose amphidromic point is a virtual one locatedonland in the southwest of England (Pingree and Griffiths, 1979). Thecentral English Channel is an area of strong tidal current activity, mainlylongshore oriented and revealing a maximum 3 hours after high andlow tide. This coast is partly sheltered from the influence of the prevail-ing western Atlantic swells by the Cherbourg peninsula, and is mainlyaffected by local wind waves (Larsonneur et al., 1982). The prevailingwinds are from the north to northwest, although the strongest windsare directed offshore (from the southwest). The local wind induceswaves from the north-western sector with short periods ranging from3 to 7 s (Monfort et al., 2000). The mean annual significant wave heightmeasured on the lower part of the foreshore at Luc-sur-Mer Beachbetween 2007 and 2012 (Fig. 2) is around 0.33 m.
The beach slopes, expressed as tanβ, vary from0.08 for thehigh tidalzone to 0.03 for the upper part of the mid-tidal zone. The sedimentcomprises a variable range of grain sizes from fine sands (D50, mid =0.217 mm) on the mid-tidal zone to coarse sands (D50, high =0.622mm) on the high tidal zone. A 20m-wide low-amplitude sandbarwith a 6–8 m wide runnel is observed across the profile, separating thehigh and the mid-tidal zones (Fig. 3). The runnel area is composed ofvery coarse sands, broken shells and few pebbles. The low tidal zone isflat, planar and partially wet, due to cropping out of the watertable,and mainly composed of a rocky platform with a slope of 0.01 and fewsmall patches of fine sands. This beach system is classified as reflective,with an Iribarren number of 0.71, and more precisely as a low tideterrace using the Masselink and Short (1993) classification withparameters RTR and Ω of 11 and 0.33, respectively.
The experimentwas carried out during 6 tideswith a combination ofwave characteristics and an increasing tidal range from neap tide tospring tide.
Natural beach scarps are ephemeral erosional features difficult tostudywith a complete set of instruments. Due to these practical consid-erations, an artificial beach scarp had been constructed and compactedwith a bulldozer on the foreshore at the location where a beach scarphad often been observed (Fig. 4). The artificial berm is about 40 m inthe alongshore direction, with a scarp about 1 m high (Fig. 5).Dimensions of this artificial beach scarp are based strictly on in situobservations at the field site, especially its height, its face (shapedwith an important slope as observed in natural beach scarp), its lengthand its location. The artificial beach scarp was realized with local sandfrom the natural berm.
Limited detailed quantitative information is availablewith respect tothe geotechnical characteristics of the sediment used in previous fieldcampaigns (Fisher et al., 1986; Crowson et al., 1988; Kubota et al.,1999; Larson et al., 2004b) and large-scale laboratory experiments(Overton et al., 1990; Nishi and Kraus, 1996; Dette et al., 2002; VanGent et al., 2008; Van Thiel de Vries et al., 2008; Van Rijn, 2009), eventhough some procedures for compacting the used sediment have beendetailed (use of vibrating compactor, saturation of sand with pouringwater, addition of sand by layers, rollers, heavy equipment, etc.).Overton et al. (1994) used laboratory experiments to show that an
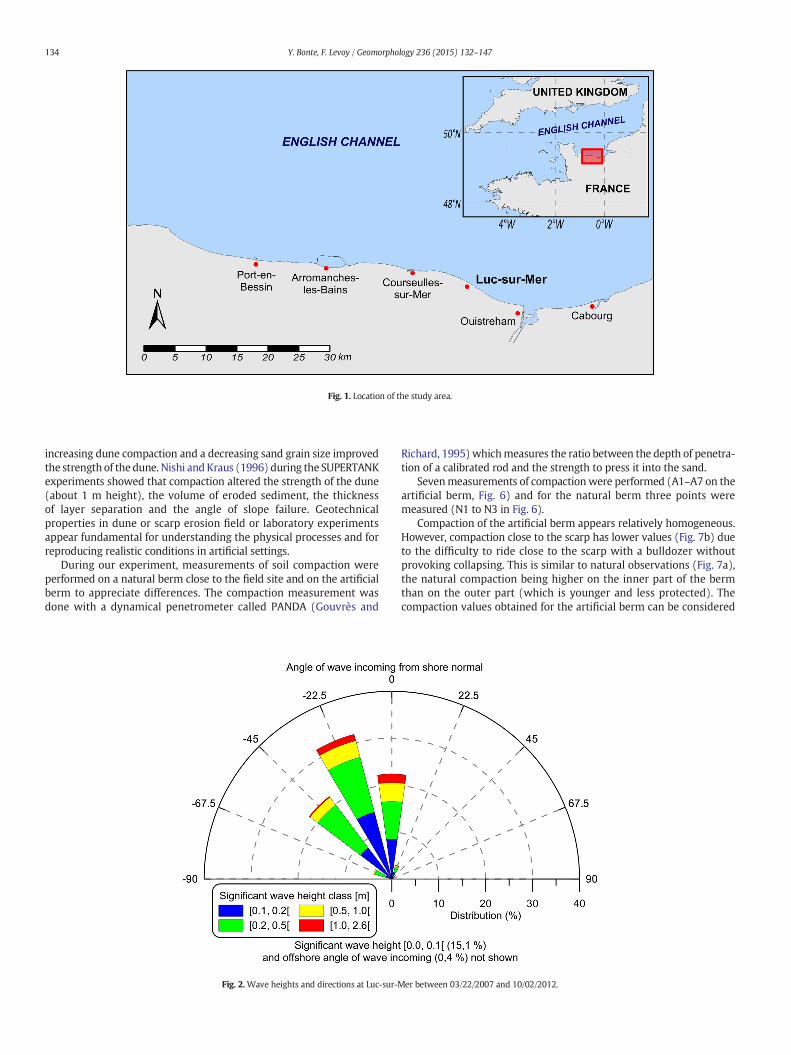
Fig. 1. Location of the study area.
134 Y. Bonte, F. Levoy / Geomorphology 236 (2015) 132–147
increasing dune compaction and a decreasing sand grain size improvedthe strength of the dune. Nishi and Kraus (1996) during the SUPERTANKexperiments showed that compaction altered the strength of the dune(about 1 m height), the volume of eroded sediment, the thicknessof layer separation and the angle of slope failure. Geotechnicalproperties in dune or scarp erosion field or laboratory experimentsappear fundamental for understanding the physical processes and forreproducing realistic conditions in artificial settings.
During our experiment, measurements of soil compaction wereperformed on a natural berm close to the field site and on the artificialberm to appreciate differences. The compaction measurement wasdone with a dynamical penetrometer called PANDA (Gouvrès and
Fig. 2.Wave heights and directions at Luc-sur-M
Richard, 1995) whichmeasures the ratio between the depth of penetra-tion of a calibrated rod and the strength to press it into the sand.
Sevenmeasurements of compactionwere performed (A1–A7 on theartificial berm, Fig. 6) and for the natural berm three points weremeasured (N1 to N3 in Fig. 6).
Compaction of the artificial berm appears relatively homogeneous.However, compaction close to the scarp has lower values (Fig. 7b) dueto the difficulty to ride close to the scarp with a bulldozer withoutprovoking collapsing. This is similar to natural observations (Fig. 7a),the natural compaction being higher on the inner part of the bermthan on the outer part (which is younger and less protected). Thecompaction values obtained for the artificial berm can be considered
er between 03/22/2007 and 10/02/2012.

Fig. 3. Typical beach profile with mean grain sizes.
135Y. Bonte, F. Levoy / Geomorphology 236 (2015) 132–147
as correct even if a longer time delay before the beginning of theexperimentation would have inevitably rendered its geotechnicalcharacteristics more similar to natural cases.
About 30 m eastward of the study area, there is a low crested groinwhich affects longshore sediment transport and impacts the upperforeshore topography with contours slightly oblique to the coastline.As mentioned by Nishi et al. (1994), these kinds of made-manstructures during stormy oblique wave conditions influence the beachtopography and possibly the longshore evolution of neighboringbeach scarps. After a long period of fair weather conditions, the bermwas often well-developed, especially in the updrift side of the groin.Just after this period, when the first storms occurred with wind wave
Fig. 4. Beach topography of the study area and plan view of ins
conditions, often a beach scarp appears close to the groin where theberm was previously wide.
2.2. Field measurements during the experiment
Low and high frequency water level measurements were obtainedfrom a S4DW electromagnetic current meter with a pressure sensor(from InterOcean) located on the mid-foreshore (100 m offshore of thebeach scarp at a depth of 3 m at high tide) and moored about 0.4 mabove the beach surface (Figs. 4, 8a). This location is relatively close tothe artificial berm to fully characterize incident waves (angle, periodand height), especially at high tide when swash motions attack the
trument locations, including fields of view of the cameras.

Fig. 5. Artificial beach scarp on the upper foreshore at Luc-sur-Mer Beach (France).
136 Y. Bonte, F. Levoy / Geomorphology 236 (2015) 132–147
scarp toe. The S4DW continuously records pressure and horizontalcurrentfluctuationswith a sampling frequency of 2Hz.Wave character-istics were obtained from the measured time series by spectral analysisusing a classical Fast Fourier Transform (FFT) with 16 degrees offreedom.
Topographic data were collected using a Terrestrial Laser Scanner(TLS) Leica C10 deployed on a 3 m stainless-steel tripod slightlyseaward of the beach scarp on the western side of the artificial berm(Fig. 8b). The scans were performed at each low tide, while videoacquisition was performed from the beginning to the end of each hightide. Compared to topographical measuring methods like DGPS, thelaser scanner appears to be more accurate as it permits to obtain hugedetails with a spot size of 4.5mmat 50m (Leica product specifications).It is possible to acquire a high density of X,Y,Z topographic points(average distance between points of 10 cm) in all directions aroundthe scanner in a minimum of time (20,000 m2 area recorded in 5 minwith a density of 100 points.m−2). Each cloud of points scanned isobtained from the same scanner location. Geographical position ofthe clouds is referenced with 5 targets (Fig. 8b–c) positioned by Real-Time-Kinematic Differential GPS (RTK-DGPS). Digital Elevation Models(DEM) were constructed to compare all the clouds of points with areagrids spacing of 0.05 m for each survey. All topographic data wereacquired in the French metric coordinate system (Lambert 93), then Xand Y coordinates projected to a cross-shore/longshore referential. Forthe low tide topographic survey, the maximum estimated error is the
Fig. 6. Location of compaction measureme
sum of the scanner system precision and the RTK-DGPS precision,around 6 cm for both horizontal and vertical dimensions.
At high tide, since the scanner was always placed at the samelocation, topographic data can be compared in a relative coordinatesystem. The maximum estimated error of the topographic survey isthe precision of the scanner system, around 1.2 cm for both horizontaland vertical dimensions. Relative coordinates are projected to a cross-shore/longshore reference system.
Swash and run-up data were collected using video techniquespreviously tested extensively (Holland et al., 1995, 1997; Stockdonet al., 2006; Senechal et al., 2011). The video monitoring system usedfor the experimentation is the KOSTA System (developed by CASAGECand AZTI-Tecnalia in 2005) (Rihouey et al., 2008). It is composed oftwo synchronized video cameras (referred to as camera C1 and C2)deployed to obtain, after geo-referencing, a vertical view of beachscarp and swash zone.
Video data were synchronized with in situ measurements usinguniversal time. Cameras C1 and C2 were fixed on a 6 m mast top(Fig. 8d) placed on the upper foreshore on the eastern side of theartificial berm, to record images at a frequency of 2 Hz during a burstperiod of 20minutes every 30minutes. As shown in Fig. 9, both cameraswere pointed in a direction parallel to the foreshore and in an areacovering about 15 m in the along-shore direction and 16 m in thecross-shore direction (area view of cameras is oriented to take intoaccount the floodlight scope for night recording).
nts on the artificial and natural berm.
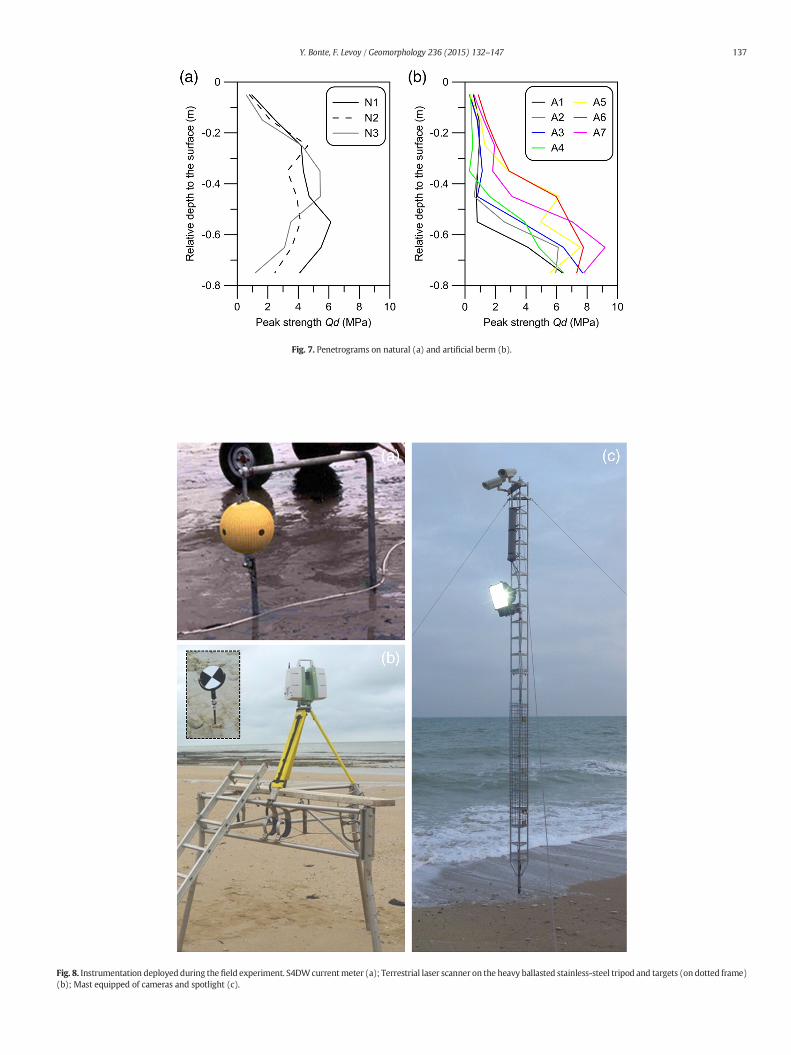
Fig. 7. Penetrograms on natural (a) and artificial berm (b).
Fig. 8. Instrumentation deployed during the field experiment. S4DWcurrentmeter (a); Terrestrial laser scanner on the heavy ballasted stainless-steel tripod and targets (on dotted frame)(b); Mast equipped of cameras and spotlight (c).
137Y. Bonte, F. Levoy / Geomorphology 236 (2015) 132–147

Fig. 9.Map of cross-shore (a) and longshore (b) video pixel resolutions (gray line indicates location of extracted video time series).
138 Y. Bonte, F. Levoy / Geomorphology 236 (2015) 132–147
Standard lens distortion correction and image geo-rectificationtechniques with targets were used for the transformation fromdistorted image coordinates (U, V) to metric system coordinates(X, Y). Then, the same pixel cross-shore transect is extracted fromevery image to obtain a time series of swash excursion and impact
Fig. 10. Part of 60 s video time series with horizontal swash excursion (dotted line) and swashmaximum (point) (b).
number of swash on scarp. Longshore and cross-shore pixel resolutionsof video measurements are less than 2 cm (Fig. 9).
On the video time series, the run-up edges are defined as the mostshoreward line of water identifiable. This definition is consistent withswash measurements obtained with resistance wires deployed near
maximum (point) (a), and vertical run-up elevation time series (black line) with run-up

139Y. Bonte, F. Levoy / Geomorphology 236 (2015) 132–147
the bed (Holman and Guza, 1984; Holland et al., 1995). The water linevariation shown on the video time series is manually digitized(Fig. 10a) and its X position along the extraction profile is saved foreach image (every 0.5 s). The X error of the digitalization is about+/−1 pixel, so +/−2 cm. Before every video acquisition, a topograph-ical measure with TLS is done and topographic data (X, Z) are extractedfrom the same profile than video extraction. The X, Y and Z error aboutTLS measurements is about +/− 1.2 cm. A linear regression formula iscalculated between each points for each topographic profile (Z = f[X])and the X digitized water line position is introduced in respectivepolynomial formula to determine the Z swash elevation and calculatethe run-up value during all video time series (Fig. 10b).
Finally, time series are segmented into section of 600 s and each run-up elevation time series and linearly detrended. On each time series, aspectral analysis was realized by FFT with 16 degrees of freedom.
Fig. 11. Time series of the hydrodynamic characteristics during the erosive campaign. Water levand maximumwave height (black line) (b); wave direction from shore normal (c); peak enerfrom the pressure time series recorded by the S4DW (e). Gray patches indicate the video burs
3. Results
The results presented focus on a tidal cycle when the beach scarpwas eroded. During the previous tides, despite high wave conditions,the water level at high tide was too low to erode the toe of the scarp.The time (in hours) used in the description of the experiment isexpressed from the beginning of the experiment.
3.1. Hydrodynamics
3.1.1. Shoaling zoneDuring the tide when beach scarp recessionwas observed, themean
significant andmeanmaximumwave height were respectively of 0.6 mand 0.96 m (Fig. 11b) and waves came mainly from −30° from shorenormal direction (Fig. 11c). The spectral analysis of the waves, with a
el predicted (gray line) andmeasured (black line) (a); significant wave height (gray line)gy (black line) and significant (gray line) wave period (d); and wave spectrum calculatedt sequences and vertical dashed lines indicate the time of the theoretical high tide.
140 Y. Bonte, F. Levoy / Geomorphology 236 (2015) 132–147
degree of freedom of 16, shows only one frequency peak that migratesbetween 0.17Hz (Tp=5.9 s) and 0.21Hz (Tp=4.8 s); no low frequencypeak was observed (Fig. 11d-e). The spread of frequencies was due to astrong wind blowing on the study area before and during the tide, witha mean and maximumwind force respectively of 8 and 13 m.s−1 and amean wind direction of −80° from a shore normal direction. As oftenobserved along the English Channel coast, short-crested waves resultdirectly from the local wind (Larsonneur et al., 1982; Monfort et al.,2000).
The maximumwater level measured during the field campaign was3.52 m IGN69 (French vertical datum) with a duration of the high tideslack of about three hours. A low storm surge, not exceeding 20 cm,was observed during the second part of the high tide slack, explainingthe slight elevation of the still water level between 2:30 and 4:15, justbefore the beginning of the falling tide (Fig. 11a).
On themid-part of the foreshore zone, close to themeanwater levelcontour where the current-meter was deployed, the mean currentvelocities were weak (below 0.2 m.s−1), with maximum velocitiesobserved at the beginning and at the end of the submergence periodand eastward-directed, and minimum velocities at high tide (between0.05 to 0.1 m.s−1).
3.1.2. Swash zone characteristics and impact number on scarp faceThe presence of the beach scarp strongly influences the swash
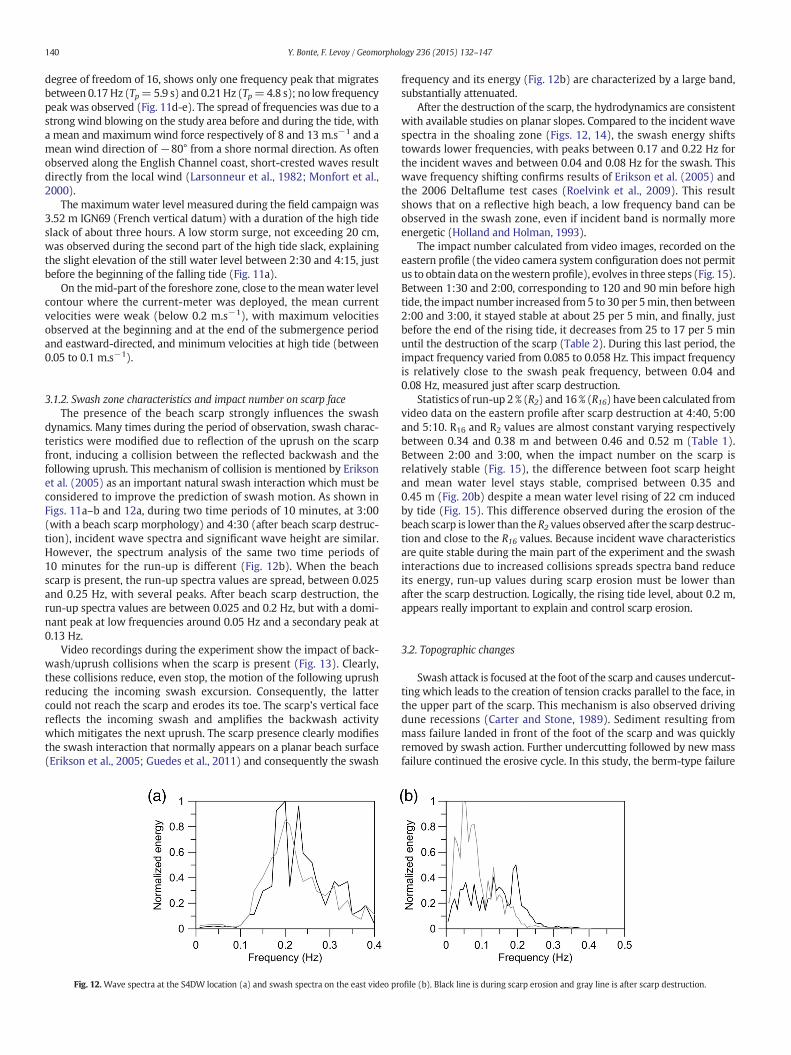
dynamics. Many times during the period of observation, swash charac-teristics were modified due to reflection of the uprush on the scarpfront, inducing a collision between the reflected backwash and thefollowing uprush. This mechanism of collision is mentioned by Eriksonet al. (2005) as an important natural swash interaction which must beconsidered to improve the prediction of swash motion. As shown inFigs. 11a–b and 12a, during two time periods of 10 minutes, at 3:00(with a beach scarp morphology) and 4:30 (after beach scarp destruc-tion), incident wave spectra and significant wave height are similar.However, the spectrum analysis of the same two time periods of10 minutes for the run-up is different (Fig. 12b). When the beachscarp is present, the run-up spectra values are spread, between 0.025and 0.25 Hz, with several peaks. After beach scarp destruction, therun-up spectra values are between 0.025 and 0.2 Hz, but with a domi-nant peak at low frequencies around 0.05 Hz and a secondary peak at0.13 Hz.
Video recordings during the experiment show the impact of back-wash/uprush collisions when the scarp is present (Fig. 13). Clearly,these collisions reduce, even stop, the motion of the following uprushreducing the incoming swash excursion. Consequently, the lattercould not reach the scarp and erodes its toe. The scarp’s vertical facereflects the incoming swash and amplifies the backwash activitywhich mitigates the next uprush. The scarp presence clearly modifiesthe swash interaction that normally appears on a planar beach surface(Erikson et al., 2005; Guedes et al., 2011) and consequently the swash
Fig. 12.Wave spectra at the S4DW location (a) and swash spectra on the east video pr
frequency and its energy (Fig. 12b) are characterized by a large band,substantially attenuated.
After the destruction of the scarp, the hydrodynamics are consistentwith available studies on planar slopes. Compared to the incident wavespectra in the shoaling zone (Figs. 12, 14), the swash energy shiftstowards lower frequencies, with peaks between 0.17 and 0.22 Hz forthe incident waves and between 0.04 and 0.08 Hz for the swash. Thiswave frequency shifting confirms results of Erikson et al. (2005) andthe 2006 Deltaflume test cases (Roelvink et al., 2009). This resultshows that on a reflective high beach, a low frequency band can beobserved in the swash zone, even if incident band is normally moreenergetic (Holland and Holman, 1993).
The impact number calculated from video images, recorded on theeastern profile (the video camera system configuration does not permitus to obtain data on thewestern profile), evolves in three steps (Fig. 15).Between 1:30 and 2:00, corresponding to 120 and 90 min before hightide, the impact number increased from5 to 30 per 5min, then between2:00 and 3:00, it stayed stable at about 25 per 5 min, and finally, justbefore the end of the rising tide, it decreases from 25 to 17 per 5 minuntil the destruction of the scarp (Table 2). During this last period, theimpact frequency varied from 0.085 to 0.058 Hz. This impact frequencyis relatively close to the swash peak frequency, between 0.04 and0.08 Hz, measured just after scarp destruction.
Statistics of run-up 2 % (R2) and 16 % (R16) have been calculated fromvideo data on the eastern profile after scarp destruction at 4:40, 5:00and 5:10. R16 and R2 values are almost constant varying respectivelybetween 0.34 and 0.38 m and between 0.46 and 0.52 m (Table 1).Between 2:00 and 3:00, when the impact number on the scarp isrelatively stable (Fig. 15), the difference between foot scarp heightand mean water level stays stable, comprised between 0.35 and0.45 m (Fig. 20b) despite a mean water level rising of 22 cm inducedby tide (Fig. 15). This difference observed during the erosion of thebeach scarp is lower than the R2 values observed after the scarp destruc-tion and close to the R16 values. Because incident wave characteristicsare quite stable during the main part of the experiment and the swashinteractions due to increased collisions spreads spectra band reduceits energy, run-up values during scarp erosion must be lower thanafter the scarp destruction. Logically, the rising tide level, about 0.2 m,appears really important to explain and control scarp erosion.
3.2. Topographic changes
Swash attack is focused at the foot of the scarp and causes undercut-ting which leads to the creation of tension cracks parallel to the face, inthe upper part of the scarp. This mechanism is also observed drivingdune recessions (Carter and Stone, 1989). Sediment resulting frommass failure landed in front of the foot of the scarp and was quicklyremoved by swash action. Further undercutting followed by new massfailure continued the erosive cycle. In this study, the berm-type failure
ofile (b). Black line is during scarp erosion and gray line is after scarp destruction.

Fig. 13. Time series of swash-swash collision with reflection on the beach scarp.
141Y. Bonte, F. Levoy / Geomorphology 236 (2015) 132–147
mechanism described by Erikson et al. (2007) was mainly observedprobably due to the relative low compaction of the artificial berm.
Topographic variations between the two low tides highlight a com-plete destruction of the artificial berm. The contrasting alongshorebeach changes indicate an evident net movement of sediments fromnorth-west to south-east on the upper part of the foreshore in thefront of the scarp (Fig. 16). The erosion of the berm was also greateron the north-west side than on the south-east side, showing a possible3D effect. At the initial scarp foot location, after the collision period, a
Fig. 14. Spectra of measured incident waves (black line) and measured vertical run-up
maximum residual erosion of 0.3 m at the edge of the west side bermand a maximum residual accretion of 0.2 m at the east side weremeasured. At the same time, the beach scarp crest was eroded by0.75m in thewest and 0.5m in the East. Also the laser scannermeasure-ments revealed an asymmetrical evolution between the west and theeast part of the berm (Fig. 17).
On the west profile (Fig. 4), the scarp retreated landward for150 minutes and was finally deeply smoothed and the beach profilebecame quasi-linear. The beach elevation at the initial foot scarp
elevation (gray line) just after scarp destruction at 4:40 (a), 5:00 (b) and 5:10 (c).

Fig. 15. Time series of impact number per 5 min on the eastern profile of the scarp (cross)and mean water level (gray line).
142 Y. Bonte, F. Levoy / Geomorphology 236 (2015) 132–147
position (12 m in the cross-shore) increased by 12 cm during the first80 minutes of scarp retreat, then decreased by 25 cm until the end ofthe experiment (210 minutes). On the east profile (Fig. 4), the scarpretreated landward for 120 minutes and disappeared. The foreshorebeach slope on the east profile decreased a little from 0.081 to 0.074,while the west profile slope decreased from 0.104 to 0.067 (foreshorebeach slope is measured between mean water level and initial footscarp position as recommended by Stockdon et al. (2007)). Onthe east profile, the beach elevation at the first foot scarp position(12 m in the cross-shore) increased by 25 cm during the first110 minutes of scarp retreat, then decreased by 15 cm until the end ofthe experiment (180 minutes). These observations clearly show adifferent morphodynamical behavior between each side of the beachand of berm.
On the two profiles, the foot scarp migrates landward (speedbetween 1.5 to 4 cm.min−1) and its elevation increases regularly duringthe experiment (Fig. 18). On the east profile, the foot scarp retreatsalong a mean slope βT of 0.131, while on the west profile its retreatfollows a steeper slope of 0.209.
The eroded volume evolution of the beach scarp during the experi-ment was calculated using laser data for each profile (Fig. 17). Largedifferences in the eroded volumes are observed during the experimentwith values onwest and east profiles of 1.9 and 0.9m3.m-1, respectively.(Table 2). The scarp disappeared when its height decreased below20 cm (Fig. 20a). This destruction happened first on the east profile,then on the west profile.
4. Discussion
4.1. Laser data and proximal video acquisitions
Topographic acquisitions done by terrestrial laser scanning duringthe erosion period have enabled us to obtain a complete set oftopographical data, permitting a 3D description of beach scarp changes.Terrestrial laser scanners are a very useful tool for non-intrusivemeasurements of an eroding foreshore with scarps and probably alsoof dune systems. Compared to topographic data acquired by stereovideo, this method has the advantage not to be affected by problemsof lighting or precision due to the proximity of cameras that influencesthe size of the pixels and the topographic accuracy. Laser scanningpresents no problem for distinguishing position of elementswith strongcontrast. Its large range of measurements could permit the recording oflarge scale in-situ morphologies (tens to hundreds of metres), enablingeasy analysis of 3D systems in a very small time and with centimetreaccuracy. Like for the stereo video protocol, the principal issue would
Table 1Summary of run-up values on the eastern profile after beach scarp destruction.
Time (hh:mm) 4:40 5:00 5:10
R16 (m) 0.34 0.39 0.38R2 (m) 0.46 0.52 0.50
be the installation of the scanner to have a good field of view, withcapabilities of deployment just outside of the studied area, no move-ment of the structure during acquisitions (mast, tripod or platform)and the least possible shadow zones. However, improvements couldbe made regarding temporal scales of data acquisitions. Continuousacquisitions at a high frequency (2 Hz) will be useful for describingshort-term evolutions of beach scarps or dune fronts (wave impacttime scale), and even swash activity, as recently presented by Almeidaet al. (2013).
Unlike classical uses of in situ video system for tracking beachevolution, which deliver decimetric to metric resolution, the proximityof the video measurements system to the beach scarp has made itpossible to precisely record the horizontal scarp evolution and theswash impacts with a high definition, about 2 cm per pixel. The combi-nation of these two non-intrusive techniques has made it possible toextract good values of run-up with an accuracy better than 5 cm,which seems very good considering the space and time variability ofthis phenomenon.
4.2. Longshore variability of beach and scarp changes
The contrasting behavior between the east and the west side of thebeach scarp is firstly the result of a contrasted beach evolution in thefront of the scarp during the duration of the experiment. The beachelevation changes were the consequence of a west–east gradient ofsediment longshore transport, induced by oblique waves generated bywind parallel to the shore. Fig. 16(b–c) shows that the east and westbeach profiles change differently between 0 and 25 m in the cross-shore direction, but that they are stable offshore. These changes mainlyon the upper part of the beach result especially from the swash motion.Oblique swash, but also grazing swash observed on video images,contributes actively to move sediment alongshore. During the collisionphase, swash activity also brings sediments eroded from the westernpart of the beach scarp to the eastern part located close to a groin. Theeffect of the groin also seems important and its presence explains thecontrasting initial beach slope in the front of the scarp. The groininfluences the beach topography especially close to its updrift side.The initial contours close to the groin were not parallel to the shorelinebut were slightly oblique, showing the impact of the groin on thelongshore sediment circulation. The level of the beach was alwayshigher along the west side of the groin in comparison with the eastside, confirming the residual movement of sand over a long period oftime but also over a stormy period. The groin induces an alongshorecontrasted updrift beach elevation which explains, locally, the gradientof longshore sediment transport and induced beach changes. The morerapid decrease of the scarp height on the east is due to the sedimentdeposit in front of the scarp that permits overwash, which smoothedthe rest of the scarp. On the western profile, the landward migrationof the foot scarp combined with the residual decrease of the beachelevation in front of the scarp by erosion during the tide, permits thisarea to be conserved longer than on the eastern profile. Then, after thecollision regime period (Sallenger, 2000), the scarp is destroyed byoverwash processes. The evolution of the beach in front of the beachscarp seems important to explain the observed scarp changes.
The observed storm surge during the second part of the tidal cycle(Fig. 11a) in particular between 2:30 and 4:30 allowed for continuedwave action on the scarp despite a landward retreat of the scarp toe.This is in line with observations by Shepard (1950) and Wiegel (1964)on foreshore landward migration by swash undercutting and slumpingon the scarp face. However, during the period of the scarp retreat, thedifference in height between the foot scarp and the mean water levelwas stable between 0.35 and 0.45 m (Fig. 20b). For east and westprofiles, this height evolves in the same manner. Moreover, impactnumbers, recorded on the east profile follow a three-step evolution.During the 60 minutes when the impacts number was stable at about25 impacts per 5 min the water level increased by 22 cm, showing

Fig. 16. Topographic changes of the studied area during the experiment (a), beach topography at low tide before (blue line) and after (red line) scarp erosion at west profile (b) and eastprofile (c).
143Y. Bonte, F. Levoy / Geomorphology 236 (2015) 132–147
that there is a parallel evolution between the water level and the scarpretreat. However, eroded volumes on the beach scarp increaseddifferently along east and west profiles. The hydrodynamic andmorphological interactions seem alongshore different. The beachslope, as mentioned by Stockdon et al. (2006), and foreshore elevationas a result of a longshore sediment transport between east andwest profiles, influence swash activity. The beach slopes between thetwo profiles at the beginning of the experiment are quite different,respectively 0.081 on the east side of the berm and 0.104 on the westside (Fig. 16b-c). The slope changes during the experiment were moreimportant along the west profile with a decrease from 0.104 to 0.067than along the east profile where the slope decreased from 0.081 to0.074.
Swash excursions and run-up elevation were affected whenthe beach topography was highly three dimensional. During the Luc-sur-Mer experiment, the difference of foreshore slope near the footscarp at east and west part of field experiment probably affects swashdynamics (direction, speed, energy…) and consequently their impactson the scarp. Video data show complex swash circulations close toscarp where longshore transport is active. Swash was primarily obliquebut in some instances swash circulating from west to east was alsoobserved. Grazing swash contributes also to reinforce longshore flowand scarp formation and erosion (Sherman and Nordstrom, 1985).
Unfortunately, data recorded during the campaign are not sufficientto confirm the role of the local slope and local topography on swashactivity because the deployed video device could not acquire images
on thewest part of the artificial berm. Further video data during obliquewave conditions will be necessary to study longshore run-up variabilityand its consequence on scarp and dune retreat.
4.3. Longshore variability of scarp retreat and foot scarp trajectory
During laboratory observations, Larson et al. (2004a) suggested thatthe foot scarp follows a slope similar to the initial foreshore slope duringits retreat (βT/βf(0) = 1). Laboratory investigations done by Palmstenand Holman (2012) present a different result with βT/βf(0) = 0.54.For this in situ experiment, the results were quite different and spatiallycontrasting. Along thewest profile, the foot scarp evolveswith a slope of0.131 (R2 = 0.92). Compared to the foreshore slope (taken betweenmean water level and initial foot scarp position) of 0.104 (R2 = 0.99),the ratio βT/βf(0) is of 1.26. On the east profile, the foot scarp evolvesto a slope of 0.209 (R2 = 0.97) and the initial foreshore slope is 0.081(R2 = 0.99), giving a ratio βT/βf(0) of 2.58.
Differences between the two surveyed profiles can be ascribed tovarious effects: from the influence of the initial topography at thefront of the scarp to a variability in the spatial characteristics of therun-up. The residual elevation of the beach in front of the scarp isopposite between the eastern and the western parts of the scarp. Thiselevation increases in front of the foot scarp on the eastern part of theberm and decreases on the western part. Logically, when the beachlevel increases due to sediment deposits, the trajectory of the scarpfoot is steep due to the location of the foot always being higher.

Fig. 17. Cross-shore profile evolution of the beach scarp at east (a) and west (b) part of the study area.
144 Y. Bonte, F. Levoy / Geomorphology 236 (2015) 132–147
Inversely, when the elevation of the beach decreases and the beachslope stays constant, the foot scarp trajectory follows a weak slope.Moreover, the first step of the upper beach changes in the front of thewestern scarp shows a vertical accretion which can be corroborated
Fig. 18. Initial beach profile and trajectory of the scarp b
with the retreat of the scarp base following a steep slope (between1:50 and 2:20). Thereafter, the foot scarp slope is less important dueto the lower beach elevation in front of the scarp. These observationsindicate that the slope of foot scarp retreat was not directly linked to
ase for east (a) and west (b) part of the study area.

Fig. 19. Cumulative volume evolution of the beach scarp between 5 and 12 m cross-shoreon east and west profile.
145Y. Bonte, F. Levoy / Geomorphology 236 (2015) 132–147
the initial beach slope and clearly suggest that the contrasted verticalevolution of the beach just in front of the scarp influences the trajectoryof dune base evolution. Palmsten and Holman (2012) mentioned thatan increase in slope of the retreat trajectory is possibly related to thedecrease in low frequency energy observed in run-up, but beach eleva-tion changes in the front of scarps and also probably for dune systemscan also contribute to modify this trajectory, especially with obliquewave conditions inducing a varying longshore transport.
4.4. Eroded volume variability and volume calculation
A strong connection between beach evolution and eroded volumeof the scarp is identified. Fig. 19 shows different volume changesbetween the west and east sides, a result directly related to differencesin longshore sediment transport. As mentioned previously, the mecha-nisms of scarp and dune erosion are often similar but differ by their
Fig. 20. Time series of scarp height evolution at east (gray line) and west (black line)profile (a), and difference between foot scarp and observed water level at east(gray line) and west (black line) profile (b).
eroded volume. With respect to works on dune erosion, it is interestingto test somemodels of dune recessionwith data coming from this study.In their formulation to calculate the eroded volume from the dune,Larson et al. (2004a) recognize the use of the number of waves (bythe ratio t/Tp) to quantify the influence of waves on dune erosion.Palmsten and Holman (2012) used this same number and incorporatedthe probability distribution of wave run-up over the foot scarp tocalculate a number of collisions. Their results show that the ratio t/Tpoverestimates the real number of impacts, but also that the formulationto calculate number of collision underestimates the real number ofimpacts on the dune scarp.
In this experiment, we analyze the number of impacts per 5 minduring a 60 min period.When this number is stable, it shows an impactfrequency, calculated from video images, that oscillates between 0.058and 0.085Hz. This rather low frequency is closer to the swash frequencyrecorded on the foreshore after scarp destruction whose peaks arebetween 0.04 and 0.08 Hz, but clearly different from the incidentwave frequency with peaks between 0.17 and 0.22 Hz (Fig. 14)commonly observed for windwave conditions. These observations sug-gest that swash frequency is more able to realistically characterize thenumber of impacts on dune or beach scarp face. Therefore, it appearsmore insightful to test swash frequency than incident waves frequencyto the calculation of volume eroded from a dune. However, the swashinteractions due to the collisions between backwash and followinguprush induced by the beach scarp affect the swash motion and, inparticular, contribute to reduce its energy. To explain the destructionof the scarp during this experiment, the risingmeanwater level appearsto be an important factor compensating the decrease of swash energyduring the phase of active swash-swash interactions.
5. Conclusions
A new field experiment was performed to study erosion of anartificial beach scarp along a macrotidal coast during oblique wind-wave conditions. Incident wave, swash activity using video imagingand topographic characteristics using a terrestrial scanner laser weremeasured to develop a new dataset useful to improve the knowledgeon the morphodynamics of beach scarp, but also of dune fronts.
A complete destruction of the artificial berm (1 m high and 40 mlong) is observed during the experiment. The duration of the erosiveprocesses was short, only few hours, when swash activity had thecapability to destroy the berm and water levels were high enough toallow swash to reach the scarp. Contrasting alongshore changes weremeasured: the erosion of the berm crest was greater on the west sideof the berm than on the east side (0.75 m versus 0.5 m), the erodedvolumes on west and east profiles were different, respectively 1.9 and0.9 m3.m-1, the foot scarp retreat along a mean slope βT of 0.131 wasobserved on the east side, while on the west profile its retreat followeda steeper slope of 0.209. The beach just in front of the scarp showed alsoa different evolution during the experiment. A residual beach erosion of0.3 m at the west edge of the artificial berm and a residual accretion of0.2 m in the east side were measured showing a clear longshore move-ment of sediments from north-west to south-east on the upper part ofthe foreshore in front of the scarp induced by oblique wave conditions.Alongshore beach changes in front of the scarp, at a small spatial scale(tens of metres), explain the scarp behavior. The scarp front erosionincreases strongly when the beach level is lowered and reduces whenthe beach surface rises. Overall, water depth and swash activity becameprogressively different along the scarp during the experiment.
During most of the experiment, the collision regime described bySallenger (2000) was principally observed. For about one hour andforty minutes, uprush strikes the scarp toe contributing to its erosion.The impact number grows with the rising tide and stays stable around25 impacts per 5 minutes (0.08 Hz) before to decrease. This swashfrequency is clearly different from the incident wave frequency(between 0.17 Hz and 0.21 Hz, stable during all the experiment

Table 2Summary of hydrodynamic and morphological parameters (no impact data available for west profile).
Time(hh:mm)
MWL(m IGN69)
Hs(m)
Tp(s)
East profile West profile
Eroded volume between5 and 12 m cross-shore(m3/m)
Foot scarp height(m IGN69)
Impacts on scarp(number/10 min)
Eroded volume between5 and 12 m cross-shore(m3/m)
Foot scarp height(m IGN69)
01:00 2.25 0.52 5.0 0 3.3 0 3.4101:10 2.51 0.57 4.4 001:20 2.72 0.59 4.1 0 3.3 0 0 3.4101:30 2.88 0.61 3.8 0 3.3 0 3.4101:40 3.01 0.62 3.7 2001:50 3.10 0.69 4.6 −0.08 3.42 34 −0.02 3.4402:00 3.18 0.68 4.9 −0.14 3.46 −0.09 3.5302:10 3.21 0.69 4.6 5802:20 3.24 0.66 4.8 −0.38 3.59 48 −0.27 3.702:30 3.27 0.69 5.0 −0.47 3.68 −0.39 3.7402:40 3.33 0.64 4.8 4902:50 3.38 0.67 5.2 −0.63 3.76 52 −0.74 3.7503:00 3.40 0.71 5.4 −0.74 3.83 −0.90 3.7803:10 3.44 0.66 4.9 (scarp destruction) 4803:20 3.47 0.69 5.3 −0.93 18 −1.35 3.8103:30 3.46 0.64 4.5 −1.05 −1.66 3.903:40 3.52 0.65 4.9 (scarp destruction)03:50 3.50 0.64 4.6 −1.30 −2.1604:00 3.50 0.72 5.6
146 Y. Bonte, F. Levoy / Geomorphology 236 (2015) 132–147
duration), but within the swash peak frequency range measured justafter scarp destruction (between 0.04 and 0.08 Hz).
If the eroded volume from the scarp is linearly correlated with thesummation of the swash impacts observed during the video bursts,swash motion is strongly affected by the presence of the scarp. Videorecordings show clearly that the swash characteristics were modifieddue to reflection of the uprush on the scarp front inducing a collisionbetween the reflected backwash and the following uprush. Theseswash interactions that normally appear on free beach surface werereinforced by the presence of the reflective scarp front. The collisionsbetween backwash and the following uprush reduce, and even stop,the incoming swash excursion acting on the swash frequency and/orits intensity. The run-up spectra when the beach scarp was present,are spread, between 0.025 and 0.25 Hz, with several peaks and itsenergy was rather attenuated by comparison with other spectra beforeand after the phase of collision regime. With this kind of swash condi-tions, the scarp could be naturally protected from erosion. The scarperosion and its complete destruction were then the result of tide-induced mean water level rise of about 20 cm. During this phase, themean impact number is maximum and relatively constant, and thedifference between the scarp foot height and the mean water levelstays stable. The onshore migration of the swash zone induced by therising tide appears to be important to explain scarp destruction, com-pensating the attenuated swash activity due to backwash-uprushinteractions.
More studies are needed to improve the knowledge of beach scarpmorphodynamics and its variability presented and discussed in thispaper. In particular, at a local scale, alongshore variability of swashconditionsmust be taken into account in order to analyze their implica-tions on the beach scarp behavior. Works are under way to assess theuse of ourfindings especially for the quantification of dune front retreat.
Acknowledgements
Thisworkwas funded by the PLAMARCNRS programand the FrenchHigher Education and Research Ministry. Thanks to Benjamin Outrey(Leica Geosystem) for lending the terrestrial laser scanner during theexperimentation and to the Luc-sur-Mer town council for lendingtheir bulldozer to the artificial berm building. Thanks also to LaurentBenoit, Emmanuel de-Saint-Léger and Emilie Poullain, from CaenUniversity, for their help during the field experimentation and to OlivierMonfort, from Caen University, for his help on the data treatment and
comments about the manuscript. Our thanks are expressed to GiovanniCoco, from IH Cantabria, for his tremendous help in preparing andimproving this manuscript. Thanks, also, to the two anonymousreviewers for useful and constructive review comments for improvingthe manuscript.
References
Almeida, L.P., Masselink, G., Russell, P.E., Davidson, M.A., Poate, T.G., McCall, R.T.,Blenkinsopp, C.E., Turner, I.L., 2013. Observations of the swash zone on a gravelbeach during a storm using a laser-scanner. Proceedings 12th International CoastalSymposium (Plymouth, England). Journal of Coastal Research 65, pp. 636–641.
Buck, M.A., 2007. Experiments and numerical model for berm and dune erosion. (Ph.D.thesis). Research Rep. No. CACR-07–03. Center for Applied Coastal Research, Univ.of Delaware, Newark, Del.
Carter, R.W.G., 1988. Coastal Environments. An introduction to physical, ecological andcultural systems of coastlines. Academic Press, London (617 pp.).
Carter, R.W.G., Stone, G., 1989. Mechanisms associated with the erosion of sand dunecliffs, Magilligan, Northern Ireland. Earth Surf. Proc. Land. 14 (1), 1–10.
Crowson, R.A., Birkemeier, W.A., Klein, H.M., Miller, H.C., 1988. Superduck nearshoreprocesses experiment: summary of studies CERC field research facility. TechnicalReport CERC-88-12. Coastal Engineering Research Center, U.S.Army EngineerWaterways Experiment Station, Vicksburg, MS (115 pp.).
Dette, H.H., Larson, M., Murphy, J., Newe, J., Peters, K., Reniers, A., Steezel, H., 2002.Application of prototype flume tests for beach nourishment assessment. Coast. Eng.47 (2), 137–177.
Erikson, L., Larson, M., Hanson, H., 2005. Prediction of swashmotion and run-up includingthe effects of swash interaction. Coast. Eng. 52, 285–302.
Erikson, L.H., Larson, M., Hanson, H., 2007. Laboratory investigation of beach scarp anddune recession due to notching and subsequent failure. Mar. Geol. 245, 1–19.
Fisher, J.S., Overton, M.F., Chisholm, T., 1986. Field measurements of dune erosion.Proceedings of the 20th Coastal Engineering Conference, Taipei, Taiwan 82,pp. 1107–1115.
Gouvrès, R., Richard, B., 1995. Le pénétromètre dynamique léger PANDA. Proceedings ofECSMFE, Copenhagen, Denmark, pp. 83–88.
Guedes, R.M.C., Bryan, K.R., Coco, G., Holman, R.A., 2011. The effects of tides on swashstatistics on an intermediate beach. J. Geophys. Res. 116 (C04008), 1–13.
Holland, K.T., Holman, R.A., 1993. The statistical distribution of swash maxima on naturalbeaches. J. Geophys. Res. 98 (C6), 10271–10278.
Holland, K.T., Raubenheimer, B., Guza, R.T., Holman, R.A., 1995. Run-up kinematics on anatural beach. J. Geophys. Res. 100 (C3), 4985–4993.
Holland, K.T., Holman, R.A., Lippmann, T.C., Stanley, J., Plant, N., 1997. Practical use ofvideo imagery in nearshore oceanographic field studies. IEEE J. - Oceanogr. Eng. 22,81–92.
Holman, R.A., Guza, R.T., 1984. Measuring run-up on a natural beach. Coast. Eng. 8,129–140.
Katoh, K., Yanagishima, S., 1990. Berm erosion due to long period waves. Proceedings ofthe 22nd International Conference of Coastal Engineering, pp. 2073–2086.
Katoh, K., Yanagishima, S., 1992. Berm formation and berm erosion. Proceedings of the23rd International Conference of Coastal Engineering, pp. 2136–2149.
Kobayashi, N., Buck, M.A., Payo, A., Johnson, B.D., 2009. Berm and dune erosion during astorm. J. Waterw. Port Coast. Ocean Eng. 135 (1), 1–10.

147Y. Bonte, F. Levoy / Geomorphology 236 (2015) 132–147
Kubota, S., Naito, A., Matsumura, T., Takezawa, M., 1997. Field observations of topographychange on an artificial beach face due to on–offshore transport. Proceedings ofCombined Australasian Coastal Engineering and Ports Conference, Christchurch,New Zealand, pp. 325–330.
Kubota, S., Katori, S., Takezawa, M., 1999. Relationship between on-offshore sedimenttransport rate on the beach face and wave energy. Proceedings of Coastal Sediments99. ASCE, pp. 447–462.
Larson, M., Erikson, L., Hanson, H., 2004a. An analytical model to predict dune erosion dueto wave impact. Coast. Eng. 51, 675–696.
Larson, M., Kubota, S., Erikson, L., 2004b. Swash-zone sediment transport and foreshoreevolution: Field experiments and mathematical modeling. Mar. Geol. 212, 61–79.
Larsonneur, C., Bouysse, P., Auffret, J.P., 1982. The superficial sediments of the EnglishChannel and its western approaches. Sedimentology 29, 851–864.
Masselink, G., Short, A.D., 1993. The effect of tide range on beach morphodynamics andmorphology: A conceptual beach model. J. Coast. Res. 9 (3), 785–800.
Monfort, O., Levoy, F., Larsonneur, C., 2000. Beach cusp characteristics and the hydrody-namic conditions of formation in macrotidal environments. Bull. Soc. Geol. Fr. 171(6), 649–656.
Nishi, R., Kraus, N.C., 1996. Mechanism and calculation of sand dune erosion by storms.Proceedings of the 25th Coastal Engineering Conference. ASCE, pp. 3034–3047.
Nishi, R., Sato, M., Wang, H., 1994. Field observation and numerical simulation of beachand dune scarps. Proceedings of the 24th Coastal Engineering Conference. ASCE,pp. 2434–2448.
Overton, M.F., Fisher, J.S., 1988. Simulation modeling of dune erosion. Proceedings of the21st International Conference in Coastal Engineering. ASCE, Costa del Sol-Malaga,Spain, pp. 1857–1867.
Overton, M.F., Fisher, J.S., Stone, A.L., 1990. Large scale laboratory tests of dune erosion.Proceedings of the 22nd Coastal Engineering Conference. ASCE, pp. 2471–2479.
Overton, M.F., Pratikto, W.A., Lu, J.C., Fisher, J.S., 1994. Laboratory investigation of duneerosion as a function of sand grain size and dune density. Coast. Eng. 23, 151–165.
Palmsten, M.L., Holman, R.A., 2012. Laboratory investigation of dune erosion using stereovideo. Coast. Eng. 60, 123–135.
Payo, A., Kobayashi, N., Munoz-Pérez, J., Yamada, F., 2008. Scarping predictability of sandybeaches in a multidirectional wave bassin. Cienc. Mar. 34 (1), 45–54.
Pingree, R.D., Griffiths, D.K., 1979. Sand transport paths around the British isles resultingfrom M2 and M4 tidal interactions. J. Mar. Biol. Assoc. U. K. 59, 497–513.
Rihouey, D., Blangy, A., Dugor, J., Dailloux, D., 2008. Technique vidéo appliquée à latopographie de la plage intertidale. Xèmes Journées Nationales Génie Côtier - GénieCivilpp. 625–634.
Roelvink, D., Reniers, A., Van Dongeren, A., Van Thiel de Vries, J., McCall, R., Lescinski, J.,2009. Modelling storm impacts on beaches, dunes and barrier islands. Coast. Eng.56, 1133–1152.
Ruiz de Alegria-Arzaburu, A., Mariño-Tapia, I., Silva, R., Pedrozo-Acuña, A., 2013. Post-nourishment beach scarp morphodynamics. In: Conley, D.C., Masselink, G., Russell,P.E., O’Hare, T.J. (Eds.), Proceedings of the 12th International Coastal Symposium(Plymouth, England). Journal of Coastal Research, Special Issue 65, pp. 576–581.
Sallenger Jr., A.H., 2000. Impact scale for barrier islands. J. Coast. Res. 16 (3), 890–895.Senechal, N., Coco, G., Bryan, K.R., Holman, R.A., 2011.Wave run-up during extreme storm
conditions. J. Geophys. Res. 116, 1–13.Seymour, R., Guza, R.T., O'Reilly, W., Elgar, S., 2005. Rapid erosion of a small southern
California beach fill. Coast. Eng. 52, 151–158.Shepard, F.P., 1950. Beach cycles in Southern California. U.S. Army Corps of
EngineeringBeach Erosion Board Tech. Mem. 20 pp. 1–26.Sherman, D.J., Nordstrom, K.F., 1985. Beach scarps. Z. Geomorphol. 29 (2), 139–152.Short, A.D. (Ed.), 1999. Handbook of beaches and shoreface morphodynamics. Wilez and
Sons, Chichester (379 pp.).Stockdon, H.F., Holman, R.A., Howd, P.A., Sallenger Jr., A.H., 2006. Empirical parametriza-
tion of setup, swash, and run-up. Coast. Eng. 53, 573–588.Stockdon, H.F., Sallenger Jr., A.H., Holman, R.A., Howd, P.A., 2007. A simple model for the
spatially-variable coastal response to hurricanes. Mar. Geol. 238, 1–20.Sunamura, T., 1985. In: Horikawa, K. (Ed.), 1988. Nearshore dynamics and coastal
processes, theory, measurement, and predictive models. University of Tokyo Press.Van Gent, M.R.A., Van Thiel de Vries, J.S.M., Coeveld, E.M., De Vroeg, J.H., Van de Graaff, J.,
2008. Large-scale dune erosion tests to study the influence of wave periods. Coast.Eng. 55 (12), 1041–1051.
Van Rijn, L.C., 2009. Prediction of dune erosion due to storms. Coast. Eng. 56, 441–457.Van Thiel de Vries, J.S.M., van Gent, M.R.A., Walstra, D.J.R., Reniers, A.J.H.M., 2008. Analysis
of dune erosion processes in large-scale flume experiments. Coast. Eng. 55 (12),1028–1040.
Vousdoukas, M.I., 2012. Erosion/accretion patterns and multiple beach cusp systems on ameso-tidal, steeply-sloping beach. Geomorphology 141–142, 34–46.
Wiegel, R.L., 1964. Oceanographical engineering. Prentice-Hall, Englewood Cliffs, NJ,pp. 1–532.
Wright, L.D., Short, A.D., 1983. Morphodynamics of beaches and surf zones in Australia. In:Komar, P.D. (Ed.), Handbook of coastal processes and erosion. CRC Press, Boca Raton,FL, pp. 35–64.