field boundary habitats and their - teagasc
TRANSCRIPT

FIELD BOUNDARY HABITATS AND THEIR
CONTRIBUTION TO THE AREA OF SEMI-
NATURAL HABITATS ON LOWLAND FARMS
IN EAST GALWAY, WESTERN IRELAND
Caroline A. Sullivan, John A. Finn, Mike J. Gormally andMicheline Sheehy Skeffington
ABSTRACT
Sustainable agriculture and the provision of environmental public goods are key deliverables forEuropean farming and food production. Farmland biodiversity, cultural landscapes, soil functionalityand climate stability are among the environmental public goods provided through agriculture.Future Common Agricultural Policy (CAP) direct payments are intended to be more targeted at theprovision of these agricultural deliverables. Field boundaries are an example of such deliverables.They are widespread features that have both environmental and aesthetic functions in farmedlandscapes. However, research on their variety, density and contribution to semi-natural habitatcover on farms in Ireland is lacking. This study investigates the diversity and density of all fieldboundary habitat types on 32 lowland farms in east County Galway, western Ireland. A total of286km of field boundaries were surveyed across six study sites. Five types of field boundary habitatswere recorded. The density of field boundaries on the farms studied was high and could havepositive implications for delivery of environmental public goods and sustainable farming metrics. Inmore intensively farmed areas, field boundaries were the only remaining semi-natural habitat onsome farms highlighting the need to retain, and improve the ecological quality, of these features.The condition of one field boundary type (hedgerows) was also investigated in further detail. Whilethe density of field boundaries was high on many of the surveyed farms, we found that thehedgerows on these farms were not necessarily in good condition for wildlife.
INTRODUCTION
Sustainable agriculture is a key strategy forEuropean farming and food production. TheEuropean Commission has convened a High-LevelSteering Board of the European Innovation Part-nership on ‘Agricultural Productivity and Sustain-ability’ to help meet the challenges of food security,sustainable resource management and environmentpreservation (DG Agriculture 2013). Integrat-ing functional agricultural biodiversity is a centralconcept in supporting sustainable agriculture(Bianchi et al. 2013). This integration requires anunderstanding of those biodiversity elements thatsupport ecosystem services and managing thosefeatures appropriately. Management practicesinclude informed choices on the integration ofnon-crop features such as field boundaries inagricultural landscapes (Bianchi et al. 2013). Typicalsemi-natural field boundaries in farmed landscapescomprise hedgerows, stone walls, earth banks andany associated watercourse such as streams or drains(Marshall and Moonen 2002). Farmland biodiver-sity features such as field boundaries form part of
our ‘green credentials’ from a food marketing pointof view but, in Ireland, there is a lack of data on thetypes and densities of field boundaries at farm-scales. The role of agriculture in maintaining andimproving the provision of environmental publicgoods is also becoming a prominent justification forexpenditure on the Common Agricultural Policy(CAP) (Hart et al. 2011). A variety of environ-mental public goods can be derived from good farmmanagement and include high quality water, airand soils, agricultural landscapes, climate stability(carbon sequestration and greenhouse gas emis-sions), resilience to flooding and farmland biodi-versity (Cooper et al. 2009). Field boundariescontribute considerably to public goods in a farmedlandscape relative to the area of land that theyoccupy (Cooper et al. 2009).
Field boundaries provide biodiversity in other-wise intensive landscapes in Britain and France(Marshall and Moonen 2002) and elsewhere inEurope. Field boundaries are the most commonsemi-natural habitats on intensively managed farmsin the Netherlands (Manhoudt and de Snoo 2003)and in Denmark they make up a high proportion of
Received3 December 2012.Accepted 11 June2013. Published 12November 2013.
Caroline A. Sullivan(Correspondingauthor; email:[email protected]), TeagascEnvironmentResearch Centre,Johnstown Castle,Wexford, Ireland;Applied EcologyUnit, Centre forEnvironmentalScience, NUI Galway,Ireland; and PlantScience, School ofNatural Sciences, NUIGalway, Ireland;John A. Finn,Teagasc EnvironmentResearch Centre,Johnstown Castle,Wexford, Ireland;Mike J. GormallyApplied EcologyUnit, Centre forEnvironmentalScience, NUI Galway,Ireland; MichelineSheehy Skeffington,Botany and PlantScience, School ofNatural Sciences, NUIGalway, Ireland.
Cite as follows:Sullivan, C.A., Finn,J.A., Gormally, M.J.and SheehySkeffington, M.2013 Field boundaryhabitats and theircontribution to thearea of semi-naturalhabitats on lowlandfarms in east Galway,western Ireland.Biology andEnvironment:Proceedings of theRoyal Irish Academy2013.DOI: 10.3318/BIOE.2013.13
DOI: 10.3318/BIOE.2013.14BIOLOGY AND ENVIRONMENT: PROCEEDINGS OF THE ROYAL IRISH ACADEMY, VOL. 113B, NO. 2, 1�13 (2013). # ROYAL IRISH ACADEMY 1

small biotopes contributing to the biodiversity ofagricultural landscapes (Agger and Brandt 1988).The contribution of field boundaries to the semi-natural habitat area of farms in Ireland has not beenquantified although research from two differentregions indicates that the average semi-naturalhabitat area on farms (including field boundariesin one case) is around 15% (Sheridan et al. 2011;Sullivan et al. 2011). The quality of these featuresmay also have an impact on the benefits theyprovide. Hedgerow corridors have a functionalimportance in a landscape but research suggeststhat hedgerows quality also has an effect onfunctionality with greater diversity of vegetationand structural complexity being favourable formovement over hedgerows of a more basic com-position (Davies and Pullin 2007). Field boundariesare also important features in extensively farmedlandscapes. Identification of HNV farmland is apriority for the current Rural Development Plan(RDP) (2007�2013) and is likely to be a priority forRDP 2014�2020. Ireland is required to identify,support and maintain HNV farmland and tomonitor any changes in its extent (EuropeanParliament and Council 2006). Length of hedge-rows or other semi-natural field boundaries (ofdefined quality) could be a HNV feature that wouldaid the identification of important high nature valuefarmland (Cooper and Beaufoy 2008). Data on fieldboundary density and quality are more importantnow than ever as decisions are made on the CAP2020, particularly in the context of the greening ofPillar 1 and the next Rural Development Plan(RDP 2014�2020).
Research to date has focused on hedgerows ingeneral (Foulkes and Murray 2005; Fuller 2006;Foulkes 2008) or the classification of hedgerowvegetation (Doogue and Kelly, 2006). There havealso been investigations into birds and their inter-actions with field boundaries on farms in the south-east of Ireland (McMahon et al. 2010a, 2010b), butthese studies discuss field boundaries in general orfocus on one or two field boundary habitats only.Indeed the research on field boundaries throughoutEurope often focuses on a single field boundarytype (Forman and Baudry 1984; French andCummins 2001; Herzon and Helenius 2008) andfew refer to the full variety of field boundaries in afarmed landscape (Burel et al. 1998; Aavik and Liira2010).
Here, we focus on field boundaries on lowlandgrassland farms in a region of east Galway, westernIreland. The first aim of this study was to quantifythe variety and density of field boundaries on afarm-scale to provide important baseline data onthese features. Secondly, this research also aimed toquantify the area of field boundaries on farms. Thiswould allow us to assess their contribution to thearea of semi-natural habitats, an important aspect of
sustainable agriculture. Finally, this study assessedhedgerows in more detail (looking at woody plantspecies composition and structural condition) as acommon field boundary on most farms to give acomprehensive view of both the density and qualityof one important component of farmland biodi-versity on lowland farms.
MATERIALS AND METHODS
STUDY AREA
The study took place in County Galway in the westof Ireland. The east of the county was chosen as,unlike the west of the county, most farmland in thisregion is outside of European or national natureconservation designated sites such as Special Areas ofConservation (SACs), Special Protection Areas(SPAs) and Natural Heritage Areas (NHAs). EastGalway is also representative of much of the midlandsin terms of farming practices (Lafferty et al. 1999),river and stream densities, road networks (OSI 2005)and soils (Teagasc 2008). District Electoral Divisions(DEDs) were selected as the main geographical unitsfor this study because farming data are readilyavailable at DED scale from the Central StatisticsOffice (CSO). East County Galway was split intofour quadrants and using stratified random sampling16 DEDs were selected (four in each quadrant).These DEDs were then assigned numbers (1�4).DED 1 in quadrant one was sampled first, then DED1 in quadrant two and so on until as many DEDs aspossible were sampled. The DEDs sampled wereClaregalway, Creggs, Cappard, Scregg, Kilmalinogueand Ahascragh (Fig. 1). Ten per cent of the farms ineach DED were selected through contact with localfarming organisations and surveyed (total � 32farms).
FIELD SURVEYS
On each of the 32 farms sampled, all habitatsincluding linear field boundary habitats were iden-tified according to Fossitt (2000). See Sullivan et al.(2011) for details on non-linear semi-natural habi-tats. Where a field boundary was composed of morethan one linear habitat type, each habitat present wasrecorded. As the more common field boundaryhabitat, hedgerows were investigated in more detail.For fields that had a hedgerow forming all or part ofthe field boundary, two randomly selected 30-mstrips were surveyed along the same side of thehedge as follows: the length of the hedgerow wasmeasured. The length was then divided in five suchthat two 30m lengths and three randomly generatedlengths would give the hedgerow length total.Using the following formula, a random numberwas generated in excel, Random 1 � RANDOM-BETWEEN (0, (L0-60)). The result of this was then
2
BIOLOGY AND ENVIRONMENT

included in a formula to generate a second randomfigure, Random 2 � RANDBETWEEN (0,((L-60)-Random 1)). Finally, both these randomnumbers were used to select the third randomnumber-Random 3 � ((L-60)-Random1�Ran-dom2)). This gives three random numbers propor-tional to the hedgerow length that allow randomlyselected 30m strips to be selected where L is the totallength of hedgerow (Foulkes and Murray 2006). Allwoody shrub and climber species present in eachstrip were identified and assigned abundance, basedon the DAFOR scale (Kent and Coker 1994).Herbaceous hedgerow plant species were notrecorded. Details on hedgerow structure, such ashedgerow function, profile, height, width, gappi-ness, vigour and adjacent habitat were recordedaccording to Foulkes and Murray (2006). Treespecies present in the hedge were also recorded.Farm management data such as stocking density andfarming enterprise were collected from each farmerat the time of field sampling. The hedgerows wereassessed as species-rich if four or more native woodyshrubs were present (Foulkes and Murray 2006).Whether or not the hedgerow was of favourablecondition for wildlife was assessed based on certainstructural characteristics adapted from the BritishHedgerow Survey handbook (DEFRA 2007)(Table 1). A hedgerow was considered of favourablecondition for wildlife if it met all six listed criteria.Field surveys were conducted from May to Octoberof 2006 and 2007.
STATISTICAL ANALYSIS
The habitat data were digitised using ArcGIS 9.3,facilitating geospatial calculations such as field bound-ary lengths and non-linear semi-naturalhabitat areas. Area of field boundaries was calculatedby assigning them a width of 1m. This likely under-estimates the true cover of these features on farms (themajority of hedgerows, drainage ditches and earthbanks were �2m in width) but still gives anindication of the minimum cover (albeit a veryconservative one). Differences in frequencies ofspecies-rich hedgerows and hedgerows of favourablecondition among DEDs were examined using the chi-squared test. As there was only one degree of freedom,Yates Correction for Continuity was included in eachpairwise comparison (Fowler et al. 1998). We alsoexamined whether either hedgerow density or totalfield boundary density was correlated with theproportion of non-linear semi-natural habitats (%) onfarms (Pearson’s correlation coefficient).
Abundance data for the woody plant commu-nities were analysed using PC-Ord version 5 forWindows (McCune and Mefford 2006). Non-metric Multidimensional Scaling (NMS) analysiswas conducted using a Sørenson distance measure, athree-axis solution and 500 real data runs, based oninitial autopilot results. NMS was chosen because itavoids the assumption of linear relationships amongvariables and allows the use of distance measuressuited to non-normally distributed data (McCune
Fig. 1*County Galway showing conservation designation sites (Special Area of Conservation (SAC), Natural Heritage
Area (NHA) and Special Protection Area (SPA)) in light grey. Study DEDs are shown in dark grey. Clockwise from the
left-most DED is Claregalway, Scregg, Creggs, Ahascragh, Kilmalinogue and Cappard.
3
FIELD BOUNDARIES’ CONTRIBUTION TO SEMI-NATURAL HABITATS ON LOWLAND FARMS
and Grace 2002). To aid interpretation, differentfactors associated with the hedgerows were overlainon the ordination such as DED they occurred in,hedgerow woody plant species-richness, farm en-terprise (from farm interviews), proportion of non-linear semi-natural habitat (based on field surveys,see Sullivan et al. (2011) for further details) anddominant soil type (based on the Teagasc Soils Map2008) on the farm.
RESULTS
FIELD BOUNDARIES
Five types of linear field boundaries (excludingwire fencing) were identified on the 32 farms,
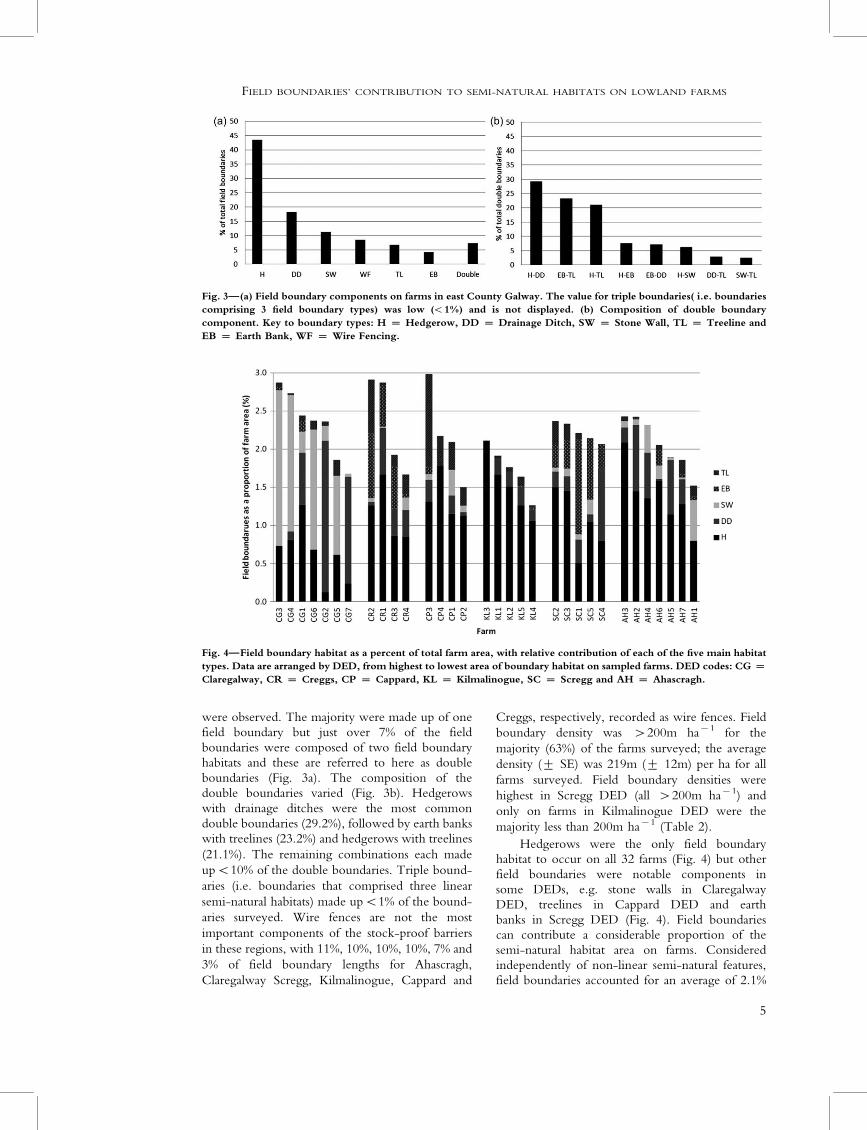
hedgerows, drainage ditches, stone walls, treelinesand earth banks (see Fig. 2). The field boundariestotalled 286km in length and the mean number (9SE) of field boundary habitat types per farm was 4.0(9 1.0). The majority (93%) of the farms had threeor more field boundary habitats. Hedgerows werethe most common field boundary overall (44%)(Fig. 3a) though they were not necessarily thedominant field boundary in every DED (seeClaregalway farms, Fig. 4). Drainage ditches werealso common; they occurred frequently as singleboundaries (18%) and as components of doubleboundaries (Fig. 3a and b). Stone walls comprised�10% of the single field boundaries but were not amajor component of double boundaries (Fig. 3aand b). Of the field boundaries surveyed, 16different combinations of the five linear habitats
Table 1*Criteria that must be met for a hedgerow to be considered in good or favourable
condition for wildlife (adapted from DEFRA 2007). All six criteria must be met for a
hedgerow to be considered in ‘favourable condition’. The percentage of hedgerows
that did not fulfil each individual criterion is included.
Threshold for favourable condition for wildlife
Hedgerows surveyed
that did not fulfil this
condition (%)
Average height at least 2m 0
Average width at least 1.5m 0
Less than 10% gaps, with no individual gap wider than 5m 38
Base of woody component closer than 50cm to the ground 35
Less than 10% introduced non-native species 10
At least 2m of undisturbed (uncultivated) ground from hedge 0
Hedgerows in this study that were not in favourable condition for wildlife (%) 56
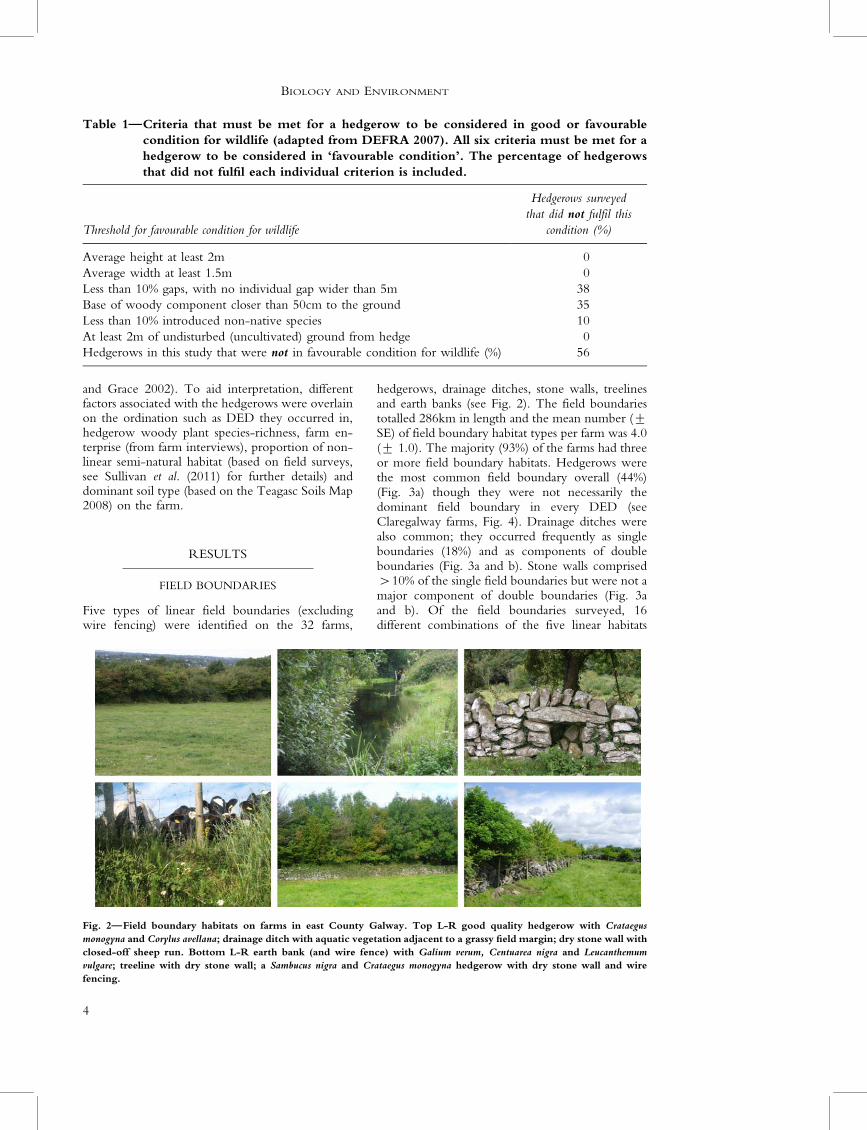
Fig. 2*Field boundary habitats on farms in east County Galway. Top L-R good quality hedgerow with Crataegus
monogyna and Corylus avellana; drainage ditch with aquatic vegetation adjacent to a grassy field margin; dry stone wall with
closed-off sheep run. Bottom L-R earth bank (and wire fence) with Galium verum, Centuarea nigra and Leucanthemum
vulgare; treeline with dry stone wall; a Sambucus nigra and Crataegus monogyna hedgerow with dry stone wall and wire
fencing.
4
BIOLOGY AND ENVIRONMENT
were observed. The majority were made up of onefield boundary but just over 7% of the field
boundaries were composed of two field boundaryhabitats and these are referred to here as double
boundaries (Fig. 3a). The composition of thedouble boundaries varied (Fig. 3b). Hedgerows
with drainage ditches were the most common
double boundaries (29.2%), followed by earth bankswith treelines (23.2%) and hedgerows with treelines
(21.1%). The remaining combinations each made
upB10% of the double boundaries. Triple bound-
aries (i.e. boundaries that comprised three linear
semi-natural habitats) made upB1% of the bound-
aries surveyed. Wire fences are not the most
important components of the stock-proof barriers
in these regions, with 11%, 10%, 10%, 10%, 7% and
3% of field boundary lengths for Ahascragh,
Claregalway Scregg, Kilmalinogue, Cappard and
Creggs, respectively, recorded as wire fences. Field
boundary density was �200m ha�1 for the
majority (63%) of the farms surveyed; the average
density (9 SE) was 219m (9 12m) per ha for all
farms surveyed. Field boundary densities were
highest in Scregg DED (all �200m ha�1) and
only on farms in Kilmalinogue DED were the
majority less than 200m ha�1 (Table 2).
Hedgerows were the only field boundaryhabitat to occur on all 32 farms (Fig. 4) but otherfield boundaries were notable components insome DEDs, e.g. stone walls in ClaregalwayDED, treelines in Cappard DED and earthbanks in Scregg DED (Fig. 4). Field boundariescan contribute a considerable proportion of thesemi-natural habitat area on farms. Consideredindependently of non-linear semi-natural features,field boundaries accounted for an average of 2.1%
Fig. 3*(a) Field boundary components on farms in east County Galway. The value for triple boundaries( i.e. boundaries
comprising 3 field boundary types) was low (B1%) and is not displayed. (b) Composition of double boundary
component. Key to boundary types: H � Hedgerow, DD � Drainage Ditch, SW � Stone Wall, TL � Treeline and
EB � Earth Bank, WF � Wire Fencing.
Fig. 4*Field boundary habitat as a percent of total farm area, with relative contribution of each of the five main habitat
types. Data are arranged by DED, from highest to lowest area of boundary habitat on sampled farms. DED codes: CG �
Claregalway, CR � Creggs, CP � Cappard, KL � Kilmalinogue, SC � Scregg and AH � Ahascragh.
5
FIELD BOUNDARIES’ CONTRIBUTION TO SEMI-NATURAL HABITATS ON LOWLAND FARMS

(90.4) of the total farm area. The maximum farmarea covered by the field boundaries was 2.9%(CP3, Fig. 4) and the minimum was 1.3% (KL4,Fig. 4). Since the field boundary area is based on a1m width for all boundaries it is likely that this is anunderestimation and that these figures woulddouble in many cases (the majority of hedgerowswere �2m in width). On some farms (CG1, CG6
and KL2), the field boundaries were the only semi-natural habitats recorded on the farm (Table 2).However, there was considerable variation withinDEDs and on farms CG7, SC5 and AH5, the fieldboundaries comprised just 3�4% of the total areaof semi-natural habitat recorded on these farms(Table 2). The possibility of using hedgerowdensity or total field boundary density as a proxy
Table 2*Field boundary density per farm in descending order of density arranged by DED. The
hedgerow density (m ha�1) and percentage of total boundary that were hedgerows are
also given, as well as the percent contribution of field boundaries to the total area of
semi-natural habitat on each farm. DED codes: CG=Claregalway, CR=Creggs,
CP=Cappard, KL=Kilmalinogue, SC=Scregg and AH=Ahascragh.
DED
All boundary
density (m ha�1)
Hedgerow density
(m ha�1)
Proportion of field
boundaries that were
hedgerow (%)
Field boundaries as a% of
semi-natural habitats
CG3 287.0 72.3 25 81
CG4 273.2 80.4 29 25
CG1 243.9 126.5 52 100
CG6 237.3 67.5 28 100
CG2 235.8 23.7 5 81
CG5 185.5 60.7 33 17
CG7 167.4 23.4 14 3
CR2 291.1 126.3 43 39
CR1 286.8 166.4 58 27
CR3 192.2 42.7 45 7
CR4 166.5 85.2 51 8
CP3 298.3 130.8 44 15
CP4 216.9 178.2 82 9
CP1 209.3 114.6 55 6
CP2 149.8 112.6 75 8
KL3 210.6 210.6 100 59
KL1 188.8 164.5 87 51
KL2 172.6 146.9 85 100
KL5 163.8 126.2 77 41
KL4 126.0 105.9 84 17
SC2 236.2 149.7 63 34
SC3 233.1 145.1 62 5
SC1 220.8 50.2 23 34
SC5 214.1 104.9 49 4
SC4 206.3 79.1 38 40
AH3 243.1 208.3 86 9
AH2 242.4 144.4 60 14
AH4 231.6 135.7 59 19
AH6 205.1 158.3 77 13
AH5 188.9 114 60 4
AH7 185.2 127.5 69 40
AH1 152.0 79.3 52 14
6
BIOLOGY AND ENVIRONMENT
for semi-natural habitat cover on a farm was alsoinvestigated. However, there was no significantcorrelation between either farm hedgerow density(r2 � �0.232, P � 0.201), or total field boundarydensity (r2 � �0.137, P � 0.454) and the semi-natural habitat area of that farm.
3.2. HEDGEROW CONDITION
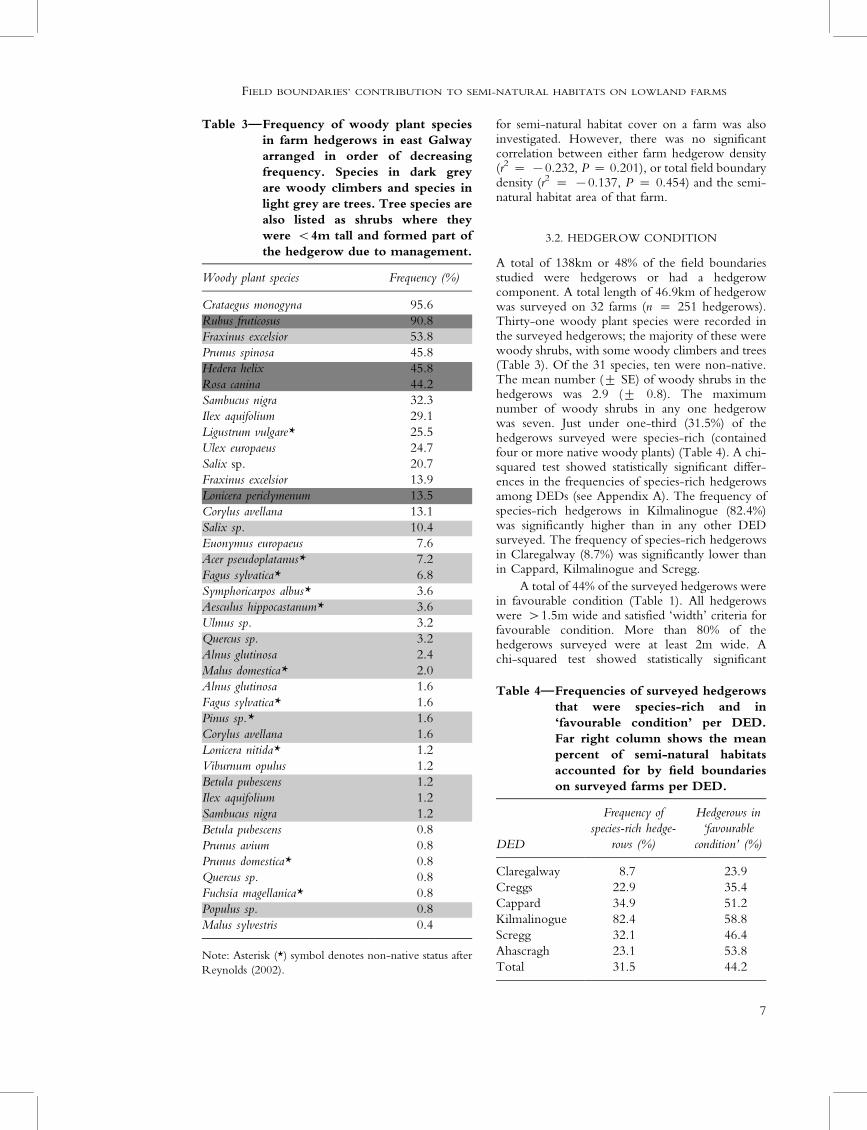
A total of 138km or 48% of the field boundariesstudied were hedgerows or had a hedgerowcomponent. A total length of 46.9km of hedgerowwas surveyed on 32 farms (n � 251 hedgerows).Thirty-one woody plant species were recorded inthe surveyed hedgerows; the majority of these werewoody shrubs, with some woody climbers and trees(Table 3). Of the 31 species, ten were non-native.The mean number (9 SE) of woody shrubs in thehedgerows was 2.9 (9 0.8). The maximumnumber of woody shrubs in any one hedgerowwas seven. Just under one-third (31.5%) of thehedgerows surveyed were species-rich (containedfour or more native woody plants) (Table 4). A chi-squared test showed statistically significant differ-ences in the frequencies of species-rich hedgerowsamong DEDs (see Appendix A). The frequency ofspecies-rich hedgerows in Kilmalinogue (82.4%)was significantly higher than in any other DEDsurveyed. The frequency of species-rich hedgerowsin Claregalway (8.7%) was significantly lower thanin Cappard, Kilmalinogue and Scregg.
A total of 44% of the surveyed hedgerows werein favourable condition (Table 1). All hedgerowswere �1.5m wide and satisfied ‘width’ criteria forfavourable condition. More than 80% of thehedgerows surveyed were at least 2m wide. Achi-squared test showed statistically significant
Table 3*Frequency of woody plant species
in farm hedgerows in east Galway
arranged in order of decreasing
frequency. Species in dark grey
are woody climbers and species in
light grey are trees. Tree species are
also listed as shrubs where they
were B4m tall and formed part of
the hedgerow due to management.
Woody plant species Frequency (%)
Crataegus monogyna 95.6
Rubus fruticosus 90.8
Fraxinus excelsior 53.8
Prunus spinosa 45.8
Hedera helix 45.8
Rosa canina 44.2
Sambucus nigra 32.3
Ilex aquifolium 29.1
Ligustrum vulgare* 25.5
Ulex europaeus 24.7
Salix sp. 20.7
Fraxinus excelsior 13.9
Lonicera periclymenum 13.5
Corylus avellana 13.1
Salix sp. 10.4
Euonymus europaeus 7.6
Acer pseudoplatanus* 7.2
Fagus sylvatica* 6.8
Symphoricarpos albus* 3.6
Aesculus hippocastanum* 3.6
Ulmus sp. 3.2
Quercus sp. 3.2
Alnus glutinosa 2.4
Malus domestica* 2.0
Alnus glutinosa 1.6
Fagus sylvatica* 1.6
Pinus sp.* 1.6
Corylus avellana 1.6
Lonicera nitida* 1.2
Viburnum opulus 1.2
Betula pubescens 1.2
Ilex aquifolium 1.2
Sambucus nigra 1.2
Betula pubescens 0.8
Prunus avium 0.8
Prunus domestica* 0.8
Quercus sp. 0.8
Fuchsia magellanica* 0.8
Populus sp. 0.8
Malus sylvestris 0.4
Note: Asterisk (*) symbol denotes non-native status after
Reynolds (2002).
Table 4*Frequencies of surveyed hedgerows
that were species-rich and in
‘favourable condition’ per DED.
Far right column shows the mean
percent of semi-natural habitats
accounted for by field boundaries
on surveyed farms per DED.
DED
Frequency of
species-rich hedge-
rows (%)
Hedgerows in
‘favourable
condition’ (%)
Claregalway 8.7 23.9
Creggs 22.9 35.4
Cappard 34.9 51.2
Kilmalinogue 82.4 58.8
Scregg 32.1 46.4
Ahascragh 23.1 53.8
Total 31.5 44.2
7
FIELD BOUNDARIES’ CONTRIBUTION TO SEMI-NATURAL HABITATS ON LOWLAND FARMS
differences in the frequencies of hedgerows in favou-rable condition among DEDs (see Appendix B).The frequency of hedgerows in ‘favourable
condition’ in Claregalway (23.9%) was significantlylower than that in Cappard, Kilmalinogue andAhascragh. There was no statistically significant
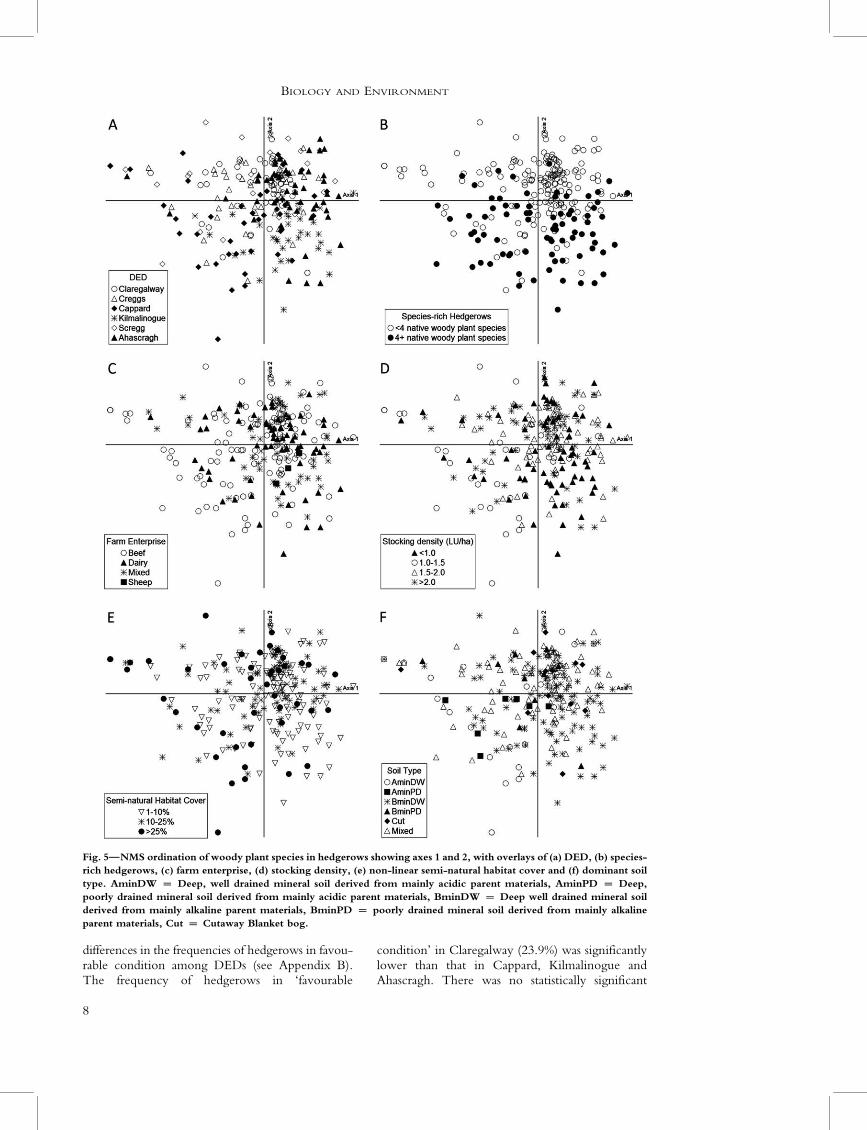
Fig. 5*NMS ordination of woody plant species in hedgerows showing axes 1 and 2, with overlays of (a) DED, (b) species-
rich hedgerows, (c) farm enterprise, (d) stocking density, (e) non-linear semi-natural habitat cover and (f) dominant soil
type. AminDW � Deep, well drained mineral soil derived from mainly acidic parent materials, AminPD � Deep,
poorly drained mineral soil derived from mainly acidic parent materials, BminDW � Deep well drained mineral soil
derived from mainly alkaline parent materials, BminPD � poorly drained mineral soil derived from mainly alkaline
parent materials, Cut � Cutaway Blanket bog.
8
BIOLOGY AND ENVIRONMENT

difference in species-richness of hedgerows amongthe other DEDs surveyed. These chi-squared testresults show differences in the frequency of bothspecies-richness and favourable structural character-istics of hedgerows among the DEDs surveyed. Themajority of hedgerows (56%) were not in favour-able condition. The most common reasons weregappiness (38%), the base being too open andscrawny (35%) or the presence of more than 10%non-native species (10%) or a combination of these(Table 1).
The NMS analyses, based on hedgerow woodyspecies composition, indicated that axes 1 and 2accounted for most of the variance in the distancematrix, explaining 44% and 22%, respectively(Fig. 5). Axis 3 accounted for 17% of the variance.For clarity, species names are not shown, butCrataegus monogyna occurred throughout the ma-jority of hedgerows (96%); Corylus avellana andEuonymus europaeus were more frequent in hedge-rows in the lower quadrants of the NMS and Ulexeuropaeus most frequently occurred in hedgerows inthe top left quadrant. Woody species compositionof hedgerows did not vary much among DEDs.Kilmalinogue hedges are concentrated in the lowerright quadrant of the ordination and Cappardhedges are mostly in the bottom left (Fig. 5a).These lower quadrants are where the species-richhedgerows are concentrated (Fig. 5b), indicatingthat Cappard and Kilmalinogue have more species-rich hedgerows than the other DEDs. This in turncorresponds with the occurrence of C. avellana andE. europaeus known to be more abundant in species-rich hedgerows (Pollard et al. 1974; Foulkes andMurray 2005). Woody species composition did notvary according to farm enterprise (Fig. 5c) orstocking density (Fig. 5d) although hedges on farmswith stocking densities of B1LU ha�1 occurredmore on the right-hand side of the ordination(black triangles). It is notable that farms with a highproportion of other (i.e. non-linear) semi-naturalhabitat were not necessarily those with species-richhedgerows (compare Fig. 5b and e). In fact, manyof the more species-rich hedgerows (in the bottomright quadrant) occur on farms with B10% non-linear semi-natural habitat area (Fig. 5e). Thesehedgerows also mostly occurred over the alkaline,well-drained soils of Kilmalinogue and Ahascragh(as opposed to more acid or waterlogged soils)(Fig. 5a and f).
DISCUSSION
Hedgerows, stone walls, earth banks, drainageditches and treelines each contribute differently tobiodiversity, due to the variety in their structureand the habitats they provide for plants and animals(Forman and Baudry 1984; Smart et al. 2002;
Herzon and Helenius 2008; Aavik and Liira2010). In this study, on average, there were fourfield boundary types per farm. Current agri-envir-onment schemes tend to focus on one or two of thefield boundaries that occur on farms, incorporatingthem into the farm management plan and advisingon their management. In Britain and Ireland, theprotection and management of hedgerows andstone walls are addressed by agri-environmentschemes (DAFF 2006; NE 2008), as are drainageditches in the Netherlands (Blomqvist et al. 2009).In most cases, management recommendations arelacking for the full variety of field boundary habitatsthat occur on farms, including double boundaries.The results presented here highlight the need toconsider all field boundary types and compositions(not just hedgerows and stone walls) when assessingthe biodiversity that is contributing to sustainableagriculture. Drainage ditches in particular wereimportant components in the studied farms thatare largely overlooked in Ireland. The integrationof functional agricultural biodiversity in agro-ecosystems requires understanding of these biodi-versity elements and translation of such knowledgeinto tailored farm and landscape managementpractices (Bianchi et al. 2013).
In Brittany, hedgerow densities of 273m h�1 awas considered to be high (bocage landscape) and113m ha�1 was considered to be low (openlandscape) (Baudry et al. 2000). The average densityof the field boundary habitats, predominantlyhedgerows, on the surveyed farms in this studywas high (�200m ha�1 for the majority of farms).Per unit area, field boundaries make a considerablecontribution to environmental public goods, so ahigher density of boundaries and margins will oftenbe associated with a higher than average provisionof environmental benefits (Cooper et al. 2009).Field boundary metrics such as these could beimportant for initiatives such as Origin Green(BordBia 2012) in which food companies committo the development of farm-scale sustainabilitythrough maintaining and/or improving sustainabil-ity in key target areas such as greenhouse gasemissions, water, energy and biodiversity. Similarmetrics are in place in the UK. Farmers can follow a‘conservation grade’ sustainability protocol in re-turn for a contracted premium price for their crop.They commit to dedicating a minimum of 10% oftheir farm area to wildlife habitats. Up to 2% ofthese can be field boundaries (Conservation GradeProducers 2011). On arable farms in the Nether-lands the total area of semi-natural habitats recordedwas just 2.1%, a high proportion of which was fieldboundaries (Manhoudt and de Snoo 2003). In thisstudy, field boundaries alone represented an averageof 2.1% of the farm area surveyed. This figure isconservative and they may, in fact, make up twicethat. Data such as these may validate Ireland’s
9
FIELD BOUNDARIES’ CONTRIBUTION TO SEMI-NATURAL HABITATS ON LOWLAND FARMS

‘green credentials’ from a food marketing point ofview.
Field boundaries represented between 3% and100% of the semi-natural habitats identified on thefarms surveyed. Where field boundaries provide theonly semi-natural habitat on a farm they should beactively targeted through agri-environmentschemes to ensure that these existing habitats are,firstly, retained and, secondly, managed in the mostappropriate manner to promote connectivity withfarms or landscapes with greater densities of semi-natural habitats and to ensure sustainable resourcemanagement and environment preservation. A highdensity of field boundaries is also a HNV farmlandfeature (Cooper and Beaufoy 2008), though theirpresence alone does not indicate HNV farmland.This research indicated that hedgerow density ortotal field boundary density were not suitable asproxies for semi-natural habitat cover on a farm butthey may still be important HNV features wherethe semi-natural habitat area is high. Where thefield boundaries occur within less intensivelymanaged land, they will normally be of higherconservation value because they usually have morecomplex interrelations of species and habitats (Beierand Noss 1998; Burel and Baudry 2005; Cooperand Beaufoy 2008).
While the presence of these features is im-portant, the quality of these field boundary net-works also needs to be measured. The ecologicalprocesses and species associated with agriculturalhabitats are greatly affected by a number of factorssuch as the spatial scale of the fields and farmingsystem and the presence and ecological quality offield boundary habitats and landscape diversity(Polakova et al. 2011). The more intensively farmedDEDs had some of the lowest areas of semi-naturalhabitats, but had the highest frequency of species-rich hedgerows (Kilmalinogue DED, Table 4). Theoccurrence of more species-rich hedgerows in theseareas is probably related to soil quality. Areas withgood soil quality (base-rich and well-drained) areoften converted to more intensive agriculture andso semi-natural habitat area is low; however, thehedgerows have probably been retained due totheir stock-proofing or boundary-markingproperties. McMahon et al. (2010a) made similarobservations on farms in south-east Ireland. Goodquality hedgerows in intensively farmed areas canprovide essential networks for species connectivitywith more extensively farmed and natural areas inthe same landscape (Grashof-Bokdam and Lange-velde 2005; Schippers et al. 2009). That said, almost40% of the hedgerows in Kilmalinogue DED werenot in favourable condition for wildlife. In fact68.5% of the hedgerows in this study were notspecies-rich and 44.2% of them were not infavourable condition for wildlife. This suggeststhat while the field boundary density in a region
might be high, they are not necessarily of goodquality. The most common reasons for thesehedgerows not being in favourable conditionwere gappiness, open and scrawny bases and thepresence of more than 10% non-native species.According to DEFRA (2007), enhancement of thediversity of plant species and structure of a hedge-row to promote wildlife diversity may be achievedif a hedgerow is in favourable condition. Simplemeasures such as increasing the hedgerow width(Aavik and Liira 2010) or targetting non-nativeplant species in the hedgerows through agri-environment or rural development schemes couldenhance the biodiversity of these features further. Itcould also be achieved through community-basedschemes that promote field boundaries and theirrole in the natural heritage of an area such as theGolden Mile competition in County Galway forhedgerows (GalwayCoCo 2012). Although, giventhe variety of field boundaries on Irish farms theseinitiatives should be extended beyond hedgerows.Further research is necessary to investigate methodsof assessing the quality of the other field boundarytypes common on Irish farms, particularly drainageditches. Information on the diversity and quality offield boundaries is important for plant, habitat andlandscape diversity perspectives but they are alsobecoming increasingly important from consumerperspectives as measures of sustainable farmingpractices.
ACKNOWLEDGEMENTS
We sincerely thank all the landowners who gavepermission for us to survey their farms. Thanks toJanice Fuller, Heather Lally, Julien Meyroneinc andBarry Kearns for assistance with hedgerowsurveying and data entry. Thanks also to DavidBourke and Daire O hUallachain for reviewingdrafts of the paper and to two anonymous reviewersfor their useful comments and suggestions. Thiswork was funded by Teagasc (The Irish Agricultureand Food Development Authority) under theWalsh Fellowship Scheme.
REFERENCES
Aavik, T. and Liira, J. 2010 Quantifying the effect oforganic farming, field boundary type and landscapestructure on the vegetation of field boundaries.Agriculture, Ecosystems and Environment 135,178�86.
Agger, P. and Brandt, J. 1988 Dynamics of smallbiotopes in Danish agricultural landscapes. LandscapeEcology 1, 227�40.
Baudry, J., Burel, F., Thenail, C. and Le Coeur, D.2000 A holistic landscape ecological study of theinteractions between farming activities and ecological
10
BIOLOGY AND ENVIRONMENT
patterns in Brittany, France. Landscape and Urban
Planning 50, 119�28.Beier, P. and Noss, R.F. 1998 Do habitat corridors
provide connectivity? Conservation Biology 12,
1241�52.Bianchi, F.J.J.A., Mikos, V., Brussaard, L., Delbaere, B.
and Pulleman, M.M. 2013 Opportunities and
limitations for functional agrobiodiversity in the
European context. Environmental Science and Policy
27, 223�31.Blomqvist, M.M., Tamis, W.L.M. and de Snoo, G.R.
2009 No improvement of plant biodiversity in
ditch banks after a decade of agri-environment
schemes. Basic and Applied Ecology 10, 368�78.BordBia 2012 What is origin green? Bord Bia (Irish
Food Board). http://www.bordbia.ie/origingreen/
whatisorigingreen/pages/default.aspx (accessed 12
September 2012).Burel, F. and Baudry, J. 2005 Habitat quality and
connectivity in agricultural landscapes: the role of
land use systems at various scales in time. Ecological
Indicators 5, 305�13.Burel, F., Baudry, J., Butet, A., Clergeau, P., Delettre,
Y., Le Coeur, D., Dubs, F., Morvan, N., Paillat, G.,
Petit, S., Thenail, C., Brunel, E. and Lefeuvre,
J.-C. 1998 Comparative biodiversity along a
gradient of agricultural landscapes. Acta Oecologica
19, 47�60.Conservation Grade Producers 2011 Conservation
Grade Farming Protocol. St. Neots, Cambridgeshire.
Conservation Grade Producers Ltd.Cooper, T. and Beaufoy, G. 2008 A guidance
document: the application of the high nature value impact
indicator. Brussels. Institute for European Environ-
mental Policy.Cooper, T., Hart, K. and Baldock, D. 2009 The
provision of public goods through agriculture in the
European Union. London. Institute for European
and Environmental Policy.DAFF 2006 The Rural Environment Protection Scheme
(REPS). Specification for REPS planners in the prepara-
tion of REPS 4 plans. Dublin. Department of
Agriculture, Food and Fisheries.Davies, Z. and Pullin, A. 2007 Are hedgerows
effective corridors between fragments of woodland
habitat? An evidence-based approach. Landscape
Ecology 22, 333�51.DEFRA 2007 Hedgerow Survey Handbook: A standard
procedure for local surveys in the UK. London. Depart-
ment for Environment, Food and Rural Affairs.DG Agriculture 2013 Agriculture and rural develop-
ment. Available at http://ec.europa.eu/agriculture/
eip/events/steering-board-01_en.htm (accessed on
26 February 2013).Doogue, D. and Kelly, D.L. 2006 Woody plant
assemblages in the hedges of eastern Ireland:
products of history or of ecology. Biology and
Environment 106B (3), 237�50.European Parliament and Council 2006 2006/144/
EC: Council Decision of 20 February 2006 on
Community strategic guidelines for rural develop-
ment (programming period 2007 to 2013). Official
Journal of the European Union L 55, 20�29.
Forman, R.T.T. and Baudry, J. 1984 Hedgerowsand hedgerow networks in landscape ecology.Environmental Management 8, 495�510.
Fossitt, J. 2000 A guide to habitats in Ireland.Kilkenny. The Heritage Council.
Foulkes, N. 2008 County Sligo hedgerow survey report.Sligo. Sligo County Council and the HeritageCouncil.
Foulkes, N. and Murray, A. 2005 County LaoisHedgerow survey report. Portlaoise. Laois CountyCouncil.
Foulkes, N. and Murray, A. 2006 A methodologyfor the recording of hedgerow extent, speciescomposition, structure and condition in Ireland.Tearmann 5, 75�89.
Fowler, J., Cohen, L. and Jarvis, P. 1998 Practicalstatistics for field biology. Chichester and New York.Wiley.
French, D.D. and Cummins, R.P. 2001 Classifica-tion, composition, richness and diversity of Britishhedgerows. Applied Vegetation Science 4, 213�28.
Fuller, J. 2006 East Galway hedgerow survey. Galway.Galway County Council.
GalwayCoCo 2012 The ‘Golden Mile’ of Galway.Galway. Galway County Council. Available athttp://www.galway.ie/en/Services/Heritage/GoldenMile/golden%20mile%20advertisment%20Mar%202012%20(2).pdf (accessed on 20 March 2013).
Grashof-Bokdam, C.J. and Langevelde, F. 2005 Greenveining: Landscape determinants of biodiversity inEuropean agricultural landscapes. Landscape Ecology20, 417�439.
Hart, K., Baldock, D., Weingarten, P., Osterburg, B.,Povellato, A., Vanni, F., Pirzio-Biroli, C. andBoyes, A. 2011 What tools for the Europeanagricultural policy to encourage the provision of publicgoods? Brussels. European Parliament.
Herzon, I. and Helenius, J. 2008 Agriculturaldrainage ditches, their biological importance andfunctioning. Biological Conservation 141, 1171�83.
Kent, M. and Coker, P. 1994 Vegetation descriptionand analysis: a practical approach. Chichester. JohnWiley.
Lafferty, S., Commins, P. and Walsh, J.A. 1999 Irishagriculture in transition: a census atlas of agriculture in theRepublic of Ireland. Maynooth, Co. Kildare, Dublin.Teagasc in Association with Department of Geo-graphy, National University of Ireland.
Manhoudt, A.G.E., de Snoo, G.R. 2003 A quanti-tative survey of semi-natural habitats on Dutcharable farms. Agriculture, Ecosystems & Environment97, 235�40.
Marshall, E.J.P. and Moonen, A.C. 2002 Fieldmargins in northern Europe: their functions andinteractions with agriculture. Agriculture, Ecosystems& Environment 89, 5�21.
McCune, B. and Grace, J.B. 2002 Analysis ofecological communities. Gleneden Beach, Oregon.MjM Software Design.
McCune, B. and Mefford, M.J. 2006 PC-ORD.Multivariate analysis of ecological data, Version 5.1.Gleneden Beach, Oregon. MjM Software.
McMahon, B.J., Helden, A., Anderson, A., Sheridan, H.,Kinsella, A. and Purvis, G. 2010a Interactionsbetween livestock systems and biodiversity in
11
FIELD BOUNDARIES’ CONTRIBUTION TO SEMI-NATURAL HABITATS ON LOWLAND FARMS

South-East Ireland. Agriculture, Ecosystems & Envir-onment 139, 232�38.
McMahon, B.J., Sheridan, H., Kinsella, A. and Purvis, G.2010b An assessment of bird species within Irishagricultural landscapes using the Field BoundaryEvaluation and Grading System. Bird Study 57,108�15.
NE 2008 Entry level stewardship handbook 2nd edn.Sheffield. Natural England.
OSI 2005 1:50,000 maps, Discovery Series. Dublin.Ordnance Survey Ireland.
Polakova, J., Tucker, G., Hart, K., Dwyer, J. andRayment, M. 2011 Addressing biodiversityand habitat preservation through measures appliedunder the Common Agricultural Policy. ReportPrepared for DG Agriculture and Rural Develop-ment, Contract No. 30-CE-0388497/00-44. Insti-tute for European Environmental Policy, London.
Pollard, E., Hooper, M.D., Moore, N.W. 1974Hedges. London. Collins.
Reynolds, S.C.P. 2002 A catalogue of alien plantsin Ireland. Glasnevin, Ireland. National BotanicGardens.
Schippers, P., Grashof-Bokdam, C., Verboom, J.,Baveco, J., Jochem, R., Meeuwsen, H. and VanAdrichem, M. 2009 Sacrificing patches forlinear habitat elements enhances metapopulationperformance of woodland birds in fragmentedlandscapes. Landscape Ecology 24, 1123�1133.
Sheridan, H., McMahon, B.J., Carnus, T., Finn, J.A.,Anderson, A., Helden, A.J., Kinsella, A. and Purvis,G. 2011 Pastoral farmland habitat diversity insouth-east Ireland. Agriculture, Ecosystems & Environ-ment 144, 130�5.
Smart, S.M., Bunce, R.G.H., Firbank, L.G. and Coward,P. 2002 Do field boundaries act as refugia forgrassland plant species diversity in intensively man-aged agricultural landscapes in Britain? Agriculture,Ecosystems & Environment 91, 73�87.
Sullivan, C.A., Bourke, D., Skeffington, M.S., Finn, J.A.,Green, S., Kelly, S. and Gormally, M.J. 2011Modelling semi-natural habitat area on lowlandfarms in western Ireland. Biological Conservation144, 1089�99.
Teagasc 2008 Soils and subsoils class. Wexford.Environmental Protection Agency.
12
BIOLOGY AND ENVIRONMENT
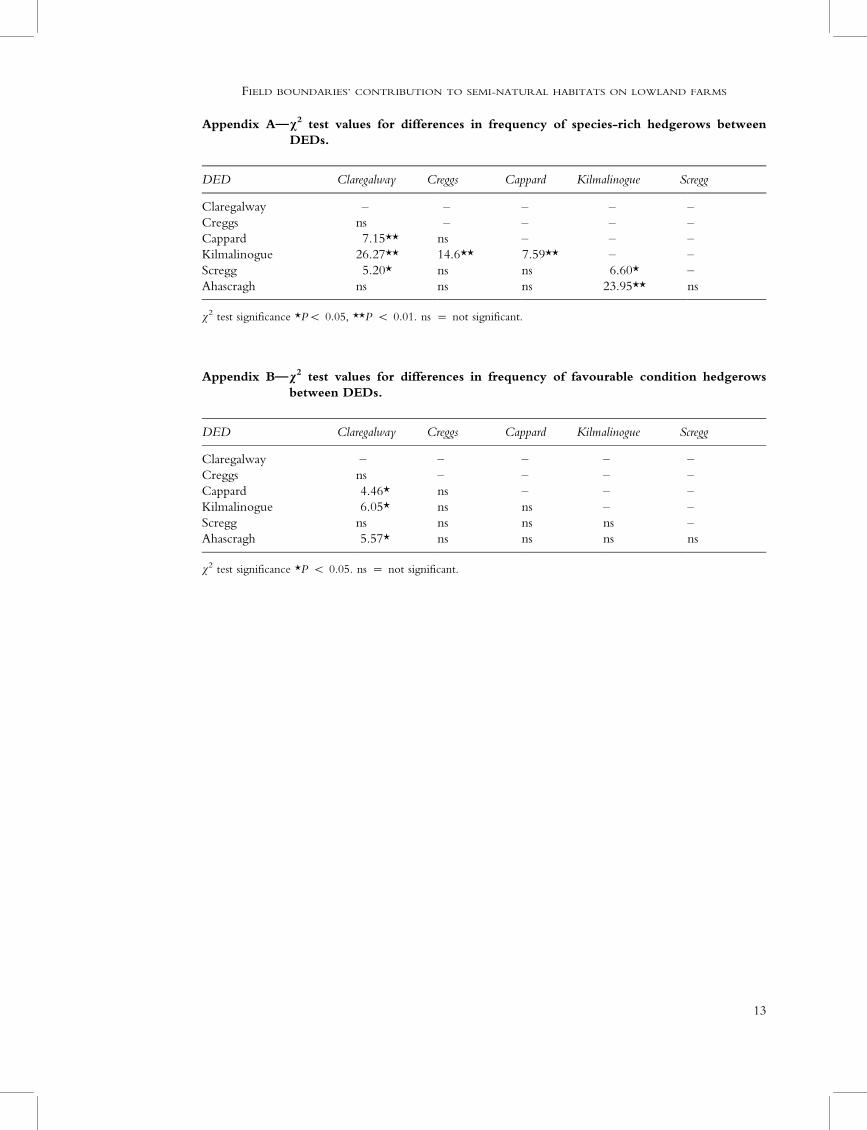
Appendix A*x2 test values for differences in frequency of species-rich hedgerows between
DEDs.
DED Claregalway Creggs Cappard Kilmalinogue Scregg
Claregalway � � � � �Creggs ns � � � �Cappard 7.15** ns � � �Kilmalinogue 26.27** 14.6** 7.59** � �Scregg 5.20* ns ns 6.60* �Ahascragh ns ns ns 23.95** ns
x2 test significance *PB 0.05, **P B 0.01. ns � not significant.
Appendix B*x2 test values for differences in frequency of favourable condition hedgerows
between DEDs.
DED Claregalway Creggs Cappard Kilmalinogue Scregg
Claregalway � � � � �Creggs ns � � � �Cappard 4.46* ns � � �Kilmalinogue 6.05* ns ns � �Scregg ns ns ns ns �Ahascragh 5.57* ns ns ns ns
x2 test significance *P B 0.05. ns � not significant.
13
FIELD BOUNDARIES’ CONTRIBUTION TO SEMI-NATURAL HABITATS ON LOWLAND FARMS