field assessment of cold recycling technologies used for
TRANSCRIPT

Field Assessment of Cold Recycling Technologies Used for Pavement Preservation
by
Danny S. Martinez Rodriguez
A thesis submitted to the Graduate Faculty of Auburn University
in partial fulfillment of the requirements for the Degree of
Master of Science
Auburn, Alabama August 8, 2020
Keywords: Pavement, preservation, RAP, sustainability,
Management
Approved by
Adriana Vargas-Nordcbeck, Assistant Professor of Civil Engineering
Benjamin Bowers, Assistant Professor of Civil Engineering
Fabricio Leiva-Villacorta, Assistant Professor of Civil Engineering

2
ABSTRACT
Cold recycling of asphalt concrete pavements is a widely practiced technique used to
prolong pavement life as a low-cost preservation method. Research in recycled materials has
become necessary to further evaluate the material properties and performance of this
sustainable technology. The National Center for Asphalt Technology (NCAT) has constructed
several test sections as part of its Pavement Preservation Study along Highway US-280 near
Opelika, Alabama. The Highway US-280 preservation sections were built in the summer of
2015, and part of the experiment included four different sections using cold recycled
techniques surfaced with a one-inch thin overlay. These cold recycled (CR) asphalt pavement
included Cold In-place Recycling (CIR) and Cold Central Plant Recycling (CCPR), each one with
asphalt emulsion and foamed asphalt as recycling agents. The functional and structural
performance of the pavement recycling techniques was evaluated periodically. Rutting and IRI
measurements were taken biweekly, deflections were taken quarterly, and crack maps were
generated quarterly to assess the influence of CR pavement sections in the thin overlay
surface.
Field performance measurements showed that the use of cold recycled materials
influenced rut depths, falling into the fair threshold of the MAP-21 rating system during the
first four and a half years of service. Cracking increase was detected in the last year of this
study in the CCPR-emulsion section. Roughness of the section slightly increased over time in
most of the sections.

3
FWD backcalculated modulus indicated the cold recycled sections have temperature-
dependent behavior, with less temperature susceptibility in the CCPR foamed section. The
obtained results were used to evaluate the structural contribution of the recycling
technologies from a pavement design perspective. Based on empirical pavement design, it
was determined that the recommended structural layer coefficients of the recycled materials
ranged between 0.23 and 0.35.

4
ACKNOWLEDGMENTS
The author would like to recognize the author’s advisor professor, Dr. Adriana Vargas,
for providing him advice, mentorship, and continuous support during his master’s program.
Also, giving the author the opportunity to pursue a master’s degree. The author’s committee,
Dr. Benjamin Bowers, and Dr. Fabricio Leiva, for their time in contributing and reviewing the
thesis, and for all their helpful observations. The author also thanks to the National Center for
Asphalt Technology staff and his fellow graduate students.
Moreover, the author would like to express gratitude to his parents, Mrs. Maria Rodriguez,
and Mr. Daniel Martinez, for their love and guidance. They provided the author with the
means to achieve a dream they could not live for themselves — also, the author’s family and
friends in Peru for all their support and advice.
Finally, the author would like to be grateful to his friends in Auburn for all the encouragement
to persevere through the program.

5
TABLE OF CONTENTS
ABSTRACT .................................................................................................................... 2
ACKNOWLEDGMENTS .................................................................................................. 4
LIST OF TABLES ............................................................................................................. 7
LIST OF FIGURES ........................................................................................................... 9
LIST OF ABBREVIATIONS ............................................................................................ 12
CHAPTER 1: INTRODUCTION ...................................................................................... 14
1.1. BACKGROUND .................................................................................................... 14
1.2. OBJECTIVES ........................................................................................................ 18
1.3. SCOPE ................................................................................................................. 18
1.4. ORGANIZATION OF THESIS ................................................................................. 19
CHAPTER 2: LITERATURE REVIEW .............................................................................. 21
2.1. COLD RECYCLING MIX DESIGN ........................................................................... 24
2.2. COLD RECYCLING CONSTRUCTION ..................................................................... 35
2.3. COLD RECYCLING PERFORMANCE ...................................................................... 39
2.4. STRUCTURAL PAVEMENT DESIGN ...................................................................... 43
2.5. SUMMARY .......................................................................................................... 47
CHAPTER 3: METHODOLOGY ..................................................................................... 49
3.1. PRESERVATION GROUP STUDY ........................................................................... 50
3.2. TEST SECTIONS ................................................................................................... 51
3.3. DATA COLLECTION ............................................................................................. 64
3.4. STRUCTURAL CAPACITY ...................................................................................... 71
3.5. SUMMARY .......................................................................................................... 78
CHAPTER 4: RESULTS .................................................................................................. 80

6
4.1. INTRODUCTION .................................................................................................. 80
4.2. STRUCTURAL CAPACITY ...................................................................................... 80
4.3. FUNCTIONAL PERFORMANCE........................................................................... 103
4.4. SUMMARY ........................................................................................................ 120
CHAPTER 5: CONCLUSIONS AND RECOMMENDATIONS ............................................122
5.1. CONCLUSIONS .................................................................................................. 122
5.2. RECOMMENDATIONS ....................................................................................... 125

7
LIST OF TABLES
Table 1. Pavement Preservation Guidelines (Geiger 2005) ........................................ 21
Table 2. Comparison between recycling agents (Wirtgen Group 2012) .................... 32
Table 3 Recommended mix design requirements for Emulsion Mix ......................... 34
Table 4. Recommended mix design requirements for Foamed Mix (ARRA 2017) ...... 35
Table 5. Structural coefficients for recycled materials ............................................... 48
Table 6. Test Locations Summary ............................................................................... 50
Table 7. Average layer thicknesses of cold recycled sections ..................................... 52
Table 8. Summary of Cold recycled mix designs......................................................... 57
Table 9. Condition thresholds for MAP-21 Performance Measures ........................... 66
Table 10. Geophone offsets ....................................................................................... 69
Table 11. Layer thickness per random location-Sections 40 and 41 ........................... 71
Table 12. Layer thickness per random location-Sections 43 and 44 ........................... 71
Table 13. Depth to a shallow layer ............................................................................. 85
Table 14. Temperature trendline of the recycled sections ........................................ 90
Table 15. Time trendline of the recycled sections ..................................................... 91
Table 16. Confidence Interval .................................................................................... 94
Table 17. Composite Asphalt modulus ....................................................................... 94
Table 18. Recycled structural coefficient ................................................................... 95
Table 19 Factor information....................................................................................... 98
Table 20. Analysis of Variance .................................................................................... 98

8
Table 21. ANOVA in sections 40, 43 and 44 ..............................................................101
Table 22. Tukey test of the recycled sections ...........................................................101
Table 23. Tukey test for difference of means ............................................................102
Table 24. Recommended structural coefficients .......................................................103
Table 25. Functional performance summary ............................................................104
Table 26. ANOVA analysis post-construction ............................................................105
Table 27. ANOVA analysis for the last date ...............................................................105
Table 28. First date rutting Tukey test ......................................................................107
Table 29. Trendline of IRI variation over time ...........................................................112
Table 30. IRI variation Pair T-test ..............................................................................115
Table 31. Overall condition of the Recycled Sections ................................................118

9
LIST OF FIGURES
Figure 1. Manufacture of asphalt emulsion (Wirtgen Group 2012) ........................... 28
Figure 2. Aggregate and asphalt emulsion bond (Asphalt Academy 2009) ................ 29
Figure 3. Foamed asphalt process (Wirtgen Group 2012) .......................................... 30
Figure 4. Aggregate and foam asphalt bond (Asphalt Academy 2009)....................... 31
Figure 5. Diagram of a CIR train (Stroup-Gardiner 2011) ........................................... 37
Figure 6. Cold Central Plant Recycling ........................................................................ 38
Figure 7. Location and Overview of Highway US-280 ................................................. 51
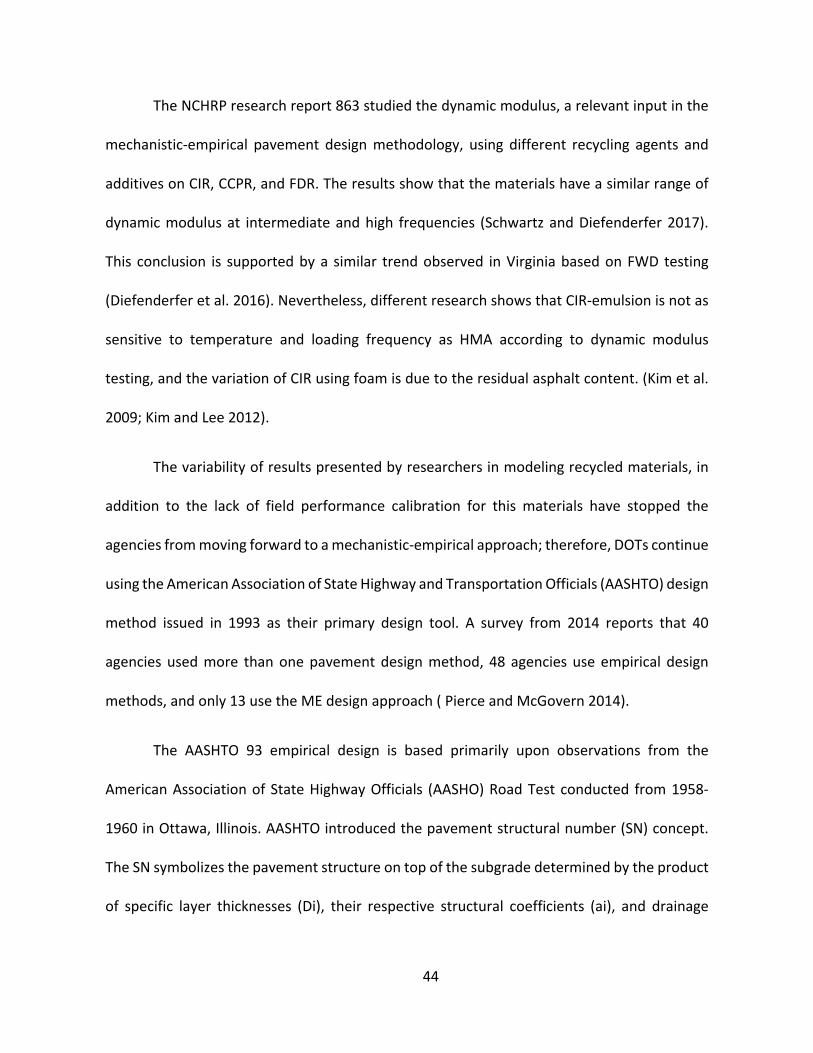
Figure 8. Average layer thicknesses of Cold Central Plant Recycled sections ............. 53
Figure 9. Average layer thicknesses of Cold In-Place Recycling sections .................... 53
Figure 10. Gradation of the aggregates from the cold recycled mixtures .................. 57
Figure 11. Milling of the CCPR sections ...................................................................... 59
Figure 12. Production of CCPR at NCAT test track ...................................................... 60
Figure 13. Paving of the CCPR foam section ............................................................... 61
Figure 14. Tack coat application for both sections ..................................................... 61
Figure 15. Pre-milling of the CIR sections ................................................................... 62
Figure 16. Recycled material loaded into the paver ................................................... 63
Figure 17. Compaction of the thin overlay ................................................................. 64
Figure 18. Automated Road Analyzing Vehicle .......................................................... 66
Figure 19. Random location of test section 43 (Google Earth 2019) .......................... 67
Figure 20. FWD testing on Highway US-280 ............................................................... 68

10
Figure 21. GPR calibration .......................................................................................... 70
Figure 22. GPR profile ................................................................................................ 70
Figure 23.Flowchart of the structural analysis process .............................................. 73
Figure 24. Deflection basin fit options on ELMOD 6 ................................................... 75
Figure 25. Deflections measured at the first geophone (D0) ...................................... 81
Figure 26. Deflections (D0) on random locations of section 40 .................................. 82
Figure 27. Recycled sections surface moduli .............................................................. 84
Figure 28. Prediction of depth to bedrock ................................................................. 85
Figure 29. Depth to unknown layer at each random location .................................... 86
Figure 30. Section 40 GPR Layer Thickness ................................................................ 87
Figure 31. Temperature effect in Foamed CCPR section ............................................ 88
Figure 32. Temperature effect in Emulsified CCPR section ........................................ 89
Figure 33. Temperature effect in Emulsified CIR section ........................................... 89
Figure 34. Temperature effect in Foamed CIR section ............................................... 90
Figure 35. Time effect on the Foamed CCPR section .................................................. 91
Figure 36. Time effect on the Emulsified CCPR section .............................................. 92
Figure 37. Time effect on the Emulsified CIR section ................................................. 92
Figure 38. Time effect on the Foamed CIR section ..................................................... 93
Figure 39. Boxplot of recycled structural layer coefficient ......................................... 95
Figure 40. Time effect on Section 40-layer coefficient ............................................... 96
Figure 41. Time effect on Section 41-layer coefficient ............................................... 97
Figure 42. Time effect on Section 43-layer coefficient ............................................... 97

11
Figure 43. Time effect on Section 44-layer coefficient ............................................... 98
Figure 44. Main effects plot ....................................................................................... 99
Figure 45. Interaction Plot ........................................................................................100
Figure 46. Differences of structural coefficient means .............................................102
Figure 48. Rut performance of the recycled sections ................................................106
Figure 48. Mean rut depths of the recycled sections ................................................108
Figure 49. Thin overlay on foamed CCPR rut depth ..................................................109
Figure 50. Thin overlay on emulsion CCPR rut depth ...............................................110
Figure 51. Thin overlay on emulsion CIR rut depth ...................................................110
Figure 52. Thin overlay on foamed CIR rut depth .....................................................111
Figure 53. CCPR Foamed section roughness .............................................................112
Figure 54. CCPR Emulsified section roughness ..........................................................113
Figure 55. CIR Emulsified section roughness .............................................................114
Figure 56. CIR Foamed section roughness ................................................................114
Figure 57. Roughness variation from post-construction to last date ........................115
Figure 59 Cracking of the recycled sections. .............................................................117
Figure 59. Section 40 picture ....................................................................................118
Figure 60. Section 41 picture ....................................................................................119
Figure 61. Section 42 picture ....................................................................................119
Figure 62. Section 44 picture ....................................................................................120

12
LIST OF ABBREVIATIONS
DOT Department of Transportation
US United States
NCHRP National Cooperative Highway Research Program
FHWA Federal Highway Administration
TRIP National Transportation Research Nonprofit
RAP Reclaimed Asphalt Pavement
NAPA National Asphalt Pavement Association
ARRA Asphalt Recycling and Reclamation Association
HR Hot Recycling
HIR Hot In-place Recycling
CR Cold Recycling
CIR Cold In-place Recycling
CCPR Cold Central Plant Recycling
AC Asphalt Concrete
SGC Superpave Gyratory Compactor
ITS Indirect Tensile Strength
OMC Optimum Moisture Content
ER Expansion Ratio
HL Half-Life
ITS Indirect Tensile Strength

13
TSR Tensile Strength Ratio
PMS Pavement Management System
NCHRP National Cooperative Highway Research Program

14
CHAPTER 1: INTRODUCTION
1.1. BACKGROUND
The National System of Interstate and Defense Highways, now known as the interstate
highway system, was established in 1956 by President Eisenhower, who signed the Federal-
Aid Highway Act law. This Act proclaims that the federal government would pay for 90 percent
of the cost of construction of Interstate Highways. The system had the goal to serve auto,
truck, and strategic military needs. These paved roads were designed based primarily upon
experience to meet relatively low traffic levels for design periods of 20 to 40 years. Since that
time, heavy traffic volumes increased due to population growth and economic development,
which conclude that many of these pavement structures have exceeded their original design
life (National Research Council 2005).
During the expansion of the roadway network, the initial cost was the most important
factor for construction decisions. Long-term cost analysis for maintenance and rehabilitation
were not relevant for decision-making. As a result, nowadays, America’s roads are often
crowded, frequently in poor condition, and underfunded. According to TRIP (National
Transportation Research Nonprofit), 21% of the nation’s highways had poor pavement
condition, and roads had a significant backlog of $420 billion in repairing existing highways in
2015. Owner agencies faced the reality of having insufficient funds to repair and maintain their
pavement networks (American Society of Civil Engineers 2017).
As a response to this issue, pavement preservation was introduced to make better use
of available funding. The concept of pavement preservation is to prioritize keeping reliable

15
roads in good condition while spending minimum resources on roads in poor condition.
Pavement preservation includes preventive maintenance, minor rehabilitation, and some
routine maintenance activities that, when applied at the right time, can restore the function
of the existing system and extend its service life (Asphalt Recycling & Reclaiming Association
2015).
The funds typically available for maintenance and rehabilitation have been below the
minimum required to improve or at least maintain the overall condition of the pavement
network. The primary funding source of highways is the federal motor fuel tax of 18.4 cents
per gallon for gasoline, which has not increased since 1993. This factor, added to inflation over
the years, has resulted in a search for new materials and technology methods to maintain the
road network by effective resource management. Sustainable pavements have risen as an
answer to this issue.
A sustainable pavement is a safe, efficient, and environmentally friendly road structure
capable of meeting the needs of present road users without jeopardizing future generations
(Chappat and Bilal 2003). The asphalt industry has been developing improved technologies
and construction methods to minimize environmental impacts, maximize economic profits,
and meet societal goals. This approach is called the triple-bottom line sustainable method
(Asphalt Paving Association of Iowa 2008). The use of Reclaimed Asphalt Pavement (RAP) for
recycling pavement techniques is an innovative technology in the asphalt industry.
The asphalt binder is the most expensive and economically variable material in an
asphalt mixture. During the Arab oil embargo, the cost of crude oil rose, which, combined with

16
savings through material replacement, generated an increase of RAP popularity in the 1970s.
The Federal Highway Administration (FHWA) supplied partial funding to state agencies to build
paving projects using RAP and to document the results. Therefore, guidelines for pavement
recycling were generated during the late 1970s, 1980s, and 1990s (Copeland 2011).
According to the National Asphalt Pavement Association (NAPA) survey in 2018,
asphalt pavement is the most common source of recycled material in North America. The
survey data reports more than 82.2 million tons of RAP. Producers stated that the use of 98%
of RAP is for new construction, pavement preservation, and rehabilitation. Also, 6.4 million
tons of RAP were used as aggregate. At year-end 2018, some 110.3 million tons of RAP was
estimated to be stockpiled for future use across the country. Asphalt recycling and reclaiming
strategies allow agencies to achieve savings in energy consumption, reduce greenhouse gas
emissions, and to use less non-renewable natural resources (Williams and Willis 2019).
Even though many recycling techniques are continuously developed in the industry,
the Asphalt Recycling and Reclamation Association (ARRA) states that asphalt recycling and
reclaiming methods can be categorized in five overall groups for practical purposes: (1) Hot
Recycling, (2) Cold Recycling, (3) Full-Depth Reclamation, (4) Hot In-place Recycling, and (5)
Cold Planing. Besides Hot Recycling, the remaining four categories have some sub-categories
which further describe pavement recycling depending on the specific method or process used
to obtain the recycled material. It is also is common to combine the use of different techniques
in the same project (Asphalt Recycling & Reclaiming Association 2015).

17
ARRA defines Hot Recycling (HR) as the process of combining RAP with new or “virgin”
aggregates, new asphalt binder, and recycling agents in a central plant to produce a recycled
asphalt mixture. Also, Hot in-place Recycling (HIR) is defined as the process of reclaiming the
existing asphalt pavement structure on-site, by a heating and softening process that allows
scarifying or loosening the existing pavement, which is then thoroughly mixed. The use of RAP
has been mostly applied to HR and HIR because of the lack of guidance on RAP use and
documented information about the successful long-term performance of cold recycled mixes.
Nevertheless, as asphalt binder costs continuously increase, and more emphasis is given to
sustainable technologies, the asphalt community is reassessing the use of RAP in Cold
Recycling (Vargas-Nordcbeck and Timm 2013).
Cold Recycling (CR) consists of recovering and reusing the existing asphalt pavement
layers without the application of heat (Wirtgen Group 2012). This technique is divided into
two subcategories: Cold In-place Recycling (CIR) and Cold Central Plant Recycling (CCPR). The
two most commonly used recycling agents in cold recycled mixes are foamed asphalt and
emulsified asphalt. Cold Recycling of asphalt concrete pavements is a practice that has been
performed to prolong pavement life as a low-cost preservation method. Also, cold asphalt
recycling falls into the three-bottom line approach of sustainability. CR is one way of increasing
the effectiveness of existing budgets to maintain, preserve, rehabilitate and reconstruct more
miles of roadway for each dollar spent, optimize the use of natural resources, reduce impacts
on the greenhouse effect, improve health, and save money to taxpayers.

18
Cold Recycling techniques have become more prevalent by many highway agencies
(Diefenderfer and Apeagyei 2014), which have gained experience by employing cold recycled
mixes as a base layer in their roads as a part of a pavement rehabilitation program using thick
hot mix asphalt (HMA) in the top layers. As no extensive studies have been performed on Cold
Recycling as a pavement preservation approach, this research focuses on the structural and
functional performance of cold recycled sections using a thin hot mix asphalt overlay as a
surface layer.
1.2. OBJECTIVES
Given the need to better comprehend and model performance of cold recycled
materials in pavement preservation, the general objective in the thesis is:
1. Evaluate the structural and functional performance of cold recycled asphalt pavement
as a pavement preservation technique.
Additionally, other objectives of the research include:
2. Determine the structural contribution of CCPR and CIR; and
3. Compare the performance of the two recycling techniques- Cold In-place Recycling
(CIR) and Cold Central Plant Recycling (CCPR), using foam and emulsion as a recycling
agent.
1.3. SCOPE
To accomplish these objectives, four test sections were built along Highway US-280 in
Opelika, Alabama, in September 2015. A total of four recycled sections were placed, including

19
cold central-plant recycling with emulsified and foamed asphalt binders (i.e., CCPR-E and
CCPR-F), and cold in-place recycling with emulsified and foamed asphalt binders (i.e., CIR-E
and CIR-F), both technologies include an active filler. All the sections have 100% RAP, and a
thin 1-inch overlay was placed as a surface layer.
Falling weight deflectometer (FWD) testing was performed to quantify the seasonal
behavior of the pavement layer moduli. Roughness, cracking, and rutting was measured and
analyzed throughout the experiment to determine if the recycling techniques and materials
affect the functional and structural performance. Moduli backcalculation was estimated using
the software ELMOD 6.
The data and observations presented in this study are part of the National Center for
Asphalt Technology (NCAT) Pavement Preservation Group (PG) Study. This research effort is
funded by multiple State Departments of Transportation (DOTs), the Federal Highway
Administration (FHWA), and the Foundation for Pavement Preservation (FP2 Inc.) and aims at
determining the life-extending benefit of various pavement preservation treatments under
varying conditions.
1.4. ORGANIZATION OF THESIS
This thesis is structured into five chapters:
• Chapter 2. A literature review that focuses on the concept of Cold Recycling and the
importance it has nowadays, a brief description of the different mix design methods, the

20
different recycling agents, construction practices, performance of previous cold recycled
mix projects, and past research related to assessing the structural behavior of cold
recycled mixes.
• Chapter 3. Summarizes the methodology, which describes the experimental plan of the
investigation, the Preservation Group (PG) study, the test location and its features, the
four different mix designs, the construction process of the recycling mixes, data collection,
and performance evaluation of the sections.
• Chapter 4 includes a summary of results from the structural and functional performance
of the four test sections with a discussion of main findings, as well as an analysis of the
structural characteristics of the recycled materials based on the results obtained from
backcalculation, and its use for pavement design methods.
• Chapter 5 provides the main conclusion of the thesis and some recommendations for
future research on cold recycled mixes.

21
CHAPTER 2: LITERATURE REVIEW
The Federal Highway Administration (FHWA) issued a “Memorandum on Pavement
preservation Definitions” to provide clarification and consistency in the interpretation and
evaluation of pavement preservation programs. According to FHWA, pavement preservation
consists of “work that is planned and performed to improve or sustain the condition of the
transportation facility in a state of good repair. Preservation activities generally do not add
capacity or structural value, but do restore the overall condition of the transportation facility.”
(Waidelich 2016). Pavement preservation can include routine maintenance, preventive
maintenance, and minor rehabilitation strategies, as shown in table 1.
Table 1. Pavement Preservation Guidelines (Geiger 2005)
Maintenance & Rehabilitation
Category
Type of Activity Increase Capacity
Increase Strength
Reduce Aging
Restore Serviceability
Construction
New Construction X X X X Reconstruction X X X X
Rehabilitation
Major (Heavy) Rehabilitation X X X Structural Overlay X X X
Pavement Preservation
Minor (Light) Rehabilitation X X
Maintenance
Preventive Maintenance X X Routine Maintenance X
Corrective (Reactive) Maintenance X
Catastrophic Maintenance X
Preventive maintenance consists of any activity that is intended to preserve or extend
the service life of pavement until a significant rehabilitation or complete reconstruction is
required. As the pavement condition deteriorates, there comes the point when maintenance
activities are no longer cost-effective, and rehabilitation is needed. Rehabilitation techniques

22
are more expensive than maintenance activities, but the rehabilitated pavement condition
will generally be equivalent to what was achieved during the initial construction. Activities
that improve or restore the structural capacity of a pavement by adding or recycling the top
layers of the pavement structure can be divided into major (Heavy), structural overlay, and
minor (Light).
Preservation treatments are usually less expensive than other strategies, and when applied at
the right time, they can prolong the performance life of the pavement resulting in the highest
return on investment. Owner agencies that have a pavement management plan usually
allocate funds to pavement preservation instead of only rehabilitation projects (Asphalt
Recycling & Reclaiming Association 2015). The asphalt recycling and reclaiming strategies may
include:
• Cold Planing or milling, where distinctive design equipment removes an existing
asphalt pavement to the desired depth, longitudinal profile, and cross-slope. This
technique can be used to restore friction, reduce roughness, or to eliminate the
oxidized and distresses surface of an existing pavement.
• Cold Recycling, which is the reuse of the existing pavement after milling to a depth as
thin as 2 inches and up to 5 inches, sizing and mixing the material with a bituminous
recycling agent, and then placing and compacting the recycled mixture.
• Hot In-Place Recycling, which includes the process of heating, softening and loosening
the existing asphalt pavement followed by mixing, typically with a rejuvenating agent,

23
and then placing and compacting. This method corrects oxidation, minor cracking, and
other defects in the upper layer of the pavement.
• Full Depth Reclamation, a rehabilitation technique that pulverizes the entire thickness
of the asphalt pavement and a defined portion of the underlying materials. A stabilizing
agent that can be mechanical, bituminous, or chemical is added if required. The
reclaimed sections are blended to provide an improved road base; an asphalt overlay
is usually placed as the surface course.
This literature review focuses on Cold Recycling as a pavement preservation approach. This
method consists of recycling asphalt pavement without the application of heat during the
recycling process. When an asphalt overlay is applied on top of the recycled mixture, the
activity is considered a minor rehabilitation (Asphalt Recycling & Reclaiming Association
2015). Asphalt recycling has several unique advantages over the traditional asphalt concrete
(AC) overlay rehabilitation methods, which include:
• Reuse and conservation of non-renewable natural resources.
• Preservation of existing roadway geometry and clearances.
• Corrections to pavement profile and cross-slope.
• Improved pavement smoothness.
• Improved pavement physical properties by modification of existing aggregate
gradation, and asphalt binder properties.
• Mitigation or elimination of non-load associated cracking.

24
2.1. COLD RECYCLING MIX DESIGN
Most State Highway Agencies do not have developed their own CR specifications. The
practices range from simple empirical formulas to more sophisticated techniques with
performance-based testing. The most straightforward practices are based on the amount and
consistency of the recovered asphalt binder to predict an initial recycling additive content. The
sophisticated methods include testing such as resilient modulus, stability, and moisture
sensitivity tests. Testing often includes short-term and long-term curing conditions (Eller and
Olson 2009; Kim et al. 2007; Muthen 1999).
The ultimate objective of mix design is to identify the most effective proportion of
materials and achieve optimal pavement performance. Cold Recycling mix design procedures
are based on different compaction methods; in general, the most popular are Marshall
compaction and the Superpave Gyratory Compactor (SGC) (Gao et al. 2014; Liu et al. 2012;
Scholz et al. 1990). The mixture tests also include a combination of Marshall stability and
indirect tensile strength (ITS) under wet vs. dry conditions. The methods shown in this chapter
are based on the manuals from the American Reclaiming and Recycling Association, Wirtgen,
and the Asphalt Academy (Asphalt Academy 2009; Asphalt Recycling & Reclaiming Association
2015; Wirtgen Group 2012). The two targets to be determined from any type of mix design
are the optimum moisture content (OMC) to achieve the maximum compacted density, and
the second target is the optimum recycling agent content to fulfill the minimum strength
criteria. The standard procedure of the mix design includes the following steps:

25
2.1.1. Sampling and RAP properties evaluation
The mix design procedure requires optimization not only in terms of volumetric and
compaction characteristics but also involves the consideration of the physical properties of
the RAP along the length, width, and depth of the road. It is thus essential that the material
samples used during the mix design be representative of the materials in the asphalt layer
recycled with a bituminous agent. When roadway sampling is required, sections with
significant differences in materials should be treated as different sampling units (ARRA 2017).
There is a misconception that samples from RAP stockpiles are highly variable, so 100%
of RAP content mixes will lead to more variability in the recycled mixture (West 2015).
Nevertheless, Nady states that well-managed RAP stockpiles have a more consistent gradation
than virgin aggregates (Nady 1997), and it was confirmed with data gathered by NCAT that
RAP processed from different sources can also be just as stable in gradation and asphalt
content as millings (West 2009). The most accurate way to sample existing RAP stockpiles is
with the assistance of a front-end loader, as described in Section 5 of AASHTO R90 Standard
Practice for Sampling Aggregate Products.
RAP is typically stored in one unfractionated stockpile, or two different stockpiles with
an only coarse or fine fraction. In a research project in Minnesota, Eller and Olson (2009)
suggested separating RAP into three different fractions and blend before mix design to reduce
variability and segregation of the aggregates.
The tests needed from RAP for cold recycled mix design are asphalt binder content of
the RAP, black-rock gradation, percent of fines (passing #200 sieve), flat, and elongate ratio,

26
and the optimum water content. The University of Nevada Reno partnered with NCAT to
evaluate several options for testing RAP properties (Hajj et al. 2012), three methods were used
to determine asphalt contents and recover the aggregates for aggregate property tests: the
ignition method, the centrifuge extraction method, and the reflux extraction method. The
study results indicated that the ignition method yielded the most accurate asphalt contents
for the RAP and provided the lowest testing variability compared to solvent extraction
methods.
Different design manuals have distinct gradation test methods. The gradation test method for
RAP/aggregate suggested by Wirtgen follows the ASTM D422 Standard Test Method for
Particle-Size Analysis of Soils with minor change (Wirtgen Group 2012). ARRA suggests ASTM
C136 Standard Test Method for Sieve Analysis of Fine and Coarse Aggregates and ASTM C117
Standard Test Method for Materials Finer than No. 200 Sieve in Mineral Aggregates by
Washing to perform sieve analysis (ARRA 2016, 2017), and the gradation band recommended
by Asphalt Academy follow South African National Roads Agency specifications (Asphalt
Academy 2009).
Wirtgen suggests running a moisture/density relationship in the RAP. Different water contents
are needed to calculate the optimum moisture content; this process allows a high density level
to be achieved when the recycled material is compacted (Wirtgen Group 2012).

27
2.1.2. Recycling Agent
The two types of bitumen used as recycling agents in cold recycled mixes are foamed
asphalt and emulsified asphalt. They are mixed with RAP at ambient temperature, and their
stabilizing mechanism is different.
2.1.2.1. Emulsified Asphalt
An emulsion is a dispersion of small droplets of one liquid in another liquid. Asphalt
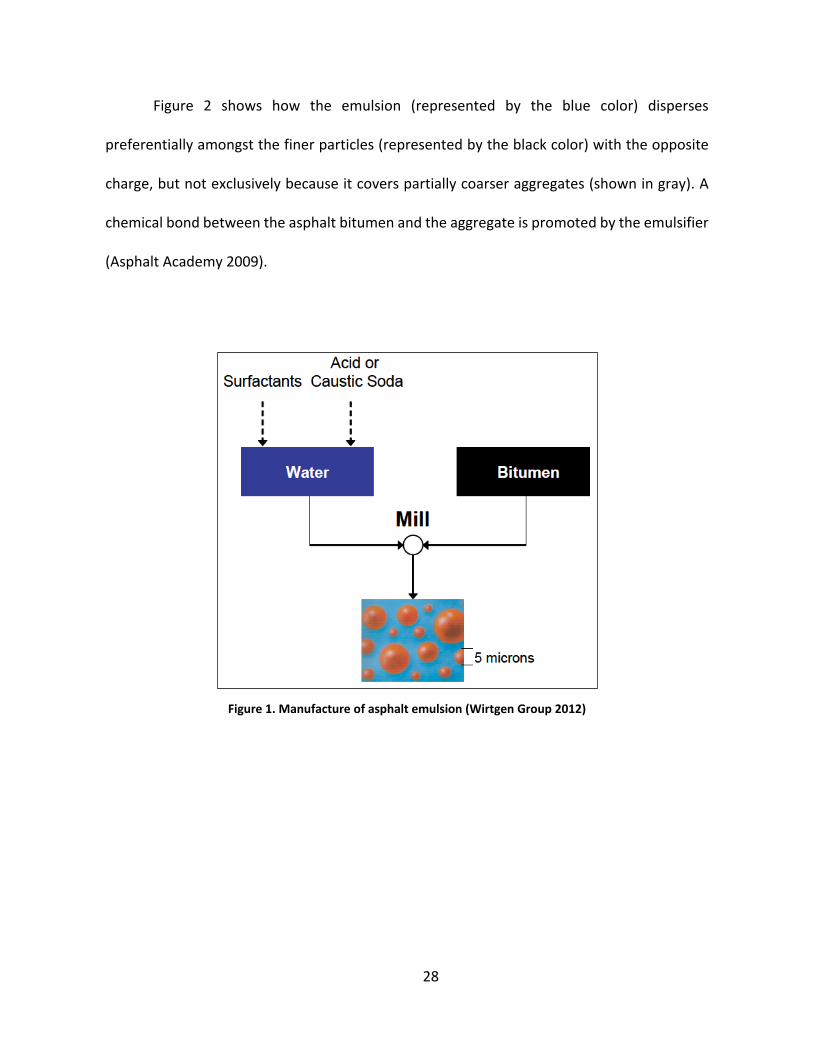
emulsion is the dispersion of asphalt binder in water by an emulsifying agent. Figure 1 shows
the manufacturing process of emulsion, where soap, water solution, and asphalt binder are
blended by a colloid mill that shears the binder into microscopic particles. Asphalt emulsion
can be classified according to the sign of the charge on the droplets as cationic (positive
charge) or anionic (negative charge). Also, emulsions are categorized by the time to react with
the aggregate; they can be rapid-setting (RS), medium-setting (MS), and slow-setting (SS).
Emulsions are named according to ASTM D977 Standard Specification for Emulsified Asphalt
and D2397 Standard Specification for Cationic Emulsified Asphalt and followed by numbers
and text indicating the emulsion viscosity and residue properties, for example, a cationic RS
of high viscosity and hard residual asphalt is denoted by the code CRS-2H (James 2016).
Emulsion “break” is a term used to describe the separation of the asphalt binder from
the water after a set period following contact with the RAP mixture. The emulsion works as a
lubricating agent, and after the break, the residual asphalt keeps the original properties of the
virgin binder. The emulsion binder has the characteristics of coating the mixture with a thin
film and bring initial strength to the RAP (Salomon 2016).
28
Figure 2 shows how the emulsion (represented by the blue color) disperses
preferentially amongst the finer particles (represented by the black color) with the opposite
charge, but not exclusively because it covers partially coarser aggregates (shown in gray). A
chemical bond between the asphalt bitumen and the aggregate is promoted by the emulsifier
(Asphalt Academy 2009).
Figure 1. Manufacture of asphalt emulsion (Wirtgen Group 2012)

29
Figure 2. Aggregate and asphalt emulsion bond (Asphalt Academy 2009)
According to Gao et al. (2014), slow-setting asphalt emulsions are more compatible
with the RAP materials and have long workability time to make good dispersion in the mix.
Ameri and Behnood (2012) studied the effects of steel slag on the properties of cold recycled
mixtures; the results showed that the anionic bitumen emulsion enhanced the compatibility
with marginal materials effectively. The Nevada Department of Transportation has usually
used CMS-2 for CR projects (Sanjeevan et al. 2014). Then, different types of emulsions can
change for different states and regions, so it is essential to determine which type of emulsion
will perform best for a particular application.
2.1.2.2. Foamed Asphalt
Foamed asphalt was initially developed by Csanyi in 1957 for full-depth reclamation to
reduce the viscosity of asphalt binder to be able to mix with the reclaimed material (Csanyi
1957). Nowadays, the process consists of injecting a small amount of water into hot asphalt
as it is combined with the recycled materials (Figure 3). When the hot binder and water blend,

30
the asphalt expands as the water turns to steam, creating a thin asphalt film of about ten times
more coating potential (Stroup-Gardiner 2011).
In Figure 4, the foamed asphalt content (represented by the blue color) is usually too
low to coat all of the aggregate particles thoroughly, it distributes exclusively to the finer
particles, producing “spot welds” of a mastic of bitumen droplets and the fines (represented
by the black color), therefore the fines particles and passing #200 have significant role to form
foam dispersion. The coarse RAP particles work as a structural skeleton (represented by the
gray color). Another factor to consider for asphalt foam dispersion is the RAP moisture content
before mixing (Schwartz and Khosravifar 2013).
Figure 3. Foamed asphalt process (Wirtgen Group 2012)

31
Foamed asphalt is produced in a specialized device that can heat binder to a specific
temperature and pressurize the binder, air, and water at the desired pressure. The foaming
process causes an expansion of asphalt binder, reducing surface tension and viscosity. The two
key parameters to evaluate foaming are the expansion ratio (ER), and half-life (HL).
Figure 4. Aggregate and foam asphalt bond (Asphalt Academy 2009)
These characteristics are used to determine the required binder temperature and
foaming water content to achieve adequate foaming. The expansion ratio is described as the
ratio between the maximum volume of the foam relative to the original amount of asphalt.
The HL is the time duration for the foamed binder to collapse into half of its maximum capacity
(Asphalt Academy 2009; Wirtgen Group 2012).
More significant expansions and longer half-life can provide a better dispersion for the
granular materials (David Newcomb et al. 2015). The quality of the foamed asphalt mix is
deeply related to the quality of the foam, which is measured by the expansion ratio and the

32
half-life, and 100% RAP mixes can be prepared with lower percentages of fines (Marquis et al.
2002). A summary of the main differences between the recycling agents is shown in Table 2.
Table 2. Comparison between recycling agents (Wirtgen Group 2012)
Factor Recycling agent Emulsion Foamed
Asphalt mixing Temperature 20°C to 70°C 160°C to 180°C
(Before foaming)
Aggregate temperature during mixing
Ambient (>10°C)
Ambient (>15°C)
Moisture content during mixing
OMC plus 1% minus emulsion addition 70% to 90% of OMC
Aggregate coating Coating of finer particles (some coarse particles).
Coating of finest particles only. Increased cohesion from the bitumen/fines mortar
Construction and compaction temperature
Ambient (>5°C)
Ambient (>10°C)
Air Voids 10% to 15% 10% to 15% Rate of initial strength gain Slow (moisture loss) Medium (moisture
loss) Modification of bitumen Yes No
Important bitumen parameters
*Emulsion type *Residual bitumen *Breaking time
*Expansion ratio *Half-life
2.1.3. Active Filler
The term for the filler that chemically modified the mix properties is called active filler.
They can be cement, hydrated lime, fly ash and other. They work improving adhesion
between the RAP and emulsion, improving dispersion in foam recycling mix by
increasing the number of fines, increase stiffness and accelerated curing of the cold
recycling mix. Commonly, the maximum amount of cement is 1%.

33
2.1.4. Mixing and Compacting
The batch of the materials depends on the amount needed by the design methodology,
before mixing the RAP has to be set to mixing temperature, generally at room temperature.
The temperature of the emulsion is the one recommended by manufacturer specifications.
Mixing of test specimens can be done manually, with a mechanical bucket mixer, or with a
laboratory size pugmill. Moisture added to the mix is typically 1.5 to 3.0% (ARRA 2016). The
RAP is compacted at different emulsion contents to estimate the optimum emulsion content.
Specimens for Marshall testing shall be compacted to 4 inches (100 mm) in diameter,
using either 75 blows per side by a Marshall hammer or with 30 gyrations using a Superpave
gyratory compactor (SGC) at 1.25° angle, 87 psi stress. Thirty gyrations are broadly accepted
in many states, including California, Illinois, Iowa, Kansas, and many others except for Texas,
which specifies 35 gyrations. Lee and Kim (2003) selected a compaction effort of 25 gyrations
as the gyration level that would achieve a similar density as the one with a 75-blow Marshall
hammer.
Foamed asphalt has to be set to the temperature defined previously during ER and HL test. A
proper mixing time between 20 and 60 seconds for foamed mixes is suggested (Gu et al. 2019).
The Wirtgen manual recommends mixing the materials at a moisture content range from 70
to 90% of the OMC determined by the standard Proctor test (Wirtgen Group 2012). Lee (1981)
recommended using a moisture content equal to 65 to 85 percent of the OMC.
Different methods have been used to compact cold recycled foamed asphalt mixtures for
design. The methods include the modified proctor test method, Marshall hammer compaction

34
of 75 blows that is popular in Maryland (Schwartz and Khosravifar 2013), gyratory compaction
method generally at 30 gyrations and others. According to Kim et al. (2007), using a gyratory
compactor rather than a Marshall hammer produces more consistent mixtures for various
foamed asphalt contents.
2.1.5. Strength and Moisture testing
A total of 6 specimens at each emulsified asphalt content are prepared for Marshall
stability testing, three for dry specimens, and three moisture conditioned specimens. For the
Marshall stability test, the moisture-conditioned samples are soaked in a 25 ± 1°C water bath
for 23 hours, followed by a 1-hour soak in a 40 ± 1°C water bath. The Marshall stability ratio is
calculated by dividing the average conditioned Marshall stability by the average dry Marshall
stability for each emulsified asphalt content (AASHTO 2017a). A required minimum retained
Marshall stability ratio value is typically 0.70. Table 3 shows a summary of the mix design
requirements (ARRA 2016; Wirtgen Group 2012)
Table 3 Recommended mix design requirements for Emulsion Mix (AASHTO 2017b)
Test Method Criteria Property High-Temperature Validation Marshall Stability AASHTO T 245 (ASTM D6927)
Minimum 1,250 lb. (5,560 N) Cured Stability
Retained Marshall Stability based on Moisture Conditioning Minimum 0.70
Resistance to Moisture Induced Damage
Evaluation of Existing Binder Recovery of Binder from RAP AASHTO T 319 (ASTM D5404)
Used for Penetration Testing Recovery of the binder
Penetration of Bituminous Materials AASHTO T 49 (ASTM D5) Report Only
Softness of Existing Binder

35
The Indirect Tensile Strength (ITS) is tested for foamed asphalt mix specimens; this
procedure follows AASHTO T283. Moisture conditioning is conducted on three compacted,
cured specimens at each foamed asphalt recycling agent content, and then samples are
submerged in a 25 ± 1 °C water bath for 24 hours and tested immediately after removal from
the water bath. TSR is a design criterion defined as the average moisture conditioned
specimen strength divided by the average dry specimen strength. Table 4 shows other mix
design criteria according to ARRA guidelines.
Table 4. Recommended mix design requirements for Foamed Mix (ARRA 2017)
Test Method Criteria Property Indirect Tensile Strength AASHTO T 283 (ASTM D4867) Minimum 45 psi (310 KPa) Cured Strength
Tensile Strength Ratio based on Moisture Conditioning AASHTO T 283 (ASTM D4867)
Minimum 0.70 Resistance to Moisture Induced Damage
Evaluation of Existing Binder Recovery of Binder from RAP AASHTO T 319 (ASTM D5404)
Used for Penetration Testing Recovery of the binder
Penetration of Bituminous Materials AASHTO T 49 (ASTM D5) Report Only Softness of Existing Binder
2.2. COLD RECYCLING CONSTRUCTION
2.2.1. Cold In-place Recycling
Cold In-place Recycling (CIR) is a maintenance/rehabilitation process that occurs within
the roadway. This method pulverizes and recycles the top of the asphalt layer using a
continuous train operation then mixes the RAP with a recycling agent and repaved in place.
The thickness is often between 50-125 mm (2-5 inches). CIR uses 100 percent of the reclaimed

36
asphalt produced during the milling process. Also, CIR significantly reduces materials trucking,
natural resources, and lower project costs (Asphalt Recycling & Reclaiming Association 2015;
Cross and West 2018; Gu et al. 2019).
The CIR method has the advantage of being able to repair a variety of pavement
distresses such as potholes, rutting, and cracks, prolonging the service life of asphalt
pavement, and improving ride comfort. Moreover, this process reduces energy consumption,
shortens the construction project period due to high production rates, and relieves
environmental pollution by using a high percentage of the recycled materials (Wirtgen Group
2012; Xiao et al. 2018). Another benefit is that CIR would not result in raising the grade;
therefore, this process can be applied to projects with various entrances, side roads, and
intersections (Lane and Kazmierowski 2005).
CIR requires various recycling agent tankers, cold planing devices, crushing/screening
or sizing units, mixers, pavers, and rollers. A train is defined as the combined equipment
spreads out over a considerable distance. Depending on the project’s scope, the CIR process
can be a single-train, two-unit, or multi-unit CIR train. The most common is a single unit train
that does not contain screening and crushing units; the mixture can be placed by a screed
attached to the individual unit or using an asphalt paver, as shown in Figure 5.
CIR can vary in the process of how RAP is obtained and sized, the recycling agents and
additives employed, and how the mixture is placed (Asphalt Recycling & Reclaiming
Association 2015; Cross and West 2018). Unlike the HIR recycling trains, one or two nurse
trucks are usually in front of the recycling profiler and mixer unit to provide a continuous

37
supply of liquids for the mix (recycling agents, water). The recycling unit mills, processes, and
mixes the recycled materials and then transfers them to a paver. Standard compaction
practices are used to place and compact the mixture (Stroup-Gardiner 2011).
Figure 5. Diagram of a CIR train (Stroup-Gardiner 2011)
2.2.2. Cold Central Plant Recycling
The first step of the CCPR method is milling the existing asphalt section and then
stockpiled the material for later use in the plant. CCPR differs from CIR because the asphalt
recycling process occurs at a mobile or central plant location (Gu et al. 2019). Other
differences of CCPR are that it allows materials from an existing pavement to be selected and
pre-treated (crushing and screening), stockpiled, and tested before mixing, thereby increasing
the level of confidence that can be achieved during placement (Wirtgen Group 2012). On the
other hand, CCPR is similar to the CIR method because it shares some benefits like cost
reduction, environmental protection, and shortening construction periods.
Figure 6 shows the CCPR processes in which the asphalt recycling takes place at a
central location using a stationary cold recycled mix plant and stockpiled RAP materials. CCPR
plants include a belt scale, a computer-controlled recycling agent system, an additive system,

38
and a pugmill for mixing of the final product. CCPR mixtures can be immediately transported
in dump trucks or belly dump trucks to the paving operations or stockpiled for later use (Cross
and West 2018). Nevertheless, storing the CCPR material is not recommended when asphalt
emulsion is used as the primary recycling additive (Asphalt Academy 2009). Placement of the
CCPR mixture on layer thickness ranges from 3 to 6 inches (75 to 150 millimeters) is conducted
with conventional asphalt pavers, but a motor grader could also be used (Asphalt Recycling &
Reclaiming Association 2015).
Figure 6. Cold Central Plant Recycling
The most common recycling agent used in CCPR production is asphalt emulsion. Still,
foamed asphalt with mineral additive has increased in the last years (Wirtgen Group 2012).
The mixing mechanism is different between emulsion and foamed asphalt.
Control of temperature and moisture is relevant to proportioning and blending the
recycled materials accurately. CCPR mixtures require more compaction cycles than hot mix

39
asphalt due to the high internal friction, higher viscosity of the aged binder, and colder
compaction temperatures (Asphalt Recycling & Reclaiming Association 2015).
2.3. COLD RECYCLING PERFORMANCE
The fluctuating economy and the need for high-quality natural aggregates and
petroleum have increased the demand for cost-effective alternatives to virgin paving
materials. Irrespective of the type of recycling agent, there are two recycling construction
method alternatives: Cold central plant recycling (CCPR) and cold in-place recycling (CIR). Over
the years, Cold Recycling of asphalt concrete pavements has become a widely practiced
construction method adopted by different agencies across the United States; they provide
owner agencies with cost-effective and sustainable approaches to restore their aged asphalt
pavements. CIR and CCPR have been shown to speed up project delivery and alleviate
construction traffic congestion, which reduces user costs (Cross and West 2018; Vargas-
Nordcbeck and Rahman 2019). The use of recycling techniques to rehabilitate and maintain
pavement in-situ started in the 1930s, and over the years, agencies gained experience by
research and case studies.
In 1984, the Ohio Department of Transportation studied two low-volume roads to
analyze the long-term performance of cold mix recycling with satisfactory results in one of the
selected sites according to field cores and deflection measurements (Dudley et al. 1987). The
Pennsylvania Department of Transportation by the end of 1985 had paved around 90 CR rural
roads, including CIR and CCPR using emulsion, and a single seal coat was applied as the

40
wearing course with the aims of providing a standard specification for selecting suitable
candidate projects. One of the recommendations was to obtain optimum moisture content of
the RAP so the asphalt emulsion can be adequately dispersed in the mix (Kandhal and Koehler
1987).
Moreover, since 1984 the New Mexico DOT has conducted over 120 CIR projects using
polymer-modified emulsion as a recycling agent, with an asphalt overlay that was applied to
the top of the recycled base. The pavement condition index (PCI) was used to evaluate road
performance (McKeen, Hanson, and Stokes, 1998). The Kansas Department of Transportation
started employing Cold Recycling procedures in 1986 to rehabilitate flexible pavements at a
rate of 80 to 160 km per year, from 1990 to 1992, fly ash was added to four test pavements
towards reducing the potential for moisture damage and wheel path rutting (Cross and Fager
1995). Additionally, in 1997 an experimental partial-depth cold in-place project was initiated
in Kansas on Highway US-283. This CIR project involved two test sections in assessing the
effectiveness of fly ash and the performance of the rehabilitated pavement using asphalt
emulsions technology on a low volume condition. The results showed that the fly ash section
cracked before the emulsion section, and both were not susceptible to rutting (Thomas et al.
2000).
In 1986, Iowa DOT paved its first CIR road. Subsequently, more CIR roads were built
with an HMA overlay. Most of the CIR roads were successful, but others reached failure before
it was expected, research and experience over the years concluded that the main reason for
the failed projects was paving in poor subgrade sections (Kim et al. 2010). Eighteen roads were

41
chosen to evaluate short-term performance between 1997 and 1998. The research
experiment found that CIR roads generally performed well and predicted service life of 18
years (Jahren Charles T. et al. 1999).
Furthermore, 24 test roads were selected in 2010 to evaluate the long-term
performance of CIR sections built between 1986 and 2004. The results support the theory that
the CIR layer acts as a stress-relieving layer where a reduced value of CIR modulus and a higher
amount of air voids indicates better performance (Chen et al. 2010).
The Nevada Department of Transportation started using the CIR technology in 1995 to
rehabilitate roads of low and medium traffic volume; the recycled layer is treated as a
stabilized base course followed by a thin HMA overlay. A mix design procedure based on the
Hveem design method was developed in 2004 and implemented on three field projects, which
showed excellent performance (Sebaaly et al. 2004). A research was published in 2006 about
the success The Nevada Department of Transportation has had for more than 30 years using
a Pavement Management System (PMS) where CIR and FDR procedures were applied for low
and medium-volume roads. During that period, the agency had saved more than $600 M
compared to complete reconstruction costs (Bemanian et al. 2006). Also, NDOT applied CIR
techniques to high volume traffic roads using HMA overlay plus a surface layer which improve
rutting and cracking resistance compared to applying only a surface treatment in low-volume
roads (Sanjeevan et al. 2014)
A rural airport in Florida restored an aging runway first built in the 1950s by applying
cold in-place recycling. The original road had poor drainage, exposure to heat, and heavy use

42
over the years. The project was a partnership between the Florida DOT and the contractor,
the construction was completed in 1997, and after an inspection in 2002, no further
maintenance was needed (Polak 2003). Caltrans applied chip seals on the top of CIR with
foamed asphalt to improve farm roads in inadequate conditions in San Joaquin Valley. This
experiment extended the life of the pavement by ten years (Kuennen 2003).
The use of Class C fly ash in CIR to improve the structural capacity of asphalt pavement
base layers was analyzed in Wisconsin. Nondestructive deflection tests were performed in a
study section to analyze the structural performance; the researchers concluded that using
recycled materials saved hauling costs (Wen et al. 2003). A section of 3.6 miles on the
southbound direction of I-81 in Virginia was rehabilitated using CIR, CCPR, and FDR techniques
in 2011; the objective was to gain experience in Virginia DOT personnel in a cold recycled mix
design and field evaluation. The research project concluded that the combination of the
construction techniques accelerated the time window in that the AC overlay can be paved
after the construction of the CCPR layer (Diefenderfer and Apeagyei 2014).
In Minnesota, two different CIR processes were compared in 2002. One was the
conventional CIR process, and the other one included a sampling protocol, a new mix design
including performance testing of laboratory-prepared samples, and an engineered asphalt
emulsion. The new process exhibited superior performance in terms of raveling, thermal
cracking, and moisture susceptibility (Forsberg et al. 2002). Cox and Howard (2016)
investigated the effects of binder systems (single or multiple component binder systems) on
CIR construction. As a result of the experiment, they created a CIR design framework. Also,

43
The Mississippi DOT evaluated the CIR moisture-density relationship on Highway US-49. The
main research finding is that moisture content had no significant effect on RAP dry density
evaluation (Cox et al. 2015).
The National Center for Asphalt Technology (NCAT) constructed cold central plant
recycled (CCPR) structural sections in its 2012 research cycle. The results from the experiment
show that under accelerated loading condition, the functional and structural performance of
foamed asphalt CCPR with 100% RAP performed similarly to conventional hot asphalt mix
(Timm et al. 2018). Researchers have tested emulsion and foamed recycled mixes under
mechanistic tests to analyze short- and long-term performance at various testing
temperatures and loading conditions in the lab (Birgisson et al. 2004; Brown et al. 2004; Kim
and Lee 2012).
2.4. STRUCTURAL PAVEMENT DESIGN
Pavement design methods have been developed, starting with empirical methods
moving to more mechanistic ones that require computer software to analyze. Pavement
design using cold recycled material has been a challenge to many researchers to model the
material properties of the mix accurately. The lack of quantitative values for the engineering
properties of CIR/CCPR materials that can be used with confidence in pavement structural
design is a significant impediment to the more widespread use of these sustainable strategies.
The Mechanistic-Empirical (ME) pavement design method predicts specific modes of distress
resulting from modeling pavement responses to loadings under various conditions (Timm et
al. 2014).
44
The NCHRP research report 863 studied the dynamic modulus, a relevant input in the
mechanistic-empirical pavement design methodology, using different recycling agents and
additives on CIR, CCPR, and FDR. The results show that the materials have a similar range of
dynamic modulus at intermediate and high frequencies (Schwartz and Diefenderfer 2017).
This conclusion is supported by a similar trend observed in Virginia based on FWD testing
(Diefenderfer et al. 2016). Nevertheless, different research shows that CIR-emulsion is not as
sensitive to temperature and loading frequency as HMA according to dynamic modulus
testing, and the variation of CIR using foam is due to the residual asphalt content. (Kim et al.
2009; Kim and Lee 2012).
The variability of results presented by researchers in modeling recycled materials, in
addition to the lack of field performance calibration for this materials have stopped the
agencies from moving forward to a mechanistic-empirical approach; therefore, DOTs continue
using the American Association of State Highway and Transportation Officials (AASHTO) design
method issued in 1993 as their primary design tool. A survey from 2014 reports that 40
agencies used more than one pavement design method, 48 agencies use empirical design
methods, and only 13 use the ME design approach ( Pierce and McGovern 2014).
The AASHTO 93 empirical design is based primarily upon observations from the
American Association of State Highway Officials (AASHO) Road Test conducted from 1958-
1960 in Ottawa, Illinois. AASHTO introduced the pavement structural number (SN) concept.
The SN symbolizes the pavement structure on top of the subgrade determined by the product
of specific layer thicknesses (Di), their respective structural coefficients (ai), and drainage

45
coefficients (mi). The structural coefficients relate the relative load-carrying capacity of
different materials; also, a direct correlation may be determined between the structural layer
coefficient and the elastic modulus of each layer analyzed (Highway Research Board 1962).
Therefore, the structural capacity for each pavement layer can be represented by an SN as the
product of the layer thickness and the structural coefficient layer and the drainage coefficient.
As mentioned above, the AASHTO design method is the most used design approach by
agencies, mainly for overlay design. This approach is accomplished using falling weight
deflectometer (FWD) testing for layer properties.
The structural layer coefficient has been determined based on their relationship with
the elastic modulus. Research has been done to correlate some recycled material tested in
the laboratory to describe the structural contribution of a specific pavement layer. Some layer
coefficients have been proposed for a limited number of recycled materials, though the
recommended values are mostly based on the results from laboratory testing. Another
method based on the relationship mentioned before is to compute the elastic modulus from
deflection testing on the field (Díaz-Sánchez et al. 2017).
2.4.1. Structural Coefficients
Over the years, research has been conducted to determine the structural layer
coefficients for recycled materials through laboratory testing and backcalculated moduli from
deflections. During the summer of 1981, in Indiana, an experimental section was constructed
to evaluate construction with the foamed technology. Layer coefficients were computed
through deflection data, and the results after one day of construction varied from 0.13-0.30

46
in. −1 (Wijk and Wood 1983). A laboratory study evaluated the behavior of cold-recycled
asphalt paving mixtures by using asphalt emulsion and foamed asphalt as the recycling agents.
Resilient modulus results show a similar performance of the mixes, and layer coefficients
ranged from 0.10 to 0.16 cm−1 (0.25–0.40 in. −1) were computed (Tia and Wood 1983). In
Maryland, a study evaluated foamed asphalt as a base material to explain the distinct
mechanical behavior, and it was compared to a granular base. The recycled foamed base
reported a modulus in the range of 191–343 ksi and a structural layer coefficient of 0.142 cm−1
(0.36 in. −1), however, the granular aggregate base had a resilient modulus in the range of 20-
40 ksi (Khosravifar et al. 2015). These results are significantly low compared to the 449–1000
ksi range for dynamic modulus of a typical HMA at 218°C and a 10 Hz loading frequency (Huang
1993).
Three projects in Maine were selected to determine the structural strength of foamed
asphalt CR layers by conducting FWD tests. From the calculated moduli, the structural
coefficients were between 0.22-0.35 in. −1 (Marquis et al. 2003). The New Mexico State
Highway and Transportation Department started to use CIR as a rehabilitation alternative for
flexible pavements since 1984 and based on performance results, the structural coefficient
determined by the DOT was 0.30 in. −1 (McKeen et al. 1998). The Nevada DOT conducted an
extensive field-testing program that used the FWD to establish a structural coefficient for the
CIR layer, the conclusion assigned a structural coefficient of 0.26 in. −1 (Sebaaly et al. 2004).
Romanoschi et al. (2004) estimated a structural layer coefficient of 0.18 for full-depth
reclamation using foamed asphalt based on the results of full-scale accelerated pavement

47
testing in Kansas. During the 2011 construction season, VDOT rehabilitated an interstate using
CIR and CCPR; this research concluded that CIR and CCPR properties were not statistically
different in terms of resilient modulus. Moreover, they have temperature dependency
behavior similar to HMA (Apeagyei and Diefenderfer 2013). The study used deflection testing
and laboratory measurements of the resilient modulus and indirect tensile strength of CCPR-
foam field cores to estimate layer coefficients; the results ranged from 0.36–0.48 in.−1
(Diefenderfer and Apeagyei 2014).
In 2012, two full-scale pavement sections were built at NCAT to assess the structural
contribution of CCPR with 100% RAP and foamed asphalt as a recycling agent. The layer
coefficients were found to fluctuate from 0.36 to 0.39 in. −1 (Díaz-Sánchez et al. 2017).
2.5. SUMMARY
This chapter defined pavement preservation and their different techniques focusing on
cold recycling as a preservation technique. Also, the literature review gives a brief overview
of mix design methods going from simple empirical to more sophisticated procedures with
performance-based testing. Differences between the two recycling agents (emulsion and
foam) were described in the chapter, which includes production, mixing temperature, RAP
coating, and others.
A description of the two main recycling techniques was included in this study. A summary
of the performance of recycled sections in different DOTs was given. A literature-based
summary of their documented structural performance was provided.

48
The main results related to the layer coefficient found in the literature reviewed are
summarized in Table 5. The reason for a wide range of cold recycled coefficients may be
because most agencies do not have a CR specification, resulting in non-optimized designs.
Therefore, this thesis focuses on the long-term performance of cold recycled asphalt mixtures
as a pavement preservation technique regardless of construction methods or recycling agents.
Table 5. Structural coefficients for recycled materials
Source Recycling Method
Layer Coefficient
Tia and Wood (1983) Laboratory mixing 0.25 - 0.40 Wijk and Wood (1983) CIR 0.13 - 0.30 Mckeen et al. (1998) CIR 0.30 Marquis (2003) CIR 0.22-0.35 Sebaaly et al. (2004) CIR 0.26 Romanoschi et al. (2004) FDR 0.18 Khosravifar et al. (2015) CIR 0.36 Apeagyei and Diefenderfer (2014) CCPR 0.36 - 0.48
(Díaz-Sánchez et al. (2017) CCPR 0.36 - 0.39

49
CHAPTER 3: METHODOLOGY
This chapter discusses the methods used to accomplish the objectives of this research.
The evaluation of the structural contribution and functional performance of Cold Recycling
techniques under realistic conditions is the most proper way to assess the evolution of
pavement properties and distresses overtime under representative traffic loading. Therefore,
the estimation of layer coefficients for the recycled layers is reliable to be used as an input in
the empirical pavement design method. Thus, four test sections were built along Highway US-
280 in Opelika, Alabama.
Cold recycled mix design and pavement construction information of the recycled
sections are reported, followed by the data collection techniques and data processing. Cold
recycled treatments were applied to full-scale test sections in 2015. Routine testing was
carried out to monitor the performance of cold recycled treatment sections. Roughness,
cracking, and rutting was measured and analyzed throughout the experiment; also, falling
weight deflectometer (FWD) testing was performed to examine the structural condition of the
pavement. The data collected from FWD testing were used to backcalculate the layer moduli.
The FWD files obtained from the Dynatest device were used for backcalculation with ELMOD
6 software. Finally, a statistical analysis was performed on the measured parameters of the
cold recycled sections using Minitab 17 software to measure the influence of the construction
techniques and recycling agents in the performance of the recycled sections.

50
3.1. PRESERVATION GROUP STUDY
In the summer of 2012, NCAT designed the Pavement Preservation Group (PG) study
as part of NCAT's fifth research cycle. The PG Study was initiated in response to the growing
need for agencies to obtain reliable performance data for different pavement preservation
treatments that would allow agencies to make objective decisions regarding treatment
selection. Although pavement preservation treatments have been applied to test sections on
the NCAT Pavement Test Track, the PG study sections were placed on off-Track roadways to
eliminate any effects resulting from the accelerated rate of axle load repetitions (Powell 2016).
The PG Study began with 23 preservation treatments in Lee County Road 159, a low-traffic
volume road in Alabama.
Preservation treatments were placed on a section of Highway US-280, a higher volume
roadway, during the 2015 research cycle. NCAT has also partnered with the Minnesota
Department of Transportation's Road Research Facility (MnROAD) to quantify the benefits of
pavement preservation in both northern and southern climates. In 2016, several treatments
were replicated on low and high traffic volume roadways near Pease, Minnesota. The
Preservation Group test locations are shown in Table 6.
Table 6. Test Locations Summary
Roadway LR -159 US-280 CSAH 8 US-169 Location Auburn, AL Opelika, AL Pease, MN Pease, MN Traffic Volume Low High Low High Number of treatments
23 34 22 21
Year Treated 2012 2015 2016 2016

51
3.2. TEST SECTIONS
For the 2015 research cycle, 34 pavement preservation treatments or treatment
combinations were placed on the outside lane of a 4-mile section of Highway US-280 in
Opelika, Alabama. The two-lane highway has a total length of 392 miles, and the road goes
from Blichton, Georgia to Birmingham, Alabama, and is the main connector between the cities
of Birmingham and Auburn, AL. Figure 7 shows the location and a view of the test sections
placed on this site. The accumulated traffic load since the summer of 2015 is approximate 2.8
million ESALs. The reported annual average daily traffic (AADT) in 2015 was 18,300 vehicles
per day (vpd), and by 2018 was 20,083 vpd with a truck volume of 16%.
Figure 7. Location and Overview of Highway US-280. (Reproduced from Google Earth, 2020)
At the time of construction, the existing pavement on Highway US-280 was nine years
old and had an average hot mix asphalt of 6.8 inches on top of a granular base of ten inches.
The 46 sections have a length of 0.1 miles each and are located on the outside lane of the two-

52
lane eastbound highway. Each section is subdivided into 32 subsections measuring 5.5 by 16.5
feet. There are six control sections with low and high levels of cracking, rutting, IRI and texture,
and six empty sections. Additionally, there are 11 segments of the road, which were part of
the Long-Term Pavement Performance (LTPP) project; these sections add variability to the
layer thicknesses of the paved road. Collected data from cores, LTPP database, and
construction records corroborate the layer thickness variability.
The location of the four recycled sections included in this study corresponds to sections
40, 41, 43, and 44 on the Highway US-280 test site, situated between mileposts 131.9 and
132.4. The treatments placed include cold central-plant recycling with emulsified and foamed
asphalt binders (i.e., CCPR-E and CCPR-F), and cold in-place recycling with emulsified and
foamed asphalt binders (i.e., CIR-E and CIR-F). All the sections have 100% RAP, and a thin 1-
inch overlay was paved as a surface layer. The complete pavement structure was determined
by Ground Penetrating Radar (GPR) testing validated with core logs. The composition of the
recycled sections is shown in Table 7, Figures 8, and 9.
Table 7. Average layer thicknesses of cold recycled sections
Section Treatment Type
Milepost
Overlay, inch
CR, inch
HMA, inch
Granular Base, inch
40 CCPR-F 131.90 1.00 4.00 3.40 11.10 41 CCPR-E 132.00 1.00 4.00 8.70 8.00 43 CIR-E 132.20 1.00 4.00 12.50 0.00 44 CIR-F 132.30 1.00 4.00 7.80 0.00
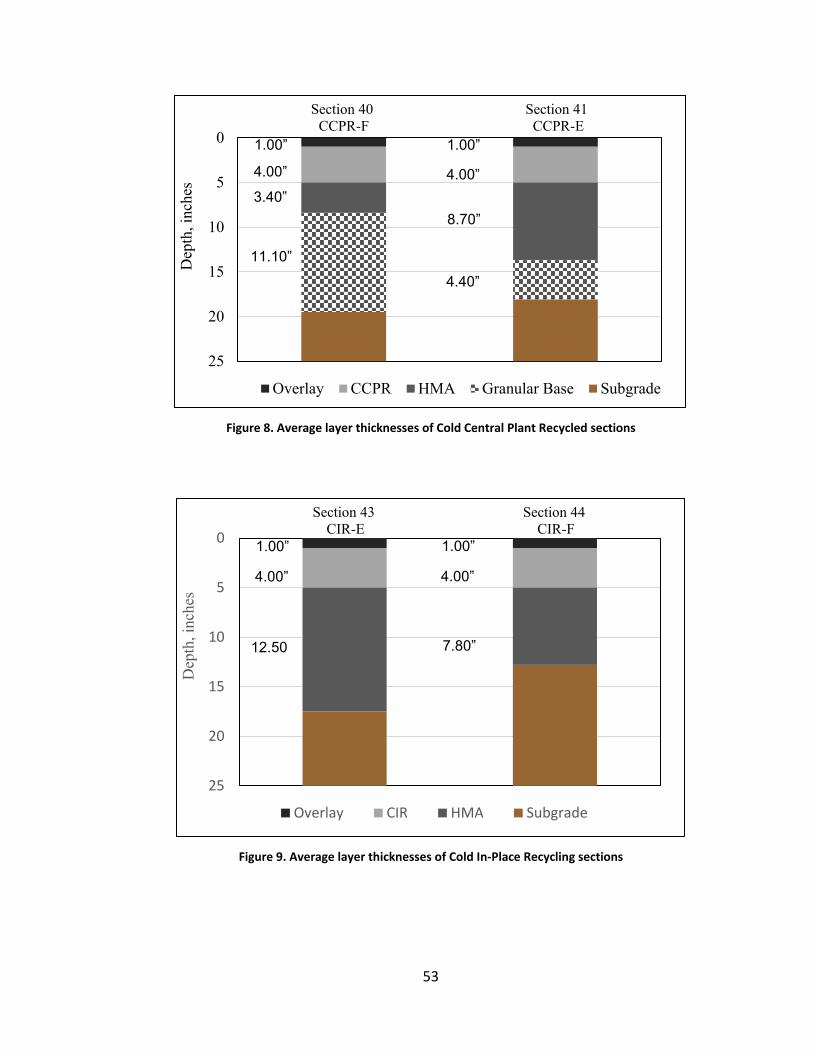
53
Figure 8. Average layer thicknesses of Cold Central Plant Recycled sections
Figure 9. Average layer thicknesses of Cold In-Place Recycling sections
0
5
10
15
20
25
Dep
th, i
nche
s
Overlay CCPR HMA Granular Base Subgrade
Section 41 CCPR-E
1.00”
4.00”
4.40”
8.70”
Section 40 CCPR-F
1.00”
4.00”
11.10”
3.40”
0
5
10
15
20
25
Dep
th, i
nche
s
Overlay CIR HMA Subgrade
Section 44 CIR-F
1.00”
4.00”
7.80”
1.00”
4.00”
12.50
Section 43 CIR-E

54
3.2.1. Mix design
The two common recycling agents used for this research were foamed asphalt and
asphalt emulsions. The reduced viscosity of recycling agents allows mixing with ambient
temperature RAP. Cold recycled mixtures can be produced using two production techniques,
cold central plant recycling (CCPR), and cold in-place recycling (CIR) using processing and
mixing equipment on the roadway.
Cold Recycling mix design guidelines proposed by the Asphalt Recycling & Reclaiming
Association (ARRA) were followed to design both the foamed asphalt and asphalt emulsion
mixtures (ARRA 2016, 2017). East Alabama Paving (EAP) milled, crushed, screened, and
stockpiled the RAP; then, the material was sampled from EAP’s stockpile. The RAP source was
from a previous construction project on Highway US-280 in Opelika, Alabama. The RAP binder
content ranged from 4.9 to 5.2 percent, and the performance grade of the recovered binder
was PG 100-10. A PG 67-22 binder from Birmingham, AL, was used for foaming while a PG 64-
22 binder from Parsons, TN was used for the emulsions.
NCAT designed the foamed asphalt mixtures. The Wirtgen’s laboratory-scale WLB 10-
S model foaming plant was used to produce the foamed asphalt. The asphalt was foamed at
170°C and 1.3 percent water to obtain a foamed asphalt with an 8.5 expansion ratio and 6-
second half-life. The twin-shaft pugmill WLM 30 model was used to mix RAP with foamed
asphalt binder at a room temperature of 25 ± 2 °C. The optimum foamed asphalt content was
determined by testing three foamed asphalt contents (2.0, 2.5, 3.0 percent) to produce
different trial mixtures.

55
After mixing, the samples were compacted to 63.5±2.5 mm height for 35 gyrations
using a Superpave gyratory compactor in a 100-mm diameter mold (Gu et al. 2019). The
compaction effort was based on previous field construction projects performed by Wirtgen
America to match field compaction effort. The specimens were extruded from the molds after
compaction, and then cured in an oven at 40 ± 1 °C for 72 hours and cooled at 25 ± 2 °C for 24
hours. Compacted and cured specimens were tested for indirect tensile strength (ITS) in both
dry and wet conditions following AASHTO T283 without freeze-thaw conditioning. The design
followed the ARRA criteria of a minimum dry strength of 45 psi and a minimum tensile strength
ratio of 70 percent.
The optimum foamed asphalt content was 2.2 percent by weight of dry RAP, and the
total water content was 7.2% by the weight of dry RAP for the CCPR mixture. The foamed
asphalt content was 1.8% by the weight of dry RAP, and the total water content was 4.9% by
the weight of dry RAP for the CIR mixture. A dosage of 1.5 percent Type I/II Portland cement
was added to reduce moisture susceptibility for both asphalt mixes, this amount of active filler
is greater than typical values. High rates of cement might affect the cracking resistance of the
sections.
The methods and criteria used for the emulsion mix designs were established by
Ingevity Corporation; these techniques were based on experience and ARRA design
procedures. The design method considers the dynamic modulus test as part of the selection
of the optimum asphalt content. Ergon Corporation provided the emulsion, which was made

56
using Ingevity’s INDULIN W-5 (a cationic slow-set emulsifier) at a dosage rate of 1.0% active
emulsifier and 2% of polymers.
The emulsion was blended with RAP at three different contents (2, 3, and 4 percent)
for comparison. Therefore, the mixtures were mixed and compacted for Marshall stability
testing at dry and wet conditions. All the mixtures with different contents passed the
minimum 1,250 lbf stability criteria, and a minimum of 70 percent retained stability. The
optimum emulsion content was selected by testing the asphalt for dynamic modulus (E*),
fracture energy by the disc-shaped compact tension test, and raveling test.
The emulsions contained 62 percent residual asphalt, also the emulsion content was
designed as 3.0 percent, and the total water content was 7.0 percent by weight of dry RAP for
the CCPR mixture. Whereas for the CIR mixture, the design emulsified asphalt content was
determined as 3.2 percent, and the total water content was selected as 4.4 percent by weight
of dry RAP. The same cement type and amount used in the foamed asphalt mixtures were
added.
A summary of the mix designs is shown in Table 8, the asphalt content shown in the
table is the residual asphalt for the emulsion designs, and the compaction is the ratio of dry
density between field cores and laboratory QC samples. The foamed and emulsion mixtures
have almost the same gradation for CCPR and CIR; the gradation curves are located to the left
of the maximum density line, which indicates a fine gradation. The burned gradations of cold
recycled techniques are shown in Figure 10, and they follow the ARRA criteria.

57
Table 8. Summary of Cold recycled mix designs
Mixture Asphalt (%)
Water (%)
Compaction (%)
Dry ITS (psi) Wet ITS (psi)
TSR (%)
CCPR foamed
2.2 7.2 98.3 52.2 48.1 92.1
CIR foamed
1.8 4.9 96.6 69.5 68.7 98.8
Mixture Asphalt (%)
Water (%)
Compaction (%)
Dry Stability (lbf)
Wet Stability
(lbf)
Retained Stability (%)
CCPR emulsion
1.9 7.0 102.4 2175.0 2025.0 93.1
CIR emulsion
2.0 4.4 96.7 2275.0 2225.0 97.8
Figure 10. Burned gradation of the aggregates from the cold recycled mixtures
0
10
20
30
40
50
60
70
80
90
100
Perc
ent P
assi
ng
Sieve Size(mm)
CCPR-f
CCPR-e
CIR-f
CIR-e
0.07
5
0.30
0.60
1.18
2.36
4.75
9.50
12.5
19.0
25.0
0.15

58
The thin overlays placed on top of the recycled sections have the same hot mix asphalt
mixture. The nominal maximum aggregate size (NMAS) was 4.75 inches; the dense-graded mix
had a design binder content of 6.1 percent; the base binder had a performance grade of PG
67-22. The mixture was designed under the Superpave method with a compaction effort of 75
gyrations. The aggregates consisted of limestone and sand, 11 percent of fractionated fine
RAP, and 3 percent of recycled asphalt shingles (RAS), for a total binder replacement of 20
percent.
3.2.2. Construction
The main contractor for the construction of the four recycled sections as part of the
preservation study was East Alabama Paving. The recycling equipment was supplied by
Wirtgen America Inc. and supported by Wirtgen personnel. The construction was scheduled
for the week of September 7, 2015. A Wirtgen KM220 mobile mixing plant was used to
produce foam and emulsion CCPR mix. A Wirtgen 3800 CR in-place recycling machine was used
to produce foam and emulsion CIR mix. The construction of the CCPR sections started on
Wednesday, September 9; the weather during the construction day was mostly clear, with a
temperature of around 90°F and 55% relative humidity. The sections were milled to a depth
of 5.4 inches (Figure 11) to allow for the placing of CCPR produced material, to accommodate
the fluff of recycling and the thin overlay.
The CCPR was carried out using a Wirtgen KMA220 Cold Mix Recycling Plant,
positioned at the NCAT test track (Figure 12). The foam CCPR was placed on Section 40 at mile
marker 131.9; the recycled RAP was loaded directly to trucks via the discharge conveyor and

59
transported to the construction site. The cold recycled mix was paved using a Roadtec paver
to the required depth and levels and immediately compacted behind the screed using tandem
steel drum vibratory rollers.
Figure 11. Milling of the CCPR sections

60
Figure 12. Production of CCPR at NCAT test track
Following the foamed RAP section, the KMA220 was set up for the Emulsion section
following the mix design. The emulsion CCPR was placed on Section 41 at milepost 132.0, the
paving of the emulsion recycled RAP executed precisely as the foam section with similar
compaction results (Figure 13).
After compaction, both sections were sealed with a tack coat; once cured, the lane was
opened to full unrestricted speed traffic (Figure 14).

61
Figure 13. Paving of the CCPR foam section
Figure 14. Tack coat application for both sections

62
On September 10, 2015, there was a concern that the tanker truck carrying the PG 64-
22 asphalt still contained leftover remnants of bitumen from the trackless tack emulsion.
Therefore, it was decided to bring in the emulsion tanker and make section 43 the CIR
emulsion section.
The weather was cloudy, with a temperature of 79°F and 84% relative humidity. The
workday started by pre-milling to a depth of 1.4 inches, with 1.5% cement spread on the
surface in each of the two 500 ft sections (Figure 15). The CIR was carried out using a Wirtgen
3800CR full lane recycling machine; the 3800CR being was set up for emulsion in the first
section. The resulting homogeneous recycled mix was loaded directly into the hopper of the
Roadtec paver via a rear discharge conveyor (Figure 16). The material was then paved and
compacted exactly as the CCPR material. The CCPR emulsion was placed at mile marker 132.2.
Figure 15. Pre-milling of the CIR sections

63
Figure 16. Recycled material loaded into the paver
On September 11, 2015, the 3800 CR was switched to foamed asphalt, and the foam-
based CIR was placed on Section 44 at milepost 132.3. Finally, the thin overlay was placed and
compacted on all the sections (Figure 17).
Quality control was performed to verify the quality of produced cold recycled mixtures.
The recycled mixtures were sampled close to the paver auger during construction and tested
for total water content, added asphalt content (subtracting RAP binder content from total
binder content), and aggregate gradation. Samples were also compacted and cured for the ITS
test (or stability test). Both the foamed mixture’s strength and emulsion mixture’s stability
met ARRA's recommended criteria.

64
Figure 17. Compaction of the thin overlay
3.3. DATA COLLECTION
Asphalt pavement performance depends on many variables, such as traffic, materials,
and construction practices. Continuous testing is relevant for reliable results and pavement
management. The evaluation is based on a set of visual evaluation methods and non-
destructive testing (NDT). Field data collection has been in progress since September 2015.
Data collection was performed periodically for the test sections. The data collected included
roughness, rutting, cracking, friction, texture, and deflection testing. Lane closures are
required to test on Highway US-280 due to the traffic level and safety of the crew.
3.3.1. Functional Performance testing
Pavement condition is assessed by collecting functional performance data over time.
Rut depth and roughness were obtained biweekly using a data collection vehicle equipped

65
with an inertial profiler, a laser rut measurement system (LRMS), and high-resolution cameras.
The inertial profiler collected the longitudinal profile of the pavement surface for both wheel
paths (Figure 18), and images for crack mapping were taken quarterly.
The LRMS systems can obtain the transverse profile and measure rut depths, while
multiple laser sensors measure macrotexture data by the average mean texture depth (MTD)
according to ASTM E1845. Additionally, the high-resolution camera for pavement scanning is
used to monitor cracking. Friction was measured monthly by ALDOT on each section with a
locked-wheel skid trailer; the test was conducted using a ribbed tire at 40 mph on a wet
surface following ASTM E 274.
The Federal Highway Administration (FHWA) proposed performance measurements to
assess the condition of the pavement based on the percentage of pavements in good and poor
condition. The Moving Ahead for Progress in the 21st Century Act (MAP-21) legislation was
issued by the FHWA in January 2017, which required that performance measures be
established by the State Departments of Transportation (DOTs). The condition of the
pavements is to be determined based on the International Roughness Index (IRI), cracking
percent, and average rutting.

66
Figure 18. Automated Road Analyzing Vehicle
The condition evaluation of the test sections is based on the three performance
measures adopted from MAP-21. This approach is essential to evaluate the road in a way that
is consistent among agencies (Visintine et al. 2018). The thresholds of the condition categories
for the performance indicator established by the MAP-21 act for good, fair, and poor are
shown in Table 9. This evaluation requires pavement segments of 0.1 miles, the same as the
length of the test sections in this study.
Table 9. Condition thresholds for MAP-21 Performance Measures
Condition Rating
% of Area Cracked
Rutting, in (cm)
IRI, in/mi (m/km)
Good < 5% < 0.20 (0.51) < 95 (1.5)
Fair 5 – 20% 0.20 – 0.40 95 – 170
Poor > 20% > 0.40 (1.02) > 170 (2.7)

67
3.3.2. Deflections
Deflection testing is performed following ASTM D 4694 Standard Test Method for
Deflections with a Falling-Weight-Type Impulse Load Device. The lane closure of Highway US
280 for FWD testing is made quarterly. There are three designated random locations for FWD
testing within each test section. An example of the locations for test section 43 can be
observed in Figure 19. The FWD test is performed on the same locations on each test date.
Figure 19. Random location of test section 43 (Reproduced from Google Earth, 2019)
At each random location, testing was performed in the center of the wheel paths. A
Dynatest 8000 FWD model device is used by NCAT for deflection testing (Figure 20). At the
time of testing, three replicates at four load levels (approximately 6, 9, 12, and 16 kips) were
applied with a plate radius of 5.91 inches at each location. Surface and air temperatures were
recorded, the load level will depend of the height of the drop, an acceptable height drop range
is between 90 and 110 percent.

68
At the start of every testing day, the FWD device applied a warmup dropping session
in order to check for variability within drops. The variability under standard specification is 3%
within replicates of the load magnitude of a target magnitude load. Common oversights during
testing are seating errors, which are due to debris or rough surface texture; these can be
addressed by cleaning the pads or checking the spring and performing seating drops to adapt
to the asphalt surface. The FWD device is subjected to calibration to prevent systematic errors;
monthly relative calibration and annual reference calibration are achieved following the
AASHTO R32 Standard Practice for Calibrating the Load Cell and Deflection Sensors for a Falling
Weight Deflectometer.
Figure 20. FWD testing on Highway US-280
A set of geophones are arranged to measure the deflection basin around the center of
the load plate. The FWD device was used with a total of nine geophones, spaced, as shown in
Table 10.

69
Table 10. Geophone offsets
Sensor Number
Offset from Load Center, in.
1 0 2 8 3 12 4 18 5 24 6 36 7 48 8 60 9 72
3.3.3. Ground Penetrating Radar (GPR)
On May 19, 2020, Bhate Geosciences Corporation completed the GPR fieldwork of the
pavement layer thicknesses at the 0.1-mile sections of Highway US-280 (Figure 21). The test
was performed using air-launched GPR following the applicable requirements of the ASTM
D4748-10 Standard Test Method for Determining the Thickness of Bound Pavement Layers
using Short-Pulse Radar. The GPR scanned the layer thickness every six inches. Existing core
data provided by NCAT was used to validate the layer thicknesses obtained using GPR. The
GPR collection instrument records the two-way travel time of the wave produced from an
antenna as it travels from the transmitter to the reflector (pavement material interface) and
back to the receiver. The dielectric constant of the material determines the velocity of the GPR
wave.

70
Figure 21. GPR calibration
The profile of the sections determined by GPR testing is displayed in Figure 22, and
Tables 11 and 12 indicate the pavement structure per random location of each test section
calculated as an average of 20 ft forward and backward from the test location to account for
the variability.
Figure 22. GPR profile
0
5
10
15
20
25
30
131.90 132.00 132.10 132.20 132.30 132.40
Thic
knes
s, in
Milepost, mi
Asphalt Thickness (in) Base Thickness (in)

71
Table 11. Layer thickness per random location-Sections 40 and 41
Random Location
Milepost Asphalt, inch
Base, inch
40-1 131.93 6.91 13.01 40-2 131.94 7.22 12.29 40-3 131.98 10.26 6.90 41-1 132.01 13.05 8.00 41-2 132.06 13.84 8.00 41-3 132.08 13.89 8.00
Table 12. Layer thickness per random location-Sections 43 and 44
Random Location
Milepost Asphalt, inch
43-1 132.23 18.10 43-2 132.26 17.59 43-3 132.30 17.21 44-1 132.31 17.64 44-2 132.36 13.22 44-3 132.37 11.76
3.4. STRUCTURAL CAPACITY
The development of the structural capacity analysis and the structural contribution
assessment for each technique follows the flow chart presented in Figure 23. This process
started with data collection using the FWD device. At the time of testing, the FWD operator
checks the device to prevent any testing error. The load pulse generated by the FWD
momentarily deforms the pavement under the load plate into a dish or bowl shape which is
measured by the geophones, this resultant deflection shape is called the deflection basin.
The second step for the analysis is to evaluate the raw deflection data. The collected
deflection files were stored in a database. This process is essential to filter outlier values that

72
can be caused by the presence of cracking on the surface or irregularities, cleanliness of the
surface, bedrock, deflections beyond the mechanical limit, shallow stiff layer, and water table.
A typical error is when a geophone that is far away from the load plate measures a higher
deflection than the geophone closer to the load; this error leads to erroneous backcalculated
modulus. Another filter to the database is that from the three load levels (6,000 to 12,000 lb.)
that have been tested at each random location ( 3 replicates per load level), only the data
obtained for the second load level (approximately 9,000 lb.) were used for structural capacity
evaluation.
The third step in the process is to import the filtered FWD files into the ELMOD 6
software and create a database in the software. The recycled sections are defined in the
software. Also, the thickness and seed modulus for each layer are entered as inputs. The
bituminous layers (cold recycled material and HMA) were combined as one for this
computation. Later, the replicates of the load levels were selected to perform the moduli
backcalculation in the software. The software uses the Deflection Basin Fit method to
backcalculate the moduli of the combined layers (Ep) and resilient modulus of the subgrade
(Mr). This method requires a forward calculation program within ELMOD 6.

73
Figure 23.Flowchart of the structural analysis process
Raw Data Analysis
Backcalculation
Layer Coefficient
computation
END
START
Data Collection
Statistical Check
Yes
No

74
This program utilizes Odemark-Boussinesq equations to generate a database of
deflection basins for different combinations of layer moduli, specified layer thicknesses, and
loading conditions. The Odemark-Boussinesq model follows the underlying assumptions that
the layers are homogeneous, isotropic, and linearly elastic. The measured deflection basin is
compared with the deflection basins in the database using a search algorithm, and a set of
moduli are interpolated from the layer moduli that produces the closest calculated deflection
basins in the database.
The number of basins required to obtain a suitable database depends on the number
of layers and the expected moduli ranges. The selection of the search range in the ELMOD 6
software can be modified on the offset (10 to 50%), and the steps (1 to 10) search options.
The software interface can be seen in Figure 24. This research considered an offset of 30% and
two steps for the search range. Finally, the program optimizes the solution by seeking to
minimize the relative sum of squared differences between the measured and calculated
surface deflections.
The backcalculation results are exported in an Excel file; it is important to notice that
the results are for the test conditions, without any adjustment for temperature or seasonal
effects. Surface temperatures recordings at the time of testing were used as an input to Bell’s
equation to compute the asphalt temperature in the middle of the layer as a function of the
previous average daily air temperature. The average air temperature was collected using the
LTTP database for Opelika, AL.

75
Figure 24. Deflection basin fit options on ELMOD 6
Temperature correction factors to convert composite pavement modulus at any
temperature to 68 °F were determined for each test section using correlation equations
obtained in Excel between Ep and temperature. The following equations were used for the
calculation:
𝐸𝐸𝑝𝑝𝑝𝑝 = 𝑘𝑘1𝑒𝑒𝑘𝑘2𝑝𝑝 [1]
𝐸𝐸𝑝𝑝68 = 𝐸𝐸𝑝𝑝𝑝𝑝𝑒𝑒𝑘𝑘2(68−𝑝𝑝) [2]
Where,
𝐸𝐸𝑝𝑝𝑝𝑝 = Backcalculated Composite Pavement Modulus at T temp., psi
𝐸𝐸𝑝𝑝𝑝𝑝68 = Backcalculated Composite Pavement Modulus at 68°F, psi
T = Mid depth temperature of pavement section, F
𝑘𝑘1,𝑘𝑘2 = correlation coefficient

76
The next step in the structural analysis process is to compute the layer coefficient of
the cold recycled layers. The method used to calculate layer coefficients in Sections 43 and 44,
which there are no granular materials, is by using the AASHTO 1993 AC over AC overlay design
method because the composite pavement modulus is over the subgrade. The Effective
Structural Number (SNeff) calculation requires the backcalculated composite pavement
modulus standardized at 68°F (Ep68) following Equation 3.
𝑆𝑆𝑆𝑆𝑒𝑒𝑒𝑒𝑒𝑒 = 0.0045 × 𝐷𝐷 �𝐸𝐸𝑝𝑝682 [3]
Where,
SNeff = Effective Structural Number from the existing pavement section
D = Total pavement thickness over subgrade, in
Ep68 = Backcalculated Standardized Composite Pavement Modulus, psi
The layer coefficient in Sections 40 and 41 was computed using Equation 4, which is a
correlation between the layer coefficient and the elastic modulus of AC from the AASHO Road
test. This method was initially used by Schwartz and Khosravifar (2013) and later applied by
Díaz-Sánchez et al. (2017) and Diefenderfer and Apeagyei (2014).
𝑎𝑎 = 0.1665 × ln(𝐸𝐸68) − 1.7309 [4]
Where,
a = Composite Pavement structural coefficient
Ep68 = Backcalculated Standardized Composite Pavement Modulus, psi

77
Then, using the layer coefficient (a) computed from Equation 4, the AC/RAP layer SN
was calculated according to Equation 5.
𝑆𝑆𝑆𝑆𝐴𝐴𝐴𝐴/𝑅𝑅𝐴𝐴𝑅𝑅 = 𝐷𝐷𝐴𝐴𝐴𝐴/𝑅𝑅𝐴𝐴𝑅𝑅 × 𝑎𝑎 [5]
Where,
𝑆𝑆𝑆𝑆AC/RAP = Effective Structural Number
𝐷𝐷AC/RAP = Thickness of asphalt concrete layers, in
a = Composite Pavement structural coefficient
Subsequently, the Recycled Structural Number (SNR) is calculated by the difference
between the SNeff (Section 43 and 44) or SNAC/RAP ( Sections 40 and 41); and the product of the
thickness and structural coefficient of the HMA layers (Equation 6). A typical loss of 20% of the
asphalt structural coefficient (aAC) is considered for low alligator and transverse cracking
severity in accordance with the AASHTO method. Also, an NCAT study recommends an asphalt
layer coefficient of 0.54 for new asphalt mixes in Alabama (Peters-Davis and Timm 2011).

78
𝑆𝑆𝑆𝑆𝑅𝑅 = 𝑆𝑆𝑆𝑆𝑒𝑒𝑒𝑒𝑒𝑒 − 𝐷𝐷𝑅𝑅 × 𝑎𝑎𝐴𝐴𝐴𝐴 [6]
Where,
SNR = Recycled Structural Number
SNeff = Effective Structural Number
𝐷𝐷𝑅𝑅 = thickness of asphalt concrete layers, in
aAC = Asphalt concrete structural coefficient
Finally, the layer coefficient for the cold recycled mix layers is computed by dividing
the SNR by their layer thickness. The last step in the process is to check for steady results by
comparing the average layer coefficients within random locations and cold recycled test
sections using statistical techniques. If the results are not adequate, the inputs for the
backcalculation process in step 3 should be evaluated and then continue to the normal process
flow.
3.5. SUMMARY
Four test sections were built in 2015 on Highway US-280 as part of a more extensive
study conducted by the NCAT. This research evaluates the field performance of cold recycled
materials (CCPR-E, CCPR-F, CIR-E, and CIR-F) under real conditions and evaluates its structural
contribution in a pavement structure.
The functional performance of the four test sections was tested by collecting rut depth,
cracking, and ride quality data on a routine basis over 4.5 years. The structural performance

79
was evaluated using FWD testing, and the data were filtered, analyzed, and backcalculated to
assess the performance over time under actual weather and traffic conditions.
Finally, a statistical analysis was performed to assess the effect of the CR method on
the structural and functional performance of the treatments.

80
CHAPTER 4: RESULTS
4.1. INTRODUCTION
NCAT has monitored the structural and functional performance of the four recycled
sections in Highway US 280 periodically. The functional performance was determined by
cracking, rut depth measurements, and ride quality for each test section. A falling-weight
deflectometer was used to conduct deflection testing to assess the structural performance of
the four recycled test sections over time. The structural layer coefficient was tested for
statistical analysis using a general linear model and compared by the Tukey test.
4.2. STRUCTURAL CAPACITY
Data collected for structural capacity analysis of the sections started in the last quarter
of 2015. From the three different load levels collected, only the load level 2, which is 9,000 lbf
was used for the analysis. This load level is often applied for most highway pavement testing,
research so that it will be easier to compare results with other project sites. Also, this load
level represents a standard 18,000 lbf axle load.
4.2.1. Raw data analysis
The next step following the flow chart previously shown in Figure 22 is to evaluate raw
deflection data. The collected deflection files were stored in a database for analysis. This
process is critical to filter outlier values that can be caused by shallow bedrock, shallow stiff
layer, water table, and others. Due to the amount of collected data at each geophone per
random location, a straightforward procedure to filter data is by using the deflection
measured by the first geophone located on top of the load plate, known as D0. Figure 25

81
shows the D0 deflections of the recycled sections distributed quarterly over time. The data
displayed represents the average of the random locations and the repetitions at each section.
Figure 25. Deflections measured at the first geophone (D0)
The layers influence the center deflection underneath the surface; therefore, it is
expected that the sections have different performance under load drops because they have
different structures. It can be observed that section CCPR-F (40) consistently has the highest
deflections in comparison with the others. This expected due to the thinner asphalt layer in
this section.
A more detailed evaluation of Section CCPR-F (40) can be observed in Figure 26. It can
be noticed that random locations one and two (RL-1 and RL-2) exhibited higher deflections
than RL-3, resulting in an average deflection higher than the other recycled sections. A non-
uniform pavement structure can explain this variability throughout the length of the section,
which can be confirmed by the data displayed in the graphic where RL-3 has the lowest
deflections.
0
2
4
6
8
10
12
14
16
18
Qtr4 Qtr1 Qtr4 Qtr1 Qtr2 Qtr3 Qtr4 Qtr1 Qtr2 Qtr3 Qtr4 Qtr1 Qtr2 Qtr3 Qtr4
2015 2016 2017 2018 2019
Defle
ctio
n (D
0), m
ili
40 - CCPR Foam
41 - CCPR Emul
43 - CIR Emul
44 - CIR Foam

82
Figure 26. Deflections (D0) on random locations of section 40
Another method to analyze structural capacity using raw deflection data is by the
surface modulus concept. The analysis is based on Boussinesq’s original closed-form
equations; this is very useful for estimating subgrade modulus and for diagnosing stress-
sensitive subgrade material. This approach uses the deflection measured by the nine
geophones, and not only the center deflection, which is dependent on the moduli of each
layer below. This assessment can be used to determine if the subgrade or the upper materials
influence CCPR-F (40) section. The surface moduli are calculated at horizontal distance r,
which is determined by the location of the geophones. The outer deflections fall within a zone
where only the subgrade contributes to the surface moduli calculation (Horak 2007).
The relationship between the vertical deflection and the surface modulus is described
by Equations 7 and 8.
𝐸𝐸0 = 2𝑅𝑅�1−𝜇𝜇2�
𝜋𝜋𝜋𝜋𝐷𝐷0 [7]
0
5
10
15
20
25
RL-1
RL-2
RL-3
RL-1
RL-2
RL-3
RL-1
RL-2
RL-3
RL-1
RL-2
RL-3
RL-1
RL-2
RL-3
RL-1
RL-2
RL-3
RL-1
RL-2
RL-3
RL-1
RL-2
RL-3
RL-1
RL-2
RL-3
RL-1
RL-2
RL-3
RL-1
RL-2
RL-3
RL-1
RL-2
RL-3
RL-1
RL-2
RL-3
RL-1
RL-2
RL-3
RL-1
RL-2
RL-3
Qtr4 Qtr1 Qtr4 Qtr1 Qtr2 Qtr3 Qtr4 Qtr1 Qtr2 Qtr3 Qtr4 Qtr1 Qtr2 Qtr3 Qtr4
2015 2016 2017 2018 2019
Defle
ctio
n( D
0), m
ili

83
𝐸𝐸𝑟𝑟 = 𝑅𝑅�1−𝜇𝜇2�
𝜋𝜋𝑟𝑟𝐷𝐷𝑟𝑟 [8]
Where,
𝐸𝐸0= Surface modulus at the center plate, psi
𝐸𝐸𝑟𝑟= Surface modulus at the center plate at distance r, psi
𝑃𝑃= Applied load, lbs
𝑟𝑟= radial distance from center load, inch
𝐷𝐷 = surface deflection, inch
The surface modulus results in Figure 27 (tested in December 2015) show a similar
normal trend and a linear elastic subgrade in sections CCPR-E (41), CIR-E (43), and CIR-F (44).
On the other hand, CCPR-F (40) surface moduli might indicate that the subgrade strongly
influences the pavement structure. Sensors 6 to 9 (r =36 to 72 inches) represent the surface
moduli under the influence of the subgrade; those results could imply the presence of shallow
bedrock, stiff clay layers, or even a shallow water table based on the literature. Surface moduli
assessed in different months during the research shows the same tendency.
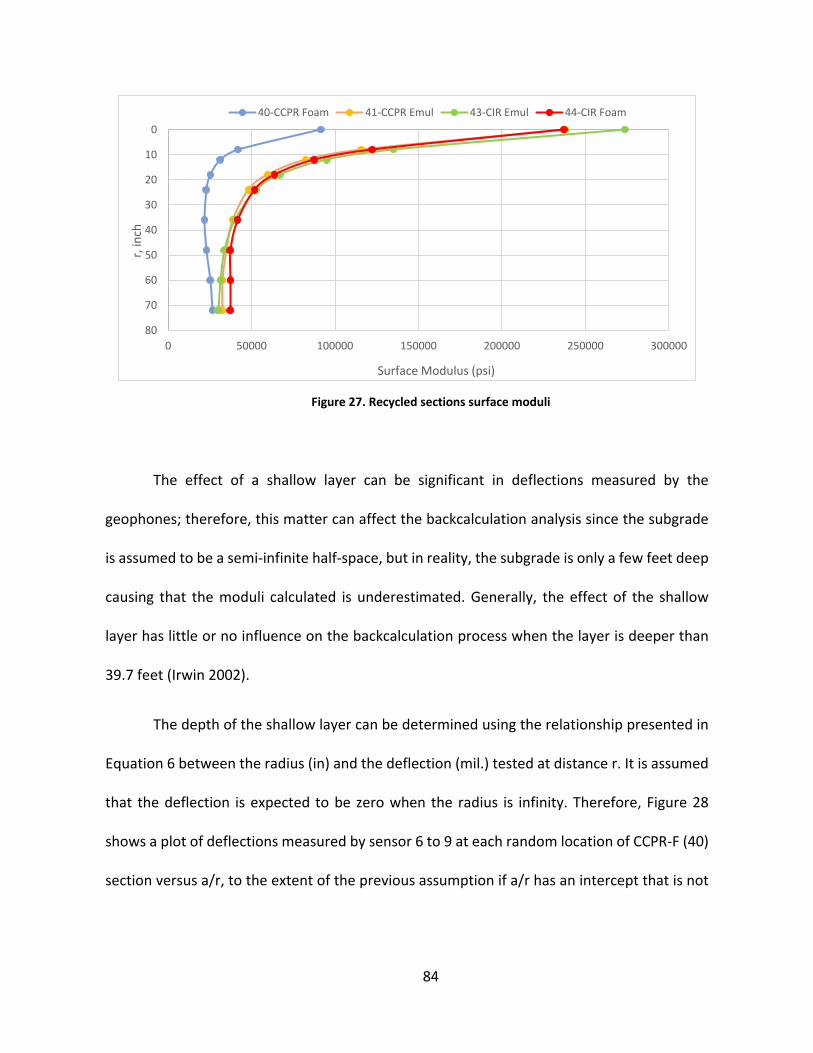
84
Figure 27. Recycled sections surface moduli
The effect of a shallow layer can be significant in deflections measured by the
geophones; therefore, this matter can affect the backcalculation analysis since the subgrade
is assumed to be a semi-infinite half-space, but in reality, the subgrade is only a few feet deep
causing that the moduli calculated is underestimated. Generally, the effect of the shallow
layer has little or no influence on the backcalculation process when the layer is deeper than
39.7 feet (Irwin 2002).
The depth of the shallow layer can be determined using the relationship presented in
Equation 6 between the radius (in) and the deflection (mil.) tested at distance r. It is assumed
that the deflection is expected to be zero when the radius is infinity. Therefore, Figure 28
shows a plot of deflections measured by sensor 6 to 9 at each random location of CCPR-F (40)
section versus a/r, to the extent of the previous assumption if a/r has an intercept that is not
0
10
20
30
40
50
60
70
800 50000 100000 150000 200000 250000 300000
r, in
ch
Surface Modulus (psi)
40-CCPR Foam 41-CCPR Emul 43-CIR Emul 44-CIR Foam

85
zero, it indicates that an unknown layer may be present. The depth to the shallow layer is then
determined at the radial distance where the deflection is zero.
Figure 28. Prediction of depth to bedrock
The depth to shallow layer is shown in Table 13. Random locations 1 and 2 have a
depth to a shallow layer of 12.2 ft and 16.2 ft, respectively, whereas random location 3 analysis
concluded that there is no shallow layer present under the load. The other test sections were
also verified for a shallow layer with negative results. Figure 29 shows a plot of the depth of
the layer at each random location in the CCPR-F (40) section.
Table 13. Depth to a shallow layer
Random Location
Distance (ft) m b Intercept Shallow
layer depth (ft)
RL-1 136 30.108 -1.2134 0.0403 Yes 12.2 RL-2 220 30.326 -0.9206 0.0304 Yes 16.2 RL-3 409 10.614 0.3643 -0.0343 No 0.0
-1.00
0.00
1.00
2.00
3.00
4.00
5.00
-0.05 0.00 0.05 0.10 0.15 0.20
Surf
ace
Defle
ctio
n, m
illi-i
n
a/r
RL-1 RL-2 RL-3

86
Figure 29. Depth to unknown layer at each random location
The shallow layer is present at a depth under 39.7 feet; therefore, it can affect the
backcalculation process. As the depth to the shallow layer was computed, it can be modeled
in the analysis to generate accurate results.
The GPR testing results for CCPR-F (40) section are presented in Figure 30. The
thickness around the third random location, which is located around milepost 131.978, has a
high standard deviation of 1.66 in due to the thickness variability, whereas the standard
deviation of random location RL-1 and RL-2 are 0.38 in and 0.25 in, respectively. The variability
of random location RL-3 is likely due to a pavement structure transition. Reliable results in
the backcalculation are relevant for the recycled pavement analysis; therefore, random
location RL-3 was not used for evaluation.
0
5
10
15
20
25
0 50 100 150 200 250 300 350 400 450 500 550De
pth,
ft
Section 40 offset (ft)

87
Figure 30. Section 40 GPR Layer Thickness
4.2.2. Backcalculation
The backcalculation of the layer moduli in the recycled sections was computed using
the ELMOD 6 software, as mentioned in Chapter 3. The results were exported to an Excel file
and temperature, and the time effect was analyzed using statistical tools.
Temperature and time-sensitivity of the backcalculated layer properties were analyzed
to accomplish the objectives of this research. Mid-depth pavement temperatures were
calculated based on Bell's equation for each random location.
A target load level of 9,000 pounds (actual loads ranging from 8,000 lbs. to 10,000 lbs.)
was selected to analyze the temperature sensitivity of the asphalt pavement modulus (Ep).
Figures 31 to 34 show the effect that temperature has on the Ep of the recycled sections.
Also, Table 14 indicates the trendline equations for each section.
0
5
10
15
20
25
30
131.90 131.92 131.94 131.96 131.98 132.00Th
ickn
ess,
inch
Milepost
Asphalt Thickness (in) Base Thickness (in)

88
All the collected backcalculated Ep values for each pavement section have been
plotted against the temperature in the horizontal axis. It can be concluded that the composite
modulus of asphalt pavement (Ep) is temperature dependent. With the increase of
temperature, the Elastic Modulus decreases exponentially. Nevertheless, CCPR-F (40) section
has the lowest R-squared value, which indicates that temperature does not account for many
variations in the composite modulus, this behavior can be explained by the layer composition
of the test section where the old HMA has the thinnest thickness in association to the sections
with values lower the 2.5 inches.
Figure 31. Temperature effect in Foamed CCPR section
0
250
500
750
1000
1250
1500
1750
2000
2250
2500
40 50 60 70 80 90 100 110
Ep, k
si
Temperature, F

89
Figure 32. Temperature effect in Emulsified CCPR section
Figure 33. Temperature effect in Emulsified CIR section
0
250
500
750
1000
1250
1500
1750
2000
2250
2500
40 50 60 70 80 90 100 110
Ep, k
si
Temperature, F
0
250
500
750
1000
1250
1500
1750
2000
2250
2500
40 50 60 70 80 90 100 110
Ep, k
si
Temperature (F)

90
Figure 34. Temperature effect in Foamed CIR section
Table 14. Temperature trendline of the recycled sections
Section R2 Trendline equation 40-CCPR-F 0.44 𝑦𝑦 = 1,437.398𝑒𝑒−0.0218𝑥𝑥 41-CCPR-E 0.75 𝑦𝑦 = 9,193.578𝑒𝑒−0.0376𝑥𝑥 43-CIR-E 0.91 𝑦𝑦 = 10,742.152𝑒𝑒−0.0349𝑥𝑥 44-CIR-F 0.83 𝑦𝑦 = 10,703.747𝑒𝑒−0.0359𝑥𝑥
The backcalculated Ep was normalized to 68°F (Ep68) using equations 1 and 2; the
results were plotted along a timeline to observe the aging effect on the pavement per random
location (Figure 35 to 38). The trendline of the composite modulus over time is presented in
Table 15.
0
250
500
750
1000
1250
1500
1750
2000
2250
2500
40 50 60 70 80 90 100 110
Ep, k
si
Temperature (F)

91
Table 15. Time trendline of the recycled sections
Section m Trendline equation 40-CCPR-F -0.107 𝑦𝑦 = −0.107𝑥𝑥 + 4,955 41-CCPR-E -0.119 𝑦𝑦 = −0.119𝑥𝑥 + 5,885 43-CIR-E -0.016 𝑦𝑦 = −0.016𝑥𝑥 + 1,676 44-CIR-F -0.035 𝑦𝑦 = −0.035𝑥𝑥 + 2,458
Figure 35. Time effect on the Foamed CCPR section
0
500
1000
1500
2000
2500
5/10/2016 9/22/2017 2/4/2019 6/18/2020
Ep68
, ksi
Date
RL-1 RL-2

92
Figure 36. Time effect on the Emulsified CCPR section
Figure 37. Time effect on the Emulsified CIR section
0
500
1000
1500
2000
2500
5/10/2016 9/22/2017 2/4/2019 6/18/2020
Ep68
, ksi
Date
RL-1 RL-2 RL-3
0
500
1000
1500
2000
2500
5/10/2016 9/22/2017 2/4/2019 6/18/2020
E 68,k
si
Date
RL-1 RL-2 RL-3

93
Figure 38. Time effect on the Foamed CIR section
When aging occurs, the normal behavior of hot mix asphalt layers is to become stiffer
with high Ep values on top layers; this can be reflected with a positive trendline slope. The
confidence interval of the regression analysis of the sections is presented in Table 16. The
slope of sections CIR-E and CIR-F goes through zero, which indicates that statistically, there is
no significant relationship between Ep68 and time.
On the other hand, P-value close to zero in sections CCPR-F (40) and CCPR-E (41) rejects
the null hypothesis that the slope of the trendline is equal to zero (no effect). Based on the
results, only CCPR-F(40) and CCPR-E (41) sections have statically decreased their composite
pavement modulus over time; this behavior can be attributed to their recycled thickness
because they are greater than the old asphalt layer. The combination of the old asphalt layer
and the recycled one can generate the modulus decrease. A summary of the average, standard
0
500
1000
1500
2000
2500
5/10/2016 9/22/2017 2/4/2019 6/18/2020
E 68,k
si
Date
RL-1 RL-2 RL-3

94
deviation, maximum and minimum values per random locations of Ep68 is presented in Table
17.
Table 16. Confidence Interval
Section P-value Upper C.I 95% Lower C.I 95% 40-CCPR-F 0.000 -0.1570 -0.0570 41-CCPR-E 0.000 -0.2055 -0.0334 43-CIR-E 0.584 -0.0713 0.0403 44-CIR-F 0.359 -0.1104 0.0403
Table 17. Composite Asphalt modulus
Sections Average, Ksi Std. Dev. Max., Ksi Min., Ksi CCPR Foam 343 115 714 194
RL-1 403 116 714 271 RL-2 283 77 501 194
CCPR Emulsion 742 229 1532 390 RL-1 709 269 1532 390 RL-2 722 194 1294 505 RL-3 796 213 1318 531
CIR Emulsion 1010 143 1376 687 RL-1 1070 130 1376 870 RL-2 962 132 1241 712 RL-3 998 147 1338 687
CIR Foam 948 193 1392 617 RL-1 867 123 1131 694 RL-2 875 166 1326 617 RL-3 1103 185 1392 762
The section with the greatest composite asphalt modulus value is the CIR emulsion, and
the one with the minor value is the CCPR foamed section. More profound conclusions from
the data provided are not suggested because each section has a different structure layer
composition, although it is critical to mention that the largest standard deviation is in section

95
41, the CCPR emulsion. A more accurate comparison between sections is by the computation
of the structural coefficient of each recycled section. This value is calculate using Equations 3
to 6, which separate the old asphalt layer and the thin overlay from the cold recycled mix.
Table 18 presents a statistical description of the recycled structural coefficient grouped
by the method of construction and recycling agent. Boxplots of the sections are shown in
Figure 39. Besides, Figures 40 to 43 help to visualize how replicates of layer coefficients are
scattered through the study.
Table 18. Recycled structural coefficient
Section Method Recycling agent N Average Std. Dev. Max Min
40 CCPR Foam 84 0.31 0.092 0.539 0.153 41 CCPR Emulsion 125 0.66 0.154 1.067 0.324 43 CIR Emulsion 126 0.43 0.092 0.653 0.197 44 CIR Foam 126 0.38 0.103 0.579 0.197
Figure 39. Boxplot of recycled structural layer coefficient
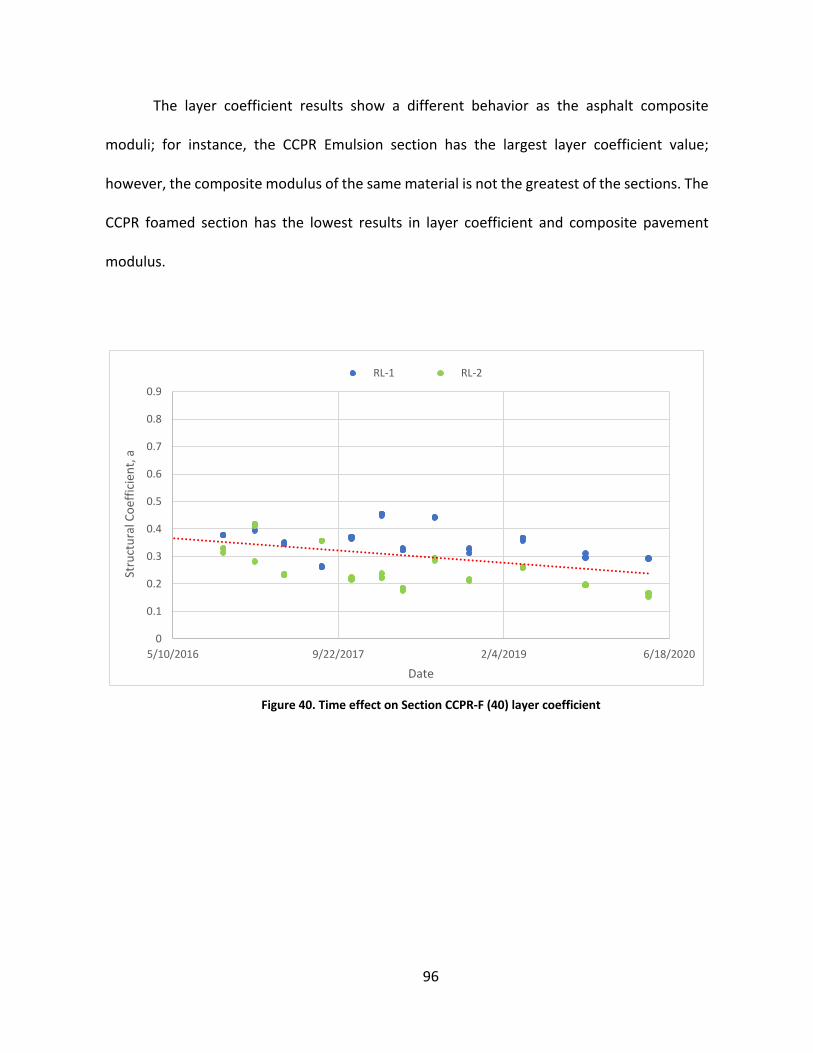
96
The layer coefficient results show a different behavior as the asphalt composite
moduli; for instance, the CCPR Emulsion section has the largest layer coefficient value;
however, the composite modulus of the same material is not the greatest of the sections. The
CCPR foamed section has the lowest results in layer coefficient and composite pavement
modulus.
Figure 40. Time effect on Section CCPR-F (40) layer coefficient
0
0.1
0.2
0.3
0.4
0.5
0.6
0.7
0.8
0.9
5/10/2016 9/22/2017 2/4/2019 6/18/2020
Stru
ctur
al C
oeffi
cien
t, a
Date
RL-1 RL-2

97
Figure 41. Time effect on Section CCPR-E (41) layer coefficient
Figure 42. Time effect on Section CIR-E (43) layer coefficient
0
0.1
0.2
0.3
0.4
0.5
0.6
0.7
0.8
0.9
5/10/2016 9/22/2017 2/4/2019 6/18/2020
Stru
ctur
al C
oeffi
cien
t, a
Date
RL-1 RL-2 RL-3
0.0
0.1
0.2
0.3
0.4
0.5
0.6
0.7
0.8
0.9
5/10/2016 9/22/2017 2/4/2019 6/18/2020
Stru
cuta
l Coe
ffici
ent,
a
Date
RL-1 RL-2 RL-3

98
Figure 43. Time effect on Section CIR-F (44) layer coefficient
A general linear model is applied to analyze the effects of the construction method and
recycling agent in the cold recycled performance; each factor has two levels (Table 18 ). The
analysis of variance of the model using a significance level of 0.05 is presented in Table 19.
Table 19 Factor information
Factor Type Levels Values
Method Fixed 2 CCPR, CIR
Recycling agent Fixed 2 Emulsion, Foam
Table 20. Analysis of Variance
Source DF Adj SS Adj MS F-Value P-Value
Method 1 0.7372 0.73724 56.33 0.000
Recycling agent 1 4.2358 4.23576 323.67 0.000
Method*Recycling agent 1 2.5051 2.50506 191.42 0.000
Error 457 5.9807 0.01309
Total 460 13.5750
0.0
0.1
0.2
0.3
0.4
0.5
0.6
0.7
0.8
0.9
5/10/2016 9/22/2017 2/4/2019 6/18/2020
Stru
ctua
l Coe
ffici
ent,
a
Date
RL-1 RL-2 RL-3

99
All the factors mentioned have a p-value lower than 0.05; the analysis suggests that at
95% confidence, the method, recycling agent, and the combination of both have a significant
impact in the structural coefficient calculations. The recycling agent factor has the largest F-
value, which can be interpreted as the most significant factor in the analysis and can be easily
observed in Figure 44, where the effect of the main effects is plotted. The main interaction
plot (Figure 45) has nonparallel lines, which reflect that interaction occurs. This interaction
effect suggests that the relationship between the construction method and structural
coefficient depends on the recycling agent.
Figure 44. Main effects plot

100
Figure 45. Interaction Plot
The average layer coefficient computed in the CCPR-E section is 0.66 in. −1, this
computed value is unexpected because it is greater than the layer coefficient assigned to a
new HMA layer. Additionally, it is not similar to the values given in previous research studies,
as can be seen in the literature review chapter (Table 5). A possible error in the computation
of the layer coefficient is using wrong thicknesses when separating the composite pavement
modulus into the recycled layer and old HMA layer. The CCPR-E section was filtered out of the
statistical analysis because of the great unforeseen value, a large standard deviation for
structural coefficient, and composite modulus, which all combined can affect the assessment
of the remaining three sections.

101
The one-way analysis of variance (ANOVA) was applied to the three remaining sections
to determine whether there are any statistically significant differences among their means
(Table 21). The null hypothesis of the test is that all the means are equal, at 95% confidence,
the hypothesis was rejected with a P-value lower than 0.05.
Table 21. ANOVA in sections 40, 43 and 44
Source DF Adj SS Adj MS F-Value P-Value Section 2 0.6486 0.324296 35.04 0.00 Error 333 3.082 0.009255 Total 335 3.7306
The ANOVA test evaluates the variability between groups to determine if the mean
differences are statistically significant. A post hoc test known as the Tukey test was applied in
the model (Table 22), which compares the groups in pairs to determine which couples are
meaningful in the analysis.
Table 22. Tukey test of the recycled sections
Section N Mean Grouping
40 CCPR-F 84 0.3143 A
43 CIR-E 126 0.4277 B
44 CIR-F 126 0.3828 C
The group results have a different letter, which means they are significantly different.
The analysis requires three comparisons to cover all combinations at a significance level of
0.05. Table 23 below presents the comparisons, the difference between group means, and the
adjusted p-value for each comparison. The p-values for each comparison are less than the

102
significance level; the difference between group means is statistically significant. Figure 46
shows this comparison; if zero is contained within a confidence interval, it indicates that there
is no statistical evidence that group means are different. None of the differences between
group comparison have a zero value; then, the difference between those pairs of groups is
statistically significant.
Table 23. Tukey test for difference of means
Group Comparison
Difference of Means
SE of Difference
Simultaneous 95% CI T-Value
Adjusted P-Value
43 - 40 0.1134 0.0136 (0.0817, 0.1452) 8.37 0.000
44 - 40 0.0685 0.0136 (0.0368, 0.1002) 5.05 0.000
44 - 43 -0.045 0.0121 (-0.0733, -0.0166) -3.71 0.001
Figure 46. Differences of structural coefficient means
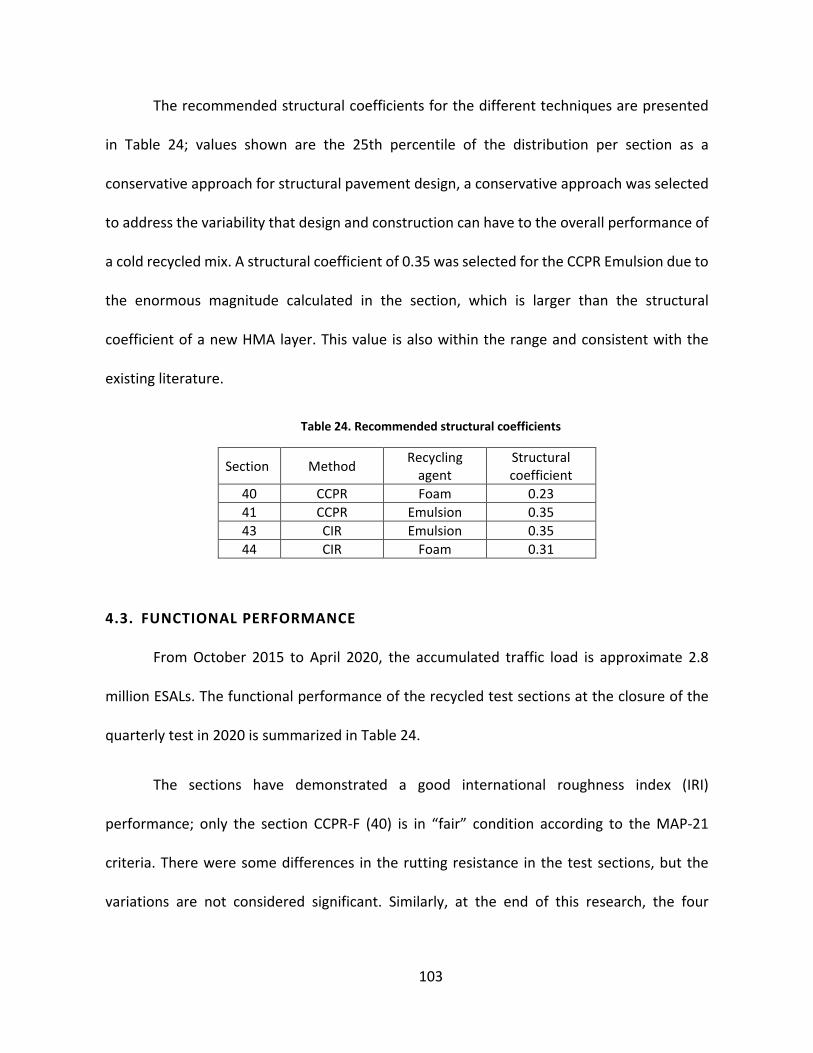
103
The recommended structural coefficients for the different techniques are presented
in Table 24; values shown are the 25th percentile of the distribution per section as a
conservative approach for structural pavement design, a conservative approach was selected
to address the variability that design and construction can have to the overall performance of
a cold recycled mix. A structural coefficient of 0.35 was selected for the CCPR Emulsion due to
the enormous magnitude calculated in the section, which is larger than the structural
coefficient of a new HMA layer. This value is also within the range and consistent with the
existing literature.
Table 24. Recommended structural coefficients
Section Method Recycling agent
Structural coefficient
40 CCPR Foam 0.23 41 CCPR Emulsion 0.35 43 CIR Emulsion 0.35 44 CIR Foam 0.31
4.3. FUNCTIONAL PERFORMANCE
From October 2015 to April 2020, the accumulated traffic load is approximate 2.8
million ESALs. The functional performance of the recycled test sections at the closure of the
quarterly test in 2020 is summarized in Table 24.
The sections have demonstrated a good international roughness index (IRI)
performance; only the section CCPR-F (40) is in “fair” condition according to the MAP-21
criteria. There were some differences in the rutting resistance in the test sections, but the
variations are not considered significant. Similarly, at the end of this research, the four

104
recycled sections showed a minimum amount of cracking, but cracking resistance started to
decrease in one section by the end of the study.
Table 25. Functional performance summary
Section Description Rutting (in.)
IRI (in./mi)
Cracking (%)
40 Foamed CCPR 0.27 82.2 4.2
41 Emulsion CCPR 0.16 77.6 0.2
43 Emulsion CIR 0.21 94.0 1.3
44 Foamed CIR 0.22 64.2 0.8
4.3.1. Rutting
The rutting performance of the test sections over 4.5 years of service is presented in
Figure 28. As mentioned previously, by the time of this study, approximately 2.8 million ESALs
had been applied to the test sections, and the reported annual average daily traffic (AADT) in
2018 was 20,083 vehicles. The figure shows two evident increases, the first one around 1.5
years, and the next one around 2.7 years. This behavior may be attributed to an increase in
pavement temperatures over the summer months. The initial rut jump measure at the start
of the study can be explained to the densification that occurs in the initial service phase
causing a reduction of the air voids.
Although the data shows an increasing trend in all the sections, which is common in
asphalt pavements open to high traffic volume, oscillating results are shown. This effect can
be due to a seasonality effect, which can be observed during the third winter when the mean

105
rut depth seems to maintain more constant values, and a measurement error can be
attributed to this behavior.
Each section is divided into 32 subsections, which were used as replicates to evaluate
for mean differences in rutting among the sections using the ANOVA test. October 5, 2015
(First date post-construction) and April 21, 2020 (Last date) were the days selected for the
analysis (Table 25 and 26).
Table 26. ANOVA analysis post-construction
Source DF Adj SS Adj MS F-Value P-Value Section 3 0.002278 0.000759 1.3 0.278
Error 124 0.072494 0.000585 Total 127 0.074772
Table 27. ANOVA analysis for the last date
Source DF Adj SS Adj MS F-Value P-Value
Section 3 0.184 0.06134 1.32 0.272 Error 124 5.7772 0.04659 Total 127 5.9612

106
Figure 47. Rut performance of the recycled sections
0.00
0.05
0.10
0.15
0.20
0.25
0.30
0.35
0.40
0.45
0.50
0 0.5 1 1.5 2 2.5 3 3.5 4 4.5 5
Rutt
ing,
in
Years
40 CCPR-F 41 CCPR-E 43 CIR-E 44 CIR-F

107
The results show that on both dates, the P-value is higher than the significance level of
0.05. Hence there is not enough evidence to reject the null hypothesis, which is that the rutting
means are all equal. The rut depth means for each date is shown in Table 28.
Table 28. Rutting average
Section Post-construction rut depth means
Last date rut depth means
40-CCPR-F 0.04 0.27 41-CCPR-E 0.04 0.16 43-CIR-E 0.04 0.21 44-CIR-F 0.05 0.22
The average means have increased from post-construction to the last date, but all
sections are statistically similar to each other on each of the dates. However, section CCPR-F
is still in the “good” condition category being also the section with the highest structural
coefficient values, while all the other three are in “fair” condition. By the end of this study, the
mean rut depth of the four test sections was well below the poor criteria of 0.4 inches,
established by the MAP-21 performance measures (Figure 48). The mean rut depths on April
2020 was less than the poor rutting criteria, which indicates the test sections had a good
rutting performance after 4.5 years.

108
Figure 48. Mean rut depths of the recycled sections
Each recycled test section rutting performance can be shown in Figure 49 to 52. The
foam CIR section was the first one to fall into the fair rutting condition at 3.1 years after
construction, but the trend has been almost constant in the fourth year. The section that has
exhibited better rutting resistance is section 41, which has been under the good indicator area
for all the time analysis.
The section that has exhibited more rutting sensitivity along the study is section CIR-F,
and the one which has the greatest rut depth by the end of the study is the CCPR-F section,
this could be related to the low composite pavement moduli and the transition in its pavement
structure along the section.
CCPR-F CCPR-E CIR-E CIR-F0
0.1
0.2
0.3
0.4
0.5
0.60 2
Rut d
epth
, in
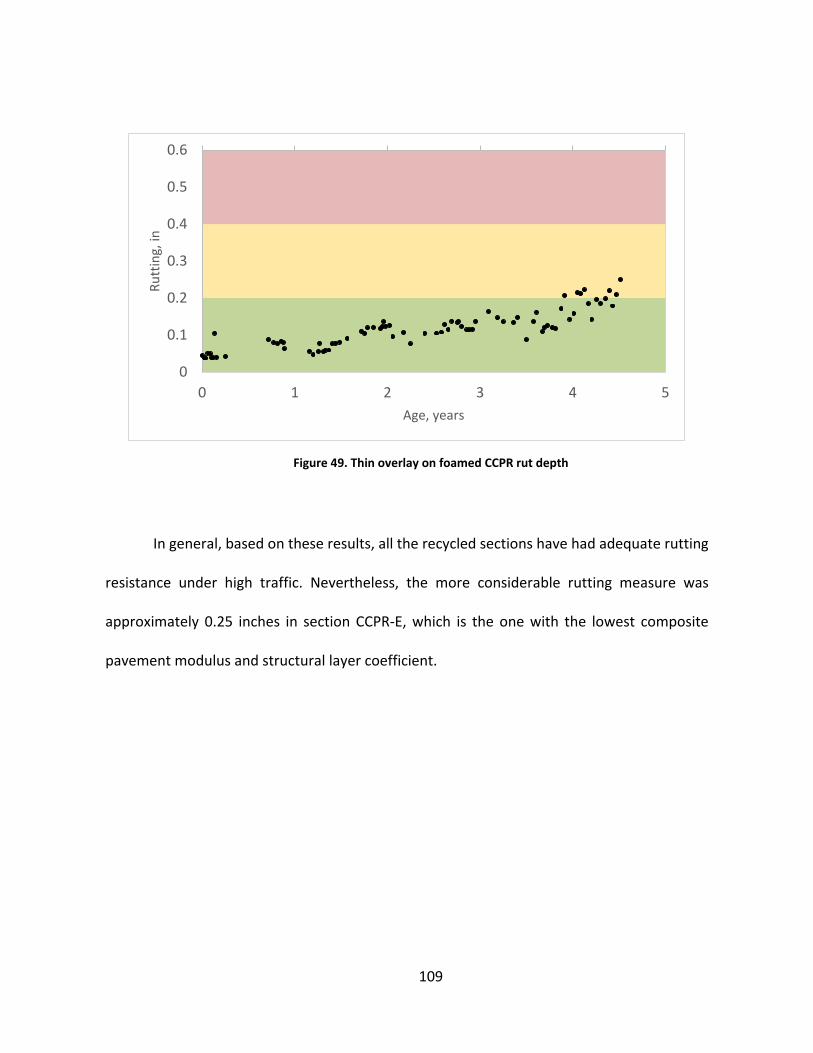
109
Figure 49. Thin overlay on foamed CCPR rut depth
In general, based on these results, all the recycled sections have had adequate rutting
resistance under high traffic. Nevertheless, the more considerable rutting measure was
approximately 0.25 inches in section CCPR-E, which is the one with the lowest composite
pavement modulus and structural layer coefficient.
0 1 2 3 4 50
0.1
0.2
0.3
0.4
0.5
0.6Ru
ttin
g, in
Age, years

110
Figure 50. Thin overlay on emulsion CCPR rut depth
Figure 51. Thin overlay on emulsion CIR rut depth
0 1 2 3 4 50
0.1
0.2
0.3
0.4
0.5
0.6Ru
ttin
g, in
Age, years
0 1 2 3 4 50
0.1
0.2
0.3
0.4
0.5
0.6
Rutt
ing,
in
Age, years

111
Figure 52. Thin overlay on foamed CIR rut depth
4.3.2. Roughness
Post-construction IRI was different for each section, but all of them were in “good”
condition. By the end of this research, the four sections show a small increase in roughness.
This behavior may be attributed to the loss of friction and texture in the surface layer due to
axle load repetitions. In all cases, the measured IRI was maintained below the “fair” threshold
of 95 in/mile established by the MAP-21 rating system. The CIR-F section appears to be more
constant during the study, and the other sections have a different rate increase, being CCPR
foamed section the most sensitive to change. The trendline of the variation in IRI over time is
shown in Table 29.
0 1 2 3 4 50
0.1
0.2
0.3
0.4
0.5
0.6Ru
ttin
g, in
Age, years

112
Table 29. Trendline of IRI variation over time
Section m Trendline equation 40-CCPR-F 3.920 𝑦𝑦 = 3.920𝑥𝑥 + 61.96 41-CCPR-E 4.078 𝑦𝑦 = 4.078𝑥𝑥 + 52.40 43-CIR-E 2.531 𝑦𝑦 = 2.531𝑥𝑥 + 81.30 44-CIR-F -0.476 𝑦𝑦 = −0.476𝑥𝑥 + 66.42
The initial IRI of the CCPR foamed section was 62.0 in./mi, then the section experienced
a constant increase in roughness level through the entire study to a level of 82.2 in./mi. The
measured IRI was maintained below the 90 in/mil threshold established as “fair” criteria
(Figure 53).
Figure 53. CCPR Foamed section roughness
The emulsion CCPR has the highest slope for IRI over time, but also, this section
presents the lowest initial IRI measurement at 52.3 in./mi at the start of the study (Figure 54).
0 1 2 3 4 50
20406080
100120140160180
IRI,
in/m
i
Age, years

113
The CIR emulsion section showed higher initial IRI measurement at 78.1 in./mil. Moreover, it
rose in the summer of 2017, falling into the “fair” category. However, the roughness level was
steady at the end of the study (Figure 55).
The CCPR foamed section appears to be steadier over the study; its initial IRI value is
66.4 in./mi, which is similar to the CIR foamed section. However, the measured IRI did not
change appreciably over time; actually, it presents a slightly negative slope that represents a
roughness reduction (Figure 56).
Figure 54. CCPR Emulsified section roughness
0 1 2 3 4 50
20406080
100120140160180
IRI,
in/m
i
Age, years

114
Figure 55. CIR Emulsified section roughness
Figure 56. CIR Foamed section roughness
0 1 2 3 4 50
20406080
100120140160180
IRI,
in/m
i
Age
0 1 2 3 4 50
20406080
100120140160180
IRI,
in/m
i
Age, years

115
Since each section has a different initial IRI value, it is essential to compare each other
by their roughness variation. Figure 57 shows the variation between the post-construction IRI
and the last measure in April 2020. Section CCPR-F and CCPR-E have a similar shift with values
of 18.9 and 23.2 in./mi respectively, nevertheless, as mentioned before, the CIR emulsion
section has a minor roughness decrease. Also, each section was analyzed using a paired t-test,
in which the null hypothesis is that the difference of means between post-construction IRI and
the last measure equals zero (Table 30).
Figure 57. Roughness variation from post-construction to the last date
Table 30. IRI variation Pair T-test
Section Mean Std. Dev. SE Mean
95% CI for T-Value P-Value
μ_difference 40-CCPR-F 18.74 18.05 3.19 (-25.25, -12.24) -4.53 0.000 41-CCPR-E 19.13 23.89 4.22 (-27.74, -10.51) -5.88 0.000 43-CIR-E 12.89 25.04 4.43 (-21.91, -3.86) -2.91 0.007 44-CIR-F 2.60 32.18 5.69 (-9.01, 14.20) 0.46 0.651
-5
0
5
10
15
20
25
CCPR-F CCPR-E CIR-E CIR-F
Chan
ge in
IRI,
in,/
mi
Sections

116
The results in Table 30 show that the null hypothesis in sections CCPR-F, CCPR-E, and
CIR-E can be rejected with a confidence interval of 95%, section CCPR-E has the greatest T-
value which can be interpreted as the section where the variation between dates is the most
relevant. Finally, section CIR-F is the only one that cannot be rejected; then, it can be
interpreted as a steady value over time.
4.3.3. Cracking
All the recycled sections performed well over the four and a half years of open traffic
in Highway US-280. Most of the measured cracking was very fine hairline cracks that are only
visible to the trained eye. Nevertheless, section CCPR-F (40) exhibited rapid growth in the
amount of cracking in the last year. This increase of cracking can be related to the high
deflections collected from FWD testing in the last year and the decrease of the composite
pavement modulus during the study, the most considerable amount of cracking appears in
the wheel path. A cracked section allows water to be trapped in the mix, which evolves in loss
of cohesion. The last cracking measure in the CCPR-F section is 4.2%, falling close to the fair
threshold, which is 5%. Even section 43 has a value slightly higher than 1.0% of cracking; it is
too small to be significant for further statistical analysis by the end of this research.

117
Figure 58 Cracking of the recycled sections.
The overall pavement condition using the MAP-21 rating analyzes each parameter with
its threshold mentioned in Table 10. If all the parameters are “good,” the section is good. If
two parameters or more are considered “poor,” then the section is poor. All other
combinations result in a “fair” overall condition. A summary of the functional performance
parameters of the recycled sections is shown in Tables 31. The overall condition of section
CCPR-E reflects a good status of the pavement section; on the other hand, all the other
sections fall into “fair” condition. Pictures of the sections after 4.5 years of service are shown
in Figures 59 to 62. It can be observed that the cracking exhibited in section CCPR-F (40) is
accompanied by pumping of fines, which may be related to the high content of fines in the
mix, and the nature of foamed recycled mixes where the particles are not coated entirely.
0.0
0.5
1.0
1.5
2.0
2.5
3.0
3.5
4.0
4.5
5.0
0.0 0.5 1.0 1.5 2.0 2.5 3.0 3.5 4.0 4.5 5.0
Crac
king
, %
Age, years40 CCPR-F 41 CCPR-E 43 CIR-E 44 CIR-F

118
Table 31. Overall condition of the Recycled Sections
Section Parameter Value Rating Overall Condition
40 CCPR-F
Cracking, % 4.2 GOOD FAIR Rutting, in 0.27 FAIR
IRI, in/mi 82.2 GOOD
41 CCPR-E
Cracking, % 0.2 GOOD GOOD Rutting, in 0.16 GOOD
IRI, in/mi 77.6 GOOD
43 CIR-E
Cracking, % 1.3 GOOD FAIR Rutting, in 0.21 FAIR
IRI, in/mi 94 GOOD
44 CIR-F
Cracking, % 0.8 GOOD FAIR Rutting, in 0.22 FAIR
IRI, in/mi 64.2 GOOD
Figure 59. Section 40 CCPR-F overview

119
Figure 60. Section 41 CCPR-E overview
Figure 61. Section 43 CIR-E overview

120
Figure 62. Section 44 CIR-F overview
4.4. SUMMARY
The sections have demonstrated a good international roughness index (IRI)
performance. The rutting resistance shows an increase in rut depth, but the variations are not
considered statically meaningful among the sections. Similarly, at the end of this research, the
four recycled sections showed a minimum amount of cracking, but cracking resistance started
to decrease in CCPR-F (40) by the end of the study. The CCPR-F (40), CCPR-E (41), and CIR-E
(43) sections are categorized as fair under the MAP-21 rating.
Pavement modulus was backcalculated in all sections considering all the asphalt layers
as composite pavement modulus. The combined AC/RAP lift was layer one, the aggregate base

121
(Sections 40 and 41) as layer two, and the subgrade as layer three. The CIR-E (43) and CIR-F
(44) sections, without aggregate base, showed a strong influence of mid-depth pavement
temperature on the modulus, and the thinnest AC section (Section 40) was found least
temperature sensitive.
The composite pavement modulus values were normalized to a reference temperature
of 68°F, CCPR F and CCPR-E sections have statically decreased their composite pavement
modulus over time. However, the CIR-E (43) and CIR-F (44) sections have regular behavior
overtime. The layer coefficient for the recycled sections was computed, and the structural
coefficients were found to be statically different.

122
CHAPTER 5: CONCLUSIONS AND RECOMMENDATIONS
Four test sections were built in 2015 on Highway US-280 as part of a larger experiment
called the Preservation Group study. This research evaluated the field performance of the cold
recycled sections under real traffic conditions. The test sections were identified as sections
CCPR-F (40), CCPR-E (41), CIR-E (43), and CIR-F (44). All the sections were comprised of a thin
overlay, which was placed on top of the cold recycled material and an old HMA. Only sections
40 and 41 have a granular base below the asphalt concrete layers.
The general objective of the study was to evaluate the structural and functional
performance of cold recycled asphalt pavement as a pavement preservation technique. Other
objectives were to determine the structural contribution of the recycled technologies and to
compare the performances of the two recycling techniques.
5.1. CONCLUSIONS
Based on the observations obtained throughout this study, the following conclusions can
be made:
• The composite pavement modulus in the cold recycled sections is sensitive to
temperature as HMA. Nevertheless, Section CCPR-F (40) has the lowest R-squared
value in the regression analysis between the composite pavement modulus and
temperature, which indicates that the temperature does not account for many
variations in the composite modulus in the section; this conduct can be explained by

123
the structural composition of the CCPR-F (40) section where the old HMA has the
thinnest thickness compared to the other sections. Nevertheless, different research
shows that CIR-emulsion is not as sensitive to temperature and loading frequency as
HMA according to dynamic modulus testing, and the variation of CIR using foam is due
to the residual asphalt content.
• The backcalculated Ep was normalized to 68°F (Ep68). Even though some seasonal
variability may affect the results, the variation of backcalculated pavement modulus
over time showed no evidence of a structural decline in sections CIR-E (43) and CIR-F
(44). In the confidence interval of the regression analysis of those sections, the 95%
confidence interval for the slope goes through zero, which indicates that statistically,
there is no significant relationship between Ep68 and time. On the other hand, CCPR-
F (40) and CCPR-E (41) sections have statically decreased their composite pavement
modulus over time, which may indicate deterioration of the pavement structure.
• A general linear model was applied to analyze the effects of the construction method
and recycling agent in the structural coefficient of the recycled sections; each factor
has two levels. All the factors mentioned have a p-value lower than 0.05; the analysis
suggests that at 95% confidence, the method, recycling agent, and the interaction of
them have a significant impact in the structural coefficient calculations. The most
significant factor in the analysis was the recycling agent. The main interaction plot
suggests that the relationship between the construction method and structural
coefficient depends on the recycling agent.

124
• The average layer coefficient computed in the CCPR-E (41) section is 0.66 in. −1, which
is higher than any values presented in previous studies, this computed value is
unexpected because it is greater than the layer coefficient assigned to a new HMA
layer. A possible error in the computation of the layer coefficient is using wrong
thicknesses when separating the composite pavement modulus into the recycled layer
and old HMA layer.
• The three remaining sections were analyzed under an ANOVA test, the null hypothesis
of the test is that all the means are equal, at 95% confidence, the hypothesis was
rejected with a P-value lower than 0.05. A Tukey test was applied in the model to
determine which sections were different. The test concluded that all the sections are
significantly different from each other.
• The recommended structural coefficients suggested for structural pavement design
were obtained by using the 25th percentile of the distribution for each section. A
structural coefficient of 0.35 was selected for the CCPR-E (41) due to the high
magnitude calculated in the section, which is larger than the structural coefficient of a
new hot mix asphalt layer. The structural layer of the recycled materials ranged
between 0.23 and 0.35.
• The functional performance of the four test sections was divided into three
parameters. The mean rut depth of the four test sections was well below the poor
criteria of 0.4 inches, established by the MAP-21 rating system. The average means
have increased from post-construction to the last date of data collection, but there are

125
no statistical differences among the sections. However, section CCPR-E (41) is still in
the “good” condition category being also the section with the highest structural
coefficient, while all the other three sections are in “fair” condition.
• The roughness parameter for all four sections shows a normal increase. In all cases,
the measured IRI was maintained below the fair threshold of 95 in/mile established by
the MAP-21 rating system. This parameter was analyzed using a paired t-test for each
section to evaluate a change between the post-construction data and the last one.
Sections 40, 41, and 43 fail the test with a confidence interval of 95%, concluding there
is a change in the IRI values overtime.
• The measured cracking was very fine hairline cracks. Nevertheless, section CCPR-F (40)
exhibited rapid growth in the amount of cracking in the last year. This increase of
cracking can be related to the high deflections collected from FWD testing in the last
year and the decrease of the composite pavement modulus during the study. A
cracked section allows water to be trapped in the mix, which evolves in loss of
cohesion. This behavior is consistent with field performance in the section, which has
the lowest rutting resistance in all sections.
5.2. RECOMMENDATIONS
The following recommendations could be made for future research:
• The PG study should continue traffic on the recycled sections and monitor the
performance of the sections to obtain a long-term assessment.

126
• By the end of the study in Highway US-280, forensic analysis of the test sections
that include performance tests would allow understanding the true failure
mechanisms.
• A climate can be assessed in the cold recycled analysis. In the summer of 2019,
similar cold recycled sections have been constructed in the Northern part of the
PG study located in Minnesota; this will allow for incorporating climate as part of
the analysis.
• Similar sections could be placed in the NCAT test track; this would address the
performance of pavement preservation techniques under a high amount of heavy
daily traffic. The sections would be instrumented with asphalt strain gauges,
temperature probe, and earth pressure cell. They would allow continuous analysis
of the pavement response under traffic and climate.

127
REFERENCES
AASHTO. (2017a). AASHTO provisional standards PP86. American Association of State Highway and Transportation Officials, Washington, D.C.
AASHTO. (2017b). AASHTO provisional standards MP31. American Association of State Highway and Transportation Officials, Washington, D.C.
Ameri, M., and Behnood, A. (2012). “Laboratory studies to investigate the properties of CIR mixes containing steel slag as a substitute for virgin aggregates.” Construction and Building Materials, 26(1), 475–480.
American Society of Civil Engineers. (2017). 2017 Infrastructure Report Card. ASCE. Apeagyei, A. K., and Diefenderfer, B. K. (2013). “Evaluation of Cold In-Place and Cold Central-
Plant Recycling Methods Using Laboratory Testing of Field-Cored Specimens.” Journal of Materials in Civil Engineering, 25(11), 1712–1720.
ARRA. (2016). Recommended Mix Design Guidelines For Cold Recycling Using Emulsified Asphalt Recycling Agent. Asphalt Recycling & Reclaiming Association, Illinois.
ARRA. (2017). Recommended Mix Design Guidelines For Cold Recycling Using Foamed Asphalt Recycling Agent. Asphalt Recycling & Reclaiming Association, Illinois.
Asphalt Academy. (2009). Technical Guideline: Bitumen Stabilised Materials. Asphalt Academy, Pretoria, South Africa.
Asphalt Paving Association of Iowa. (2008). The Iowa Asphalt Report. The Green Issue. Asphalt Recycling & Reclaiming Association. (2015). Basic Asphalt Recycling Manual. Federal
Highway Administration, Maryland. Bemanian, S., Polish, P., and Maurer, G. (2006). “Cold In-Place Recycling and Full-Depth
Reclamation Projects by Nevada Department of Transportation: State of the Practice.” Transportation Research Record, 1949(1), 54–71.
Birgisson, B., Roque, R., Kim, J., and Pham, L. V. (2004). “THE USE OF COMPLEX MODULUS TO CHARACTERIZE THE PERFORMANCE OF ASPHALT MIXTURES AND PAVEMENTS IN FLORIDA.”
Brown, E. R., Prowell, B., Cooley, A., Zhang, J., and Powell, R. B. (2004). “EVALUATION OF RUTTING PERFORMANCE ON THE 2000 NCAT TEST TRACK (WITH DISCUSSION).” Journal of the Association of Asphalt Paving Technologists.
Chappat, M., and Bilal, J. (2003). “The Environmental Road of the Future: Life Cycle Analysis.” Colas Group, 47.
Chen, D., Jahren, C. T., Lee, H. “David,” Williams, R. C., Kim, S., Heitzman, M., and Kim, J. “Joe.” (2010). “Effects of Recycled Materials on Long-Term Performance of Cold In-Place Recycled Asphalt Roads.” Journal of Performance of Constructed Facilities, 24(3), 275–280.
Copeland, A. (2011). Reclaimed Asphalt Pavement in Asphalt Mixtures: State of the Practice. Technical, Federal Highway Administration, Virginia, 55.

128
Cox, B. C., and Howard, I. L. (2016). “Cold In-Place Recycling Characterization for Single-Component or Multiple-Component Binder Systems.” Journal of Materials in Civil Engineering, 28(11), 04016118.
Cox, B., Howard, I., and Battey, R. (2015). “In-Place Recycling Moisture-Density Relationships for High-Traffic Applications.” Proceedings, Texas, 349–358.
Cross, S. A., and Fager, G. A. (1995). “FLY ASH IN COLD RECYCLED BITUMINOUS PAVEMENTS.” Transportation Research Record, (1486).
Cross, S. A., and West, R. (2018). Overview of Project Selection Guidelines for Cold In-place and Cold Central Plant Pavement Recycling. Federal Highway Administration.
Csanyi, L. H. (1957). “FOAMED ASPHALT IN BITUMINOUS PAVING MIXTURES.” Highway Research Board Bulletin, (160), 108–122.
David Newcomb, Edith Arambula, Fan Yin, Jun Zhang, Amit Bhasin, Wei Li, and Zelalem Arega. (2015). Properties of Foamed Asphalt for Warm Mix Asphalt Applications. The National Academies Press, Washington, DC.
Díaz-Sánchez, M. A., Timm, D. H., and Diefenderfer, B. K. (2017). “Structural Coefficients of Cold Central-Plant Recycled Asphalt Mixtures.” Journal of Transportation Engineering, Part A: Systems, 143(6), 04017019.
Diefenderfer, B. K., and Apeagyei, A. K. (2014). I-81 In-Place Pavement Recycling Project. Virginia Center for Transportation Innovation and Research, Richmond, VA.
Diefenderfer, B. K., Bowers, B. F., Schwartz, C. W., Farzaneh, A., and Zhang, Z. (2016). “Dynamic Modulus of Recycled Pavement Mixtures:” Transportation Research Record.
Dudley, S., Majidzadeh, K., and Kaloush, K. (1987). “The Recycling of Cold-Mix , In Place for Low-Volume Road in Ohio.” 1106, 163–172.
Eller, A., and Olson, R. (2009). Recycled Pavements Using Foamed Asphalt in Minnesota. Minnesota Department of Transportation, Minnesota.
Forsberg, A., Lukanen, E., and Thomas, T. (2002). “Engineered Cold In-Place Recycling Project: Blue Earth County State Aid Highway 20, Minnesota:” Transportation Research Record.
Gao, L., Ni, F., Charmot, S., and Luo, H. (2014). “Influence on Compaction of Cold Recycled Mixes with Emulsions Using the Superpave Gyratory Compaction.” Journal of Materials in Civil Engineering, 26(11), 04014081.
Geiger, D. (2005). Pavement Preservation Definitions. Federal Highway Administration. Gu, F., Ma, W., West, R. C., Taylor, A. J., and Zhang, Y. (2019). “Structural performance and
sustainability assessment of cold central-plant and in-place recycled asphalt pavements: A case study.” Journal of Cleaner Production, 208, 1513–1523.
Highway US 280, AL (2020). From Google Earth <https://earth.google.com>
Hajj, E. Y., Sebaaly, P. E., West, R., Morian, N., and Loria, L. (2012). “Recommendations for the characterization of RAP aggregate properties using traditional testing and mixture volumetrics.” Road Materials and Pavement Design, 13(sup1), 209–233.
Highway Research Board. (1962). The AASHO Road Test Repot 5. National Research Council, Washington, DC.

129
Horak, E. (2007). “Surface Moduli Determined with the Falling Weight Deflectometer Used as Benchmarking Tool.” 26th, Pretoria, South Africa, 10.
Huang, Y. (1993). Pavement analysis and design. Prentice Hall, New Jersey. Irwin, L. H. (2002). “Backcalculation: an overview and perspective.” Jahren Charles T., Cawley Bryan, and Bergeson Kenneth. (1999). “Performance of Cold In-Place
Recycled Asphalt Cement Concrete Roads.” Journal of Performance of Constructed Facilities, 13(3), 128–133.
James, A. (2016). “Overview of Asphalt Emulsions.” Asphalt Emulsion Technology, E, Transportation Research Board, Washington, DC, 1–15.
Kandhal, P. S., and Koehler, W. C. (1987). “COLD RECYCLING OF ASPHALT PAVEMENTS ON LOW-VOLUME ROADS.” Transportation Research Record.
Khosravifar, S., Schwartz, C. W., and Goulias, D. G. (2015). “Mechanistic structural properties of foamed asphalt stabilised base materials.” International Journal of Pavement Engineering, 16(1), 27–38.
Kim, J., Lee, H. D., and Heitzman, M. (2009). “Dynamic Modulus and Repeated Load Tests of Cold In-Place Recycling Mixtures Using Foamed Asphalt.” Journal of Materials in Civil Engineering, 21(6), 279–285.
Kim, J., Lee, H. D., Jahren, C. T., Heitzman, M., and Chen, D. (2010). “Long-Term Field Performance of Cold In-Place Recycled Roads in Iowa.” Journal of Performance of Constructed Facilities, 24(3), 265–274.
Kim, Y., and Lee, H. D. (2012). “Performance evaluation of Cold In-Place Recycling mixtures using emulsified asphalt based on dynamic modulus, flow number, flow time, and raveling loss.” KSCE Journal of Civil Engineering, 16(4), 586–593.
Kim, Y., Lee, H. D., and Heitzman, M. (2007). “Validation of New Mix Design Procedure for Cold In-Place Recycling with Foamed Asphalt.” Journal of Materials in Civil Engineering, 19(11), 1000–1010.
Kuennen, T. (2003). “CALIFORNIA PUTS FOAMED ASPHALT TO THE TEST.” Better Roads, 73(7). Lane, B., and Kazmierowski, T. (2005). “Implementation of Cold In-Place Recycling with
Expanded Asphalt Technology in Canada:” Transportation Research Record. Lee, D. Y. (1981). “TREATING MARGINAL AGGREGATES AND SOILS WITH FOAMED ASPHALT
(WITH DISCUSSION AND CLOSURE).” Lee, H., and Kim, Y. (2003). Development of a Mix Design Process for Cold-In-Place
Rehabilitation Using Foamed Asphalt. Iowa Department of Transportation, Iowa. Liu, Y. R., Xie, C. W., Liang, L. L., and Li, X. J. (2012). “Utilization of Cold in-Site Recycling
Technology on Distressed Asphalt Concrete Pavement.” Trans Tech Publications, 476–478, 1631–1634.
Marquis, B., Peabody, D., and Mallick, R. B. (2002). Using Foamed Asphalt as a Stabilizing Agent in Full Depth Reclamation of Route 8 in Belgrade, Maine. University of Wisconsin, Wisconsin.
130
Marquis, B., Peabody, D., Mallick, R. B., and Soucie, T. (2003). Determination of Structural Layer coefficient for Roadway Recycling Using Foamed Asphalt. Maine Department of Transportation & Worcester Polytechnic Institute, Maine.
McKeen, R., Hanson, D., and Stokes, J. (1998). “Construction and Performance Using Cold In-Situ Recycling in New Mexico.” Flexible Pavement Rehabilitation and Maintenance, P. Kartdhal and M. Stroup-Gardiner, eds., ASTM International, 100 Barr Harbor Drive, PO Box C700, West Conshohocken, PA 19428-2959, 53-53–15.
Muthen, M. (1999). Foamed Asphalt Mixes: Mix Design Procedure. CSIR TRANSPORTEK, Pretoria, South Africa, 37.
Nady, R. M. (1997). The Quality of Random RAP: Separating Fact from Supposition. Hot-Mix Asphalt Technology, National Asphalt Pavement Association, Maryland.
National Research Council. (2005). Assessing and Managing the Ecological Impacts of Paved Roads. The National Academies Press, Washington, DC.
Peters-Davis, K., and Timm, D. (2011). “Recalibration of the Asphalt Layer Coefficient.” Journal of Transportation Engineering, 137(1), 22–27.
Polak, M. (2003). “RECYCLING FOR REGIONAL AIRPORT RUNWAYS.” Better Roads, 73(7). Powell, B. (2016). “Development and Validation of a Nondestructive Methodology to Measure
Subgrade Moisture Contents at the NCAT Pavement Test Track.” The Roles of Accelerated Pavement Testing in Pavement Sustainability, J. P. Aguiar-Moya, A. Vargas-Nordcbeck, F. Leiva-Villacorta, and L. G. Loría-Salazar, eds., Springer International Publishing, Cham, 621–632.
Romanoschi, S. A., Hossain, M., Gisi, A., and Heitzman, M. (2004). “Accelerated Pavement Testing Evaluation of the Structural Contribution of Full-Depth Reclamation Material Stabilized with Foamed Asphalt.” Transportation Research Record, 1896(1), 199–207.
Salomon, D. R. (2016). Asphalt Emulsion Technology. E-C102, Transportation Research Board, Washington, DC, 58.
Sanjeevan, S., Piratheepan, M., Hajj, E. Y., and Bush, A. K. (2014). “Cold In-Place Recycling in Nevada: Field Performance Evaluation over the Past Decade.” Transportation Research Record.
Scholz, T., Hicks, R. G., and Allen, D. (1990). “Mix Design Practices for Cold In-Place Recycled Pavements.” Asphalt Emulsions, ASTM International, Pennsylvania, 44–64.
Schwartz, C., and Diefenderfer, B. K. (2017). Material Properties of Cold In-Place Recycled and Full-Depth Reclamation Asphalt Concrete. NCHRP Research, The National Academies Press, Washington, DC.
Schwartz, C., and Khosravifar, S. (2013). Design and Evaluation of Foamed Asphalt Base Materials. Research, Maryland State Highway Administration, Maryland, 95.
Sebaaly, P. E., Bazi, G., Hitti, E., Weitzel, D., and Bemanian, S. (2004). “Performance of Cold In-Place Recycling in Nevada.” Transportation Research Record: Journal of the Transportation Research Board, 1896(1), 162–169.

131
Stroup-Gardiner, M. (2011). Recycling and Reclamation of Asphalt Pavements Using In-Place Methods. National Cooperative Highway Research Program Synthesis Program, National Academies Press, Washington, D.C.
Thomas, T., Kadrmas, A., and Huffman, J. (2000). “Cold In-Place Recycling on US-283 in Kansas:” Transportation Research Record.
Tia, M., and Wood, L. E. (1983). “USE OF ASPHALT EMULSION AND FOAMED ASPHALT IN COLD-RECYCLED ASPHALT PAVING MIXTURES.” Transportation Research Record.
Timm, D. D. H., Robbins, D. M. M., Tran, D. N., and Rodezno, D. C. (2014). FLEXIBLE PAVEMENT DESIGN – STATE OF THE PRACTICE. National Center for Asphalt Technology, Alabama, 45.
Timm, D. H., Diefenderfer, B. K., and Bowers, B. F. (2018). “Cold Central Plant Recycled Asphalt Pavements in High Traffic Applications.” Transportation Research Record: Journal of the Transportation Research Board, 2672(40), 291–303.
Vargas-Nordcbeck, A., and Rahman, M. T. (2019). “Effect of Thin Overlays on the Structural Performance of Cold Recycled Bases for High Traffic Volume Roads.” Airfield and Highway Pavements, 10.
Vargas-Nordcbeck, A., and Timm, D. (2013). PHYSICAL AND STRUCTURAL CHARACTERIZATION OF SUSTAINABLE ASPHALT PAVEMENT SECTIONS AT THE NCAT TEST TRACK. National Center for Asphalt Technology, Auburn, AL, 149.
Visintine, B., Rada, G., and Simpson, A. (2018). Guidelines for Informing Decisionmaking to Affect Pavement Performance Measures. Federal Highway Administration, Virginia, 47.
Waidelich, W. C. (2016). Pavement Preservation Definitions. Federal Highway Administration. Wen, H., Tharaniyil, M. P., and Ramme, B. (2003). “Investigation of Performance of Asphalt
Pavement with Fly-Ash Stabilized Cold In-Place Recycled Base Course:” Transportation Research Record.
West, R. (2009). “Keys to Managing RAP Variability.” Better Roads, 79(10), 12–15. West, R. (2015). Best Practices for RAP and RAS Management. National Asphalt Pavement
Association, Maryland. Wijk, A. V., and Wood, L. E. (1983). “Use of Foamed Asphalt in Recycling of an Asphalt
Pavement.” Transportation Research Record: Journal of the Transportation Research Board, 911, 96–103.
Williams, B., and Willis, R. (2019). Asphalt Pavement Industry Survey on Recycled Materials and Warm-Mix Asphalt Usage: 2018. National Asphalt Pavement Associaton, Maryland.
Wirtgen Group. (2012). Wirtgen Cold Recycling Manual. Wirtgen GmbH, Germany. Xiao, F., Yao, S., Wang, J., Li, X., and Amirkhanian, S. (2018). “A literature review on cold
recycling technology of asphalt pavement.” Construction and Building Materials, 180, 579–604.